performance management practices and methodologies for ...performance management practices and...
TRANSCRIPT

Performance Management Practices and Methodologies for Setting Safety Performance Targets Task B-1 – Literature Review
October 24, 2011

Notice
This document is disseminated under the sponsorship of the U.S. Department of Transportation in the interest of information exchange. The U.S. Government assumes no liability for the use of the information contained in this document.
The U.S. Government does not endorse products or manufacturers. Trademarks or manufacturers' names appear in this report only because they are considered essential to the objective of the document.
Quality Assurance Statement
The Federal Highway Administration (FHWA) provides high-quality information to serve Government, industry, and the public in a manner that promotes public understanding. Standards and policies are used to ensure and maximize the quality, objectivity, utility, and integrity of its information. FHWA periodically reviews quality issues and adjusts its programs and processes to ensure continuous quality improvement.

final report
Performance Management Practices and Methodologies for Setting Safety Performance Targets
Task B-1 – Literature Review

Technical Report Documentation Page
1. Report No.
FHWA-SA-14-007
2. Government Accession No.
3. Recipient’s Catalog No.
4. Title and Subtitle
Performance Management Practices and Methodologies for Setting Safety Performance Targets: Task B-1 Literature Review
5. Report Date
October 24, 2011
6. Performing Organization Code
7. Author(s)
Audrey Wennink
8. Performing Organization Report No.
9. Performing Organization Name And Address
Cambridge Systematics, Inc. 100 CambridgePark Drive, Suite 400 Cambridge, MA 02140
10. Work Unit No. (TRAIS)
11. Contract or Grant No. DTFH61-10-D-00020
12. Sponsoring Agency Name and Address
Federal Highway Administration Office of Safety 1200 New Jersey Avenue, SE Washington, DC 20590
13. Type of Report and Period Covered Final Report, June 2011 to October 2011
14. Sponsoring Agency Code
15. Supplementary Notes
The contract manager for this project was Keith D. Williams.
16. Abstract
This document reviews the role of target setting in a performance management framework, safety performance measures, and provides of examples of national safety target setting.
17. Key Words
Safety, performance measure, target, goal, transportation
18. Distribution Statement
No restrictions
19. Security Classif. (of this report)
Unclassified
20. Security Classif. (of this page)
Unclassified
21. No. of Pages
46
22. Price
N/A Form DOT F 1700.7 (8-72) Reproduction of completed page authorized


Performance Management Practices and Methodologies for Setting Safety Performance Targets Task B-1 - Literature Review
i
Table of Contents
1.0 Introduction ............................................................................................................ 1
2.0 Target Setting ......................................................................................................... 3 2.1 Role of Target Setting .................................................................................... 3 2.2 Goal Setting .................................................................................................... 5 2.3 Types of Safety Performance Measures ...................................................... 6
Number of Fatalities/Serious Injuries ........................................................ 7 Number of Fatal/Injury Crashes ................................................................. 7 Fatality Rate per VMT ................................................................................... 8 Fatality Rate by Population .......................................................................... 8
2.4 Approaches to Target Setting ....................................................................... 8 Examples of National Target Setting ........................................................ 12
United States ............................................................................................ 12 Canada ...................................................................................................... 13 Denmark ................................................................................................... 14 United Kingdom ..................................................................................... 14 Norway ..................................................................................................... 15 Australia ................................................................................................... 16 Finland ...................................................................................................... 17 Japan ......................................................................................................... 17 The Netherlands ...................................................................................... 18 European Commission ........................................................................... 19 United Nations ........................................................................................ 19
2.5 Allocation of Resources .............................................................................. 22 2.6 Evaluation ..................................................................................................... 23 2.7 Data ................................................................................................................ 23
3.0 Conclusions ........................................................................................................... 25
4.0 References ............................................................................................................. 27


Performance Management Practices and Methodologies for Setting Safety Performance Targets Task B-1 - Literature Review
iii
List of Tables
Table 2.1 Advantages and Risks of Target-Setting Approaches ........................... 9
Table 2.2 Predicted Number of Road Users Killed or Injured in Norway in 2020 according to Different Options .................................................. 16
Table 2.3 Representative Sample of Safety Targets ............................................... 20

Performance Management Practices and Methodologies for Setting Safety Performance Targets Task B-1 - Literature Review
v
List of Figures
Figure 2.1 Performance Management Framework ................................................... 4
Figure 2.2 Factors Influencing Target Setting Approaches ................................... 11
Figure 2.3 U.S. DOT Performance Target Setting for Highway Fatalities ........... 13
Figure 2.4 Japan Methodology for Target Setting ................................................... 18

Performance Management Practices and Methodologies for Setting Safety Performance Targets Task B-1 - Literature Review
1
1.0 Introduction
Over the last 15 years, use of performance management has dramatically increased in the transportation arena to plan, prioritize, track, and improve the effectiveness of nearly all functions to achieve an agency’s fundamental goals, including safety. Performance information guides decisions about priorities and resource allocation, not only for capital project delivery, but also for internal agency management and operations (Cambridge Systematics, 2009).
The Federal Highway Administration (FHWA) has begun a process for identifying a methodology for setting a national traffic fatality performance target. This literature review catalogues and analyzes existing fatality target setting practices for transportation agencies. The objective is to identify relevant theories, ideas, or recommendations for fatality target setting strategies and examples of specific methodologies in use.
The point of departure for this literature review is recent research conducted for NCHRP 666: Target-Setting Methods and Data Management to Support Performance-Based Resource Allocation by Transportation Agencies. This doc-ument and the literature reviewed for NCHRP 666 was screened for content specific to safety target setting. Additional literature from the National Transportation Library was identified through on-line databases, including Transportation Research Information System (TRIS) and Research in Progress (RIP). Keywords used to search included ‘safety’, ‘target’, ‘goals’, and ‘trans-portation’ among others. Transportation agency web site searches in countries known to have developed safety programs also were conducted, including the United Kingdom, Sweden, Australia, New Zealand, and Japan. Other recent research reports on performance-based planning were reviewed, including NCHRP Project 08-62 – Transportation Performance Management Programs – Insight from Practitioners and Proceedings from the National Forum on Performance-Based Planning and Programming. In total, 65 documents offered information useful to this task (a detailed listing is included in Section 4.0, References). The review did not include all state Strategic Highway Safety Plans. These and other state safety plans are being reviewed in a separate task to develop a compendium of state practices in setting safety targets.
General observations from the literature review included:
• Target setting is a key element of performance management. Targets provide a direct link between goals and investment decisions. They allow agencies to gauge progress over time.
• Much of the relevant literature defines safety targets as reductions in: 1) actual fatalities/serious injuries, 2) fatal/serious injury crashes, or 3) fatality/injury rates.

Performance Management Practices and Methodologies for Setting Safety Performance Targets Task B-1 - Literature Review
2
• A few key documents (Whitelegg and Haq, 2006) suggest agencies adopt interim targets based on a broader vision (e.g., Vision Zero). Sweden, Finland, Australia, and the Netherlands have established a zero fatality vision. Within the U.S., Alaska, Arizona, Iowa, Louisiana, Utah, Washington and others have adopted versions of the “Target Zero” goal.
• Few agencies use a data intensive, modeling approach to set targets for fatali-ties (Washington and Kim, 2007). Japan and the United Kingdom (UK) have incorporated road safety measures and vehicle safety technologies into forecasting models, but the final target is set as a matter of policy, combining information from modeling, expert opinion, and the practicality of the long-term vision.
In approaching this work the use of language is important. In the report two types of targets are described, hard targets and stretch goal targets. Hard targets are raw numbers or percentages, while stretch goal targets – in many cases zero –are treated as goals.
Performance Management Practices and Methodologies for Setting Safety Performance Targets Task B-1 - Literature Review
3
2.0 Target Setting
While many agencies set targets, limited information is available on the target set-ting process. Relevant findings from the literature can be categorized into four areas, including: the role of target setting, goal setting, types of safety measures, and approaches to safety target setting.
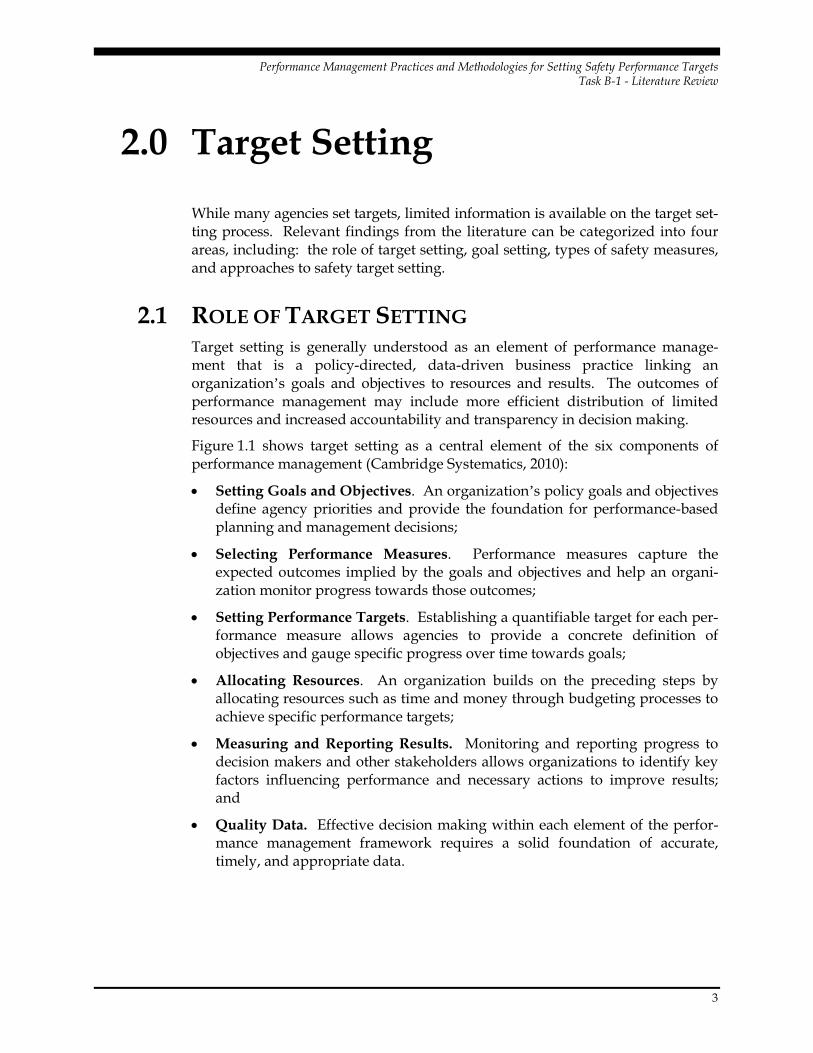
2.1 ROLE OF TARGET SETTING Target setting is generally understood as an element of performance manage-ment that is a policy-directed, data-driven business practice linking an organization’s goals and objectives to resources and results. The outcomes of performance management may include more efficient distribution of limited resources and increased accountability and transparency in decision making.
Figure 1.1 shows target setting as a central element of the six components of performance management (Cambridge Systematics, 2010):
• Setting Goals and Objectives. An organization’s policy goals and objectives define agency priorities and provide the foundation for performance-based planning and management decisions;
• Selecting Performance Measures. Performance measures capture the expected outcomes implied by the goals and objectives and help an organi-zation monitor progress towards those outcomes;
• Setting Performance Targets. Establishing a quantifiable target for each per-formance measure allows agencies to provide a concrete definition of objectives and gauge specific progress over time towards goals;
• Allocating Resources. An organization builds on the preceding steps by allocating resources such as time and money through budgeting processes to achieve specific performance targets;
• Measuring and Reporting Results. Monitoring and reporting progress to decision makers and other stakeholders allows organizations to identify key factors influencing performance and necessary actions to improve results; and
• Quality Data. Effective decision making within each element of the perfor-mance management framework requires a solid foundation of accurate, timely, and appropriate data.

Performance Management Practices and Methodologies for Setting Safety Performance Targets Task B-1 - Literature Review
4
Figure 2.1 Performance Management Framework
Goals/Objectives
Performance Measures
Quality DataTarget SettingEvaluate Programs,
Projects, and Strategies
Measure, Evaluate, and Report ResultsActual Performance
Achieved
Allocate ResourcesBudget and Staff
Source: Cambridge Systematics, Inc.
Transportation safety is one of the most commonly measured performance areas for transportation agencies, both internationally and in the U.S. In the U.S., safety performance measure tracking and the use of safety targets has grown substantially since the Safe Accountable Flexible Efficient Transportation Equity Act – A Legacy for Users (SAFETEA-LU) required development of Strategic Highway Safety Plans.
Both long-term and interim targets are used in many countries in national, regional, and local road safety programs. The types of safety targets in use include hard targets (i.e., reduce fatalities to a specific number) and stretch goal targets (i.e., achieve zero fatalities by some future year). However, the literature presents little documentation of the methods and approaches used to set these safety targets. The most commonly documented approach is to establish a top-down visionary target and track success using interim, hard targets.
The literature provides several observations and recommendations about target setting.
• Setting targets can have a significant effect on safety performance, even if the targets are not achieved. Targets demonstrate a government’s commitment to reducing fatalities and injuries on its roadways. It is recommended all countries adopt ambitious, empirically derived road safety targets to help drive improved performance and accountability (Joint Transportation Research Centre of the Organisation for Economic Co-operation and Development and International Transport Forum, 2008). For example, in Australia, target establishment strengthened commitment to national action on road safety issues. The country made significant gains in many areas, achieving a 34 percent reduction in the per capita fatality rate even though

Performance Management Practices and Methodologies for Setting Safety Performance Targets Task B-1 - Literature Review
5
this fell short of the target of a 40 percent reduction (Australian Transport Council, 2011).
• Targets demonstrate that transportation leaders are likely to support pro-posed policy and legislative changes and allocate sufficient resources to safety programs. In the Netherlands the Ministry of Transport recently lowered the safety target from 580 fatalities by 2020 to 500. This follows a decade where the number of injuries dropped by over 10 percent and the number of road fatalities decreased by 30 percent. By continuing to set aggressive targets, leadership is demonstrating continued ambition to make additional safety gains (Ministry of Transport, Public Works, and Water Management, 2009).
• Targets also can raise the profile of safety by creating a visible goal for vari-ous entities to work toward collaboratively. This can drive decisions about institutional coordination, legislative needs, resource allocation, performance monitoring, research, and knowledge transfer (Joint Transport Research Centre of the International Transport Forum and the Organisation for Economic Co-operation and Development, 2008).
• UK researchers have noted that it is important to use a sound methodology to prepare a target for reducing roadway crashes and fatalities. If the methodology is not sound, the target will lack credibility and jeopardize safety efforts. Additionally, if key stakeholders realize a poor methodology has produced an overly ambitious target that cannot be achieved, they will lose motivation and progress will be hampered (Broughton, J. 2009).
2.2 GOAL SETTING Setting an overarching goal provides a framework and focus for safety efforts. Perhaps the most well known goal is the Swedish Road Administration’s Vision Zero, which was introduced in 1995. The Vision Zero concept is guided by the belief that the road transport system must be designed with the understanding that people make mistakes, and traffic crashes cannot be avoided completely. Therefore, the roadway system must be designed so human error does not result in serious or fatal injuries. This perspective shifts the major share of safety responsibility from road users to those who design the roadway system (Swedish Road Administration, 2006).
Several countries, particularly developed countries with strong road safety initi-atives, have followed Sweden’s lead and developed a long-term goal to have no fatalities or serious injuries occur on the roadway system. This vision is often accompanied by interim targets to measure progress. Countries taking this approach include Finland, Australia, and the Netherlands. In the U.S. several states have adopted a Vision Zero approach, including Arizona, Iowa, Utah, and Washington. In addition to its “Target Zero” goal, Washington State also has identified interim targets: To achieve Target Zero, the State must decrease traffic

Performance Management Practices and Methodologies for Setting Safety Performance Targets Task B-1 - Literature Review
6
fatalities by 25 each year between 2008 and 2030. Iowa’s “One Death is One Too Many” provides an overall vision, and interim fatality targets also have been set for the State.
Countries adopting zero as a vision/goal for traffic fatalities have made substan-tial progress; however some concerns with such a target also have been identi-fied. One benefit of such an ambitious goal is it can push a society past its comfort zone and stimulate the development of new safety measures. However, taking on the goal of eliminating a known cause of death, such as traffic crashes, may be so expensive it reduces resources available to address other causes of death and may increase general mortality. (Elvik, 1999.) For example, Netherlands leadership recognizes that to reduce fatalities past a certain point will impact quality of life in other ways. Society must ask if getting to zero roadway fatalities is worth cutting down all the trees next to the roadway or establishing societal restrictions that would negatively impact quality of life in other ways (Ministry of Transport, Public Works and Water Management, 2009).
A related approach, adopted by Canada’s road safety stakeholders, is to have the “safest roads in the world.” The approach does not set a specific target or long- term goal but does provide a potentially easy means to check on progress and to iden-tify shorter-term targets by examining the performance of others. (CCMTA, 2011.)
2.3 TYPES OF SAFETY PERFORMANCE MEASURES Five common types of safety measures used for targets were identified in the litera-ture, including raw numbers of fatalities/serious injuries, number of fatal/serious injury crashes, fatality and injury rates based on vehicle miles traveled, and fatality/serious injury rate by population. Number of licensed drivers is also used as an exposure measure in some of the literature (i.e., as the denominator in a rate-based measure instead of population or vehicle miles of travel).
As states and regions follow the strategic highway safety planning approach defined by the American Association of State Highway and Transportation Officials (AASHTO), they have defined safety emphasis areas to focus efforts to improve safety. Some states have set targets related to these emphasis areas, though typically for the same fatalities and serious injuries statistics described above. For example, in New Mexico, a target was set for the number of alcohol-related traffic fatalities. (Note: a comprehensive review of target setting practices in strategic highway safety plans will be provided in a future task.)
Beginning with 2010 Highway Safety Plans and Annual Reports, states are using a core set of safety performance measures developed by the National Highway Traffic Safety Administration (NHTSA) and the Governors Highway Safety Association (GHSA). Three of the recommended performance measures and recommended data sources, as defined in Traffic Safety Performance Measures for States and Federal Agencies, are:

Performance Management Practices and Methodologies for Setting Safety Performance Targets Task B-1 - Literature Review
7
• Number of traffic fatalities (FARS);
• Number of serious injuries in traffic crashes (State crash data files); and
• Fatalities per vehicle miles traveled (FARS/FHWA).
Number of Fatalities/Serious Injuries Many states and countries identify the total number of fatalities as the primary safety performance measure and set targets for reducing this number. This measure is easily understood by stakeholders and the public. Examples of the approach include:
• The Kansas City region set a target to decrease transportation-related fatali-ties in the Kansas City region from 245 to 183 or fewer, by 2012. To meet this target, regional fatalities must fall by 3.9 percent annually. The regional tar-get is based on Missouri’s Blueprint to Arrive Alive. In Missouri, while the vision is to work toward zero fatalities, the interim target is 850 or fewer fatalities by 2012.
• The target in Kentucky is to reduce fatalities by 5 percent from the 2006-2008 level by 2010 and an additional 10 percent by 2012.
• Finland set a target to halve the total number of fatalities to 125 by 2020.
As safety measurement evolves, increasingly attention is being paid to the toll in serious injuries as well as fatalities. In 2005, Japan established the target of a reduction in fatalities to no more than 5,500 by 2010 (a decrease of 1,200 annual fatalities compared to 1999). The serious injury target was a 25,000 reduction by 2010, compared to 2005, and a reduction of 50,000 serious injuries by 2015. Australia’s target for 2020 is to reduce both the annual number of traffic fatalities and the annual number of serious injuries by 30 percent. At this time the European Commission plans to develop a serious injury target, but has not because of inconsistencies in the definition for severe and minor injuries (European Commission, 2010).
Number of Fatal/Injury Crashes Some states measure the number of fatal crashes – crashes involving one or more fatalities. Using the number of fatal crashes as a target does not account for vari-ation in vehicle occupancy. The total number of fatalities will be higher as more than one person may die in a crash. This type of measure also may be expanded to include injury or serious injury crashes either as a separate category or a com-bined fatal and injury crash target. For example, the Cheyenne Metropolitan Planning Organization set its target at a 20 percent reduction in fatal and injury crashes from 2008 to 2020.
Performance Management Practices and Methodologies for Setting Safety Performance Targets Task B-1 - Literature Review
8
Fatality Rate per VMT A number of states track safety using a fatality rate, such as the rate of fatalities per 100 million vehicle miles of travel (100 MVMT). The fatality rate perfor-mance measure controls for the amount of vehicle traffic, and thus, theoretically, makes it a comparable measure across states. In California the target was set to reduce the fatality rate on the California State highway system to 1.00/100 MVMT by 2008 and to continuously reduce annually thereafter toward a goal of the lowest rate in the nation. The available literature suggests that other coun-tries rely more on raw fatality numbers than on rates. No international examples we found using fatalities per MVMT as safety performance measures.
Fatality Rate by Population The fatality rate per unit of population is a measure of safety that accounts for population growth over time and normalizes safety results in areas with differ-ent population levels. For example, in the 2004 Transportation Safety Action Plan, the Oregon Transportation Commission established a performance meas-ure of transportation deaths per 100,000 people. Sometimes states or regions will look at fatality rate per unit of population to get a snapshot of where higher and lower rates fall among a number of jurisdictions. Mortality rate per 100,000 people also is the most common exposure-based statistical reporting measure adopted by the public health community. The World Health Organization (WHO) and the Center for Disease Control and Prevention (CDC) regularly pub-lish mortality rates and set health targets per 100,000 people.
2.4 APPROACHES TO TARGET SETTING NCHRP 666: identifies a number of approaches to target setting, not all of which are applicable to safety (Table 2.1). The range of target setting approaches includes:
1. Edict – A target is set by agency leadership, elected officials, or other policy-making body;
2. Expert – A target is set through a consensus-based planning process within the context of a performance-based resource allocation exercise;
3. Customer Feedback – A target is set based on feedback from users of the transportation system;
4. Benchmarking – A target is set based on targets established by peer jurisdictions; and
5. Modeling – A target is set by modeling the expected impact of strategies and investments on future performance.

Performance Management Practices and Methodologies for Setting Safety Performance Targets Task B-1 - Literature Review
9
Table 2.1 Advantages and Risks of Target-Setting Approaches Target-Setting Approach Advantage Risk
Approach to Balancing Advantages with Risks
Edict • Less time and money intensive.
• Unequivocal and well-understood.
• Lack of defensibility and inclusion.
• Use hybrid approach.
Expert Opinion • Insures broad understanding and acceptance within and outside agency.
• May founder in effort to be inclusive.
• Appoint internal champion to lead effort to identify the “critical few” measures and targets.
Customer Feedback
• Insures more transparent process.
• May be confusing to discuss technical measures with public.
• Describe measures and targets in the simplest terms possible.
Benchmarking • Provides a peer group comparison.
• Can be misused for comparative rankings.
• Continue to refine comparative analysis techniques.
Modeling • Defensibility.
• Better understanding of future performance.
• More time and money intensive.
• Models change over time.
• Continue to refine modeling techniques.
• Use hybrid approach.
Source: NCHRP 666: Target-Setting Methods and Data Management to Support Performance-Based Resource Allocation by Transportation Agencies.
Stretch goal targets are generally determined via edict (a decision by a policy-maker or group of policy-makers, DOT directors, or others) or in combination with expert opinion.
Benchmarks to compare performance against peers tend to be hard or percent change targets. However, Japan’s medium-term goal to achieve the world’s saf-est roadway conditions and Canada’s vision of making its roads the safest in the world may be considered stretch goal targets. European Union (EU) member states have been encouraged to develop national road safety strategies to achieve the regional target. The European Commission recommends each state concentrate its efforts on areas where performance is the lowest, using as an indicator the results obtained by the best performers in such areas. Each country could therefore establish its national safety target, such as a fatality rate by vehicle kilometers driven. The Missouri DOT does not set specific targets for safety or any other performance measure. However, for each safety measure included in the MoDOT Tracker, MoDOT benchmarks its performance against other states, showing Missouri’s ranking in the nation.
Modeling-based approaches are defined here as any data-driven methodology for setting a target. Modeling approaches include extrapolating recent trends into the future or using a model to forecast the effects of funding, projects, and

Performance Management Practices and Methodologies for Setting Safety Performance Targets Task B-1 - Literature Review
10
policies on future safety performance. This often involves comparing a “do nothing” scenario to scenarios that combine investments and policies at various levels (i.e., from moderate to aggressive action).
Due to the technical challenges of forecasting safety impacts and the public pol-icy implications of safety, modeling is rarely if ever solely used to set safety targets. Instead, modeling approaches provide information to decision makers who ultimately select a target using additional information sources (such as customer-feedback or expert opinion).
A small number of countries have used or are using empirically-derived targets, based on quantitative modeling of potential strategies. With this approach, tar-gets are based on empirical evidence of the selected interventions’ previous effectiveness combined with best estimates of future effectiveness, using a model linking inputs and outcomes. For example, Japan developed targets based on anticipated effects of vehicle safety improvements. Targets based on safety effectiveness, supported by research are more realistic and achievable, which helps secure political support (International Transport Forum).
A number of factors influence target setting types. Figure 2.2 relates these factors, shown in the first column, back to the target-setting approaches, shown in the bottom row, by indicating the level of influence of each factor in each type of approach. The ratings in the table show the extent to which an element is priority or the level of resources needed for various types of target setting approaches. For example, in the case of a target by edict, the level of customer- service focus would be low; for a target developed using modeling, strong technical resources would be needed.

Performance Management Practices and Methodologies for Setting Safety Performance Targets Task B-1 - Literature Review
11
Figure 2.2 Factors Influencing Target-Setting Approaches
Political/Legislative Influence Varied Strong Strong Varied Varied
Customer Service Focus Low priority High priority Highest priority Priority Priority
PBRA History/Evolution in State of the Practice Shorter history Varied Longer history Varied Longer history
Commitment to Regular Communication and Reporting Low priority High priority High priority Priority Priority
Span of Control/ Agency Jurisdiction Limited/focused Broad Broad Any Limited modes
Financial Resources Few Few Strong Medium Strong
Timeframe Varied Varied Varied Short Varied
Technical Resources/ Planning and Forecasting Capability Low Low Low Medium Strong
Organizational Structure Very centralized Varied Varied Varied Varied
Stakeholder Expectations Low priority High priority High priority Priority Priority
Internal Support Low priority High priority Priority High priority Priority
Types of Resources to be Allocated Internal funds and staff Funding for projects/programs
Funding for projects/programs Varied Funding for
projects/programs
Culture Less oriented to PBRA Stakeholder-oriented Customer-oriented Competitive Technical
Edict Expert Opinion
Customer Feedback
Benchmarking Modeling
Source: NCHRP 666: Target-Setting Methods and Data Management to Support Performance-Based Resource Allocation by Transportation Agencies.

Performance Management Practices and Methodologies for Setting Safety Performance Targets Task B-1 - Literature Review
12
To evaluate the factors affecting target-setting for a particular measure in a public agency or private organization, a practitioner can begin by asking a few simple questions:
• Why is the target needed?
• Who will be using the targets?
• Where in the process will the targets be used?
• When should targets be attained?
• How will targets be calculated and achieved?
• What is the target?
Examples of National Target Setting Limited information is available in the literature on the practical details of target setting. In most cases, targets are presented by the national government or by a state leadership, with no supporting documentation on how the target was developed. Following are examples of targets set by various countries with information about the approach where available.
United States In May of 2007, the American Association of State Highway Transportation Officials (AASHTO) Board of Directors adopted the revised national highway safety target of halving fatalities in two decades. This replaced the AASHTO target set in 2003 to reduce the national fatality rate to no more than one fatality per 100 MVMT (AASHTO, 2005). The motivation behind setting the new target of halving fatalities within 20 years was AASHTO’s recognition that the previous target would not be reached by 2008 and a new approach to engaging stake-holders was needed. AASHTO consciously selected a numerical target that would resonate more with the public than an exposure-based figure. This is expected to be a more successful approach given that achievement of a target is largely impacted by broad acceptance and support by the public, media, and public/private institutions of highway safety goals (AASHTO, 2007b).
To set the previous goal of 1.0 fatalities per 100 MVMT, a simple analysis was conducted that compared the reductions in fatalities that would be required to hit various potential targets. At the time the 1.0 per MVMT target was devel-oped, data were available through 2001 and about 42,000 fatalities occurred annually for a fatality rate of 1.51 per MVMT. At the time, VMT was expected to grow by roughly 2 percent per year, which would yield 50,000 fatalities by 2008 if the current fatality rate remained constant. Analyses were conducted to determine the result of lowering the fatality rate by different amounts. The final target chosen was 1.0 fatality per MVMT shown in Figure 2.3, which translated into a target of a 20 percent reduction in fatalities from 2001 to 2008. To achieve the target, the fatality rate had to be reduced by 34 percent because of the antic-ipated growth in VMT (Cambridge Systematics, 2006b).

Performance Management Practices and Methodologies for Setting Safety Performance Targets Task B-1 - Literature Review
13
Figure 2.3 U.S. DOT Performance Target Setting for Highway Fatalities
Source: NCHRP Report 97 – Guide to Effective Freeway Performance Measurement: Final Report and
Guidebook, Transportation Research Board.
Canada In Canada, the national target for 2008-2010 called for a 30 percent decrease in the average number of road users killed or seriously injured compared with 1996-2001 average figures (Canadian Council of Motor Transport Administrators, 2006). The methodology for setting the target was not described and is assumed to be by edict and expert opinion. A number of subtargets and intermediate outcome targets also were set, including:
• Ninety-five percent rate of seat belt wearing and proper use of appropriate child restraints by all motor vehicle occupants;
• Forty percent decrease in the number of fatally or seriously injured unbelted occupants;
• Forty percent decrease in the percentage of road users fatally or seriously injured in crashes involving drinking drivers; and
• Forty percent decrease in the number of road users fatally or seriously injured on rural roadways (defined as roads where the speed limit is 80-90 km/hr).
In its most recent safety plan released in 2011, Canada no longer includes hard targets. The goal will be to achieve downward progress in fatalities and serious injuries, tracked through rate-based measures. However, if local jurisdictions would like to establish targets they will be permitted to do so (Canadian Council of Motor Transport Administrators, 2011).

Performance Management Practices and Methodologies for Setting Safety Performance Targets Task B-1 - Literature Review
14
Denmark While the overarching vision is “every accident is one too many,” Denmark also has set an interim safety target. The target established for 2012 is no more than 300 fatalities and 2,443 serious injuries. This represents a 40 percent reduction compared to 1998 levels. While previous targets included fatalities and all inju-ries, the current target includes only serious injuries to focus efforts on the most serious areas of need. To identify the target, Denmark forecasted the safety effects of all the measures that were deemed cost effective. The target time period of 12 years was selected purposely to allow local jurisdictions sufficient time to conduct analysis of local trends and identify and implement appropriate countermeasures (Danish Ministry of Transport, 2000).
United Kingdom In the late 1990s the UK established a methodology to forecast road safety countermeasure effects and support safety target development. This methodology provides a series of statistical models that were used to forecast the number of casualties under a number of assumptions about the changes in road travel and the assumed effects of new road safety countermeasures that might be introduced. An important feature of the methodology is it can incorporate the effects of existing road safety countermeasures where they can be estimated reliably.
The UK found only three types of measures could be reliably estimated:
• Improved standards of secondary safety in cars;
• Countermeasures to reduce the level of alcohol impaired driving; and
• Road safety engineering countermeasures.
The UK updates the forecasting models annually, and results show the methodology is reliable overall.
As a result of the analysis, the UK set targets for 2010 compared to the average for 1994-1998: a 40 percent reduction in the total number of people killed or seriously injured; a 50 percent reduction in children killed or seriously injured; and a 10 percent reduction in the minor injury rate based on distance traveled (OECD, 2002). This followed the previous target set in 1987 to reduce roadway casualties by one-third by 2000.
Research was conducted to develop a safety target for the period after 2010 (Post 2010 Road Casualty Reporting). However, since this report was developed, a deci-sion was announced in 2011 in the Department for Transport’s Strategic Framework for Road Safety to abandon use of a national safety target in favor of devolving responsibility to local jurisdictions, which will develop individual per-formance measures. It is anticipated effectiveness will be increased by supporting local capacity building and enabling flexibility and creativity instead of a prescribed central safety target. The report does, however, introduce a number of performance measures to track safety performance over time.

Performance Management Practices and Methodologies for Setting Safety Performance Targets Task B-1 - Literature Review
15
Norway Norway’s National Transport Plan defines a safety target to reduce the number of fatalities or serious injuries by at least a third by 2020, compared to 2005-2008. This represents roughly the same reduction in the next 10 years as in the pre-vious 20 years. It must be noted that the target exists under the umbrella of a Vision Zero goal as Norwegian politicians historically have found any target other than zero untenable (Elvik, 2009).
To develop this target, Norway conducted a detailed analysis of the potential effects of safety countermeasures. Researchers considered 139 road safety coun-termeasures, of which 45 were included in an impact assessment with benefit-cost analysis. The other 94 safety countermeasures were not included for rea-sons, including:
• Effects of the countermeasure are too poorly known to support an impact assessment;
• The countermeasure does not improve safety;
• The countermeasure has been fully implemented in Norway;
• The countermeasure overlaps another countermeasure and was not included to prevent double counting; and
• The countermeasure is unable to be analyzed.
Norway considered the potential impact of these measures through 2020, finding that 39 of the 45 measures analyzed were cost effective. The future effectiveness of the countermeasures was estimated in the context of four policy approaches:
1. Optimal use of all safety countermeasures for which benefits exceed costs (including benefits beyond only safety benefits). These countermeasures include vehicle, roadway engineering, enforcement, and education safety strategies. The predicted level of fatalities in 2020 without the measures is 285, which can be reduced by 48 percent to 138 fatalities if all measures are used to the fullest extent. However, constraints are not factored in, such as public acceptance or financial limitations, so it is unlikely full implementation of all countermeasures will be possible.
2. Optimal use of road safety countermeasures under national control. Under this policy, current strategies would be used to the fullest extent. Some strategies included here that are not included in Policy 1 include speed enforcement and speed cameras.
3. Continuation of present policies at current levels.
4. Strengthening of present policies, e.g., increased enforcement of speed, impaired driving, and safety belt use; upgraded pedestrian crossings; and increased roundabout installation.
Table 2.2 shows the forecasted safety results for each of the policy approaches. The road safety impact assessments show that if the most aggressive level of
Performance Management Practices and Methodologies for Setting Safety Performance Targets Task B-1 - Literature Review
16
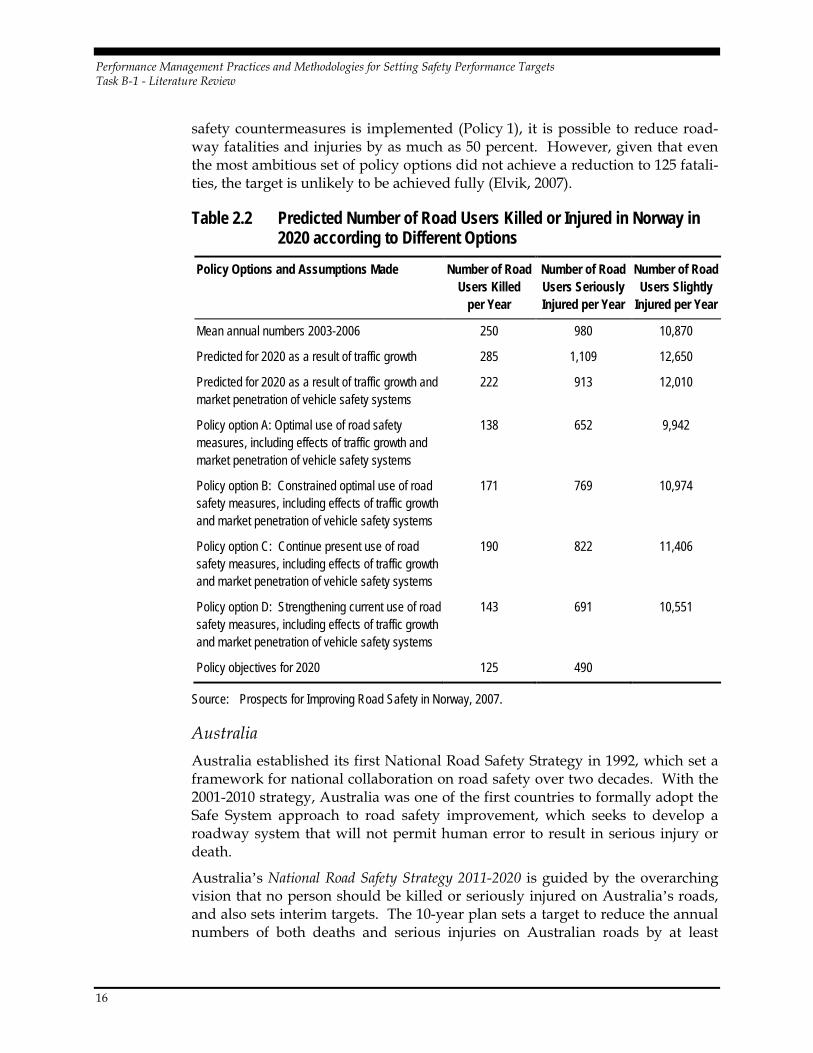
safety countermeasures is implemented (Policy 1), it is possible to reduce road-way fatalities and injuries by as much as 50 percent. However, given that even the most ambitious set of policy options did not achieve a reduction to 125 fatali-ties, the target is unlikely to be achieved fully (Elvik, 2007).
Table 2.2 Predicted Number of Road Users Killed or Injured in Norway in 2020 according to Different Options
Policy Options and Assumptions Made Number of Road Users Killed
per Year
Number of Road Users Seriously Injured per Year
Number of Road Users Slightly
Injured per Year
Mean annual numbers 2003-2006 250 980 10,870
Predicted for 2020 as a result of traffic growth 285 1,109 12,650
Predicted for 2020 as a result of traffic growth and market penetration of vehicle safety systems
222 913 12,010
Policy option A: Optimal use of road safety measures, including effects of traffic growth and market penetration of vehicle safety systems
138 652 9,942
Policy option B: Constrained optimal use of road safety measures, including effects of traffic growth and market penetration of vehicle safety systems
171 769 10,974
Policy option C: Continue present use of road safety measures, including effects of traffic growth and market penetration of vehicle safety systems
190 822 11,406
Policy option D: Strengthening current use of road safety measures, including effects of traffic growth and market penetration of vehicle safety systems
143 691 10,551
Policy objectives for 2020 125 490
Source: Prospects for Improving Road Safety in Norway, 2007.
Australia Australia established its first National Road Safety Strategy in 1992, which set a framework for national collaboration on road safety over two decades. With the 2001-2010 strategy, Australia was one of the first countries to formally adopt the Safe System approach to road safety improvement, which seeks to develop a roadway system that will not permit human error to result in serious injury or death.
Australia’s National Road Safety Strategy 2011-2020 is guided by the overarching vision that no person should be killed or seriously injured on Australia’s roads, and also sets interim targets. The 10-year plan sets a target to reduce the annual numbers of both deaths and serious injuries on Australian roads by at least

Performance Management Practices and Methodologies for Setting Safety Performance Targets Task B-1 - Literature Review
17
30 percent. Under the previous National Road Safety Strategy 2001-2010, a target was set to reduce the annual rate of road fatalities per 100,000 people by 40 percent, which is approximately equivalent to a 30 percent reduction in the absolute number of fatalities. The actual reduction achieved over that period was 23 percent. While the previous strategy set a target for fatalities only, the new strategy includes serious injuries as an important dimension of the roadway safety problem (Australian Transport Council, 2011).
Australia’s method for setting its most recent safety target was influenced by data modeling by the Monash University Accident Research Centre (MUARC), which estimated the potential reductions in deaths and serious injuries expected from a range of road safety interventions. This effort included review of Australian and other research on the effectiveness of a number of road safety countermeasures. The modeling was one input into target setting. The targets set in Australia seek to balance the evidence about what can realistically be achieved and desire to move the country toward zero roadway fatalities, which will require innovation and renewed national commitment to safety. Australian officials recognize the level of fatal and serious injury reduction achievable by 2020 depends on the costs and policy changes the community will accept in return for a safer road transport system (Australian Transport Council, 2011).
Finland While Finland is guided by its overarching Vision Zero goal, it has established an interim safety target to halve the number of road fatalities (270 in 2010) during the next decade. The Annual Report 2010 on transport notes the importance of safety culture increases as the number of accidents approaches zero.
Japan Japan has established the long-term goal to be a crash free society and also set interim targets. In 1999, the Transport Engineering Council established a target to achieve a 1,200 annual fatality reduction by 2010 compared to 1999. The target was reached five years early, and therefore an additional reduction of 800 fatali-ties was added to the target for 2010 (Japanese Transport Policy Council).
In 2006, Japan revised its safety targets with a focus on the capabilities of vehicle technologies to reduce fatalities. The safety target was modified to no more than 5,500 fatalities by 2010. Japan divided vehicle safety technologies into the fol-lowing two groups:
1. Those activated before a crash to avoid the crash or to reduce the impact speed, described as “active safety” technologies; and
2. Those activated upon crash involvement to mitigate injury by minimizing the impact, (e.g., restraining the occupants), described as “passive safety technologies.

Performance Management Practices and Methodologies for Setting Safety Performance Targets Task B-1 - Literature Review
18
Japan estimates the passive technologies currently in use have nearly reached their potential to reduce fatalities. To continue to reduce fatalities in the years following 2010, Japan feels greater promotion of active safety technologies designed to prevent crashes and slow down crash impact speeds is essential. Figure 2.4 shows how targets were set in Japan based on anticipated vehicle safety technology effectiveness. The yellow line indicates initial reduction of 1,200 fatalities by 2010, which was based on advanced vehicle technology. Adjusting for the inclusion of “passive safety” technologies, the target was reduced by a further 800 fatalities by 2010 (blue line). Targets beyond 2010 will incorporate “active safety” measures in vehicles to achieve accelerated reduction in traffic mortality (green line).
Figure 2.4 Japan Methodology for Target Setting
Source: Japan Road Transport Subcommittee of Land Transport Committee of Transport Policy Council,
Vehicle Safety Measures for Building a Society Free from Road Traffic Accidents, 2006.
The Netherlands The Netherlands was one of the first countries to formulate quantitative targets for road safety. In 1987 the first Long Range Plan for Road Safety was published, including the 2000 target of 25 percent fewer fatalities and injuries compared to 1985. The Second Transport Structure Plan of 1990 reduced the targets for 2010 to 50 percent fewer road deaths and 40 percent fewer injuries compared to 1986. To achieve these targets a two-pronged approach involved focusing on enforce-ment, impaired driving, speed, and occupant protection, as well as “sustainable safety,” which is similar to the Safe Systems approach.
The 2020 target was originally established as no more than 580 fatalities, although the methods for setting the target were not described. In its Road Safety Strategic Plan 2008-2020, The Minister of Transport, Public Works and Water proposes a further reduction in the national safety target to a maximum of 500 fatalities. However, the report notes that to do so all the measures from the

Performance Management Practices and Methodologies for Setting Safety Performance Targets Task B-1 - Literature Review
19
Road Safety Strategy must be implemented, vehicle technology must meet expectations, and programs on alternatives methods of paying for transport must be implemented. Analysis by the Department of Transport and Shipping (DVS) and the Knowledge Institute for Mobility Policy (KiM) have determined such a fatality reduction is possible; however, the methodology is not known.
European Commission The European Commission recently established a target of halving the overall number of road deaths in the EU by 2020. Developing a unified target is intended to reduce disparities between the EU member countries and to provide a more consistent level of roadway safety throughout Europe. This is a continuation of its strategy to reduce by half roadway fatalities previously established between 2003 and 2010. Although the initial target was not met by the end of 2010, the European Commission believes the road safety action plan provided a catalyst. The 2020 target represents an ambitious goal for the region and demonstrates Europe’s commitment to road safety (European Commission, 2010).
Some European countries have adopted the EU fatality targets. For example, Greece established a target for reducing the number of road deaths by 50 percent by 2020. Achievement of this target would result in 650 fewer fatalities.
United Nations On May 11, 2011 the United Nations General Assembly formally announced the Decade of Action for Road Safety (2011 to 2020), which is based on the “safe sys-tems” approach (World Health Organization, 2011). No overarching target for this effort has been set. Instead, the effort asks individual countries to “set rea-listic and long-term targets for national activities based on the analysis of national traffic crash data through: 1) identifying areas for performance improvements; and 2) estimating potential performance gains.” The UN plans to set an “ambitious yet feasible” target for reduction of traffic fatalities by 2020 by building on the safety targets of individual countries.
The report also calls for countries to establish and support data systems for ongoing monitoring and evaluation at both national and local levels. These sys-tems would measure and monitor:
• Road traffic deaths, injuries and crashes;
• Intermediate outcomes, such as average speed, helmet use rates, safety belt use rates, etc.;
• Outcomes of road safety interventions;
• The economic impact of road traffic injuries; and
• Exposure to road traffic injuries.
Table 2.3 identifies a number of road safety targets throughout the U.S. and other countries. While this list is not comprehensive, it provides a sense of the key

Performance Management Practices and Methodologies for Setting Safety Performance Targets Task B-1 - Literature Review
20
safety measures and targets in use today. In a future task a compendium of state safety targets will be developed, which will provide a more comprehensive list for the U.S.
Table 2.3 Representative Sample of Safety Targets
Jurisdiction Performance
Measure Target Date Target Setting
Approach Reference Document
Missouri Fatalities 850 fatalities 2012 Unknown Missouri’s Blueprint to Arrive
Alive
New Mexico Fatalities and fatality rate
Alcohol related fatality <= 172; No alcohol related
fatality <= 264; Traffic fatality = 2 per 100 MVMT
Unknown Good to Great: Performance
Measures Report
Oregon Fatalities and fatality rate
9.75 (or 342 lives lost) per 100,000 population by
2010; 9.00 (or 315 lives lost based on 2002 population
figures) per 100,000 population by 2025.
Short-term: 2010;
Long-term: 2025
Unknown Oregon Transportation
Plan
Rhode Island
Fatalities and fatality rate
Reduce number of fatalities (based on a three year
average) from 81 in 2001 to 72 in 2015, 66 in 2025, and
63 in 2030. Fatality rate (per 100 MVMT) target:
0.79 in 2015; 0.65 in 2025; 0.60 in 2030.
Short-term: 2015;
Intermediate: 2025
Long-term: 2030
Unknown Rhode Island Transportation
2030
South Carolina
Fatalities 784 fatalities 2010 Unknown South Carolina Statewide
Comprehensive Multimodal
Transportation Plan
Vermont Fatality rate Reduce five-year average to 1 fatality per 100 MVMT
2010 Unknown Vermont Long Range
Transportation Business
Washington Fatalities Zero deaths 2030 Unknown The Gray Notebook

Performance Management Practices and Methodologies for Setting Safety Performance Targets Task B-1 - Literature Review
21
Table 2.3 Representative Sample of Safety Targets (continued)
Jurisdiction Performance
Measure Target Date Target Setting
Approach Reference Document
Wyoming Fatalities 142 fatalities Unknown Freight Performance Measures: Approach Analysis
Ohio Fatality Rate 1 per 100 MVMT Unknown Freight Performance Measures: Approach Analysis
North Carolina
Fatality Rate < 1.63 per 100 MVMT Unknown Freight Performance Measures: Approach Analysis
International – Australia
Fatalities and serious Injuries
Reduce annual number of fatalities and serious injuries 30 percent
2020 Modeling/Expert Opinion
National Road Safety Strategy
2011-2020
International –Denmark
Fatalities and serious injuries
300 fatalities; 2,443 serious injuries
2012 Modeling Every Accident is One Too Many
International –Finland
Fatalities
Halve the number of fatalities to 135
2020 Modeling Trafi Annual Report 2010
International –Japan
Fatalities; injuries
5,500 fatalities
Reduction in annual number of the injured –
25,000 fewer by 2010 and 50,000 fewer by 2015 compared to the 2005
baseline
2010 (fatalities)
2010/2015 (injuries)
Modeling Vehicle Safety Measures for
Building a Society
Free from Road Traffic Accidents
International –Netherlands
Fatalities and serious injuries
500 fatalities 2020 Unknown Road Safety Strategic Plan
2008-2020

Performance Management Practices and Methodologies for Setting Safety Performance Targets Task B-1 - Literature Review
22
Table 2.3 Representative Sample of Safety Targets (continued)
Jurisdiction Performance
Measure Target Date Target Setting
Approach Reference Document
International – New Zealand
Fatality rate among
specific risk groups
Reduce fatality rate of young people from 21 per 100,000 population to a
rate similar to that of young Australians of 13 per 100,000; reduce the level of fatalities caused by drink and/or drugged
driving, currently 28 deaths per one million population, to a rate
similar to that in Australia of 22 deaths per one
million population; reduce the road fatality rate of motorcycle and moped
riders from 12 per 100,000 population to a rate similar to that of the
best performing Australian state, Victoria, which is 8 per 100,000; reduce the road fatality rate of older New Zealanders from 15 per 100,000 population to
a rate similar to that of older Australians of 11 per
100,000.
2020 Benchmarking Safer Journeys: New Zealand’s
Road Safety Strategy 2010-
2020
International –Norway
Fatalities Reduce the number of fatalities or serious
injuries by at least a third, compared with 2005-2008
2020 Modeling Norway National Transportation
Plan 2010-2019
International –Sweden
Fatalities Vision Zero Edict Safe Traffic: Vision Zero on
the Move
Source: Cambridge Systematics, Inc.
2.5 ALLOCATION OF RESOURCES Performance management involves dividing resources across a range of perfor-mance areas; however, not many agencies are actively using measures as part of

Performance Management Practices and Methodologies for Setting Safety Performance Targets Task B-1 - Literature Review
23
resource allocation. Decisions on resource allocation within and across different types of investments require analysis of tradeoffs to understand how different allocation options will affect the achievement of policy objectives. After identifying the key factors that influence performance, agencies can direct resources toward areas with the greatest improvement potential and the most importance to stakeholders. Resource allocation should be aligned with progress toward targets (Cambridge Systematics, 2010).
However, performance management cannot compensate for insufficient funding. Funding constraints must be incorporated into development of a range of options and consideration of tradeoffs (Cambridge Systematics, 2010).
2.6 EVALUATION Ongoing monitoring of system performance provides data and information that should be fed back into the goals and performance measures. Monitoring typi-cally refers to the process of reviewing and communicating performance results to determine the success of an agency towards meeting its goals and targets. Evaluation typically refers to the process of reviewing the tools and methodolo-gies used to develop targets, analyze data, and forecast future performance. Both are important components of an overall performance management program.
A well designed monitoring process can indicate where and when course correc-tions are needed to improve safety performance. Safety system monitoring includes ongoing collection of traffic counts, crash data, health outcomes data and other means of determining the performance of the transportation system with respect to safety. Monitoring is undertaken by a range of agencies and then information is fed back into the planning process (FHWA, 2009). As data are col-lected and progress toward targets is monitored, targets can be adjusted based on the feasibility of achieving them. If targets are reached more quickly than expected, they can be reset so direction is set for continued progress.
Evaluation is critical to performance management because agencies desire to have quality information to help with decision making. Agencies can review practices and benchmark practices and tools against those used by other agencies to better understand the resources required to improve safety performance.
2.7 DATA Selecting performance measures requires balancing two considerations – the quality of data available and the ability of the performance measure to capture an agency’s goals and objectives. Performance measures are sometimes identi-fied based on appeal as “good information to have,” but if the necessary data do not exist or are expensive to collect, it will be challenging to use the measure. On the other hand, some agencies start with the data they have in hand, and identify what measures they can report. But if the measure does not capture the

Performance Management Practices and Methodologies for Setting Safety Performance Targets Task B-1 - Literature Review
24
fundamental objective of the agency’s goals and objectives, it will not help support decision making.
Either way, when screening performance measures, it is important to determine if quality data are available. To make this determination, it is usually necessary to consult with the data collection and processing units within the responsible agencies. Often, required data are collected by various agencies or divisions within an agency for a variety of purposes. Safety stakeholders will need to build the necessary relationships to access and use the data sources to measure transportation safety performance.
A strategy for systematic data collection to support performance measures over time must be put in place. Data collection schedules, organizational roles and responsibilities, resource allocations, and data collection methodologies must be incorporated into the standard procedures of the implementing agencies. It will be important to ensure data collection approaches meet the quality standards and schedule needs for selected safety performance measures (FHWA, 2009).

Performance Management Practices and Methodologies for Setting Safety Performance Targets Task B-1 - Literature Review
25
3.0 Conclusions
The cost of roadway deaths runs into billions of dollars worldwide. Transportation agencies across the globe are cognizant of the societal burden and are taking steps to reduce fatalities.
In the U.S., use of safety targets has grown substantially since SAFETEA-LU required development of Strategic Highway Safety Plans. With the introduction of a standard set of performance measures for states by GHSA and NHTSA, safety will be measured more consistently moving forward, although additional improvements, such as tracking injuries, are still needed. Safety targets can be effective by inspiring stakeholders involved in improving safety, tracking progress, and evaluating the effectiveness of investment decisions.
Numerous countries throughout the world (with the majority in Europe) have pursued and achieved safety targets over the years. While limited examples of well described target setting methodologies are available, current good practice involves a combination of top-down long term goals and as bottom-up interim targets (usually of a 7-10 year duration). A few agencies are developing interim targets closely aligned to the selection of countermeasures, their estimated effec-tiveness, vehicle safety technologies, and implementation quality. Such a process requires defining the country’s level of ambition for road safety and taking into account the institutional arrangements and strategies needed to improve safety. This target setting approach combines both idealism and realism.
Some European countries have 30 or more years of experience in safety target setting. This experience has revealed several pitfalls to avoid when setting safety targets (SafetyNet 2009).
• Targets without political support are unlikely to impact funding or the availability of resources.
• A purely symbolic target has no value. Targets should be accompanied by a realistic safety program to ensure progress. The national target should define actions and goals of all responsible key agencies.
• Much can go wrong with implementation. Early problem detection is critical to maintain a course toward achieving the target.
Targets must be ambitious but realistic. If targets are unrealistically ambitious for the defined time period and require a rate of progress significantly beyond that achieved previously, they will be perceived as being out of reach and will not be accepted. On the other hand, if the national strategy target is too easily obtained, a major opportunity for saving lives may be lost.
The UK and Canada provide examples of evolution in target setting as a policy decision. After decades of target setting and significant progress in reducing

Performance Management Practices and Methodologies for Setting Safety Performance Targets Task B-1 - Literature Review
26
roadway fatalities, both have decided to abandon national safety targets. The UK and Canada feel that to get to the next level in safety, they must enable greater local autonomy and establish a context for greater innovation at the local level. While target setting had important outcomes for these agencies, they believe a more flexible and holistic approach will enable continued progress.
At this stage, the brief literature review has examined most domestic and inter-national studies that discuss fatality target setting strategies. Even though many states and countries have a safety target in place, few have a well defined methodology documented in available literature. The scope of the research includes building upon this literature review through examination of state SHSPs and other state safety planning materials, and producing a research tech-nical paper. The next step will examine in detail methodologies used for estab-lishing performance measures and target setting by transportation agencies in non safety areas. Finally, this research effort will investigate how industries out-side of transportation use targets to make progress in key areas while facing similar challenges in terms of the number of independent and uncoordinated entities attempting to reach the same goal.

Performance Management Practices and Methodologies for Setting Safety Performance Targets Task B-1 - Literature Review
27
4.0 References
AASHTO (2005). Strategic Highway Safety Plan, http://safety.transportation.org/doc/Safety-StrategicHighwaySafetyPlan.pdf – Accessed August 2011.
AASHTO (2007a). Report on Performance-Based Federal-Aid Highway Program.
AASHTO (2007b). Revised Policy Resolution PR-07-01.
AASHTO (2010). Strategic Plan 2010-2014, http://highways.transportation.org/Documents/SCOH%20Strategic%20Plan%202010-2014.pdf – Accessed July 2011.
Arizona Department of Transportation (2009). Strategic Plan, Fiscal Years 2011-2015.
Australian Transport Council (2001). National Road Safety Strategy 2001-2010.
Australian Transport Council (2011). National Road Safety Strategy 2011-2020, http://www.infrastructure.gov.au/roads/safety/national_road_safety_strategy/files/NRSS_2011_2020_15Aug11.pdf – Accessed October 2013.
Braceras, C. M., Tally, R. F., Proctor, G., Bremmer, D., Hank, L. E., Hayse, J., Kane, A. R., Leiphart, K. L., March, J. W., Pickrell, S. M., Stanley, J. W., van der Velde, J. and Yew, C. P. (2010). Linking Transportation Performance and Accountability, Federal Highway Administration, FHWA-PL-10-011, http://www.international.fhwa.dot.gov/pubs/pl10011/pl10011.pdf – Accessed August 2011.
Broughton, J., (2009). Post 2010 Road Casualty Forecasting, Department of Transport, UK. http://webarchive.nationalarchives.gov.uk + http://wwwcf.fhwa.dot.gov/exit.cfm?link=http://www.dft.gov.uk/pgr/roadsafety/research/rsrr/theme5/rsrr8.pdf – Accessed September 2011.
Broughton, J. et al (2009a). Road Safety Strategy Beyond 2010: A Scoping Study. http://webarchive.nationalarchives.gov.uk + http://www.dft.gov.uk/pgr/roadsafety/research/rsrr/theme5/rsrr105.pdf – Accessed September 2011.
Cabinet Office, Government of Japan (2006). Summary of the Eighth Fundamental Traffic Safety Program, http://www8.cao.go.jp/koutu/kihon/keikaku8/english/summary.html – Accessed July 2011.
Cambridge Systematics, Inc. (2009). Performance-Based Management: State of the Practice White Paper. http://www.ampo.org/assets/1017_whitepaperfor2009ceoleade.pdf – Accessed September 2011.
Cambridge Systematics, Inc., Boston Strategies International, Inc., Gordon Proctor & Associates, and Markow, M. J. (2010). NCHRP Report 666 – Target-Setting Methods and Data Management to Support Performance-Based Resource Allocation by Transportation Agencies, Transportation Research Board, http://onlinepubs.trb.org/onlinepubs/nchrp/nchrp_rpt_666.pdf – Accessed July 2011.

Performance Management Practices and Methodologies for Setting Safety Performance Targets Task B-1 - Literature Review
28
Cambridge Systematics, Inc. and High Street Consulting Group (2010). NCHRP Report 660 – Transportation Performance Management: Insight from Practitioners, Transportation Research Board, http://onlinepubs.trb.org/onlinepubs/nchrp/nchrp_rpt_660.pdf – Accessed August 2011.
Cambridge Systematics, Inc., High Street Consulting Group, Bay, P. N., and Volpe National Transportation Center. (2010). Report on National Forum on Performance-Based Transportation Planning and Programming, Transportation Research Board, http://www.camsys.com/pubs/NCHRP20-24(58)_NationalForumSummary%5B1%5D.pdf – Accessed August 2011.
Cambridge Systematics, Inc., PB Consult, Inc., and Texas Transportation Institute (2006a). NCHRP Report 551-Performance Measures and Targets for Transportation Asset Management, Transportation Research Board, http://onlinepubs.trb.org/onlinepubs/nchrp/nchrp_rpt_551.pdf – Accessed August 2011.
Cambridge Systematics, Inc., Texas Transportation Institute, University of Washington, Dowling Associates (2006b). NCHRP Report 97 – Guide to Effective Freeway Performance Measurement: Final Report and Guidebook, Transportation Research Board, http://onlinepubs.trb.org/onlinepubs/nchrp/nchrp_w97.pdf – Accessed July 2011.
Canadian Council of Motor Transport Administrators (2011). Canada’s Road Safety Strategy 2015. http://www.ccmta.ca/crss-2015/_files/road_safety_strategy_2015.pdf. Accessed September 2011.
Canadian Council of Motor Transport Administrators (2006). Road Safety Vision 2010- 2005 Annual Report. http://www.ccmta.ca/crss-2015/_files/road_safety_strategy_2015.pdf. Accessed September 2011.
Commission of the European Communities (2001). European Transport Policy for 2010: Time to Decide, http://ec.europa.eu/transport/strategies/2001_white_paper_en.htm – Accessed July 2011.
Danish Ministry of Transport (2000). Every Accident is One Too Many, http://www.trm.dk/graphics/synkron-library/trafikministeriet/publikationer/pdf_uk/003.pdf – Accessed September 2011.
Department of Transport, United Kingdom (2011). Strategic Framework for Road Safety, https://www.gov.uk/government/uploads/system/uploads/attachment_data/file/8146/strategicframework.pdf – Accessed October 2013.
Elvik, R. (1999). Can injury prevention efforts go too far? Reflections on some possible implications of Vision Zero for road accident fatalities, Accident Analysis and Prevention, Vol. 31, pp. 265-286.
Elvik, R. (2007). Prospects for Improving Road Safety in Norway, Institute of Transport Economics, Norwegian Centre for Transport Research - https://www.toi.no/getfile.php/Publikasjoner/T%C3%98I%20rapporter/2007/897-2007/897-2007-nett.pdf – Accessed September 2011.

Performance Management Practices and Methodologies for Setting Safety Performance Targets Task B-1 - Literature Review
29
European Commission (2011). Commission Staff Working Document – Accompanying the White Paper: Roadmap to a Single European Transport Area – Towards a competitive and resource efficient transport system, http://www.scp-knowledge.eu/sites/default/files/knowledge/attachments/EC%20(2011)%20white_paper_working_document_en.pdf – Accessed June 2011.
European Commission (2009). Quantitative Road Safety Targets, http://www.dacota-project.eu/Links/erso/knowledge/Fixed/70_qrst/quantitative%20road%20safety%20targets.pdf – Accessed July 2011.
European Commission (2010). Towards a European road safety area: policy orientations on road safety 2011-2020, http://ec.europa.eu/transport/road_safety/pdf/com_20072010_en.pdf – Accessed July 2010.
European Commission (2011). White Paper: Roadmap to a Single European Transport Area – Towards a competitive and resource efficient transport system, http://ec.europa.eu/transport/strategies/2011_white_paper_en.htm – Accessed July 2011.
Federal Highway Administration (2009). A Primer on Safety Performance Measures for the Transportation Planning Process. http://tsp.trb.org/assets/BB_FHWA_PerformanceMeasurePrimer_Dec09_FIN.pdf – Accessed September 2011.
Finnish Transport Safety Agency, Finland (2010). Trafi Annual Report, 2010.
Gordon Proctor & Associates, Cambridge Systematics, Inc., American Transportation Research Institute, StarIsis Corporation, and Council of Supply Chain Management Professionals (2011). NCFRP Report 10 – Performance Measures for Freight Transportation, Transportation Research Board, http://onlinepubs.trb.org/onlinepubs/ncfrp/ncfrp_rpt_010.pdf – Accessed July 2011.
Hammond, P. J. (2009). The Gray Notebook, Washington State Department of Transportation, http://www.wsdot.wa.gov/NR/rdonlyres/EFA555E7-4B17-4640-B85A-16FD190F4BD5/0/GrayNotebookDec08.pdf – Accessed July 2007.
Hedlund, James (2008). Traffic Safety Performance Measures for States and Federal Agencies. http://www.nhtsa.gov/DOT/NHTSA/Traffic%20Injury%20Control/Articles/Associated%20Files/811025.pdf. Accessed August 2011.
Herbel, S., Meyer, M. D., Kleiner, B. and Gaines, D. (2009). A Primer on Safety Performance Measures for the Transportation Planning Process, Federal Highway Administration, FHWA-HEP-09-043, http://safety.fhwa.dot.gov/hsip/tsp/fhwahep09043/fhwahep09043.pdf – Accessed July 2011.
Illinois Department of Transportation (2007). Illinois State Transportation Plan, 2007, http://www.illinoistransportationplan.org/pdfs/stp_final_summary_final_1207.pdf – Accessed July 2011.

Performance Management Practices and Methodologies for Setting Safety Performance Targets Task B-1 - Literature Review
30
Joint Transportation Research Centre of the Organisation for Economic Co-operation and Development and International Transport Forum (2008) Towards Zero: Ambitious Road Safety Targets and the Safe System Approach, http://www.internationaltransportforum.org/jtrc/safety/targets/08TargetsSummary.pdf – Accessed August 2011.
Kraay, undated, The Netherlands Traffic & Transport Plan with a Special Focus on Speed Behavior, AW Transport Research Centre, Ministry of Transport, Netherlands. http://www.ictct.org/dlObject.php?document_nr=217&/Kraay.pdf – Accessed October 2011.
Mah, D., White, V., Ng, S., and Bloomer, K. (2007). Caltrans Strategic Plan, 2007-2012, The California Department of Transportation, http://www.dot.ca.gov/docs/StrategicPlan2007-2012.pdf – Accessed August 2011.
McMullen, S. B. and Monsere, C. (2010). Freight Performance Measures: Approach Analysis – Final Report, The Oregon Department of Transportation, http://www.oregon.gov/ODOT/TD/TP_RES/docs/Reports/2010/Freight_Performance_Measures.pdf?ga=t – Accessed July 2011.
Mercer, B. (2009), Reducing Fatalities by Half, AASHTO – ftp://ftp.mdt.mt.gov/research/LIBRARY/SLF4-1-SAFETY_LEADERSHIP_FORUM-REDUCING_FATALITIES-HALF-AASHTO.PDF – Accessed September 2011.
Ministry of Infrastructure, Transport and Networks, Greece (2011). The National Road Safety Strategic Plan for Greece, 2011-2020, http://www.nrso.ntua.gr/geyannis/images/stories/ge/Conferences/geyannis-c57.pdf – Accessed July 2011.
Ministry of Transport, Public Works and Water, Netherlands (2009), Road Safety Strategic Plan, 2008-2020. http://www.fietsberaad.nl/library/repository/bestanden/5a_Philippens_ICSC2012.pdf – Accessed September 2011.
Mid-American Regional Council Transportation Department (2009). Kansas City Regional Transportation Safety Blueprint, http://www.marc.org/transportation/safety/pdf/regionalblueprint2009.pdf – Accessed August 2011.
Missouri Coalition for Roadway Safety (2008). Missouri’s Blueprint to Arrive Alive, http://www.savemolives.com/documents/FINALBlueprintdocument.pdf – Accessed July 2011.
Nebraska Department of Roads (2008). Performance Measures: A Performance-Based Transportation Agency, http://nlcs1.nlc.state.ne.us/epubs/R6000/B274-2008.pdf – Accessed August 2011.
New York City Department of Transportation (2008). Sustainable Streets 2008 and Beyond, http://www.nyc.gov/html/dot/html/about/stratplan.shtml – Accessed July 2011.
New Zealand Ministry of Transport (2010). Safer Journeys – New Zealand’s Road Safety Strategy 2010, http://www.transport.govt.nz/saferjourneys/saferjourneysstrategy/ – Accessed July 2011.

Performance Management Practices and Methodologies for Setting Safety Performance Targets Task B-1 - Literature Review
31
New Mexico Department of Transportation (2007). Good to Great: Performance Management Report.
Norwegian Ministry of Transport and Communications (2009). National Transport Plan 2010-2019. http://www.regjeringen.no/Upload/SD/Vedlegg/NTP/Binder1ntp_engNY.pdf – Accessed September 2011.
Oregon Department of Transportation (2004), Oregon Transportation Safety Action Plan. http://www.oregon.gov/ODOT/TS/docs/Transportation_Safety_Action_Plan.pdf?ga=t – Accessed September 2011.
Oregon Department of Transportation (2006). Oregon Transportation Plan, 2006-2030.
Organisation for Economic Co-operation and Development (2002). Safety On Roads: What is the Vision?, http://www.internationaltransportforum.org/Pub/pdf/02SafetyOnRoads.pdf – Accessed August 2011.
The Pew Center on the States and the Rockefeller Foundation (2011). Measuring Transportation Investments – The Road to Results, http://www.pewstates.org/uploadedFiles/PCS_Assets/2011/Measuring_Transportation_Investments.pdf – Accessed July 2011.
Rhode Island State Planning Council (2010). Transportation 2030.
Road Transport Subcommittee (2006). Vehicle Safety Measures for Building a Society Free of Traffic Accidents, Land Transport Committee of Transport Policy Council, Japan, http://www.mlit.go.jp/english/2006/i_road_transport_bureau/2006report(vehiclesafety)english.pdf – Accessed July 2011.
SafetyNet (2009) Quantitative Road Safety Targets. http://ec.europa.eu/transport/road_safety/specialist/knowledge/pdf/quantitative_road_safety_targets.pdf – Accessed September 2011.
Sauwens, J. (2010). Report on the Consultation of the Subsidiary Monitoring Network on the Communication: Towards a European Road Safety Area: Policy Orientations on Road Safety 2011-2020, European Commission, http://eur-lex.europa.eu/LexUriServ/LexUriServ.do?uri=SEC:2010:0903:FIN:EN:PDF – Accessed July 2010.
Swedish Road Administration (2006). Safe Traffic: Vision Zero on the Move, http://publikationswebbutik.vv.se/upload/1723/88325_safe_traffic_vision_zero_on_the_move.pdf – Accessed July 2010.
Transportation for America (2011). Measuring Performance in the Federal Transportation Program: A Path to Progress and Accountability, http://t4america.org/docs/NTO%20Strategic%20Planning%20Whitepaper%20031611.pdf – Accessed July 2011.

Performance Management Practices and Methodologies for Setting Safety Performance Targets Task B-1 - Literature Review
32
Transport Research Center of the OECD and International Transport Forum (2008). Towards Zero Ambitious Road Safety Targets and the Safe System Approach – Exec Summary, http://www.internationaltransportforum.org/jtrc/safety/targets/08TargetsSummary.pdf – Accessed August 2011.
Vermont Agency of Transportation (2009). Vermont Long-Range Transportation Business Plan.
Washington, S. and Kim, D. (2007). Feasibility of Forecasting Highway Safety in Support of Safety Incentive and Safety Target Programs – Final report 597, The Arizona Department of transportation, http://azmemory.azlibrary.gov/utils/getfile/collection/statepubs/id/6878/filename/7167.pdf – Accessed July 2011.
Wegman, Fred and Aarts, Letty (2006), Advancing Sustainable Safety, SWOV Institute for Road Safety Research.
Whitelegg, J. and Haq, G. (2006). Vision Zero: Adopting a Target of Zero for Road Traffic Fatalities and Serious Injuries, Stockholm Environment Institute, http://sei-international.org/mediamanager/documents/Publications/Future/vision_zero_FinalReportMarch06.pdf – Accessed July 2011.
Wilbur Smith Associates (2007). MIDOT State Long-Range Transportation Plan, 2005-2030: Key Findings, http://www.michigan.gov/documents/mdot/MDOT_SLRP_Key_Findings-3-27-07_191398_7.pdf – Accessed August 2011.
World Health Organization (2011). Global Plan for the Decade of Action for Road Safety 2011-2020, http://www.who.int/roadsafety/decade_of_action/plan/english.pdf –%20Accessed%20July%202011.

U.S. Department of Transportation Federal Highway Administration Office of Safety 1200 New Jersey Avenue, SE Washington, DC 20590 www.safety.fhwa.dot.gov October 24, 2011 FHWA-SA-14-007