performance management review - montgomerycountymd.gov · review (pmr) for fiscal year 2015. this...
TRANSCRIPT
THE MARYLAND-NATIONAL CAPITAL PARK AND PLANNING COMMISSION
PPPeeerrrsssooonnnnnneeelll MMMaaannnaaagggeeemmmeeennnttt RRReeevvviiieeewww EEEmmmpppllloooyyyeeeeee DDDeeemmmooogggrrraaappphhhiiiccc PPPrrrooofffiiillleee
FFFiiissscccaaalll YYYeeeaaarrr 222000111555
PPPrrreeepppaaarrreeeddd bbbyyy ttthhheee DDDeeepppaaarrrtttmmmeeennnttt ooofff HHHuuummmaaannn RRReeesssooouuurrrccceeesss aaannnddd MMMaaannnaaagggeeemmmeeennnttt AAAppprrriiilll 222000111666
M-NCPPC FY2015 Personnel Management Rev Employee Demographic Profile
2 (A173)
The Maryland-National Capital Park and Planning Commission
Personnel Management Review
Fiscal Year 2015
Employee Demographic Profile
The Commission
Casey Anderson, Chair
Elizabeth M. Hewlett, Vice-Chair
MONTGOMERY COUNTY PRINCE GEORGE’S COUNTY PLANNING BOARD PLANNING BOARD Casey Anderson, Chair Elizabeth M. Hewlett, Chair Norman Dreyfuss Dorothy F. Bailey Natali Fani-Gonzalez Manuel R. Geraldo Amy Presley John P. Shoaff Marye Wells-Harley A. Shuanise Washington
Officers
Patricia Colihan Barney, Executive Director Joseph Zimmerman, Secretary-Treasurer
Adrian R. Gardner, General Counsel
Directors
Ronnie Gathers, Prince George’s County Parks and Recreation Fern Piret, Prince George’s County Planning
Mike Riley, Montgomery County Parks Gwen Wright, Montgomery County Planning
www.mncppc.org
M-NCPPC FY2015 Personnel Management Review Employee Demographic Profile
2 (A174)

The Maryland-National Capital Park and Planning Commission
Personnel Management Review
Fiscal Year 2015
Credits
Patricia Colihan Barney Executive Director
William Spencer
Human Resources Director
Boni L. King PMR Project Advisor
Derrick A. Peoples
PMR Project Manager
Terri Berry Anika Harris John Kroll
Ann McCosby Jennifer McDonald
Wanda Wesley Data Contributors
Terri Berry
Technical Staff
Nakiia Buyck Bill Sumler
Production Staff
M-NCPPC FY2015 Personnel Management Review Employee Demographic Profile
3 (A175)

M-NCPPC Personnel Management Review FY2015
TABLE OF CONTENTS Page Transmittal ..................................................................................................... 7 Trends ..................................................................................................... 9 Selected Highlights ................................................................................................... 16 Merit System Employee Profile Composition Population - Full and Part-Time FY11 – FY15 ..................................................... 24 Distribution by Gender ......................................................................................... 25 Distribution by Race/Ethnicity .............................................................................. 26 Distribution by Employment Category .................................................................. 27 Distribution by Employment Category and Gender and Race/Ethnicity .............. 28 Distribution by Race/Ethnicity, Gender and Employment Category .................... 29 Distribution by Race/Ethnicity and Employment Category ................................. 30 Seven Year Comparison FY09 – FY15................................................................ 31 Length of Service ................................................................................................. 32 Average Length of Service by Gender and Race/Ethnicity.................................. 33 Employees Eligible for Normal Retirement, FY16 – FY20 ................................... 34 Represented and Non-Represented Employees ................................................. 35 Employee Distribution by Age and by Department .............................................. 36 Salary Distribution by Salary Range .............................................................................. 37 Average Salary by Employment Category, Gender and Race/Ethnicity .............. 38-39 Average Salary by Gender and Race .................................................................. 40 Average Salaries by Grade .................................................................................. 41-42 Distribution by Grade within Pay Schedule .......................................................... 43 Career Employee Promotions by Department ..................................................... 44 Career Employee Promotions by Employment Category per Department .......... 45 Career Employee Promotions by Gender and Race/Ethnicity ............................. 46 Career Employee Promotions by Race/Ethnicity and Employment Category…..47 Employees at Top of Grade by Department ........................................................ 48 Comparison of Cost of Living Adjustments, FY05 – FY16................................... 49 Benefits Medical Health Plan Participation by Coverage and Provider ............................. 50 Active Career Health Plan Participation by Type, Provider and Coverage .......... 51 Retirement Plan Participation by Plan ................................................................. 52 Tuition Assistance Program Participation ........................................................... 53 Turnover Separations by Department ................................................................................ 54 Separations by Gender ........................................................................................ 55 Separations by Race/Ethnicity ............................................................................. 56 Separations by Employment Category ................................................................ 57 Separations by Reason FY11 – FY15 and Turnover Rates ................................ 58
M-NCPPC FY2015 Personnel Management Review Employee Demographic Profile
4 (A176)
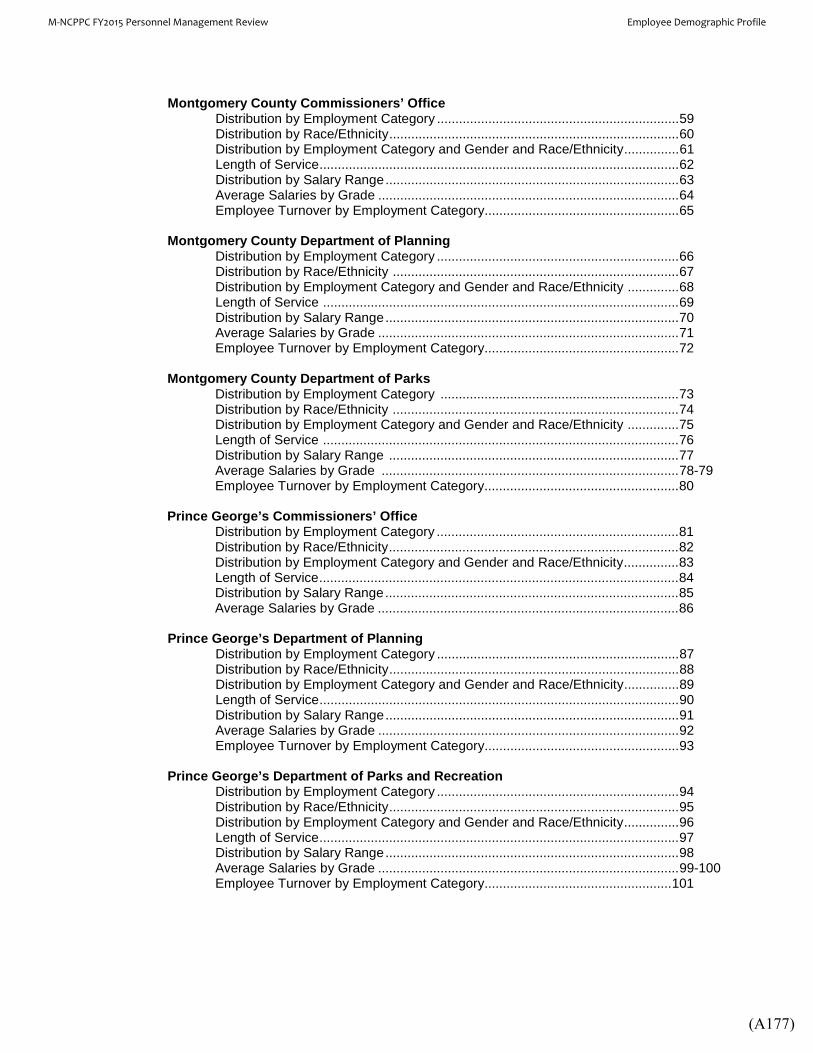
Montgomery County Commissioners’ Office Distribution by Employment Category .................................................................. 59 Distribution by Race/Ethnicity ............................................................................... 60 Distribution by Employment Category and Gender and Race/Ethnicity ............... 61 Length of Service .................................................................................................. 62 Distribution by Salary Range ................................................................................ 63 Average Salaries by Grade .................................................................................. 64 Employee Turnover by Employment Category..................................................... 65 Montgomery County Department of Planning Distribution by Employment Category .................................................................. 66 Distribution by Race/Ethnicity .............................................................................. 67 Distribution by Employment Category and Gender and Race/Ethnicity .............. 68 Length of Service ................................................................................................. 69 Distribution by Salary Range ................................................................................ 70 Average Salaries by Grade .................................................................................. 71 Employee Turnover by Employment Category..................................................... 72 Montgomery County Department of Parks Distribution by Employment Category ................................................................. 73 Distribution by Race/Ethnicity .............................................................................. 74 Distribution by Employment Category and Gender and Race/Ethnicity .............. 75 Length of Service ................................................................................................. 76 Distribution by Salary Range ............................................................................... 77 Average Salaries by Grade ................................................................................. 78-79 Employee Turnover by Employment Category..................................................... 80 Prince George’s Commissioners’ Office Distribution by Employment Category .................................................................. 81 Distribution by Race/Ethnicity ............................................................................... 82 Distribution by Employment Category and Gender and Race/Ethnicity ............... 83 Length of Service .................................................................................................. 84 Distribution by Salary Range ................................................................................ 85 Average Salaries by Grade .................................................................................. 86 Prince George’s Department of Planning Distribution by Employment Category .................................................................. 87 Distribution by Race/Ethnicity ............................................................................... 88 Distribution by Employment Category and Gender and Race/Ethnicity ............... 89 Length of Service .................................................................................................. 90 Distribution by Salary Range ................................................................................ 91 Average Salaries by Grade .................................................................................. 92 Employee Turnover by Employment Category..................................................... 93 Prince George’s Department of Parks and Recreation Distribution by Employment Category .................................................................. 94 Distribution by Race/Ethnicity ............................................................................... 95 Distribution by Employment Category and Gender and Race/Ethnicity ............... 96 Length of Service .................................................................................................. 97 Distribution by Salary Range ................................................................................ 98 Average Salaries by Grade .................................................................................. 99-100 Employee Turnover by Employment Category................................................... 101
M-NCPPC FY2015 Personnel Management Review Employee Demographic Profile
5 (A177)

Central Administrative Services Distribution by Employment Category ................................................................ 102 Distribution by Race/Ethnicity ............................................................................. 103 Distribution by Employment Category and Gender and Race/Ethnicity ............. 104 Length of Service ................................................................................................ 105 Distribution by Salary Range .............................................................................. 106 Average Salaries by Grade ................................................................................ 107 Employee Turnover by Employment Category................................................... 108 Commission-Wide Composition: Non-Career Employee Profile Distribution by Type ............................................................................................ 109 Distribution by Gender ........................................................................................ 110 Distribution by Race/Ethnicity ............................................................................. 111 Distribution by Grade ......................................................................................... 112-113 Medical Health Plan Participation by Type of Plan ........................................... 114 Distribution by Age and Department .................................................................. 115 Appendix Definition of Race/Ethnicity................................................................................. 116 Description of Job Categories ............................................................................ 117-118 General Service Pay Schedule .......................................................................... 119 Special Salary Range Pay Schedule for Select IT Positions ............................ 120 Office/Clerical Pay Schedule .............................................................................. 121 Trades Pay Schedule ......................................................................................... 122 Service/Labor Pay Schedule .............................................................................. 123 FOP Park Police Pay Schedule .......................................................................... 124 Park Police Command Officers and Candidates Pay Schedule......................... 125 Aquatics Seasonal/Intermittent Pay Schedule ................................................... 126 Seasonal/intermittent Pay Schedule .................................................................. 127 Tennis Instructor Pay Schedule ......................................................................... 128 Specialty Services Pay Schedule ....................................................................... 129 Health Plan Premium Rates ............................................................................... 130
M-NCPPC FY2015 Personnel Management Review Employee Demographic Profile
6 (A178)
MN I THE M~RYLAND-NATIONAL CAPITAL PARK AND PLANNING COMMISSION
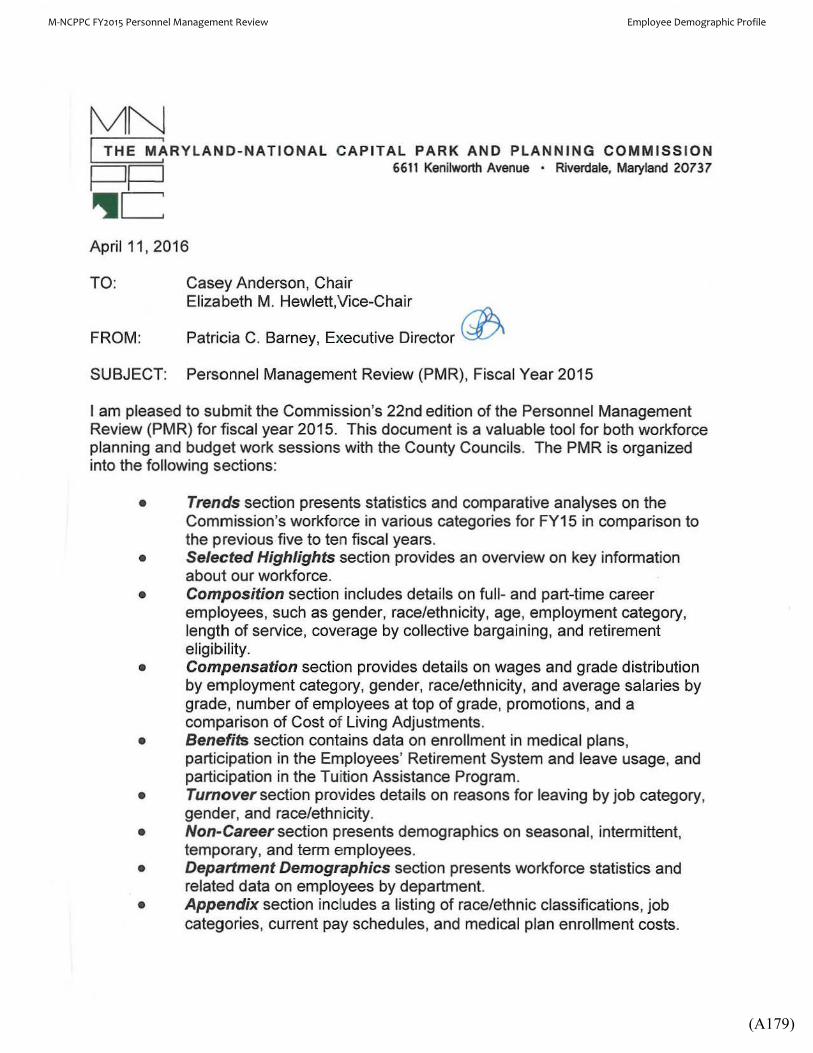
6611 Kenilworth Avenue • Riverdale, Maryland 20737 pp • c April 11 , 2016
TO: Casey Anderson, Chair Elizabeth M. Hewlett,Vice-Chair
FROM: Patricia C. Barney, Executive Director 0 SUBJECT: Personnel Management Review (PMR), Fiscal Year 2015
I am pleased to submit the Commission's 22nd edition of the Personnel Management Review (PMR) for fiscal year 2015. This document is a valuable tool for both workforce planning and budget work sessions with the County Councils. The PMR is organized into the following sections:
• Trends section presents statistics and comparative analyses on the Commission's workforce in various categories for FY15 in comparison to the previous five to ten fiscal years.
• Selected Highlights section provides an overview on key information about our workforce.
• Composition section includes details on full- and part-time career employees, such as gender, race/ethnicity, age, employment category, length of service, coverage by collective bargaining, and retirement eligibility.
• Compensation section provides details on wages and grade distribution by employment category, gender, race/ethnicity, and average salaries by grade, number of employees at top of grade, promotions, and a comparison of Cost of Living Adjustments.
• Benefits section contains data on enrollment in medical plans, participation in the Employees' Retirement System and leave usage, and participation in the Tuition Assistance Program.
• Turnover section provides details on reasons for leaving by job category, gender, and race/ethnicity.
• Non-Career section presents demographics on seasonal, intermittent, temporary, and term employees.
• Department Demographics section presents workforce statistics and related data on employees by department.
• Appendix section includes a listing of race/ethnic classifications, job categories, current pay schedules, and medical plan enrollment costs.
M-NCPPC FY2015 Personnel Management Review Employee Demographic Profile
7 (A179)

The PMR is available for review and online at www.mncppc.org. The Personnel Management Review can be retrieved under the column heading entitled "Quick Links". Internal staff may access the PMR via intranet on inSite. Select "Our Organization," and the Department of Human Resources and Management link. The PMR can be retrieved under the section entitled "Other Documents".
The Commission remains committed to delivering an informative report. We welcome your feedback! Please address comments/questions to [email protected].
M-NCPPC FY2015 Personnel Management Review Employee Demographic Profile
8 (A180)

THE MARYLAND-NATIONAL CAPITAL PARK AND PLANNING COMMISSION
PERSONNEL MANAGEMENT REVIEW
TRENDS
1. Between FY16 and FY20, 33.6% of all career employees (full-time and part-time) will be eligible for normal retirement.
2. In the Officials/Administrators category, between FY16 and FY20, 74.7% of employees are eligible for normal retirement, which is roughly a 1% decrease from FY14 (75.7%). Succession planning is critical to ensure the preservation of institutional knowledge.
3. Over the past five years, there have been small incremental changes in the Commission’s demographics.
4. In comparison to FY14, the percentage of employees in the 50 to 60+ age category remained steady at 46.3%.
2011 2012 2013 2014 2015RaceAsian 4.0% 3.6% 3.6% 3.8% 4.0%Hispanic 5.0% 5.7% 6.2% 6.1% 6.1%Black 36.0% 37.0% 37.7% 37.6% 36.9%White 54.0% 53.0% 52.0% 51.9% 52.4%American Indian 1.0% 0.6% 0.6% 0.5% 0.6%
GenderWomen 39.2% 39.0% 39.0% 39.0% 37.9%Men 60.8% 61.0% 61.0% 61.0% 62.1%
Total Population 2019 1977 1994 2002 2049
Five-Year Demographic Distribution2011 - 2015
M-NCPPC FY2015 Personnel Management Review Employee Demographic Profile
9 (A181)
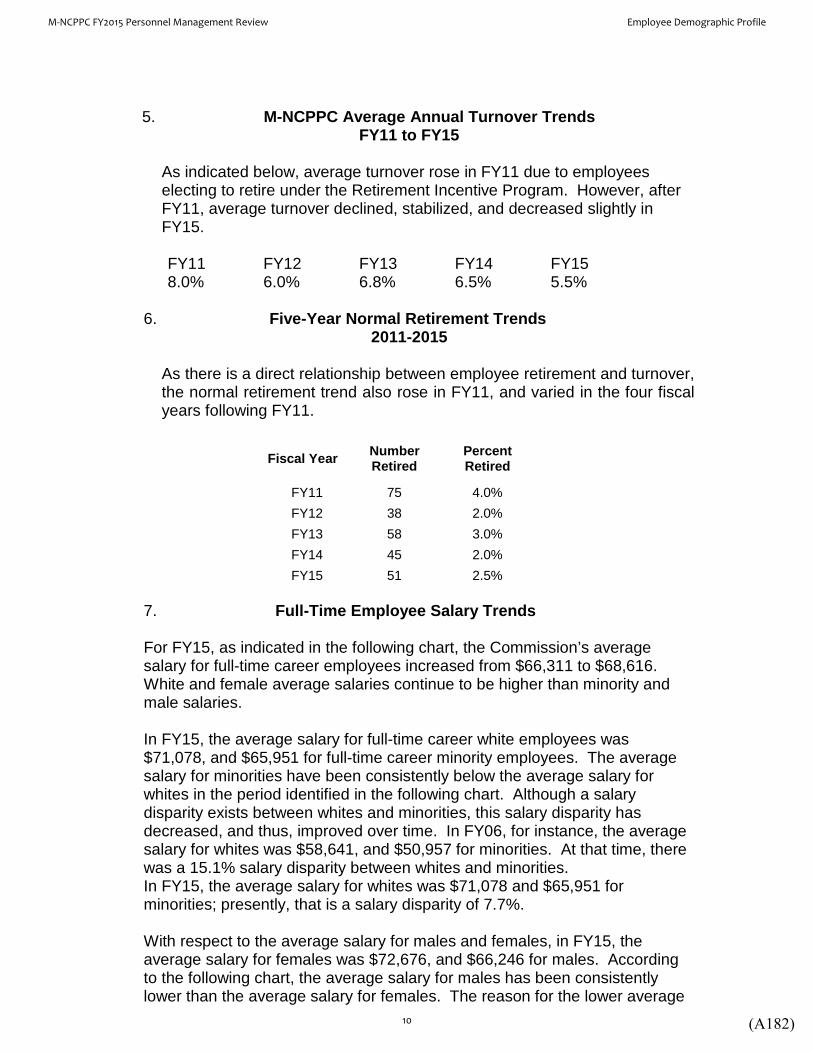
5. M-NCPPC Average Annual Turnover Trends FY11 to FY15
As indicated below, average turnover rose in FY11 due to employees
electing to retire under the Retirement Incentive Program. However, after FY11, average turnover declined, stabilized, and decreased slightly in FY15. FY11 FY12 FY13 FY14 FY15 8.0% 6.0% 6.8% 6.5% 5.5%
6. Five-Year Normal Retirement Trends 2011-2015
As there is a direct relationship between employee retirement and turnover, the normal retirement trend also rose in FY11, and varied in the four fiscal years following FY11.
Fiscal Year Number Retired
Percent Retired
FY11 75 4.0% FY12 38 2.0% FY13 58 3.0% FY14 45 2.0% FY15 51 2.5%
7. Full-Time Employee Salary Trends For FY15, as indicated in the following chart, the Commission’s average salary for full-time career employees increased from $66,311 to $68,616. White and female average salaries continue to be higher than minority and male salaries. In FY15, the average salary for full-time career white employees was $71,078, and $65,951 for full-time career minority employees. The average salary for minorities have been consistently below the average salary for whites in the period identified in the following chart. Although a salary disparity exists between whites and minorities, this salary disparity has decreased, and thus, improved over time. In FY06, for instance, the average salary for whites was $58,641, and $50,957 for minorities. At that time, there was a 15.1% salary disparity between whites and minorities. In FY15, the average salary for whites was $71,078 and $65,951 for minorities; presently, that is a salary disparity of 7.7%. With respect to the average salary for males and females, in FY15, the average salary for females was $72,676, and $66,246 for males. According to the following chart, the average salary for males has been consistently lower than the average salary for females. The reason for the lower average
M-NCPPC FY2015 Personnel Management Review Employee Demographic Profile
10 (A182)

salary among males is that there are a large number of males (i.e., 355) in the Service/Maintenance employment category and (i.e., 172) in the Skilled Craft employment category, in comparison to a small number of women (i.e., 40) in the Service/Maintenance employment category and no women in the Skilled Craft employment category. Additionally, as average salaries across-the-board rose during the period identified in the following chart, average salaries declined slightly as a result of the furlough plan that was implemented in FY11.
2006 2007 2008 2009 2010 2011 2012 2013 2014 2015Commission-wide $55,378 $58,048 $61,378 $63,565 $64,766 $64,181 $64,100 $63,222 $66,311 $68,616females $56,689 $59,364 $63,581 $65,732 $67,138 $63,348 $67,064 $66,295 $69,704 $72,676males $54,616 $57,272 $60,087 $62,255 $63,262 $62,159 $62,303 $61,385 $64,295 $66,246whites $58,641 $61,623 $65,509 $67,578 $68,260 $65,309 $67,449 $66,352 $69,271 $71,078minorities $50,957 $53,370 $56,428 $58,912 $60,736 $59,568 $62,265 $60,806 $64,217 $65,951
$30,000
$35,000
$40,000
$45,000
$50,000
$55,000
$60,000
$65,000
$70,000
$75,000
Full-time Employee Salary Trends
M-NCPPC FY2015 Personnel Management Review Employee Demographic Profile
11 (A183)

8. In FY14, the Recruitment and Selection Services Unit predicted that days-
to-fill would trend up slightly in FY15. To be proactive and reduce the number of days-to-fill, Recruitment and Selection Services set an aggressive goal of lowering the days-to-fill to 97 days from the previous year’s average of 102 days. The approach included contacting hiring managers regarding the status of their positions and requesting them to defer or close the position if there was not an immediate intention to fill the vacancy. At the beginning of FY15, as illustrated in the chart below, it took an average of 164 days to fill positions; and throughout the remainder of the fiscal year, average days to fill positions varied widely. Many variables contribute to the average number of days it takes to fill positions. One primary reason is that hiring needs and priorities vary by department month-to-month, and can greatly influence the time it takes to fill a vacancy. The average time it took to fill positions in FY15 was 101 days. Excluding the month of July 2014, the average days to fill for the remaining 11 months was 87 days.
0
25
50
75
100
125
150
175
200
164 96 72 96 85 125 87 108 98 73 105 100
Jul-14 Aug-14 Sep-14 Oct-14 Nov-14 Dec-14 Jan-15 Feb-15 Mar-15 Apr-15 May-15 Jun-15
Aver
age
Days
to F
ill P
ositi
ons
Commission Wide Average Days to Fill Positions July 2014 - June 2015
Business Days, Holidays Included Linear (Business Days, Holidays Included)
M-NCPPC FY2015 Personnel Management Review Employee Demographic Profile
12 (A184)

9. In FY15, the Recruitment and Selection Services Unit assisted
departments in filling 260 positions. Of these, 176 positions were filled by external candidates and 84 positions were filled by internal candidates.
10. Top of Grade
FY10 FY11 FY12 FY13 FY14 FY15
311 286 248 226 296 411 14.8% 14.2% 13.0% 11.3% 14.7% 20.0%
In the fiscal years leading up to FY15, as indicated above, the number of
employees at top of grade declined, and after FY13, increased. Between FY11 and FY13, merit increases were suspended; and accordingly, due to turnover, the number at top of grade declined. In FY15, the number of career employees at top of grade increased by 115 employees from FY14. This increase in the number of employees at top of grade was influenced by low turnover and the re-establishment of merit increases.
9 8 8 9 8 4 6 6 7 7 5 7
15 13
31
14 15
5
11 17 17 16
15 7
24 21
39
23 23
9
17
23 24 23 20
14
0
5
10
15
20
25
30
35
40
Jul-14 Aug-14 Sep-14 Oct-14 Nov-14 Dec-14 Jan-15 Feb-15 Mar-15 Apr-15 May-15 Jun-15
Num
ber o
f Pos
ition
s
Commission-wide Positions Filled July 2014 - June 2015
Internal External
M-NCPPC FY2015 Personnel Management Review Employee Demographic Profile
13 (A185)
11. Thirty-eight percent (38.2%) of the Commission’s workforce were union members. According to the Bureau of Labor Statistics (BLS), union membership for the public sector workforce in the Baltimore-Washington Region was 35%. According to BLS, 41% of local government workers are unionized. The higher numbers for union membership attributed to local government workers is the result of heavily unionized occupations such as teachers, police officers and firefighters. Source: U.S. Department of Labor Bureau of Labor Statistics, Economic News Release, Union Members, 2014.
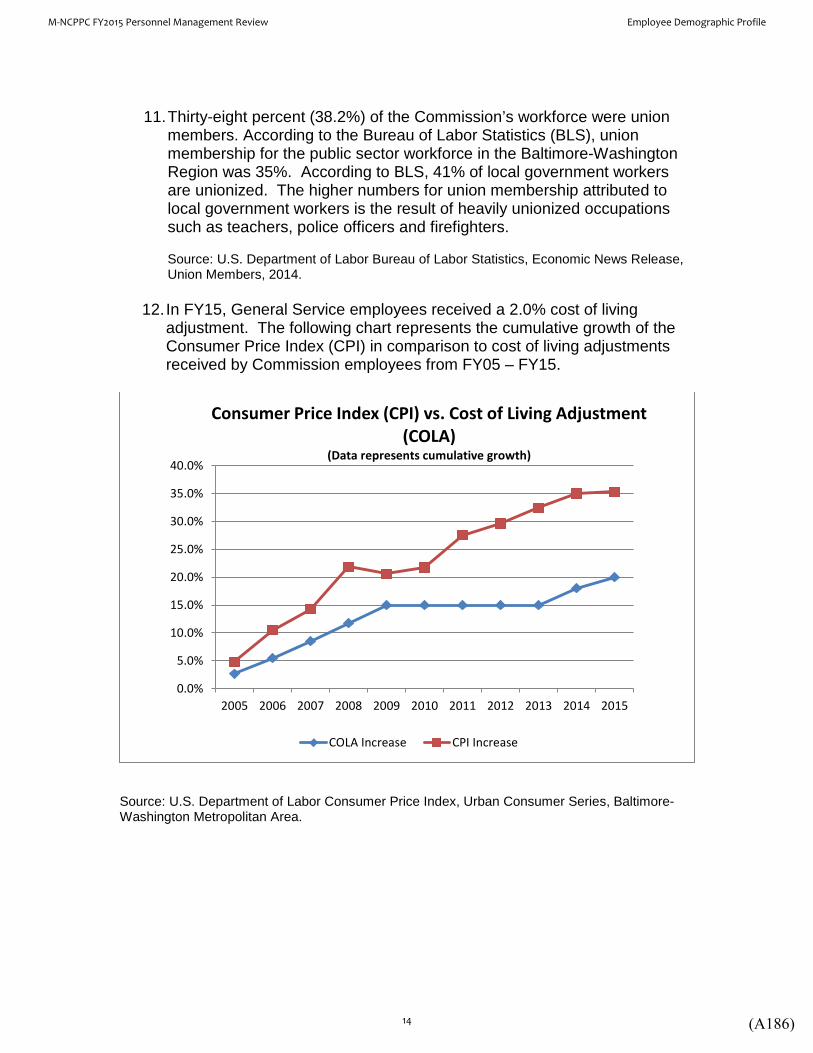
12. In FY15, General Service employees received a 2.0% cost of living adjustment. The following chart represents the cumulative growth of the Consumer Price Index (CPI) in comparison to cost of living adjustments received by Commission employees from FY05 – FY15.
Source: U.S. Department of Labor Consumer Price Index, Urban Consumer Series, Baltimore-Washington Metropolitan Area.
0.0%
5.0%
10.0%
15.0%
20.0%
25.0%
30.0%
35.0%
40.0%
2005 2006 2007 2008 2009 2010 2011 2012 2013 2014 2015
Consumer Price Index (CPI) vs. Cost of Living Adjustment (COLA)
(Data represents cumulative growth)
COLA Increase CPI Increase
M-NCPPC FY2015 Personnel Management Review Employee Demographic Profile
14 (A186)
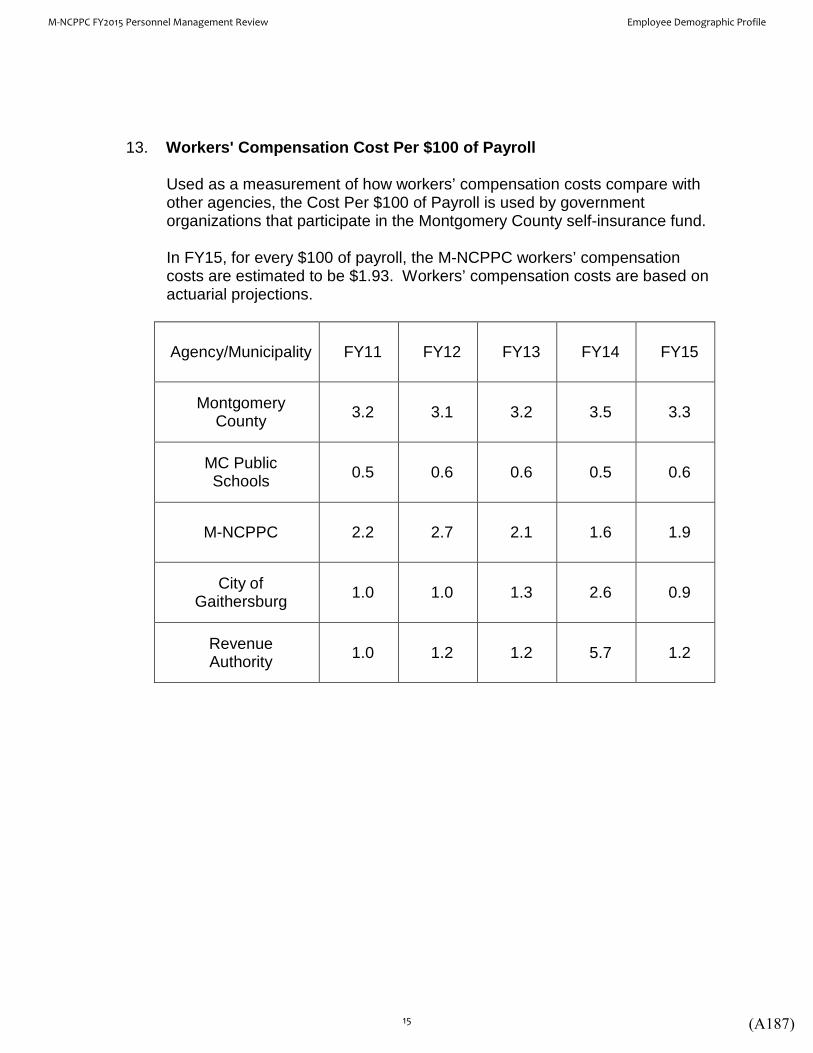
13. Workers' Compensation Cost Per $100 of Payroll
Used as a measurement of how workers’ compensation costs compare with other agencies, the Cost Per $100 of Payroll is used by government organizations that participate in the Montgomery County self-insurance fund. In FY15, for every $100 of payroll, the M-NCPPC workers’ compensation costs are estimated to be $1.93. Workers’ compensation costs are based on actuarial projections.
Agency/Municipality FY11 FY12 FY13 FY14 FY15
Montgomery County 3.2 3.1 3.2 3.5 3.3
MC Public Schools 0.5 0.6 0.6 0.5 0.6
M-NCPPC 2.2 2.7 2.1 1.6 1.9
City of Gaithersburg 1.0 1.0 1.3 2.6 0.9
Revenue Authority 1.0 1.2 1.2 5.7 1.2
M-NCPPC FY2015 Personnel Management Review Employee Demographic Profile
15 (A187)
THE MARYLAND-NATIONAL CAPITAL PARK AND PLANNING COMMISSION
PERSONNEL MANAGEMENT REVIEW
SELECTED HIGHLIGHTS: Workforce Profile
July 1, 2014 - June 30, 2015 (Fiscal Year 2015)
Composition - Career
• The total career workforce at June 30, 2015 was 2,049. This includes
2,005 full-time career and 44 part-time career employees.
• Between FY14 and FY15, the Commission’s career workforce increased by 2.3% or 47 employees.
• The career employee population by gender was 1,272 or 62.1% male
and 777 or 37.9% female.
• The average age of the Commission’s career workforce was 48 years of age.
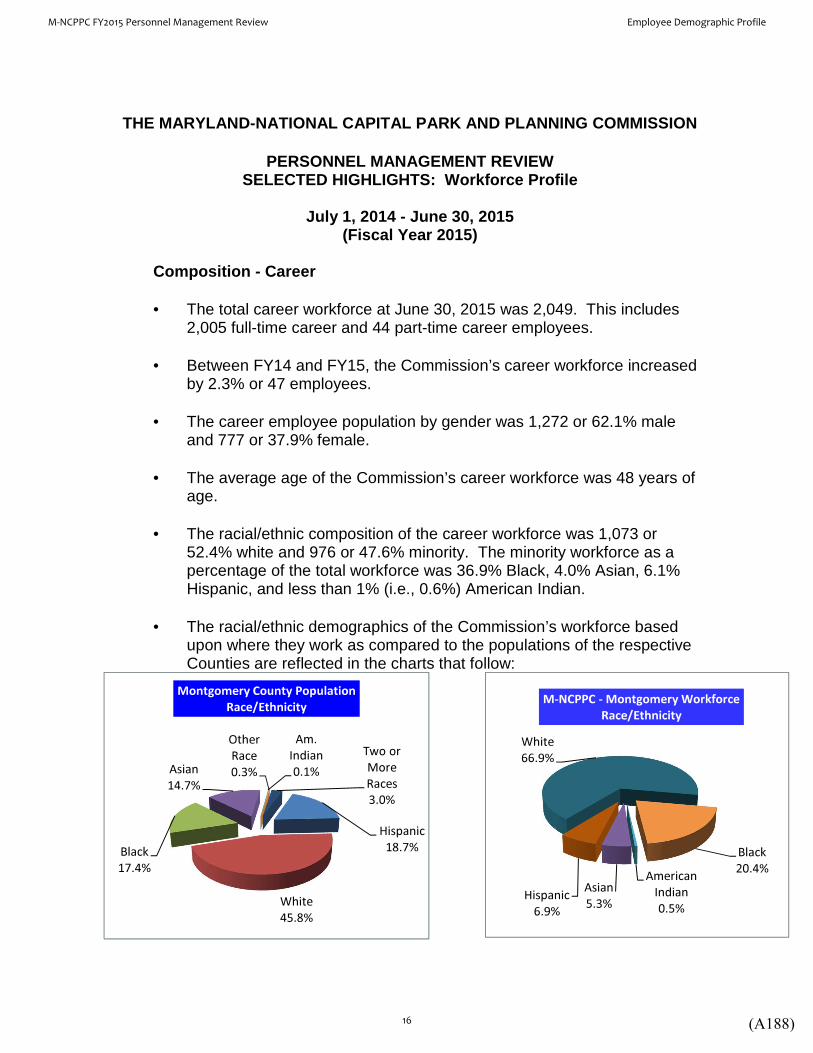
• The racial/ethnic composition of the career workforce was 1,073 or
52.4% white and 976 or 47.6% minority. The minority workforce as a percentage of the total workforce was 36.9% Black, 4.0% Asian, 6.1% Hispanic, and less than 1% (i.e., 0.6%) American Indian.
• The racial/ethnic demographics of the Commission’s workforce based
upon where they work as compared to the populations of the respective Counties are reflected in the charts that follow:
Hispanic
18.7%
White
45.8%
Black
17.4%
Asian
14.7%
Am.
Indian
0.1%
Other
Race
0.3%
Two or
More
Races
3.0%
Montgomery County Population
Race/Ethnicity
Black
20.4%American
Indian
0.5%
Asian
5.3%Hispanic
6.9%
White
66.9%
M-NCPPC - Montgomery Workforce
Race/Ethnicity
M-NCPPC FY2015 Personnel Management Review Employee Demographic Profile
16 (A188)

Source for County Demographics: U.S. Census 2014 American Community Survey 1 year data series; Research and Technology Center, Montgomery County Planning Department, March 2014. M-NCPPC workforce includes Central Administrative Services located in Prince George’s County. These charts are not meant to be a one-for-one comparison since the county statistics include all ages and persons otherwise not in the labor market such as retirees and students.
• In FY15, the largest number and percent of employees at the Commission fell into the Professional category with 883 employees or 43.1% of the workforce, followed by the Service Maintenance category with 396 employees or 19.3% of the workforce. The greatest number of minority employees were in the Professional employment category. Of the 976 minority employees, 42.0% or 410 were in the Professional category and 24.3% or 237 were in the Service/Maintenance category.
• The number of employees by job category were as follows:
*In comparing the number of employees in the Para-Professional and Office/Clerical employment categories from FY14 to FY15, large irregularities were identified in the total counts for these categories only. This is the result of the Human Resources Information System conversion from ePersonality to Lawson. Additional research and analysis will be conducted in FY16 to calibrate counts in these categories.
Hispanic
16.9%
White
14.1%
Black
62.0%
Asian
4.4%
American
Indian
0.2%
Two or
More Races
2.2%
Prince George's County Population Race
Ethnicity
Black
46.6%
American
Indian
0.8%
Asian
2.6%
Hispanic/
Latin
5.6%
White
44.4%
M-NCPPC - Prince George's Workforce
Race/Ethnicity
Job Category FY14 FY15
%
Change
from
FY14
Officials/Administrators 70 71 1.4%Professionals 894 883 -1.2%Technicians 108 139 28.7%Protective Service 148 145 -2.0%*Para-Professional 79 39 -50.6%*Office/Clerical 120 204 70.0%Skilled Craft 174 172 -1.1%Service/Maintenance 409 396 -3.1%Total Employees 2002 2049
M-NCPPC FY2015 Personnel Management Review Employee Demographic Profile
17 (A189)

• The majority of female employees were in the Professional and Office/ Clerical employment categories. Of the 777 female employees, 440 or 56.6% were in the Professional category and 173 or 22.3% were in the Office/Clerical category.
• The majority of male employees were in the Professional and Service/Maintenance employment categories. Of the 1,272 male employees, 443 or 34.8% were in the Professional category and 356 or 27.9% were in the Service/Maintenance category.
• By job category, the number and percentage of positions held by whites
compared to minorities is as follows:
Job Category
Total Commission
Workforce by Job Category
Total Whites % Total
Minorities %
Officials Administrators 71 44 4.1% 27 2.8%
Professionals 883 473 44.1% 410 42.0%
Technicians 139 85 7.9% 54 5.5%
Protective Service 145 79 7.4% 66 6.8%
Para-Professionals 39 23 2.1% 16 1.6%
Office/Clerical 204 84 7.8% 120 12.3%
Skilled Craft 172 126 11.7% 46 4.7%
Service Maintenance 396 159 14.8% 237 24.3% Total 2049 1073 100.0% 976 100.0%
The definition of the Protective Services is found in the guidelines from the Equal Employment Opportunity Commission (EEOC). Under these guidelines, Officers in the ranks of Park Police Officer Candidate, Park Police Officer II through Park Police Officer IV are defined as Protective Services. EEOC defines the rank of Sergeant as Technician, Lieutenant and Captain are defined as Professional and the Commander is an Official/Administrator. Tenure
● Commission-wide, the average length of service was 12.8 years; for females, the average was 12.9 years; and for males, the average was 12.7 years.
• 48.7% of the workforce have been employed with the Commission less
M-NCPPC FY2015 Personnel Management Review Employee Demographic Profile
18 (A190)

than 9 years, 16.8% between 10 and 14 years, 10.6% between 15 and 19 years, 8.6% between 20 and 24 years, 9.7% between 25 and 29 years, and 5.7% have been with the Commission for 30 or more years.
• The average length of service was 13.5 years for Whites, 11.6 years for
Asian, 12.2 years for Blacks, 13.5 years for American Indians, and 10.5 years for Hispanic employees.
Collective Bargaining
• In FY15, 38.2% of the Commission workforce belonged to a union. Of
the 38.2%, 30.1% were members of The United Food & Commercial Workers, Local 1994/ Municipal and County Government Employees Organization (MCGEO) and 8.1% were members of the Fraternal Order of Police, Lodge #30 (FOP).
• MCGEO is the exclusive representative for the Service/Labor, Trades
and Office/Clerical bargaining units. Composition of the units are as follows:
The Service/Labor Unit was composed of 348 employees or 17.0% of the career workforce.
The Trades Unit was composed of 135 employees or 6.6% of the career workforce.
The Office/Clerical Unit was composed of 133 employees or 6.5% of the career workforce.
Compensation ● The Commission compensates and rewards its employees utilizing
either a pay range or step system. o There are six separate pay range schedules for career employees, 3
for non-represented employees (General, IT, Command Staff) and 3 for represented employees (Service/Labor, Office/Clerical, Trades). Each range consists of a minimum, midpoint and maximum salary with represented employees also having a longevity increment.
o The step system is utilized by employees in the FOP Bargaining Unit with two additional increments for longevity.
● The average salary for all career employees (full-time and part-time) was
$68,452. The actual distribution of full-time employees by pay range indicates that approximately 41.1% earned between $30,000 and $59,000; and 58.9% earned $60,000 or more.
M-NCPPC FY2015 Personnel Management Review Employee Demographic Profile
19 (A191)
● Average salary for female employees was $72,676. The average salary for male employees was $66,246. The average salary for white employees was $71,078 and the average salary for minority employees was $65,951.
● Average salaries for represented employees were as follows:
FOP: $73,244 Trades: $56,381 Office/Clerical: $51,232 Service/Labor: $43,412 Budget Allocations ● Group insurance represented 7.1% of the General Fund. ● Employee salaries and benefits represented 72% of the General Fund. Promotions and Cost of Living Adjustments ● In FY15, 143 career employees received promotions. Of the 143
promotions, 105 competed for promotions via the recruitment and selection process; and 38 received promotions through the reclassification process.
• Of the 143 promotions, 52 or 36.4% were females; and 91 or 63.6%
were males. 88 or 61.5% of white employees received promotions and 55 or 38.5% of minority employees received promotions.
● In FY15, non-represented and MCGEO represented career employees
received a 2.0% COLA. Employees eligible to receive a merit increase (or longevity increase for union employees) received a one-time lump sum payment of 0.5% of base pay. Employees not eligible to receive a merit increase (or longevity increase for union employees) because they were at top of grade and received a satisfactory performance rating received a lump sum of one percent (1.0%) of base pay. FOP, Park Police Command Staff and Candidates received a 1.75% COLA.
● From FY05 through FY16, M-NCPPC non-represented employees
received a cumulative COLA of 21.8% as compared to the cumulative COLA of 25.8% for non-represented employees of Montgomery County Government, and 16.5% for non-represented employees of Prince George’s County Government.
● From FY05 through FY16, M-NCPPC Park Police Officers have received
a cumulative COLA of 28%. During the same period, police in Montgomery County received a cumulative COLA of 24.5%, and police in Prince George’s County received a cumulative COLA of 13.5%.
M-NCPPC FY2015 Personnel Management Review Employee Demographic Profile
20 (A192)
• From FY05 through FY16, M-NCPPC MCGEO employees received a cumulative COLA of 21.3%, Montgomery County MCGEO employees received a cumulative COLA of 23.8%, and Prince George’s County AFSCME employees received a cumulative COLA of 21.5%
Health Benefits – Career and Term Contract
● Career Employees selected from three medical plans for health
insurance coverage. These include a Point of Service Plan (POS), UnitedHealth care Choice Plus POS, and two Exclusive Provider Organizations (EPO), UnitedHealthcare Select EPO and CIGNA OAPIN (Open Access Plus In Network) EPO. Term contract employees could enroll in the EPO’s, but were not eligible to enroll in the POS plan.
● The Commission also offered career employees vision, prescription, and
dental plans; life, accidental death and dismemberment (AD&D), long term care, a sick leave bank, and long term disability insurance (LTD); employee assistance program (EAP), deferred compensation, access to legal services, and flexible spending accounts. Term contract employees were only eligible for long term care, deferred compensation, and flexible spending accounts. MCGEO members had a choice of Sick Leave Bank or a Sick Leave Donor Program.
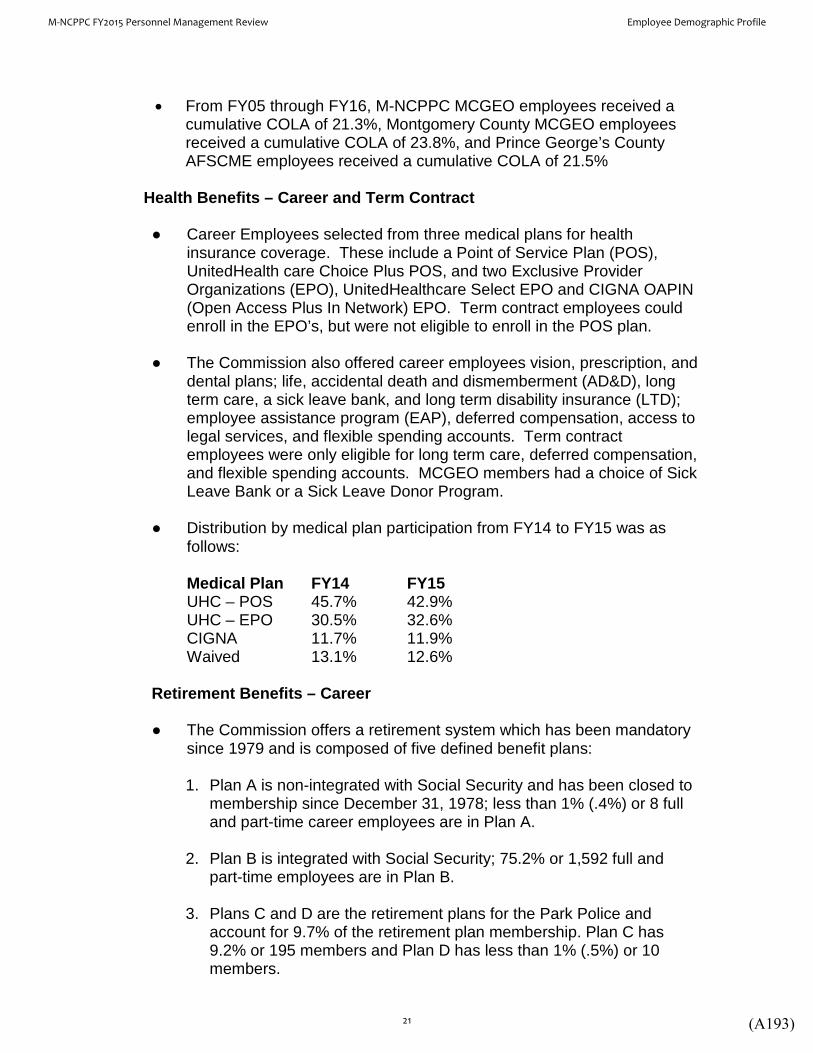
● Distribution by medical plan participation from FY14 to FY15 was as
follows: Medical Plan FY14 FY15 UHC – POS 45.7% 42.9% UHC – EPO 30.5% 32.6% CIGNA 11.7% 11.9% Waived 13.1% 12.6% Retirement Benefits – Career ● The Commission offers a retirement system which has been mandatory
since 1979 and is composed of five defined benefit plans:
1. Plan A is non-integrated with Social Security and has been closed to membership since December 31, 1978; less than 1% (.4%) or 8 full and part-time career employees are in Plan A.
2. Plan B is integrated with Social Security; 75.2% or 1,592 full and part-time employees are in Plan B.
3. Plans C and D are the retirement plans for the Park Police and
account for 9.7% of the retirement plan membership. Plan C has 9.2% or 195 members and Plan D has less than 1% (.5%) or 10 members.
M-NCPPC FY2015 Personnel Management Review Employee Demographic Profile
21 (A193)
4. Plan E is mandatory for all full-time and part-time career Merit System employees (except Park Police), for individuals employed by Employees’ Retirement System, Appointed Officials, and employees exempted from the Merit System who are employed or appointed on or after January 1, 2013. Plan E has 14.8% or 313 members.
5. Normal retirement for employees in both Plan A and Plan B is age 60 with at least five years of credited service or 30 years of credited service regardless of age. Plans A and B are closed to new membership.
6. Normal retirement for employees in Plan C is 25 years of credited
service or age 55 with at least five years of service.
7. Normal retirement for employees in Plan D is 22 years of credited service or age 55 with at least five years of service; Plan D was closed to new membership in 1993.
8. Normal retirement for employees in Plan E is age 62 with at least 10
years of credited service or 30 years of credited service regardless of age.
9. Employees are eligible to convert accumulated sick leave into
credited service at the time of retirement. Employees may use a maximum of 14 months to qualify for early or normal retirement.
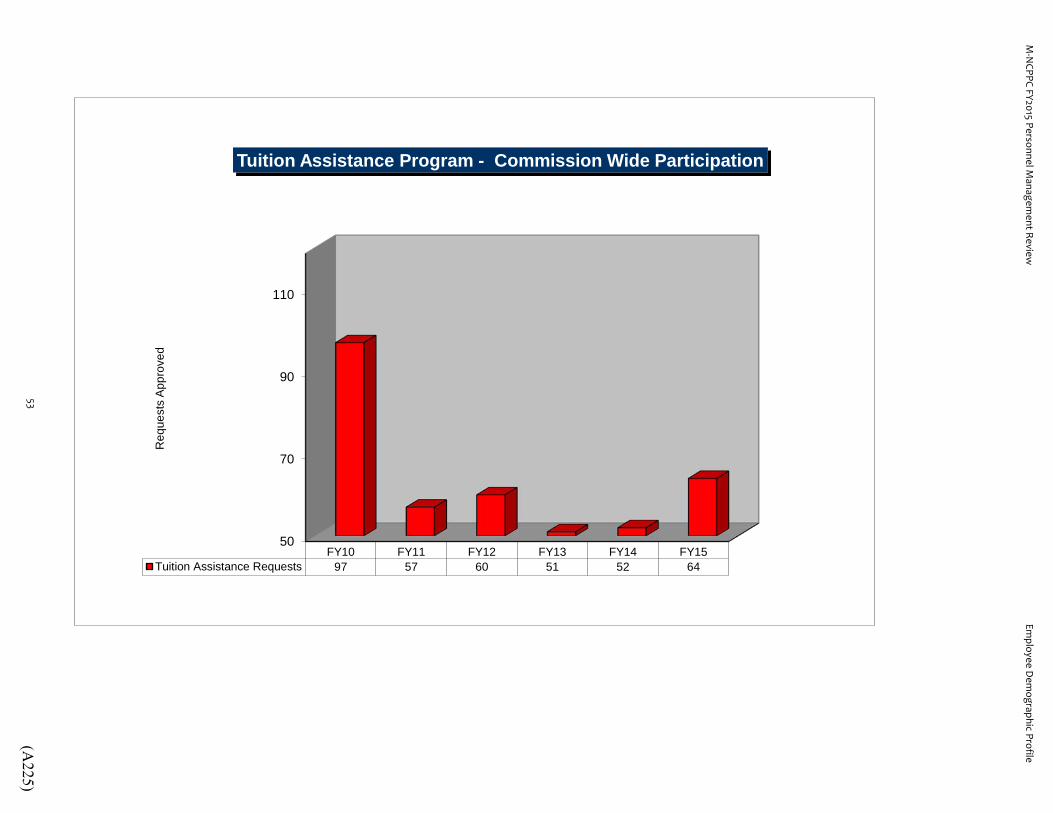
General Benefits ● In FY15, 64 employees utilized the Tuition Assistance Program, a 23%
(12 employees) increase over FY14 when 52 employees utilized the program.
● On December 31, 2015, the total number of hours in the Sick Leave
Bank was 15,004. Employee deductions for contributions were waived. ● Eligible employees used 1,744 hours of the sick leave bank during the
2015 calendar year, in comparison to 2014 calendar year where 2,885 hours of sick leave was used.
Turnover – Career
● Turnover rate in FY15 was 5.5% or 112 employees. The average
turnover rate for the past five fiscal years was 6.5%. ● In FY15, 58% of employees who separated employment were male and
42% were female, in comparison to FY14 where 57% male and 43% female.
M-NCPPC FY2015 Personnel Management Review Employee Demographic Profile
22 (A194)
● In FY15, the composition of exiting employees was 47.3% white and 51.0% minority and 1.8% did not identify their race.
● Of the 112 separated employees, the highest turnover occurred in the
Professional category at 44.6%, followed by Service/Maintenance at 13.4% and Administrative Support at 13.4%.
● In FY15, the three primary reasons for leaving were normal retirement, a
new job, and personal reasons. Composition - Non-Career (Seasonal/Intermittent, Term and Temporary)
● In FY15, the non-career workforce numbered 5,118, in comparison to
5,004 in FY14. Of this number, 99% were seasonal/intermittent. ● Of the non-career employees, 91% worked in Prince George’s County
Department of Parks and Recreation and 8% worked in Montgomery County Department of Parks. In FY14, 91% worked in Prince George’s County Department of Parks and Recreation and 7% worked in Montgomery County Department of Parks.
• The gender composition of non-career employees remained unchanged
between FY15 and FY14 with females representing 54% and males representing 46%.
● In FY15, the racial/ethnic composition of non-career employees was
82% minority and 18% white, in comparison to FY14 when 79% were minority and 20% white.
● 55% of non-career employees were 29 years of age and younger.
M-NCPPC FY2015 Personnel Management Review Employee Demographic Profile
23 (A195)

1,600
1,650
1,700
1,750
1,800
1,850
1,900
1,950
2,000
2,050
2,100
2,150
2,200
FY11 FY12 FY13 FY14 FY15Part-Time 49 48 41 43 44Full-Time 1,970 1,929 1,953 1,959 2,005
Num
ber o
f Em
ploy
ees
Full/Part-Time Career Employees
Total 1,977 Total 1,994
Total 2,019
Total 2,002
Total 2,049
M-N
CPPC FY2015 Personnel Managem
ent ReviewEm
ployee Dem
ographic Profile
24(A
196)
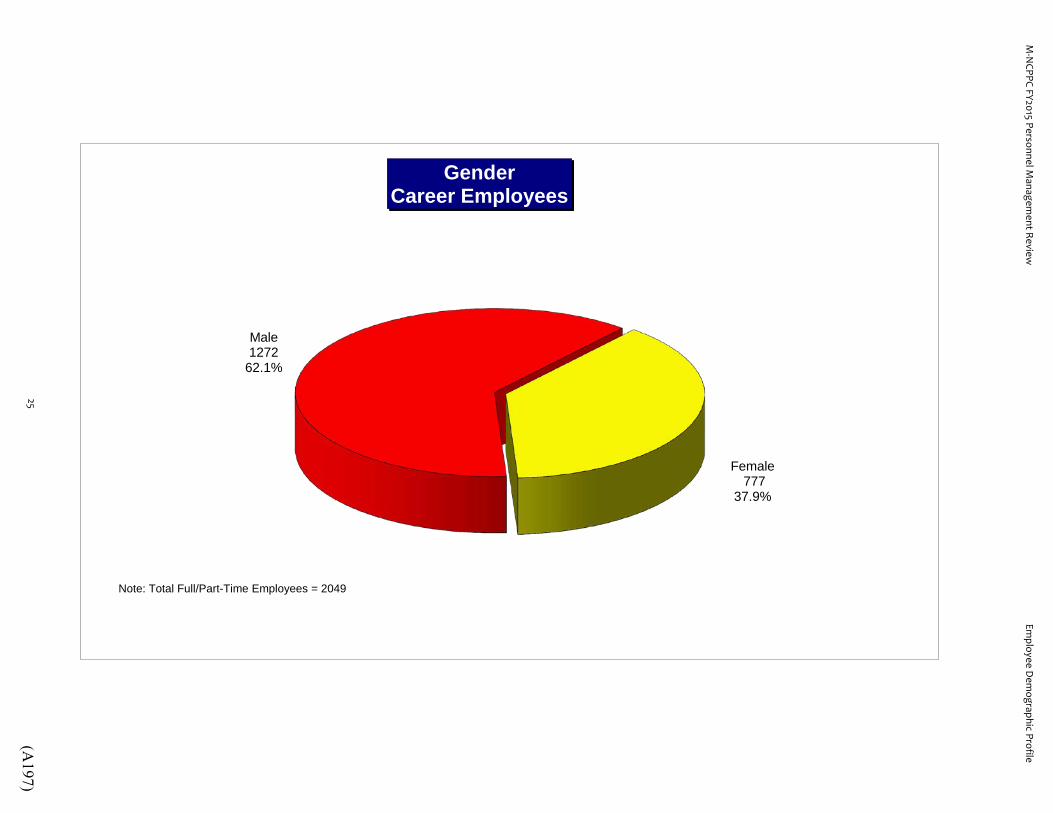
Female 777
37.9%
Male 1272
62.1%
Gender Career Employees
Note: Total Full/Part-Time Employees = 2049
M-N
CPPC FY2015 Personnel Managem
ent ReviewEm
ployee Dem
ographic Profile
25(A
197)

Black 756
36.9%
American Indian 13
0.6%
Asian 81 4%
Hispanic 126
6.1%
White 1073
52.4%
Race/Ethnicity Career Employees
Note: Total Employees = 2,049
`
M-N
CPPC FY2015 Personnel Managem
ent ReviewEm
ployee Dem
ographic Profile
26(A
198)
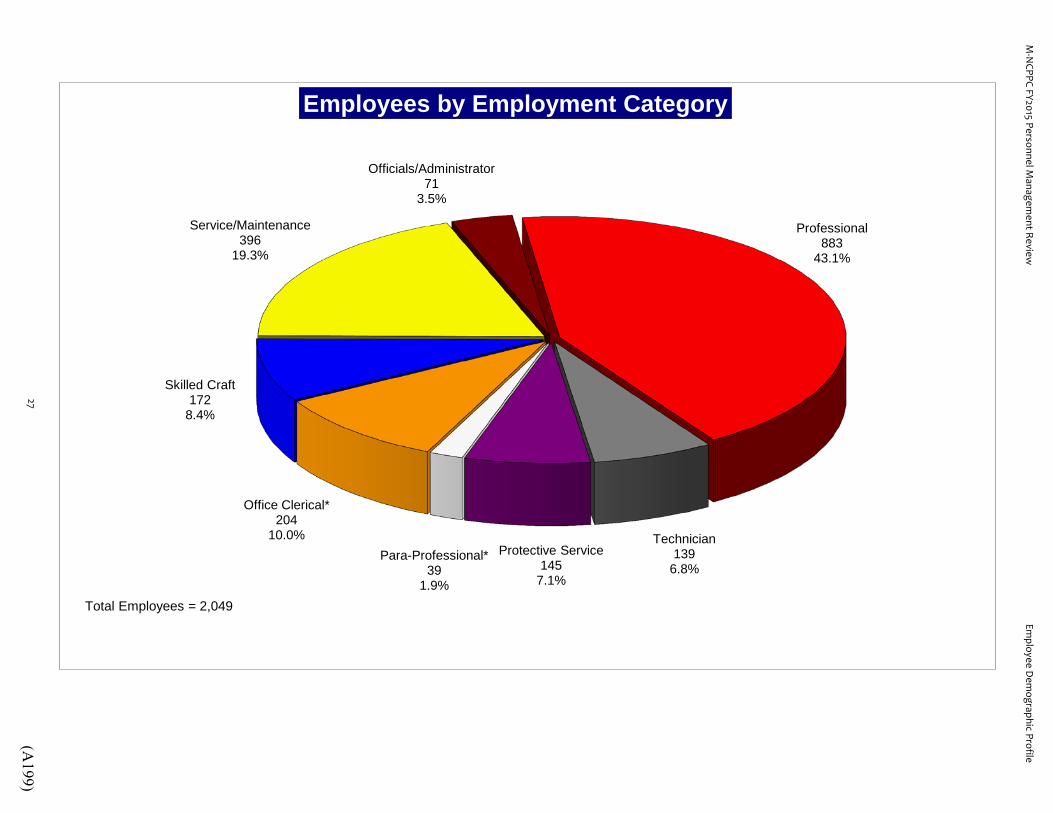
Officials/Administrator 71
3.5%
Professional 883
43.1%
Technician 139
6.8% Protective Service
145 7.1%
Para-Professional* 39
1.9%
Office Clerical* 204
10.0%
Skilled Craft 172
8.4%
Service/Maintenance 396
19.3%
Employees by Employment Category
Total Employees = 2,049
M-N
CPPC FY2015 Personnel Managem
ent ReviewEm
ployee Dem
ographic Profile
27(A
199)
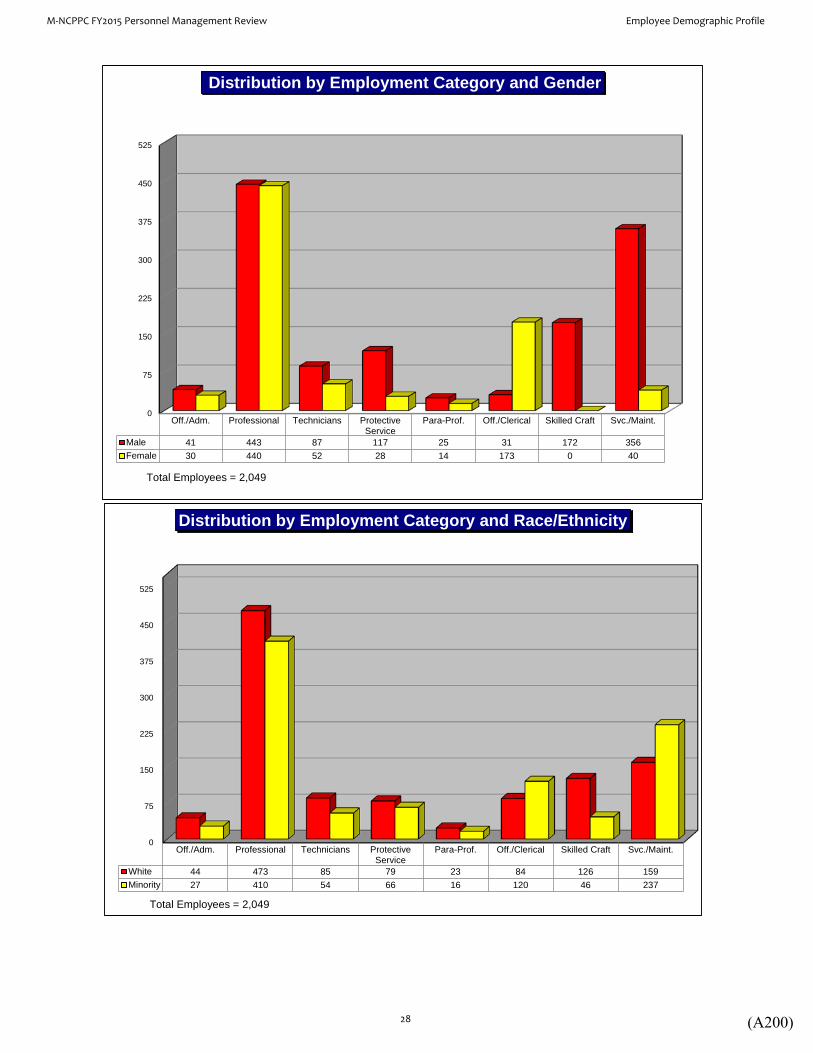
0
75
150
225
300
375
450
525
Off./Adm. Professional Technicians ProtectiveService
Para-Prof. Off./Clerical Skilled Craft Svc./Maint.
Male 41 443 87 117 25 31 172 356Female 30 440 52 28 14 173 0 40
Distribution by Employment Category and Gender
Total Employees = 2,049
0
75
150
225
300
375
450
525
Off./Adm. Professional Technicians ProtectiveService
Para-Prof. Off./Clerical Skilled Craft Svc./Maint.
White 44 473 85 79 23 84 126 159Minority 27 410 54 66 16 120 46 237
Distribution by Employment Category and Race/Ethnicity
Total Employees = 2,049
M-NCPPC FY2015 Personnel Management Review Employee Demographic Profile
28 (A200)

Race/Ethnicity, Gender and Employment Category
White Male Official/Administrator 26 1.3% Hispanic Female Official/Administrator 1 0.0%Professional 239 11.7% Professional 14 0.7%
Technician 50 2.4% Technician 2 0.1%
Protective Service 64 3.1% Protective Service 1 0.0%
Paraprofessional 17 0.8% Paraprofessional 0 0.0%
Office Clerical 17 0.8% Office Clerical 6 0.3%
Skilled Craft 126 6.1% Skilled Craft 0 0.0%
Service/Maintenance 144 7.0% Service/Maintenance 6 0.3%683 33.3% 30 1.5%
White Female Official/Administrator 18 0.9% Asian Male Official/Administrator 1 0.0%Professional 234 11.4% Professional 21 1.0%Technician 35 1.7% Technician 5 0.2%Protective Service 15 0.7% Protective Service 9 0.4%Paraprofessional 6 0.3% Paraprofessional 0 0.0%Office Clerical 67 3.3% Office Clerical 1 0.0%Skilled Craft 0 0.0% Skilled Craft 2 0.1%Service/Maintenance 15 0.7% Service/Maintenance 11 0.5%
390 19.0% 50 2.4%
Black Male Official/Administrator 13 0.6% Asian Female Official/Administrator 2 0.1%Professional 159 7.8% Professional 24 1.2%Technician 24 1.2% Technician 1 0.0%Protective Service 35 1.7% Protective Service 0 0.0%Paraprofessional 6 0.3% Paraprofessional 0 0.0%Office Clerical 10 0.5% Office Clerical 4 0.2%Skilled Craft 38 1.9% Skilled Craft 0 0.0%Service/Maintenance 150 7.3% Service/Maintenance 0 0.0%
435 21.2% 31 1.5%
Black Female Official/Administrator 8 0.4% American Indian Male Official/Administrator 0 0.0%Professional 164 8.0% Professional 3 0.1%Technician 14 0.7% Technician 1 0.0%Protective Service 12 0.6% Protective Service 1 0.0%Paraprofessional 8 0.4% Paraprofessional 0 0.0%Office Clerical 96 4.7% Office Clerical 0 0.0%Skilled Craft 0 0.0% Skilled Craft 1 0.0%Service/Maintenance 19 0.9% Service/Maintenance 2 0.1%
321 15.7% 8 0.4%
Hispanic Male Official/Administrator 1 0.0% American Indian Female Official/Administrator 1 0.0%Professional 21 1.0% Professional 4 0.2%Technician 7 0.3% Technician 0 0.0%Protective Service 8 0.4% Protective Service 0 0.0%Paraprofessional 2 0.1% Paraprofessional 0 0.0%Office Clerical 3 0.1% Office Clerical 0 0.0%Skilled Craft 5 0.2% Skilled Craft 0 0.0%Service/Maintenance 49 2.4% Service/Maintenance 0 0.0%
96 4.7% 5 0.2%
Percentages are based on total number of employees which is 2,049.
M-NCPPC FY2015 Personnel Management Review Employee Demographic Profile
29 (A201)
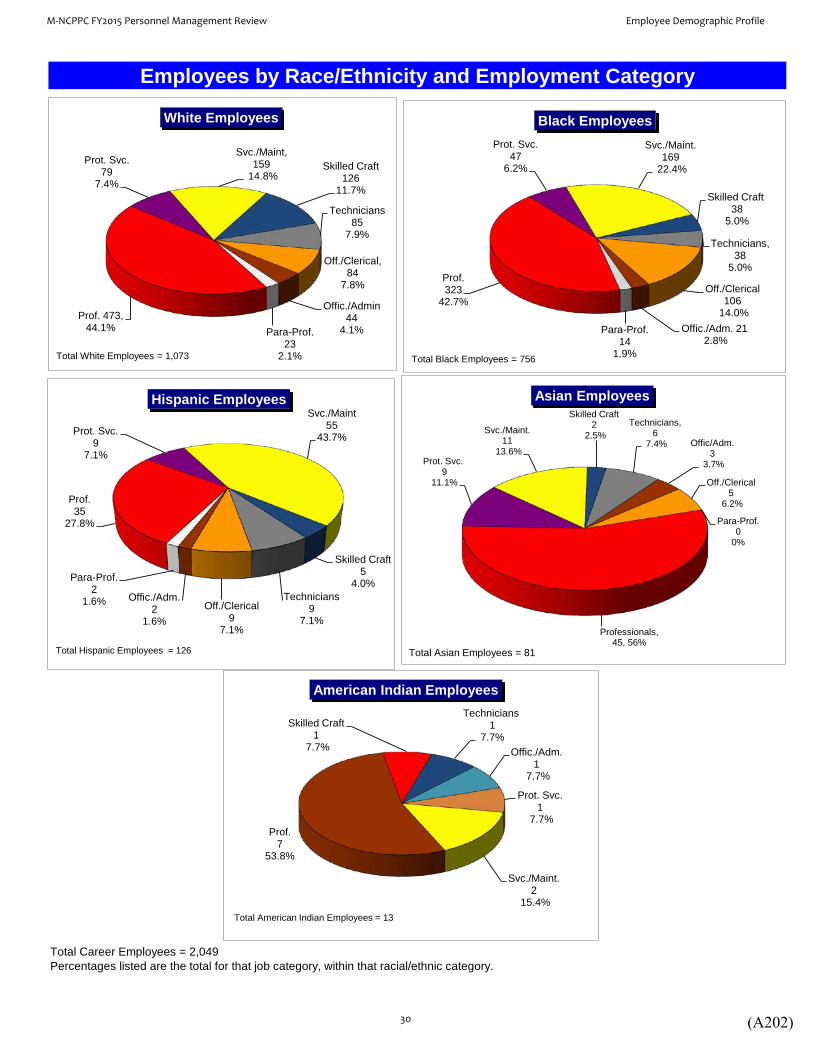
Employees by Race/Ethnicity and Employment Category
Total Career Employees = 2,049Percentages listed are the total for that job category, within that racial/ethnic category.
Off./Clerical, 84
7.8%
Offic./Admin 44
4.1% Para-Prof. 23
2.1%
Prof. 473, 44.1%
Prot. Svc. 79
7.4%
Svc./Maint, 159
14.8% Skilled Craft
126 11.7%
Technicians 85
7.9%
White Employees
Total White Employees = 1,073
Off./Clerical 106
14.0% Offic./Adm. 21
2.8% Para-Prof.
14 1.9%
Prof. 323
42.7%
Prot. Svc. 47
6.2%
Svc./Maint. 169
22.4%
Skilled Craft 38
5.0%
Technicians, 38
5.0%
Black Employees
Total Black Employees = 756
Off./Clerical 9
7.1%
Offic./Adm. 2
1.6%
Para-Prof. 2
1.6%
Prof. 35
27.8%
Prot. Svc. 9
7.1%
Svc./Maint 55
43.7%
Skilled Craft 5
4.0% Technicians
9 7.1%
Hispanic Employees
Total Hispanic Employees = 126
Svc./Maint. 2
15.4%
Prof. 7
53.8%
Skilled Craft 1
7.7%
Technicians 1
7.7% Offic./Adm.
1 7.7%
Prot. Svc. 1
7.7%
American Indian Employees
Total American Indian Employees = 13
Off./Clerical 5
6.2%
Para-Prof. 0
0%
Professionals, 45, 56%
Prot. Svc. 9
11.1%
Svc./Maint. 11
13.6%
Skilled Craft 2
2.5% Technicians,
6 7.4% Offic/Adm.
3 3.7%
Asian Employees
Total Asian Employees = 81
M-NCPPC FY2015 Personnel Management Review Employee Demographic Profile
30 (A202)
0
100
200
300
400
500
600
700
800
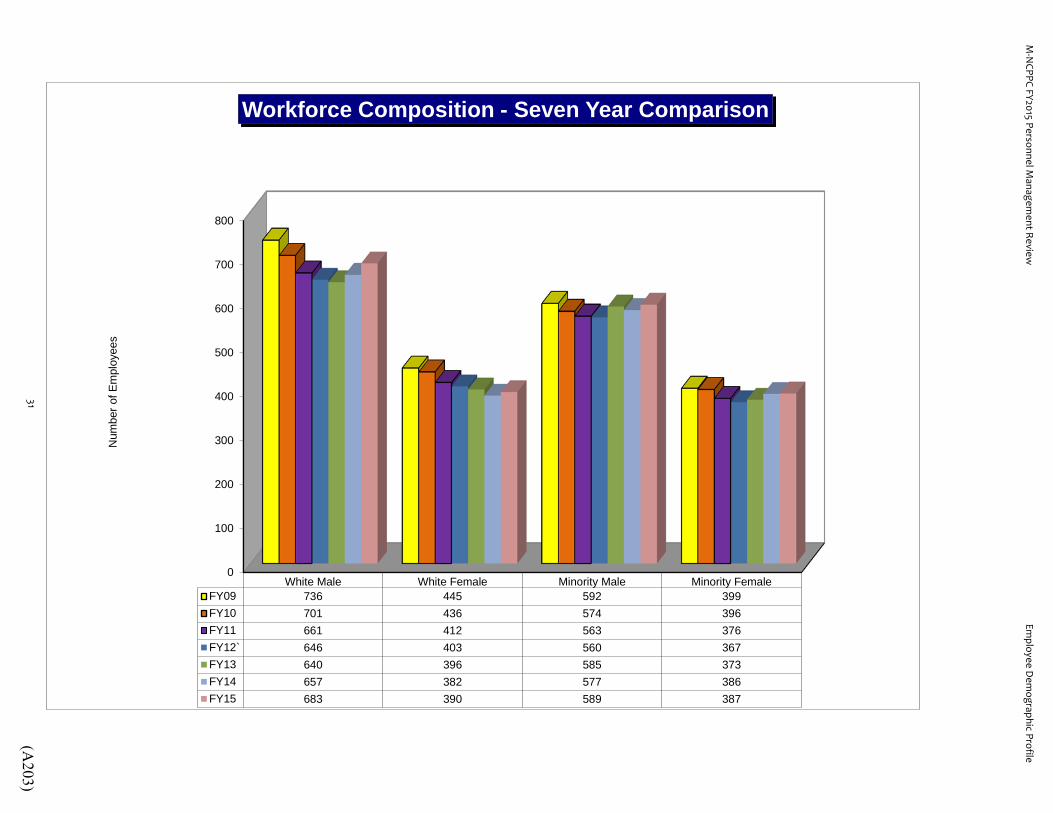
White Male White Female Minority Male Minority FemaleFY09 736 445 592 399FY10 701 436 574 396FY11 661 412 563 376FY12` 646 403 560 367FY13 640 396 585 373FY14 657 382 577 386FY15 683 390 589 387
Num
ber o
f Em
ploy
ees
Workforce Composition - Seven Year Comparison
M-N
CPPC FY2015 Personnel Managem
ent ReviewEm
ployee Dem
ographic Profile
31(A
203)

Less than 5 Years 496
24.2%
5 - 9 Years 501
24.5%
10 - 14 Years 344
16.8%
15 - 19 Years 218
10.6%
20 - 24 Years 176
8.6%
25 - 29 Years 198
9.7% 30 Yrs. and Above
116 5.7%
Length of Service Career Employees
Total Employees: 2,049
M-N
CPPC FY2015 Personnel Managem
ent ReviewEm
ployee Dem
ographic Profile
32(A
204)

1
3
5
7
9
11
13
15
17
19
American Indian Asian Black Hispanic WhiteAvg. Yrs. 13.5 11.6 12.2 10.5 13.5
Average Length of Service by Race/Ethnicity
1
3
5
7
9
11
13
15
17
19
Female MaleAvg. Yrs. 12.9 12.7
Leng
th o
f Ser
vice
Average Length of Service By Gender
M-NCPPC FY2015 Personnel Management Review Employee Demographic Profile
33 (A205)

Employees Eligible for Normal RetirementBetween FY16 and FY20
FY16 FY17 FY18 FY19 FY20 TotalPr. Geo Comm 4 1 1 1 0 7Pr. Geo Pks & Rec 161 33 35 35 27 291Pr. Geo Planning 34 11 5 8 9 67Sub Total 199 45 41 44 36 365
CAS 23 5 7 3 4 42
Mont. Comm 4 0 0 0 0 4Mont. Parks 129 27 30 24 24 234Mont. Planning 25 9 4 5 1 44Sub Total 158 36 34 29 25 282
Total 380 86 82 76 65 689
Between FY16 and FY20, 689 or 33.6% of current employees will reach normal retirement eligibility. This is an average of 138 employees for each of those years.
Based on the current number of employees, by EEO category, this represents:
74.7% of the Official/Administrator category33.9% of the Professional category35.3% of the Technician category15.2% of the Protective Service category18.0% of the Para-Professional category34.3% of the Office Clerical category41.3% of the Skilled Craft (Trades) category29.8% of the Service/Maintenance category
Excludes appointed officials and employees in Long Term Disability status.
0
100
200
300
400
500
600
700
800
900
OfficialAdm
Prof. Tech ProtectService
Para-Prof.
OfficeClerical
SkilledCraft
ServiceMaint
Eligible 53 299 49 22 7 70 71 118Employees 71 883 139 145 39 204 172 396
Employees by Job Category Eligible to Retire Between FY16 and FY20 (Collectively)
M-NCPPC FY2015 Personnel Management Review Employee Demographic Profile
34 (A206)
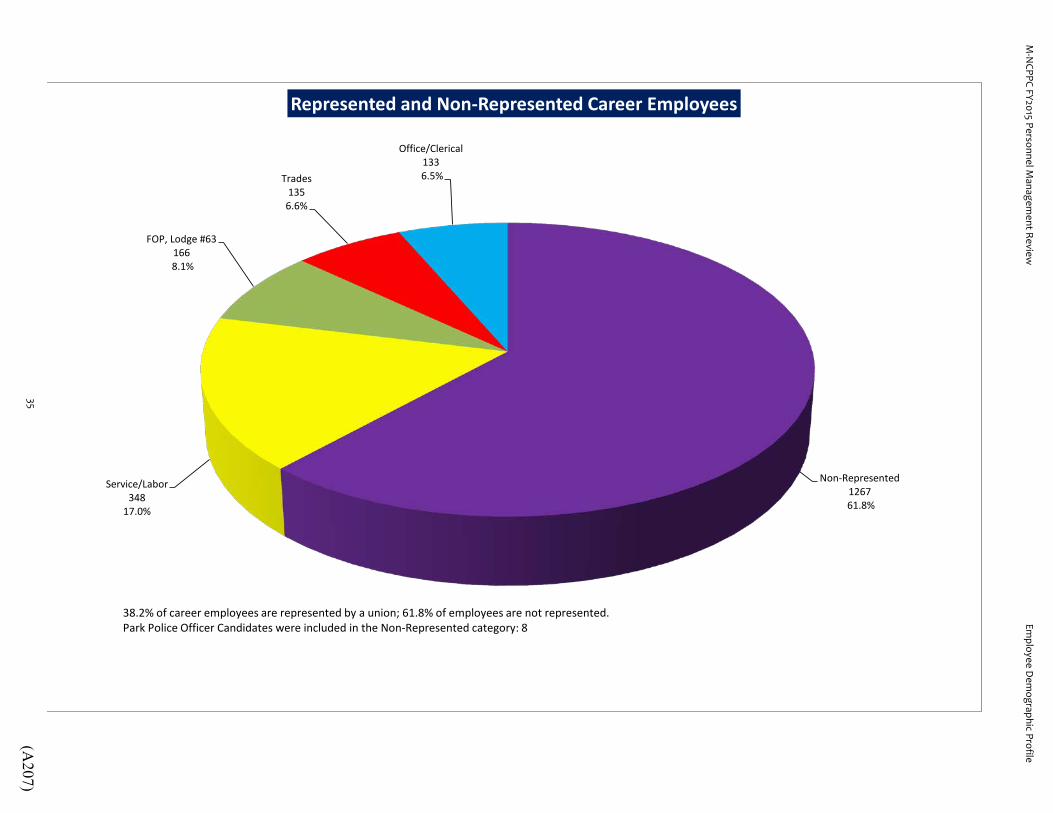
Non-Represented 1267
61.8%
Service/Labor 348
17.0%
FOP, Lodge #63 166
8.1%
Trades 135
6.6%
Office/Clerical 133
6.5%
Represented and Non-Represented Career Employees
38.2% of career employees are represented by a union; 61.8% of employees are not represented. Park Police Officer Candidates were included in the Non-Represented category: 8
M-N
CPPC FY2015 Personnel Managem
ent ReviewEm
ployee Dem
ographic Profile
35(A
207)
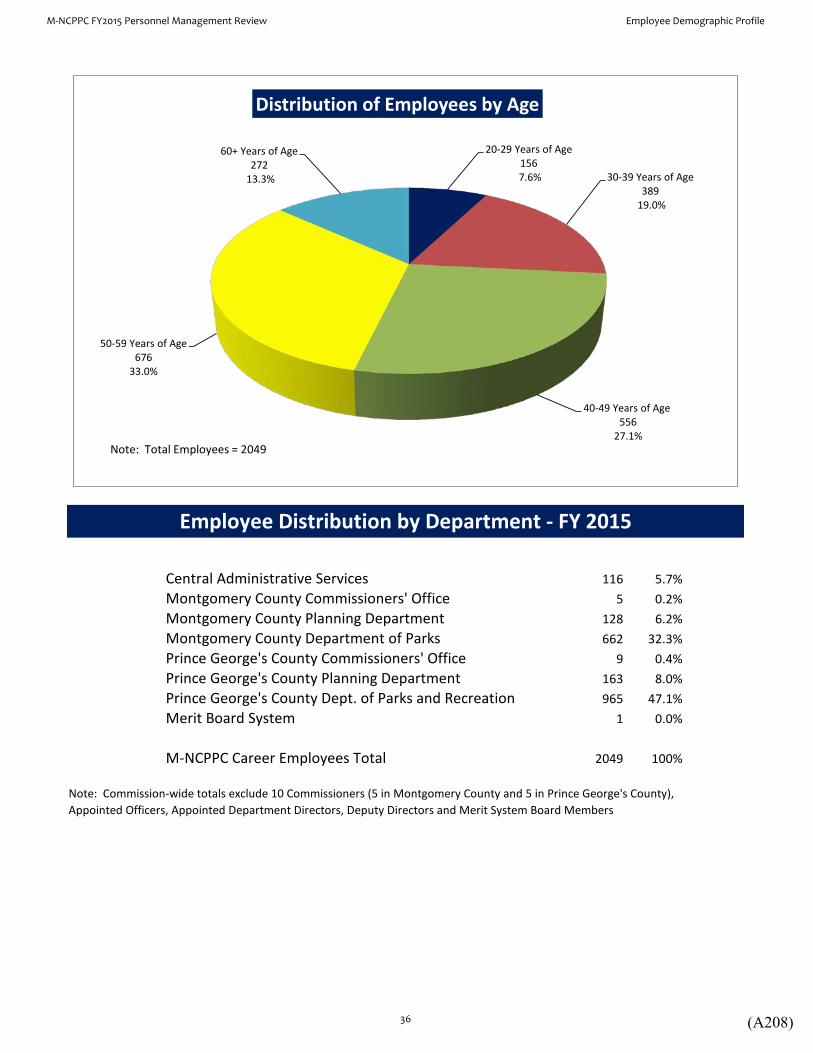
Central Administrative Services 116 5.7%Montgomery County Commissioners' Office 5 0.2%Montgomery County Planning Department 128 6.2%Montgomery County Department of Parks 662 32.3%Prince George's County Commissioners' Office 9 0.4%Prince George's County Planning Department 163 8.0%Prince George's County Dept. of Parks and Recreation 965 47.1%Merit Board System 1 0.0%
M-NCPPC Career Employees Total 2049 100%
Employee Distribution by Department - FY 2015
Note: Commission-wide totals exclude 10 Commissioners (5 in Montgomery County and 5 in Prince George's County), Appointed Officers, Appointed Department Directors, Deputy Directors and Merit System Board Members
20-29 Years of Age 156
7.6% 30-39 Years of Age 389
19.0%
40-49 Years of Age 556
27.1%
50-59 Years of Age 676
33.0%
60+ Years of Age 272
13.3%
Distribution of Employees by Age
Note: Total Employees = 2049
M-NCPPC FY2015 Personnel Management Review Employee Demographic Profile
36 (A208)
0
50
100
150
200
250
300
350
400
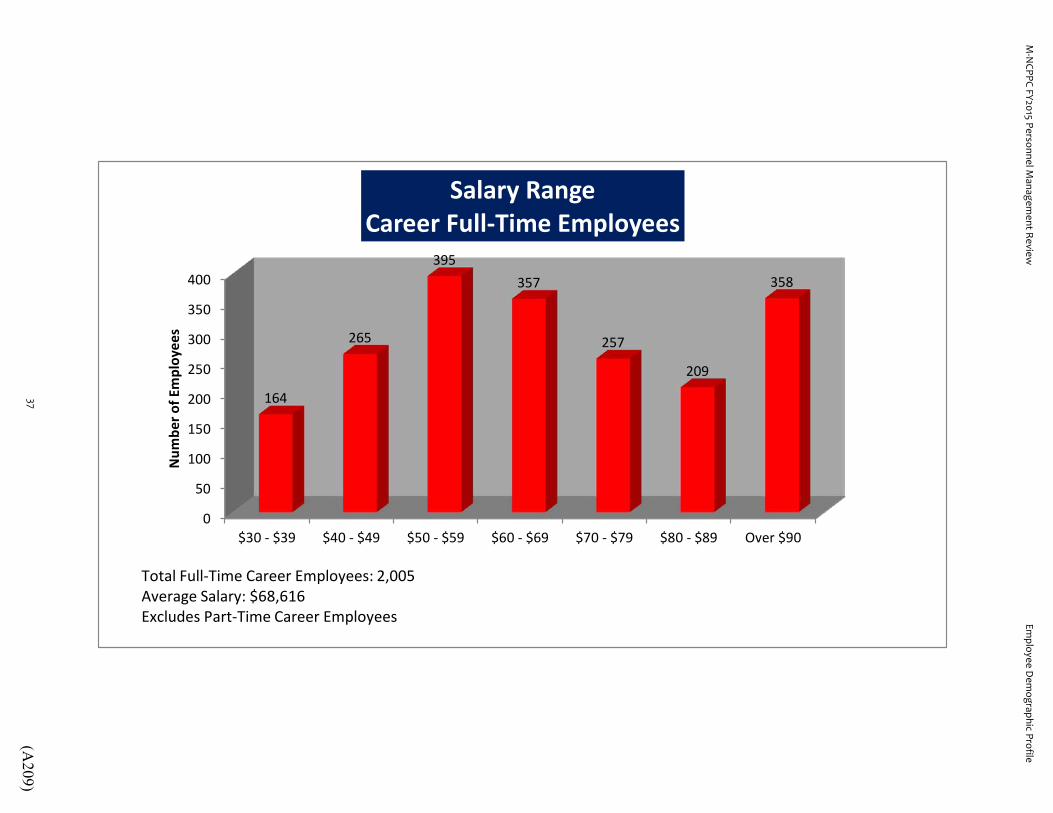
$30 - $39 $40 - $49 $50 - $59 $60 - $69 $70 - $79 $80 - $89 Over $90
164
265
395 357
257
209
358
Num
ber o
f Em
ploy
ees
Salary Range Career Full-Time Employees
Total Full-Time Career Employees: 2,005 Average Salary: $68,616 Excludes Part-Time Career Employees
M-N
CPPC FY2015 Personnel Managem
ent ReviewEm
ployee Dem
ographic Profile
37(A
209)
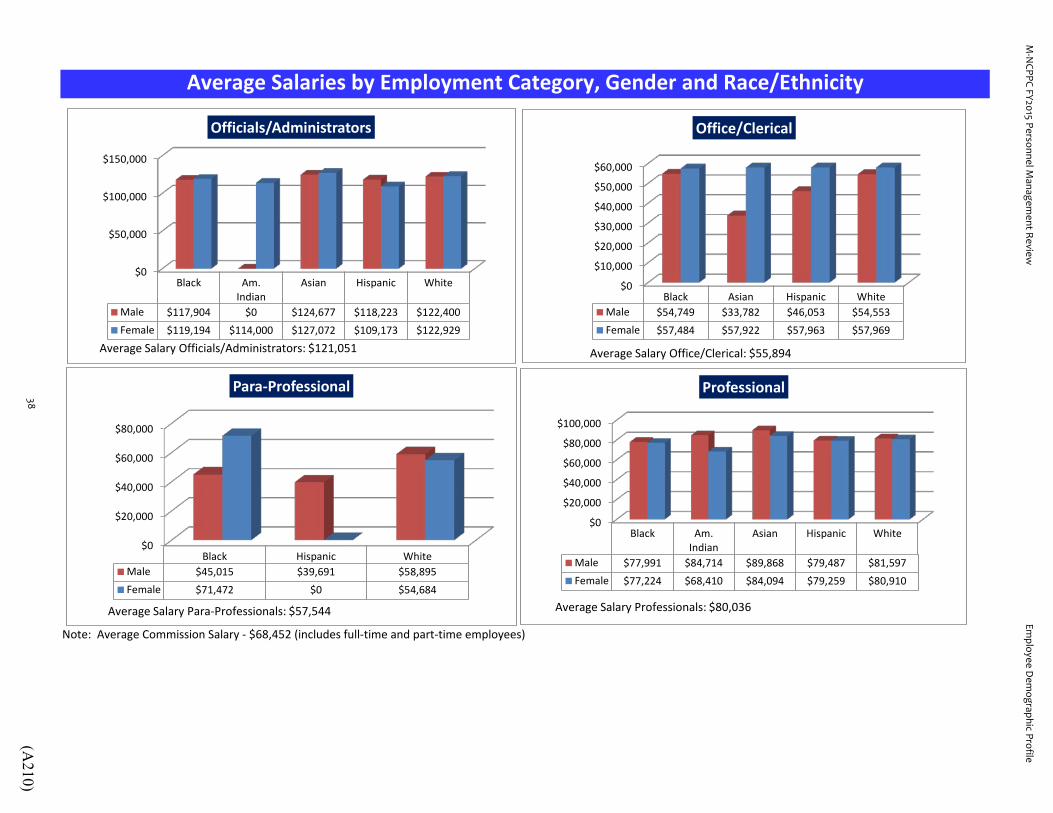
Note: Average Commission Salary - $68,452 (includes full-time and part-time employees)
Average Salaries by Employment Category, Gender and Race/Ethnicity
$0
$50,000
$100,000
$150,000
Black Am.Indian
Asian Hispanic White
Male $117,904 $0 $124,677 $118,223 $122,400Female $119,194 $114,000 $127,072 $109,173 $122,929
Officials/Administrators
Average Salary Officials/Administrators: $121,051
$0
$10,000
$20,000
$30,000
$40,000
$50,000
$60,000
Black Asian Hispanic WhiteMale $54,749 $33,782 $46,053 $54,553Female $57,484 $57,922 $57,963 $57,969
Office/Clerical
Average Salary Office/Clerical: $55,894
$0
$20,000
$40,000
$60,000
$80,000
Black Hispanic WhiteMale $45,015 $39,691 $58,895Female $71,472 $0 $54,684
Para-Professional
Average Salary Para-Professionals: $57,544
$0
$20,000
$40,000
$60,000
$80,000
$100,000
Black Am.Indian
Asian Hispanic White
Male $77,991 $84,714 $89,868 $79,487 $81,597Female $77,224 $68,410 $84,094 $79,259 $80,910
Professional
Average Salary Professionals: $80,036
M-N
CPPC FY2015 Personnel Managem
ent ReviewEm
ployee Dem
ographic Profile
38(A
210)
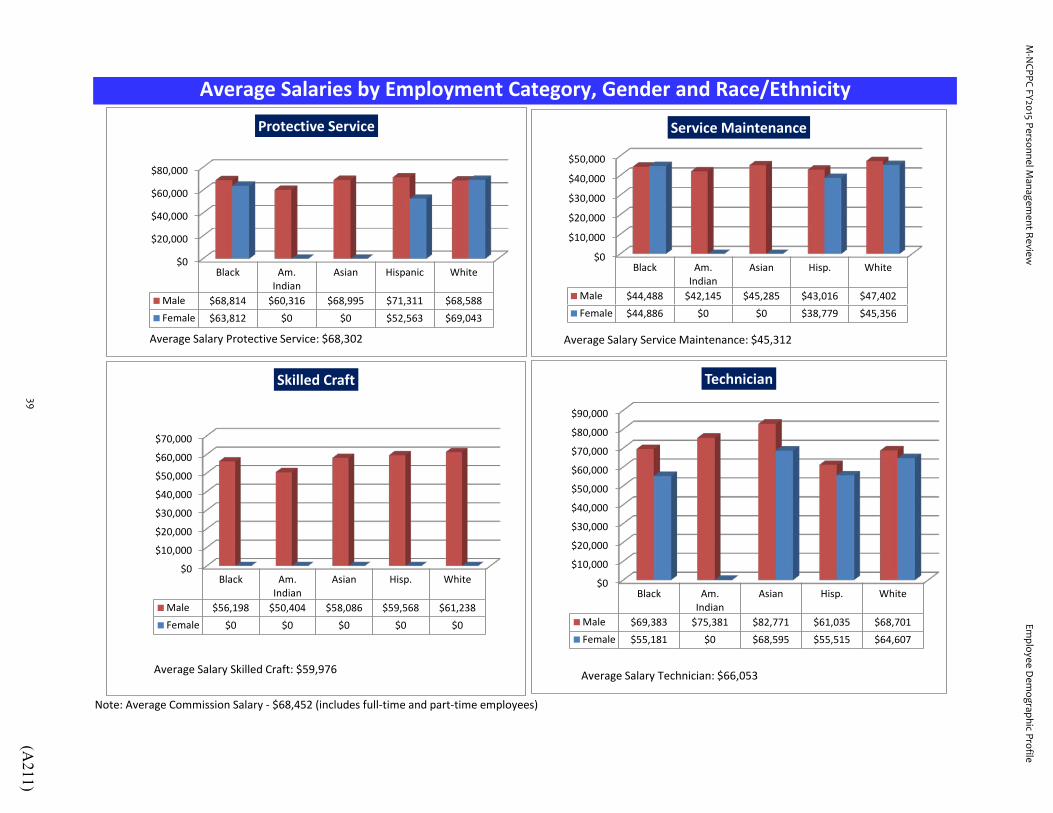
Note: Average Commission Salary - $68,452 (includes full-time and part-time employees)
Average Salaries by Employment Category, Gender and Race/Ethnicity
$0
$10,000
$20,000
$30,000
$40,000
$50,000
Black Am.Indian
Asian Hisp. White
Male $44,488 $42,145 $45,285 $43,016 $47,402Female $44,886 $0 $0 $38,779 $45,356
Service Maintenance
Average Salary Service Maintenance: $45,312
$0
$10,000
$20,000
$30,000
$40,000
$50,000
$60,000
$70,000
Black Am.Indian
Asian Hisp. White
Male $56,198 $50,404 $58,086 $59,568 $61,238Female $0 $0 $0 $0 $0
Skilled Craft
Average Salary Skilled Craft: $59,976
$0
$20,000
$40,000
$60,000
$80,000
Black Am.Indian
Asian Hispanic White
Male $68,814 $60,316 $68,995 $71,311 $68,588Female $63,812 $0 $0 $52,563 $69,043
Protective Service
Average Salary Protective Service: $68,302
$0
$10,000
$20,000
$30,000
$40,000
$50,000
$60,000
$70,000
$80,000
$90,000
Black Am.Indian
Asian Hisp. White
Male $69,383 $75,381 $82,771 $61,035 $68,701Female $55,181 $0 $68,595 $55,515 $64,607
Technician
Average Salary Technician: $66,053
M-N
CPPC FY2015 Personnel Managem
ent ReviewEm
ployee Dem
ographic Profile
39(A
211)
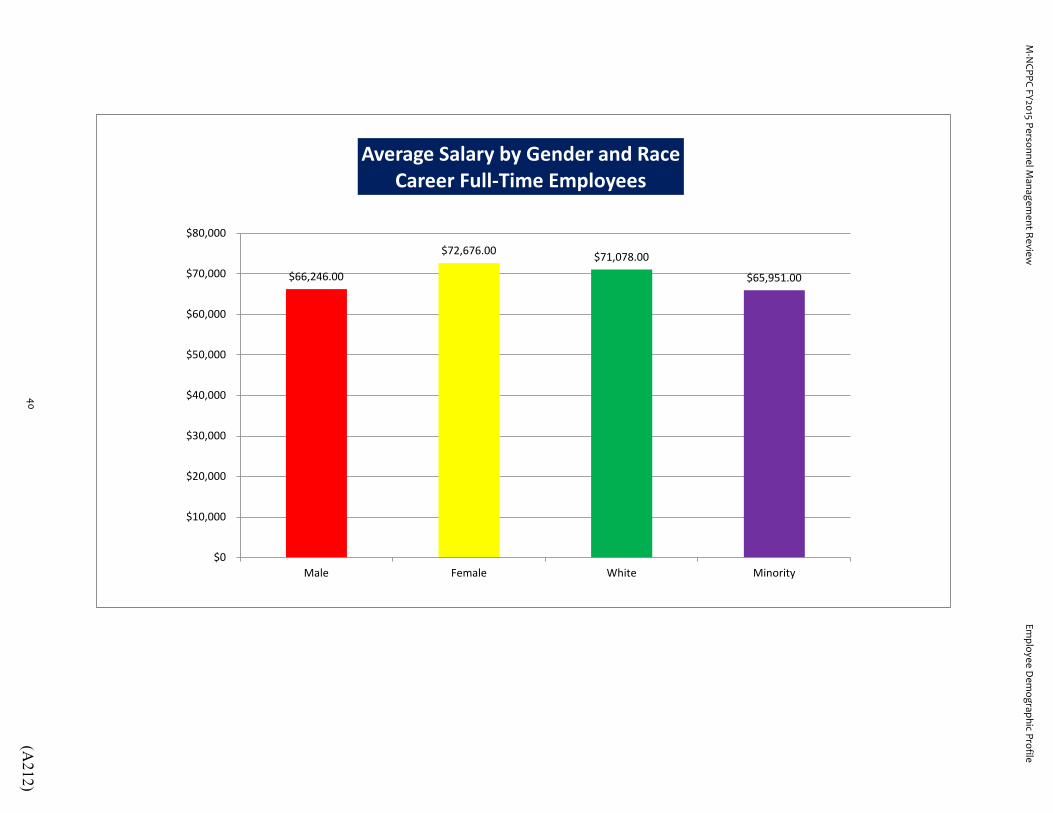
$66,246.00
$72,676.00 $71,078.00
$65,951.00
$0
$10,000
$20,000
$30,000
$40,000
$50,000
$60,000
$70,000
$80,000
Male Female White Minority
Average Salary by Gender and Race Career Full-Time Employees
M-N
CPPC FY2015 Personnel Managem
ent ReviewEm
ployee Dem
ographic Profile
40(A
212)

Grade Salary Grade Salary Grade Salary
PC-1 $48,338 D $45,288 GIT $68,583P02 $57,208 E $49,053 HIT $74,573P03 $62,270 F $56,569 IIT $93,067P04 $76,032 G $61,273 JIT $110,915P05 $91,080 H $71,789 Avg. Salary $91,828P06 $109,429 I $87,169P07 $128,985 J $104,280P09 $152,161 K $122,850
L $145,951Avg. Sal. FOP $73,244 Avg. Salary $76,081Avg. Sal. PP Command $118,694
Average Salary All Career Employees: $68,452 (includes full-time and part-time employees)
Average Annual Salary for Career Employees by Grade
Information TechGeneral ServicePark Police
$0
$20,000
$40,000
$60,000
$80,000
$100,000
$120,000
$140,000
$160,000
D E F G H I J K LGrade
Average Salary by Grade General Service Employees
$0
$50,000
$100,000
$150,000
$200,000
Grade
Average Salary by Grade Park Police
$0
$50,000
$100,000
$150,000
GIT HIT IIT JITGrade
Average Salary by Grade Information Technology Employees
M-NCPPC FY2015 Personnel Management Review Employee Demographic Profile
41 (A213)
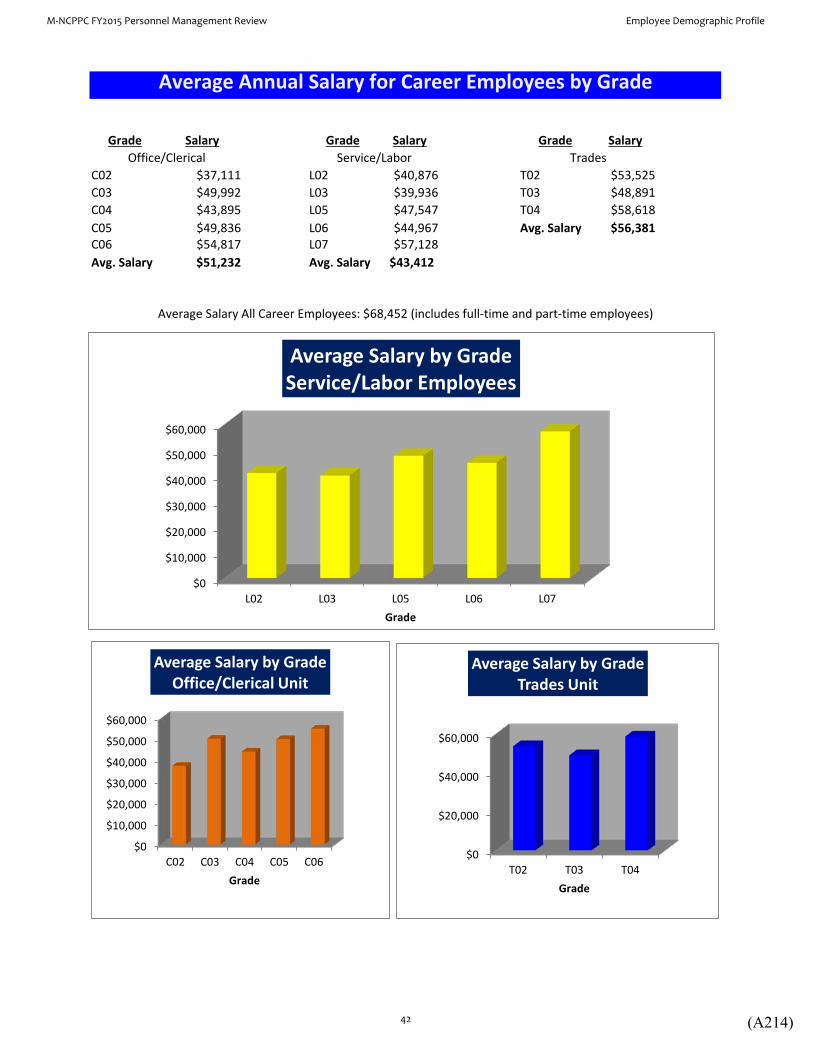
Grade Salary Grade Salary Grade Salary
C02 $37,111 L02 $40,876 T02 $53,525C03 $49,992 L03 $39,936 T03 $48,891C04 $43,895 L05 $47,547 T04 $58,618C05 $49,836 L06 $44,967 Avg. Salary $56,381C06 $54,817 L07 $57,128Avg. Salary $51,232 Avg. Salary $43,412
Office/Clerical Service/Labor Trades
Average Annual Salary for Career Employees by Grade
Average Salary All Career Employees: $68,452 (includes full-time and part-time employees)
$0
$10,000
$20,000
$30,000
$40,000
$50,000
$60,000
L02 L03 L05 L06 L07Grade
Average Salary by Grade Service/Labor Employees
$0
$10,000
$20,000
$30,000
$40,000
$50,000
$60,000
C02 C03 C04 C05 C06Grade
Average Salary by Grade Office/Clerical Unit
$0
$20,000
$40,000
$60,000
T02 T03 T04Grade
Average Salary by Grade Trades Unit
M-NCPPC FY2015 Personnel Management Review Employee Demographic Profile
42 (A214)

Employee Distribution by Grade Within Pay Schedule
050
100150200250300350
D E F G H I J K LEmployees 1 9 143 277 302 276 95 51 8
Distribution by Grade General Service
05
10152025303540
GIT HIT IIT JITEmployees 4 16 36 17
Distribution by Grade IT
0
20
40
60
80
100
PC-1
P02
P03
P04
P05
P06
P07
P09
Employees 8 39 12 86 29 15 7 2
Distribution by Grade Park Police Officers and Command Staff
0102030405060
C02 C03 C04 C05 C06Employees 1 3 17 52 60
Distribution by Grade Office Clerical
0
50
100
150
200
L02 L03 L05 L06 L07Employees 14 182 125 18 9
Distribution by Grade Service Labor
0
50
100
150
T02 T03 T04Employees 2 30 103
Distribtion by Grade Trades
M-NCPPC FY2015 Personnel Management Review Employee Demographic Profile
43 (A215)

Non-MinorityMinority
CAS MC Planning MC Parks PGCommission
PGC Planning Parks &Recreation
Minority 10 2 13 1 4 38White 4 8 34 0 4 25
4 8
34
0 4
25 10 2
13
1
4
38
Career Employee Promotions (Competitive and Non-Competitive)
By Department
M-N
CPPC FY2015 Personnel Managem
ent ReviewEm
ployee Dem
ographic Profile
44(A
216)

CAS MC Planning MC Parks PG Commission PGC Planning Parks & RecreationTotals 14 10 47 1 8 63Officials/Administrators 5 4 4Professionals 9 6 15 5 21Technicians 6 2 7Protective Services 8 18Paraprofessionals 1Office Clerical 2 1 1 4Skilled Crafts 2 5Service Maintenance 10 7
10 7 2 5 2
1 1
4 1 8 18 6
2
7
9 6
15
5
21
5 4
4
14 10
47
1
8
63
Career Employee Promotions By Employment Category Per Department
M-N
CPPC FY2015 Personnel Managem
ent ReviewEm
ployee Dem
ographic Profile
45(A
217)

White Black Asian Hispanic American IndianFemale 23 23 3 3 0Male 52 27 4 8 0
52
27
4 8
0
23
23
3
3
0
143 Promotions Commission-wide
Career Employee Promotions By Gender and Race/Ethnicity
M-N
CPPC FY2015 Personnel Managem
ent ReviewEm
ployee Dem
ographic Profile
46(A
218)
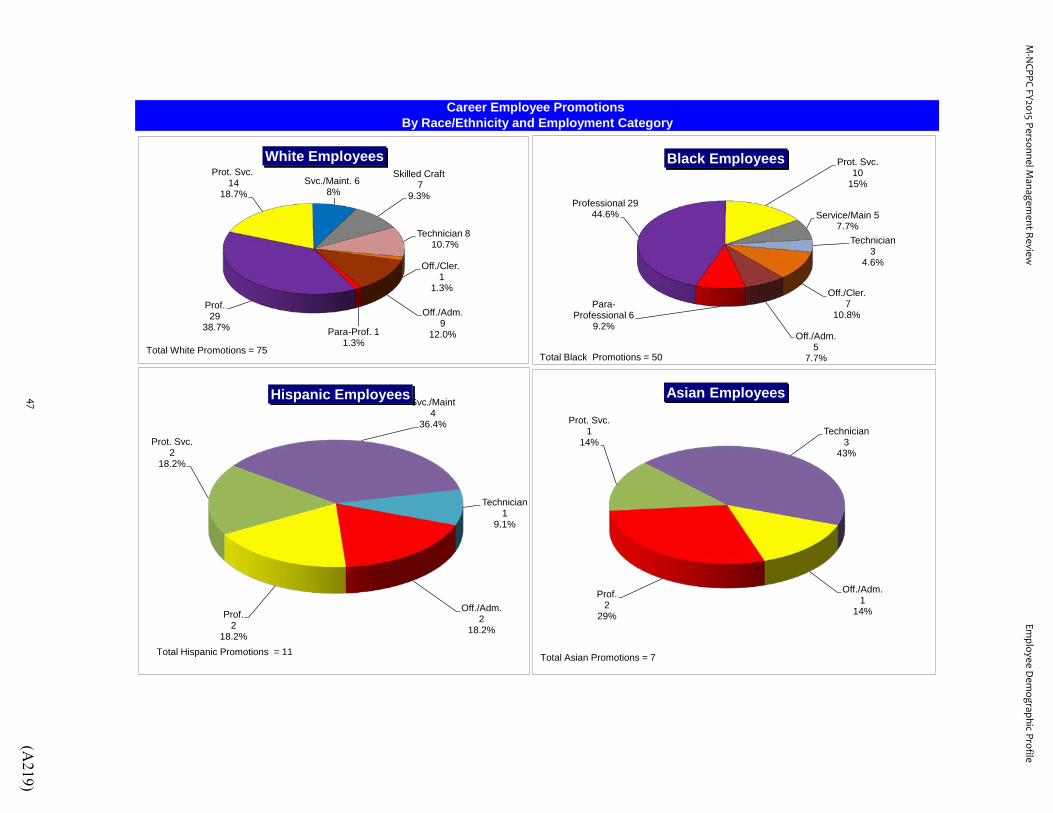
Career Employee Promotions By Race/Ethnicity and Employment Category
Off./Cler. 1
1.3%
Off./Adm. 9
12.0% Para-Prof. 1 1.3%
Prof. 29
38.7%
Prot. Svc. 14
18.7% Svc./Maint. 6
8%
Skilled Craft 7
9.3%
Technician 8 10.7%
White Employees
Total White Promotions = 75
Off./Cler. 7
10.8%
Off./Adm. 5
7.7%
Para-Professional 6
9.2%
Professional 29 44.6%
Prot. Svc. 10
15%
Service/Main 5 7.7%
Technician 3
4.6%
Black Employees
Total Black Promotions = 50
Off./Adm. 2
18.2% Prof.
2 18.2%
Prot. Svc. 2
18.2%
Svc./Maint 4
36.4%
Technician 1
9.1%
Hispanic Employees
Total Hispanic Promotions = 11
Off./Adm. 1
14%
Prof. 2
29%
Prot. Svc. 1
14% Technician
3 43%
Asian Employees
Total Asian Promotions = 7
M-N
CPPC FY2015 Personnel Managem
ent ReviewEm
ployee Dem
ographic Profile
47(A
219)

0
100
200
300
400
500
600
700
800
900
1000
MCComm
MCPlanning
MC Parks PGCComm
PGC Pks& Rec.
PGCPlanning
Cent.Adm.Serv.
Employees at TOG 0 42 130 3 150 52 34Employees in Dept 5 128 662 9 965 163 117
Employees at Top of Grade (TOG) By Department
Total Employees at Top of Grade Commission-wide = 411
M-N
CPPC FY2015 Personnel Managem
ent ReviewEm
ployee Dem
ographic Profile
48(A
220)

Comparison of Cost-of-Living Adjustments FY05 -- FY16(Percent of Increase)
M-NCPPC MONTGOMERY COUNTY PRINCE GEORGE'S COUNTYFiscal Park Ser/Labor Non-Repre. Police OPT & SLT Non-Repre. Police Ser/Labor Non-Repre.Year Police Trades Employees (FOP) (1994) Employees (FOP) Trades Employees
FOP Office Office(Local 1994) (AFSCME)++
2005 2.50 (l) 2.70 2.70 2.00 (j) 2.00 (j) 2.00 (j) 2.00 (k) 3.00 (m) 1.502006 3.50 (n) 2.80 2.80 2.75 2.75 2.75 3.00 2.50 2.502007 4.50 3.00 3.00 4.00 (o) 4.00 (p) 4.00 (p) 3.00 2.50 2.502008 4.50 3.25 3.25 7.50 (q) 4.00 4.00 2.50 2.50 2.502009 3.25 3.25 3.25 4.00 (r) 4.50 (s) 4.50 (s) 3.00 2.50 2.50
2.00 (t)
2010 3.75 See note (u) 0.00 0.00 0.00 0.00 0.00 0.00 0.002011 0.00 0.00 0.00 0.00 0.00 0.00 0.00 0.00 0.002012 0.00 0.00 0.00 0.00 0.00 0.00 0.00 See note (v) 0.002013 See note (w) See note (w) See note (w) See note (w) See note (w) 0.00 0.00 See note (v) 0.002014 2.50 2.50 (w2) 3.00 (w3) 2.10 3.25 3.25 0.00 (x) 2.50 (y) 2.50 (z)
1.50 (w3)
1.50 (w3) 2.50 (yy) 2.50 (zz)
2015 1.75 (w1 2.00 (w4) 2.00 (w4)
See note (w5) 2.10 3.25 3.25 0.00 0.00 0.00 (zz1)
2016 1.75 1.75 1.75 2.00 2.00 2.00 See Note (zz4) 3.50 (zz2 TBD (zz3)
Cumulative 28.00 21.25 21.75 24.45 23.75 25.75 13.50 21.50 16.50
++Closely matches classes represented by MCGEO Local 1994 at M-NCPPC
(j) COLAs effective 9/5/04 (w2) FY14 COLA for MCGEO employees was phased in with 1.25% effective 10/13 and1.25%
(k) FY05 COLA, 1.0% in 7/ 04 and 1.0% in 1/05 effective 1/14. Employees at top of grade received 2.75%
(l) FY05 COLA effective 5/05; graded officers received 2.5%; Sergeants received 5.0% (w3) FY14 COLA 3.0% for Non-represented whose base salary was at or within 2.999% of top of
(m) FY05 COLA, 1.0% in 7/04, 1.0% in 1/05, and 1.0% in 4/05 grade effective 10/13 and 1.5% for Non-represented whose base salary was not at or within
(n) Officers received 2.5% effective 7/05 and a 1% COLA effective 4/06 2.999% of top of grade effective 10/13 and 1.5% effective 1/14
(o) FY07 COLA 3,0% effective 1/9/06 and 1% effective 1/7/07 (w4) 2.0% COLA, effective 9/14/14, plus 0.5% lump sum for employees not at top of grade or
(p) FY07 COLA, 3.0% effective 7/1/06 and 1.0% effective 1/7/07 1.0% lump sum for those at top of grade
(q) Salary schedule adjusted by $3,151 - equivalent to 7.5%, effective 7/1/07 (w5) FY15 - 1.0% lump sum of base pay for employees at top of grade and 0.5% of base pay for
(r ) FY09 COLA 4.25% for officers employees who will receive a merit increase, effective 7/6/14
(s) FY09 COLA of 4.5% for Service/Labor, Trades and Office Unites, and Non-represented (x) Adding new step
(t) FY09 one-time 2% longevity for employees with performance ratings of exceptional or (y) 2.5% COLA, effective 7/1/13
highly successful for 2 most consecutive years and top of grade, with 20 years service (yy) 2.5% COLA, effective 3/1/14
(u) $1,420 lump sum wge adjustment with $640 representing COLA (z) 2.5% COLA, effective 8/25/13
(v) FY13 $1,000 lump sum not added to base salary in FY12 and $1,250 lump sum not added to base (zz) 2.5% COLA, effective 3/9/14
(w) $2,000 lump sum not added to base salary (zz1) Union agreement will end 6/30/15(w1) FY15 COLA 1.75%, effective 7/1/15 (zz2) Employees will receive a 3.5% COLA if general fund revenues exceed a pre-determined amount.
(w2) FY14 COLA 2.75% for Service/Labor, Trades and Office Units at top of grade; and 2.5% for (zz3) No information has been released on COLA's for general schedule employees.
Service/Labor, Trades and Office Units within 3.499% of top of grade, effective 10/13 and 1.25% (zz4) Police Officers will receive FY16 increases in FY17
effective 1/14.
M-N
CPPC FY2015 Personnel Managem
ent ReviewEm
ployee Dem
ographic Profile
49(A
221)

These graphs do not include participation in prescription drug, dental or vision coverage.Participation is based on calendar year. Distribution totals and percentages change each year at Open Enrollment.
UHC Choice POS 879
42.9%
UHC EPO 668
32.6%
CIGNA EPO 244
11.9%
Waived Coverage, 258
12.6%
Medical Health Plan Participation by Provider
Total Employees: 2,049
0
50
100
150
200
250
300
350
UHC POS UHC EPO CIGNA EPOFamily 336 270 77Single 346 236 109Two Member 197 162 58
Medical Health Plan Participation by Coverage
Total number of career employees that waived health care coverage: 258
M-NCPPC FY2015 Personnel Management Review Employee Demographic Profile
50 (A222)

Health Plan Coverage Enrolled Percentage
IPA ModelsUHC EPO Family 270 13.2%UHC EPO Single 236 11.5%UHC EPO Two Member 162 7.9%
668 32.6%
CIGNA EPO Family 77 3.8%CIGNA EPO Single 109 5.3%CIGNA EPO Two Member 58 2.8%
244 11.9%
UHC POS Family 336 16.4%UHC POS Single 346 16.9%UHC POS Two Member 197 9.6%
879 42.9%
Waived Coverage 258 12.6%
Total 2049 100%
Note: Does not include participation in prescription drug, supplemental dental, or vision coverage.Participation is based on calendar year. Distribution totals and percentages change each calendar at Open Enrollment.
Active Career Health Plan Participation
M-NCPPC FY2015 Personnel Management Review Employee Demographic Profile
51 (A223)
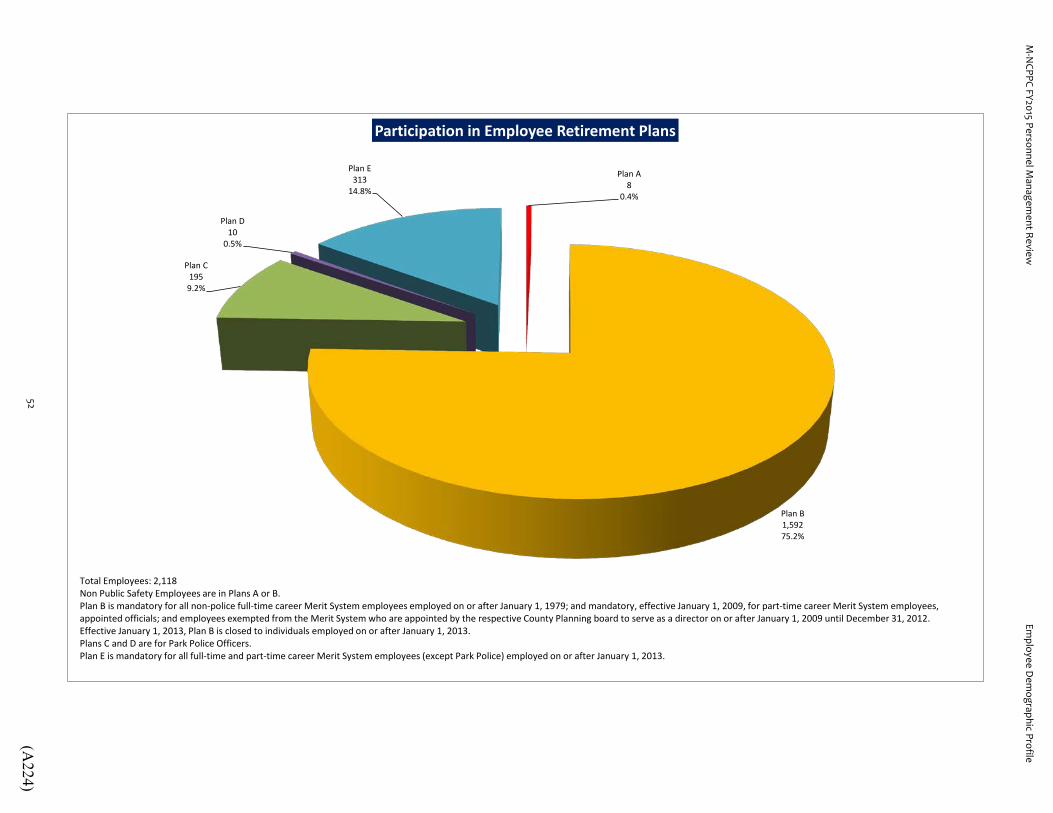
Plan A 8
0.4%
Plan B 1,592 75.2%
Plan C 195
9.2%
Plan D 10
0.5%
Plan E 313
14.8%
Participation in Employee Retirement Plans
Total Employees: 2,118 Non Public Safety Employees are in Plans A or B. Plan B is mandatory for all non-police full-time career Merit System employees employed on or after January 1, 1979; and mandatory, effective January 1, 2009, for part-time career Merit System employees, appointed officials; and employees exempted from the Merit System who are appointed by the respective County Planning board to serve as a director on or after January 1, 2009 until December 31, 2012. Effective January 1, 2013, Plan B is closed to individuals employed on or after January 1, 2013. Plans C and D are for Park Police Officers. Plan E is mandatory for all full-time and part-time career Merit System employees (except Park Police) employed on or after January 1, 2013.
M-N
CPPC FY2015 Personnel Managem
ent ReviewEm
ployee Dem
ographic Profile
52(A
224)
q
50
70
90
110
FY10 FY11 FY12 FY13 FY14 FY15Tuition Assistance Requests 97 57 60 51 52 64
Req
uest
s A
ppro
ved
Tuition Assistance Program - Commission Wide Participation
M-N
CPPC FY2015 Personnel Managem
ent ReviewEm
ployee Dem
ographic Profile
53(A
225)

Prince George's County
Planning Dept. 16
14.3%
Prince George's County Dept. of Parks and Recreation
50 44.6%
Montgomery County Commissioners' Office
2 1.8%
Montgomery County Planning Department
5 4.5%
Montgomery County Department of Parks
33 29.5%
Central Administrative Services
6 5.4%
Employee Separations by Department
Commission-wide Separations: 112
M-N
CPPC FY2015 Personnel Managem
ent ReviewEm
ployee Dem
ographic Profile
54(A
226)

Male 65
58.0%
Female 47
42.0%
Employee Separations by Gender
Total Employees: 112
M-N
CPPC FY2015 Personnel Managem
ent ReviewEm
ployee Dem
ographic Profile
55(A
227)

Black 46
41.1%
Asian 4
3.6% Hispanic
7 6.3%
White 53
47.3%
Not Disclosed 2
1.8%
Employee Separations by Race/Ethnicity
Commission-Wide Separations: 112
M-N
CPPC FY2015 Personnel Managem
ent ReviewEm
ployee Dem
ographic Profile
56(A
228)
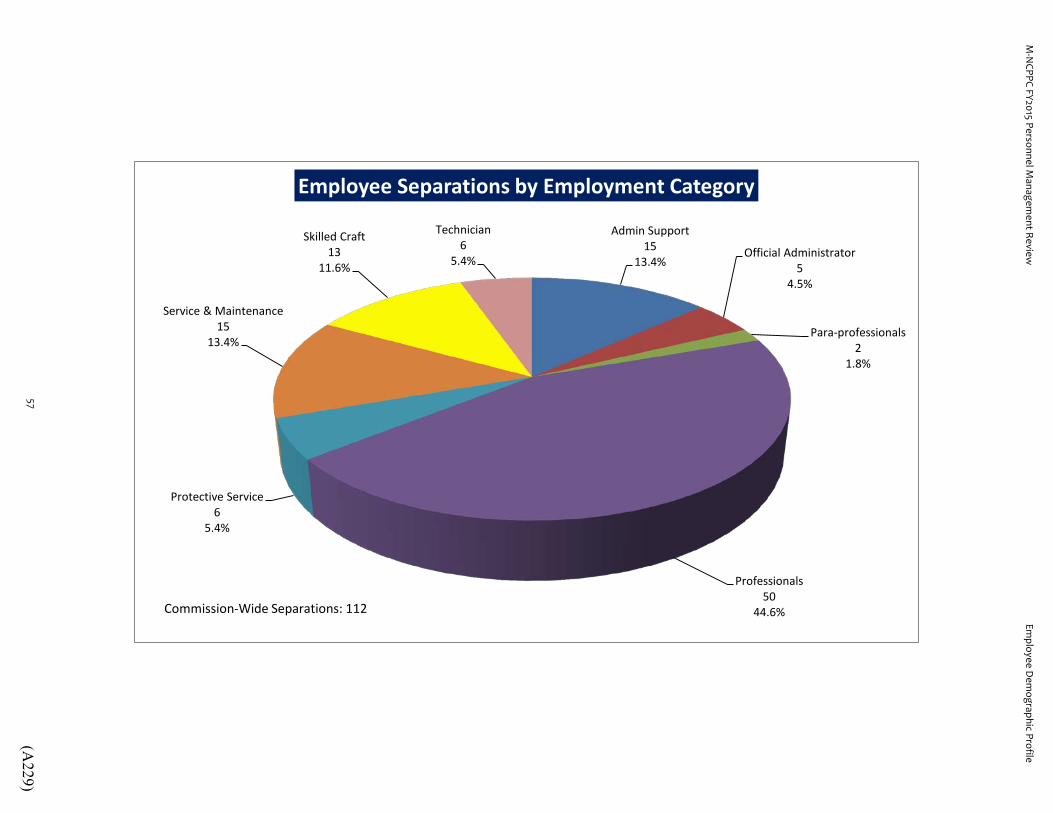
Admin Support 15
13.4% Official Administrator
5 4.5%
Para-professionals 2
1.8%
Professionals 50
44.6%
Protective Service 6
5.4%
Service & Maintenance 15
13.4%
Skilled Craft 13
11.6%
Technician 6
5.4%
Employee Separations by Employment Category
Commission-Wide Separations: 112
M-N
CPPC FY2015 Personnel Managem
ent ReviewEm
ployee Dem
ographic Profile
57(A
229)

2011 2012 2013 2014 2015
Voluntary New Job 24 21 27 31 21Relocation 1 3 6 5 3Personal Reasons 26 24 22 32 21Return to School 0 1 0 1 1
Early Retirement 5 5 4 1 2Normal Retirement 75 38 58 45 *48Quit Without Notice 5 4 4 1 0Other 0 2 0 1 3
Management/Fiscal Violation of Rules 6 7 4 6 4Unsatisfactory Performance 6 1 3 5 5Reduction in Force (RIF) 9 0 0 0 0Dismissal/Job Abondonment 0 0 0 0 1
Other Death 4 1 5 3 2Not Specified 0 0 0 0 1DisabilityMedical 0 2 1 0 0Resign Medical 0 0 1 0 0
Total Separations 161 109 135 131 112Turnover Rate 7.50% 6.00% 6.80% 6.50% 5.51%
*This count is based on the number of employees who completed an exit interview. According to the ERS, 59 employees retired during FY15.
Number of Separations by Reason and Fiscal Year
0
50
100
150
200
FY11 FY12 FY13 FY14 FY15Other 4 3 7 3 4Mgt./Fiscal 21 8 7 11 10Voluntary 136 98 121 117 98
Turnover - Separation Reasons
M-NCPPC FY2015 Personnel Management Review Employee Demographic Profile
58 (A230)
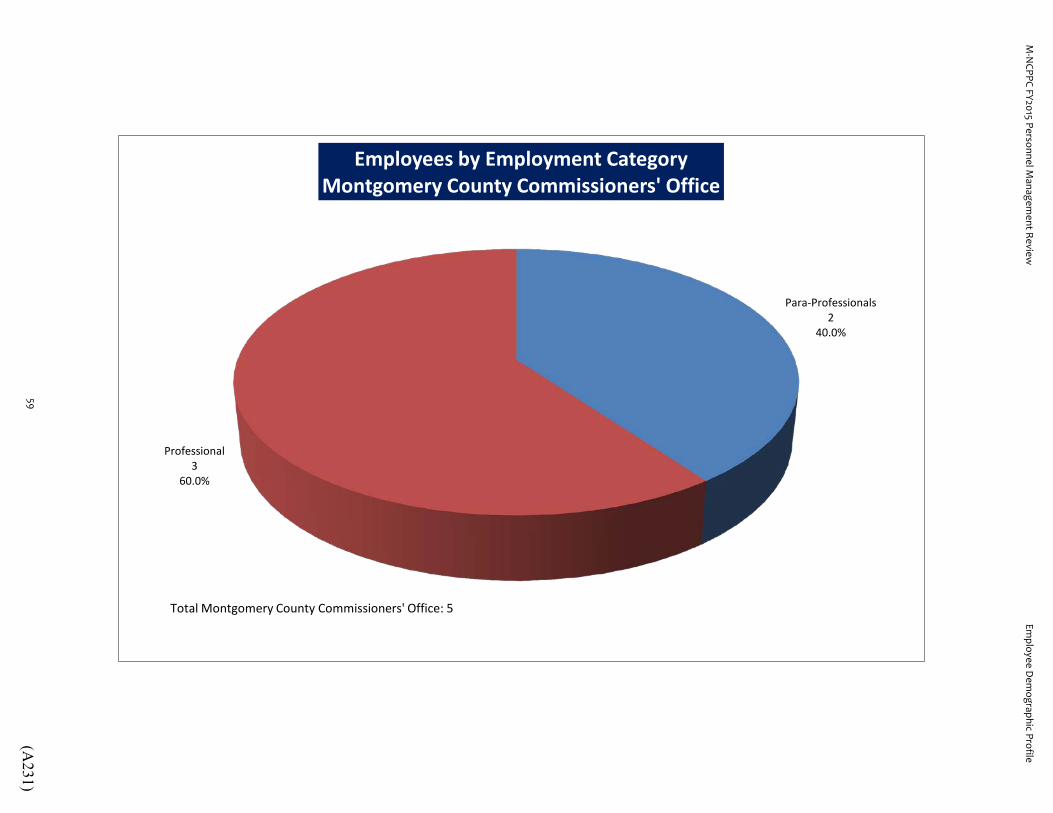
Para-Professionals 2
40.0%
Professional 3
60.0%
Employees by Employment Category Montgomery County Commissioners' Office
Total Montgomery County Commissioners' Office: 5
M-N
CPPC FY2015 Personnel Managem
ent ReviewEm
ployee Dem
ographic Profile
59(A
231)

Black 4
80.0%
White 1
20.0%
Race/Ethnicity Career Employees
Montgomery County Commissioners' Office
Total Montgomery County Commissioner's Office Employees: 5
M-N
CPPC FY2015 Personnel Managem
ent ReviewEm
ployee Dem
ographic Profile
60(A
232)
0
1
2
3
4
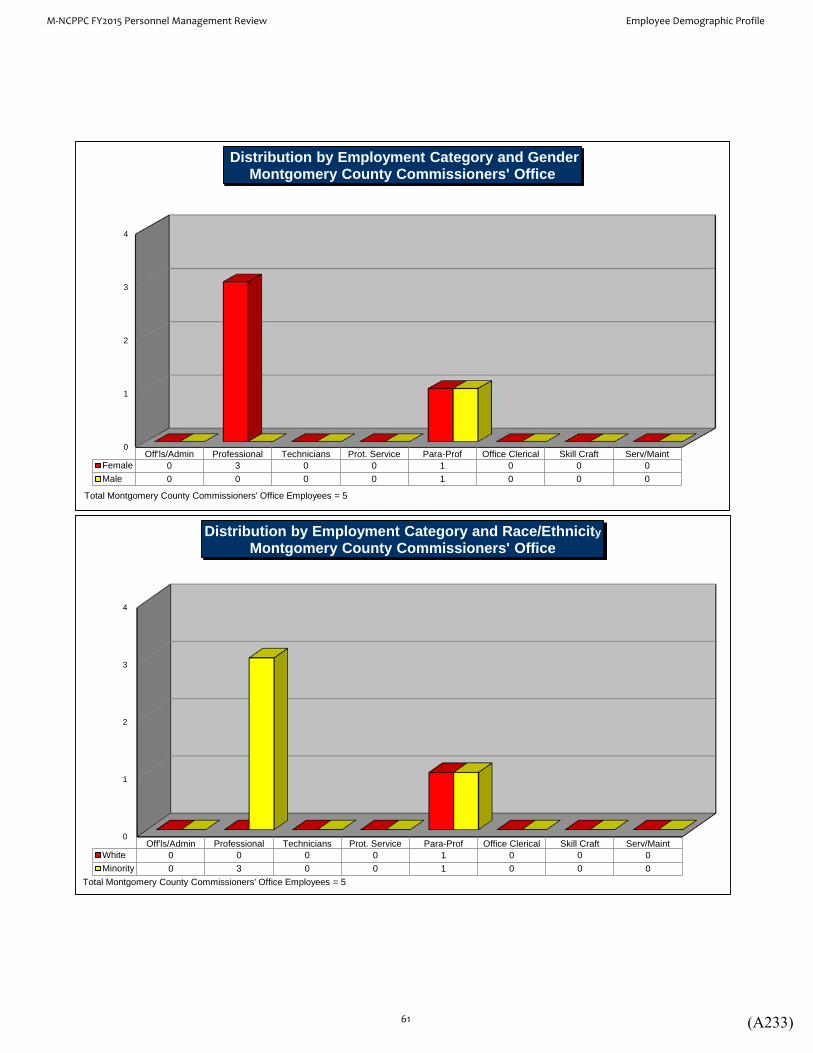
Off'ls/Admin Professional Technicians Prot. Service Para-Prof Office Clerical Skill Craft Serv/MaintFemale 0 3 0 0 1 0 0 0Male 0 0 0 0 1 0 0 0
Distribution by Employment Category and Gender Montgomery County Commissioners' Office
Total Montgomery County Commissioners' Office Employees = 5
0
1
2
3
4
Off'ls/Admin Professional Technicians Prot. Service Para-Prof Office Clerical Skill Craft Serv/MaintWhite 0 0 0 0 1 0 0 0Minority 0 3 0 0 1 0 0 0
Distribution by Employment Category and Race/Ethnicity Montgomery County Commissioners' Office
Total Montgomery County Commissioners' Office Employees = 5
M-NCPPC FY2015 Personnel Management Review Employee Demographic Profile
61 (A233)
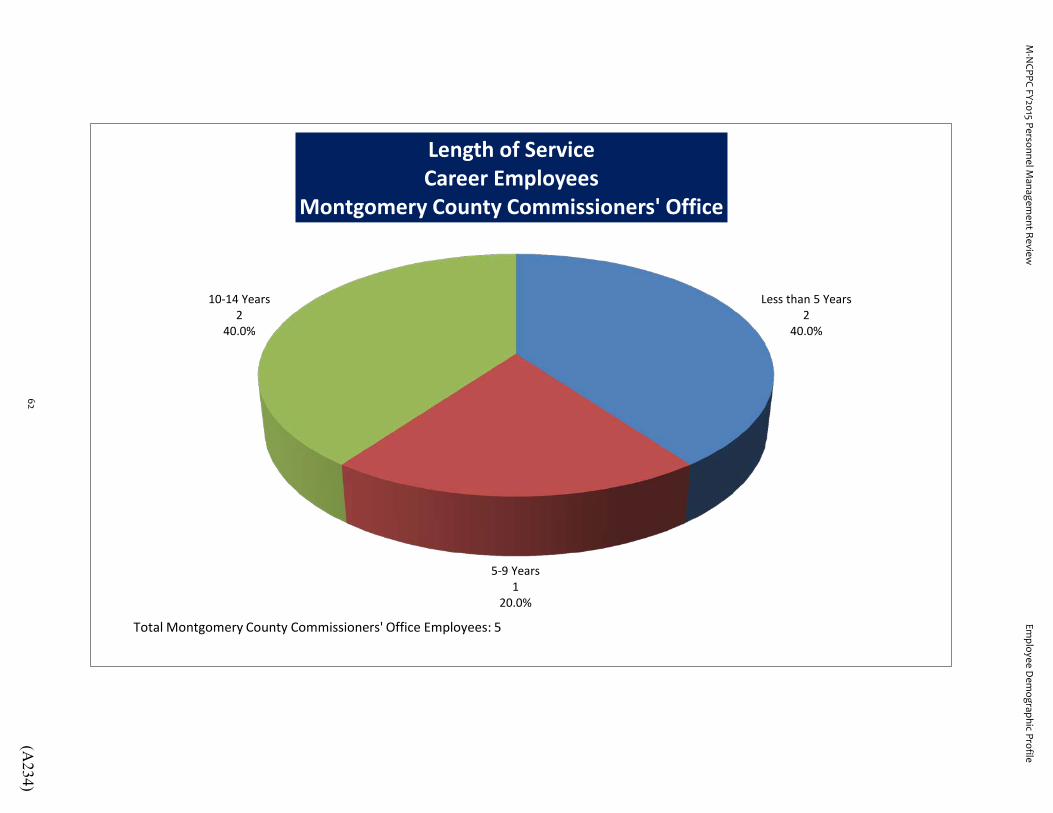
Less than 5 Years 2
40.0%
5-9 Years 1
20.0%
10-14 Years 2
40.0%
Length of Service Career Employees
Montgomery County Commissioners' Office
Total Montgomery County Commissioners' Office Employees: 5
M-N
CPPC FY2015 Personnel Managem
ent ReviewEm
ployee Dem
ographic Profile
62(A
234)

0
1
2
3
4
5
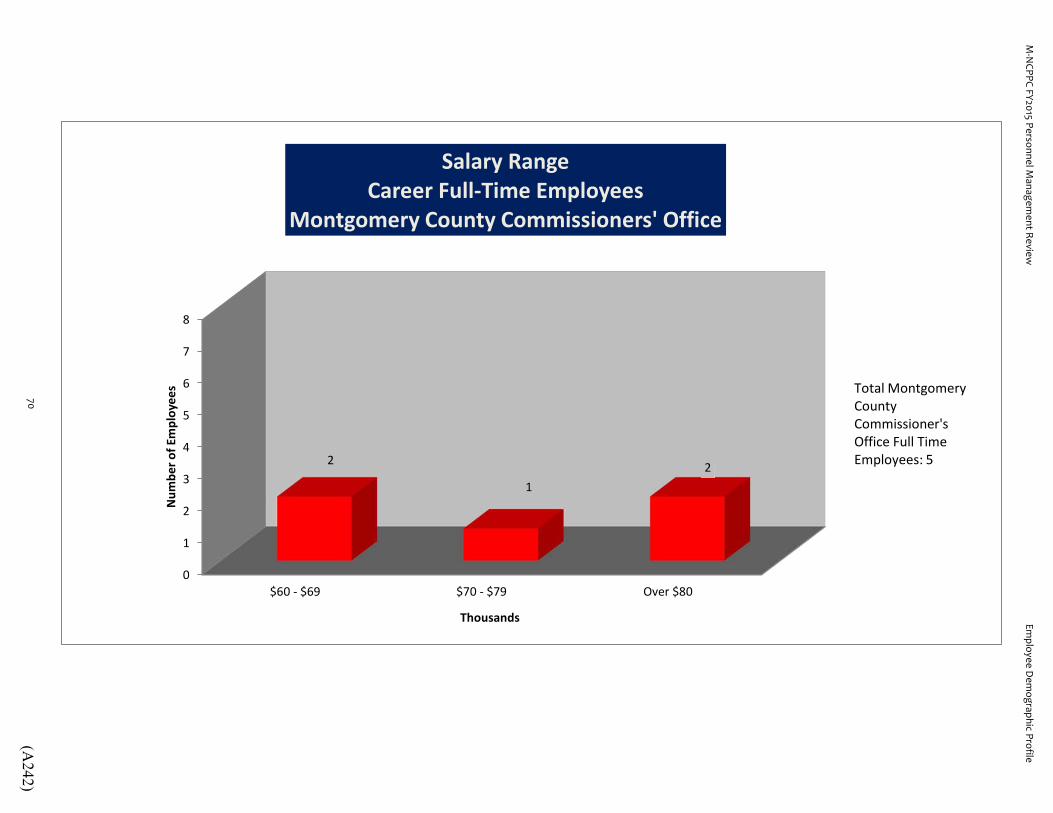
6
7
8
$60 - $69 $70 - $79 Over $80
2
1 2
Num
ber o
f Em
ploy
ees
Thousands
Salary Range Career Full-Time Employees
Montgomery County Commissioners' Office
Total Montgomery County Commissioner's Office Full Time Employees: 5
M-N
CPPC FY2015 Personnel Managem
ent ReviewEm
ployee Dem
ographic Profile
63(A
235)

Average Annual Salary for Career Employees by Grade Montgomery County Commissioner's Office
Grade Salary
G 65,542$ H 81,382$ J 109,565$
Average Departmental Salary: $80,683 Average Commission Salary: $68,452 (includes full-time and part-time employees)
$0
$20,000
$40,000
$60,000
$80,000
$100,000
G H JGrade
Average Salary by Grade Career Employees
M-NCPPC FY2015 Personnel Management Review Employee Demographic Profile
64 (A236)

Admin Support Para-ProfessionalNo. of Employees 1 1
0
0.2
0.4
0.6
0.8
1
1.2
Num
ber o
f Em
ploy
ees
Employee Turnover by Employment Category Montgomery County Commissioners' Office
Total Montgomery County Commissioners' Office Employees: 5 Commissioners' Office employee separations in FY15: 2 Turnover percentage: 40%
M-N
CPPC FY2015 Personnel Managem
ent ReviewEm
ployee Dem
ographic Profile
65(A
237)

Office/Clerical
10 7.8%
Official Administrator 9
7.0%
Professional 102
79.7%
Technician 7
5.5%
Employees by Employment Category Montgomery County Planning Department
Total Employees Montgomery County Planning Department: 128
M-N
CPPC FY2015 Personnel Managem
ent ReviewEm
ployee Dem
ographic Profile
66(A
238)

Black 27
21.1%
Asian 10
7.8%
Hispanic 6
4.7%
White 85
66.4%
Race/Ethnicity Career Employees
Montgomery County Planning Department
Total Montgomery County Planning Department Employees: 128
M-N
CPPC FY2015 Personnel Managem
ent ReviewEm
ployee Dem
ographic Profile
67(A
239)
0
10
20
30
40
50
60
70
80
90
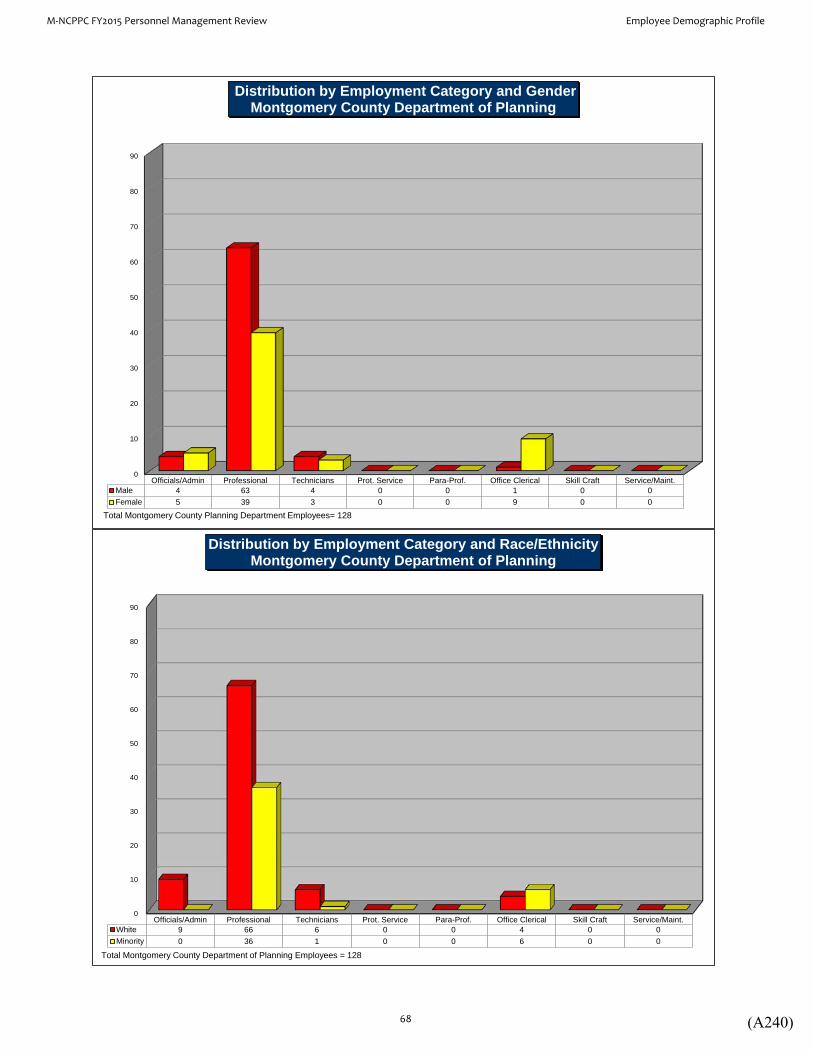
Officials/Admin Professional Technicians Prot. Service Para-Prof. Office Clerical Skill Craft Service/Maint.Male 4 63 4 0 0 1 0 0Female 5 39 3 0 0 9 0 0
Distribution by Employment Category and Gender Montgomery County Department of Planning
Total Montgomery County Planning Department Employees= 128
0
10
20
30
40
50
60
70
80
90
Officials/Admin Professional Technicians Prot. Service Para-Prof. Office Clerical Skill Craft Service/Maint.White 9 66 6 0 0 4 0 0Minority 0 36 1 0 0 6 0 0
Distribution by Employment Category and Race/Ethnicity Montgomery County Department of Planning
Total Montgomery County Department of Planning Employees = 128
M-NCPPC FY2015 Personnel Management Review Employee Demographic Profile
68 (A240)

Less Than 5 Years 34
26.6%
5-9 Years 30
23.4% 10-14 Years
25 19.5%
15-19 Years 10
7.8%
20-24 Years 11
8.6%
25-29 Years 12
9.4%
30 + Years 6
4.7%
Length of Service Career Employees
Montgomery County Department of Planning
Total Montgomery County Planning Department Employees: 128
M-N
CPPC FY2015 Personnel Managem
ent ReviewEm
ployee Dem
ographic Profile
69(A
241)
0
1
2
3
4
5
6
7
8
$60 - $69 $70 - $79 Over $80
2
1 2
Num
ber o
f Em
ploy
ees
Thousands
Salary Range Career Full-Time Employees
Montgomery County Commissioners' Office
Total Montgomery County Commissioner's Office Full Time Employees: 5
M-N
CPPC FY2015 Personnel Managem
ent ReviewEm
ployee Dem
ographic Profile
70(A
242)

Average Annual Salary for Career Employees by Grade Montgomery County Planning Department
Grade Salary Grade Salary Grade SalaryC05 $53,206 D $45,288 GIT $72,875C06 $52,813 F $62,628 HIT $82,182
G $64,022 IIT $100,885H $76,188 JIT $109,236I $91,345J $107,380K $126,416L $163,624
Average Departmental Salary: $86,475 Average Commission Salary: $68,452 (includes full-time and part-time employees)
$0
$20,000
$40,000
$60,000
$80,000
$100,000
$120,000
$140,000
$160,000
$180,000
D F G H I J K LGrade
Average Salary by Grade General Service Employees
$0
$20,000
$40,000
$60,000
$80,000
$100,000
$120,000
GIT HIT IIT JITGrade
Average Salary by Grade Information Technology Employees
$0$10,000$20,000$30,000$40,000$50,000
C05 C06Grade
Average Salary by Grade Administrative Employees
M-NCPPC FY2015 Personnel Management Review Employee Demographic Profile
71 (A243)

No. of Employees
ProfessionalNo. of Employees 5
0
1
2
3
4
5
6
Employee Turnover by Employment Category Montgomery County Planning Department
Total Montgomery County Planning Department Employees: 128 Planning employee separations in FY15: 5 Turnover Percentage: 3.9%
M-N
CPPC FY2015 Personnel Managem
ent ReviewEm
ployee Dem
ographic Profile
72(A
244)

Office/Clerical 43
6.5%
Officials/Administrators 16
2.4%
Para-Professionals 3
0.5%
Professional 201
30.4%
Protective Service 60
9.1%
Service / Maintenance 210
31.7%
Skilled Craft 85
12.8%
Technician 44
6.6%
Employees by Employment Category Montgomery County Department of Parks
Total Montgomery County Department of Parks Employees: 662
M-N
CPPC FY2015 Personnel Managem
ent ReviewEm
ployee Dem
ographic Profile
73(A
245)

Black 131
19.8% American Indian 4
0.6%
Asian 32
4.8%
Hispanic 49
7.4% White
446 67.4%
Race/Ethnicity Career Employees
Montgomery County Department of Parks
Total Montgomery County Department of Parks Employees: 662
M-N
CPPC FY2015 Personnel Managem
ent ReviewEm
ployee Dem
ographic Profile
74(A
246)

020406080
100120140160180200
OfficialsAdm.
Prof. Tech. Prot.Service
Para-Prof. Off./Cler. SkilledCraft
Serv./Maint.
Female 5 95 12 12 0 32 0 14Male 11 106 32 48 3 11 85 196
Distribution by Employment Category and Gender Montgomery County Department of Parks
Total Montgomery County Department of Parks Employees: 662
0
20
40
60
80
100
120
140
160
OfficialsAdm.
Prof. Tech. Prot.Service
Para-Prof. Off./Cler. SkilledCraft
Service/Maint.
White 10 157 31 45 3 27 72 101Minority 6 44 13 15 0 16 13 109
Distribution by Employment Category and Race Ethnicity Montgomery County Department of Parks
Total Montgomery County Department of Parks Employees: 662
M-NCPPC FY2015 Personnel Management Review Employee Demographic Profile
75 (A247)
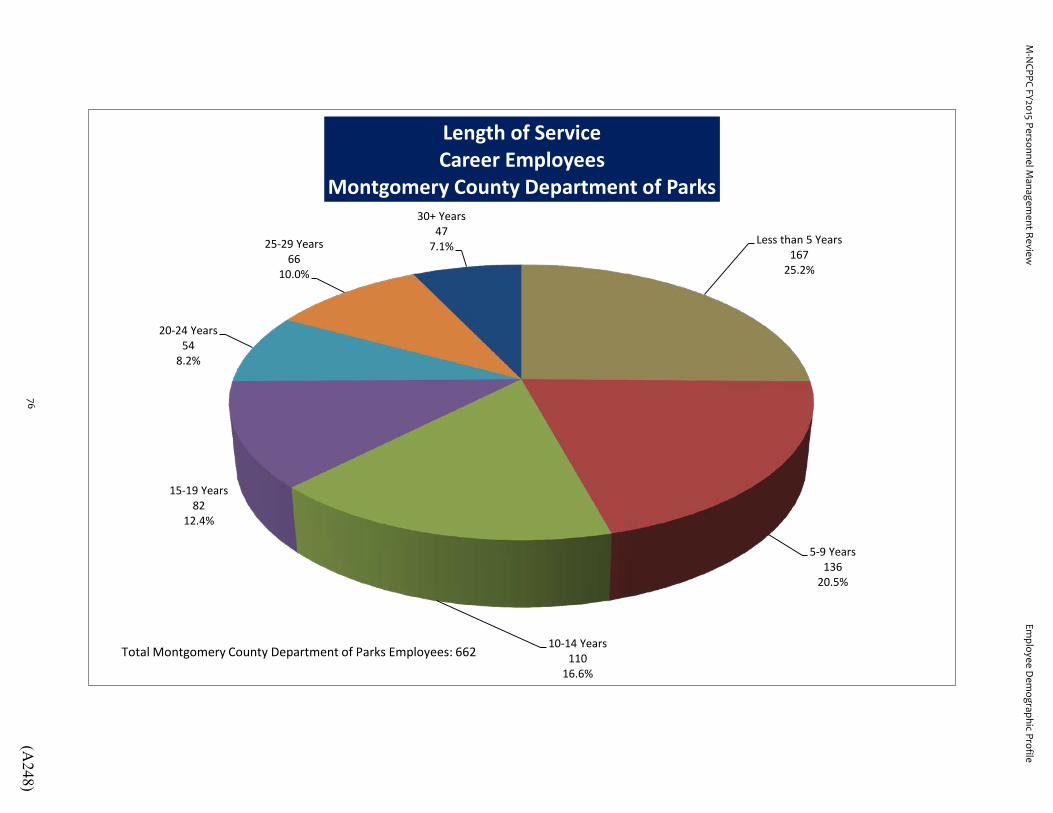
Less than 5 Years 167
25.2%
5-9 Years 136
20.5%
10-14 Years 110
16.6%
15-19 Years 82
12.4%
20-24 Years 54
8.2%
25-29 Years 66
10.0%
30+ Years 47
7.1%
Length of Service Career Employees
Montgomery County Department of Parks
Total Montgomery County Department of Parks Employees: 662
M-N
CPPC FY2015 Personnel Managem
ent ReviewEm
ployee Dem
ographic Profile
76(A
248)

0
20
40
60
80
100
120
140
$30 - $39 $40 - $49 $50 - $59 $60 - $69 $70 - $79 $80 - $89 Over $90
72
96
136 125
82
54
88
Num
ber o
f Em
ploy
ees
Thousands
Salary Range Career Full-Time Employees
Montgomery County Department of Parks
Total Montgomery County Department of Parks Full-Time Employees: 653 Average Salary: $64,960 Excludes Part-Time Employees
M-N
CPPC FY2015 Personnel Managem
ent ReviewEm
ployee Dem
ographic Profile
77(A
249)
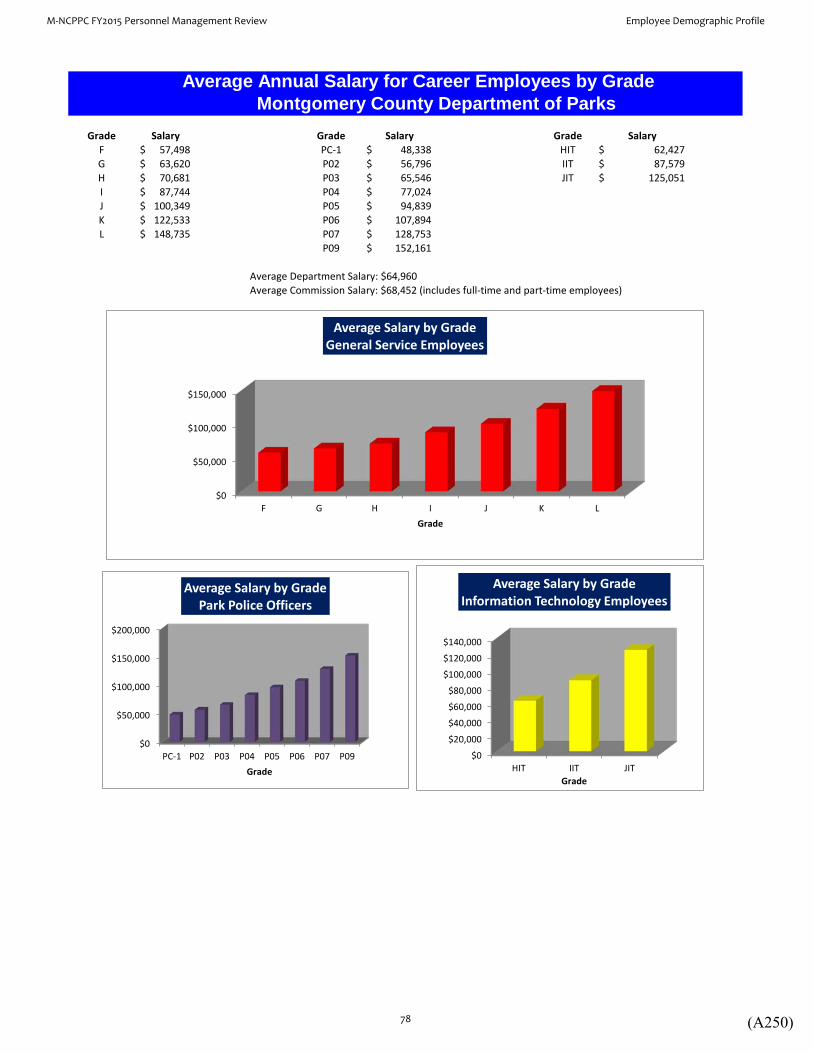
Average Annual Salary for Career Employees by Grade Montgomery County Department of Parks
Grade Salary Grade Salary Grade SalaryF 57,498$ PC-1 48,338$ HIT 62,427$ G 63,620$ P02 56,796$ IIT 87,579$ H 70,681$ P03 65,546$ JIT 125,051$ I 87,744$ P04 77,024$ J 100,349$ P05 94,839$ K 122,533$ P06 107,894$ L 148,735$ P07 128,753$
P09 152,161$
Average Department Salary: $64,960Average Commission Salary: $68,452 (includes full-time and part-time employees)
$0
$50,000
$100,000
$150,000
F G H I J K LGrade
Average Salary by Grade General Service Employees
$0
$50,000
$100,000
$150,000
$200,000
PC-1 P02 P03 P04 P05 P06 P07 P09Grade
Average Salary by Grade Park Police Officers
$0
$20,000
$40,000
$60,000
$80,000
$100,000
$120,000
$140,000
HIT IIT JITGrade
Average Salary by Grade Information Technology Employees
M-NCPPC FY2015 Personnel Management Review Employee Demographic Profile
78 (A250)

Average Annual Salary for Career Employees by Grade Montgomery County Department of Parks
Grade Salary Grade Salary Grade SalaryL02 $43,199 C04 $39,791 T02 $53,410L03 $40,976 C05 $49,278 T03 $50,154L05 $48,670 C06 $50,694 T04 $59,547L06 $43,910L07 $58,843
Average Departmental Salary: $64,960Average Commission Salary: $68,452 (includes full-time and part-time employees)
$0
$10,000
$20,000
$30,000
$40,000
$50,000
$60,000
L02 L03 L05 L06 L07
Grade
Average Salary by Grade Service/Labor Employees
$0
$10,000
$20,000
$30,000
$40,000
$50,000
$60,000
C04 C05 C06Grade
Average Salary by Grade Office and Clerical Employees
$0
$10,000
$20,000
$30,000
$40,000
$50,000
$60,000
T02 T03 T04Grade
Average Salary by Grade Trades Employees
M-NCPPC FY2015 Personnel Management Review Employee Demographic Profile
79 (A251)

No. of Employees
Officials/Adm. Professional Technician ProtectiveService Office/Clerical Skilled Craft Service and
MaintenanceNo. of Employees 3 14 2 2 2 3 7
0
2
4
6
8
10
12
14
16
Employee Turnover by Employment Category Montgomery County Department of Parks
Total Montgomery County Department of Parks Employees: 662 Parks employee separations in FY15: 33 Turnover Percentage: 5.0%
M-N
CPPC FY2015 Personnel Managem
ent ReviewEm
ployee Dem
ographic Profile
80(A
252)

Office Clerical 3
33.3%
Official Administrator 2
22.2%
Para-Professionals 2
22.2%
Professional 2
22.2%
Employees by Employment Category Prince George's County Commissioners' Office
Total Prince George's County Commissioner's Office Employees: 9
M-N
CPPC FY2015 Personnel Managem
ent ReviewEm
ployee Dem
ographic Profile
81(A
253)
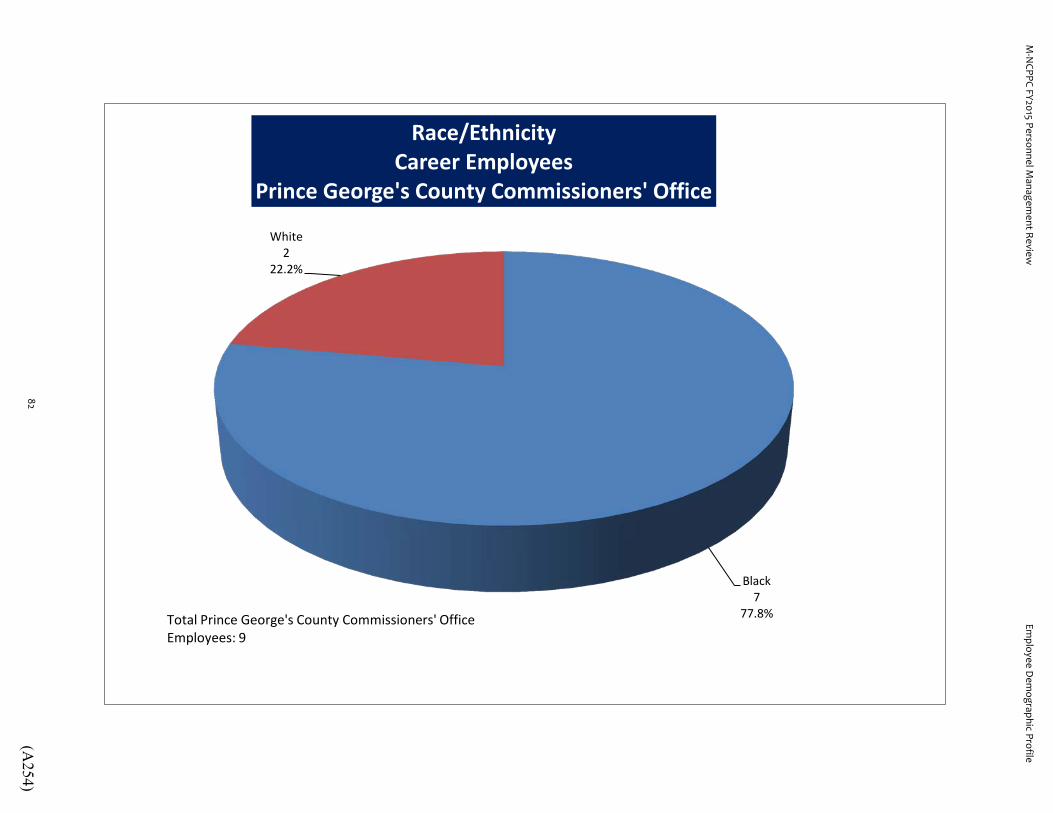
Black 7
77.8%
White 2
22.2%
Race/Ethnicity Career Employees
Prince George's County Commissioners' Office
Total Prince George's County Commissioners' Office Employees: 9
M-N
CPPC FY2015 Personnel Managem
ent ReviewEm
ployee Dem
ographic Profile
82(A
254)
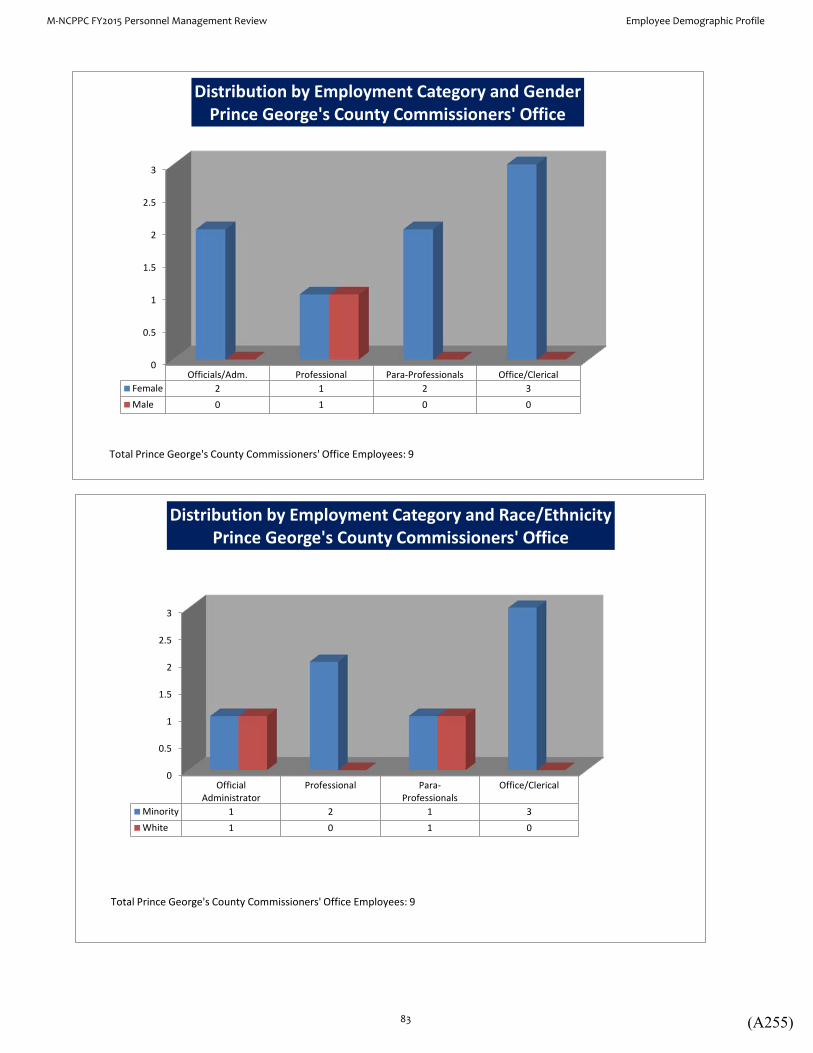
0
0.5
1
1.5
2
2.5
3
Officials/Adm. Professional Para-Professionals Office/ClericalFemale 2 1 2 3Male 0 1 0 0
Distribution by Employment Category and Gender Prince George's County Commissioners' Office
Total Prince George's County Commissioners' Office Employees: 9
0
0.5
1
1.5
2
2.5
3
OfficialAdministrator
Professional Para-Professionals
Office/Clerical
Minority 1 2 1 3White 1 0 1 0
Distribution by Employment Category and Race/Ethnicity Prince George's County Commissioners' Office
Total Prince George's County Commissioners' Office Employees: 9
M-NCPPC FY2015 Personnel Management Review Employee Demographic Profile
83 (A255)

Less than 5 years 1
11.1%
5-9 years 2
22.2%
10-14 years 1
11.1%
20-24 years 4
44.4%
25-29 years 1
11.1%
Length of Service Career Employees
Prince George's County Commissioners' Office
Total Prince George's County Commissioners' Office Employees: 9
M-N
CPPC FY2015 Personnel Managem
ent ReviewEm
ployee Dem
ographic Profile
84(A
256)

0
0.5
1
1.5
2
2.5
3
$60-$69 $70-$79 $80-$89 Over $90
3
1
2
3
Num
ber o
f Em
ploy
ees
Thousands
Salary Range Career Full-Time Employees
Prince George's County Commissioners' Office
Total Prince George's County Commissioners' Office Employees: 9 Average Salary: $85,212 Excludes Part-Time Career Employees
M-N
CPPC FY2015 Personnel Managem
ent ReviewEm
ployee Dem
ographic Profile
85(A
257)
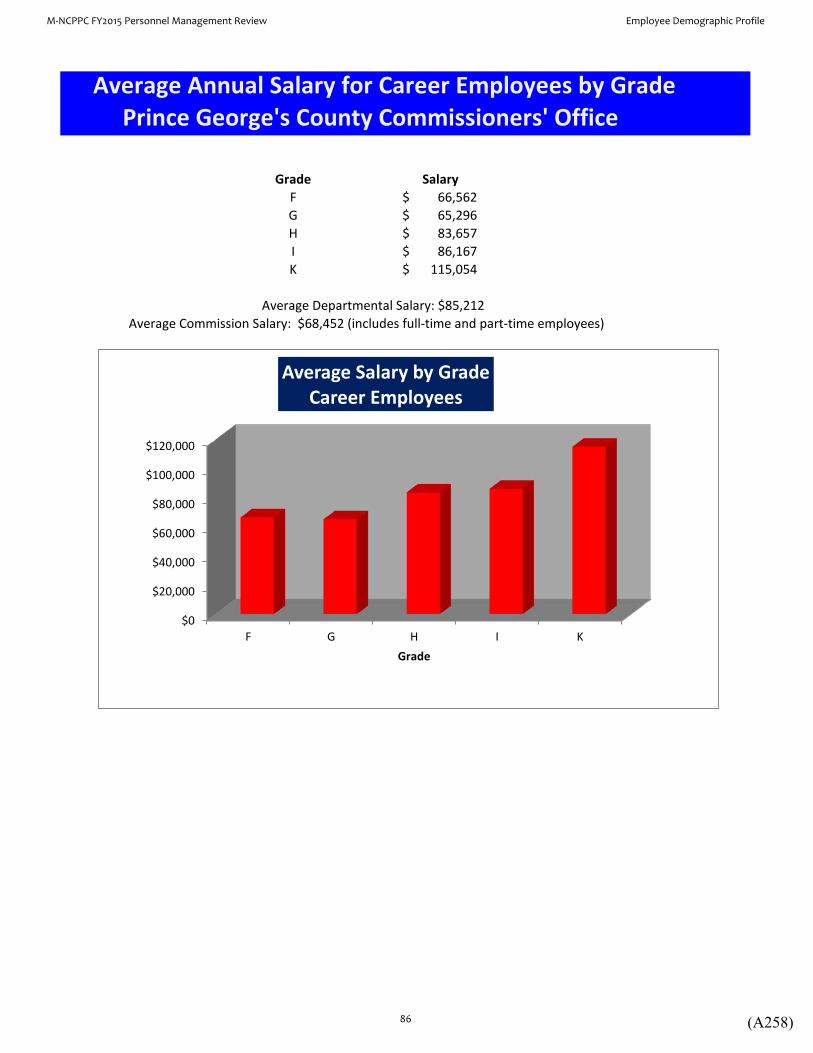
Average Annual Salary for Career Employees by Grade Prince George's County Commissioners' Office
Grade SalaryF 66,562$ G 65,296$ H 83,657$ I 86,167$ K 115,054$
Average Departmental Salary: $85,212Average Commission Salary: $68,452 (includes full-time and part-time employees)
$0
$20,000
$40,000
$60,000
$80,000
$100,000
$120,000
F G H I KGrade
Average Salary by Grade Career Employees
M-NCPPC FY2015 Personnel Management Review Employee Demographic Profile
86 (A258)

Office Clerical 18
11.0% Official Administrator
5 3.1%
Para-Professionals 4
2.5%
Professional 105
64.4%
Technician 31
19.0%
Employees by Employment Category Prince George's County Planning Department
Total Prince George's County Planning Department Employees: 163
M-N
CPPC FY2015 Personnel Managem
ent ReviewEm
ployee Dem
ographic Profile
87(A
259)

Black 60
36.8%
American Indian 2
1.2%
Asian 7
4.3% Hispanic
6 3.7%
White 88
54.0%
Race/Ethnicity Career Employees
Prince George's County Planning Department
Total Prince George's County Planning Department Employees: 163
M-N
CPPC FY2015 Personnel Managem
ent ReviewEm
ployee Dem
ographic Profile
88(A
260)

0
10
20
30
40
50
60
Off./Adm. Professional Technician Para-Professionals
Office/Clerical
Female 2 48 17 2 14Male 3 57 14 2 4
Distribution by Employment Category and Gender Prince George's County Planning Department
Total Prince George's County Planning Department Employees: 163
0
10
20
30
40
50
60
70
Off./Adm. Professional Technician Para-Professionals
Office/Clerical
Minority 2 42 16 1 14White 3 63 15 3 4
Distribution by Employment Category and Race/Ethnicity Prince George's County Planning Department
Total Prince George's County Planning Department Employees: 163
M-NCPPC FY2015 Personnel Management Review Employee Demographic Profile
89 (A261)
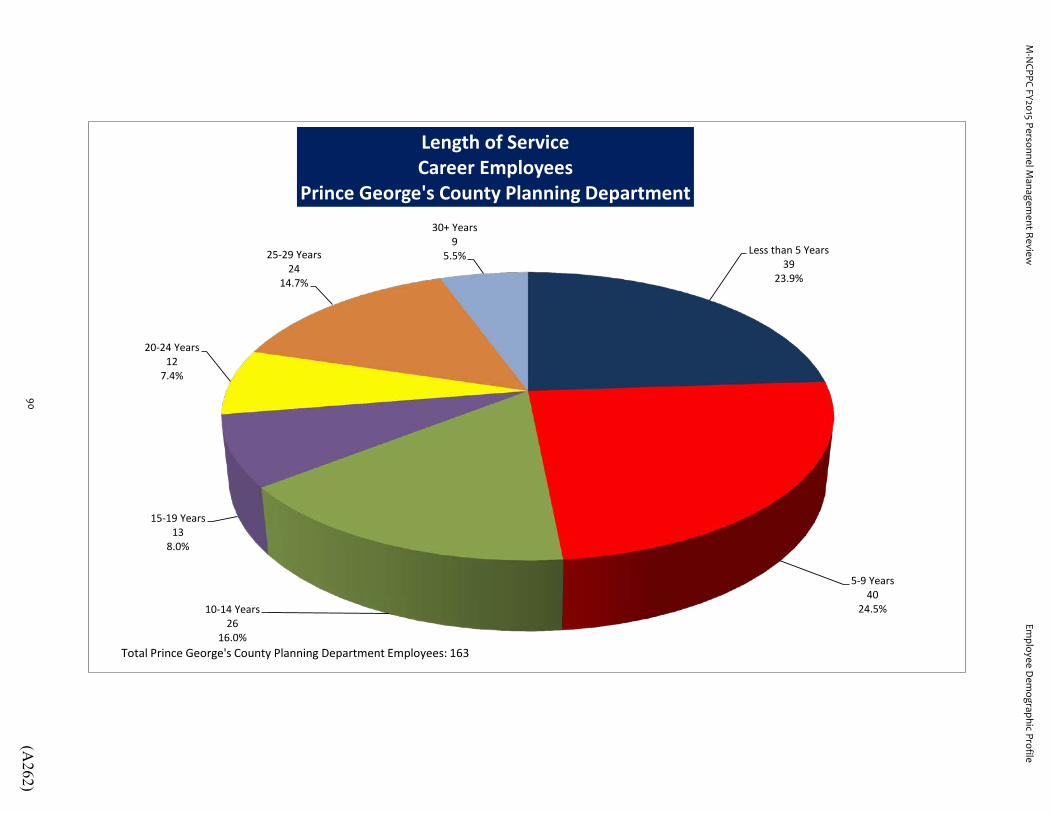
Less than 5 Years 39
23.9%
5-9 Years 40
24.5% 10-14 Years 26
16.0%
15-19 Years 13
8.0%
20-24 Years 12
7.4%
25-29 Years 24
14.7%
30+ Years 9
5.5%
Length of Service Career Employees
Prince George's County Planning Department
Total Prince George's County Planning Department Employees: 163
M-N
CPPC FY2015 Personnel Managem
ent ReviewEm
ployee Dem
ographic Profile
90(A
262)

0
10
20
30
40
50
60
$40-$49 $50-$59 $60-$69 $70-$79 $80-$89 Over $90
12
23 28
15
30
54
Thousands
Salary Range Career Full-Time Employees
Prince George's County Planning Department
Total Full-Time Prince George's County Planning Department Employees: 162
Average Salary: $80,180 Excludes Part-Time Career Employees
M-N
CPPC FY2015 Personnel Managem
ent ReviewEm
ployee Dem
ographic Profile
91(A
263)
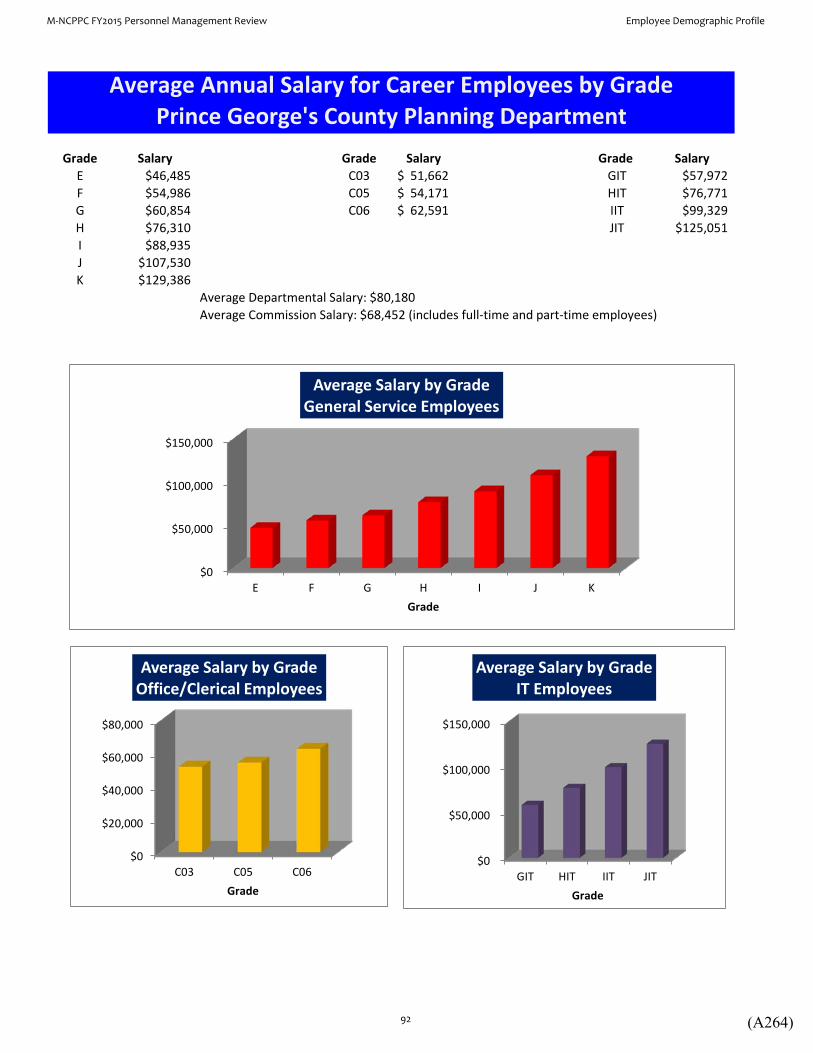
Grade Salary Grade Salary Grade SalaryE $46,485 C03 51,662$ GIT $57,972F $54,986 C05 54,171$ HIT $76,771G $60,854 C06 62,591$ IIT $99,329H $76,310 JIT $125,051I $88,935J $107,530K $129,386
Average Departmental Salary: $80,180Average Commission Salary: $68,452 (includes full-time and part-time employees)
Prince George's County Planning DepartmentAverage Annual Salary for Career Employees by Grade
$0
$50,000
$100,000
$150,000
E F G H I J KGrade
Average Salary by Grade General Service Employees
$0
$20,000
$40,000
$60,000
$80,000
C03 C05 C06Grade
Average Salary by Grade Office/Clerical Employees
$0
$50,000
$100,000
$150,000
GIT HIT IIT JITGrade
Average Salary by Grade IT Employees
M-NCPPC FY2015 Personnel Management Review Employee Demographic Profile
92 (A264)

Official/Adm. Professionals Technician Office/ClericalNo. of Employees 1 9 1 5
0
1
2
3
4
5
6
7
8
9
10
Employee Turnover by Employment Category Prince George's County Department of Planning
Total Prince George's County Department of Planning Employees: 163 Planning employee separations in FY15: 16 Turnover Percentage: 9.8%
M-N
CPPC FY2015 Personnel Managem
ent ReviewEm
ployee Dem
ographic Profile
93(A
265)
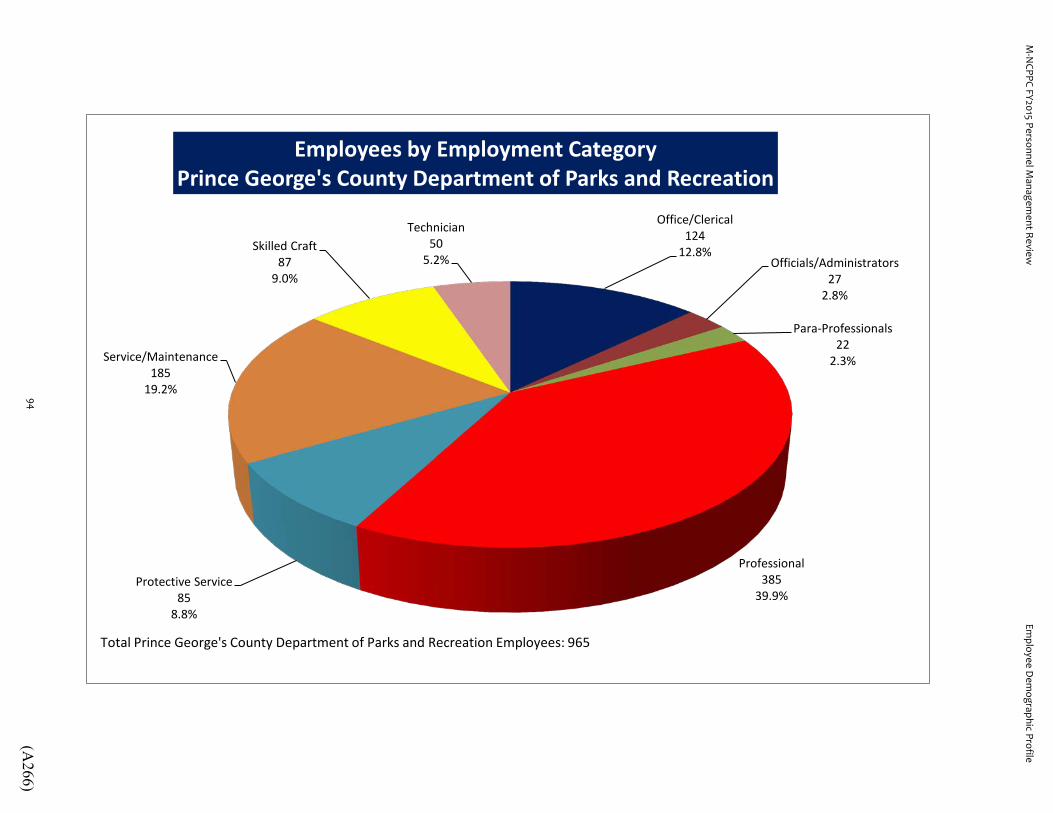
Office/Clerical 124
12.8% Officials/Administrators
27 2.8%
Para-Professionals 22
2.3%
Professional 385
39.9% Protective Service
85 8.8%
Service/Maintenance 185
19.2%
Skilled Craft 87
9.0%
Technician 50
5.2%
Employees by Employment Category Prince George's County Department of Parks and Recreation
Total Prince George's County Department of Parks and Recreation Employees: 965
M-N
CPPC FY2015 Personnel Managem
ent ReviewEm
ployee Dem
ographic Profile
94(A
266)

Black 463
48.0%
American Indian 7
0.7%
Asian 22
2.3%
Hispanic 58
6.0%
White 415
43.0%
Race/Ethnicity Career Employees
Prince George's County Department of Parks and Recreation
Total Prince George's County Department of Parks and Recreation Employees: 965
M-N
CPPC FY2015 Personnel Managem
ent ReviewEm
ployee Dem
ographic Profile
95(A
267)

0
20
40
60
80
100
120
140
160
180
200
Officials/Adm. Professional Technician ProtectiveService
Para-Professionals
Office Clerical Skilled Craft Service /Maintenance
Female 9 194 14 16 3 110 0 26Male 18 191 36 69 19 14 87 159
Distribution by Employment Category and Gender Prince George's County Department of Parks and Recreation
Total Prince George's County Department of Parks and Recreation Employees: 965
0
50
100
150
200
250
Officials/Adm. Professional Technician ProtectiveService
Para-Professionals
Office Clerical Skilled Craft Service /Maintenance
White 13 163 32 34 14 47 54 58Minority 14 222 18 51 8 77 33 127
Distribution by Employment Category and Race/Ethnicity Prince George's County Department of Parks and Recreation
Total Prince George's County Department of Parks and Recreation Employees: 965
M-NCPPC FY2015 Personnel Management Review Employee Demographic Profile
96 (A268)
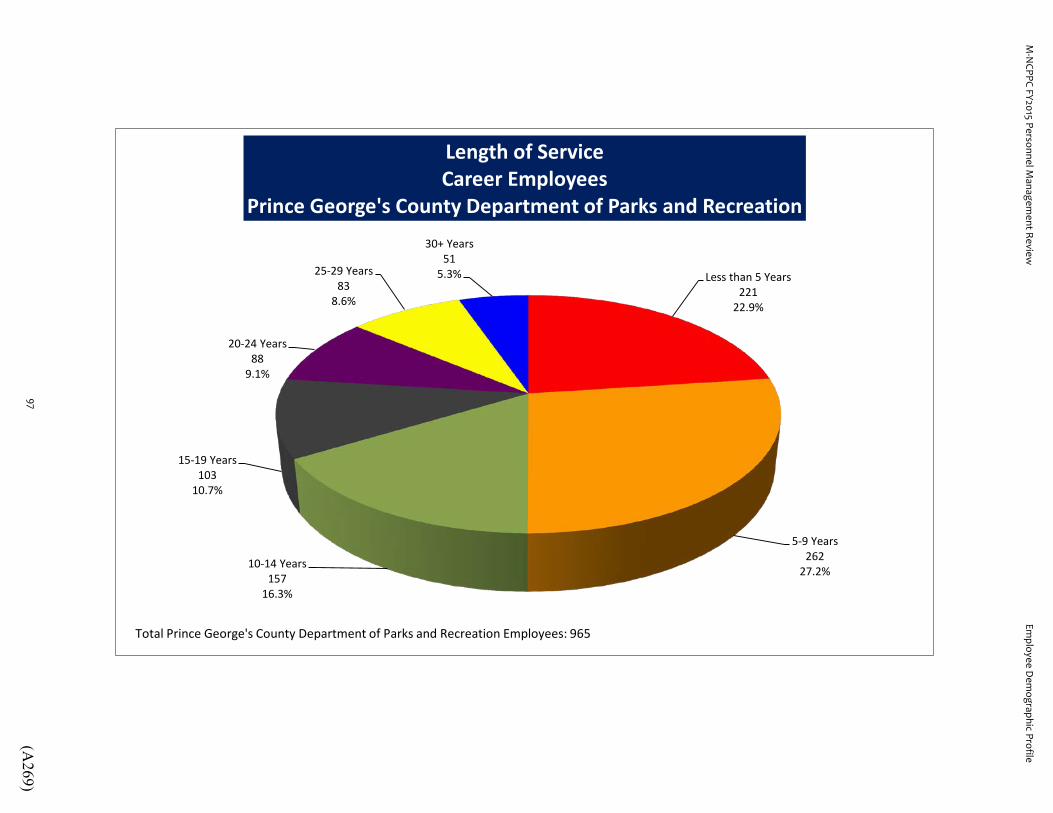
Less than 5 Years
221 22.9%
5-9 Years 262
27.2% 10-14 Years
157 16.3%
15-19 Years 103
10.7%
20-24 Years 88
9.1%
25-29 Years 83
8.6%
30+ Years 51
5.3%
Length of Service Career Employees
Prince George's County Department of Parks and Recreation
Total Prince George's County Department of Parks and Recreation Employees: 965
M-N
CPPC FY2015 Personnel Managem
ent ReviewEm
ployee Dem
ographic Profile
97(A
269)

0
50
100
150
200
250
$30-$39 $40-$49 $50-$59 $60-$69 $70-$79 $80-$89 Over $90
92
150
220
168
121
79
108
Salary Range Career Full-Time Employees
Prince George's County Department of Parks and Recreation
Total Full-Time Employees: 938 Average Salary: $64,007 Excludes Part-Time Career Employees
M-N
CPPC FY2015 Personnel Managem
ent ReviewEm
ployee Dem
ographic Profile
98(A
270)
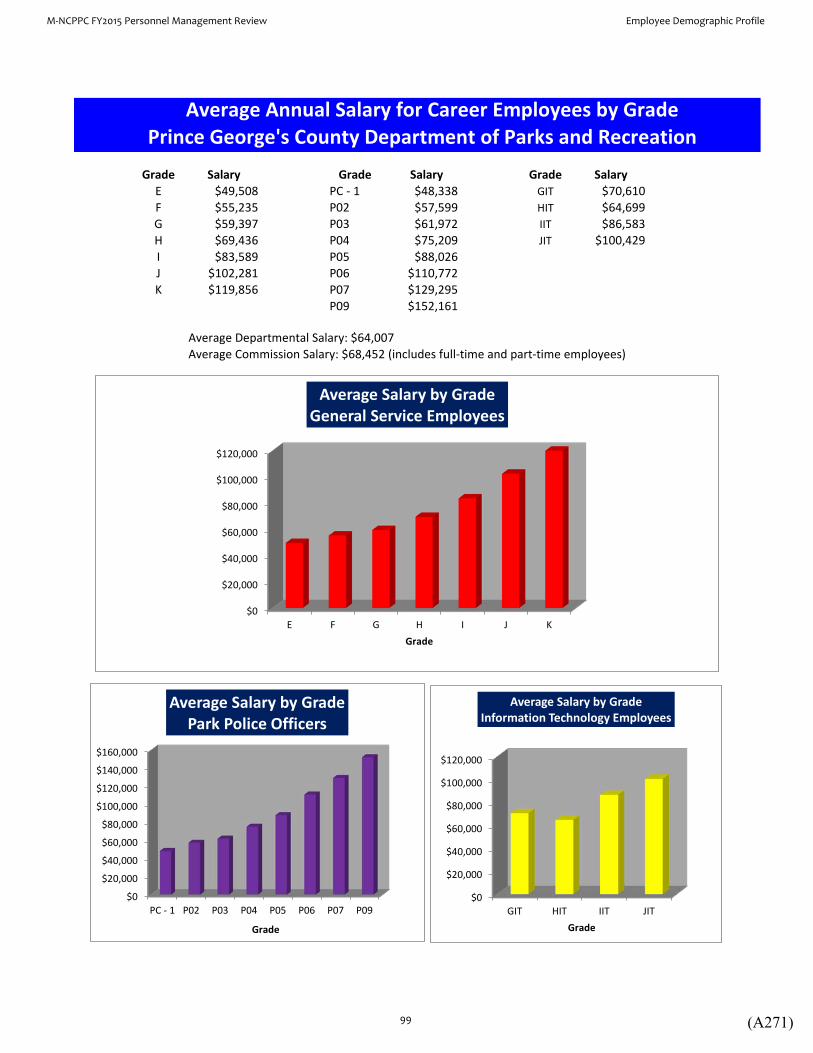
Grade Salary Grade Salary Grade SalaryE $49,508 PC - 1 $48,338 GIT $70,610F $55,235 P02 $57,599 HIT $64,699G $59,397 P03 $61,972 IIT $86,583H $69,436 P04 $75,209 JIT $100,429I $83,589 P05 $88,026J $102,281 P06 $110,772K $119,856 P07 $129,295
P09 $152,161
Average Departmental Salary: $64,007Average Commission Salary: $68,452 (includes full-time and part-time employees)
Average Annual Salary for Career Employees by Grade Prince George's County Department of Parks and Recreation
$0
$20,000
$40,000
$60,000
$80,000
$100,000
$120,000
E F G H I J KGrade
Average Salary by Grade General Service Employees
$0
$20,000
$40,000
$60,000
$80,000
$100,000
$120,000
$140,000
$160,000
PC - 1 P02 P03 P04 P05 P06 P07 P09
Grade
Average Salary by Grade Park Police Officers
$0
$20,000
$40,000
$60,000
$80,000
$100,000
$120,000
GIT HIT IIT JITGrade
Average Salary by Grade Information Technology Employees
M-NCPPC FY2015 Personnel Management Review Employee Demographic Profile
99 (A271)
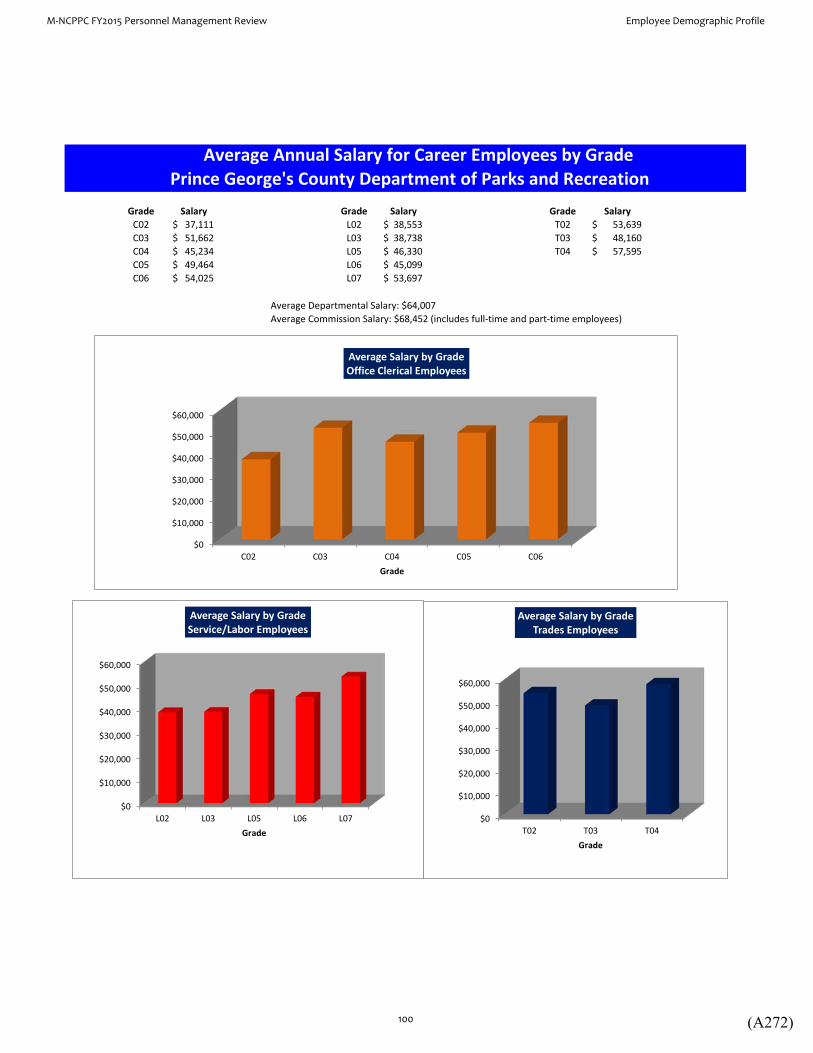
Grade Salary Grade Salary Grade SalaryC02 37,111$ L02 38,553$ T02 53,639$ C03 51,662$ L03 38,738$ T03 48,160$ C04 45,234$ L05 46,330$ T04 57,595$ C05 49,464$ L06 45,099$ C06 54,025$ L07 53,697$
Average Departmental Salary: $64,007Average Commission Salary: $68,452 (includes full-time and part-time employees)
Average Annual Salary for Career Employees by Grade Prince George's County Department of Parks and Recreation
$0
$10,000
$20,000
$30,000
$40,000
$50,000
$60,000
C02 C03 C04 C05 C06Grade
Average Salary by Grade Office Clerical Employees
$0
$10,000
$20,000
$30,000
$40,000
$50,000
$60,000
L02 L03 L05 L06 L07Grade
Average Salary by Grade Service/Labor Employees
$0
$10,000
$20,000
$30,000
$40,000
$50,000
$60,000
T02 T03 T04Grade
Average Salary by Grade Trades Employees
M-NCPPC FY2015 Personnel Management Review Employee Demographic Profile
100 (A272)
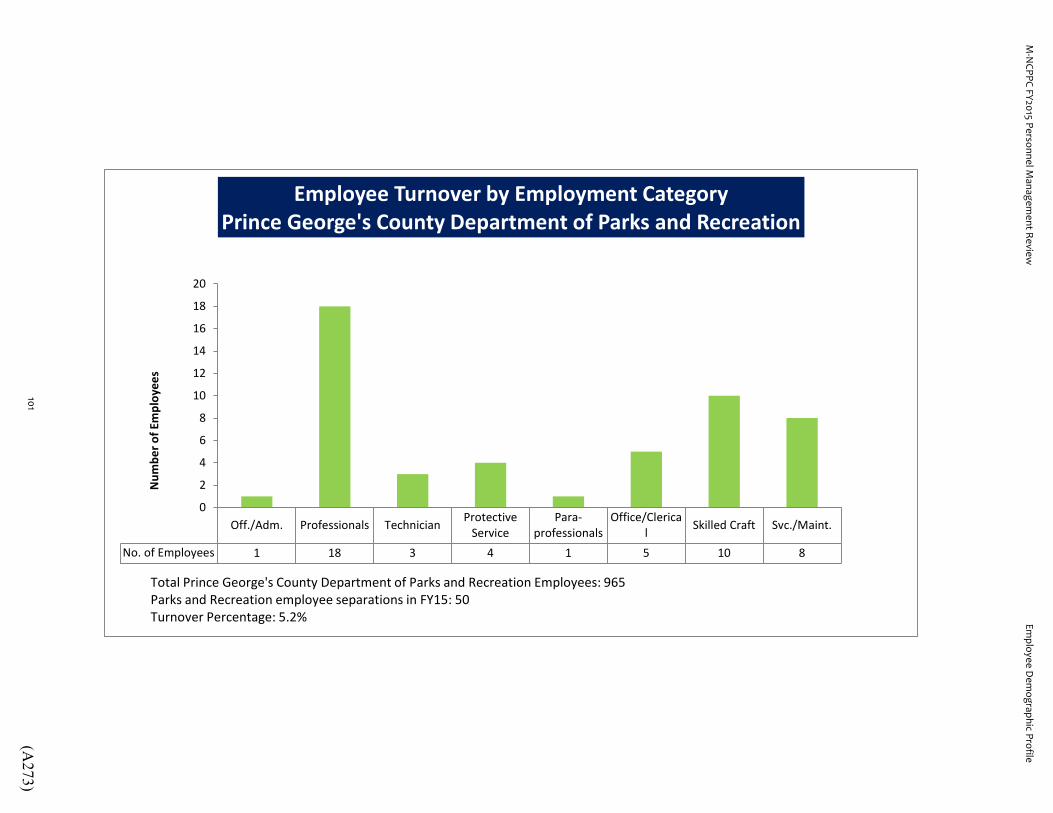
Off./Adm. Professionals Technician ProtectiveService
Para-professionals
Office/Clerical Skilled Craft Svc./Maint.
No. of Employees 1 18 3 4 1 5 10 8
0
2
4
6
8
10
12
14
16
18
20
Num
ber o
f Em
ploy
ees
Employee Turnover by Employment Category Prince George's County Department of Parks and Recreation
Total Prince George's County Department of Parks and Recreation Employees: 965 Parks and Recreation employee separations in FY15: 50 Turnover Percentage: 5.2%
M-N
CPPC FY2015 Personnel Managem
ent ReviewEm
ployee Dem
ographic Profile
101(A
273)

Office/Clerical
6 5.1%
Officials/Administrators 12
10.3%
Para-Professionals 6
5.1%
Professional 85
72.6%
Service / Maintenance 1
0.9%
Technician 7
6.0%
Employees by Employment Category Central Administrative Services
Department of Human Resources and Management, Finance, Legal, Internal Audit and Merit System Board
Total Central Administrative Services Employees: 117
M-N
CPPC FY2015 Personnel Managem
ent ReviewEm
ployee Dem
ographic Profile
102(A
274)

Black 64
54.7%
Asian 10
8.5%
Hispanic 7
6.0%
White 36
30.8%
Race/Ethnicity Career Employees
Central Administrative Services Department of Human Resources and Management, Finance, Legal, Internal Audit and
Merit System Board
Total Central Administrative Services Employees: 117
M-N
CPPC FY2015 Personnel Managem
ent ReviewEm
ployee Dem
ographic Profile
103(A
275)
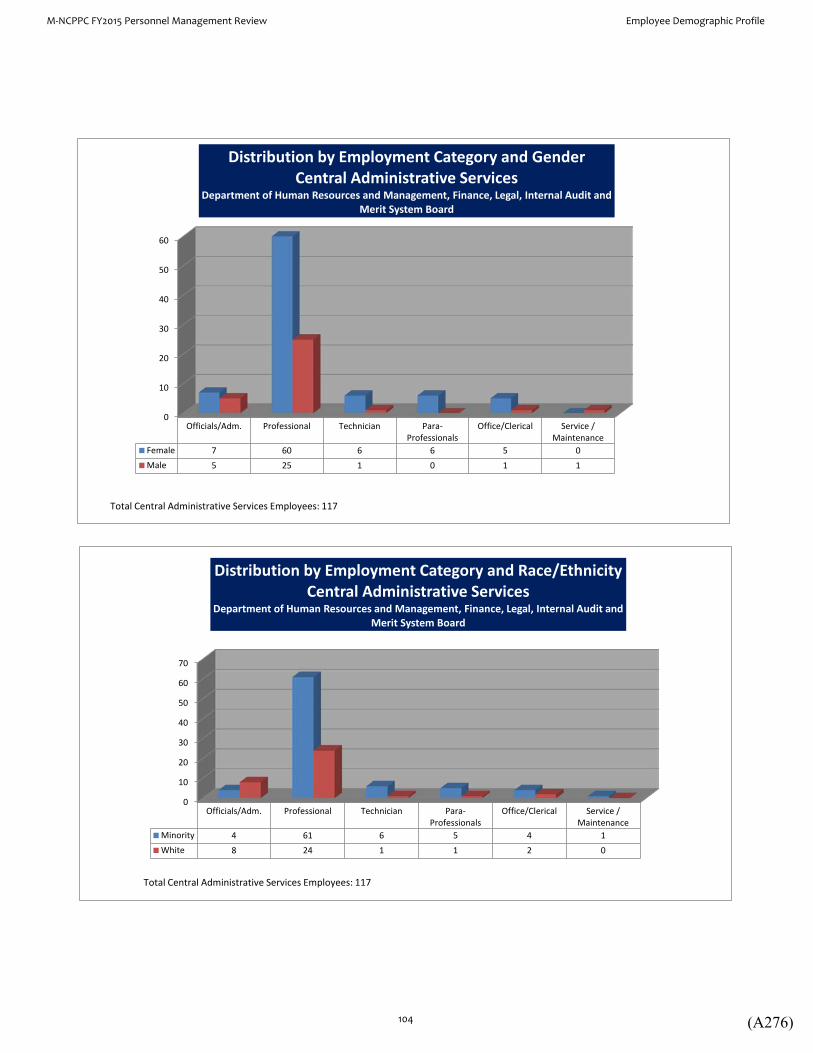
0
10
20
30
40
50
60
Officials/Adm. Professional Technician Para-Professionals
Office/Clerical Service /Maintenance
Female 7 60 6 6 5 0Male 5 25 1 0 1 1
Distribution by Employment Category and Gender Central Administrative Services
Department of Human Resources and Management, Finance, Legal, Internal Audit and Merit System Board
Total Central Administrative Services Employees: 117
0
10
20
30
40
50
60
70
Officials/Adm. Professional Technician Para-Professionals
Office/Clerical Service /Maintenance
Minority 4 61 6 5 4 1White 8 24 1 1 2 0
Distribution by Employment Category and Race/Ethnicity Central Administrative Services
Department of Human Resources and Management, Finance, Legal, Internal Audit and Merit System Board
Total Central Administrative Services Employees: 117
M-NCPPC FY2015 Personnel Management Review Employee Demographic Profile
104 (A276)
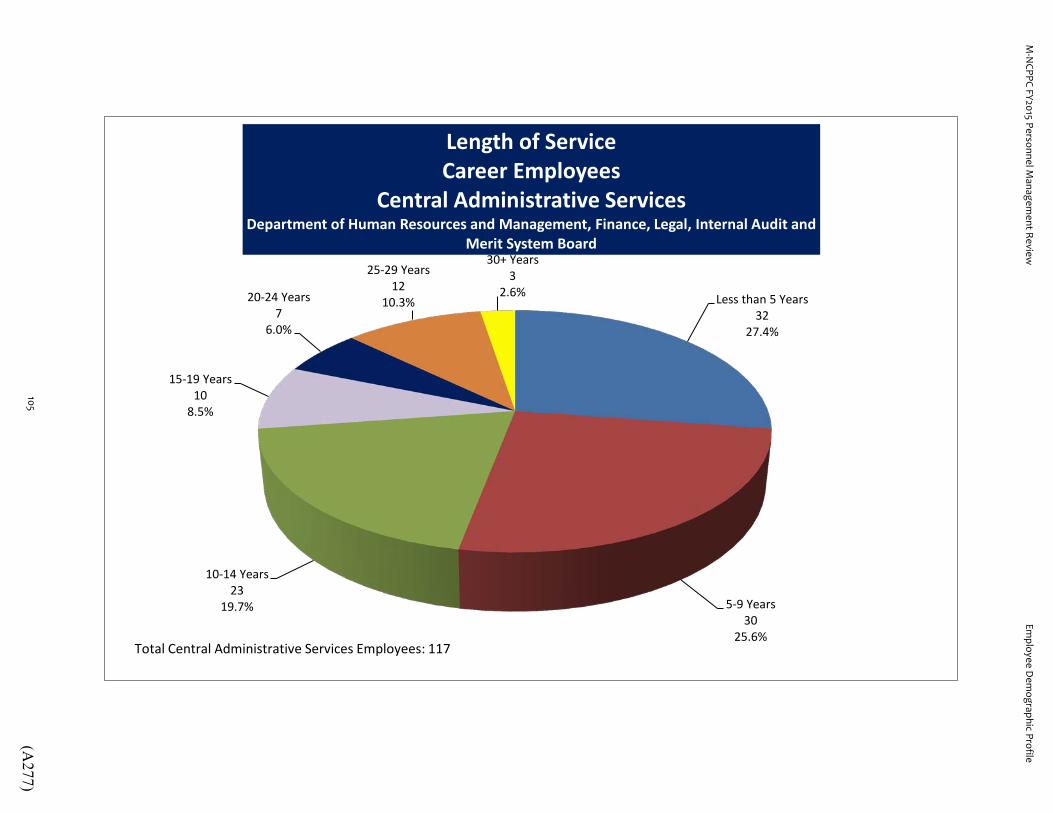
Less than 5 Years 32
27.4%
5-9 Years 30
25.6%
10-14 Years 23
19.7%
15-19 Years 10
8.5%
20-24 Years 7
6.0%
25-29 Years 12
10.3%
30+ Years 3
2.6%
Length of Service Career Employees
Central Administrative Services Department of Human Resources and Management, Finance, Legal, Internal Audit and
Merit System Board
Total Central Administrative Services Employees: 117
M-N
CPPC FY2015 Personnel Managem
ent ReviewEm
ployee Dem
ographic Profile
105(A
277)

0
5
10
15
20
25
30
35
40
45
50
$40-$49 $50-$59 $60-$69 $70-$79 $80-$89 $90 and Over
3
9
14
20 19
50
Num
ber o
f Em
ploy
ees
Thousands
Salary Range Career Full-Time
Central Administrative Services Department of Human Resources and Management, Finance, Legal, Internal Audit and Merit System Board
Total Central Administrative Services Full-Time Employees: 115 Average Salary: $89,742 Excludes Part-Time Employees
M-N
CPPC FY2015 Personnel Managem
ent ReviewEm
ployee Dem
ographic Profile
106(A
278)
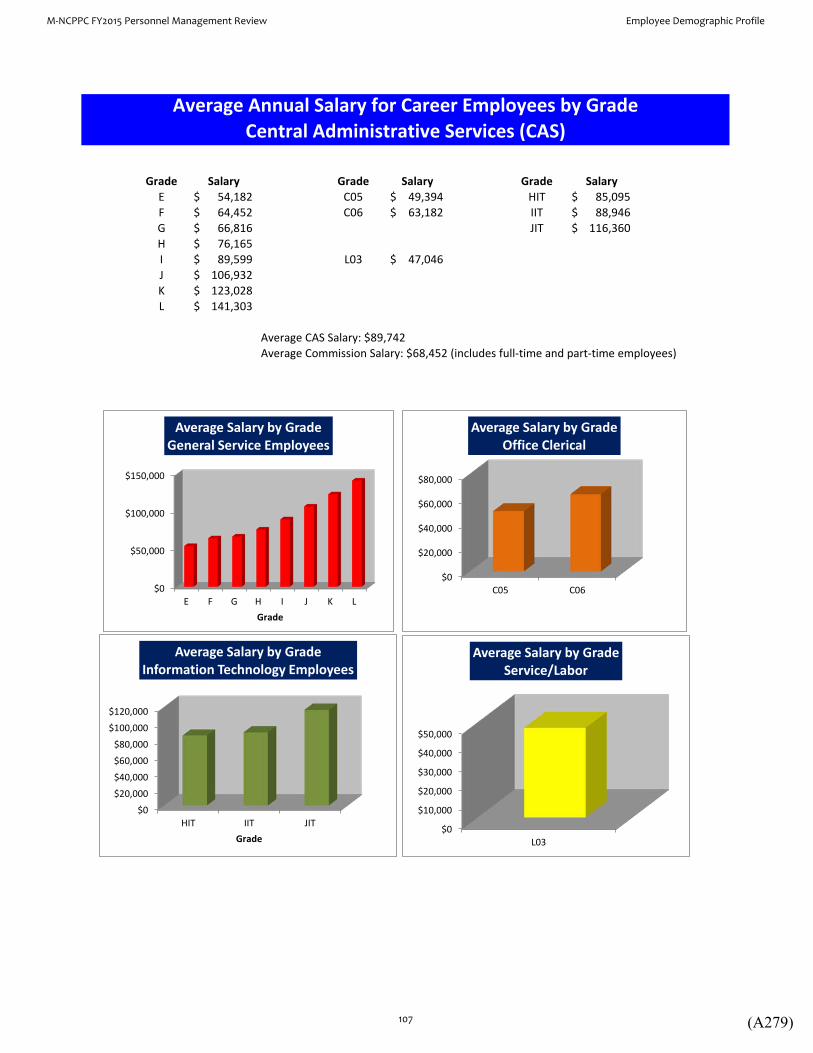
Grade Salary Grade Salary Grade SalaryE 54,182$ C05 49,394$ HIT 85,095$ F 64,452$ C06 63,182$ IIT 88,946$ G 66,816$ JIT 116,360$ H 76,165$ I 89,599$ L03 47,046$ J 106,932$ K 123,028$ L 141,303$
Average CAS Salary: $89,742Average Commission Salary: $68,452 (includes full-time and part-time employees)
Average Annual Salary for Career Employees by GradeCentral Administrative Services (CAS)
$0
$50,000
$100,000
$150,000
E F G H I J K LGrade
Average Salary by Grade General Service Employees
$0
$20,000
$40,000
$60,000
$80,000
$100,000
$120,000
HIT IIT JITGrade
Average Salary by Grade Information Technology Employees
$0
$20,000
$40,000
$60,000
$80,000
C05 C06
Average Salary by Grade Office Clerical
$0
$10,000
$20,000
$30,000
$40,000
$50,000
L03
Average Salary by Grade Service/Labor
M-NCPPC FY2015 Personnel Management Review Employee Demographic Profile
107 (A279)

Admin Support ProfessionalsNo. of Employees 2 4
0
0.5
1
1.5
2
2.5
3
3.5
4
4.5
Employee Turnover by Employment Category Central Administrative Services
Total Central Administrative Services Employees: 117 Central Administrative Services employee separations in FY15: 6 Turnover Percentage: 5.1%
M-N
CPPC FY2015 Personnel Managem
ent ReviewEm
ployee Dem
ographic Profile
108(A
280)

Active Seasonal/Intermittent 5057
98.8%
Active Temporary Contract 9
0.2%
Active Term Contract 52
1.0%
Non-Career Employees by Type
Total Non-Career Employees: 5,118
M-N
CPPC FY2015 Personnel Managem
ent ReviewEm
ployee Dem
ographic Profile
109(A
281)
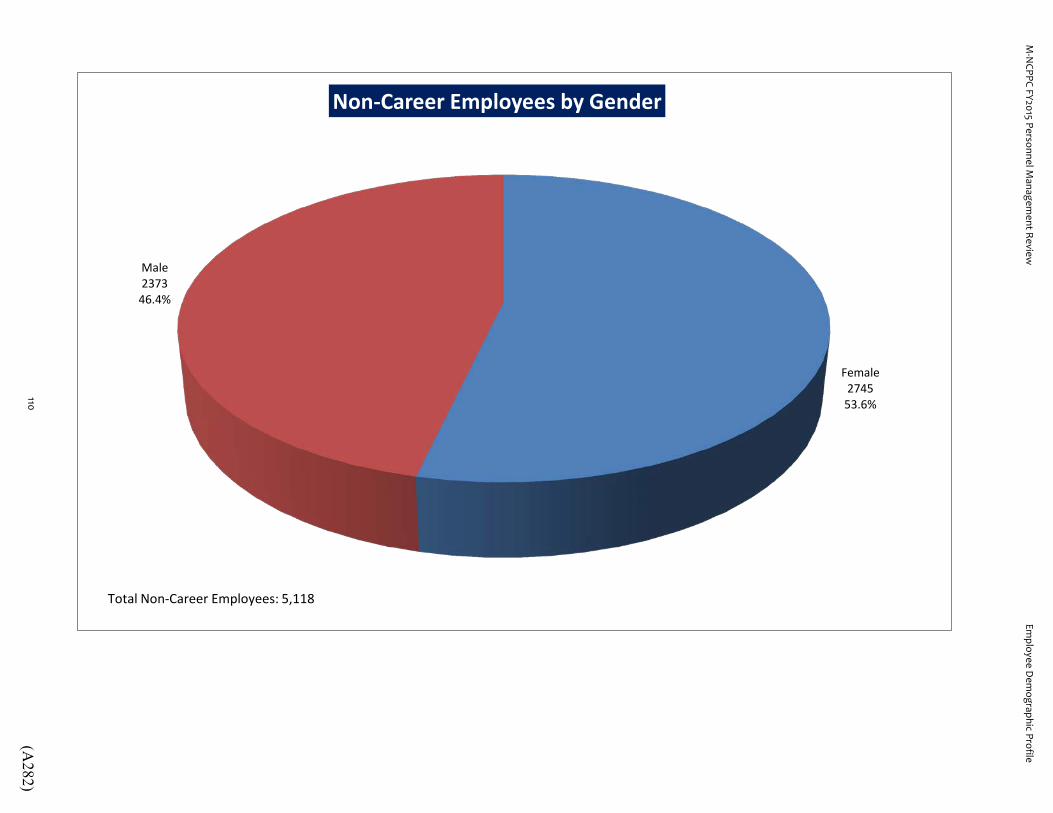
Female 2745
53.6%
Male 2373
46.4%
Non-Career Employees by Gender
Total Non-Career Employees: 5,118
M-N
CPPC FY2015 Personnel Managem
ent ReviewEm
ployee Dem
ographic Profile
110(A
282)

Black 3868 76%
American Indian 16 0%
Asian 87 2%
Hispanic 207 4%
White 940 18%
Non-Career Employees by Race/Ethnicity
Total Non-Career Employees: 5,118
M-N
CPPC FY2015 Personnel Managem
ent ReviewEm
ployee Dem
ographic Profile
111(A
283)

Non Career Employees Distribution by Grade by Pay Schedule Assignment
0100200300400500600700800900
1000
N01 N02 N03 N04 N05 N07 N08 N10 N11 N12 N13 N14 N15Employees 451 424 506 460 923 785 268 1 311 2 333 7 129
Distribution by Grade Intermittent Pay Schedule
0
50
100
150
200
250
300
A02 A03 A04 A05 A06Employees 7 284 74 15 80
Distribution by Grade Aquatics Pay Schedule
M-NCPPC FY2015 Personnel Management Review Employee Demographic Profile
112 (A284)

Non Career Employees Distribution by Grade by Pay Schedule Assignment
0
0.5
1
1.5
2
GIT JITEmployees 1 2
Distribution by Grade Special Salary Range Pay Schedule for Select Career IT Positions
0
5
10
15
20
C D E F G H I J KEmployees 5 5 2 8 16 6 9 2 2
Distribution by Grade General Schedule Pay Schedule Temporary and Term Contract
M-NCPPC FY2015 Personnel Management Review Employee Demographic Profile
113 (A285)

CIGNA EPO 3
15.0%
UnitedHealthCare EPO 17
85.0%
Non-Career (Term) Employee Medical Health Plan Participation
M-N
CPPC FY2015 Personnel Managem
ent ReviewEm
ployee Dem
ographic Profile
114(A
286)
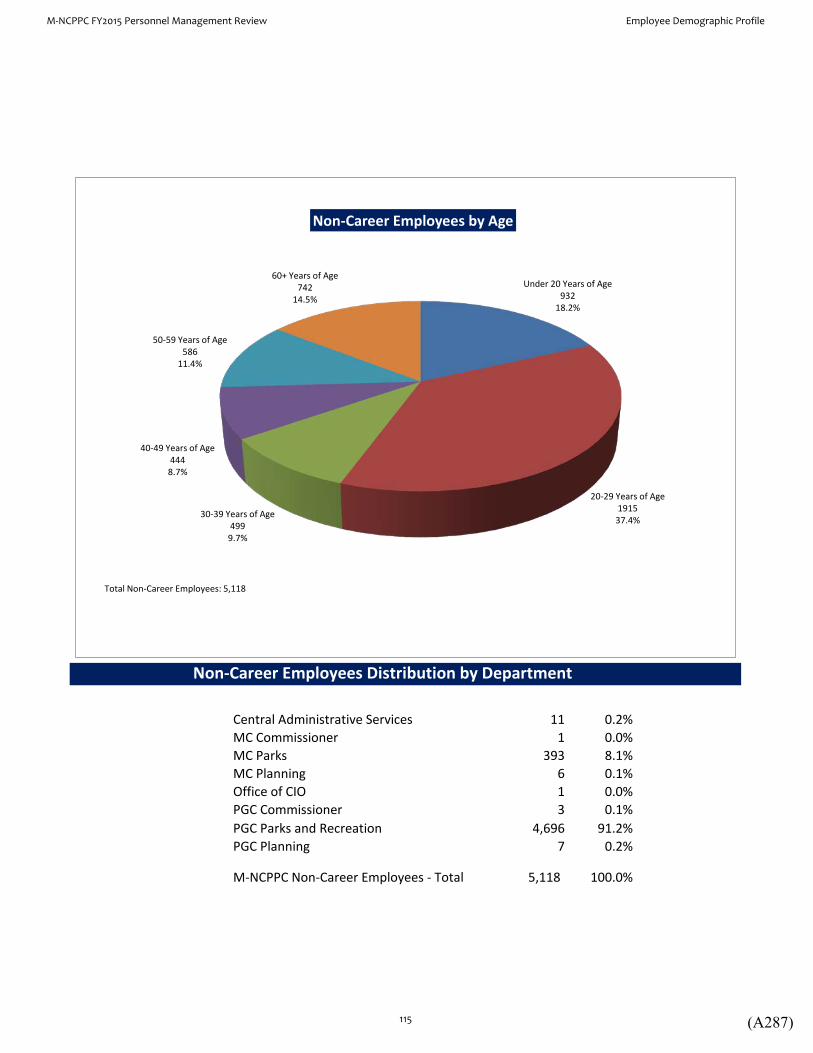
Central Administrative Services 11 0.2%MC Commissioner 1 0.0%MC Parks 393 8.1%MC Planning 6 0.1%Office of CIO 1 0.0%PGC Commissioner 3 0.1%PGC Parks and Recreation 4,696 91.2%PGC Planning 7 0.2%
M-NCPPC Non-Career Employees - Total 5,118 100.0%
Non-Career Employees Distribution by Department
Under 20 Years of Age 932
18.2%
20-29 Years of Age 1915
37.4% 30-39 Years of Age 499
9.7%
40-49 Years of Age 444
8.7%
50-59 Years of Age 586
11.4%
60+ Years of Age 742
14.5%
Non-Career Employees by Age
Total Non-Career Employees: 5,118
M-NCPPC FY2015 Personnel Management Review Employee Demographic Profile
115 (A287)

Excerpt from U.S. Equal Employment Opportunity Commission’s EEOC Form 164, State and Local Government Information (EEO-4), Instruction Booklet.
RACE/ETHNIC IDENTIFICATION
An employer may acquire the race/ethnic information necessary for this section either by visual surveys of the work force, or from post-employment records as to the identity of employees. Since visual surveys are permitted, and the fact that race/ethnic identifications are not present on agency records is not an excuse for failure to provide the data called for. However, although the Commission does not encourage direct inquiry as a method of determining racial or ethnic identity, this method is not prohibited in cases where it has been used in the past, or where other methods are not practical, provided it is not used for purposes of discrimination.
Moreover, the fact that employees may be located at different addresses does not provide an acceptable reason for failure to comply with the reporting requirements. In such cases, it is recommended that visual surveys be conducted for the employer by persons such as supervisors who are responsible for the work of the employees or to whom the employees report for instruction or otherwise.
Please note that the General Counsel of the Commission has ruled, on the basis of court decisions, that the Commission has the authority to require the racial and ethnic identification of employees, regardless of any possible conflicting state or local laws.
The concept of race as used by the Equal Employment Opportunity Commission does not denote clearcut scientific definitions of anthropological origins. For the purposes of this report, an employee may be included in the group to which he or she appears to belong, identifies with, or is regarded in the community as belonging. However, no person may be counted in more than one race/ethnic category.
NOTE: The category "HISPANIC", while not a race identification, is included as a separate race/ethnic category because of the employment discrimination often encountered by this group; for this reason do not include HISPANIC under either "white" or "black".
For the purposes of the report, the following race/ethnic categories will be used:
a. White (not of Hispanic origin): All persons having origins in any of the original peoples of Europe, North Africa, or the Middle East.
b. Black (not or Hispanic origin): All persons having origins in any of the Black racial groups of Africa.
c. Hispanic: All persons of Mexican, Puerto Rican, Cuban, Central or South American, or other Spanish culture or origin, regardless of race.
d. Asian or Pacific Islander: All persons having origins in any of the original peoples of the Far East, Southeast Asia, the Indian Subcontinent, or the Pacific Islands. This area includes, for example, China, India, Japan, Korea, the Philippine Islands, and Samoa.
e. American Indian or Alaskan Native: All persons having origins in any of the original peoples of North America, and who maintain cultural identification through tribal affiliation or community recognition.
M-NCPPC FY2015 Personnel Management Review Employee Demographic Profile
116 (A288)

DESCRIPTION OF JOB CATEGORIES
a. Officials and Administrators: Occupations in which employees set broad policies, exercise overall responsibility for execution of these policies, or direct individual departments or special phases of the agency's operations, or provide specialized consultation on a regional, district or area basis. Includes: department heads, bureau chiefs, division chiefs, directors, deputy directors, controllers, wardens, superintendents, sheriffs, police and fire chiefs and inspectors, examiners (bank, hearing, motor vehicle, warehouse), inspectors (construction, building, safety, rent-and- housing, fire, A.B.C. Board, license, dairy, livestock, transportation), assessors, tax appraisers and investigators, coroners, farm managers, and kindred workers.
b. Professionals: Occupations which require specialized and theoretical knowledge which is usually acquired through college training or through work experience and other training which provides comparable knowledge. Includes: personnel and labor relations workers, social workers, doctors, psychologists, registered nurses, economists, dietitians, lawyers, systems analysts, accountants, engineers, employment and vocational rehabilitation counselors, teachers or instructors, police and fire captains and lieutenants, librarians, management analysts, airplane pilots and navigators, surveyors and mapping scientists, and kindred workers.
c. Technicians: Occupations which require a combination of basic scientific or technical knowledge and manual skill which can be obtained through specialized post-secondary school education or through equivalent on-the-job training. Includes: computer programmers, drafters, survey and mapping technicians, licensed practical nurses, photographers, radio operators, technical illustrators, highway technicians, technicians (medical, dental, electronic, physical sciences), police and fire sergeants, inspectors (production or processing inspectors, testers and weighers), and kindred workers.
d. Protective Service Workers: Occupations in which workers are entrusted with public safety , security and protection from destructive forces. Includes: police patrol officers firefighters, guards, deputy sheriffs, bailiffs, correctional officers, detectives, marshals, harbor patrol officers, game and fish wardens, park rangers (except maintenance), and kindred workers.
e. Paraprofessionals: Occupations in which workers perform some of the duties of a professional or technician in a supportive role, which usually require less formal training and/or experience normally required for professional or technical status. Such positions may fall within an identified pattern of staff development and promotion under a "New Careers" concept. Included: research assistants, medical aides, child support workers, policy auxiliary welfare service aides, recreation assistants, homemakers aides, home health aides, library assistants and clerks, ambulance drivers and attendants, and kindred workers.
f. Administrative Support(Including Clerical and Sales): Occupations in which workers are responsible for internal and external communication, recording and retrieval of data and/or information and other paperwork required in an office. Includes: bookkeepers, messengers, clerk-typist, stenographers, court transcribers, hearing reporters, statistical clerks, dispatchers, license distributors, payroll clerks, office machine and computer operators, telephone operators, legal assistants, sales workers, cashiers, toll collectors, and kindred workers.
g. Skilled Craft Workers: Occupations in which workers perform jobs which require special manual skill and a thorough and comprehensive knowledge of the process involved in the work which is acquired through on-the-job training and experience
M-NCPPC FY2015 Personnel Management Review Employee Demographic Profile
117 (A289)
or through apprenticeship or other formal training programs. Includes: mechanics and repairers electricians, heavy equipment operators, stationary engineers, skilled machining occupations, carpenters, compositors and typesetters, power plant operators, water and sewage treatment plant operators, and kindred workers.
h. Service-Maintenance: Occupations in which workers perform duties which result in or contribute to the comfort, convenience, hygiene or safety of the general public or which contribute to the upkeep and care of buildings, facilities or grounds of public property. Workers in this group may operate machinery. Includes: chauffeurs, laundry and dry cleaning operatives, truck drivers, bus drivers, garage laborers, custodial employees, gardeners and groundkeepers, refuse collectors, construction laborers, park rangers (maintenance), farm workers (except managers), craft apprentices/trainees/helpers, and kindred workers.
M-NCPPC FY2015 Personnel Management Review Employee Demographic Profile
118 (A290)
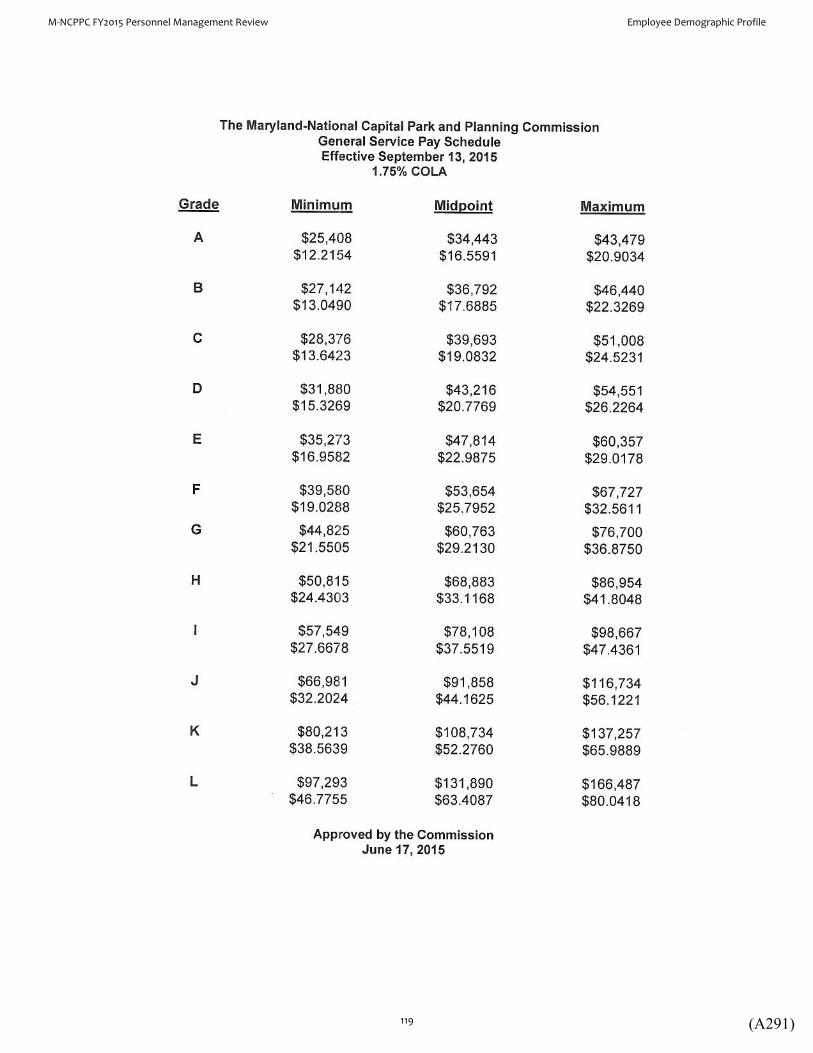
M-NCPPC FY2015 Personnel Management Review Employee Demographic Profile
119 (A291)

M-NCPPC FY2015 Personnel Management Review Employee Demographic Profile
120 (A292)
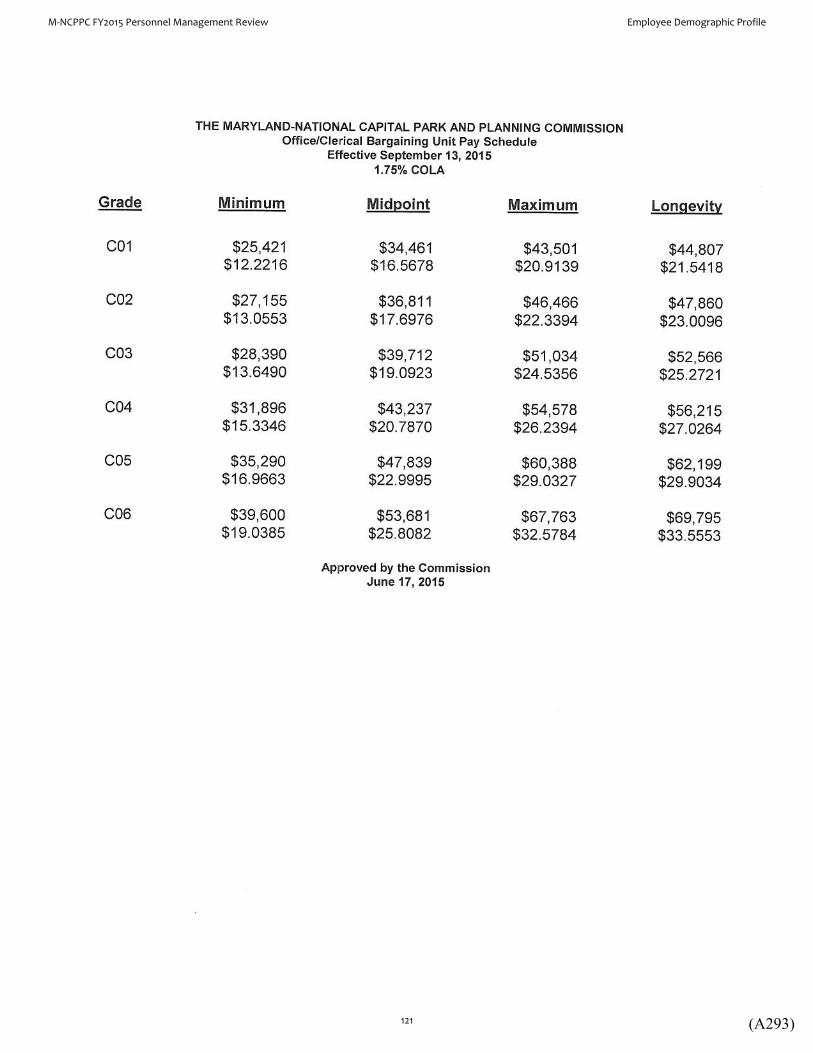
M-NCPPC FY2015 Personnel Management Review Employee Demographic Profile
121 (A293)
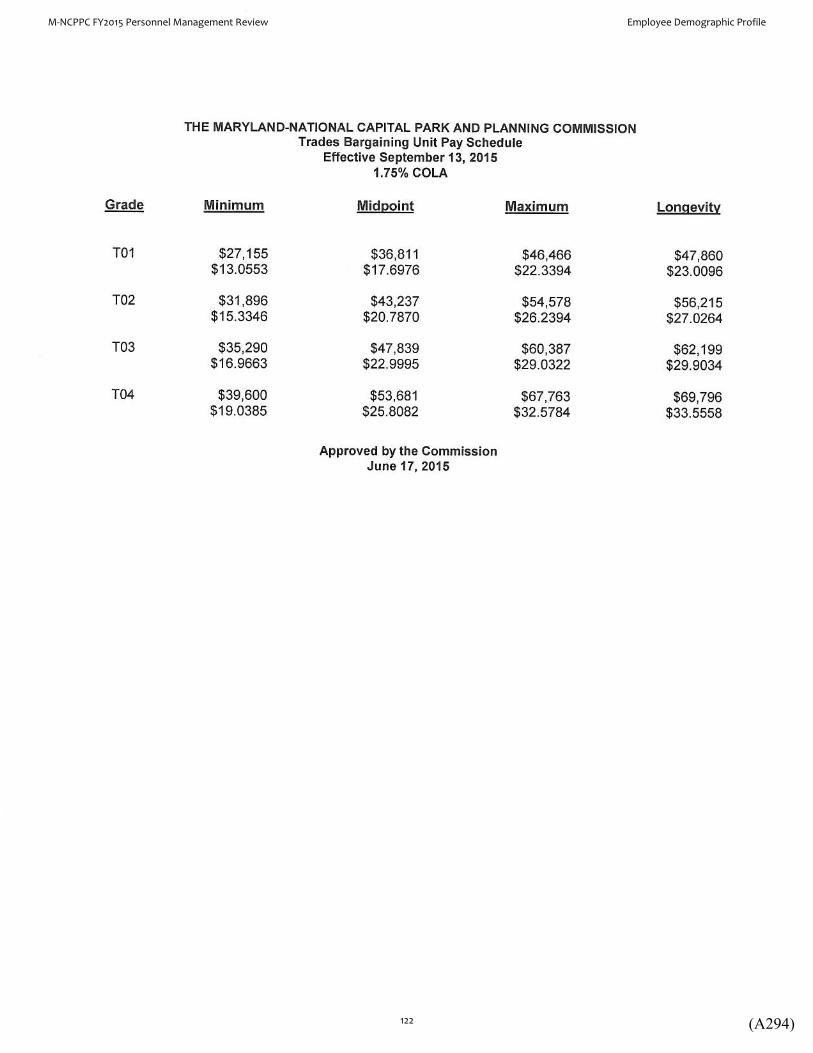
M-NCPPC FY2015 Personnel Management Review Employee Demographic Profile
122 (A294)
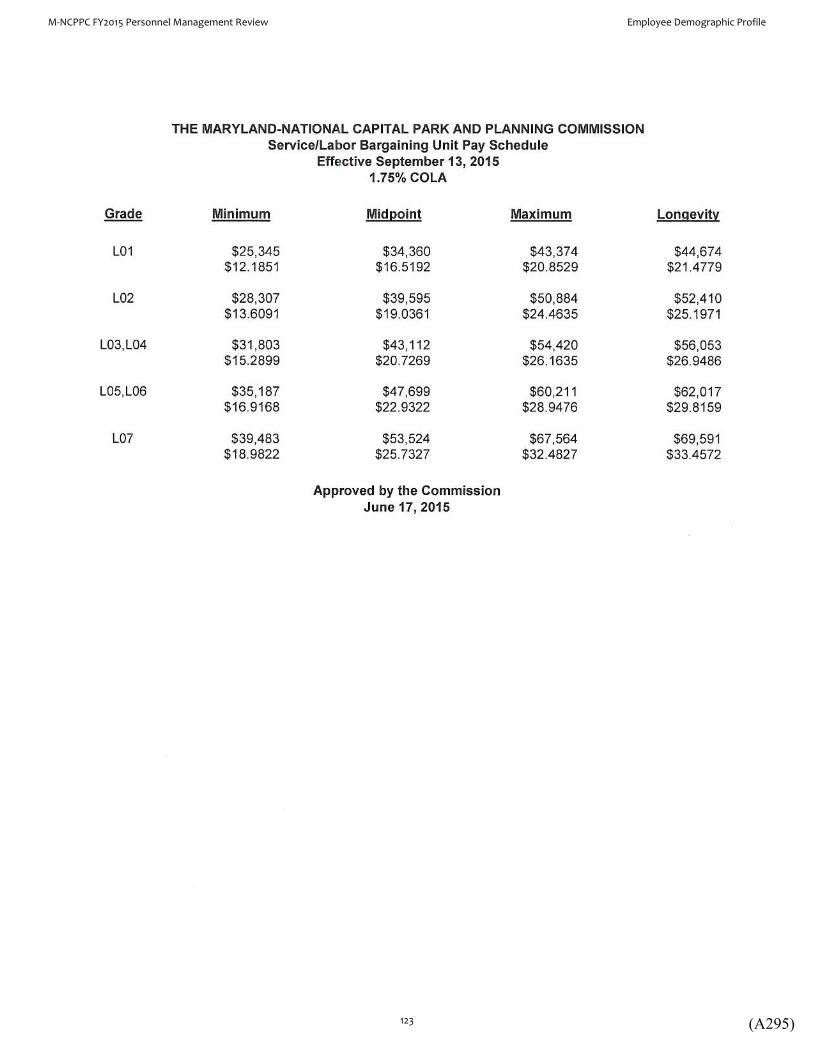
M-NCPPC FY2015 Personnel Management Review Employee Demographic Profile
123 (A295)
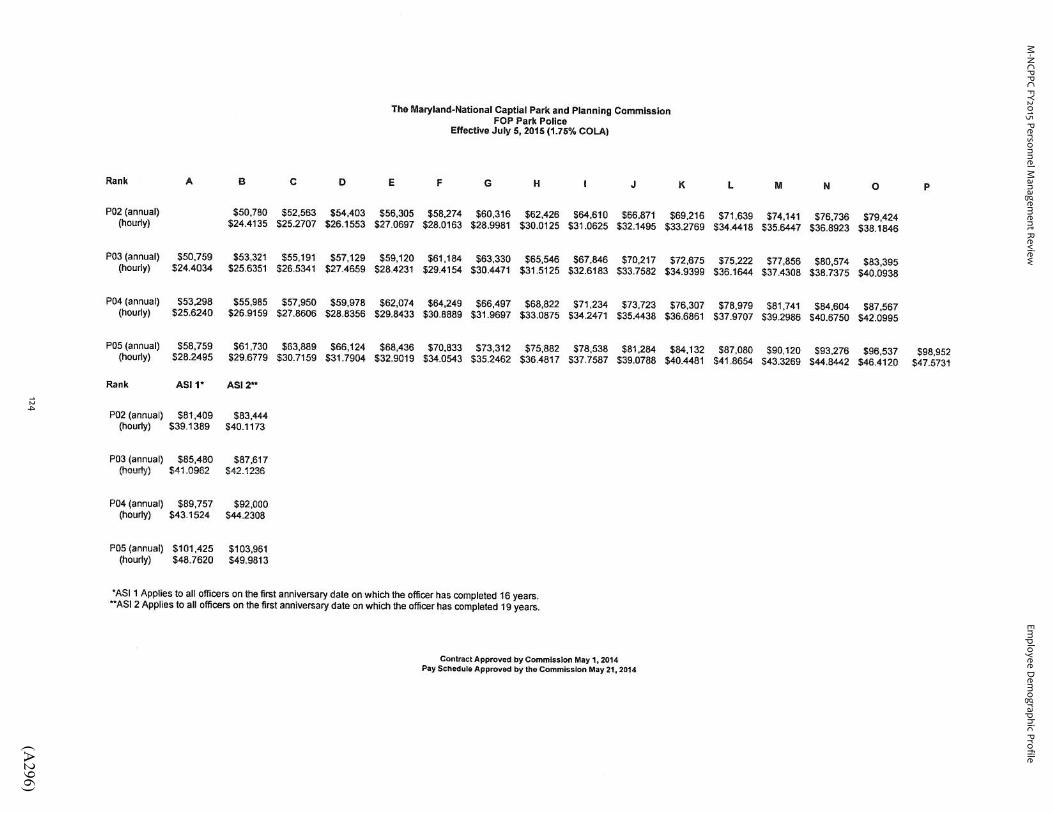
M-N
CPPC FY2015 Personnel Managem
ent ReviewEm
ployee Dem
ographic Profile
124(A
296)

M-NCPPC FY2015 Personnel Management Review Employee Demographic Profile
125 (A297)

M-NCPPC FY2015 Personnel Management Review Employee Demographic Profile
126 (A298)

M-NCPPC FY2015 Personnel Management Review Employee Demographic Profile
127 (A299)

M-NCPPC FY2015 Personnel Management Review Employee Demographic Profile
128 (A300)

M-NCPPC FY2015 Personnel Management Review Employee Demographic Profile
129 (A301)

M-NCPPC FY2015 Personnel Management Review Employee Demographic Profile
130 (A302)