performance measurement and evaluation support … vehicle pilot deployment program overview...
TRANSCRIPT

1 U.S. Department of Transportation
Kate Hartman, Program Manager & ICF/WYDOT Site COR Deepak Gopalakrishna/ICF, Project Manager
Fred M Kitchener/McFarland Management, PM Lead
Performance Measurement and Evaluation Support Plan ICF/Wyoming CV Pilot

2 U.S. Department of Transportation
TODAY’S AGENDA Purpose of this Webinar
□ To share the Performance Measurement and Evaluation Support plan from the ICF/Wyoming team with the stakeholders of connected vehicle technologies.
Webinar Content □ Connected Vehicle Pilot Deployment Program Overview □ ICF/Wyoming Performance Measurement and Evaluation Support Plan □ Stakeholder Q&A □ How to Stay Connected
Webinar Protocol
□ Please mute your phone during the entire webinar □ You are welcome to ask questions via chatbox at the Q&A Section □ The webinar recording and the presentation material will be posted on the CV
Pilots website

CONNECTED VEHICLE PILOT DEPLOYMENT PROGRAM PR
OG
RA
M G
OA
LS
PILOT SITES
ICF/Wyoming DOT
NYCDOT
Tampa (THEA)
Participate in Concept Development Phase Webinars for the three Pilot Sites (see website for exact dates and times)
Visit Program Website for Updates: http://www.its.dot.gov/pilots Contact: Kate Hartman, Program Manager, [email protected]
Feb 2016 Mar 2016 Apr 2016 May 2016 Jun 2016 Jul 2016 Aug 2016
STAY
CO
NN
ECTE
D
Concept of Operations Webinars
Performance Measurement Webinars
Comprehensive Deployment Plan Webinars

4 U.S. Department of Transportation
Project Overview
Deepak Gopalakrishna - ICF

6 U.S. Department of Transportation
High Crash Rates
• Winter crash rate (October to April) has been found to be 3 to 5 times as high as the summer crash rates
• Speed management is critical
195 184 176 144
240 234
329
176
109
247 202
65 80 71 75 73 67 67 69 69 79 77
APR
15,
200
1 -
APR
14,
200
2
APR
15,
200
2 -
APR
14,
200
3
APR
15,
200
3 -
APR
14,
200
4
APR
15,
200
4 -
APR
14,
200
5
APR
15,
200
5 -
APR
14,
200
6
APR
15,
200
6 -
APR
14,
200
7
APR
15,
200
7 -
APR
14,
200
8
APR
15,
200
8 -
APR
14,
200
9
APR
15,
200
9 -
APR
14,
201
0
APR
15,
201
0 -
APR
14,
201
1
APR
15,
201
1 -
APR
14,
201
2
Cra
sh F
requ
ency
Reported Crashes from April 15, 2001 to April 14, 2012 by Season (MP 238 - 291)
Winter
4/13/2014 - Between Laramie and Rawlins - Speeds reduced to 45 mph in VSL zone – 0 Fatalities - 70+ vehicles 4/15/2015 - Between Cheyenne and Laramie - Speeds reduced to 45 mph in VSL zone – 0 Fatalities - 65+ vehicles 4/20/2015 - Between Laramie and Rawlins - Speeds 75 mph (no VSL available) – 2 Fatalities - 65+ vehicles

8 U.S. Department of Transportation
Five Focus Areas Manage following speed and distance between vehicles by alerting trucks to slowing
traffic ahead to prevent multiple-vehicle crashes.
Provide custom alerts and advisories for vehicles that are at risk due to their weight, profile or traveling speeds due to high-winds, near work zones, include alerting drivers if their vehicles are too tall for bridges.
Provide location-based parking information with a focus on directing drivers to safe parking areas in the event of a road closure.
Allow first responders to be notified of a crash automatically based on vehicle metrics, such as airbag deployment.
Use data collected from vehicle’s weather sensors such as the status of windshield wipers and if anti-lock brake systems are activated. This information will be used to develop advisories and forecasts for travel to fleet management centers and the general public.
10 U.S. Department of Transportation
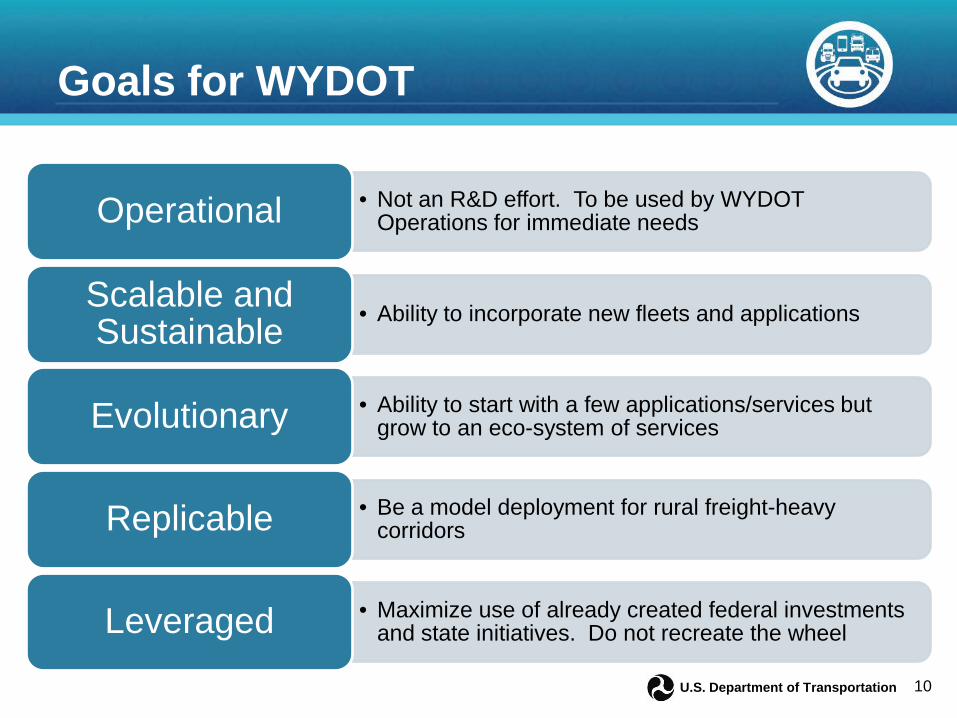
Goals for WYDOT
• Not an R&D effort. To be used by WYDOT Operations for immediate needs Operational
• Ability to incorporate new fleets and applications Scalable and Sustainable
• Ability to start with a few applications/services but grow to an eco-system of services Evolutionary
• Be a model deployment for rural freight-heavy corridors Replicable
• Maximize use of already created federal investments and state initiatives. Do not recreate the wheel Leveraged

11 U.S. Department of Transportation
Physical Architecture
Vehicle OBUs
Back-Office
Fleet Vehicles
Commercial Trucks
Snow Plow
Operational Data Environment (ODE)
PikAlert System
WYDOT Data Broker
WTI
CVOP
TRAC
RCRS
Third Party
WYDOT Data Warehouse
USDOT SCMS
Short Range CommunicationsWide Area
CA
NWS/WFO
IC
511 App
Center to Center
RSUHighway
Patrol
USDOT Situation Data Warehouse
WYDOT TeleCom
RemoteTeleCom
XXX External Interface

12 U.S. Department of Transportation
CV Pilot Performance Measures
Fred M. Kitchener - McFarland Management

13 U.S. Department of Transportation
PMs Are Represented in 9 Categories Road Weather
Condition Input TMC Information Dissemination
Vehicle/Roadside Alerts & Advisories Outcomes
Improve road weather condition reports
received into the TMC
Reduce vehicle crashes
Efficiently disseminate broad area traveler
information
Effectively transmit and receive V2V
messages
Improve speed adherence and reduce
speed variation
Improve ability of the TMC to generate
alerts and advisories
Effectively disseminate and
receive I2V or V2I alert/advisory
messages from TMC
Improve information to commercial vehicle
fleet managers
Automate emergency notifications of a crash

14 U.S. Department of Transportation
Performance Measures
Improve road weather condition reports
received into the TMC
Improve ability of the TMC to generate
alerts and advisories
1. Number of road weather condition reports per road segment/day pre and post CV Pilot (quantity)
2. Miles with at least one reported road condition per hour pre and post CV Pilot (coverage)
3. Average refresh time of road condition reports in each segment pre and post CV Pilot (latency)
Efficiently disseminate broad area traveler
information
5. TMC staff time to disseminate broad area traveler information. Activities include log/process road condition reports and activate/update VSL, DMS, and HAR systems
6. Qualitative improvements in 0-6 hour road weather forecasting accuracy due to enhanced road condition data
4. Pikalert™ generated alerts and advisories that were accepted by TMC operators

15 U.S. Department of Transportation
Performance Measures
7. Alerts/advisories sent from the TMC and received by the RSU 8. Alerts/advisories sent and received between the RSU and OBU 9. Connected vehicles that took action following receipt of an alert
a. Parked b. Reduced Speed c. Came to a stop safely d. Detoured
Effectively disseminate and
receive I2V or V2I alert/advisory
messages from TMC
Improve information to commercial vehicle
fleet managers
10. Number of operational changes made by fleet managers due to information from TMC during CV Pilot
a. Routing b. Timing c. Parking availability d. Canceled trips
11. Commercial vehicle managers are satisfied with information provided by the TMC during the CV Pilot
a. Road conditions b. Road weather forecasts c. Parking information

16 U.S. Department of Transportation
Performance Measures
12. V2V alerts properly received in surrounding vehicles from sending vehicle
13. Connected vehicles that took action following receipt of a V2V alert
a. Parked b. Reduced Speed c. Came to a stop safely d. Detoured
14. Number of emergency notifications that are first received in the TMC from connected vehicles (compared to alternate traditional methods, such as 911 caller)
Effectively transmit and receive V2V
messages
Automate emergency notifications of a crash

17 U.S. Department of Transportation
Performance Measures 15. Total vehicles traveling at no more than 5 mph over the posted
speed (compare before and after CV Pilot) 16. Total vehicles traveling within +/- 10 mph of 85th percentile
speed (compare before and after CV Pilot) 17. Speed of applicable connected vehicles are closer to posted
speed when compared to non-connected vehicles
Improve speed adherence and reduce
speed variation
18. Reduction of total and truck crash rates of along the corridor * 19. Reduction of the number of vehicles involved in a crash * 20. Reduction of total and truck crash rates within a work zone
area * 21. Reduction of critical (fatal or incapacitating) total and truck
crash rates in the corridor * 22. Number of connected vehicles involved in a crash
a. Initial crashes b. Secondary crashes
Reduce vehicle crashes
* Compare a 5-year average before Pilot to CV Pilot data and track connected versus non-connected vehicles

18 U.S. Department of Transportation
ICF Wyoming CV Pilot Confounding Factors

19 U.S. Department of Transportation
Confounding Factors CV Technology Penetration Rate
□ 400 – 500 connected vehicles – known location and time □ Estimate penetration rate – support understanding evaluation results □ Simulation modeling will provide additional insights
CV Technology Adoption □ New technology = CHANGE (process, equipment, etc.) □ Myriad agencies, users, stakeholders □ Significant system training, follow-up □ Qualitative assessments will help to understand technology adoption
Freight and Passenger Vehicle Demand
□ Freight demand dependent on economic conditions, fuel prices, construction, etc. □ Alternate routes are generally not practical □ Numbers of trucks and cars will be tracked throughout demonstration

20 U.S. Department of Transportation
Confounding Factors Weather Condition Variability
□ Need to conduct evaluation analysis during like conditions □ Before/after and with/without analysis methods □ Weather events will be logged and categorized (baseline and demonstration) □ Data comparisons will be for like weather events
Availability of Sensing in the Corridor □ Weather, speed sensing – focused in VSL corridors (35% of corridor) □ Roughly 6-7 mile spacing (heavily instrumented Interstate corridor) □ Supplement: Proposing mobile sensor trailers (budget permitting)
Limited Duration of Evaluation Activities
□ Primarily focus on weather events – mostly winter seasons □ Aggressive project schedule allowing for two evaluation periods ▪ 2017-2018 winter season ▪ 2018-2019 winter season

21 U.S. Department of Transportation
ICF/Wyoming CV Pilot Impact Evaluation Design

22 U.S. Department of Transportation
Five Evaluation Designs Before – After
□ Comparison of pre and post deployment □ Key: documented baseline (planned in Phase II)
With – Without □ Compare with and without technology deployment during same conditions ▪ Equipped vehicles compared to non-equipped vehicles at same time, location
System Performance □ Evaluate how well system worked ▪ Alerts/advisories created, sent, received (I2V, V2I, V2V)
Behavior Assessment □ Measure driver’s actions that result from CV technology application
Qualitative Assessment □ Surveys and Interviews with key stakeholders □ Supplemental to quantitative analyses ▪ Learn details regarding perceptions, likes/dislikes, and the why, when, and how’s

23 U.S. Department of Transportation
Evaluation Design Application Evaluation Category
Before – After
With – Without
System Performance
Behavior Assessment
Qualitative
Improved road weather reports
Improved alerts - advisories
Disseminated broad area Traveler info
Sent, received V2I alerts-advisories
Information to CVO fleet managers
Sent, received V2V alerts-advisories
Automated emergency notifications
Improved speed adherence/variation
Reduced vehicle crashes

24 U.S. Department of Transportation
Contextual Performance Measurement Data Connected Vehicle Location at all times (time, location, direction)
Estimated connected vehicle penetration rate
Weather event and road condition characteristics at all times
Alert/advisory message details (number, type, content, time stamp, and location)
Connected vehicle incidents
Equipment reliability and up-time

25 U.S. Department of Transportation
Importance of Establishing Baseline
Many PMs will use Before-After evaluation design method
Establishing a baseline (prior to CV technology deployment) is essential to successful evaluation □ Phase II activity
Examples of baseline data □ Traffic characteristics – truck and cars □ Road weather condition reports □ TMC operator time to conduct key actions □ Baseline surveys of key stakeholders □ Vehicle speed, speed variation □ 5-year history of crash data

26 U.S. Department of Transportation
ICF/Wyoming CV Pilot Data Collection Plan

27 U.S. Department of Transportation
Data Collection Data types
□ System □ Non-System □ Survey □ Modeling and simulation □ Interview
Frequency of data collect is dependent on type and system
Stored in WYDOT Data Warehouse
Baseline data collection
Data available to evaluate Performance Measures

28 U.S. Department of Transportation
Data Types
Data Type Elements
System BSMs, alerts/advisories, RSU logs, DSRC logs, OBU logs, PikAlert logs, TMC logs, WTI updates, crash notifications, partner fleet manager data, security breaches, mobile road weather observations, other connected vehicle alerts
Non-System Traffic data, crash records, road closures, RWIS data, DMS logs, Construction and maintenance event logs
Survey Participant survey results pre and post deployment
Model and Simulation VISSIM simulation model results, UW driver simulator analysis results
Interviews Stakeholder interview results pre and post deployment

29 U.S. Department of Transportation
ICF/Wyoming CV Pilot Performance Reporting
and Data Sharing

30 U.S. Department of Transportation
Data Sharing System performance data will be shared with USDOT and
Independent Evaluator on a regular basis □ System data – as appropriate □ Crash and other outcome data – seasonally, focused on weather events
Templates and dashboards will be created for efficient data sharing □ USDOT and Independent Evaluator
Appropriate data will be uploaded to RDE at appropriate times during the Pilot

31 U.S. Department of Transportation
ICF/Wyoming CV Pilot Next Steps

32 U.S. Department of Transportation
Schedule and Next Steps
Complete Phase 1 activities – Deployment Plan Baseline data collection and documentation Revise Performance Measurement and Evaluation Support Plan Execute during demonstration
□ 2017 – 2018 winter – WYDOT and TriHydro vehicles □ 2018 – 2019 winter – add other commercial vehicle partners
ActivityPhase II - Document Baseline Conditions - Support System Design and Build Activities - Revise PM & ES Plan, with baseline
Phase III - Execute PM & ES Plan - Data Collection - Data Management/Performance Reporting - Prepare Performance Measurement Report
Q4Q2 Q3 Q4 Q1 Q2 Q32016 2017 2018 2019Q4 Q1 Q2 Q3 Q4 Q1
Next Steps

33 U.S. Department of Transportation
STAKEHOLDER Q&A Please keep your phone muted
Please use chatbox to ask questions
Questions will be answered in the order in which they were received

34 U.S. Department of Transportation
STAY Connected Contact for CV Pilots Program:
Kate Hartman, Program Manager [email protected]
Join us for the Getting Ready for Deployment Series Discover more about the CV Pilot
Sites Learn the Essential Steps to CV
Deployment Engage in Technical Discussion
Website: http://www.its.dot.gov/pilots Twitter: @ITSJPODirector Facebook: https://www.facebook.com/USDOTResearch
CV Pilot Sites’ Performance Measurement Webinars
• 6/6/2016, 2:00 pm – 3:00 pm ET ICF/WYDOT Performance Measurement Webinar
• 6/6/2016, 3:30 pm – 4:30 pm ET NYCDOT Performance Measurement Webinar
• 6/7/2016, 12:00 pm – 1:00 pm ET Tampa (THEA) Performance Measurement Webinar
Please visit the CV pilots website for the recording and the briefing material of the previous webinars.