performance measurement systems in logistics organizations
TRANSCRIPT

Performance measurement systems in logistics organizations:
Design, usage, and impact on organizational capabilities and competitiveness
Andreas Bühler
Inaugural dissertation for obtaining the academic degree Doctor rerum politicarum (Dr. rer. pol.)
WHU – Otto Beisheim School of Management
November 2013 First Advisor: Prof. Dr. Carl Marcus Wallenburg Second Advisor: Prof. Dr. Dr. h.c. Jürgen Weber


I
Overview of Content
1 Introduction ......................................................................................................................... 1
2 Performance measurement systems in logistics: Impact on capabilities and performance. 9
3 Using performance measurement systems in logistics organizations in the era of
turbulence .......................................................................................................................... 32
4 The state of performance measurement systems in logistics practice: Patterns and
outcomes ........................................................................................................................... 52
5 Concluding remarks .......................................................................................................... 74
6 References ......................................................................................................................... 82
7 Appendix ........................................................................................................................... 98

II
Table of Content
1 Introduction ......................................................................................................................... 1
1.1 Problem exposition ..................................................................................................... 2
1.2 Outline of the dissertation .......................................................................................... 7
2 Performance measurement systems in logistics: Impact on capabilities and performance. 9
2.1 Introduction .............................................................................................................. 10
2.2 Research framework ................................................................................................. 11
2.2.1 Conceptualizing PMS excellence ......................................................................... 11
2.2.2 Conceptual model and hypotheses ....................................................................... 15
2.3 Methodology and scale development ....................................................................... 21
2.3.1 Sample design and characteristics ........................................................................ 21
2.3.2 Measurement scales .............................................................................................. 22
2.3.3 Model and scale analysis ...................................................................................... 24
2.3.4 Validation of second-order construct ................................................................... 26
2.4 Hypothesis test results .............................................................................................. 26
2.5 Discussion and implications ..................................................................................... 28
2.5.1 Theoretical implications ....................................................................................... 28
2.5.2 Managerial implications ....................................................................................... 29
2.6 Limitations and future research ................................................................................ 30
3 Using performance measurement systems in logistics organizations in the era of
turbulence .......................................................................................................................... 32
3.1 Introduction .............................................................................................................. 33
3.2 Conceptual framework and hypotheses .................................................................... 34
3.2.1 An organizational perspective on SCRM ............................................................. 35
3.2.2 Upper management’s role in PMS design for turbulence .................................... 36
3.2.3 Development of hypotheses ................................................................................. 37
3.3 Methodology ............................................................................................................ 42
3.3.1 Sample design and characteristics ........................................................................ 42
3.3.2 Measurement scales .............................................................................................. 44
3.3.3 Controls ................................................................................................................ 45
3.4 Results ...................................................................................................................... 46
3.5 Discussion and implications ..................................................................................... 47
3.5.1 Theoretical implications ....................................................................................... 47
3.5.2 Managerial implications ....................................................................................... 49
3.6 Limitations and future research ................................................................................ 50

III
4 The state of performance measurement systems in logistics practice: Patterns and
outcomes ........................................................................................................................... 52
4.1 Introduction .............................................................................................................. 53
4.2 Research framework ................................................................................................. 54
4.2.1 Attributes of advanced PMS design ..................................................................... 54
4.2.2 Associated factors of PMS design ........................................................................ 56
4.3 Methodology ............................................................................................................ 59
4.3.1 Data collection ...................................................................................................... 59
4.3.2 Measurement ........................................................................................................ 59
4.3.3 Data analysis ........................................................................................................ 60
4.4 Empirical results ....................................................................................................... 61
4.4.1 Patterns of PMS design ........................................................................................ 61
4.4.2 Coverage of key performance measures .............................................................. 64
4.4.3 Shippers vs. LSPs ................................................................................................. 66
4.4.4 Market turbulence and PMS design ..................................................................... 67
4.4.5 Outcomes .............................................................................................................. 69
4.5 Discussion and implications ..................................................................................... 71
4.6 Limitations and future research ................................................................................ 72
5 Concluding remarks .......................................................................................................... 74
5.1 Main research findings and contributions ................................................................ 75
5.2 Future research possibilities ..................................................................................... 79
6 References ......................................................................................................................... 82
7 Appendix ........................................................................................................................... 98
Appendix 2-1 ........................................................................................................................ 98
Appendix 2-2 ........................................................................................................................ 99
Appendix 3-1 ...................................................................................................................... 100
Appendix 3-2 ...................................................................................................................... 101
Appendix 3-3 ...................................................................................................................... 101
Appendix 3-4 ...................................................................................................................... 102
Appendix 3-5 ...................................................................................................................... 103
Appendix 4-1 ...................................................................................................................... 104
Appendix 4-2 ...................................................................................................................... 106

IV
List of Figures
Figure 2-1: Conceptual research model ................................................................................... 16
Figure 2-2: Results of structural equation model ..................................................................... 27
Figure 3-1: Conceptual research model ................................................................................... 37
Figure 3-2: Results of structural equation model ..................................................................... 46
Figure 4-1: PMS types and development path ......................................................................... 63
List of Tables
Table 2-1: Dimensions of PMS excellence .............................................................................. 13
Table 2-2: Respondent demographics ...................................................................................... 21
Table 2-3: Second-order PMS excellence construct ................................................................ 25
Table 2-4: Test for discriminant validity .................................................................................. 26
Table 2-5: Fit indices for first and second order model ........................................................... 26
Table 3-1: Respondent demographics ...................................................................................... 43
Table 4-1: Established attributes of advanced PMS design ..................................................... 55
Table 4-2: Respondent demographics ...................................................................................... 59
Table 4-3: PMS types with key characteristics ........................................................................ 61
Table 4-4: Coverage of key performance measures ................................................................. 64
Table 4-5: Cluster shares – Shippers vs. LSPs ......................................................................... 66
Table 4-6: PMS clusters and market turbulence ...................................................................... 67
Table 4-7: Supply chain related PMS design ........................................................................... 68
Table 4-8: PMS design and subjective perceptions of PMS success ....................................... 69
Table 4-9: PMS design and logistics performance ................................................................... 70

1
1 Introduction

2
1.1 Problem exposition
Performance measurement systems (PMS), over the last three decades, have become a
key element of management control systems (MCS) (Henri, 2006b; Malmi and Brown, 2008).
With their origin in the accounting discipline, MCS traditionally focused on formal mecha-
nisms to monitor financial results and provide feedback as part of a cybernetic philosophy
(Hofstede, 1978). In further developing this role to “present managers with financial and non-
financial measures covering different perspectives which, in combination, provide a way of
translating strategy into a coherent set of performance measures” (Chenhall, 2005), PMS has
received considerable attention, with a large number of conceptual contributions across
disciplines. In addition to well-established frameworks such as Lynch and Cross’ (1991)
performance pyramid or Kaplan and Norton’s (1992) balanced scorecard, researchers have
provided an impressive amount of conceptual contributions and recommendations for PMS
design (Neely, 2005). Moreover, the role of PMS in creating competitive advantage has been
investigated both in the accounting literature (e.g. Ittner et al., 2003; Simons, 1990) and in
operations management (e.g. Ghalayini et al., 1997; Evans, 2004). Still, Melnyk et al. (2004),
by stating that “performance measurement continues to present a challenge to operations
managers as well as researchers of operations management” (p. 210), reflect a broad consen-
sus in the PMS research community that further empirical research is required for both
academics and practitioners to understand the contribution of PMS to organizational competi-
tiveness (Gunasekaran and Kobu, 2007).
The logistics discipline, in seeking to employ PMS to control processes and support
decision-making (Fawcett et al., 1997), has taken PMS beyond the definition of a “set of
metrics used to quantify both the efficiency and effectiveness of actions” (Neely et al., 1995,
p. 81). Context-specific frameworks have provided insights into PMS design for logistics and
the selection of logistics performance metrics (e.g. Caplice and Sheffi, 1995; Griffis et al.,
2004). Moreover, with the growing importance of supply chain management in the last decade
(Kouvelis et al., 2006), researchers have called for logistics performance measurement to go
beyond the boundaries of individual organizations (e.g. Gunasekaran et al., 2004; Rafele,
2004). In this regard, Keebler and Plank (2009), in their empirical study of U.S. logistics
organizations with data collected from 1998 to 2000, found that “logistics measurement at a
supply chain level is limited at best” (p. 786).
Overall, compared to the large body of conceptual insights, the share of empirical PMS
research in the logistics and supply chain management literature is rather low (Akyuz and
Erkan, 2010; Gunasekaran and Kobu, 2007). Besides a small number of benchmark investiga-

3
tions on logistics performance measurement practice in the U.S. (Fawcett and Cooper, 1998;
Keebler and Manrodt, 2000; Keebler and Plank, 2009), only few exploratory studies have
been conducted so far. Some notable exceptions are the quantitative studies by Fawcett et al.
(1997) and van Donselaar et al. (1998) as well as case study research by van Hoek (2001),
Schmitz and Platts (2004), and Wouters (2009).
Yet, with highly demanding customers and increasing competitive pressures (Manuj and
Mentzer, 2008), logistics practitioners and researchers require further empirical insights into
the role that PMS can play in increasing the competitiveness of logistics organizations, i.e.
organizations that are primarily involved with logistics activities. Looking at today’s logistics
requirements―including transportation, warehousing, inventory management, order fulfill-
ment, and distribution (Mentzer et al., 2004)―the ongoing outsourcing trend in logistics
(Deepen et al., 2008; Langley et al. 2006) has resulted in a dynamic co-existence of internal
logistics departments of manufacturing and trading companies and logistics service providers
(LSPs) as providers of third party logistics (Selviaridis and Spring, 2007). Internal logistics
departments of manufacturing and trading companies, on the one hand, represent one of many
functions that contribute to their company’s value creation within a larger organizational
context. In manufacturing companies, the overall organizational setup may comprise several,
largely independent logistics organizations like inbound/supply logistics and out-
bound/distribution logistics. During recent years, many logistics departments in manufactur-
ing and trading companies have paved their way from mere support functions to more
strategic functions (McGinnis and Kohn, 2002). LSPs, on the other hand, are "pure players"
with logistics being their core competence (Busse and Wallenburg, 2011; Lai, 2004).
Although an LSP organization will obviously comprise non-logistical support functions like
marketing, sales, accounting, and human resources, logistics services represent their clear
business focus.
Yet, while LSPs and internal logistics departments of manufacturing and trading compa-
nies are characterized by the immanent differences outlined above, managers in both types of
logistics organizations, in designing and using their PMS, will ultimately aim at enhancing the
competitiveness of their logistics activities and hence share the same basic objectives in
performance measurement practice. Although Morgan’s (2004) statement that “survival may
be the difference between a good PMS and a mediocre PMS” (p. 534) is pointedly formulated,
logistics managers in both types of logistics organizations need to bring their PMS to a level
of sophistication which their organization will actually benefit from. Confronted with a
growing body of conceptual PMS knowledge on advanced PMS design but a lack of empirical

4
evidence on the truly relevant aspects of PMS, they need guidance regarding the generally
applicable design attributes that need to be incorporated into their PMS, regardless of their
specific organizational context. This leads to the first research question of this dissertation:
RQ1: Based on prior PMS literature, which design attributes can be identified that dis-
tinguish advanced from less advanced PMS in logistics?
Moreover, while PMS information seeks to fulfill the “needs of managers who must
convert firm resources into customer value more efficiently and effectively” (Fawcett et al.,
1997), the actual contribution of PMS to the competitiveness of logistics organizations, due to
a lack of empirical research, remains somewhat vague. Besides conceptual propositions that
“good performance measures and metrics will facilitate a more open and transparent commu-
nication between people leading to a co-operative supported work and hence improved
organizational performance” (Gunasekaran and Kobu, 2007, p. 2820), only Fawcett et al.
(1997) and Rodrigues et al. (2004) have provided first empirical evidence of the positive
relationship between performance measurement and operational success in logistics. Yet,
given the “paucity of empirical research into the performance impact of measurement
frameworks” (Neely, 2005, p. 1267), it remains mostly unclear how PMS can support
logistics organizations in addressing the challenges that go along with rapidly changing
markets (Gundlach et al., 2006) and the increasing complexity of supply chain processes
(Fawcett and Magnan, 2002) in order to ensure high levels of organizational performance.
In this regard, the accounting literature has provided important empirical findings re-
garding PMS effectiveness, yet not fully clarifying the exact nature of the relationship
between advanced forms of PMS and organizational competitiveness. In extending prior
studies (e.g. Chenhall, 2005; Simons, 1990), Henri (2006b) proposed that “PMS use may not
contribute directly to performance, but instead contribute indirectly through capabilities” (p.
538). Building on these findings and following resource-based theory where capabilities
permit the deployment of resources (Amit and Schoemaker, 1993), logistics researchers and
practitioners require evidence that a superior PMS as a valuable resource translates into
enhanced organizational capabilities and―by using these capabilities to master the challenges
that logistics organizations are facing―competitiveness. This leads to the second research
question of this dissertation:
RQ2: To what extent can a superior PMS help logistics organizations to foster pivotal
organizational capabilities and thereby ultimately logistics performance?
5
One specific challenge that has been widely recognized as a new, major challenge for
logistics organizations in recent years, particularly since the economic and financial crisis, is
demand and supply market turbulence (Braunscheidel and Suresh, 2009). Accordingly, supply
chain risk management (SCRM) has become a dominant research stream in what Christopher
and Holweg (2011) have called the “era of turbulence”. Logistics organizations, in seeking to
ensure a comprehensive risk management while making the monitoring of market turbulence
an integral part of existing management control processes, need to account for corresponding
risk metrics in designing their performance measurement systems. Yet, the potential role of
PMS in supporting logistics organizations to cope with market turbulence has received little
attention within the SCRM domain, and “performance measurement in the new supply era is
still an open area of research” (Akyuz and Erkan, 2010, p. 5137). Overall, research regarding
the role of management control systems in SCRM is particularly scant, though Christopher
and Holweg (2011) have stated that supply chain turbulence “marks a major departure from
current thinking and will require revisiting the management accounting procedures that are
used to evaluate different supply chain decisions” (p. 63). So far, the few propositions that
supply chain risk metrics should be accounted for in PMS design (Rasid et al., 2012; Ritchie
and Brindley, 2007) represent initial ideas and are merely of conceptual nature. Within the
PMS literature, the use of risk metrics to capture the risks related to higher levels of market
turbulence―i.e. PMS design for turbulence―can neither be considered an established design
attribute nor has its relevance been verified empirically.
Regarding the organizational antecedents for the use of risk metrics within a PMS, the
accounting literature suggests that upper management’s focus of PMS use may represent a
factor that influences PMS design and the selection of performance measures (Henri, 2006a).
Here, following established concepts, two distinct types of PMS use that are characterized by
different managerial mindsets are an (interactive) attention-focusing use and a (diagnostic)
score-keeping use (Simon et al., 1954; Simons, 1990). In short, an attention-focusing PMS
use―in aiming at stimulating organizational awareness (Henri, 2006a)―may have different
implications for the use of risk metrics in PMS design than a score-keeping PMS that
primarily seeks to monitor results against expectations (Vandenbosch, 1999). Therefore, and
given the lack of research in this domain, it is important to understand the role of upper
manager’s mindset in driving or impeding PMS design for turbulence.
Overall, both the PMS and the SCRM literature would benefit from an investigation of
the role that PMS can play in supporting logistics organizations in dealing with market
turbulence. This leads to the third research question of this dissertation:

6
RQ3: How can logistics organizations use PMS to cope with increasing levels of mar-
ket turbulence and what is the role of upper management’s control focus in this context?
Despite the importance of performance measurement for logistics organizations and the
challenges in the new supply chain era outlined above (Gunasekaran and Kobu, 2007), little
attempt has been made to empirically investigate how logistics organizations actually design
their PMS in practice and whether they follow researchers’ conceptual recommendations. In
the U.S., Fawcett and Cooper (1998), Keebler and Manrodt (2000), and Keebler and Plank
(2009)―using the same data set as the Keebler and Manrodt (2000) study―investigated the
state of performance measurement, the use of specific performance metrics, and specific
PMS-related outcomes in logistics organizations. In Germany, Weber and Blum (2001)
provided insights into the status quo and effectiveness of logistics control, albeit taking a
broader perspective on management control practice rather than the specific PMS context.
These prior studies only partly focused on PMS as an entity and the implementation of
scholarly recommended design attributes in practice. Therefore, in addition to the cause-and-
effect relationships outlined in the first three research questions, both logistics researchers and
practitioners need to gain a comprehensive understanding of the actual status quo of PMS
design and effectiveness in current logistics practice. Researchers, on the one hand, need to
validate existing PMS knowledge in order to develop an understanding for the robustness of
conceptual findings in practice and to define further research avenues based on the current
state of practice. Logistics managers, on the other hand, in seeking to understand where their
organization stands and how it needs to proceed, require a benchmark of the actual state of
PMS in logistics practice. This leads to the fourth research question of this dissertation:
RQ4: What is the actual state of PMS in logistics practice?
Given the call for more empirically grounded PMS research in logistics and supply
chain management (Gunasekaran and Kobu, 2007; Akyuz and Erkan, 2010), the aim of this
dissertation, in answering the above outlined research questions, is to close theoretical gaps
while gaining valuable insights for logistics managers of both manufacturing companies and
LSPs. In this regard, the academia has debated the supposed conflict between the method-
logical rigor of research and the relevance of results for both theory and practice. Mentzer
(2008), in contributing to the debate, asked: “How can research be good if it is not relevant to
the discipline under study?” (p. 72) while at the same time clearing up the misconception that
rigor and relevance may be contradictory. In line with his assessment, this dissertation’s
relevance―without compromising on methodologically rigorous analyses―was ensured via

7
discussions with both logistics practitioners and researchers before, during, and after data
collection. For this purpose, a group of ten academics and practitioners were first involved in
discussing and challenging the practical relevance of questions during the development of the
online survey. Next, as informants had to be knowledgeable in the research domain and
familiar with the PMS of their respective logistics organization, a key informant approach was
applied (Daugherty et al., 2009). A newsletter mailing of the German Logistics Association
(Bundesvereinigung Logistik, BVL) was used to announce the survey and ask logistics
managers involved in the PMS domain for participation. A link to a registration form was
included in the newsletter mailing. The same link was sent to 3297 potential respondents from
a commercial database, yielding a total of 349 registrations of prospective survey participants
from both mailings. Along with 714 logistics managers from a database collected at the
authors' university that were pre-screened to determine if they met the criteria for our study,
they received a link to the online survey.
Overall, 431 usable data sets―251 from internal logistics departments of manufacturing
companies and 180 from LSPs―were collected and will be described in more detail in the
following chapters. Several discussion forums were used to refine research priorities and to
calibrate research results. After data collection, first results were presented and discussed at an
international conference of the German Logistics Association and at the LM2011 conference.
The discussions were then further detailed in two workshops with logistics practitioners
organized by the University of St. Gallen and WHU – Otto Beisheim School of Management,
respectively. This way, the relevance of results for logistics and supply chain managers was
further validated.
1.2 Outline of the dissertation
In total, this dissertation consists of five main chapters. After the introduction, detailed
investigations of the outlined research questions on PMS in logistics organizations are
conducted in three chapters based on quantitative empirical analyses, followed by a chapter of
concluding remarks.
Chapter 2 addresses research questions 1 and 2. It builds on a cross-disciplinary litera-
ture review of PMS frameworks and conceptual contributions to identify the key design
attributes that constitute an excellent PMS in logistics organizations. In conceptualizing PMS
excellence as the degree to which these attributes are simultaneously incorporated into a PMS,
it uses structural equation modelling to show how PMS that follow these recommendations

8
provide value to logistics organizations. Using a resource-based perspective, the positive
impact of PMS excellence on customer orientation and cross-functional integration as two
pivotal capabilities in logistics organizations and ultimately on logistics performance are
hypothesized and tested. In so doing, this chapter particularly contributes to the limited
empirical research regarding the effectiveness of scholarly recommended PMS design
attributes.
Chapter 3 addresses research question 3 by examining the role of PMS in enabling lo-
gistics organizations to cope with market turbulence as a major source of supply chain risk.
Using structural equation modelling, it outlines how PMS design for turbulence can help
logistics organizations to build organizational resilience―the ability to cope with turbu-
lence―and thus drive distribution service performance. Regarding the antecedents to PMS
design for turbulence, the chapter builds on the accounting literature to investigate upper
management’s role in driving or impeding the use of supply chain risk metrics.
Chapter 4 is primarily descriptive in nature and complements the dissertation by inves-
tigating the current state of PMS in logistics practice, thus addressing research question 4
while building on the concepts of advanced PMS design introduced in chapters 2 and 3. Using
cluster analysis, different PMS design patterns and sophistication levels in logistics organiza-
tions are identified and outlined along their main characteristics. Moreover, tests of difference
and regression analysis are used to relate these patterns to specific context factors and
competitive outcomes and to examine key differences and dependencies. In so doing, this
chapter recapitulates and enhances prior works like Fawcett and Cooper (1998) and Keebler
and Plank (2009).
The dissertation concludes with Chapter 5 which summarizes the overarching insights
and contributions as well as future research possibilities.

9
2 Performance measurement systems
in logistics: Impact on capabilities
and performance1
1 This chapter is based upon the eponymous unpublished manuscript co-authored with Carl Marcus Wallenburg.

10
2.1 Introduction
Rapidly changing markets (Gundlach et al., 2006) and the increasing complexity of to-
day’s supply chains (Malik et al., 2011) impose tremendous challenges on logistics organiza-
tions. They need to increasingly orient themselves toward the customers they are serving
(Gunasekaran et al., 2004) and improve operational efficiency by aligning internal efforts
across functions (Rodrigues et al., 2004). In dealing with such challenges, the role of perfor-
mance measurement systems (PMS) has been widely discussed (Gunasekaran and Kobu,
2007; Mentzer and Firman, 1994). As traditional forms of PMS have been criticized for
failing to adequately address managers’ actual information needs (Fawcett et al., 1997), more
advanced PMS frameworks have emerged in accounting, operations, and logistics to support
decision-making and enhance performance (Griffis et al., 2004; Kaplan and Norton, 1992;
Neely et al., 1995).
In practice, however, it remains unclear what constitutes a truly good PMS. Although
many frameworks for advanced PMS discuss similar design attributes, no consensus regard-
ing the truly relevant aspects of PMS has been reached, and few attempts have been made to
consolidate the existing body of knowledge across disciplines. Moreover, although recent
survey-based studies in management accounting and in operations management have provided
first insights regarding the impact of advanced PMS on organizational performance (Chen-
hall, 2005; Evans, 2004; Ittner et al., 2003), empirical evidence on the positive effects of such
advanced PMS in logistics operations is scant. Only Fawcett et al. (1997) and Rodrigues et al.
(2004) have investigated the relationship between performance measurement and operational
success in logistics, albeit focusing on a limited and context-specific scope of PMS design
attributes. For managers of logistics operations who are facing cost-benefit tradeoffs when
considering investments into PMS, the actual value proposition of advanced PMS as a lever to
enhance logistics performance remains difficult to grasp. They need to gain insight into the
extent to which advanced PMS can help them address the challenges of responding more
effectively to customer needs and to align logistics operations across internal functions.
Corresponding to the above research gaps, the first objective of this research is to pro-
vide a consolidated view of the design attributes that distinguish superior from inferior PMS
in logistics. To do so, the present study first conducts an extensive literature review across
different disciplines to identify PMS excellence as the degree to which these specific design
attributes are incorporated into a PMS. As a valuable resource, an excellent PMS can help
logistics organizations to address the above outlined challenges by enabling increased
customer orientation and cross-functional integration as two pivotal capabilities in logistics

11
operations. Thus, in empirically applying the conceptualization of PMS excellence along a
resource-based perspective, our second objective is to outline that PMS excellence fosters
these two capabilities in logistics organizations, and ultimately enhances logistics perfor-
mance. For this purpose, a new second-order construct to measure PMS excellence in logistics
operations is developed from the literature review.
The remainder of this paper is organized accordingly. Building on the conceptualization
of PMS excellence, we present the hypotheses of our research framework. After describing
our empirical methodology and the hypotheses test results derived from a study of 429
logistics organizations, we discuss implications and identify avenues for future research.
2.2 Research framework
2.2.1 Conceptualizing PMS excellence
Performance measurement systems (PMS) refer to “the set of metrics used to quantify
both the efficiency and effectiveness of actions” (Neely et al., 1995, p. 81). Yet, different
authors have focused on very different focal aspects in their attempt to provide guidance to
the design of PMS. Therefore, the PMS literature does not convey a clear picture of the design
attributes that constitute an excellent PMS that comprehensively supports an organization in
dealing with its strategic and operational challenges. To address this shortcoming, we follow
the call of Ittner et al. (2003, p. 739) that “future studies can also extend our analyses by
examining a broader set of performance measurement system attributes” and provide a
comprehensive conceptualization of the attributes that constitute an excellent PMS in general
and an excellent logistics PMS in particular. To do so, we have conducted an extensive
literature review on the recommended design attributes of advanced PMS in the accounting,
operations, and logistics literature, thereby adopting an approach Auzair and Langfield-Smith
(2005) used for establishing a comprehensive characterization of management control
systems.
Across disciplines, a significant body of literature has examined PMS, with contributions
ranging from broad conceptual PMS frameworks, such as the performance pyramid (Lynch
and Cross, 1991) or the balanced scorecard (Kaplan and Norton, 1992) in management
accounting to context-specific frameworks, such as the performance prism system in opera-
tions management (Neely and Adams, 2000) or function-specific frameworks for supply chain
related performance measurement (Gunasekaran et al., 2004) or the selection of measures in

12
logistics (Griffis et al., 2004; Griffis et al., 2007). Although articles have focused on different
aspects of PMS design and different levels of detail, the identified frameworks often share
several underlying and recurring design attributes to distinguish less sophisticated from more
advanced forms of PMS. An example is the broad consensus across disciplines that both
financial and non-financial measures should be incorporated into a PMS to keep managers
from ignoring relevant performance dimensions (Chenhall, 2005; Neely, 1999). In conceptu-
alizing advanced PMS for empirical research, some authors have examined the use of specific
performance measures along the dimensions of the balanced scorecard (e.g. Henri, 2006b;
Tung et al., 2011) or context-specific measurement dimensions (e.g. Evans, 2004; Fawcett et
al., 1997). Others have limited their inquiries to a single or a few attributes of advanced PMS
design (e.g. Ittner et al., 2003; Rodrigues et al., 2004). Together, while providing important
empirical insights into the impact of specific aspects of PMS design, they have not developed
an exhaustive conceptualization of the design attributes that constitute an excellent PMS.
Recent PMS literature reviews in logistics (Akyuz and Erkan, 2010; Gunasekaran and Kobu,
2007), on the other hand, have focused on outlining prior studies and their content rather than
synthesizing the observable design attributes of an excellent PMS.
Through a detailed analysis of PMS design attributes recurrently suggested across disci-
plines, we have identified the distinct categories shown in Table 2-1, which need to be
incorporated into an excellent PMS for logistics operations. Building on this synthesis of prior
knowledge, we define PMS excellence as the degree to which an organization combines the
following six interconnected dimensions into its PMS: measurement diversity, strategic-
operational linkage, external linkage, information timeliness, information aggregation, and
system adaptability.
Measurement diversity refers to the degree to which a PMS uses a broad set of measures
along all relevant performance dimensions of an organization (Amir et al., 2010; Ittner et al.,
2003). It encompasses the use of multiple, complementary types of measures (Brignall and
Ballantine, 1996; Malina and Selto, 2004) such as financial and non-financial, strategic and
operational, as well as lagging (ex post) and leading (ex ante) measures (Evans, 2004; Malmi
and Brown, 2008). Though some authors have limited measurement diversity to the dimen-
sions of the balanced scorecard in their research (e.g. Henri, 2006; Tung et al., 2011), the
PMS literature, on a generic level, discusses this factor as the comprehensiveness of a PMS
with respect to the measurement information needs in a specific organizational context
(Eccles and Pyburn, 1992; Griffis et al., 2007).

13
Dimensions of PMS excellence Sources from cross-disciplinary literature review
Measurement Diversity Amir et al. (2010); Brignall and Ballantine (1996); Chenhall (2005); Eccles (1991); Evans (2004); Griffis et al. (2007); Henri (2006a); Ittner et al. (2003); Kaplan and Norton (1997); Malina and Selto (2004); Malmi and Brown (2008); Neely et al. (1995); Rodrigues et al. (2004); Tung et al. (2011)
Strategic-Operational Linkage Caplice and Sheffi (1995); Bourne et al. (2000); Chenhall (2005); Dixon et al. (1990); van Donselaar et al. (1998); Fawcett et al. (1997); Ferreira and Otley (2009); Griffis et al. (2004); Ittner et al. (2003); Kaplan and Norton (1997); Maskell (1989); Otley (1999); Petersen et al. (2009); Pun and White (2005); Simons (2000); Wisner and Fawcett (1991)
External Linkage Akyuz and Erkan (2010); Chenhall (2005); Evans (2004); Fawcett et al. (1997); Gunasekaran et al. (2004); van Hoek (1998); Keebler and Plank (2009); Lai et al. (2002); Malina and Selto (2004); Morgan (2004); Neely (2005); Schmitz and Platts (2004); Simatupang and Sridharan (2004)
Information Timeliness Amir et al. (2010); Fawcett et al. (1997); Ferreira and Otley (2009); Ghalayini et al. (1997); Griffis et al. (2004); Gunasekaran and Kobu (2007); Ittner et al. (2003); Maskell (1989); Neely et al. (1995); Selviaridis and Spring (2007)
Information Aggregation Amigoni (1978); Bond (1999); Brignall and Ballantine (1996); Caplice and Sheffi (1994); Ferreira and Otley (2009); Ittner et al. (2003); Lee et al. (2002); Morgan (2004); Pun and White (2005); Weber and Schäffer (1998)
System Adaptability Brignall and Ballantine (1996); Ghalayini et al. (1997); Griffis et al. (2007); Gunasekaran and Kobu (2007); Kennerley and Neely (2003); Maskell (1989); Malina and Selto (2004); McGinnis and Kohn (2002); Morgan (2004); Neely (2005); Waggoner et al. (1999)
Table 2-1: Dimensions of PMS excellence
Strategic-operational linkage refers to the extent to which a PMS translates an organiza-
tion’s strategic goals into a consistent set of performance measures on all organizational levels
(Caplice and Sheffi, 1995; Chenhall, 2005). If established successfully, the strategic and
operational levels of a PMS will be integrated through causal links between operational value
drivers and strategic objectives (Kaplan and Norton, 1992; Petersen et al., 2009). Having
consistent operational and strategic performance measures in place will not only enhance
PMS satisfaction in an organization (Sandt et al., 2001) but will make these performance
measures a useful basis for management incentive schemes and personal goals (Evans, 2004;
Otley, 1999). Thus, in supporting an organization’s strategy implementation, the strategic-
operational linkage of a PMS adds significant value to managerial decision-making.
External linkage refers to the degree to which an organization’s PMS accounts for exter-
nal supply chain elements and their interrelation with its own business performance (Gun-

14
asekaran and Kobu, 2007; Schmitz and Platts, 2004) to support coordination with supply
chain partners (Akyuz and Erkan, 2010). Yet, it does not necessarily imply the integration of
systems between supply chain partners. In contrast to the traditional performance measure-
ment focus within the boundaries of an organization (Short and Venkatraman, 1992; Lai et al.,
2002), it is important―particularly for logistics managers―to understand how their organiza-
tion’s performance depends on other members of their supply chain, including customers,
suppliers, and alliance partners (Normann and Ramírez, 1993; Chenhall, 2005). Thus,
whereas accounting for measures that extend across supply chain relationships is discussed in
PMS research across disciplines, external linkage stands out as particularly relevant for
logistics operations (van Hoek, 1998; Neely, 2005).
Information timeliness refers to the degree to which performance measurement infor-
mation is readily available for decision-makers (Brignall and Ballantine, 1996; Ittner et al.,
2003). While periodic result measures will be consulted infrequently (Griffis et al., 2007),
managers must be able to monitor day-to-day operations to reduce the time lag between
measuring performance and applying the results for corrective action (Gunasekaran and
Kobu, 2007). Identifying operational priorities in a timely way, therefore, is of particular
relevance in operations management and logistics (Fawcett et al., 1997; Neely et al., 1995).
Information aggregation refers to the degree to which a PMS focuses performance infor-
mation on the most relevant measures (Ittner et al., 2003; Ferreira and Otley, 2009). In
addressing the abundance of modern information systems and the time restrictions managers
face in making decisions, information aggregation encompasses prior recommendations in
PMS research such as using selective measures (Amigoni, 1978; Weber and Schäffer, 1998)
and using less detailed, simpler measures at higher levels of the managerial hierarchy
(Brignall and Ballantine, 1996).
System adaptability refers to the degree to which a PMS can be adjusted to specific re-
quirements or new findings. Competitive organizations are adapting constantly to their
environment (McGinnis and Kohn, 2002); therefore, they need to select and use new or
different measures dynamically in order to reflect current conditions (Malina and Selto, 2004;
Kennerley and Neely, 2003; Waggoner et al., 1999). Correspondingly, a PMS must be
designed to be adaptable in the same way, as “firms and managers must be able to identify
and select new or different measures consistent with evolving organizational priorities”
(Griffis et al., 2007, p. 35).
15
A PMS will provide value to a logistics organization particularly when its design reflects
a combination of all six dimensions. For example, measurement diversity by itself is not
beneficial when it results in excessive reporting and information overload (Schick et al.,
1990), thus not putting managers in a good position to monitor operations and make decisions
efficiently and effectively. Here, the PMS literature provides clear evidence that each
dimension of PMS excellence, to unfold its value, should not be improved alone but needs to
be combined with one or several other dimensions. Kaplan and Norton (1992) stress the
simultaneous importance of a multidimensional approach to performance measurement
(measurement diversity) and the interlinkage between strategic goals and operational value
drivers (strategic operational linkage). Similarly, Brignall and Ballantine (1996)—besides
stressing non-financial measures—also suggest less detailed, more aggregated, and simpler
PMS information on higher hierarchical levels (information aggregation) as well as the
importance to change a PMS when necessary as “the PM system is not cast in stone” (p. 15)
(system adaptability). In focusing on the PMS literature within the field of logistics and
supply chain management, Gunasekaran and Kobu (2007) also outline the simultaneous
importance of PMS linkages to supply chain partners (external linkage) and the timely
availability of performance measures (information timeliness) in PMS design. Thus, in
bringing the many different, but partly overlapping PMS design frameworks together, it can
be concluded that the six dimensions are complementary and mutually reinforcing in enhanc-
ing PMS value. Building on this insight, the present study conceptualizes the combined
existence of these six dimensions as PMS excellence.
2.2.2 Conceptual model and hypotheses
According to the resource-based view (RBV) of the firm, resources are assets, pro-
cesses, information, knowledge, or firm attributes that enable managers to develop and
implement strategies to improve efficiency and effectiveness, ultimately leading to sustainable
competitive advantage (Barney 1991). From this perspective―and given the fact that many
logistics organizations are struggling to implement a PMS that adequately addresses their
managers’ information needs (Fawcett et al., 1997; Keebler and Plank, 2009)―PMS excel-
lence as a superior reporting and control structure constitutes an organizational capital
resource (Tomer, 1987) that can lead to enhanced organizational competitiveness. Amit and
Schoemaker (1993) extended the RBV by suggesting that competitive advantage and superior
performance result from leveraging resources and assembling, integrating, and deploying such
resources to build organizational capabilities. Given the ongoing challenges of logistics
16
organizations to respond effectively to customer needs (McGinnis and Kohn, 2002) and to
align internal efforts across departments (van Hoek and Mitchell, 2006), this research focuses
on customer orientation (Selviaridis and Spring, 2007) and cross-functional integration
(Zacharia and Mentzer, 2004) as two pivotal capabilities in logistics operations. Following
Amit and Schoemaker’s (1993) perspective, we investigate the impact that PMS excellence as
a valuable resource has on logistics performance via customer orientation and cross-functional
integration as two capabilities that leverage this resource. As we analyze the impact of PMS
excellence as a source of competitive advantage in different organizational contexts, logistics
performance refers to the overall competitiveness of an organization regarding the efficiency
and effectiveness of its logistics activities (Mentzer and Konrad, 1991; Mentzer et al., 2004).
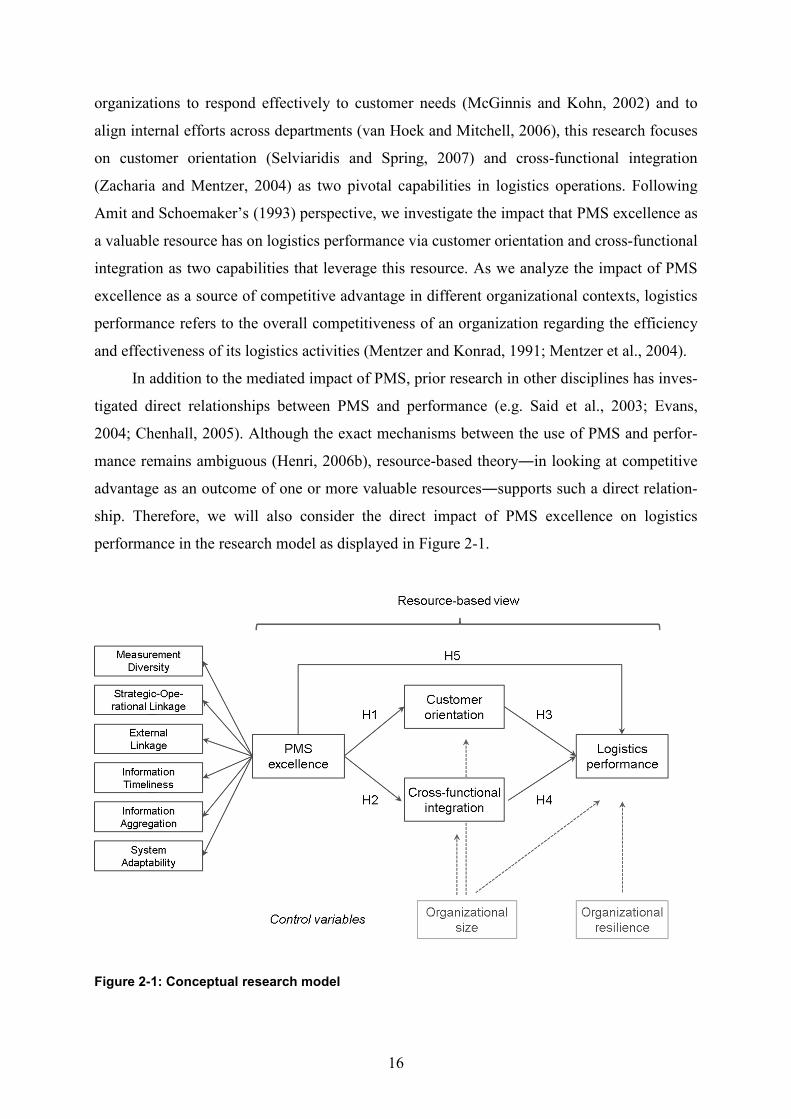
In addition to the mediated impact of PMS, prior research in other disciplines has inves-
tigated direct relationships between PMS and performance (e.g. Said et al., 2003; Evans,
2004; Chenhall, 2005). Although the exact mechanisms between the use of PMS and perfor-
mance remains ambiguous (Henri, 2006b), resource-based theory―in looking at competitive
advantage as an outcome of one or more valuable resources―supports such a direct relation-
ship. Therefore, we will also consider the direct impact of PMS excellence on logistics
performance in the research model as displayed in Figure 2-1.
Figure 2-1: Conceptual research model

17
Impact of PMS excellence organizational capabilities
With an increasing awareness of the benefits of leveraging logistics to increase
customer value (Fugate et al., 2010), customer orientation has become an essential capability
in logistics operations (Zhao et al., 2001). Rather than a generic strategy, it represents a
capability that may—depending on the preferences of the specific company’s customers—
involve both cost and service aspects. In seeking to attain this capability, logistics
organizations must understand their performance with respect to existing and future customer
expectations (Gunasekaran and Kobu, 2007). Performance measurement systems represent an
important formal mechanism to support such an understanding (Gunasekaran and Kobu,
2007). Having an excellent logistics PMS in place will do more than translate customer
satisfaction as a strategic goal into operational value drivers such as on-time pickup and
delivery, lead times, or consistency of service. By providing such operational measures in a
timely and aggregated manner while adapting them to evolving customer priorities, PMS
excellence will also put logistics managers in a position to continuously focus organizational
attention and efforts on activities that add distinct value. By linking internal activities to those
of customers through performance measures, it can help to improve service levels or to even
identify sources of increased functionality or additional services. In summary, and following
our RBV perspective, we argue that PMS excellence as a valuable resource will enhance the
ability of logistics organizations to meet existing and to anticipate upcoming customer needs.
We thus posit our first hypothesis:
H1: PMS excellence has a positive effect on customer orientation in logistics
organizations.
A second capability that leverages PMS excellence as a valuable resource is cross-
functional integration which generally refers to bringing different departments together for
interaction and collaboration (Daugherty et al., 2009; Zacharia and Mentzer, 2004). In the
context of logistics organizations, it reflects the ability to align logistics operations across
departments (Bowersox et al., 2002) and thereby improve decision-making efficiency and
effectiveness.
The contribution of PMS excellence to cross-functional integration can be explained by
the common ground that a PMS provides to an organization’s different departments. If
operational priorities in managing day-to-day activities differ between departments, focusing
managers’ and employees’ attention on the same issues across departments is not a simple
effort. To support interaction and shared priorities, it is essential that employees recognize the

18
value of working together (Daugherty et al., 2009), not only within their function, but also
across the departments of an organization. As “a lack of measurement or systems that put
functions in competition with each other certainly harm integration efforts” (Pagell, 2004, p.
476), excelling in performance measurement represents an important basis in this context for
several reasons. First, using a diverse set of financial and non-financial measures along all
relevant performance dimensions, while providing transparency on dependencies between
internal performance and external partners, will ensure that the priorities of each function are
represented adequately. Second, having high-level strategic measures linked to the operational
level will provide transparency regarding different departments’ contributions to the
organization’s goals. Finally, such operational driver measures will be readily available across
departments, tailored to the time constraints of day-to-day operations, and ready to be
adjusted to cross-functional priorities.
Overall, PMS excellence will not only contribute significantly to conveying the same
priorities to different departments, but also encourage information-sharing and joint work
teams in managing logistics operations. Combined with first empirical insights on the positive
effects of advanced measurement systems on integrated internal operations provided by
Rodrigues et al. (2004), we argue:
H2: PMS excellence has a positive effect on cross-functional integration in logistics
organizations.
Impact of organizational capabilities on logistics performance
Capabilities are the organizational routines by which firms deploy valuable resources,
which can significantly contribute to superior performance (Day, 1994; Barney et al., 2011).
In leveraging the resource of PMS excellence, both customer orientation and cross-functional
integration are corresponding capabilities that can create competitive advantage and enhanced
performance in logistics operations.
Responding to customer expectations has long been regarded a key driver of
performance in logistics (Defee et al., 2010). Extant logistics and supply chain literature has
focused mainly on service performance as a dimension of logistics performance rather than
customer orientation as an organizational antecedent (Shang and Marlow, 2005).
Nevertheless, a small number of studies have provided insights regarding the positive
contributions that customer-focused logistics capabilities have on firm performance (Innis and
La Londe, 1994; Zhao et al., 2001) as well as on supply chain performance (Jeong and Hong,
2007).

19
In general, an organization with a strong customer focus will be adept at reacting to
formal and informal feedback (Baker and Sinkula, 1999) and will work continuously on
meeting or exceeding customer expectations (Bowersox et al., 1999). Given the direct
customer interaction in logistics operations, key dimensions of customer value such as
delivery reliability, quality of service, and flexibility (Fawcett et al., 1997) are closely linked
to the organization’s overall performance. This becomes particularly evident when looking at
the most-used operational performance measures such as on-time delivery, order fill rates,
lead times, or complaint rates (Lai, 2004; Keebler and Plank, 2009). In seeking to improve
customer value along these measures, logistics organizations will, at the same time, improve
their overall competitiveness regarding the efficiency and effectiveness of logistics processes.
Along with prior suggestions on customer responsiveness as a source of competitive
advantage in logistics (Daugherty et al., 1992), we therefore propose:
H3: Customer orientation in logistics organizations has a positive effect on logistics
performance.
A significant body of research has found the integration of different departments within
an organization to be an essential enabler of performance (e.g. Chen et al., 2007; Droege et
al., 2004; Ruekert and Walker, 1987). Given the strong process-focus in logistics operations,
cross-functional exchange, information sharing, and teamwork among the departments
involved in logistics operations are of crucial importance (Mentzer 2004; Rodrigues et al.,
2004). Indeed, prior studies have suggested and confirmed that logistics organizations that
achieve cross-functional integration enjoy improved performance (Kahn and Mentzer, 1996;
Ellinger et al., 2000). Besides reduced duplication and redundancy (Stank et al., 2001), cross-
functional integration can lead to improved on-time delivery, lead time reductions, and
reduced inventory (Gustin et al., 1995).
As logistics processes always involve more than one funtional area (Kahn and Mentzer
1996), the primary reasons for the performance impact of cross-functional integration are
quite straightforward. Managers and employees from different functions who build cross-
functional teams (Daugherty et al., 2009) facilitate superior performance in managing
processes and ensure that efforts and resources are coordinated (Chen et al., 2007). With the
relevant areas working together rather than remaining in functional silos, their assets, know-
how, and information are mutually supportive and build a more efficient and effective
logistics organization. Ultimately, such an integrated organization will yield higher levels of
logistics performance:

20
H4: Cross-functional integration in logistics operations has a positive effect on logistics
performance.
Direct impact of PMS excellence on logistics performance
Besides the mediated impact of PMS excellence on logistics performance via organiza-
tional capabilities, prior empirical studies have suggested, and partly confirmed, direct
relationships between PMS and performance (Davis and Albright, 2004; Evans, 2004;
Fawcett et al., 1997), thereby leaving an open debate about the exact nature of the relationship
between PMS and performance.
In management accounting, Henri (2006b) analyzed this issue and concluded that “since
a large proportion of the relationships between PMS use and performance is expected to come
indirectly through capabilities, the direct effects are expected to be relatively small” (p. 539).
Also, in investigating both mediated and direct links between PMS and firm-level perfor-
mance, Chenhall (2005) confirmed both links but found stronger support for the mediated
effects.
Based on these findings in accounting and the complex interaction of various processes
within logistics organizations, it is reasonable to assume that most of the value of PMS
excellence will be mediated through organizational capabilities. At the same time, following
resource-based logic from a theoretical standpoint—where resources have a direct potential
for sustainable competitive advantage and rent-generation (Barney, 1991; Grant, 1991)—it
can be argued that PMS excellence as a valuable resource can also have a direct impact on
performance. Furthermore, from a managerial standpoint in logistics operations, having the
right information at the right time to make decisions enhances organizational competitiveness
(Gunasekaran and Kobu, 2007). Building on the findings of prior research, PMS excellence
represents a source of information that—in addition to its primary impact through organiza-
tional capabilities—will translate directly into enhanced logistics performance. In further
investigating the impact of PMS in logistics operations, while contributing to the above-noted
debate in other disciplines, we therefore propose:
H5: PMS excellence has a positive direct effect on logistics performance that is smaller
than the mediated effect via organizational capabilities.

21
2.3 Methodology and scale development
2.3.1 Sample design and characteristics
To test our research model, a large-scale survey among logistics organizations of manu-
facturing, trading, and logistics companies in Germany was conducted to collect primary data.
As informants had to be knowledgeable and familiar with the PMS of their respective
logistics organization, a key informant approach was applied (Mitchell, 1994). Potential
respondents were gathered from three databases of 4,011 logistics and supply chain managers
who received an email announcement of the survey. To ensure that informants were knowl-
edgeable in our field of research, the announcement asked experts involved in the PMS
domain of their respective logistics organization for registration via an online form. Subse-
quently, after a four week registration period, an email that included a link to the online
survey was sent to a total of 1,063 registered candidates. The survey was active between July
and September 2011, and three reminder emails were used to improve the response rate. A set
of 431 responses was considered usable due to the low percentage of missing values. Based
on the initial sample of 1,063 registered managers, this corresponds to a very good response
rate of 40.5% (Wagner and Kemmerling, 2010). Two outliers were removed based on
Mahalanobis distance (Byrne, 2001). Respondent demographics are summarized in Table 2-2.
Industry Percent Job title of respondents Percent
Automotive 12% Top level executive / director 55%
Machinery and equipment 11% Senior manager 27%
High-tech and electronics 5% Manager 12%
Chemicals and pharmaceuticals 7% Non-executive 6%
Consumer goods 11% Number of logistics employees
Logistics services 42% Less than 100 51%
Other industries 12% 100 to 999 34%
1,000 or more 15%
Table 2-2: Respondent demographics
In our survey, we pointed out that a Performance Measurement System (PMS) refers to
any structured set of performance measures used to quantify the efficiency and effectiveness
of operations in the respondents’ respective logistics organization, not necessarily a sophisti-
cated information system.

22
As both independent and dependent variables were collected from the same respond-
ents, we applied several methods to minimize the potential for common method bias. In
addition to separating items of independent and dependent variables through survey questions
that were unrelated to our model while also assuring anonymity to survey participants, we
applied the marker variable technique to detect potential common method bias (Lindell and
Whitney, 2001; Podsakoff et al., 2003). As a measure that should theoretically not be related
to any of the focal constructs in the model, a three-item marker for perceived external risk was
used as part of the survey to test for statistical dependence that may be caused by common
method bias. Using the lowest correlation of the marker variable’s items to the items used to
measure the constructs of our research model (0.0005 with p > 0.991) as the upper bound for
potential common method variance, we found no indication for the presence of common
method bias.
Non-response bias was examined in two ways. First, no significant differences
(p < 0.05) were found when comparing all scale items via independent sample t-tests between
the first and last third of responses (Armstrong and Overton, 1977). Second, 30 randomly
selected non-respondents were convinced to complete a short version of the survey that
included six items from our model (Lambert and Harrington, 1990). Again, no significant
differences (p < 0.05) were found compared to the responses of the original participants.
Thus, non-response bias is not expected to influence the results of this study.
2.3.2 Measurement scales
All construct measures used for the survey relied upon multi-item 7-point Likert scales.
During questionnaire design, all items were discussed with a group of ten academics and
logistics practitioners. Three further practitioners were involved to examine specific questions
and to validate the final survey. Following suggestions by Brislin (1976), the questionnaire
was first developed in English, then translated into German, and finally back-translated into
English to improve the translation accuracy for our target group of German speaking logistics
managers. The back-translated version was checked against the original version.
Development of second-order PMS excellence construct
Armstrong and Shimizu (2007) pointed out that the operationalization of resource con-
structs in empirically testing the RBV represents an important challenge. They stated that
RBV researchers should “theoretically identify what the observable consequences of unob-
servable resources are likely to be” and that “since it is unlikely to find one proxy that reflects

23
unobservable resources, researchers should use multiple variables to collectively represent
latent constructs” (p. 968). To provide a comprehensive scale that is applicable universally to
any logistics organization and to address Armstrong and Shimizu’s (2007) suggestions, the
present study operationalizes PMS excellence as a second-order construct that combines the
extent to which the six dimensions of PMS excellence can be observed in a specific organiza-
tion. As presented in the research framework in more detail, these include measurement
diversity, strategic-operational linkage, supply-chain linkage, information timeliness,
information aggregation, and system adaptability. An initial list of items for each first-order
construct was compiled based on the study’s PMS literature review. To verify the validity of
the first-order constructs and eliminate ambiguous items, an item sorting approach developed
by Moore and Benbasat (1991) was adapted following prior applications in instrument
development (e.g. Lee et al., 2002; Li et al., 2005). While a description of the detailed sorting
procedure is beyond the scope of the present paper, the basic construct validation rationale
was as follows. In a first step, comprehensiveness and categorization of the sub-constructs and
underlying items were discussed and adapted with three logistics practitioners. Next, to
further verify the scale, two groups of five logistics researchers each were formed to catego-
rize defined items. While the six underlying sub-constructs described above were not known
to the first group, their objective was to build item categories and provide proposed construct
definitions for each category. For the second group, the underlying constructs were named,
and each member sorted items into constructs, while also providing convergence grades for
each item to indicate the quality of fit. Based on the results, which indicated a high fit of
proposed items and constructs, a small number of ambiguous items were modified or
eliminated.
Further constructs
To measure customer orientation, we used Narver and Slater’s (1990) well-established
scale. Two indicators for customer satisfaction were merged to reduce overlap that may have
confused respondents. One item (“We pay close attention to after-sales service”) was dropped
because it did not universally fit the context of all logistics organizations.
Cross-functional integration was measured using the scale items developed by Zacharia
and Mentzer (2004) and Daugherty et al. (2009). When we discussed the survey with logistics
practitioners, one item (“The orientation of our organization has shifted from managing
functions to managing processes”) was deemed confusing for measuring cross-functional
integration and therefore omitted.

24
The scale developed by Fugate et al. (2010) was used to measure logistics performance.
As the study used data from manufacturing, trading, and service companies, this scale was
chosen due to its applicability to different logistics contexts.
Further, we included the size of the logistics organization, i.e. the number of employees
in logistics operations, as control variable, as organizational size can be a source of variance
that may influence research results (Wagner and Bode, 2006). To prevent any omitted
variable bias, organizational resilience, due to its potential impact on logistics performance,
was added as a second control variable.2
2.3.3 Model and scale analysis
Confirmatory factor analysis (CFA) was conducted in AMOS to check unidimensionali-
ty and convergent validity, internal consistency of constructs, discriminant validity, and
second-order construct validity. Following Brown (2006), one second-order model was used
with grouped first-order dimensions of our newly developed PMS excellence scale. Based on
low loadings or high correlated errors, SOL4, EL2, EL4, and SA3 were removed from the
new second-order scale to improve the model fit without affecting the coverage of their
respective first-order constructs (Hair et al., 2006). Good fit indices of the CFA model (χ²/df =
1.656; CFI = 0.967; GFI = 0.903; TLI = 0.964; RMSEA = 0.039) confirm unidimensionality
(Hair et al., 2006).
Please rate the extent to which the following items describe the
Performance Measurement System of your logistics organization: Mean SD
Stand. Weight
t-value
Measurement Diversity (Cronbach’s alpha = 0.85; AVE = 0.71; CR = 0.88)
Our Performance Measurement System G
MD1 G is not limited to one dimension (e.g. financials only), but measures performance along multiple complementary dimensions.
4.89 1.74 0.79 18.88
MD2 G ensures that all relevant performance dimensions are accounted for. 4.79 1.61 0.87 21.32
MD3 ... provides a diverse set of measures (e.g. financial/non-financial, internal/external, lagging (ex-post)/leading (ex-ante) measures).
4.46 1.67 0.86 Fixed
Strategic-Operational Linkage (Cronbach’s alpha = 0.82; AVE = 0.60; CR = 0.82) Our Performance Measurement System G
SOL1 ... provides causal links between operational value drivers (input measures) and strategic result measures (output measures).
4.06 1.73 0.70 14.80
SOL2 ... links all business activities with the achievement of goals and objectives of the organization as a whole.
4.48 1.67 0.85 16.03
SOL3 ... provides consistent and mutually reinforcing links between current operating performance and long-term strategies.
3.96 1.56 0.77 Fixed
SOL4 ... shows how activities of one business unit affect other units and the organization as a whole.*
2 A detailed investigation of organizational resilience is provided in chapter 3.

25
External Linkage (Cronbach’s alpha = 0.88; AVE = 0.57; CR = 0.84) Our Performance Measurement System G
EL1 Gprovides measures that link internal activities to those of our supply chain partners (customers, suppliers, alliance partners).
3.83 1.79 0.78 13.28
EL2 ... links our business performance to customers and suppliers.*
EL3 ... enhances transparency on performance linkages between different participants in the supply chain.
3.76 1.70 0.81 13.60
EL4 ... integrates external measures like customer service or supplier performance.*
EL5 ... includes measures that were jointly defined with our supply chain partners (customers, suppliers, and alliance partners).
3.34 1.77 0.68 Fixed
EL6 ... supports coordination with our supply chain partners. 3.22 1.72 0.74 17.03
Information Timeliness (Cronbach’s alpha = 0.84; AVE = 0.73; CR = 0.89) Our Performance Measurement System G
IT1 ... ensures more frequent measurement for continuously needed operational measures than for periodic result measures.
5.36 1.70 0.79 19.29
IT2 ... has performance measurement information readily available when needed. 5.26 1.52 0.92 23.23
IT3 ... helps to reduce the time lag between measuring performance and applying results for corrective action.
4.83 1.63 0.84 Fixed
Information Aggregation (Cronbach’s alpha = 0.80; AVE = 0.57; CR = 0.80) Our Performance Measurement System G
IA1 G focuses on relevant performance information based on selective measures. 5.40 1.39 0.82 13.71
IA2 ... provides less detailed, more focused performance information as one rises in the managerial hierarchy.
5.11 1.71 0.76 13.08
IA3 ... does not generate as many performance measures as possible but prioritizes the most relevant measures.
5.31 1.51 0.67 Fixed
IA4 ... has the right level of detail / accuracy for different PMS user groups.*
System Adaptability (Cronbach’s alpha = 0.93; AVE = 0.84; CR = 0.94) Our Performance Measurement System G
SA1 ... can be easily adjusted to new findings or additional requirements. 4.66 1.65 0.94 27.16
SA2 ... responds dynamically to changed requirements or circumstances. 4.63 1.64 0.96 28.04
SA3 ... ensures adaptability of performance measures to specifics of different organiza-tional units (e.g. BUs/departments).*
SA4 ... is not an off-the-shelf solution but easily adjustable to our specific business requirements.
4.57 1.69 0.84 Fixed
Items were measured with 7-point Likert scale ranging from 1 = I strongly disagree to 7 = I strongly agree (* items eliminated in scale-refinement after large-scale analysis)
Table 2-3: Second-order PMS excellence construct
As shown for the new PMS excellence scale in Table 2-3 and the dependent scales in
Appendix 1-1, all dimensions exhibit good convergent validity with the lowest t-value at
13.08 (IA2) and a minimum standardized regression path of 0.67 (IA3).
In addition to Cronbach’s alpha, internal consistency of constructs was assessed via
composite reliability (CR) and average variance extracted (AVE). All constructs exceeded the
recommended minimum value of 0.6 for CR (Bagozzi and Yi, 1988) and 0.5 for AVE
(Fornell and Larcker, 1981), supporting the reliability of the constructs and their measurement

26
items. For discriminant validity, AVE and squared correlation were compared for all con-
structs following the Fornell-Larcker (1981) criterion, which all constructs met (Table 2-4).
Scale AVE Squared Correlations
(1) (2) (3) (4)
(1) PMS excellence 0.59 --
(2) Customer orientation 0.54 0.31 --
(3) Cross-functional integration 0.65 0.24 0.22 --
(4) Logistics performance 0.79 0.10 0.19 0.11 --
Table 2-4: Test for discriminant validity
2.3.4 Validation of second-order construct
To validate the second-order PMS excellence construct, we followed Cao and Zhang
(2011) by examining the target (T) coefficient between the first-order model and the second-
order model (where T = first-order χ² / second-order χ²). As the fit indices for higher-order
models can never be better than the corresponding first-order model (Segars and Grover,
1998), a T coefficient of 0.80 to 1.00 indicates the existence of a second-order construct
(Marsh and Hocevar, 1985). The calculated target coefficient of 91.0% is shown in Table 2-5
and strongly supports the more accurate representation of our second-order model structure
over the corresponding first-order model.
Model χ² (df) Normed χ² CFI TLI RMSEA T coefficient
First-order 612.58 (368) 1.665 0.971 0.965 0.039 91.0%
Second-order 673.28 (392) 1.718 0.966 0.963 0.041
Table 2-5: Fit indices for first and second order model
2.4 Hypothesis test results
The structural model (including the control variables) was tested using AMOS and
shows adequate fit with χ²/df = 1.95; CFI = 0.95; TLI = 0.94; RMSEA = 0.047. Results are
displayed in Figure 2-2.
Hypotheses 1 and 2 posit that PMS excellence improves the two capabilities of custom-
er orientation (H1) and cross-functional integration (H2). Our model’s results provide strong
support for both hypotheses, with significant and substantial standardized path coefficients of
+0.591 (p < 0.001) and +0.512 (p < 0.001), respectively. Thus, the proposed role of PMS

27
excellence as an enabler of these two pivotal capabilities in logistics organizations is clearly
underscored.
Hypotheses 3 and 4, which postulate a positive effect of both capabilities on logistics
performance, receive support as well. With a standardized regression weight of +0.264
(p < 0.001), the effect of customer orientation on logistics performance is stronger than that of
cross-functional integration (+0.138, p = 0.019). While the positive effects of cross-functional
integration confirm previous research suggesting that overcoming functional boundaries is a
key success factor in logistics operations, the high impact of customer orientation emphasizes
its particular importance for logistics organizations.
Figure 2-2: Results of structural equation model
The direct effect of PMS excellence on logistics performance is not only smaller than
the mediated effect but―other than stated in Hypothesis 5―virtually non-existent and
insignificant; thus, we do not find support for H5. To assess the explanatory power of our
research model, squared multiple correlations (R2) were examined for all endogenous latent
variables. The results indicate that 37.7% of customer orientation’s total variance and 26.3%
of cross-functional integration’s total variance are explained by PMS excellence in logistics
organizations. Furthermore, 22.1% of variance in logistics performance is explained. An
overview of hypothesis test results, including coefficients and p-values for the model with and
without controls, are shown in Appendix 2-2.

28
2.5 Discussion and implications
While the role of performance measurement to support managerial decision-making in
logistics has been extensively discussed in prior conceptual research (e.g. Griffis et al., 2007;
Caplice and Sheffi, 1995), empirical evidence on PMS impact in logistics was scant. The
present study confirms the relevance of PMS as a potential source of competitive advantage in
logistics organizations and provides a holistic conceptualization of PMS excellence while
validating its mediated impact via customer orientation and cross-functional integration as
two pivotal organizational capabilities.
2.5.1 Theoretical implications
Building on our newly derived conceptualization of PMS excellence in logistics organi-
zations and the second-order construct developed for our study, our empirical results show
that the six interconnected and mutually reinforcing dimensions of PMS excellence—
measurement diversity, strategic-operational linkage, external linkage, information timeliness,
information aggregation, and system adaptability—combine to significantly enable organiza-
tional capabilities and logistics performance. While PMS excellence builds on design
attributes that are recommended across disciplines, there are obviously other elements to
consider from PMS frameworks that are not related to design, e.g. criteria for the selection of
specific measures in a particular organizational context (Ghalayini et al., 1997; Griffis et al.,
2004). Still, in summarizing the key criteria of advanced PMS design, PMS excellence
represents a common denominator for the large body of conceptual PMS knowledge in the
literature. Given the small share of PMS research in logistics and supply chain management
that is empirical (Gunasekaran and Kobu, 2007), it is an important finding that the criteria
provided by different conceptual PMS frameworks are actually found to provide significant
value to logistics organizations. By integrating the complementary dimensions of PMS
excellence into a second-order construct, we also followed the call of Armstrong and Shimizu
(2007) to better operationalize resource constructs for empirical RBV research and to use
multiple variables to collectively measure such constructs.
PMS excellence shows to be a strong driver of organizational customer orientation and
explains 37.7% of its variance. While there is little doubt that customer orientation represents
a key capability in logistics, our findings suggest that logistics organizations that excel in
PMS will be in a better position to use performance information to actually fulfill customer

29
requirements by focusing organizational attention and efforts on activities that add customer
value.
Next, PMS excellence was shown to be a substantial facilitator of cross-functional inte-
gration, thus addressing logistics organizations’ ongoing challenge to continuously improve
internal alignment for enhanced operational efficiency. In providing a broad set of perfor-
mance measures that convey the same priorities to different departments, while being readily
available across the organization and adapted to managerial information needs and time
constraints, PMS excellence significantly supports interaction and collaboration among
different departments. Prior research has confirmed the relevance of cross-functional relation-
ships in logistics (Daugherty et al., 2009; van Hoek, Ellinger, and Johnson, 2008); therefore,
having 26.3% of variance in cross-functional integration explained by PMS excellence is an
important finding.
Together, customer orientation and cross-functional integration fully mediate the impact
of PMS excellence as a valuable resource and explain 22.1% of overall logistics performance.
Here, while the positive effects of cross-functional integration confirm previous research
suggesting that overcoming functional boundaries is a key success factor in logistics opera-
tions, the even higher impact of customer orientation emphasizes its particular importance for
logistics organizations.
In following the original RBV definition (Barney, 1991), our research framework also
proposed a direct relationship between PMS excellence as a valuable resource and logistics
performance as a result of competitive advantage. However, unlike hypothesized, the direct
impact was not only found to be smaller than the mediated impact, but turns out to be
irrelevant. As prior empirical research by Fawcett et al. (1997) found a positive relationship
between performance measurement information and operational success in logistics using
correlation analysis, the present study’s results refine these findings by confirming that the
impact of PMS excellence is fully mediated through organizational capabilities. We thereby
also support previous suggestions from accounting research that the performance impact of
PMS is mediated through organizational capabilities (Chenhall, 2005; Henri, 2006b).
2.5.2 Managerial implications
The present study’s findings offer important implications for managers involved in the
performance measurement practice of their respective logistics organization. In general, the
results strongly underscore the value of an excellent PMS. More specifically, our research
provides conceptual guidance on the criteria that managers need to simultaneously account for

30
when designing their organization's PMS. Think of an approach that, for example, builds on
the idea of the balanced scorecard (BSC), but is enhanced by further aspects. While a BSC
represents a formalized example of a PMS that already incorporates different dimensions of
performance measures (measurement diversity) and links the strategic and operational level
(strategic operational linkage), further important criteria of advanced PMS design should be
added as emphasized in our work. Regardless of whether a PMS consists of a simple set of
measures that are linked within a spreadsheet or a sophisticated information system, the
outlined design criteria can be equally incorporated. Logistics managers seeking to further
exploit PMS potential will need to assess and critically challenge the observable characteris-
tics of PMS design and implementation within their organization. To reach beyond a coherent
and diverse set of measures that translates logistics strategy to the operational level (Kaplan
and Norton, 1997), they need to not only review the status of their PMS along all six dimen-
sions of PMS excellence, but to develop an understanding of the factors that enable PMS
within their organization.
Moreover, the supported relationships of our RBV framework can guide managers in
exploiting PMS excellence for logistics performance by fostering customer orientation and
cross-functional integration as two key capabilities in logistics operations. The substantial
share of an organizations’ customer orientation variance explained by PMS excellence reveals
a significant managerial lever to meet the continuous challenge of delivering real customer
value. Furthermore, the supported relationship between PMS excellence, cross-functional
integration, and overall logistics performance strongly confirms prior conceptual suggestions
by Gunasekaran and Kobu (2007) that “good performance measures and metrics will facilitate
a more open and transparent communication between people leading to a co-operative
supported work and hence improved organizational performance” (p. 2820). Hence, while
there are many organizational factors contributing to cross-functional integration (Pagell,
2004), logistics managers on all hierarchical levels should also seek to exploit the opportuni-
ties arising from a better PMS to tie their organization together and to focus on the most
urgent priorities across all functional departments.
2.6 Limitations and future research
Some limitations of our study need to be recognized, which, at the same time, offer
promising avenues to further advance our understanding of PMS in logistics. First, in
applying resource-based theory to analyze the impact of PMS excellence as a source of

31
competitive advantage, the present research focused on the combined and mutually reinforc-
ing existence of PMS design characteristics within a rather generic organizational context. In
using data from manufacturing and trading companies in various industries, as well as service
companies with different focus areas, we had to measure dependent variables with rather
general items that are equally applicable to different logistics contexts. To understand PMS in
more detail, future research should also investigate the importance of PMS design in more
specific logistics contexts, for example, its role for distribution service performance in a
specific industry or a specific type of logistics organization. In so doing, it will be important
for researchers to view context-related performance items, ideally operational data, to better
understand the exact relationships. Furthermore, case study research may be particularly
relevant in this context to provide empirical evidence in addition to large-scale analysis.
Second, in explaining how managers can transform PMS excellence to create value, we
focused the present research on customer-orientation and cross-functional integration as two
pivotal capabilities that address ongoing challenges in logistics operations. Given that “the
RBV requires further elaboration to explain the link between the management of resources
and the creation of value” (Sirmon et al., 2007, p. 273), future research could examine other
relevant capabilities. For example, given the challenge of increasing volatility and supply
chain disruptions, understanding the potential contribution of PMS to supply chain risk
management and organizational resilience would benefit academics and practitioners alike.
Third, we have focused our RBV perspective on the impact of PMS excellence as a val-
uable resource in logistics organizations without investigating the antecedents of PMS
excellence. It would be interesting, therefore, to understand the specific enablers and barriers
to PMS excellence based on first findings by Keebler and Plank (2009) and to better under-
stand the factors that influence PMS value for an organization, where Tung et al. (2011) have
provided first interesting insights.
32
3 Using performance measurement
systems in logistics organizations
in the era of turbulence3
3 This chapter is based upon the eponymous unpublished manuscript co-authored with Carl Marcus Wallenburg
and Andreas Wieland.

33
3.1 Introduction
During recent years, an increasing level of turbulence has fundamentally challenged the
assumption of stability in traditional supply chain management practice (Christopher and
Holweg, 2011; Malik et al., 2011) and, in the aftermath of the economic and financial crisis
since 2008, demand and supply market turbulence has increasingly been accepted to be a
major source of supply chain risk (Blome and Schoenherr, 2011; Braunscheidel and Suresh,
2009). Indeed, in seeking new approaches to cope with market turbulence and disruptions of
material flow, risk management has become a major field of supply chain management
research (Sodhi et al., 2012). Consistent with the definition of supply chain risk management
(SCRM) as “the implementation of strategies to manage both everyday and exceptional risks
along the supply chain based on continuous risk assessment with the objective of reducing
vulnerability and ensuring continuity” (Wieland and Wallenburg, 2012), most authors have
focused on risk identification, risk assessment, as well as mitigation and contingency strate-
gies to control risk (e.g. Ponomarov and Holcomb, 2009; Sodhi et al., 2012).
Yet, despite a broad consensus that the risk management process—besides identifying,
assessing, and implementing strategies to control risk—also requires a constant monitoring of
risk to sense new important factors and update the initial assessment (Hallikas et al., 2004),
this vital part of a comprehensive SCRM process has not received the same level of attention.
In supply chain management practice, however, the objective of ensuring high and consistent
levels of distribution service performance (Ellinger et al., 2000) in a turbulent market
environment will largely depend on such a constant monitoring to prevent the occurrence of
an event or to enable fast reactions. Correspondingly, Christopher and Holweg (2011) have
proposed that higher levels of turbulence “will require revisiting the management accounting
procedures that are used to evaluate different supply chain decisions” (p. 64). To make the
monitoring of market turbulence an integral part of existing management control processes, it
is of pivotal importance to account for corresponding metrics in designing an organization's
performance measurement system (PMS) (Rasid et al., 2012; Ritchie and Brindley, 2007).
However, recent empirical research shows that by far not all logistics organizations actually
have adapted PMS design to the changing supply chain environment (Weber et al., 2012).
In this context, the primary objective of our research is to demonstrate (1) that adapting
PMS design to market turbulence is vitally important and (2) why it is important for achieving
higher levels of distribution service performance. It has been argued that the resource-based
view (RBV) suggests that supply chain management has the characteristics to be a source of
temporary or even sustained competitive advantage for a firm (Barney, 2012; Lavie, 2006).

34
Following this view, we argue that the integration of supply chain risk metrics in an organiza-
tion’s PMS helps to build organizational resilience—the ability to adjust and maintain
functions under challenging conditions (Ponomarov and Holcomb, 2009)—and thus enhances
distribution service performance.
Building on Henri’s (2006a) concept of upper management control impact on PMS de-
sign, our secondary objective is to demonstrate that PMS design for turbulence is contingent
upon an organization's upper management focus of PMS use. Here, an (interactive) attention-
focusing use and a (diagnostic) score-keeping use represent two distinct types of PMS use that
are characterized by different managerial mindsets (Simon et al., 1954; Vandenbosch, 1999).
While an attention-focusing PMS use seeks to increase organizational awareness of critical
success factors and uncertainties (Henri, 2006a), a score-keeping use focuses on comparing
outcomes to expectations (Vandenbosch, 1999). Therefore, organizations where the upper
management strongly uses PMS for attention-focusing will design their PMS in a way that
allows identifying new risk developments (i.e. the monitoring of market turbulence). In
contrast, organizations where the upper management focuses on a score-keeping use of PMS
will tend to discourage forward looking activities like the monitoring of market turbulence.
To meet the outlined objectives, the rest of this article is organized as follows: First, we
provide a brief overview on the current state of SCRM research and present the concepts
covered in our study. After outlining the theoretical framework of the research model and its
underlying hypotheses, we describe the results derived from our study of 431 logistics
organizations. Finally, theoretical and managerial implications of the findings are discussed
and avenues of future research are proposed.
3.2 Conceptual framework and hypotheses
Corresponding to the proclamation of the “era of turbulence” (Christopher and Holweg,
2011) and to the statement that “modern supply chains seem to be more vulnerable than ever”
(Wagner and Bode, 2006, p. 307), many researchers have expressed a broad consensus that
new approaches are required in supply chain management to cope with increasing levels of
market turbulence (e.g. Jüttner et al., 2003; Sheffi and Rice, 2005; Tang, 2006). Meanwhile,
SCRM, as a “hot topic” with considerable attention from academia has been widely discussed
both in supply chain management research and in managerial practice (Kouvelis et al., 2006;
Malik et al., 2011; Sodhi et al., 2012). Besides ample conceptual work on new approaches to
supply chain strategies and design (e.g. Jüttner, 2005; Manuj and Mentzer, 2008; Ponomarov

35
and Holcomb, 2009), the positive effects of SCRM on supply chain resilience and ultimately
supply chain performance have also been empirically shown (e.g. Wagner and Bode, 2008;
Wieland and Wallenburg, 2012).
3.2.1 An organizational perspective on SCRM
As part of a comprehensive SCRM approach, monitoring market turbulence on an or-
ganizational level involves “the imperative to devise and develop appropriate performance
measures and metrics to evaluate, educate and direct the operational and strategic decisions”
(Ritchie and Brindley, 2007, p. 304). Before outlining the hypotheses of our conceptual
model, we will give a brief overview of the primary constructs of this study.
PMS design for turbulence refers to the degree to which an organization’s PMS ac-
counts for risk metrics to monitor the potential impact of market turbulence. Such metrics, in
seeking to reveal the increasing risks in the supply chain context and the need for new
responses to manage these risks, will help front-line managers to make decisions with the
right information at the right time (Gunasekaran and Kobu, 2007).
Organizational resilience is the ability of an organization to cope with turbulence. Fol-
lowing Ponomarov and Holcomb (2009, p. 128) in summarizing works of Weick et al. (1999),
Bunderson and Sutcliffe (2002), and Edmondson (1999), it can also be defined as “the
capacity to adjust and maintain desirable functions under challenging or straining conditions”.
While recent research has mainly focused on the concept of supply chain resilience from a
cross-company perspective (e.g. Christopher and Holweg, 2011), this study focuses on the
resilience of individual logistics organizations, i.e. both internal logistics departments of
manufacturing and trading companies and logistics service providers.
Distribution service performance refers to the overall fulfillment of customer expecta-
tions in logistics operations (Ellinger et al., 2000; Springinklee and Wallenburg, 2012).
Within the cost-to-service tradeoff in logistics (Stank et al., 2001), it focuses on the quality of
service that is key to creating customer satisfaction (Mentzer et al., 2012; Rhea and Shrock,
1987). This research looks at distribution service performance as the key outcome of a
logistics organization that affects the performance of other supply chain members, and
ultimately overall supply chain performance (Cooper et al., 1997; Mentzer et al., 2001).

36
3.2.2 Upper management’s role in PMS design for turbulence
In his seminal work, Henri (2006a) outlined that upper manager’s―i.e. executive man-
agers, not lower level operational managers (Carpenter et al., 2004)―usage focus of PMS
represents a contingent factor for PMS design as well as the selection of performance metrics.
In this domain, the accounting-related literature has provided various classifications of
managerial PMS use, including differentiations between score carding, problem solving, and
attention directing (Simon et al., 1954), between an instrumental, conceptual and symbolic
use (Menon and Varadarajan, 1992) as well as a diagnostic and interactive use (Simons,
1990). Vandenbosch (1999), in extending Simon et al.’s (1954) framework, differentiated
between a score keeping, problem solving, attention focusing, and legitimizing use of PMS.
Building on these different classifications from an SCRM perspective, the two distinct
types of PMS usage focus which represent the opposing ends on a continuum between using
PMS for either empowering or controlling an organization are an (interactive) attention-
focusing and a (diagnostic) score-keeping use (Henri, 2006a; Vandenbosch, 1999). In that
sense, these two types are the two most polar forms of PMS use and—as we will argue in the
hypotheses of our conceptual model—constitute contingent factors for the use of supply chain
risk metrics in an organization.
Attention-focusing refers to an interactive PMS use that fosters organizational dialogue
(Simons, 1990), where the guiding question is “What problems should we look into?” (Henri,
2006a; Simon et al., 1954). For upper managers preferring an attention-focusing use of
performance metrics, PMS will serve as “ammunition machine” (Burchell et al., 1980, p.15)
to proactively direct employees’ attention on critical success factors and uncertainties (Henri,
2006a). Within the classification provided by Menon and Varadarajan (1992), it represents a
conceptual use that fosters the awareness and understanding of specific situations (Schäffer
and Steiners, 2003).
Score-keeping, in contrast, represents a diagnostic PMS use (Simons, 1990) for report-
ing and surveillance (Feldman and March, 1981), where the guiding question is “How am I
doing?” (Simon et al., 1954). It focuses on a reactive cybernetic logic that compares operating
results to prior expectations and provides feedback for potential future corrections (Hofstede,
1978). Hence, for upper managers focusing on a score-keeping use of PMS, performance
metrics will serve as a routine control measure to follow-up with predefined goals (Henri,
2006a; Vandenbosch, 1999).

37
3.2.3 Development of hypotheses
Figure 3-1 presents the conceptual model of this research. To investigate SCRM in lo-
gistics organizations, we build on two theoretical domains. The outcome part of the model
reflects the causal relationships to be proposed between PMS design for turbulence, resilience
as an organizational capability, and enhanced levels of distribution service performance.
Following Calantone et al. (2003) and Trkman and McCormack (2009) in that an organiza-
tion’s ability to sense and adapt to changes in its environment represents a sustainable
competitive advantage, we use a resource-based perspective to argue that logistics organiza-
tions using appropriate metrics for risk monitoring will be more resilient and in a better
position to cope with market turbulence which is the basis to enhance their overall distribution
service performance.
Figure 3-1: Conceptual research model
In the antecedent part of the model, we investigate how the focus of upper manage-
ment’s PMS usage either acts as a driver or as an impediment of PMS design for turbulence.
Building on Henri’s (2006a) concept of upper management control impact on PMS design, we
argue that an upper management seeking to use PMS primarily for attention-focusing will be
more inclined to draw upon supply chain risk metrics than an upper management primarily
pursuing a score-keeping use.

38
Outcome: Linking PMS design for turbulence, organizational resilience, and performance
In seeking ways to manage higher levels of market turbulence, logistics organizations
need to monitor supply chain risks through appropriate performance metrics (Rasid et al.,
2012). Such forward-looking risk metrics, in providing an organization with early warning
signals, represent an intangible resource which—though being among the strategically most
important resources (Itami, 1987)—are often disregarded in management information systems
(Grant, 1991). Following Amit and Schoemaker’s (1993) extension of the RBV where
organizational capabilities forge the link between valuable resources and competitive
advantage, we argue that organizational resilience as the ability of an organization to cope
with challenging conditions translates the value of PMS design for turbulence into enhanced
distribution service performance.
In order to manage supply chain risk in daily operations, front-line logistics managers—
in following up with the initial identification and assessment of risk sources—need to
constantly keep track of potential impacts. Though it remains a challenge to assess the
probability of supply chain risks and their impact (Wagner and Bode, 2008), PMS design for
turbulence will be an important foundation for such a constant monitoring of risk. Risk
metrics will inform operational decision-makers as well as workers about the current state of
identified risk sources and thus sharpen organizational awareness. Regarding the coordination
of SCRM across departments, front-line managers from different departments will better
collaborate when sharing one overall risk monitoring process, similarly to other processes of
internal relational behavior (Wong et al., 2012). This way, PMS design for turbulence will
allow an organization to either anticipate and prevent the occurrence of future change
(proactive lever) or to make current change visible and enable fast reactions (reactive lever).
These two levers are the components of resilience (Wieland and Wallenburg, 2012). Looking
at the proactive lever, the monitoring of risk will increase resilience by helping an organiza-
tion to prepare for an external risk, to assess its impact and probability, and to take timely
precautions without increasing the level of control perceived among employees that might
decrease organizational flexibility (Ignatiadis and Nandhakumar, 2006). In case of an
unexpected supply chain event, the reactive risk monitoring lever consists in a quick detection
that allows for speedy corrective actions to recover and stabilize operations (Sheffi and Rice,
2005; Wieland and Wallenburg, 2012) and, in that way, increases resilience. Overall, supply
chain risk metrics will put a logistics organization in a position to cope with market turbu-
lence and thus minimize their vulnerability.

39
We therefore argue that PMS design for turbulence, by providing a constant monitoring
of external risk and facilitating SCRM coordination across departments enhances an organiza-
tion’s resilience in coping with market turbulence. Based on this reasoning, we hypothesize:
H1: PMS design for turbulence has a positive impact on organizational resilience.
Grant (1991), in line with Amit and Schoemaker (1993), proposed that “while resources
are the source of an organization's capabilities, capabilities are the main source of its competi-
tive advantage” (p. 119). In leveraging the monitoring of turbulence, organizational resilience
represents such a capability. A number of conceptual contributions have highlighted the
importance of organizational resilience as a distinct source of competitive advantage (Coutu,
2002; Hamel and Välikangas, 2003; Sheffi and Rice, 2005). McCann et al. (2009) provided
first empirical insights into the importance of resilience for competitiveness and profitability
in turbulent environments, albeit not focusing on the supply chain context. In line with Weick
et al.’s (1999) statement that “resilience is not only about bouncing back from errors, it is also
about coping with surprises in the moment” (p. 46), Wieland and Wallenburg (2012) have
empirically confirmed the importance of both the proactive and reactive dimensions of
resilience from an overall supply chain perspective. Given these findings, we argue that
organizations that are prepared to cope with market turbulence will be in a better position to
fulfill customer expectations regarding consistently high levels of distribution service
performance by mitigating potential negative consequences of turbulence outlined in prior
SCRM research (e.g. Wagner and Bode, 2008). First and foremost, keeping processes stable
or recovering quickly while adapting processes to changed circumstances will be a critical
factor for continued delivery reliability. Moreover, in an unstable environment, a resilient
organization will better perform in responding to short-term customer requests. For example,
it will be prepared to adapt its own delivery quantities to shortages caused by the bullwhip
effect or upstream capacity constraints (Lee and Billington, 1993; Sheffi and Rice, 2005)
while taking quick action to resolve these shortages. In summary, and adding to the findings
outlined above, we propose:
H2: Organizational resilience has a positive impact on distribution service performance.
Supply chain risk management has gained significant levels of attention as a “hot topic”
in managerial practice, but actual SCRM processes are still in their infancy and often too
simple to actually mitigate risk (e.g. Jüttner, 2005). Although it seems obvious that managing
market turbulence goes beyond measuring it, Sheffi and Rice (2005) have stated that many

40
logistics organizations “use formal processes to gather risk metrics for presentations to their
boards of directors” which “can go only a limited way toward reducing vulnerability” (p. 48).
Following this line of thought, we argue that the mere use of risk metrics to monitor market
turbulence does not deliver performance improvements by itself. As previously outlined, PMS
design for turbulence will help an organization to follow up with the initial identification and
assessment of risk sources and to keep track of potential effects ahead of their occurrence.
However, leveraging risk monitoring information for increased levels of distribution service
performance forms part of an organizational learning process. Manuj and Mentzer (2008)
emphasize the role of organizational learning in SCRM in “promoting an ongoing stream of
dialogue and inquiry, analyzing mistakes, seeking feedback, communicating, and question-
ing” (p. 148). Thus, with a learning orientation as an organizational antecedent to SCRM
(Braunscheidel and Suresh, 2009), making use of supply chain risk metrics for superior
performance comes through the increasing ability to cope with turbulence (i.e. organizational
resilience). Similarly, Ponomarov and Holcomb (2009) suggest that readiness, efficient
response, and recovery constitute the core elements of supply chain resilience as a learning
process towards sustainable competitive advantage.
Building on this reasoning, we argue that an enhanced competitive position in terms of
higher levels of distribution service performance can only be achieved by continuously
translating the monitoring of supply chain risk into an organization’s resilience in terms of
precautions or fast reactions. Therefore, we propose:
H3: The positive impact of PMS design for turbulence on distribution service perfor-
mance is mediated by organizational resilience.
Linking the focus of PMS use and PMS design for turbulence
Henri (2006a), in conceptualizing the impact of upper management’s control focus on
PMS design and the diversity of performance metrics, found that upper managers―depending
on their primary type of PMS use―will not need the same variety of financial and non-
financial measures to support their objectives. In using PMS for attention-focusing, upper
managers seek to foster organizational dialogue and the awareness of critical issues. Hence,
the mindset of upper-level managers who prefer an attention-focusing use is targeted towards
empowering rather than controlling their organization (Vandenbosch, 1999). By selecting
performance measures that—besides tracking progress towards predefined goals—can send
signals throughout the organization, they will generally give an important role to non-
financial measures that are more actionable than financial measures (Ittner and Larcker,

41
1998), including leading measures that aim at predicting what will happen (Evans, 2004).
Henri (2006a) found that a key objective of an attention-focusing PMS use is to direct
employees’ attention on critical uncertainties and that it strongly supports the use of such non-
financial measures. Vandenbosch’s (1999) results underline upper-level managers’ awareness
that PMS information can affect what their organization focuses on. In the context of higher
levels of market turbulence, upper-level managers with an attention-focusing mindset will
take a broader view and will be more inclined to recognize the role of supply chain risks and
the importance of risk metrics as part of a comprehensive SCRM process. Besides fostering
the initial identification and assessment of supply chain risk, they will seek to ensure a
constant risk monitoring process. Thus, in designing the PMS of their organization, they will
proactively foster the integration of supply chain risk metrics. Therefore, we propose:
H4: The degree to which upper management uses PMS for attention-focusing has a pos-
itive influence on PMS design for turbulence.
A score-keeping use of PMS focuses on comparing results with predefined expectations
in order to fulfill managers’ and stakeholders’ information requirements (Atkinson et al.,
1997). In evaluating different types of PMS use, Vandenbosch (1999) found a score-keeping
use to be negatively related to organizational competitiveness, albeit recognizing its raison
d'être in the simplicity of being “one of the easiest management information and control
systems to develop” (p. 88). Hofstede (1978) states that “standards are often set by higher line
management, intervening is the task of lower line management, while the actual process to be
controlled is carried out by operating personnel” (p. 452). Hence, the mindset of upper-level
managers who prefer a score-keeping use is targeted towards controlling rather than empow-
ering their organization. In seeking to establish a standardized reporting routine with a
cybernetic control of results, their PMS will be dominated by lagging (outcome) measures at
the expense of leading (predictive) measures (Evans, 2004). Moreover, given upper-level
managers’ preference for performance measures that are simple and easy to use (Gunasekaran
and Kobu, 2007), such a focus on outcomes usually results in a clear dominance of financial
measures and a negligence of non-financial measures (Henri, 2006a). Consequently, it can be
assumed that upper-level managers with a score-keeping mindset—even when made aware of
the importance of SCRM in a supply chain context with increasing levels of market turbu-
lence—will not be inclined to foster PMS design for turbulence. As part of their reporting to
stakeholders, they may provide an initial identification and assessment of supply chain risk, or
even define risk mitigation and contingency strategies upfront to control risk. They will,

42
however, be less inclined to recognize front-line managers’ need for a constant proactive
monitoring of risk through the integration of supply chain risk measures in their organiza-
tion’s PMS.
Thus, even in a supply chain context that is characterized by an increasing level of mar-
ket turbulence, an upper management preference for a score-keeping PMS use will be an
impediment to the design of PMS for supply chain risk. If used at all, risk metrics will play a
subordinate role. Therefore, we propose:
H5: The degree to which upper management uses PMS for score-keeping has a negative
influence on PMS design for turbulence.
3.3 Methodology
3.3.1 Sample design and characteristics
As basis for hypotheses testing, an online survey was conducted to collect primary data
from logistics organizations of manufacturing and trading companies as well as logistics
service providers in Germany. Following Phillips (1981) in that informants are most reliable
when they participate in relevant decision-making processes, our target informants had to be
knowledgeable with their organization’s logistics PMS, the process of supply chain risk
management, and their organization’s distribution service performance. In line with our
research objective, 4,011 potential respondents were gathered from three databases of
managers involved in logistics and supply chain management. They received an email that
announced the survey and asked experts involved in the PMS domain of their respective
logistics organization for registration via an online form, thus yielding an initial sample of
1,063 registered candidates. Only they received a link to the online survey. To ensure a
common understanding, it was pointed out that a performance measurement system (PMS)
refers to any structured set of performance measures used to quantify the efficiency and
effectiveness of operations in the respondents’ respective logistics organization, not necessari-
ly a technologically sophisticated management information system. Given the single inform-
ant approach of the study, anonymity was assured to participants and items of independent
and dependent variables were separated through survey questions that were unrelated to our
model to minimize the potential for common method bias (Podsakoff et al., 2003).
The survey was active between July and September 2011 and three reminder emails
were used to improve the response rate. After eliminating nine data sets because of missing

43
data, a set of 431 responses was used for our analysis, which corresponds to a very good
response rate of 40,5% (Wagner and Kemmerling, 2010). Within these data sets, a remainder
of less than 1% missing item values was estimated using the expectation maximization
algorithm (Dempster et al., 1977). A demographic summary of the companies and respond-
ents is shown in Table 3-1.
Industry Percent Job title of respondents Percent
Automotive 12% Top level executive / director 55%
Machinery and equipment 11% Senior manager 27%
High-tech and electronics 5% Manager 12%
Chemicals and pharmaceuticals 7% Non-executive 6%
Consumer goods 11% Number of logistics employees
Logistics services 42% Less than 100 51%
Other industries 12% 100 to 999 34%
1,000 or more 15%
Table 3-1: Respondent demographics
Besides focusing the initial sample on logistics and supply chain managers, respondent
positions were analyzed to assess the validity of our data (Phillips, 1981). With an average
tenure of more than 14 years and 82% of participants in senior positions, the answers reflect a
high level of competency in our field of research.
Due to our single-informant approach, common method bias may be a problem (Pod-
sakoff et al., 2003) and was assessed using Harman’s single-factor test of common method
bias (Harman, 1967; Paulraj et al., 2012). An unrotated factor analysis of all measurement
items reveals 4 factors with Eigenvalues above 1 that explain 68.2% in total variance, where
the first factor accounts for 33.0% of variance. As the test assumes that, if common method
bias is present, either (a) a single factor will emerge from the factor analysis or (b) one factor
will account for the majority of the covariance among the measures (Podsakoff et al., 2003),
common method bias does not appear to be a problem.
To test for late-response bias, the means of all items were compared between the first
and last third of responses via t-test analysis (Armstrong and Overton, 1977). Results showed
no significant differences (p < 0.05) for any of the items and therefore no indication for a late-
response bias. Moreover, in following Lambert and Harrington (1990) and Mentzer and Flint
(1997), a test for non-response bias was conducted. 30 non-respondents were convinced to
complete an abbreviated version of the survey online, including eight item questions related to

44
the constructs of our model. Again, an independent sample t-test that compared answers
between the full respondent version and the short non-respondent version showed no signifi-
cant differences (p < 0.05). Therefore, it can be assumed that non-response bias does not
influence the results of this research.
3.3.2 Measurement scales
All construct measures used for the survey relied upon multi-item Likert-type scales
(see Appendix 3-1 for all measurement scales and items). A review of the existing logistics,
supply chain management, and accounting literature provided items for the measurement
scales. As the survey was sent to German logistics and supply chain managers, it was first
developed in English, then translated into German, and finally back-translated into English to
ensure validity as recommended by Brislin (1976). Items were discussed with a group of ten
academics and logistics practitioners during development of the survey to validate readability.
As a result of the discussion, a few items were adapted to better fit our research context. Three
further practitioners were involved for specific questions and final validation of the survey.
Both PMS use for attention-focusing and PMS use for score-keeping were measured
with the scales of Vandenbosch (1999). For attention-focusing, one item (“vocabulary in the
organization”) was deemed confusing and therefore omitted. Instead, an item of Henri’s
(2006a) scale (AF4) was added to ensure scale validity and comprehensiveness.
Given the lack of empirical research on the monitoring of market turbulence in the sup-
ply chain context, no suitable instrument to measure PMS design for turbulence could be
identified. Therefore, items were generated based on a review of extant SCRM and PMS
literature (Christopher and Holweg, 2011; Ritchie and Brindley, 2007; Trkman and McCor-
mack, 2009) and discussed with the group of ten researchers and practitioners involved in the
development of the survey. First, statements were formulated to reflect a PMS that accounts
for the monitoring of market turbulence in the supply chain environment. Next, a discussion
of the statements ensured that the items were applicable to the context of any logistics
organization. Small adaptations were made during the translation process to enhance under-
standability for the target group of German-speaking logistics managers.
To measure organizational resilience, statements from conceptual SCRM research
(Ponomarov and Holcomb, 2009; Tang, 2006; Weick et al., 1999) were used to define items.
Unlike broader conceptual SCRM research, these statements specifically referred to the
concept of resilience. After adapting the items to fit the context of our research, they were
subsequently discussed and further refined.

45
Distribution service performance was measured using the established scale of Ellinger
et al. (2000) where one item (“notifying customers in advance”) was replaced with an item
from the scale’s adaptation by Stank et al. (2001) (DSP5) to better reflect the overall fulfill-
ment of customer expectations in logistics operations.
Cronbach’s alpha was used to assess the reliability of the measurement scales and sur-
passed the lower bound of 0.7 (Nunally, 1978) for all constructs. Moreover, all composite
reliabilities (CR) were 0.83 or higher and all average variances extracted (AVE) were 0.55 or
higher. With that, the values well exceeded the recommended 0.7 (Bagozzi and Yi, 1988) and
0.5 (Fornell and Larcker, 1981), respectively. The assumed construct dimensionality and
convergent validity was supported by an exploratory factor analysis (EFA) as shown in the
Appendix 3-2 and a subsequent confirmatory factor analysis (CFA) which indicates good
model fit (χ²/df = 1.76; CFI = 0.98; TLI = 0.97; RMSEA = 0.042) (Garver and Mentzer,
1999). Further, a high significance of loadings for the scales measurement items is confirmed
by a lowest standardized regression path of 0.65 (AF4) and a lowest t-value of 13.63 (DSP2)
(Gerbing and Anderson, 1988; Koufteros, 1999) as shown in Appendix 3-1.
To test discriminant validity between the constructs, a series of chi-square tests was
conducted for one pair of constructs at a time by constraining the estimated correlation to 1.0
(Anderson and Gerbing, 1988; Garver and Mentzer, 1999). Significantly lower χ² values for
the unconstrained models confirm discriminant validity for each pair of constructs (p < 0.05).
3.3.3 Controls
A logistics organization’s actual exposure to market turbulence may influence the pro-
posed relationships. To capture such a potential influence, we controlled for the exposure to
market turbulence. We operationalized this control variable along three items based on the
SCRM literature (Braunscheidel and Suresh, 2009; Trkman and McCormack, 2009) (see
Appendix 3-3). Also, as the sample included both internal logistics departments of manufac-
turing and trading companies (58%) and logistics service providers (42%), we included a
binary control variable for the type of logistics organization to capture any influences that the
different organizational setups may have on the proposed relationships. Further, customer
orientation and cross-functional integration were added as control variables to prevent any
omitted variable bias.4
4 A detailed investigation of customer orientation and cross-functional integration is provided in chapter 2.

46
3.4 Results
To test the hypotheses, the structural model (including the controls) was calculated us-
ing AMOS. As shown in Figure 3-2, the results indicate adequate fit (χ²/df = 2.49; CFI = 0.91;
TLI = 0.90; RMSEA = 0.059) (e.g., Homburg and Baumgartner, 1995). In the right part of the
model, the hypothesized positive impact of PMS design for turbulence on organizational
resilience (H1) receives clear support with a standardized path coefficient of +0.30 and high
significance (p < 0.001). Moreover, organizational resilience shows a strong positive and
highly significant (+0.27; p < 0.001) effect on distribution service performance, also support-
ing hypothesis 2.
Figure 3-2: Results of structural equation model
As the direct path from PMS design for turbulence to distribution service performance
has a very low and non-significant standardized coefficient (+0.02; p > 0.50), hypothesis
3―in proposing that the positive effect of PMS design for turbulence on distribution service
performance is mediated by organizational resilience―receives support as well. Full media-
tion was demonstrated following the test proposed by Bagozzi and Dholakia (2006). The
model with a direct path from PMS design for turbulence to distribution service performance
was compared to a model without the direct path. The difference in chi-square values between
the two models serves as a test for the significance of the added path. This difference is 0.43,
with one degree of freedom, which is not significant (p > 0.50). Hence, the direct path is
insignificant and the 18% of variance in distribution service performance explained by the
model are fully mediated by organizational resilience.
Regarding the effect of upper management's PMS usage focus on PMS design for turbu-
lence examined in the left part of the model, the positive hypothesized impact of attention-

47
focusing (H4) is strongly confirmed with a high standardized coefficient and significance
(+0.55; p < 0.001). The hypothesized negative impact of a score-keeping use on PMS design
for turbulence (H5) finds only very weak support (-0.11; p = 0.26). An overview of hypothe-
sis test results, including coefficients and p-values for the model with and without controls,
can be found in Appendix 3-5.
3.5 Discussion and implications
3.5.1 Theoretical implications
Looking at the established conceptual framework of SCRM as a process of identifying,
assessing, controlling, and monitoring supply chain risk (Hallikas et al., 2004; Norrman and
Jansson, 2004; Wieland and Wallenburg, 2012), prior research focused primarily on the initial
identification and assessment of risk as well as on mitigation and contingency strategies to
control risk. In arguing that a constant monitoring of supply chain risk to sense new develop-
ments is of pivotal importance in SCRM, the aim of this research was to show the value of
supply chain risk metrics in an organization’s PMS and to outline the mechanism underlying
their impact on distribution service performance. These metrics were focused on market
turbulence which, in recent years, turned out to be a major source of supply chain risk.
Besides adding to the existing research that, for the most part, looks at SCRM as an isolated
organizational process, one of the study's contributions lies in bringing together SCRM and an
established element of management control, namely PMS. As Christopher and Holweg
(2011), in light of higher levels of market turbulence, have proposed to revisit management
accounting procedures from a supply chain management perspective, PMS design for
turbulence underlines the value of integrating the monitoring of market turbulence into PMS
as an established system of management control. In investigating this value, we related PMS
design for turbulence to organizational resilience as a key capability and confirmed the
positive impact on distribution service performance as a key customer-related outcome in
logistics operations. The actual exposure to market turbulence which we used as a control
variable does neither significantly impact PMS design for turbulence or organizational
resilience, nor the proposed relationships. Even in a moderation analysis that divides the
sample into two sub-samples of logistics organizations with a high and low exposure to
market turbulence, the proposed relationships between PMS design for turbulence, organiza-
tional resilience, and distribution service performance remain significant for both groups. This

48
finding shows that even logistics organizations with a relatively low exposure, in the era of
turbulence, are still sufficiently affected to benefit from the confirmed relationships and the
positive impact on distribution service performance. Similarly, a moderation analysis between
the two basic types of logistics organizations in our sample―shippers’ internal logistics
departments on the one hand (n = 251) and logistics service providers (n = 180) on the other
hand―shows no significant path differences in a chi-square test (p < 0.05), thus confirming
the robustness of results and their generalizability to different organizational contexts in
logistics operations.
In line with the RBV perspective taken in this research where organizational capabilities
forge the link between valuable resources and competitive advantage (Amit and Schoemaker,
1993), the impact of PMS design for turbulence as an intangible resource is fully mediated by
organizational resilience which substantially explains distribution service performance (R2 =
18%). Here, having no evidence for a direct performance impact of PMS design for turbu-
lence is an important finding as it shows that risk monitoring by itself cannot unfold its
benefits unless translated into organizational resilience. Our results show that companies must
take an effort in leveraging the information provided by supply chain risk metrics to prepare
for market turbulence by building organizational resilience.
In seeking to understand why, in current logistics practice, some organizations make use
of supply chain risk metrics while others do not (Weber et al., 2012), we built on Henri’s
(2006a) concept of upper management control impact on PMS design. The results shed light
on upper management’s role in driving or impeding PMS design for turbulence. Our find-
ings―where an attention-focusing PMS use explains a substantial share of PMS design for
turbulence―confirm that upper-level managers better realize the need for supply chain risk
metrics when using PMS for attention-focusing rather than for score-keeping. These findings,
while validating the expected effect of an attention-focusing PMS use in the SCRM context,
are in line with the strong positive implications on organizational competitiveness found by
Vandenbosch (1999) and on the diversity of performance measures found by Henri (2006a).
In contrast, we could not find sufficient proof for our hypothesis that a score-keeping
PMS use, in representing a mindset that primarily seeks to control an organization, negatively
influences PMS design for turbulence. The proposed negative effect turns out to be insignifi-
cant. Still, the difference between the impact of an attention-focusing PMS use and a score-
keeping use is highly significant. Moreover, as our data confirm prior findings that the
different types of PMS use are not mutually exclusive but co-exist in managerial practice

49
(Ansari and Euske, 1987), PMS design for turbulence will mainly depend on the positive
impact of upper management PMS use for attention-focusing.
3.5.2 Managerial implications
The results of our study offer several insightful implications for logistics managers.
Given the need to manage supply chains in the context of higher levels of market turbulence,
we provide clear support that the integration of supply chain risk metrics in the PMS of an
organization can be a source of competitive advantage. Even for organizations with a
relatively low exposure to market turbulence, the proposed relationships of our RBV perspec-
tive (resource → capability → performance) are confirmed. Accordingly, logistics managers
need to be aware that―even if they consider their organization to be less affected by market
turbulence than others―PMS design for turbulence can still be an enabler of distribution
service performance. However, the results confirm that risk monitoring through an organiza-
tion's PMS promises higher levels of performance only if logistics organizations manage to
translate their risk awareness into resilient operations. Moreover, we have demonstrated that
upper-level managers' mindset plays an essential role in accounting for turbulence in PMS
design to support front-line managers and employees in daily operations. Hence, upper-level
managers can draw conclusions in two principal fields.
First, they need to critically review the readiness of their PMS for the monitoring of
market turbulence. If supply chain risk metrics are not being used in their organization, they
may want to reconsider PMS design, including their own role in selecting and prioritizing the
mix of measures. As a possible explanation for the lack of supply chain risk metrics consists
in a strong focus on score-keeping, accounting for new supply chain management require-
ments in PMS design requires a broader perspective of the risks associated with higher levels
of market turbulence. Although upper management’s mindset and hence the focus of control
in an organization will not change overnight, moving towards an attention-focusing PMS use
will gradually prepare an organization for supply chain risk. Here, it will be of pivotal
importance to involve front-line managers and employees with a sound understanding of risk
monitoring needs in daily operations. Only upper-level managers who, for the sake of
simplicity, take a conscious decision to focus on a score-keeping PMS use (Vandenbosch,
1999) may continue to pass on the integration of supply chain risk metrics.
Second, as the mere use and reporting of risk metrics does not imply higher levels of
performance by itself but through organizational resilience only, a learning process is required
to truly leverage the benefits arising from risk monitoring. From a managerial perspective,

50
this is an important finding which, at first glance, contradicts the often cited phrase “what gets
measured gets done” (e.g. Otley, 1999). At second glance, it confirms that SCRM cannot
follow the cybernetic control logic often used for financial controlling where goals are set in
advance and compared to actual results (Hofstede, 1978). As supply chain risk represents an
external factor, it is mostly impossible or inappropriate to monitor results against predefined
goals. Tracking the potential impact of market turbulence, for example, cannot follow a
cybernetic logic. However, upper-level and front-line managers can jointly ensure that the
information provided by supply chain risk metrics actually translates into the capability to
better cope with supply chain risk.
3.6 Limitations and future research
Besides the discussed findings of this study, a few issues need to be pointed out that al-
so offer promising avenues for further research.
First, data were solely collected in Germany which may limit the generalization of find-
ings (Wagner and Bode, 2006). Second, in seeking to bring together SCRM with PMS as an
established management control system, we had to measure PMS design for turbulence with
rather general items to fit the different organizational contexts of participating companies and,
due to its importance, we concentrated on market turbulence rather than other supply chain
risk sources. Moreover, no “hard facts” were drawn upon to measure distribution service
performance, though the high share of participating key informants provides reliable results.
In further investigating the role of PMS for risk management, it would be interesting to
explore more specific supply chain setups, including the identification of particular risk
metrics being used in managerial practice. Here, we would strongly encourage case study
research that would not only contribute to SCRM research, but at the same time allow
“revisiting the management accounting procedures that are used to evaluate different supply
chain decisions” as proposed by Christopher and Holweg (2011). A multiple case study of
different companies involved in a supply chain may yield interesting insights into the
relationship between PMS design for turbulence, organizational resilience, and overall supply
chain resilience.
Moreover, in seeking to understand the drivers and impediments underlying PMS de-
sign for turbulence, our study focused on two opposing types of PMS use as a contingent
variable for PMS design. Other organizational factors may also play an important role in this
context. Besides investigating a broader scope of organizational culture for the role of

51
management control systems in SCRM, examining other determinants of PMS design such as
strategic priorities (Henri, 2006a) would provide valuable contributions to the supply chain
management and accounting literature.

52
4 The state of performance measure-
ment systems in logistics practice:
Patterns and outcomes5
5 This chapter is based upon the eponymous paper co-authored with Carl Marcus Wallenburg and presented at
the NOFOMA conference 2013.

53
4.1 Introduction
In logistics and supply chain management (SCM) practice, increasing competitive pres-
sures have made cost and service advantages a key part of many companies' corporate
strategies (McGinnis and Kohn, 2002; Lai, 2004). To manage operations in line with these
strategic objectives, decision-makers require adequate performance measurement systems
(PMS) with financial and non-financial metrics to fulfill their information needs (Fawcett et.
al, 1997). As PMS has become an established element of managerial control in practice,
various conceptual frameworks for advanced PMS design have emerged, also within the field
of logistics (Gunasekaran and Kobu, 2007). Yet, little attempt has been made to empirically
show how logistics organizations design their PMS and whether they actually follow the
scholarly recommendations. Only Fawcett and Cooper (1998) and Keebler and Plank (2009)
provided first insights into the state of logistics performance measurement in U.S. companies.
And even though our study shows that logistics managers attribute a high importance to their
organization's PMS, the assessment of Melnyk et al. (2004, p. 210) that “performance
measurement continues to present a challenge to operations managers as well as researchers
of operations management” is still true today.
The objective of our research is to comprehensively describe the current state of PMS in
logistics practice—both in internal logistics departments of manufacturing and trading
companies (shippers) and at logistics service providers (LSPs)—and to provide an under-
standing for the associated context factors and outcomes of advanced logistics performance
measurement. To do so, we empirically identify typical design patterns along seven design
dimensions. These dimensions that distinguish a more advanced from a less advanced PMS
(e.g. timeliness of information) were extracted from the literature and serve as the basis for
the clustering of logistics organizations.
In order to provide guidance for both logistics managers and researchers, we build on
and substantially expand prior PMS research in several ways. First, we identify distinct
sophistication levels of PMS that can be observed in practice. Second, we investigate the
propositions of Fawcett and Cooper (1998) and Keebler and Plank (2009) that higher levels of
PMS sophistication relate to a higher coverage of key performance measures. Third, this
research is the first to address potential differences in logistics performance measurement
practice between shippers, where logistics operations are embedded into a larger organiza-
tional context, and LSPs, which are "pure players" with logistics being their core competence
(Lai, 2004). Fourth, given the growing degree of turbulence within supply chain and in their
external environment (Blome and Schoenherr, 2011) and the broad consensus that “perfor-

54
mance measurement in the new supply era is still an open area of research” (Akyuz and
Erkan, 2010, p. 5137), we investigate whether logistics organizations account for this
development by enhanced PMS. Finally, Morgan (2004) points out that even company failure
may result from the difference between a good PMS and a mediocre PMS. Therefore, this
research investigates the link between PMS design and competition-related outcomes.
4.2 Research framework
4.2.1 Attributes of advanced PMS design
PMS, for more than two decades, have received considerable attention across disci-
plines. In seeking to provide guidance for the design of PMS which address the deficits that
short-term, purely profit-driven performance measurement have (Bond, 1999; Hofstede,
1978), researchers’ contributions have ranged from broad conceptual frameworks for
advanced PMS like the balanced scorecard (Kaplan and Norton, 1992) to context-specific
frameworks in operations management and logistics (e.g. Neely and Adams, 2000; Griffis et
al., 2007; Gunasekaran et al., 2004).
Empirical research on the actual state of PMS in logistics practice has, despite the large
body of conceptual insights, mainly focused on examining the use of specific performance
measures. Here, Fawcett and Cooper (1998) and Keebler and Plank (2009) provided valuable
insights into the use of key measures. Yet, to fully grasp an PMS as an entity, it is also
important to examine the underlying attributes of PMS design (Neely et al., 1995; Tangen,
2004), which further distinguish more from less advanced PMS in logistics organizations.
Within the large body of conceptual research in the accounting, operations, as well as
logistics and SCM literature, different frameworks for advanced PMS design focus on
different key aspects and different levels of detail. Yet, they share a number of underlying and
recurring attributes suggested across disciplines, which we have identified through an
extensive literature review. Four of the design attributes refer to content-related design of the
PMS, we call this domain PMS scope, and three attributes refer to the user-oriented prepara-
tion and presentation of performance measurement information which we call PMS usability
(see Table 4-1).
Regarding PMS scope, the prior literature widely outlines three attributes that advanced
PMS should entail measurement diversity, strategic-operational linkage, and external linkage.

55
We complement these three attributes by a fourth of key importance for logistics organiza-
tions, design for turbulence.
PMS scope Sources from cross-disciplinary literature review
Measurement Diversity Amir et al. (2010); Brignall and Ballantine (1996); Chenhall (2005); Eccles (1991); Evans (2004); Henri (2006a); Ittner et al. (2003); Malina and Selto (2004); Malmi and Brown (2008); Neely et al. (1995); Rodrigues et al. (2004)
Strategic-Operational Linkage Caplice and Sheffi (1995); Bourne et al., (2000); Chenhall (2005); Ferreira and Otley (2009); Ittner et al. (2003); Kaplan and Norton (1992); Otley (1999); Petersen et al. (2009); Pun and White (2005); Wisner and Fawcett (1991)
External Linkage Akyuz and Erkan (2010); Chenhall (2005); Evans (2004); Gunasekar-an and Kobu (2007); van Hoek (1998); Keebler and Plank (2009); Lai (2002); Malina and Selto (2004); Morgan (2004); Neely (2005); Simatupang and Sridharan (2004)
PMS usability Sources from cross-disciplinary literature review
Information Timeliness Amir et al. (2010); Fawcett et al. (1997); Ferreira and Otley (2009); Ghalayini et al. (1997); Griffis et al. (2004); Ittner et al. (2003); Neely et al. (1995); Selviaridis and Spring (2007)
Information Aggregation Amigoni (1978); Bond (1999); Brignall and Ballantine (1996); Caplice and Sheffi (1994); Ferreira and Otley (2009); Ittner et al. (2003); Lee et al. (2002); Morgan (2004); Pun and White (2005)
System Adaptability Brignall and Ballantine (1996); Ghalayini et al. (1997); Griffis et al. (2007); Kennerley and Neely (2003); Malina and Selto (2004); McGinnis and Kohn (2002); Morgan (2004); Neely (2005)
Table 4-1: Established attributes of advanced PMS design
Measurement diversity refers to the degree to which a PMS uses a broad set of comple-
mentary, financial and non-financial performance measures instead of few narrow-focused
measures in order to keep managers from ignoring relevant aspects of performance (Malina
and Selto, 2004; Ittner et al., 2003). Strategic-operational linkage refers to the degree to
which a PMS links an organization’s strategic goals with the organizational level through
performance measures (Kaplan and Norton, 1992; Wisner and Fawcett, 1991). External
linkage refers to the degree to which a PMS accounts for external elements (e.g. suppliers and
customers) in the supply chain and their interrelation with the performance of the logistics
organization (Gunasekaran and Kobu, 2007; Rodrigues et al., 2004). Without necessarily
implying the integration of systems across organizations, it supports coordination within the
supply chain (Akyuz and Erkan, 2010). Due to logistics’ upstream and downstream intercon-
nectedness within the supply chain, external linkage stands out as particularly relevant

56
attribute for logistics organizations (van Hoek, 1998). Moreover, as risks within the supply
chain have become an increasing challenge in recent years, Christopher and Holweg (2011)
posit that higher levels of turbulence and volatility “will require revisiting the management
accounting procedures that are used to evaluate different supply chain decisions” (p. 64).
Also, Ritchie and Brindley (2007) as well as Rasid et al. (2012) have proposed to account for
the new challenges in performance measurement. Therefore, PMS design for turbulence has
to be considered as a fourth attribute of advanced PMS in logistics organization. It captures
the degree to which a PMS enables companies to understand and accounts for market
turbulence by providing corresponding risk metrics.
PMS usability entails three attributes that characterize advanced PMS: information time-
liness, information aggregation, and system adaptability. The first attribute, information
timeliness, refers to the degree to which a PMS ensures that performance information is
readily available and not provided with a substantial time-lag which allows managers to
identify operational priorities and take corrective action where needed (Fawcett et al., 1997;
Gunasekaran and Kobu, 2007). Information aggregation refers to the degree to which a PMS
focuses performance information on the most relevant aspects accounting for managers’
information needs and time constraints (Ferreira and Otley, 2009) with less detailed and more
aggregated performance measures at higher levels in the managerial hierarchy (Brignall and
Ballantine, 1996). System adaptability refers to the degree to which the PMS itself can easily
be adjusted to new requirements (Malina and Selto, 2004) as “managers must be able to (…)
select new or different measures consistent with evolving organizational priorities” (Griffis et
al., 2007, p. 35).
Together, the outlined seven attributes can be used to distinguish more advanced from
less advanced of PMS design. Therefore, we use them to outline current performance
measurement practices in logistics organizations.
4.2.2 Associated factors of PMS design
Providing a comprehensive picture about the state of performance measurement in lo-
gistics practice also requires an understanding of the organizational context and the factors
that may be related to PMS design (Chenhall, 2003; Ferreira and Otley, 2009). Here, contin-
gency-based research in the accounting literature has mainly proposed factors as the organiza-
tion’s environment, technology, size, structure, and strategy (Chenhall, 2003; Henri, 2006a).
This research, besides examining a broad range of context factors suggested in prior research,

57
provides a thorough insights into few specific factors that are of particular relevance in
logistics PMS.
Coverage of key logistical performance measures
Prior empirical logistics research (e.g. Fawcett and Cooper, 1998; Keebler and Plank,
2009), has mainly used the coverage of key logistical performance measures as an indicator to
judge how advanced a PMS is. They found greater levels of information availability regarding
key logistical performance measures to be associated with higher levels of organizational
competitiveness. As one may argue that the mere number of indicators is not what drives
competitiveness, we want to view the relationship between different PMS design patterns and
the corresponding coverage of key performance measures. With that we expand on Fawcett
and Cooper (1998, p. 348), who state that “high performance logistics firms have greater
access to measurement information”, where superior access can both be related to scope and
usability. For comparability reasons we consolidated the performance measures used by
Fawcett and Cooper (1998) and Keebler and Plank (2009) to a list of 25 measures that are
both applicable and comparable in content for shippers’ internal logistics organizations and
LSPs. In line with their classifications of performance measures and given the cost-to-service
tradeoff in logistics (Stank et al., 2001), we covered both logistics efficiency (16 measures
related to financials and productivity) and logistics effectiveness (9 measures related to
process quality and customer service).
Shippers’ logistics organizations vs. LSPs
Given the immanent differences between shippers’ internal logistics departments and
LSPs, it is reasonable to assume that PMS design patterns will differ between these two types
of logistics organizations. For LSPs, logistics operations are at the core of their business
(Busse and Wallenburg, 2011), thus representing the focus of their entire organization. For
shippers, in contrast, their internal logistics organization represents one of several functional
areas within a larger organizational context. As “pure players” LSPs have two advantages,
from a core-competence perspective (Prahalad and Hamel, 1990) their logistics has far greater
importance and will receive more management attention and resources, which facilitates
better PMS. Second, their PMS is not embedded into a larger company context and, therefore,
does not need to compromise with PMS designs directives catered for other business func-
tions. Contrasting this, shippers often claim better managerial competences in logistics than
many LSPs―supposedly the latter have not outgrown a pure hands-on mentality that focuses

58
on basic functions of transportation and storage. In order to shed more light on these issues we
investigate possible differences in PMS design between the two groups.
Turbulence
In recent years, logistics organizations have been facing a growing degree of supply and
demand market turbulence as major sources of supply chain risks (Blome and Schoenherr,
2011). As a consequence, Christopher and Holweg (2011) proposed that higher levels of
turbulence “will require revisiting the management accounting procedures that are used to
evaluate different supply chain decisions” (p. 64). Following this line of thought and other
claims in the literature that logistics performance measurement needs to account for supply
chain risk (e.g. Rasid et al., 2012; Ritchie and Brindley, 2007), it may be assumed that
logistics organizations that are exposed to high environmental turbulence should reflect this
especially in the supply chain related elements of PMS (i.e. in the attributes external linkage
and design for turbulence).
While prior empirical research showed that performance measurement at the supply
chain level is rather limited (Keebler and Plank, 2009), we provide a more detailed under-
standing, by examining the link between a logistics organization’s exposure to turbulence and
PMS design patterns. This provides insights whether or not logistics organizations actually
respond to the “era of turbulence” (Christopher and Holweg, 2011, p. 80) in performance
measurement practice.
Outcomes
By addressing the information needs of managers “who must convert firm resources in-
to customer value more efficiently and effectively” (Fawcett et al. 1997, p. 410), PMS
ultimately serves as facilitator of performance. Accordingly, Gunasekaran and Kobu (2007),
in their literature review on logistics performance measurement have stated that “the real
challenge for managers of this new enterprise environment is to develop suitable performance
measures and metrics to make right decisions that would contribute to an improved organiza-
tional competitiveness” (p. 2819). In logistics operations, organizational competitiveness is
primarily reflected by increased levels of logistics efficiency (i.e. how well resources are
utilized), and logistics effectiveness (i.e. how well goals are accomplished) (Mentzer and
Konrad, 1991).
Yet, prior research has also discussed PMS satisfaction as a criterion of PMS success
(e.g. Banker et al., 2001; Ittner et al., 2003). For logistics managers, PMS satisfaction,
usefulness, and perceived cost-benefit efficiency may serve as a proxy for their PMS’ actual

59
contribution to competitiveness. Therefore, we include these three directly PMS-related
aspects to complement logistics efficiency and effectiveness as the objective measures of
logistics performance.
4.3 Methodology
4.3.1 Data collection
To provide a comprehensive picture on the state of PMS practice in German logistics
organizations, an online survey was used to collect primary data from both shippers and LSPs.
Following a key informant approach (Phillips, 1981), participants had to be knowledgeable
with their firm’s logistics PMS and related organizational context. Therefore, an announce-
ment of the survey was sent to potential respondents from three databases of logistics and
supply chain managers―both at shippers’ internal logistics departments and at LSPs―that
asked experts involved in the PMS domain of their respective logistics organization for an
online registration. After a four-week registration period, an initial sample of 1,063 registered
candidates received the link to our online survey, thus yielding a total of 431 complete and
usable data sets (251 from shippers and 180 from LSPs, respectively). Respondent de-
mographics are shown in Table 4-2.
Industry Percent Job title of respondents Percent
Automotive 12% Top level executive / director 55%
Machinery and equipment 11% Senior manager 27%
High-tech and electronics 5% Manager 12%
Chemicals and pharmaceuticals 7% Non-executive 6%
Consumer goods 11% Number of logistics employees
Logistics services 42% Less than 100 51%
Other industries 12% 100 to 999 34%
1,000 or more 15%
Table 4-2: Respondent demographics
4.3.2 Measurement
Building on our extensive literature review of the established attributes of advanced
PMS design and its associated factors, a group of ten logistics practitioners and researchers

60
were involved in the development of our survey instrument. To measure the attributes of PMS
design, statements from the literature review (see Table 4-1) were used and validated using an
item sorting approach developed by Moore and Benbasat (1991). The final scales are shown
in Appendix 4-1. Logistics efficiency and effectiveness were measured using established
items that are equally applicable to shippers and LSPs from Ellinger et al. (2000), Stank et al.
(2001), and Fugate et al. (2010). Items for the measurement of subjective perceptions of PMS
success (satisfaction, usefulness, and cost-benefit efficiency) as well as for a logistics
organization’s level of exposure to market turbulence were newly developed as no suitable
instruments exist in the literature. Subsequently, three further logistics managers were
involved to validate the final survey and to identify remaining ambiguities or wording issues.
The scales can be found in Appendix 4-1.
Given the study’s single informant approach, items of different variables were separated
through other survey questions to minimize the risk of common-method bias. Moreover, using
t-test analysis, neither an indication for late-response bias nor an indication for non-response
bias was found following the rationale of Armstrong and Overton (1977) and Lambert and
Harrington (1990).
4.3.3 Data analysis
As one major objective of this study is to identify distinct types of companies based on
their PMS design we follow previous research (Gerdin, 2005; Gomes et al., 2006) and use
cluster analysis along the seven design attributes to explore the PMS patterns observable in
logistics practice. Cluster analysis allows exploring relations of similarity where each cluster
is as homogeneous as possible with respect to the characteristics of interest and distinctively
different from the other clusters (Lai, 2004; Gerdin, 2005). As a basis for the analysis, for
each PMS design attribute (measurement diversity (MD), strategic-operational linkage (SOL),
external linkage (EL), design for turbulence (DT), information timeliness (IT), information
aggregation (IA), and system adaptability (SA)) a score was computed as the mean of the
corresponding scale items. Given the objective of identifying distinct PMS types based on the
design attributes, a categorical differentiation was required to clearly distinguish high from
low implementation levels for each design attribute (Lai, 2004). Therefore, the means were
translated into three rank-values with “0” for the lowest 25% of companies within that
attribute, “1” for the intermediate 50%, and “2” for the highest 25% within the attribute.
Hierarchical cluster analysis, using the squared Euclidean distance as agglomeration coeffi-
cient to maximize within-clusters homogeneity (Gerdin, 2005), suggests that a division into

61
five company clusters represents the best solution based on a large percentage change in the
agglomeration coefficient between a five and a four cluster solution.
After having identified the five clusters, we used different uni- and multivariate statisti-
cal methods including ANOVA and regression analysis to analyze the relationships of the
PMS design to the key domains outlined in the concept section (i.e. associated factors and
outcomes of PMS design).
4.4 Empirical results
4.4.1 Patterns of PMS design
The key characteristics of each PMS type are summarized in Table 4-3 and will be de-
scribed hereafter.
PMS type Description Implementation level
of PMS design attributes Noteworthy
structural features1
MD SOL EL DT IT IA SA
Average 4.7 4.2 3.5 3.7 5.1 5.1 4.6
1. “All-round laggards” (n = 63; 15%)
Least advanced PMS with broad design deficits
2.6 2.4 1.8 1.9 3.5 3.6 3.5 Size
2: 70% small
Industry: Machinery
2. “Usability laggards” (n = 49; 11%)
PMS with substantial usability deficits
4.2 3.4 3.2 3.4 3.5 4.0 3.1 Size
2: 41% mid-size
Industry: Automotive
3. “Middlers” (n = 111; 26%)
Mediocre PMS with still considerable deficits
4.4 4.0 2.9 3.2 5.2 5.1 4.3 -
4. “Turbulence leaders” (n = 57; 13%)
Advanced PMS with strong external focus
5.6 4.6 4.4 5.1 5.1 5.2 5.0 Industry: High-tech
5. “All-round leaders” (n = 151; 35%)
Well-advanced PMS with no major design deficits
5.7 5.1 4.4 4.3 6.2 6.1 5.7 Industry: Consumer goods
1 See Appendix 4-2 for details on structural characteristics
2 Number of logistics employees in organization: Small (less than 100) = 51%; mid-size (100 up to 999) = 33%; large (1000 or more) = 16%
Table 4-3: PMS types with key characteristics
PMS Type I―“All-round laggards”: A first group of logistics organizations (n = 63;
15%) shows substantial deficits along all seven design attributes. The attribute scores of this
group lie well below the overall average and only at between 40 and 60 percent of the values
of the most advanced group. Deficits can be observed across all attributes. Yet, they are most
pronounced regarding PMS scope. Looking at the structural company data, companies with

62
less than 100 employees in logistics are overrepresented (70% of type I companies are small,
compared to 40% of other companies in our study). Further, the machinery industry is
overrepresented.
PMS Type II―“Usability laggards”: This cluster (n = 49; 11%) contains the logistics
organizations that are similar to the all-round laggards in their deficiencies with respect to
PMS usability (i.e. in terms of IT, IA, and SA). At the same time, they are substantially more
advanced than the “all-round-laggards” along the attributes of PMS scope (MD, SOL, EL, and
DT) and with that only slightly below the overall averages in the four PMS scope attributes.
As the smallest cluster, this PMS design pattern appears to be rather uncommon in logistics
practice. From a structural perspective, medium and large organizations are overrepresented
just as the automotive industry.
PMS Type III―“Middlers”: Performance measurement practice of these logistics or-
ganizations (n = 111; 26%) are characterized by a middling position―not being good, but
also not really bad across all seven attributes. Correspondingly, both PMS scope and usability
are close to the overall sample mean.
PMS Type IV―“Turbulence leaders”: A rather small group of logistics organizations
(n = 57; 13%), is at a middle level in terms of PMS usability, but is leading with respect to
PMS scope. This group seams particularly well prepared for today’s supply chain require-
ments in performance measurement; not only are links to external partners (EL) well account-
ed for, but this PMS type is clearly most advanced in usage of risk measures related to market
turbulence (DT). From a structural perspective, high-tech companies are strongly represented
in this cluster.
PMS Type V―“All-round leaders”: The PMS of logistics organizations in this cluster
(n = 151; 35%) is advanced along all design attributes. The cluster represents a rather large
group of organizations that, albeit still leaving room for further progress in PMS design
(especially in the supply chain related attributes EL and DT), have managed to implement a
rather comprehensive performance measurement practice, both regarding PMS scope and
usability.
Overall, there is still room for improvement for all PMS types and along all design at-
tributes. While many logistics organizations have managed to reach sound levels especially in
the areas of information timeliness and information aggregation, the average implementation
level of external linkage and design for turbulence stand out as particularly lagging. Here,
without necessarily integrating PMS across company boundaries, logistics organizations need

63
to further account for their interrelation with external partners in the supply chain that may
have an impact on their own performance.
In comparing the PMS design patterns of all clusters, Figure 4-1 shows the relative im-
plementation levels along all design attributes for all clusters (100% is the value of the all-
round leaders on the respective attribute).
Figure 4-1: PMS types and development path
First of all, the patterns reveal the close connections within PMS scope and within PMS
usability. Changes in the different attributes of PMS scope (MD, SOL, EL, and DT) go hand
in hand with one another, i.e. a higher implementation level of measurement diversity, for the
most part, comes with higher implementation levels of the other attributes of PMS scope. The
same applies for the attributes of PMS usability. Second, one can observe a pattern that
corresponds to a possible development path. Moving from the least advanced to the most
advanced PMS type (from I to V), alternating improvements occur. Starting from an all-round
low level (all-round laggards), the next level is characterized by improved PMS scope
(indicated with (1) in Figure 1). Then from II to III PMS usability improves, before again
PMS scope improves from III to IV. The last improvement is PMS usability, when moving
from type IV to V.
Moreover, several structural factors where tested for (e.g., IT usage, educational level,
and industry). Here, the only significant finding is that small organizations with less than 100
logistics employees are lagging behind in PMS scope and PMS usability whereas size has no
significant impact when comparing mid-size and large organizations.

64
4.4.2 Coverage of key performance measures
Both Fawcett and Cooper (1998) and Keebler and Plank (2009), in empirically investi-
gating the state of performance measurement in logistics practice, have focused on the
coverage of key performance measures as a proxy for performance measurement comprehen-
siveness and hence PMS sophistication. Our study, while focusing on the design attributes of
a system rather than specific performance measures to assess PMS sophistication, confirms
their findings for the most part. While data were collected for 25 key performance measures
related to the two principal areas of logistics effectiveness and efficiency. Table 4-4 shows an
excerpt of four pivotal measures in each category (see Appendix 4-2 for full list). Looking at
the results, it becomes evident that the coverage of key logistical performance measures
steadily increases as PMS advances moving from Type I over Types II and III to Types IV
and V.
Performance measures
Cluster I: All-round laggards
Cluster II: Usability laggards
Cluster III: Middlers
Cluster IV: Turbulence
leaders
Cluster V: All-round leaders
Difference I to V
(p-value)
Ave-rage I to V
Fawcett/ Cooper (1998)
Keebler/ Plank (2009)
Logistics effectiveness (average of all 9 measures)
41% 55% 56% 68% 66% 59% 72% 64%
On-time delivery 65% 69% 77% 95% 90% 25%
(0.01) 81% 88% 79%
Order fill rate 49% 66% 68% 84% 82% 33%
(0.01) 73% 85% 81%
Cycle time 30% 53% 57% 63% 63% 33%
(0.01) 55% 83% 62%
Customer complaints 70% 80% 84% 89% 91% 11%
(0.01) 84% 73% 76%
Logistics efficiency (average of all 16 measures)
36% 51% 51% 63% 66% 55% 75% 53%
Total logistics cost 52% 69% 71% 86% 89% 37%
(0.01) 77% 94% N/A
Freight cost 79% 82% 86% 93% 90% 11%
(0.05) 87% 87%
1 78%
1
Equipment downtime 21% 35% 41% 67% 59% 38%
(0.01) 47% 56% 46%
Labor utilization 32% 57% 64% 86% 81% 49%
(0.01) 67% N/A 36%
1Calculated average value for inbound freight cost and outbound freight cost
Table 4-4: Coverage of key performance measures
Moreover, the increase in the coverage of key performance measures particularly corre-
sponds with the “development path” of PMS design attributes that are related to improve-

65
ments in PMS scope rather than PMS usability. A substantial gap in key performance
measures coverage is present between the all-round laggards and the two following clusters
(usability laggards and middlers) and again for the two top clusters (all-round leaders and
turbulence leaders). A comparison between the all-round laggards and both usability laggards
and middlers shows that some shifts in key performance measure coverage are significant at
the p < 0.05 level (e.g. order fill rate, cycle time, labor utilization) while others are not (e.g.
on-time delivery, customer complaints, freight cost). Yet, all of these differences are equally
significant (or non-significant) for both Type II and III.
The overall difference between the all-round laggards and both top clusters (all-round
leaders and turbulence leaders) are highly significant (p < 0.01) for all performance measures
except for one (freight costs; p < 0.05). Even between the middle two clusters and the top two
clusters all differences are significant at p < 0.05 except for the availability of the measure
customer complaints. In contrast, the differences within these two groups (i.e. between all-
round leaders and turbulence leaders respectively between middlers and usability laggards are
not significant (p > 0.05) for any key performance measure.
In comparing the results to the studies conducted by Fawcett and Cooper (1998) as well
as Keebler and Plank (2009) conducted with U.S. organizations and our results from Germa-
ny, we notice two things: First, Fawcett and Cooper (1998)―with very few excep-
tions―found a higher overall coverage of key performance measures. While it must be
doubted that information availability, in general, was higher in the late 1990s, the difference
may be caused by Fawcett and Cooper’s focus on large corporations with a more detailed
reporting of performance measurement information. Average availabilities found by Keebler
and Plank (2009) are closer to the results of our study. Second, there has been no clearly
discernible shift in key performance measure coverage from effectiveness to efficiency or
vice versa.
While our study shows that the coverage of key performance measures actually is a
proxy for how advanced the PMS is, it is important not to confound the importance of key
performance measures with a need for a high number of performance measures. In line with
the design attribute of information aggregation, it remains important to focus performance
measurement on a limited number of selected measures (Bond, 1999; Tangen, 2004) rather
than practicing excessive reporting that may result in information overload (Schick et al.,
1990).

66
4.4.3 Shippers vs. LSPs
A comparison between internal logistics departments of manufacturing and trading
companies (shippers) on the one hand and LSPs on the other hand does not reveal any major
differences in PMS sophistication. As shown in Table 4-5, only the usability laggards and the
turbulence leaders stand out as outliers regarding the sample’s overall shares of 58% shippers
and 42% LSPs. Within the usability laggards, LSPs are overrepresented (49%) and, thus,
more often suffer from a lack of PMS usability in terms of well-prepared performance
measurement information than shippers. One could have imagined the use of less sophisticat-
ed information technology as a possible explanation, but a one-item question asking respond-
ents for the intensity of IT usage shows no significant difference between shippers and LSPs.
Type of logistics organization
Cluster I: All-round laggards
Cluster II: Usability laggards
Cluster III: Middlers
Cluster IV: Turbulence
leaders
Cluster V: All-round leaders
Average
Shippers 57%
(n=36) 51%
(n=25) 57%
(n=63) 67%
(n=38) 59%
(n=89) 58%
(n=251)
LSPs 43%
(n=27) 49%
(n=24) 43%
(n=48) 33%
(n=19) 41%
(n=62) 42%
(n=180)
Table 4-5: Cluster shares – Shippers vs. LSPs
Moreover, shippers (67%) are clearly overrepresented among the turbulence leaders.
This may be due to their higher awareness of supply chain complexity. While LSPs can focus
on their customers as well as a small number of suppliers and horizontal cooperation partners
(Schmoltzi and Wallenburg, 2011), shippers tend to operate directly in supply chain that today
are more and more complex (Peck and Christopher, 2003; Sheffi and Rice, 2005).
Overall, LSPs appear less homogeneous with a wider spread in PMS sophistication
across clusters which is confirmed by higher standard deviations along the PMS design
attributes (mean standard deviation along all attributes is 1.54 for LSPs, 1.38 for shippers).
Hence, LSPs as "pure players" with logistics as their core competence (Lai, 2004), as a whole,
do not show the advantages in PMS design that one could have expected. Rather, the LSP
industry exhibits both organizations with a very good PMS and organizations with a substan-
tial need to catch up with those good practices. One explanation is that the logistics industry
in general, and particularly in Germany, is very fragmented (Wagner and Kemmerling, 2010)

67
with a number of leading-edge companies on the one hand and a high share of small, to be
further professionalized organizations on the other hand.
4.4.4 Market turbulence and PMS design
The literature claims that logistics organizations need to account for new and expanded
PMS requirements in the “era of turbulence” (Christopher and Holweg, 2011, p. 80). This
claim is understandable and consistent with contingency theory and the idea of fit between the
organizational setup and the external context (Donaldson, 2001). Consequently, when the
environment becomes less predictable, companies need to improve their PMS as part of their
overall management control system.
Yet, our results indicate a very different picture in reality. A superior PMS does not ap-
pear to be the result of responding to a challenging context. In fact, all five PMS clusters
exhibit almost the same level of supply and demand market turbulence and the slight differ-
ences are not significant (p > 0.10). Moreover, the two most opposing PMS clusters with
regarding PMS design for turbulence, turbulence leaders and all-round laggards, are faced
with the identical average level of turbulence (both 3.45) as shown in Table 4-6.
Market turbulence Cluster I: All-round laggards
Cluster II: Usability laggards
Cluster III: Middlers
Cluster IV: Turbulence
leaders
Cluster V: All-round leaders
Average 3.45 3.41 3.34 3.45 3.39
Ongoing fluctuations (e.g. raw material prices)
3.73 3.71 3.79 3.86 3.79
Fluctuations in customer demand
3.63 3.39 3.59 3.42 3.48
Fluctuations in upstream supply
3.00 3.12 2.63 3.07 2.91
Table 4-6: PMS clusters and market turbulence
Viewing only the two PMS attributes that are directly concerned with supply and de-
mand markets and their turbulence (EL and DT), both are not affected by the level of market
turbulence. In order to verify this, we also performed regression analyses and found the

68
regression coefficient of market turbulence on EL to be 0.04 (p > 0.47) and on DT 0.10
(p > 0.11).
Instead, the clusters with the best overall PMS (Type IV and V) also exhibit by far the
best PMS design with respect to incorporating upstream and downstream aspects of the
supply chain (captured via EL) and key indicators that provide insights into market turbulence
(captured via DT). First, as shown in Table 4-7, it can be seen that their average values for EL
and DT are much higher than those of the three other clusters. Second, the clear majority of
companies that can be regarded as good practice in both dimensions (the top 25% in both
dimensions) are in cluster IV or V. In contrast, if companies are clustered according to the
market turbulence they are faced with, the differences are very small and not significant.
Cluster I: All-round laggards
(15%)
Cluster II: Usability laggards
(11%)
Cluster III: Middlers
(26%)
Cluster IV: Turbulence
leaders (13%)
Cluster V: All-round leaders (35%)
Exposure to market turbulence
High Low (50%) (50%)
External linkage 1.79 3.15 2.91 4.37 4.35 3.44 3.50
Share of Top 25% companies with respect to External Linkage
0% 2% 5% 33% 60% 52% 48%
Design for turbulence 1.92 3.37 3.17 5.05 4.28 3.68 3.62
Share of Top 25% companies with respect to Design for Turbulence
0% 5% 5% 42% 49% 50% 50%
Table 4-7: Supply chain related PMS design
Actually, the logistics organizations that have better prepared for higher levels of mar-
ket turbulence are the ones that also excel in the other dimensions of PMS. Obviously, in
current logistics practice, accounting for higher levels of market turbulence in PMS design is
less a question of actual exposure to market turbulence, but rather of its overall proficiency in
PMS and the awareness of new PMS requirements. While recognizing a changing supply
chain environment and high exposure to turbulence is one thing, actually having the ability to
do so is another thing altogether and continues to be a challenge for many organizations
(Melnyk et al., 2004; Ritchie and Brindley, 2007).

69
4.4.5 Outcomes
Regarding the outcomes of advanced PMS design, the literature has discussed two ma-
jor rationales to assess PMS success: PMS satisfaction as a rather subjective criterion (Banker
et al., 2001; Ittner et al., 2003) and PMS impact on performance as a more objective criterion
(Chenhall, 2005; Evans, 2004; Fawcett et al., 1997). For both rationales, the results of our
study provide detailed insights into the relationships between sophistication of PMS design
and success in logistics practice.
PMS design and subjective perceptions of PMS success
To investigate the relationship between PMS design and subjective perceptions of PMS
success, respondents were asked to assess both their overall satisfaction with their organiza-
tion’s PMS, PMS usefulness for the control of logistics operations, and PMS cost-benefit
efficiency. For this part, only respondents who considered themselves familiar with the cost
associated with the development and maintenance of their organization’s logistics PMS (n =
332) were asked to assess cost-benefit efficiency.
Subjective perceptions of PMS success
Cluster I: All-round laggards
Cluster II: Usability laggards
Cluster III: Middlers
Cluster IV: Turbulence
leaders
Cluster V: All-round leaders
Difference I to V
(p-value)
PMS satisfaction 2.63 3.35 4.14 5.19 5.56 2.93
(0.01)
Usefulness for logistics control 3.06 3.57 4.45 5.49 5.98 2.92
(0.01)
Cost-benefit efficiency 3.69 3.86 4.71 5.23 5.88 1.92
(0.01)
Table 4-8: PMS design and subjective perceptions of PMS success
As shown in Table 4-8, the results clearly reflect a positive relationship between ad-
vanced PMS design and subjective perceptions of PMS success. The difference in both PMS
usefulness and cost-benefit efficiency is highly significant (p < 0.01) between the two leading
clusters (all-round leaders and turbulence leaders) and the three other clusters. And in seven
out of eight cases (two dependent variables times four moves) is the difference significant at
p < 0.05 when moving from one sophistication level to the next (e.g. moving from Type II to
III). Particularly noteworthy is the clarity and the extent to which subjective perceptions of
PMS success are linked to PMS sophistication. While this relationship had so far not been

70
empirically investigated related to logistics, the results are consistent with prior findings in the
accounting literature (Ittner et al., 2003; Sandt et al., 2001).
PMS design and logistics performance
From a managerial perspective, the actual impact of PMS design on logistics perfor-
mance is more important than subjective perceptions of PMS success. Here, following the
cost-to-service trade-off in logistics (Stank et al., 2001) this study applies the established
distinction between logistics efficiency and effectiveness (Mentzer and Konrad, 1991) as
shown in Table 4-9.
The results clearly support a positive impact of advanced PMS design on logistics per-
formance. Overall, logistics efficiency of both lagging clusters―while not differing between
them―is significantly lower than that of the other three clusters (all-round leaders, turbulence
leaders, and middlers) at p < 0.01, where the differences among the latter three are again
highly significant (p < 0.01) both for the overall efficiency and for all of its sub-measures.
Logistics Performance Cluster I: All-round laggards
Cluster II: Usability laggards
Cluster III: Middlers
Cluster IV: Turbulence
leaders
Cluster V: All-round leaders
Difference I to V
(p-value)
Logistics Efficiency: (3-item average)
3.97 4.07 4.26 4.50 4.66 0.69
(0.01)
Total logistics cost 3.86 3.96 4.18 4.23 4.58 0.72
(0.01)
Freight cost 4.05 4.02 4.23 4.56 4.78 0.73
(0.01)
Labor productivity in logistics 4.02 4.24 4.38 4.72 4.63 0.61
(0.01)
Logistics Effectiveness: (3-item average)
5.02 5.04 5.07 5.31 5.32 0.30
(0.05)
Delivery dates and quantities 5.08 4.96 5.03 5.25 5.31 0.23
(0.10)
Over/short/damaged deliveries 4.87 4.98 4.91 5.07 5.12 0.25
(0.05)
Adherence to customer specifica-tions
5.10 5.18 5.28 5.61 5.45 0.35
(0.01)
Table 4-9: PMS design and logistics performance
The study also supports a link between logistics effectiveness and sophistication of
PMS design. While the differences are not quite as distinct compared to logistics efficiency,
71
as the relationship between PMS design and logistics efficiency, the differences between the
two lagging clusters and the all-round leaders are all significant at least at the p < 0.10 level.
Overall, logistics effectiveness appears to benefit only from high sophistication levels of PMS
design. Whereas Types I to III exhibit similar levels of logistics effectiveness, substantial
PMS driven improvements can only be observed for logistics organizations with high
implementation levels of both PMS scope and PMS usability.
4.5 Discussion and implications
This research, to the best of our knowledge, provides the first comprehensive picture on
performance measurement practice in logistics organizations. Besides the focus on PMS as an
entity that is defined by its design rather than the coverage of specific performance measures,
several new aspects of performance measurement practice have been investigated. Overall, we
find distinct differences in PMS sophistication between high performing and low performing
logistics organizations along all attributes of advanced PMS design. While about one third of
the logistics organizations show―without being perfect―sound implementations levels for
both PMS scope and PMS usability, more than half should improve significantly. Although
the results, due to the different regional focus, are only partly comparable to the insights
provided by Fawcett and Cooper (1998), they confirm that organizations with more advanced
PMS also show a distinctively better coverage of key logistical performance measures.
Similar to Keebler and Plank’s (2009) findings in U.S. logistics organizations, major deficits
are found in supply chain related performance measurement. Here, and bearing in mind the
broad consensus that increasing levels of turbulence represent one of the major challenges in
current logistics and supply chain management practice (Blome and Schoenherr, 2011;
Christopher and Holweg, 2011), it was important to find that logistics organizations with
generally more advanced PMS appear to be substantially better prepared to cope with
increased turbulence than their counterparts with broad PMS deficits.
From a managerial perspective, the results can serve as a benchmark and guidance for
logistics organizations that are willing to potentially change the design of their PMS. Given
the insight that higher levels of PMS sophistication are related to enhanced performance both
regarding logistics efficiency and logistics effectiveness, managers need to raise questions
regarding the design attributes of PMS scope and usability in order to identify and eliminate
major deficits. What is the organization’s current stage of development in PMS design? And:
Which shortcomings must be addressed to ensure better implementation levels for all design

72
attributes? When answering these questions, managers should not only assess each design
attribute individually, but view the simultaneous presence of the attributes related to PMS
scope and PMS usability to gain a sound and comprehensive (self-)assessment. Only then will
it be possible to decide whether an incremental or a fundamental redesign is required to
advance the PMS to higher levels.
During the process of self-assessment, it will also be crucial not to confuse the im-
portance of key performance measures with a rationale of “the more measurement, the better”
that may result in excessive reporting and thus not fulfill logistics managers’ actual infor-
mation needs (Schick et al., 1990). While being in line with Fawcett and Cooper’s proposition
that “high performance logistics firms have greater access to measurement information”
(p. 348), the results of our study primarily suggest that overall PMS sophistication―i.e. the
design of a system according to attributes recommended across disciplines―are a strong basis
for high levels of logistics performance.
From a theoretical perspective, the results provide two important insights. First, we find
clear support for researchers’ prior conceptual PMS contributions and frameworks: higher
levels of PMS sophistication are actually related to enhanced performance in terms of
logistics efficiency and logistics effectiveness. Yet, in order to account for specific require-
ments, a fourth scope dimension (design for turbulence) should be considered in PMS design.
Second, in contrast to what can be assumed based on contingency theory which posits a fit
between the organizational setup and its environment, PMS design practice does not appear to
follow the requirements induced by increasing levels of market turbulence―at least not short
term. In fact, regarding market turbulence, PMS design is driven by an organization’s overall
proficiency in PMS where leading organizations have the ability to account for external
factors and lagging organizations do not.
4.6 Limitations and future research
In seeking to provide a comprehensive picture of the state of PMS in logistics practice,
it was aimed to minimize any limitations. Yet, and partly due to its empirical-descriptive
character, this research does have some limitations which, at the same time, offer interesting
possibilities of future research. First, the results, due to the different regional focus, are only
partly comparable to previous insights provided by Fawcett and Cooper (1998) and Keebler
and Plank (2009). While recapitulating the coverage of key performance measures examined
in these two U.S. studies provides an essential baseline, it would also be beneficial to

73
empirically investigate the selection of key performance measures in specific logistics
organizations.
Moreover, as in any empirical-descriptive study, focal areas of research had to be priori-
tized. Therefore, besides the major focus on patterns of PMS design, both antecedents and
outcomes were limited to specific aspects.
Regarding the antecedents to PMS design, the study focused on market turbulence as an
external factor and an area of interest in current logistics and supply chain management
research and practice (Blome and Schoenherr, 2011). Given the finding that there was no
relationship between the actual exposure to market turbulence and the implementation level of
PMS design for turbulence, further insights regarding other PMS antecedents would certainly
be valuable to researchers and practitioners and require further research. Moreover, there are
obviously further important antecedents to investigate, including other sources of external risk
as well as internal organizational factors like the availability of resources or the skill set of
employees (Keebler and Plank, 2009).
Regarding the outcomes of PMS design, the study focused on logistics efficiency and
effectiveness as two major sources of competitiveness in logistics organizations. Yet, to
actually derive clear cause-and-effect relationships and to understand how PMS is actually
translated into organizational competitiveness, the findings provided in chapters 2 and 3
provide a more robust basis for the impact of PMS on organizational competitiveness and
further research possibilities.

74
5 Concluding remarks

75
In view of a large body of conceptual PMS research across disciplines and the compara-
bly limited number of empirical PMS studies in the logistics discipline (Gunasekaran and
Kobu, 2007), this dissertation is dedicated to providing in-depth empirical insights on PMS
design and PMS contribution to competitive outcomes in logistics organizations. For this
purpose, it consolidates prescriptive frameworks to identify the key attributes of advanced
PMS design while taking into account the growing importance of performance measurement
in the supply chain context (Akyuz and Erkan, 2010). Building on this consolidation of
scholarly recommended PMS design attributes, hypotheses on the effectiveness of advanced
PMS design regarding competitive outcomes in logistics organizations and corresponding
research models are derived from the literature and tested using the resource-based view as a
theoretical foundation. Regarding the new requirements of logistics performance measure-
ment in the era of turbulence, PMS design for turbulence is shown to be contingent upon
upper management’s control focus. Moreover, a comprehensive picture of the actual state of
PMS practice in logistics organizations―both manufacturing companies’ internal logistics
departments and LSPs―is provided.
5.1 Main research findings and contributions
In addition to the detailed discussions of research findings as well as implications for
theory and practice provided in each chapter of the dissertation, this section starts with a brief
overview of the main findings while particularly seeking to summarize the most relevant
insights and to draw overall conclusions.
Chapter 2, in answering the first and second research question, provides evidence that
advanced PMS represents a valuable resource that acts as a substantial driver of customer
orientation and cross-functional integration as two pivotal capabilities in logistics organiza-
tions which ultimately enhance logistics performance. By investigating PMS as an entity
whose overall level of sophistication is defined by the combined existence of key design
attributes derived from the literature, this dissertation goes significantly beyond previous
research that followed the dimensions of the balanced scorecard (e.g. Henri, 2006b; Tung et
al., 2011) or specific attributes of advanced PMS design (e.g. Rodrigues et al., 2004; Chen-
hall, 2005).
From a research perspective, the chapter confirms the scholarly recommended PMS de-
sign attributes of measurement diversity, strategic-operational linkage, external linkage,
information timeliness, information aggregation, and system adaptability. As these attributes

76
are taken from an extensive literature review across disciplines and particularly logistics, the
findings confirm the common denominator of multiple conceptual contributions on PMS
design. Moreover, the hypothesized importance of the combined presence of these attributes
is validated through the second-order PMS excellence construct, thus confirming that
different attributes of advanced PMS design are complementary and mutually reinforcing.
Particularly for logistics managers who are pursuing higher levels of PMS sophistication, it is
an important finding that working on one specific design attribute, e.g. measurement diversi-
ty, may not yield the expected benefits in enhancing organizational capabilities and competi-
tiveness unless other design attributes are implemented as well.
Chapter 3, by investigating the role of PMS in supply chain risk management, addresses
previously un-researched aspects of PMS design and effectiveness in logistics organizations.
Although a few authors have vaguely pointed to the potential role of control systems in supply
chain risk management (e.g. Rasid et al., 2012), this dissertation first shows that accounting
for higher levels of market turbulence through PMS design for turbulence actually fosters
organizational resilience―the ability to cope with turbulence―and thus drives distribution
service performance. Unlike the widely established PMS design attributes built upon in
chapter 2, PMS design for turbulence adds a new design dimension that is shown to provide
distinct value to logistics organizations. In a supply chain environment that is characterized by
increasing levels of market turbulence (Christopher and Holweg, 2011), empirical evidence
on the positive impact of supply chain risk metrics is a valuable insight both for the academia
and for logistics practice.
The results also show that upper management’s control focus in using PMS interactively
(attention-focusing) or diagnostically (score-keeping) can act as a driver or impediment of
PMS design for turbulence. In contrast to prior research that focused on openly expressed
management support as an antecedent to the effectiveness of PMS (Keebler and Plank, 2009;
Tung et al., 2011), we can see that upper managers’ mindset―as a rather subtle driver or
impediment that many decision-makers may not even be aware of―can have a substantial
impact as well.
In complementing the fundamental investigation of PMS design and its effectiveness in
logistics organizations (chapter 2) and the more specific role of PMS for the growing
challenge of market turbulence in the supply chain environment (chapter 3), chapter 4
provides an overall picture of how PMS is actually implemented in logistics practice. It
follows an empirical-descriptive approach and provides in-depth insights into the patterns of
PMS design and the usage of key performance measures in logistics organizations, as well as

77
associated factors and competitive outcomes. Using cluster analysis along the key PMS
design attributes identified in chapter 2 and 3, the results reveal five different PMS sophistica-
tion levels in logistics organizations. Moreover, the path of development along the different
PMS sophistication levels shows close connections between the content-related PMS design
attributes, i.e. PMS scope, and the attributes related to the user-oriented preparation and
presentation of performance measurement information, i.e. PMS usability. To bring their
organization’s PMS to the next level, logistics managers need to not only improve a specific
design attribute, but simultaneously advance all attributes of PMS scope or PMS usability,
depending on where their PMS is particularly lagging behind.
Overall, besides substantial differences in PMS sophistication between leading and lag-
ging logistics organizations, the supply chain related design attributes of external linkage and
design for turbulence stand out as particularly lagging. Along with the fact that―in contrast to
contingency-based logic―PMS design in logistics organizations is not adapted to the level of
turbulence faced in the market, this is a disconcerting finding which shows that logistics
managers need to particularly question whether their organization’s PMS practice appropri-
ately addresses supply chain related challenges. During a workshop discussion of results with
logistics practitioners6, contrasting views like “External linkage is extremely important. I need
full transparency at least down to my sub-suppliers” on the one hand and “Why care about
external linkage? My suppliers know that I expect them to deliver as promised” on the other
hand made it obvious that there is quite a disagreement regarding the actual need to measure
performance beyond the boundaries of individual organizations. It should go without saying
that performance measurement at the supply chain level requires “thinking outside the box” of
one’s own logistics organization. Yet, whether or not integrated PMS or jointly defined
performance metrics are required to do so is another thing altogether. Therefore, this issue
will be further addressed in the next section about future research possibilities.
Yet, supply chain related performance measurement is not the only area of investigation
where PMS reality does not turn out exactly as expected. The comparison between the two
basic types of logistics organizations―internal logistics departments of manufacturing
companies and LSPs―shows only very small differences. Rather than translating their
logistics “core competence” into substantial advantages regarding performance measurement
practice, LSPs comprise a wide spread of organizations with both very sophisticated and still
underdeveloped PMS. Although this is partly due to the fragmented structure of the logistics
6 See chapter 1 (workshop at international conference of the German logistics organization)

78
industry in Germany (Wagner and Kemmerling, 2010), LSPs, overall, do not fulfill the
leadership role that one may expect from their business focus on logistics services.
Viewing all chapters together, some of the findings of this dissertation are of general na-
ture and therefore equally valuable for researchers and practitioners. First, whereas the
evidence that scholarly recommended PMS design attributes actually do provide value in
logistics organizations is an important finding, understanding how they provide value is
obviously more important. Here, we learn that the impact of PMS excellence, although one
may expect a direct relationship between PMS excellence and competitive outcomes, is fully
mediated by organizational capabilities. This is confirmed both for PMS excellence along the
established attributes of advanced PMS design in chapter 2 (where PMS value is fully
mediated by customer orientation and cross-functional integration) and for the specific
investigation of PMS effectiveness regarding the growing challenge of market turbulence in
chapter 3 (where PMS value is fully mediated by organizational resilience). In both cases, the
direct relationships between PMS and enhanced levels of performance are virtually irrelevant.
For PMS research, on the one hand, this is a valuable clarification which supports that
PMS has an indirect impact on organizational competitiveness only (Chenhall, 2005; Henri,
2006b). Other than the descriptive results in chapter 4 and suggestions from correlation
analysis in prior studies (e.g. Fawcett et al., 1997) could make one believe, we learn that
positive outcome effects are only achieved indirectly, mediated via organizational capabili-
ties. This contribution is mostly owed to the dissertation’s research design and its hypotheses-
driven theoretical foundation. Here, the resource-based view―although being criticized for its
“all-inclusiveness” (Priem and Butler, 2001) and its limited explanatory power (Hoopes et al.,
2003; Sirmon et al., 2007)―serves as a useful theoretical foundation if combined with sound,
literature-driven hypotheses.
For logistics managers, on the other hand, it is important to know that competitive out-
comes can only be expected if PMS value is successfully translated into organizational
capabilities. Hence, it is essential, but not sufficient, to ensure high implementation levels of
the attributes of advanced PMS design. By clearly underscoring PMS impact through
organizational capabilities, the dissertation provides an answer to Sirmon et al.’s (2007) claim
that “unfortunately, there is minimal theory explaining ‘how’ managers/firms transform
resources to create value. Therefore, the RBV requires further elaboration to explain the link
between the management of resources and the creation of value.”
In reflecting the dissertation’s overall findings regarding PMS design in logistics organ-
izations as a central domain of investigation, it is essential to bring the different chapters

79
together. As outlined above, chapter 2 identifies PMS excellence as the combined existence of
six mutually reinforcing key design attributes derived from the literature. Whereas these
established design attributes have recurrently been recommended across PMS frameworks,
chapter 3―in investigating the role of PMS in the era of turbulence―adds a new, more
specific design attribute that was not previously researched. Yet, PMS design for turbulence,
even though readdressed in chapter 4 for the purpose of a comprehensive and up-to-date
description of the current state of PMS in logistics practice, stands on a somewhat different
level than the established attributes of advanced PMS design. As many logistics organiza-
tions―albeit showing an advanced use of both financial and non-financial performance
metrics―have not yet managed to prepare for the specific requirements of the era of turbu-
lence (Weber et al. 2012), the dissertation investigated this specific aspect of PMS design in
detail. That is to say, the use of risk metrics related to demand and supply turbulence, was
treated as a stand-alone design attribute. Yet, in anticipating further developments of perfor-
mance measurement practice in logistics organizations, PMS design for turbulence―in
becoming an inherent part of PMS excellence―is to be captured via measurement diversity
(regarding the use of supply chain risk metrics) and external linkage (regarding the demand
and supply dependencies from partners in the supply chain). Therefore, in the long run, it will
not be considered a stand-alone PMS design attribute.
In sum, the investigations in chapters 2 through 4 present a complete picture on PMS
design and effectiveness in logistics organizations. Although PMS represent a much-
examined field of research, the empirical findings on cause and effect relationships as well as
the current state of practice shed light on previously under-investigated issues, thus providing
profound insights for researchers and practitioners and a sound basis for future research.
5.2 Future research possibilities
In addition to the limitations and research avenues provided in each chapter, this final
section seeks to present a broader picture of future research possibilities arising from the
dissertation.
Regarding PMS design as the focal subject of examination, a common denominator of
PMS frameworks was used to consolidate PMS knowledge regarding recommendable design
attributes in logistics organizations. For this purpose and given the quantitative approach of
the dissertation, the measurement items of content-related design attributes had to cover the

80
individual design attributes broadly enough to capture the implementation of the attribute in
different organizational contexts. Regarding PMS usability, the attributes of information
timeliness, information aggregation, and system adaptability, when it comes to the detailed
requirements of specific organizations, will have different implications in different contexts.
Similarly, measurement diversity, besides the general applicability of financial and non-
financial measures, may present itself in different ways when it comes to the actual selection
of performance metrics. Most importantly, both the supply chain related attributes of external
linkage and design for turbulence and strategic-operational linkage require a context-specific
implementation in practice. For instance, external linkage may range from an intra-
organizational assessment and measurement of performance dependencies from other supply
chain members to a full inter-organizational integration with jointly defined performance
measurement. Here, different organizational contexts may require different approaches and
logistics managers’ understanding of the ideal state of external linkage and corresponding
performance measurement requirements may vary significantly. Therefore, further empirical
research is required to better understand the context-specific design and effectiveness of
external linkage beyond prior researchers’ conceptual contributions (e.g. van Hoek, 1998).
Given the need for detailed investigations, qualitative case study research will most probably
provide the best research approach for this purpose.
At the same time, the role of PMS in supply chain risk management, i.e. the implemen-
tation of PMS design for turbulence and the selection of supply chain risk measures in
specific logistics organizations, is clearly in its infancy and should be further investigated.
Overall, I agree with Akyuz and Erkan (2010) that “performance measurement in the new
supply era is still an open area of research” (p. 5137). Here, the dissertation has laid the
foundation to conduct in-depth case studies regarding supply chain related PMS design and its
impact on organizational competitiveness.
Similarly, and judging from the above mentioned discussion with logistics practitioners,
strategic-operational linkage appears to be highly relevant in logistics organizations and
should therefore be further examined for the specific requirements of the logistics function.
Yet, no detailed empirical insights have been provided on the attribute’s actual implementa-
tion in logistics practice. For such case-specific and detailed investigations, researchers should
distinguish between shippers and LSPs and take an organization’s specific scope of logistics
services into consideration. This way, detailed case studies can ensure a selection of different
logistics organizations as “polar types” (Eisenhardt, 1989).

81
Another important area for further research consists in the antecedents to advanced PMS
design. Here, while chapter 3 showed that PMS design for turbulence is contingent upon
upper management’s control focus, the results of chapter 4 did not support the idea of fit
between higher levels of market turbulence and PMS design. For logistics managers who are
willing to take their organization’s PMS to the next level, it is not only important to be aware
of the design attributes that should be implemented. They also require further insights
regarding the drivers and inhibitors of PMS excellence within their organization. Although
Keebler and Plank (2009) have provided first survey-based empirical insights in this regard,
there is still plenty of work to be done to gain a comprehensive understanding of PMS
antecedents. From a research perspective, further theory development may be required to fully
explain the relationship between both internal and external factors and PMS design.
Overall, although PMS represents a well-established field of research, there are still
plenty of opportunities to advance PMS knowledge, particularly through further empirical
insights. Here, this dissertation can serve as a basis for detailed, context-specific studies on
PMS design and effectiveness in logistics organizations.

82
6 References

83
Akyuz, G. A., & Erkan, T. E. (2010). Supply chain performance measurement: a literature
review. International Journal of Production Research, 48(17), 5137–5155.
Amigoni, F. (1978). Planning management control systems. Journal of Business Finance &
Accounting, 5(3), 279–291.
Amir, A. M., Ahmad, N. N. N., & Mohamad, M. H. S. (2010). An investigation on PMS
attributes in service organisations in Malaysia. International Journal of Productivity and
Performance Management, 59(8), 734–756.
Amit, R., & Schoemaker, P. J. H. (1993). Strategic assets and organizational rent. Strategic
Management Journal, 14(1), 33–46.
Anand, G., & Ward, P. T. (2004). Fit , flexibility and performance in manufacturing: coping
with dynamic environments. Production and Operations Management Journal, 13(4),
369–385.
Anderson, J. C., & Gerbing, D. W. (1988). Structural equation modeling in practice: A review
and recommended two-step approach. Psychological Bulletin, 103(3), 411–423.
Ansari, S., & Euske, K. J. (1987). Rational, rationalizing, and reifying uses of accounting data
in organizations. Accounting, Organizations and Society, 12(6), 549–570.
Armstrong, C. E., & Shimizu, K. (2007). A review of approaches to empirical research on the
resource-based view of the firm. Journal of Management, 33(6), 959–986.
Armstrong, J. S., & Overton, T. S. (1977). Estimating nonresponse bias in mail surveys.
Journal of Marketing Research, 14(3), 396–402.
Atkinson, A. A., Booth, P., Cote, J. M., Groot, T., Uliana, E., & Wu, A. (1997). New direc-
tions in management accounting research. Journal of Management Accounting Research,
9, 79–108.
Auzair, S., & Langfield-Smith, K. (2005). The effect of service process type, business
strategy and life cycle stage on bureaucratic MCS in service organizations. Management
Accounting Research, 16(4), 399–421.
Bagozzi, R P, & Yi, Y. (1988). On the evaluation of structural equation models. Journal of
the Academy of Marketing Science, 16(1), 74–94.
Bagozzi, Richard P., & Dholakia, U. M. (2006). Antecedents and purchase consequences of
customer participation in small group brand communities. International Journal of Re-
search in Marketing, 23(1), 45–61.
Baker, W. E., & Sinkula, J. M. (1999). The synergistic effect of market orientation and
learning orientation on organizational performance. Journal of the Academy of Market-
ing Science, 27(4), 411–427.
Banker, R. D., Janakiraman, S. N., & Konstans, C. (2001). Balanced scorecard: linking
strategy to performance. Financial Executives International, New York.

84
Barney, J. B. (1991). Firm resources and sustained competitive advantage. Journal of
Management, 17(1), 99–120.
Barney, J. B. (2012). Purchasing, supply chain management and sustained competitive
advantage: The relevance of resource-based theory. Journal of Supply Chain Manage-
ment, 48(2), 3–6.
Barney, J. B., Ketchen, D. J., & Wright, M. (2011). The future of resource-based theory:
Revitalization or decline? Journal of Management, 37(5), 1299–1315.
Blome, C., & Schoenherr, T. (2011). Supply chain risk management in financial crises—A
multiple case-study approach. International Journal of Production Economics, 134(1),
43–57.
Bond, T. C. (1999). The role of performance measurement in continuous improvement.
International Journal of Operations & Production Management, 19(12), 1318–1334.
Bourne, M., Mills, J., Wilcox, M., Neely, A., & Platts, K. (2000). Designing, implementing
and updating performance measurement systems. International Journal of Operations &
Production Management, 20(7), 754–771.
Bowersox, D. J., Closs, D. J., & Cooper, M. B. (2002). Supply chain logistics management.
New York: McGraw-Hill/Irwin.
Bowersox, D. J., Closs, D. J., & Stank, T. P. (1999). 21st century logistics: Making supply
chain integration a reality. Oak Brook, IL: Council of Logistics Management.
Braunscheidel, M. J., & Suresh, N. C. (2009). The organizational antecedents of a firm’s
supply chain agility for risk mitigation and response. Journal of Operations Manage-
ment, 27(2), 119–140.
Brignall, S., & Ballantine, J. (1996). Performance measurement in service businesses
revisited. International Journal of Service Industry Management, 7(1), 6–31.
Brislin, R. W. (1976). Comparative research methodology: Cross-cultural studies. Interna-
tional Journal of Psychology, 11(3), 215–229.
Brown, T. A. (2006). Confirmatory factor analysis for applied research (methodology in the
social sciences). New York: The Guilford Press.
Bühler, A., & Wallenburg, C. M. (2012). Performance measurement systems in logistics:
Impact on capabilities and performance. Unpublished manuscript.
Bühler, A., & Wallenburg, C. M. (2013). Performance measurement systems in logistics
practice: Patterns and outcomes. Manuscript presented at the NOFOMA 2013 confer-
ence.
Bühler, A., Wallenburg, C. M., & Wieland, A. (2013). Using performance measurement
systems in logistics organizations in the era of turbulence. Unpublished manuscript..

85
Bunderson, J. S., & Sutcliffe, K. M. (2002). Comparing alternative conceptualizations of
functional diversity in management teams: Process and performance effects. Academy of
Management Journal, 45(5), 875–893.
Burchell, S., Clubb, C., Hopwood, A., Hughes, J., & Nahapiet, J. (1980). The roles of
accounting in organizations and society. Accounting, Organizations and Society, 5(1),
5–27.
Busse, C., & Wallenburg, C. M. (2011). Innovation management of logistics service provid-
ers: Foundations, review, and research agenda. International Journal of Physical Distri-
bution & Logistics Management, 41(2), 187–218.
Byrne, B. M. (2001). Structural equation modeling with AMOS: Basic concepts, applications,
and programming. New Jersey: Lawrence Erlbaum Associates.
Calantone, R., Garcia, R., & Droege, C. (2003). The effects of environmental turbulence on
new product development strategy planning. Journal of Product Innovation Manage-
ment, 20, 90–103.
Cao, M., & Zhang, Q. (2011). Supply chain collaboration: Impact on collaborative advantage
and firm performance. Journal of Operations Management, 29(3), 163–180.
Caplice, C., & Sheffi, Y. (1994). A review and evaluation of logistics metrics. International
Journal of Logistics Management, 5(2), 11–28.
Caplice, C., & Sheffi, Y. (1995). A review and evaluation of logistics performance measure-
ment systems. International Journal of Logistics Management, 6(1), 61–74.
Carpenter, M. A., Geletkanycz, M. A., & Sanders, W. G. (2004). Upper echelons research
revisited: Antecedents, elements, and consequences of top management team composi-
tion. Journal of Management, 30(6), 749–778.
Chen, H., Mattioda, D. D., & Daugherty, P. J. (2007). Firm-wide integration and firm
performance. The International Journal of Logistics Management, 18(1), 5–21.
Chenhall, R. (2003). Management control systems design within its organizational context:
findings from contingency-based research and directions for the future. Accounting,
Organizations and Society, 28(2-3), 127–168.
Chenhall, R. (2005). Integrative strategic performance measurement systems, strategic
alignment of manufacturing, learning and strategic outcomes: an exploratory study.
Accounting, Organizations and Society, 30(5), 395–422.
Chow, G., Heaver, T. D., & Henriksson, L. E. (1994). Logistics performance: Definition and
measurement. International Journal of Physical Distribution & Logistics Management,
24(1), 17–28.
Christopher, M., & Holweg, M. (2011). “Supply Chain 2.0”: managing supply chains in the
era of turbulence. International Journal of Physical Distribution & Logistics Manage-
ment, 41(1), 63–82.

86
Christopher, M., & Peck, H. (2004). Building the resilient supply chain. The International
Journal of Logistics Management, 15(2), 1–14.
Cooper, M. C., Lambert, D. M., & Pagh, J. D. (1997). Supply chain management : More than
a new name for logistics. The International Journal of Logistics Management, 8(1),
1–14.
Coutu, D. L. (2002). How resilience works. Harvard business review, May, 46–55.
Daugherty, P. J., Chen, H., Mattioda, D. D., & Grawe, S. J. (2009). Marketing / Logistics
Relationships: Influence on Capabilities and Performance. Journal of Business Logistics,
30(1), 1–19.
Daugherty, P. J., Sabath, R., & Rogers, D. (1992). Competitive advantage through customer
responsiveness. Logistics and Transportation Review, 28(3), 257–271.
Davis, S., & Albright, T. (2004). An investigation of the effect of balanced scorecard
implementation on financial performance. Management Accounting Research2, 15(2),
135–153.
Day, G. (1994). The capabilities of market-driven organizations. Journal of Marketing, 58(4),
37–52.
Deepen, J. M., Thomas, J., Knemeyer, A. M., & Wallenburg, C. M. (2008). Beyond expecta-
tions: An examination of logistics outsourcing goal achievement and goal exceedance.
Journal of Business Logistics, 29(2), 75–104.
Defee, C. C., Williams, B., Randall, W. S., & Thomas, R. (2010). An inventory of theory in
logistics and SCM research. The International Journal of Logistics Management, 21(3),
404–489.
Dempster, A., Laird, N., & Rubin, D. (1977). Maximum likelihood from incomplete data via
the EM algorithm. Journal of the Royal Statistical Society. Series B (Methodological),
39(1), 1–38.
Dixon, J., Nanni, A. & Vollmann, T., 1990. The new performance challenge: Measuring
operations for world-class competition. Homewood, IL: Dow Jones-Irwin.
Donaldson, L. (2001). The contingency theory of organizations. Thousand Oaks, CA: Sage.
Droege, C., Jayaram, J., & Vickery, S. (2004). The effects of internal versus external integra-
tion practices on time-based performance and overall firm performance. Journal of Op-
erations Management, 22(6), 557–573.
Eccles, R. G. (1991). The performance measurement manifesto. Harvard business review,
69(1), 131–7.
Eccles, R., & Pyburn, P. (1992). Creating a comprehensive system to measure performance.
Management Accounting, 74(4), 41–44.

87
Edmondson, A. (1999). Psychological safety and learning behavior in work teams. Adminis-
trative Science Quarterly, 44(2), 350.
Eisenhardt, K. M. (1989). Building theories from case study research. Academy of Manage-
ment Review, 14(4), 532–550.
Ellinger, A. E., Daugherty, P. J., & Keller, S. B. (2000). The relationship between market-
ing/logistics interdepartmental integration and performance in U.S. manufacturing firms:
an empirical analysis. Journal of Business Logistics, 21(1), 1–22.
Evans, J. (2004). An exploratory study of performance measurement systems and relation-
ships with performance results. Journal of Operations Management, 22(3), 219–232.
Fawcett, S. E., & Cooper, M. B. (1998). Logistics performance measurement and customer
success. Industrial Marketing Management, 27, 341–357.
Fawcett, S. E., & Magnan, G. M. (2002). The rhetoric and reality of supply chain integration.
International Journal of Physical Distribution & Logistics Management, 32(5), 339–361.
Fawcett, S. E., Smith, S. R., & Cooper, M. B. (1997). Strategic intent, measurement capabil-
ity, and operational success: making the connection. International Journal of Physical
Distribution & Logistics Management, 27(7), 410–421.
Feldman, M. S., & March, J. G. (1981). Information in organizations as signal and symbol.
Administrative Science Quarterly, 26, 171–186.
Ferreira, A., & Otley, D. (2009). The design and use of performance management systems:
An extended framework for analysis. Management Accounting Research, 20(4), 263–
282.
Fornell, C., & Larcker, D. F. (1981). Evaluating structural equation models with unobservable
variables and measurement error. Journal of Marketing Research, 18(1), 39–50.
Fugate, B. S., Mentzer, J. T., & Stank, T. P. (2010). Logistics performance: Efficiency,
effectiveness, and differentiation. Journal of Business Logistics, 31(1), 43–63.
Garver, M. S., & Mentzer, J. T. (1999). Logistics research methods: Employing structural
equation modeling to test for construct validity. Journal of Business Logistics, 20(1), 33–
58.
Gerbing, D. W., & Anderson, J. C. (1988). An updated aradigm for scale development
incorporating unidimensionality and its assessment. Journal of Marketing Research,
25(2), 186–192.
Gerdin, J. (2005). Management accounting system design in manufacturing departments: an
empirical investigation using a multiple contingencies approach. Accounting, Organiza-
tions and Society, 30(2), 99–126.
Ghalayini, A. M., Noble, J. S., & Crowe, T. J. (1997). An integrated dynamic performance
measurement system for improving manufacturing competitiveness. International Jour-
nal of Production Economics, 48(3), 207–225.

88
Gomes, C. F., Yasin, M. M., & Lisboa, J. V. (2006). Performance measurement practices in
manufacturing firms: an empirical investigation. Journal of Manufacturing Technology
Management, 17(2), 144–167.
Grant, R. M. (1991). The resource-based theory of competitive advantage: Implications for
strategy formulation. California Management Review, 33(3), 114–135.
Grawe, S. J., Daugherty, P. J., & Roath, A. S. (2011). Knowledge synthesis and innovative
logistics processes : Enhancing operational flexibility and performance. Journal of Busi-
ness Logistics, 32(1), 69–80.
Griffis, S. E., Cooper, M., Goldsby, T. J., & Closs, D. J. (2004). Performance measurement:
Measure selection based upon firm goals and information reporting needs. Journal of
Business Logistics, 25(2), 95–118.
Griffis, S. E., Goldsby, T. J., Cooper, M., & Closs, D. J. (2007). Aligning logistics perfor-
mance measures to the information needs of the firm. Journal of Business Logistics,
28(2), 35–56.
Gunasekaran, A, Lai, K., & Edwin Cheng, T. (2008). Responsive supply chain: A competitive
strategy in a networked economy. The International Journal of Management Science,
36(4), 549–564.
Gunasekaran, A, Patel, C., & McGaughey, R. E. (2004). A framework for supply chain
performance measurement. International Journal of Production Economics, 87(3),
333–347.
Gunasekaran, A., & Kobu, B. (2007). Performance measures and metrics in logistics and
supply chain management: a review of recent literature (1995-2004) for research and ap-
plications. International Journal of Production Research, 45(12), 2819–2840.
Gundlach, G. T., Bolumole, Y. a., Eltantawy, R. a., & Frankel, R. (2006). The changing
landscape of supply chain management, marketing channels of distribution, logistics and
purchasing. Journal of Business & Industrial Marketing, 21(7), 428–438.
Gustin, C., Daugherty, P., & Stank, T. (1995). The effects of information availability on
logistics integration. Journal of Business Logistics1, 16(1), 1–21.
Hair, J., Black, W., Babin, B., Anderson, R., & Tatham, R. (2006). Multivariate data analysis.
New Jersey: Prentice Hall.
Hallikas, J., Karvonen, I., Pulkkinen, U., Virolainen, V.-M., & Tuominen, M. (2004). Risk
management processes in supplier networks. International Journal of Production Eco-
nomics, 90(1), 47–58.
Hamel, G., & Välikangas, L. (2003). The quest for resilience. Harvard business review,
September, 52–63.
Han, J. K., Kim, N., & Srivastva, R. K. (1998). Market orientation and organizational
performance: Is innovation the missing link? Journal of Marketing, 62(4), 1–31.

89
Harman, H. H. (1967). Modern factor analysis. Chicago, IL: University of Chicago Press.
Hendricks, K. B., & Singhal, V. R. (2005). Association between supply chain glitches and
operating performance. Management Science, 51(5), 695–711.
Henri, J. (2006a). Organizational culture and performance measurement systems. Accounting,
Organizations and Society, 31(1), 77–103.
Henri, J. (2006b). Management control systems and strategy: A resource-based perspective.
Accounting, Organizations and Society, 31(6), 529–558.
Hofstede, G. (1978). The poverty of management control philosophy. Academy of Manage-
ment Review, 3(3), 450–461.
Homburg, C., & Baumgartner, H. (1995). Beurteilung von Kausalmodellen. Marketing ZFP,
17(3), 162–176.
Hoopes, D. G., Madsen, T. L., & Walker, G. (2003). Guest editors’ introduction to the special
issue: why is there a resource-based view? Toward a theory of competitive heterogenei-
ty. Strategic Management Journal, 24(10), 889–902.
Ignatiadis, I., & Nandhakumar, J. (2006). The impact of enterprise systems on organizational
resilience. Journal of Information Technology, 22(1), 36–43.
Innis, D., & La Londe, B. (1994). Customer service: The key to customer satisfaction,
customer loyalty, and market share. Journal of Business Logistics, 15(1), 1–28.
Itami, H. (1987). Mobilizing invisible assets. Harvard University Press. Cambridge, MA:
Harvard University Press.
Ittner, C. D., & Larcker, D. F. (1998). Innovations in performance measurement: Trends and
research implications. Journal of Marketing Research, 10(2), 205–238.
Ittner, C., Larcker, D., & Randall, T. (2003). Performance implications of strategic perfor-
mance measurement in financial services firms. Accounting, Organizations and Society,
28, 715–741.
Jeong, J. S., & Hong, P. (2007). Customer orientation and performance outcomes in supply
chain management. Journal of Enterprise Information Management, 20(5), 578–94.
Jüttner, U. (2005). Supply chain risk management: Understanding the business requirements
from a practitioner perspective. The International Journal of Logistics Management,
16(1), 120–141.
Jüttner, U., Peck, H., & Christopher, M. (2003). Supply chain risk management: Outlining an
agenda for future research. International Journal of Logistics: Research & Applications,
6(4), 197–210.
Kahn, K. B., & Mentzer, J. T. (1996). Logistics and interdepartmental integration. Interna-
tional Journal Of Physical Distribution and Logistics Management, 26(8), 6–14.

90
Kaplan, R. S., & Norton, D. P. (1992). The balanced scorecard - measures that drive perfor-
mance. Harvard Business Review, (January/February), 71–79.
Kaplan, R. S., & Norton, D. P. (1997). Linking the balanced scorecard to strategy. California
Management Review, 39(1), 53–79.
Keebler, J.S., & Manrodt, K. B. (2000). The state of logistics performance measurement.
Council of Logistics Management.
Keebler, James S., & Plank, R. E. (2009). Logistics performance measurement in the supply
chain: a benchmark. Benchmarking: An International Journal, 16(6), 785–798.
Kennerley, M., & Neely, A. (2003). Measuring performance in a changing business environ-
ment. International Journal of Operations & Production Management, 23(2), 213–229.
Kern, D., Moser, R., Hartmann, E., & Moder, M. (2012). Supply risk management: model
development and empirical analysis. International Journal of Physical Distribution &
Logistics Management, 42(1), 60–82.
Koufteros, X. (1999). Testing a model of pull production: A paradigm for manufacturing
research using structural equation modeling. Journal of Operations Management, 17(4):
467–488.
Kouvelis, P., Chambers, C., & Wang, H. (2006). Supply chain management research and
review, trends, and opportunities. Production and Operations Management Journal,
15(3), 449–469.
Lai, K., Ngai, E., & Cheng, T. (2002). Measures for evaluating supply chain performance in
transport logistics. Transportation Research Part E: Logistics and Transportation Re-
view, 38(6), 439–456.
Lai, K. (2004). Service capability and performance of logistics service providers. Transporta-
tion Research Part E: Logistics and Transportation Review, 40(5), 385–399.
Lambert, D. M., & Harrington, T. C. (1990). Measuring nonresponse bias in customer service
mail surveys. Journal of Business Logistics, 11(2), 5–25.
Langley, C.J.J., van Dort, E., Ross, T., Topp, U., Allen, G.R. & Sykes, S.R. (2006). Third-
party logistics – Results and findings of the 11th annual study. Georgia Institute of
Technology, Atlanta, GA.
Lavie, D. (2006). The competitive advantage of interconnected firms: An extension of the
resource-based view. Academy of Management Review, 31(3), 638–658.
Lee, H. L. and Billington, C. (1993). Material management in decentralized supply chains.
Operations Research, 41(5): 835–847.
Lee, Y., Strong, D., Kahn, B., & Wang, R. (2002). AIMQ: a methodology for information
quality assessment. Information & Management, 40(2), 133–146.

91
Li, S., Rao, S., Ragu-Nathan, T., & Ragu-Nathan, B. (2005). Development and validation of a
measurement instrument for studying supply chain management practices. Journal of
Operations Management, 23(6), 618–641.
Lindell, M. K., & Whitney, D. J. (2001). Accounting for common method variance in cross-
sectional research designs. Journal of Applied Psychology, 86(1), 114–121.
Lynch, R., & Cross, K. (1991). Measure up: The essential guide to measuring business
performance. London: Mandarin.
Malik, Y., Niemeyer, A., & Ruwadi, B. (2011). Building the supply chain of the future.
McKinsey Quarterly, (January), 1–10.
Malina, M., & Selto, F. (2004). Choice and change of measures in performance measurement
models. Management Accounting Research, 15(4), 441–469.
Malmi, T., & Brown, D. (2008). Management control systems as a package—Opportunities,
challenges and research directions. Management Accounting Research, 19(4), 287–300.
Manuj, I., & Mentzer, J. T. (2008). Global supply chain risk management. Journal of Business
Logistics, 29(1), 133–155.
Marsh, H., & Hocevar, D. (1985). Application of confirmatory factor analysis to the study of
self-concept: first- and higher-order factor models and their invariance across groups.
Psychological Bulletin, 97(3), 562–582.
Maskell, B. (1989). Performance measurement of world-class manufacturing. Management
Accounting, 67, 32–33.
McCann, J., Selsky, J., & Lee, J. (2009). Building agility, resilience, and performance in
turbulent environments. People and Strategy, 32(3), 44–51.
McGinnis, M. A., & Kohn, J. W. (2002). Logistics strategy - revisited. Journal of Business
Logistics, 23(2), 1–17.
Melnyk, S., Stewart, D. M., & Swink, M. (2004). Metrics and performance measurement in
operations management: dealing with the metrics maze. Journal of Operations Manage-
ment, 22(3), 209–218.
Menon, A., & Varadarajan, P. R. (1992). A model of marketing knowledge use within firms.
Journal of Marketing, 56(October), 53–71.
Mentzer, J. T. (2004). Fundamentals of supply chain management: Twelve drivers of competi-
tive advantage. Thousand Oaks, CA: Sage Publishing.
Mentzer, J. T. (2008). Rigor versus relevance: Why would we choose only one? Journal of
Supply Chain Management, 44(2), 72–77.
Mentzer, J. T., DeWitt, W., Keebler, J. S., Min, S., Nix, N. W., Smith, C. D., & Zacharia, Z.
G. (2001). Defining supply chain management. Journal of Business Logistics, 22(2),
1–25.

92
Mentzer, J. T., & Firman, J. (1994). Logistics control systems in the 21st century. Journal of
Business Logistics, 15(1), 215–228.
Mentzer, J. T., & Flint, D.J. (1997). Validity in logistics research. Journal of Business
Logistics, 18(1), 199–216.
Mentzer, J. T., Flint, D. J., & Hult, G. T. M. (2012). Logistics service quality as a segment-
customized process. Journal of Marketing, 65(4), 82–104.
Mentzer, J. T., & Konrad, B. P. (1991). An efficiency/effectiveness approach to logistics
performance analysis. Journal of Business Logistics, 12(1), 33–61.
Mentzer, J. T., Min, S., & Bobbitt, L. M. (2004). Toward a unified theory of logistics.
International Journal of Physical Distribution & Logistics Management, 34(8), 606–627.
Mitchell, V. (1994). Using industrial key informants: Some guidelines. Journal of the
Marketing Research Society, 36(2), 139–144.
Moore, G. C., & Benbasat, I. (1991). Development of an instrument to measure the percep-
tions of adopting an information technology innovation. Information Systems Research
2(3), 192–223.
Morgan, C. (2004). Structure, speed and salience: performance measurement in the supply
chain. Business Process Management Journal, 10(5), 522–536.
Narver, J. C., & Slater, S. F. (1990). The effect of market orientation on business profitability.
Journal of Marketing, 54(October), 20–35.
Neely, A. (1999). The performance measurement revolution: why now and what next?
International Journal of Operations & Production Management, 19(2), 205–28.
Neely, A. (2005). The evolution of performance measurement research: Developments in the
last decade and a research agenda for the next. International Journal of Operations &
Production Management, 25(12), 1264–1277.
Neely, A., & Adams, C. (2000). Perspectives on Performance: The Performance Prism. Gee
Publishing, London.
Neely, A., Gregory, M., & Platts, K. (1995). Performance measurement system design: A
literature review and research agenda. International Journal of Operations & Production
Management, 15(4), 80–116.
Neely, A., Mills, J., Platts, K., Gregory, M., Richards, H. (1996). Performance measurement
system design: Should process based approaches be adopted ? International Journal of
Production Economics, 47, 423–431.
Newbert, S. L. (2007). Empirical research on the resource-based view of the firm: An
assessment and suggestions for future research. Strategic Management Journal,
146(September 2005), 121–146.

93
Normann, R., & Ramírez, R. (1993). From value chain to value constellation: desigining
interactive strategy. Harvard Business Review, 71(4), 65–77.
Norrman, A., & Jansson, U. (2004). Ericsson’s proactive supply chain risk management
approach after a serious sub-supplier accident. International Journal of Physical Distri-
bution & Logistics Management, 34(5), 434–456.
Nunally, J. C. (1978). Psychometric Theory (2nd ed.). New York: McGraw-Hill.
Otley, D. (1999). Performance management: a framework for management control systems
research. Management Accounting Research, 10(4), 363–382.
Pagell, M. (2004). Understanding the factors that enable and inhibit the integration of
operations, purchasing and logistics. Journal of Operations Management, 22(5), 459–
487.
Paulraj, A., Chen, I. J., & Lado, A. A. (2012). An empirical taxonomy of supply chain
management practices. Journal of Business Logistics, 33(3), 227–244.
Peck, H., & Christopher, M. (2003). Supply chain risk management: Outlining an agenda for
future research. International Journal of Logistics: Research & Applications, 6(4),
197–210.
Petersen, J. A., McAlister, L., Reibstein, D. J., Winer, R. S., Kumar, V., & Atkinson, G.
(2009). Choosing the right metrics to maximize profitability and shareholder value.
Journal of Retailing, 85(1), 95–111.
Phillips, L. W. (1981). Assessing measurement error in key informant reports: A methodolog-
ical note on organizational analysis in marketing. Journal of Marketing Research, 18(4),
395–415.
Podsakoff, P. M., MacKenzie, S. B., Lee, J.-Y., & Podsakoff, N. P. (2003). Common method
biases in behavioral research: a critical review of the literature and recommended reme-
dies. The Journal of applied psychology, 88(5), 879–903.
Ponomarov, S. Y., & Holcomb, M. C. (2009). Understanding the concept of supply chain
resilience. The International Journal of Logistics Management, 20(1), 124–143.
Prahalad, C. K., & Hamel, G. (1990). The core competence of the corporation. Harvard
business review, (Spring).
Priem, R. L., & Butler, J. E. (2001). Is the resource-based view a useful perspective for
strategic management research? Academy of Management Review, 26(1), 22–40.
Pun, K. F., & White, A. S. (2005). A performance measurement paradigm for integrating
strategy formulation: A review of systems and frameworks. International Journal of
Management Reviews, 7(1), 49–71.
Rafele, C. (2004). Logistic service measurement: a reference framework. Journal of Manufac-
turing Technology Management, 15(3), 280–290.

94
Rasid, S. Z., Golshan, N. M., K., I. W., & Ahmad, F. S. (2012). Risk management, perfor-
mance measurement and organizational performance: a conceptual framework. 3rd in-
ternational conference on business and economic research 2012 proceeding, (March),
1702–1715.
Rhea, M. J., & Shrock, D. J. (1987). Measuring the effectiveness of physical distribution
customer service programs. Journal of Business Logistics, 8(1), 31–45.
Ritchie, B., & Brindley, C. (2007). Supply chain risk management and performance: A
guiding framework for future development. International Journal of Operations & Pro-
duction Management, 27(3), 303–322.
Rodrigues, A. M., Stank, T. P., & Lynch, D. F. (2004). Linking strategy, structure, process,
and performance in integrated logistics. Journal of Business Logistics, 25(2), 65–94.
Ruekert, R.W. and Walker, O.C. (1987). Marketing’s interaction with other functional units: a
conceptual framework and empirical evidence. Journal of Marketing, 51, 1–19.
Sandt, J., Schäffer, U., & Weber, J. (2001). Balanced performance measurement systems and
manager satisfaction – empirical evidence from a German study. Working Paper, 1–17.
Sandt, J. (2004). Management mit Kennzahlen und Kennzahlensystemen - Bestandsaufnahme,
Determinanten und Erfolgsauswirkungen. WHU - Otto Beisheim School of Manage-
ment.
Schäffer, U., & Steiners, D. (2003). Zur Nutzung von Controllinginformationen. Management
Accounting, (9), 1–36.
Schick, A. G., Gordon, L., & Haka, S. (1990). Information overload: A temporal approach.
Accounting, Organizations and Society, 15(3), 199–220.
Schmitz, J., & Platts, K. W. (2004). Supplier logistics performance measurement: Indications
from a study in the automotive industry. International Journal of Production Economics,
89(2), 231–243.
Schmoltzi, C., & Wallenburg, C. M. (2011). Horizontal cooperations between logistics
service providers: motives, structure, performance. International Journal of Physical
Distribution & Logistics Management, 41(6), 552–575.
Segars, A., & Grover, V. (1998). Strategic information systems planning success: an investi-
gation of the construct and its measurement. MIS Quarterly, 22(2), 139–163.
Selviaridis, K., & Spring, M. (2007). Third party logistics: a literature review and research
agenda. The International Journal of Logistics Management, 18(1), 125–150.
Shang, K., & Marlow, P. (2005). Logistics capability and performance in Taiwan’s major
manufacturing firms. Transportation Research Part E: Logistics and Transportation Re-
view, 41(3), 217–234.
Sheffi, Y., & Rice Jr., J. B. (2005). A supply chain view of the resilient enterprise. MIT Sloan
Management Review, 47(1), 40–48.

95
Short, J., & Venkatraman, N. (1992). Beyond business process redesign: redefining Baxter’s
business network. Sloan Management Review, 34(1), 7–21.
Simatupang, T. M., & Sridharan, R. (2004). A benchmarking scheme for supply chain
collaboration. Benchmarking: An International Journal, 11(1), 9–30.
Simon, H., Kozmetsky, H., Guetzkow, G., & Tyndall, G. (1954). Centralization vs. decentral-
ization in organizing the controller’s department. Public budgeting and finance. Read-
ings in theory and practice, 487–501.
Simons, R. (1990). The role of management control systems in creating competitive ad-
vantage: New perspectives. Accounting, Organizations and Society, 15(1-2), 127–143.
Simons, R. (2000). Performance measurement and control systems for implementing strategy:
Text & cases. Upper Saddle River, NJ: Prentice Hall.
Sink, H. L., & Langley, J. (1997). A managerial framework for the acquisition of third-party
logistics services. Journal of Business Logistics, 18(2), 163–190.
Sirmon, D. G., Hitt, M. A., & Ireland, R. D. (2007). Managing firm resources in dynamic
environments to create value: Looking inside the black box. Academy of Management
Review, 32(1), 273–292.
Sodhi, M. S., Son, B.-G., & Tang, C. S. (2012). Researchers’ perspectives on supply chain
risk management. Production and Operations Management Journal, 21(1), 1–13.
Springinklee, M., & Wallenburg, C. M. (2012). Improving distribution service performance
through effective production and logistics integration. Journal of Business Logistics,
33(4), 309–323.
Stank, Theodore P., Keller, S. B., & Daugherty, P. J. (2001). Supply chain collaboration and
logistical service performance. Journal of Business Logistics, 22(1), 29–48.
Stank, Theordore P., Daugherty, P. J., & Ellinger, A. E. (1999). Marketing/logistics integra-
tion and firm performance. International Journal of Logistics Management, 10(1), 11–
24.
Tang, C. S. (2006). Perspectives in supply chain risk management. International Journal of
Production Economics, 103(2), 451–488.
Tangen, S. (2004). Performance measurement: from philosophy to practice. International
Journal of Productivity and Performance Management, 53(8), 726–737.
Tomer, J. (1987). Organizational capital: The path to higher productivity and well-being.
New York: Praeger Publishing.
Trkman, P., & McCormack, K. (2009). Supply chain risk in turbulent environments—A
conceptual model for managing supply chain network risk. International Journal of Pro-
duction Economics, 119(2), 247–258.
96
Tung, A., Baird, K., & Schoch, H. P. (2011). Factors influencing the effectiveness of perfor-
mance measurement systems. International Journal of Operations & Production Man-
agement, 31(12), 1287–1310.
Van Donselaar, K., Kokke, K., & Allessie, M. (1998). Performance measurement in the
transportation and distribution sector. International Journal Of Physical Distribution and
Logistics Management, 28(6), 434–450.
Van Hoek, R. I. (1998). Measuring the unmeasurable - measuring and improving performance
in the supply chain. Supply Chain Management: An International Journal, 3(4), 187–
192.
Van Hoek, R. I. (2001). The contribution of performance measurement to the expansion of
third party logistics alliances in the supply chain. International Journal of Operations &
Production Management, 21(1/2), 15–29.
Van Hoek, R. I., Ellinger, A., & Johnson, M. (2008). Great divides: Internal alignment
between logistics and peer functions. International Journal of Logistics Management,
19(2), 110–129.
Van Hoek, R. I., & Mitchell, a. J. (2006). The challenge of internal misalignment. Interna-
tional Journal of Logistics Research and Applications, 9(3), 269–281.
Vandenbosch, B. (1999). An empirical analysis of the association between the use of execu-
tive support systems and perceived organizational competitiveness. Accounting, Organi-
zations and Society, 24(1), 77–92.
Waggoner, D., Neely, A. & Kennerley, M. (1999). The forces that shape organisational
performance measurement systems: An interdisciplinary review. International Journal of
Production Economics, 60-61, 53–60.
Wagner, S. M., & Bode, C. (2006). An empirical investigation into supply chain vulnerability.
Journal of Purchasing and Supply Management, 12(6), 301–312.
Wagner, S. M., & Bode, C. (2008). An empirical examination of supply chain performance
along several dimensions of risk. Journal of Business Logistics, 29(1), 307–325.
Wagner, S. M., & Kemmerling, R. (2010). Handling nonresponse in logistics research.
Journal of Business Logistics, 31(2), 357–381.
Weber, J. & Blum, H. (2001). Logistik-Controlling – Konzept und empirischer Stand.
Kostenrechnungspraxis, 45(5), 275–282.
Weber, J., & Schäffer, U. (1998). Entwicklung von Kennzahlensystemen. WHU - Otto
Beisheim School of Management, (62), 1–23.
Weber, J., Wallenburg, C. M., Bühler, A., & Singh, M. (2012). Logistics controlling with
performance measurement systems. German Logistics Association (BVL) - WHU - Otto
Beisheim School of Management.

97
Weick, K. E., Sutcliffe, K. M., & Obstfeld, D. (1999). Organizing for high reliability:
processes of collective mindfulness. Research in Organizational Behavior, 21, 13–81.
Wieland, A., & Wallenburg, C. M. (2012). Dealing with supply chain risks: Linking risk
management practices and strategies to performance. International Journal of Physical
Distribution & Logistics Management, 42(10).
Wisner, J. D., & Fawcett, Stanley, E. (1991). Linking firm strategy to operating decisions
through performance measurement. Production and Inventory Management Journal,
31(3), 5–11.
Wong, C., Skipworth, H., Godsell, J., & Achimugu, N. (2012). Towards a theory of supply
chain alignment enablers: a systematic literature review. Supply Chain Management: An
International Journal, 17(4), 419–437.
Wouters, M. (2009). A developmental approach to performance measures—Results from a
longitudinal case study. European Management Journal, 27(1), 64–78.
Zacharia, Z. G., & Mentzer, J. T. (2004). Logistics salience in a changing environment.
Journal of Business Logistics, 25(1), 187–211.
Zhao, M., Droege, C., & Stank, T. P. (2001). The effects of logistics capabilities on firm
performance: Customer-focused versus information-focused capabilities. Journal of Bu-
siness Logistics, 22(2), 91–108.

98
7 Appendix
Appendix 2-1
Scales and descriptive statistics
Constructs and Scale Items Mean SD Stand. Weight
t-value
Customer Orientation (Narver and Slater 1990)
Cronbach’s alpha = 0.76; AVE = 0.54; CR = 0.78
Please rate the extent to which the following items describe your logistics organization:
CO1 We have a very good understanding of customer needs. 5.72 1.08 0.73 15.92
CO2 There is a high commitment to serving customers’ needs. 5.62 1.17 0.73 15.80
CO4 We have very clear objectives regarding customer satisfaction. 5.40 1.50 0.74 16.20
Cross-functional Integration (Zacharia and Mentzer 2004; Daugherty et al. 2009)
Cronbach’s alpha = 0.88; AVE = 0.65; CR = 0.90
Please rate the extent to which the following items describe your logistics organization:
CFI1 Within our organization cross-functional work teams are extensively utilized for managing day-to-day operations.
4.57 1.69 0.73 17.08
CFI2 Within our organization, employees are encouraged to work together with colleagues from other functional areas.
5.05 1.54 0.87 21.90
CFI3 Managers in our organization are strongly encouraged to share information and provide input to other functional areas.
5.40 1.47 0.86 21.78
CFI4 Within our organization, employees from different functional areas are strongly encouraged to share resources.
4.98 1.53 0.84 20.95
CFI5 Managers across our organization work together in (informal) teams. 4.86 1.66 0.71 16.53
Logistics Performance (Fugate, Mentzer, and Stank 2010)
Cronbach’s alpha = 0.90; AVE = 0.79; CR = 0.92
Please rate your logistics organization’s performance on logistics activities in comparison to your competitors:
LP1 Our overall logistics performance is well above industry average. 4.94 1.10 0.82 20.13
LP2 In general, our logistics performance is excellent. 4.88 1.20 0.94 24.85
LP3 We are outstanding at performing our logistics activities. 4.99 1.16 0.90 23.44
Items were measured with 7-point Likert scale ranging from 1 = I strongly disagree to 7 = I strongly agree (for Logistics Performance: 1 = much worse to 7 = much better)

99
Appendix 2-2
Structural equation model without and with controls
Parameter
Model A: Structural equation
model without controls
Model B: Structural equation model with controls
Estimate p-value Estimate p-value
PMS excellence → Customer orientation (H1) 0.509 *** 0.591 ***
PMS excellence → Cross-functional integration (H2) 0.576 *** 0.512 ***
Customer orientation → Logistics performance (H3) 0.341 *** 0.264 ***
Cross-functional integration → Logistics performance (H4) 0.172 0.003 0.138 0.019
PMS excellence → Logistics performance (H5) 0.036 0.629 -0.021 0.787
Organizational size → Customer orientation (control) -0.168 ***
Organizational size → Cross-functional integration (control) -0.029 0.523
Organizational size → Logistics performance (control) 0.136 0.004
Organizational resilience → Logistics performance (control) 0.337 ***
R2 Customer orientation 0.332 0.377
R2 Cross-functional integration 0.259 0.263
R2 Logistics performance 0.202 0.221
Note: *** p-value < 0.001; ** 0.001 < p-value < 0.01; * 0.01 < p-value < 0.1

100
Appendix 3-1
Measurement scales and items
Constructs and Scale Items Mean SD Stand. Weight
t-value
Attention-Focusing (Vandenbosch, 1999)
(Cronbach’s alpha = 0.87; AVE = 0.63; CR = 0.87)
Please rate the extent to which your upper management currently uses PMS to G
AF1 G tie the organization together. 4.99 1.63 0.84 14.34
AF2 G enable the organization to focus on our critical success factors. 4.92 1.53 0.83 14.26
AF3 G provide a common view of the organization. 4.94 1.60 0.84 14.33
AF4 ... enable discussion in meetings of superiors, sub-ordinates and peers. 4.71 1.69 0.65 fixed
AF5 ... enable continual challenge and debate of underlying results, assump-tions and action plans.*
Score-Keeping (Vandenbosch, 1999)
(Cronbach’s alpha = 0.90; AVE = 0.71; CR = 0.91)
Please rate the extent to which your upper management currently uses PMS to G
SK1 ... track progress towards goals. 5.69 1.35 0.86 22.21
SK2 ... review key performance indicators. 5.35 1.47 0.80 19.77
SK3 ... monitor results. 5.75 1.31 0.86 22.27
SK4 ... compare outcomes to expectations. 5.74 1.29 0.85 fixed
PMS Design for Turbulence (newly developed)
(Cronbach’s alpha = 0.84; AVE = 0.65; CR = 0.85)
Please rate the extent to the following items describe the PMS of your logistics organization:
PDT1 We use specific risk metrics to understand the impact of external turbulence on our business.
3.64 1.86 0.80 15.37
PDT2 We use early warning indicators to anticipate and plan for fluctuations. 3.81 1.76 0.87 15.84
PDT3 We measure market volatility in order to be able to react on time. 3.50 1.76 0.73 fixed
Organizational Resilience (newly developed)
(Cronbach’s alpha = 0.83; AVE = 0.63; CR = 0.83)
Please rate the extent to the following items describe your logistics organization:
OR1 Our logistics organization has a strong ability to cope with external risk or turbulence.
5.00 1.30 0.83 16.51
OR2 We are well prepared to sustain operations in a turbulent market environ-ment and to recover quickly afterwards.
5.21 1.25 0.86 fixed
OR3 We have the capacity to adjust required functions under challenging or straining conditions.
5.24 1.19 0.69 14.42
Distribution Service Performance (Ellinger et al. 2000; Stank et al. 2001)
(Cronbach’s alpha = 0.86; AVE = 0.55; CR = 0.86)
Please rate your logistics organization's performance in comparison to competitors:
DSP1 The ability to meet quoted or anticipated delivery dates and quantities on a consistent basis.
5.16 1.08 0.76 14.10
DSP2 The ability to respond to the needs and wants of key customers. 5.40 1.11 0.69 13.63
DSP3 The ability to accommodate delivery times for specific customers. 5.22 1.13 0.67 14.50
DSP4 The adherence to customer specifications. 5.35 0.98 0.71 17.26
DSP5 The global judgment regarding the extent to which logistics performance matches customer expectations.
5.28 0.93 0.86 14.42
Items were measured with 7-point Likert scales ranging from 1 = not at all to 7 = to a very great extent (for Distribution Service Performance: 1 = much worse to 7 = much better)
(* items eliminated in scale-refinement after large-scale analysis)

101
Appendix 3-2
Exploratory Factor Analysis
Factor 1 Factor 2 Factor 3 Factor 4 Factor 5
AF1 0.756
AF2 0.800
AF3 0.837
AF4 0.576
SK1 0.669
SK2 0.595
SK3 0.928
SK4 0.905
PDT1 0.826
PDT2 0.861
PDT3 0.710
OR1 0.808
OR2 0.861
OR3 0.698
DSP1 0.746
DSP2 0.710
DSP3 0.681
DSP4 0.722
DSP5 0.841
Note: Only factor loadings above 0.30 are displayed
Appendix 3-3
Controls
Exposure to Market Turbulence (control variable)
Please rate the extent of fluctuations in your logistics organization’s environment: Mean SD
MT1 Our environment is characterized by a high number of ongoing fluctuations (e.g. raw material prices).
3.78 1.03
MT2 Our customer demand is subject to very high fluctuations. 3.51 1.03
MT3 The supply of our (sub-)suppliers is subject to very high fluctuations. 2.90 1.00
Items were measured with a 5-point Likert scale ranging from 1 = not at all 5 = to a very great extent
Type of Logistics Organization (control variable)
Internal logistics department of manufacturing/trading company n = 431 (58% of sample)
Logistics service provider n = 251 (42% of sample)

102
Appendix 3-4
Correlation matrix for the measurement items
DS
P5
1
DS
P4
1
0,6
25
DS
P3
1
0,4
85
0,5
26
DS
P2
1
0,5
62
0,4
92
0,5
86
DS
P1
1
0,4
83
0,5
20
0,5
23
0,6
79
OR
3
1
0,2
33
0,2
29
0,2
11
0,1
81
0,2
91
OR
2
1
0,5
93
0,2
34
0,2
05
0,2
47
0,1
98
0,2
57
OR
1
1
0,7
06
0,5
66
0,2
58
0,2
31
0,2
25
0,1
87
0,2
63
PD
T3
1
0,1
96
0,2
42
0,0
42
0,0
89
0,0
76
0,1
21
0,1
31
0,0
79
PD
T2
1
0,6
37
0,1
86
0,2
35
0,1
33
0,0
34
0,0
84
0,0
97
0,1
15
0,0
88
PD
T1
1
0,7
06
0,5
83
0,1
91
0,2
11
0,0
61
0,0
74
0,0
83
0,1
28
0,1
21
0,0
92
SK
4
1
0,2
48
0,1
89
0,1
49
0,1
94
0,1
50
0,0
74
0,0
63
0,1
53
0,0
94
0,1
40
0,0
94
SK
3
1
0,7
89
0,2
35
0,1
79
0,1
76
0,2
24
0,2
06
0,1
28
0,0
80
0,1
34
0,0
56
0,1
51
0,1
08
SK
2
1
0,6
74
0,6
35
0,3
00
0,2
50
0,2
11
0,1
86
0,1
51
0,1
20
0,1
07
0,1
22
0,1
02
0,1
75
0,1
29
SK
1
1
0,7
12
0,7
19
0,7
12
0,2
62
0,2
53
0,2
49
0,2
53
0,2
08
0,1
26
0,0
79
0,0
88
0,0
83
0,1
21
0,1
00
AF
4
1
0,4
38
0,4
57
0,4
18
0,3
72
0,2
82
0,3
28
0,2
37
0,2
35
0,1
89
0,1
23
0,1
03
0,1
14
0,1
07
0,1
22
0,1
38
AF
3
1
0,5
44
0,6
12
0,5
37
0,5
26
0,5
29
0,2
71
0,3
12
0,3
19
0,2
62
0,2
05
0,1
58
0,1
10
0,1
15
0,1
16
0,1
65
0,1
79
AF
2
1
0,7
05
0,5
44
0,6
01
0,5
81
0,5
11
0,5
19
0,3
43
0,3
40
0,3
02
0,2
10
0,2
15
0,1
69
0,0
86
0,0
85
0,1
38
0,1
57
0,1
60
AF
1
1
0,6
92
0,7
09
0,5
27
0,6
17
0,6
03
0,5
59
0,5
62
0,2
82
0,3
13
0,2
89
0,2
14
0,1
93
0,1
68
0,0
83
0,0
82
0,1
18
0,1
80
0,1
36
AF
1
AF
2
AF
3
AF
4
SK
1
SK
2
SK
3
SK
4
PD
T1
PD
T2
PD
T3
OR
1
OR
2
OR
3
DS
P1
DS
P2
DS
P3
DS
P4
DS
P5

103
Appendix 3-5
Structural equation model without and with controls
Parameter
Model A: Structural equation
model without controls
Model B: Structural equation model with controls
Estimate p-value Estimate p-value
PMS design for turbulence → Organizational resilience (H1) 0.298 *** 0.298 ***
Organizational resilience → DSP (H2) 0.368 *** 0.265 ***
PMS design for turbulence → DSP (H3) 0.044 0.427 0.023 0.676
Attention focusing → PMS design for turbulence (H4) 0.557 *** 0.553 ***
Score keeping → PMS design for turbulence (H5) -0.110 0.250 -0.108 0.258
Market turbulence → PMS design for turbulence (control) 0.071 0.220
Market turbulence → Organizational resilience (control) 0.003 0.957
Market turbulence → DSP (control) -0.093 0.117
Customer orientation → DSP (control) 0.258 ***
Cross-functional integration → DSP (control) 0.025 0.625
R2 PMS design for turbulence 0.225 0.230
R2 Organizational resilience 0.089 0.091
R2 DSP 0.147 0.183
Note: *** p-value < 0.001
Binary control (type of logistics organization) not included due to non-meaningful path coefficients

104
Appendix 4-1
Measurement scales (all items were measured with 7-point scales ranging from 1 = I strongly disagree to 7 = I strongly agree)
a. PMS design attributes – PMS scope
Please rate the extent to which the following items describe the PMS of your logistics organization
Measurement Diversity: Our Performance Measurement System G
MD1 G is not limited to one dimension (e.g. financials only), but measures performance along multiple complementary dimensions.
MD2 G ensures that all relevant performance dimensions are accounted for.
MD3 ... provides a diverse set of measures (e.g. financial/non-financial, internal/external, lagging /leading measures.)
Strategic-Operational Linkage: Our Performance Measurement System G
SOL1 ... provides causal links between operational value drivers (input measures) and strategic results (output measures).
SOL2 ... links all business activities with the achievement of goals and objectives of the organization as a whole.
SOL3 ... provides consistent and mutually reinforcing links between current operating performance and long-term strategies.
External Linkage: Our Performance Measurement System G
EL1 Gprovides measures that link internal activities to those of our supply chain partners.
EL2 ... enhances transparency on performance linkages between different participants in the supply chain.
EL3 ... includes measures that were jointly defined with our supply chain partners (customers, suppliers, alliance partners).
Design for Turbulence: Our Performance Measurement System G
DT1 G uses specific risk metrics to understand the impact of external turbulence on our business.
DT2 G uses early warning indicators to anticipate and plan for fluctuations.
DT3 G measures market volatility to enable our organization to react on time.
b. PMS design attributes – PMS usability
Please rate the extent to which the following items describe the PMS of your logistics organization
Information Timeliness: Our Performance Measurement System G
IT1 ... ensures more frequent measurement for continuously needed operational measures than for periodic result measures.
IT2 ... has performance measurement information readily available when needed.
IT3 ... helps to reduce the time lag between measuring performance and applying results for corrective action.
Information Aggregation: Our Performance Measurement System G
IA1 G focuses on relevant performance information based on selective measures.
IA2 ... provides less detailed, more focused performance information as one rises in the managerial hierarchy.
IA3 ... does not generate as many performance measures as possible but prioritizes the most relevant measures.
System Adaptability: Our Performance Measurement System G
SA1 ... can be easily adjusted to new findings or additional requirements.
SA2 ... responds dynamically to changed requirements or circumstances.
SA3 ... is not an off-the-shelf solution but easily adjustable to our specific business requirements.

105
Subjective perceptions of PMS success (all items were measured with 7-point scales ranging from 1 = I strongly disagree to 7 = I strongly agree)
Please provide your overall assessment of your logistics organization’s PMS
PMS satisfaction
I am very much satisfied with our PMS.
PMS usefulness for logistics control
Our PMS is highly useful for the control of our logistics operations.
Cost-benefit efficiency: Our Performance Measurement System G
CBE1 G generates benefits that compensate the costs associated with its development and maintenance.
CBE2 G shows a very adequate relationship between measurement effort and support for managerial decision-making.
CBE4 G enhances organizational effectiveness to an extent that justifies its initial and ongoing expenditures.
CBE4 G ensures a cost-effective gathering of performance information.
Logistics performance (all items were measured with 7-point scales ranging from 1 = I strongly disagree to 7 = I strongly agree)
Logistics efficiency: Please rate your logistics organization's performance in comparison to competitors:
EFC1 Total logistics cost.
EFC2 Freight cost.
EFC3 Labor productivity in logistics operations.
Logistics effectiveness: Please rate your logistics organization's performance in comparison to competitors:
EFN1 The ability to meet quoted or anticipated delivery dates and quantities on a consistent basis.
EFN2 The share of over/short/damaged deliveries.
EFN3 The ability to respond to the needs and wants of key customers.

106
Appendix 4-2
Descriptive Statistics
Total list of key performance measures
Performance measure
Cluster I Cluster II Cluster III Cluster IV Cluster V Average
Logistics effective-ness (overall average)
41% 55% 56% 68% 66% 59%
On-time delivery 65% 69% 77% 95% 90% 81%
Order fill rate 49% 66% 68% 84% 82% 73%
Cycle time 30% 53% 57% 63% 63% 55%
Customer complaints 70% 80% 84% 89% 91% 84%
Customer satisfaction 37% 61% 50% 81% 70% 61%
Returns allowances 41% 37% 51% 53% 60% 51%
Reaction time 8% 24% 26% 37% 34% 28%
Billing accuracy 10% 22% 20% 37% 33% 26%
Inventory differences 59% 69% 70% 74% 75% 71%
Logistics efficiency (overall average)
36% 51% 51% 63% 66% 55%
Total logistics cost 52% 69% 71% 86% 89% 77%
Freight cost1 79% 82% 86% 93% 90% 87%
Equipment downtime 21% 35% 41% 67% 59% 47%
Labor utilization 32% 57% 64% 86% 81% 67%
Warehousing cost 62% 71% 72% 77% 87% 77%
Overhead cost 56% 61% 64% 70% 78% 68%
Failure cost 16% 27% 27% 51% 43% 34%
Customer profitability 17% 43% 39% 53% 55% 44%
Inventory turnover 49% 63% 76% 77% 82% 73%
Orders per employee 27% 47% 40% 56% 58% 47%
Units per employee 25% 41% 38% 42% 54% 42%
Orders per time 33% 47% 42% 47% 61% 49%
Units per time 27% 43% 38% 47% 58% 45%
Turnover per hour 16% 35% 26% 33% 36% 30%
Space utilization 40% 55% 53% 63% 64% 57%
Equipment utilization 16% 37% 40% 54% 58% 44%
1Calculated average value for inbound freight cost and outbound freight cost

107
Structural characteristics
Structural feature Cluster I Cluster II Cluster III Cluster IV Cluster V Average
Industry (shippers only)
Automotive 13.9% 36.0% 15.9% 23.7% 19.1% 19.9%
Machinery and equipment 22.2% 4.0% 19.0% 15.8% 14.6% 15.9%
High-tech and electronics 11.1% 12.0% 9.5% 13.2% 4.5% 8.8%
Chemicals and pharmaceuticals 16.7% 16.0% 9.5% 10.5% 10.1% 11.6%
Consumer goods 8.3% 4.0% 17.5% 13.2% 30.3% 18.7%
Other industries 15.0% 10.0% 32.5% 17.5% 25.0% 19.9%
Organizational size (number of logistics employees in organization)
Small (less than 100) 69.8% 40.8% 51.4% 57.9% 43.7% 51.0%
Mid-size (100 up to 999) 19.0% 40.8% 33.3% 28.1% 38.4% 33.2%
Large (1000 or more) 11.2% 18.4% 15.3% 14.0% 17.9% 15.8%