performance measures for u.s. pacific fleet ship
TRANSCRIPT


DUDLEY KNOX LIBRARY
NAVAL POSTGRADUATE SCHOOL
MONTEREY CA 93943-5101


Approved for public release; distribution is unlimited.
Performance Measures for U.S. Pacific Fleet
Ship Intermediate Maintenance Activities
by
Deidre L. McLay
Lieutenant, United States Navy
B.S., University of Colorado
Submitted in partial fulfillment
of the requirements for the degree of
MASTER OF SCIENCE IN OPERATIONS RESEARCH
from the
NAVAL POSTGRADUATE SCHOOL
September 1992
Peter Purdue, Chairman
Department of Operations Research

Unclassified
ECURITY CLASSIFICATION OF THIS PAGE
REPORT DOCUMENTATION PAGEForm ApprovedOMB No. 0704-0188
I. REPORT SECURITY CLASSIFICATION
NCLASSIFIED1b. RESTRICTIVE MARKINGS
i. SECURITY CLASSIFICATION AUTHORITY
>. DECLASSIFICATION/DOWNGRADING SCHEDULE
3. DISTRIBUTION/AVAILABILITY OF REPORTApproved for public release; distribution is unlimited
PERFORMING ORGANIZATION REPORT NUMBER(S) 5. MONITORING ORGANIZATION REPORT NUMBER(S)
I. NAME OF PERFORMING ORGANIZATION
aval Postgraduate School
6b. OFFICE SYMBOL!
OR
7a. NAME OF MONITORING ORGANIZATION
:. ADDRESS (City, State, and ZIP Code)
lonterey, CA 93943-5000
7b. ADDRESS (City, State, and ZIP Code)
NAME OF FUNDING/SPONSORINGORGANIZATION
8b. OFFICE SYMBOL 9. PROCUREMENT INSTRUMENT IDENTIFICATION NUMBER
ADDRESS (City, State, and ZIP Code) 10. SOURCE OF FUNDING NUMBERSPROGRAMELEMENT NO.
PROJECTNO.
TASKNO.
WORK UNITACCESSION NO
I . TITLE (Including Security Classification)
ERFORMANCE MEASURES FOR U.S. PACIFIC FLEET SHIP INTERMEDIATE MAINTENANCE ACTIVITIES
» PERSONAL AUTHOR(S)
cLay, Deidre Loreen
J TYPE OF REPORTlaster's thesis
13b. TIME COVEREDFROM TO
14. DATE OF REPORT (Year, Month, Day)
1992, SEPTEMBER1 5. Page Count
76>. SUPPLEMENTAL NOTATIONhe views expressed in this thesis are those of the author and do not reflect the official policy or position of the
epartment of Defense or the U.S. Government.COSATI CODES
FIELD GROUP SUB-GROUP18. SUBJECT TERMS (Continue on reverse if necessary and identify by block number)
Performance, Efficiency, Productivity, Measure of Effectiveness, Intermediate
Maintenance Activity
I. ABSTRACT (Continue on reverse if necessary and identify by block number)
The subject of this thesis is performance measures for U.S. Pacific Fleet Ship Intermediate Maintenance Activities
(IMAs). It examines measurement data collected by the Maintenance Resource Management Systems (MRMS)and the Monthly IMA Utilization Report. Also, new timeliness measures of effectiveness are defined. The purposeof the study is to present, in one document, a description of all currently collected IMA performance measures,recommendations for other performance measures, and a statistical analysis of the performance measures to
determine if they show performance differences between the Intermediate Maintenance Activities.
) DISTRIBUTION/AVAILABILTIY OF ABSTRACT^UNCLASSIFIED/UNLIMITED SAMEASRPT.Q DTIC
1a. REPORT SECURITY CLASSIFICATION
Unclassified
2a. NAME OF RESPONSIBLE INDIVIDUAL
an C. Boger22b. TELEPHONE (Include Area Code)
(408)646-2607
22c. OFFICE SYMBOLOR/Bo
DD Form 1473, JUN 86 Previous editions are obsolete.
S/N0102-LF-0 14-6603
i
SECURITY CLASSIFICATION OF THIS PAGEUnclassified

ABSTRACT
The subject of this thesis is performance measures for U.S. Pacific Fleet Ship
Intermediate Maintenance Activities (TMAs). It examines measurement data collected by
the Maintenance Resource Management System (MRMS) and the Monthly EMA
Utilization Report. Also, new timeliness measures of effectiveness are defined. The
purpose of the study is to present, in one document, a description of all currently
collected IMA performance measures, recommendations for other performance measures,
and a statistical analysis of the performance measures to determine if they show
performance differences between the Intermediate Maintenance Activities.
111

TABLE OF CONTENTS
I. INTRODUCTION 1
A. WHY MEASURE PERFORMANCE ? 1
B. THESIS OVERVIEW 3
H. NAVY SHIP MAINTENANCE 5
A. BACKGROUND 5
1
.
Organizational Level 6
2. Intermediate Level 6
3. Depot Level 6
B. INTERMEDIATE MAINTENANCE ACTIVITY MISSIONS 7
C. U. S. PACIFIC FLEET INTERMEDIATE MAINTENANCE
ACTIVITIES 8
1. Description 8
2. Chain of Command 9
D. INTERNAL INTERMEDIATE MAINTENANCE ACTIVITY
ORGANIZATION 11
E. WORK REQUEST FLOW 11
IV

DUDLEY KNOX LIBRARYNAVAL POSTGRADUATE SCHOOLMONTEREY CA 93943-5101
m. PERFORMANCE MEASURES 14
A. MEASUREMENT 14
B. CATEGORIES OF PERFORMANCE MEASURES 15
1. Quantity 15
2. Efficiency 16
3. Effectiveness 16
4. Productivity 17
C. SUMMARY 18
IV. THE MAINTENANCE RESOURCE MANAGEMENT SYSTEM 20
A. BACKGROUND 20
B. MEASURES OF PERFORMANCE USED 23
1
.
Definition of Terms 24
2. Definition of Measures 25
C. ANALYSIS OF MRMS MEASURES OF PERFORMANCE 26
D. ANALYSIS OF HISTORICAL DATA 27
1
.
Data Description 28
2. Comparisons Between Intermediate Maintenance Activities ... 30
E. SUMMARY 34
V. MONTHLY IMA UTILIZATION REPORT 36
A. DESCRIPTION 36
B. DISCUSSION 37
C. DATA 39
1
.
Data as Reported 40
2. Derived (Calculated) Values 42
a. Percent of Work Requests Accepted 43
b. When Work Requests are Accepted 44
c. Manhours per Work Request 45
d. Relation Between Number of Personnel and Amount of
Work Done 48
VI. SUGGESTED MEASURE OF EFFECTIVENESS 52
A. DISCUSSION 53
B. SELECTION OF APPROPRIATE TIME INTERVAL 53
C. RESULTS 57
1
.
Comparison of Empirical Distribution Functions of A 59
2. Discussion of Tp
60
3. Discussion of Pt
61
D. SUMMARY 62
VH. CONCLUSIONS AND RECOMMENDATIONS 63
LIST OF REFERENCES 66
INITIAL DISTRIBUTION LIST 68
VI

I. INTRODUCTION
A. WHY MEASURE PERFORMANCE ?
It is often true that measurement data is collected and then nothing is done with the
data. If measurement data isn't used for something, then collecting it is a waste of time,
effort, and resources. There must be a reason for collecting performance information
about Intermediate Maintenance Activities.
Perigord writes,
"The purpose of measurement is to find evidence of any variation from the
negotiated specifications. The role of measurement is to identify possible
improvements and to indicate where to initiate action on failures. Above all,
measurement should be a potent vehicle of success." [Ref. 1]
"Success" is definitely a goal of Intermediate Maintenance Activities (IMAs). As
elements of the United States Navy, they must perform their mission well at all times to
ensure military readiness.
The determination that an IMA is performing its mission well is accomplished
through measuring its performance. Performing "well" can mean many things, including
performing effectively and efficiently.
Changes in the military due to the collapse of the Soviet Union and other world
events may require that some ship maintenance practices be altered. In 1990, U. S.
Pacific Fleet Staff members agreed that the following assumptions regarding future
Pacific Fleet maintenance trends were valid:

• Less resources available for maintenance,
• Shorter repair and modernization periods,
• More technically complex platforms,
• Infrastructure changes, such as base closures and consolidation of facilities,
• Growth of Intermediate level workload,
• Greater customer awareness of quality, and
• Increased emphasis on measurement. [Ref. 2]
Meaningful measurement data for Intermediate Maintenance Activity performance
is clearly desirable. However, it has been and continues to be difficult to obtain.
Intermediate Maintenance Activities (IMAs) came into being in a rather hit or miss
kind of way. The IMAs were created in their earliest form as a solution to a manpower
sea duty and shore duty rotation problem that resulted from the end of the United States'
involvement in the Viet Nam War. Their maintenance mission was defined after the fact.
The IMAs were not created in response to an existing maintenance need. No formal
performance measurement methods were defined.
Several observers have commented on the methods of performance evaluation that
were developed informally. Christopher Moe wrote in 1985,
"At SEMA Norfolk first line managers evaluate shop productivity on professional
"gut feeling". Characteristics that support this judgmental estimation focus
generally on personal motivation of shop personnel, skill acquired through on-the-
job experience, and training received through technical schools. Most of these
same managers based considerable weight on their individual ability to gauge
productivity through visual evaluation of shop activity. This visual perception wasfurther supported by each manager's knowledge of jobs in progress and projected

completion dates required to meet the ship's departure from the repair availability.
"
[Ref. 3]
William Marshall gave a simpler description. He listed the following methods used at
a Shore Intermediate Maintenance Activity (SIMA) for productivity measurement:
• Management by walking around,
• Observation of the parking lot technique, i.e. if the parking lot is empty early in
the day not enough work is being done,
• Completion rate,
• Number of productive manhours expended,
• Amount of shop overtime,
• Rework percentage, and
• Waterfront reputation. [Ref. 4]
Obviously, these are subjective measurement methods, difficult to record and analyze.
More quantitative, repeatable techniques are needed to obtain meaningful measurement
data. Such data are needed to identify possible improvements and to identify and correct
failures.
B. THESIS OVERVIEW
This thesis is organized into seven chapters. This introduction is Chapter I.
Chapter n is a description of Navy ship maintenance. Chapter HI contains a discussion
of various terms used in performance measurement. Current Intermediate Maintenance

Activity performance measures are examined in Chapters IV and V. Chapter VI
proposes a new performance measure and Chapter VII contains conclusions and
recommendations
.

n. NAVY SHIP MAINTENANCE
A. BACKGROUND
Ships are complex structures that require constant care and upkeep. They operate
at sea, a harsh and unforgiving environment; an uncared for ship will quickly deteriorate
and fail its user. Modern warships have the additional complexity of advanced weapons
systems and gas turbine propulsion plants. Such Navy vessels must be able to respond
to crises at any time in addition to performing routine deployments and exercises. There
is no place for unkempt, broken down ships in the United States Navy. To help ensure
that the ships of the fleet will be ready when called upon, the Navy has an extensive ship
maintenance program.
The Navy ship maintenance program is designed to keep ships at "an adequate
level of material condition to maximize their required operational availability to the Fleet
Commanders" [Ref. 5]. In other words, the goal of the maintenance program
is to keep everything in the ships of the Navy in proper working order and in proper
condition as much as possible. "Downtime" for any system or component is to be
minimized.
The Navy ship maintenance program has three levels, each requiring a different
degree of capability. The levels are organizational, intermediate, and depot. Each level
is defined below.

1. Organizational Level
The first level of maintenance is the organizational level consisting of the ship
itself and the sailors on board the ship. Organizational level maintenance is that
corrective and preventive maintenance accomplished by the ship's crew. The work is a
blend of equipment operation, condition monitoring, planned maintenance actions and
repair ranging from simple equipment lubrication to component change out and, in some
cases, complete rework in place. [Ref. 6]
2. Intermediate Level
The second level of maintenance is the intermediate level consisting of
Tenders, Repair Ships, Shore Intermediate Maintenance Activities (SIMAs) and Naval
Reserve Maintenance Facilities (SIMA NRMFs). At these commands Navy personnel
with specialized facilities and training accomplish intermediate level repair work.
Intermediate level maintenance is that maintenance which is normally
performed by Navy personnel stationed on tenders, repair ships, and at SIMAs and SIMA
NRMFs. It normally consists of calibration; repair or replacement of damaged or
unserviceable parts, components or assemblies; the emergency manufacture of
unavailable parts; and providing technical assistance. [Ref. 5]
3. Depot Level
Depot level maintenance is that type of maintenance generally requiring a
greater industrial capability than possessed by either organizational or intermediate level
activities. It consists of that maintenance performed by shipyards, either private or

Navy, Naval Ship Repair Activities, or other shore based activities, on equipment
requiring major overhaul or complete rebuild of parts, assemblies, subassemblies, end
items, and complete platforms, including manufacture of parts.
The only work to be scheduled for accomplishment by depot level
maintenance activities will be that which is not feasible to be accomplished by
organizational or intermediate level maintenance activities because of insufficient time
or manpower, or because it is beyond the capabilities of these fleet maintenance
activities, or is of such a nature that split responsibility between Fleet and depot
maintenance activities should be avoided. [Ref. 5]
B. INTERMEDIATE MAINTENANCE ACTIVITY MISSIONS
This thesis examines performance measures for the maintenance activities at the
intermediate level. It is not concerned with organizational or depot level maintenance.
A further explanation of the missions of Shore Intermediate Maintenance Activities,
Repair Ships, and Tenders follows.
The mission of the Shore Intermediate Maintenance Activities (SIMAs) is to:
• Perform intermediate level maintenance for ships,
• Provide meaningful assignments ashore to support sea/shore rotation in order to
retain the skilled Petty Officers needed to man the Fleet in peacetime and
mobilization,
• Provide in rate training and experience for sea intensive enlisted personnel whorepair and maintain shipboard systems,
• Provide a mobilization option for wartime maintenance and battle damage repair,
and

• Provide billets co-located with Naval Reserve Force ships to support TARpersonnel sea/shore rotation and retention. [Ref. 7]
Like Shore EMAs, the mission of Repair Ships and Tenders is to perform
intermediate level maintenance for ships. However, their mission does not include the
manpower rotation considerations and Naval Reserve support concerns listed above for
Shore IMAs. Unlike Shore IMAs, Tenders and Repair Ships are not fixed in one
location. They have the mobility necessary to provide intermediate level support, repair
of battle damage and other emergent repairs to advance and forward areas when required.
This unique feature, mobility, is also needed to redeploy intermediate maintenance
capability between theaters in balance with the movement of operating forces. This
reduces the investment needed for fixed overseas sites. [Ref. 7]
C. U. S. PACIFIC FLEET INTERMEDIATE MAINTENANCE ACTIVITIES
1. Description
There are eleven ship Intermediate Maintenance Activities (IMAs) assigned
to the United States Pacific Fleet. Six are shore based facilities, four are Tenders, and
one is a Repair Ship. They vary widely in size and capability. Table 1 lists the eleven
IMAs and the number of personnel assigned to each.
All IMAs have the capability to do routine intermediate level work such as
welding, valve work, pump repair, sheetmetal work, and electrical repair. The larger
IMAs can provide such things as foundry work, diving services, lifeboat maintenance,
electroplating, sonar repair, and gas turbine engine repair.
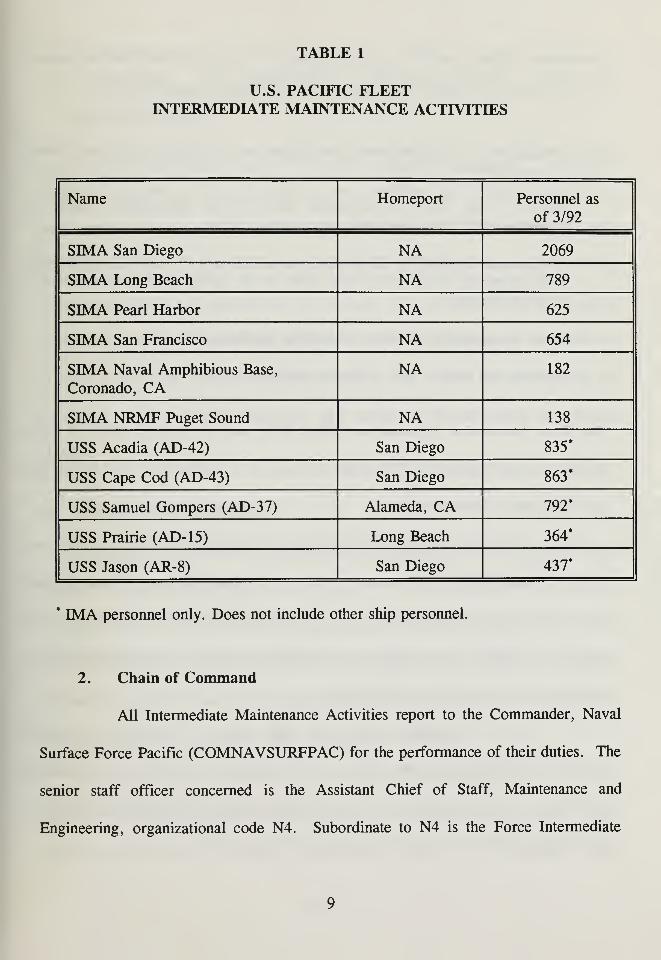
TABLE 1
U.S. PACIFIC FLEETINTERMEDIATE MAINTENANCE ACTIVITIES
Name Homeport Personnel as
of 3/92
SIMA San Diego NA 2069
SIMA Long Beach NA 789
SIMA Pearl Harbor NA 625
SIMA San Francisco NA 654
SIMA Naval Amphibious Base,
Coronado, CANA 182
SIMA NRMF Puget Sound NA 138
USS Acadia (AD-42) San Diego 835*
USS Cape Cod (AD-43) San Diego 863*
USS Samuel Gompers (AD-37) Alameda, CA 792*
USS Prairie (AD-15) Long Beach 364*
USS Jason (AR-8) San Diego 437*
* IMA personnel only. Does not include other ship personnel.
2. Chain of Command
All Intermediate Maintenance Activities report to the Commander, Naval
Surface Force Pacific (COMNAVSURFPAC) for the performance of their duties. The
senior staff officer concerned is the Assistant Chief of Staff, Maintenance and
Engineering, organizational code N4. Subordinate to N4 is the Force Intermediate

Maintenance Officer, code N41. A key assistant to N41 is the Intermediate Maintenance
Plans and Programs Officer, code N411. The many duties of N411 include:
• Provide data for budget input and budget requirements and prepare budget
recommendations for IMAs,
• Review Force IMA requirements and provide appropriate inputs to
COMNAVSURFPAC long-term procurement requests,
• Participate as the COMNAVSURFPAC representative in development efforts in the
ADP community which have a direct effect on the quality and/or improvement of
Force maintenance,
• Direct the scheduling of IMA availabilities for Force units, and
• Research and monitor IMA utilization performance. [Ref. 8]
The Force Intermediate Maintenance Officer (N41) and the Assistant Chief of Staff,
Maintenance and Engineering (N4) review and approve all reports from N41 1 before they
are forwarded to higher authority.
This thesis addresses the final item on the list, the duty to "research and
monitor IMA utilization performance". It does so by evaluating current methods used
to monitor IMA performance and by recommending additional methods. Valid
performance measures are necessary to support recommendations made about IMAs while
carrying out the other N411 duties listed.
There is another level in the chain of command between
COMNAVSURFPAC and the IMAs. The immediate senior for Intermediate
Maintenance Activities (IMAs) is the local screening authority. The screening authority
is discussed further in the subsection about work request flow.
10

D. INTERNAL INTERMEDIATE MAINTENANCE ACTIVITY
ORGANIZATION
Intermediate Maintenance Activities are job shop facilities. They consist of several
workcenters (or shops), each organized to do a particular type of work. Table 2 lists
representative workcenters. Not all IMAs possess all workcenters. For example, SIMA
San Francisco has 39 different workcenters while SIMA San Diego has 65. The
alphanumeric names are standardized; for example, 35A will always refer to an optical
workcenter regardless of where that workcenter is located. In addition to the production
oriented workcenters, support workcenters exist as well. These include Planning and
Estimating, Supply, Quality Assurance, and Automated Recordkeeping and Reports
(ARRS).
E. WORK REQUEST FLOW
A request for intermediate level work can be initiated by a ship for several reasons.
A piece of equipment may break in such a way that the ship's personnel cannot repair
it. Routine tests may show that an item needs refurbishment available only at the
intermediate level. A workspace may need new storage lockers. Mandatory periodic
intermediate level tasks may be due. Regular wear and tear may require the replacement
of various deck fittings, lengths of pipe, or portions of deckplate.
All requests are submitted via a standard work request document with formatted
fields of data to enable computer systems to aid in the processing of the requests. Each
ship maintains a list of its pending work requests, known as the Consolidated Ships
11

TABLE 2
PARTIAL LISTING OFINTERMEDIATE MAINTENANCE ACTIVITY
WORKCENTERS
11A shipfitter 51A electrical
17A sheetmetal 51F gyro
26A welding 56A pipe
31A inside machine 56C flex hose
31D valve repair 57A lagging
31G pump shop 64E key and lock
31T gas turbine 67A electronics
35A optical 67D teletype
Maintenance Plan (CSMP). The list is maintained in a computer format.
All ships in a given geographic area routinely submit their worklists (CSMPs) to
the local screening authority. The screening authority is a representative of
COMNAVSURFPAC responsible for allocating work to the IMAs in that geographic
area. For example, the screening authority in San Diego assigns work to SIMA San
Diego, USS Acadia (AD-42), USS Cape Cod (AD-43), and USS Jason (AR-8). When
deployed overseas, Tenders and Repair ships are under the authority of various deployed
commanders.
The screening authority is a work request broker. It reviews all work requests in
the geographic area for appropriateness and correctness and places the work with a
maintenance facility that can complete the work. Much of the work is placed with Navy
12

Intermediate Maintenance Activities, although the screening authority also places work
with civilian contractors.
Requests for work fall into two categories, planned and emergent. Planned work
is accomplished during availabilities, marrying the customer ships with the repair
activity, which can be an IMA or private sector contractor. An "availability " is a period
of time when the ship is made available for work by the scheduling authority and when
it receives priority service at the IMA. Availabilities are planned for weeks ahead of
time to ensure materials are available and all jobs are planned. Current Pacific Fleet
policy is that each ship should have at least one three-week availability each quarter.
Mission degrading emergent work is accomplished at any time and is assigned to repair
activities based on their capability, current workload, and operational necessity.
After a work request is accepted by the IMA, the job must be planned. Personnel
from the IMA's Planning and Estimating workcenter review the job, visit the customer
ship if necessary to gather additional information, order materials, and plan the number
of manhours and skill types to get the job done. A lead workcenter is assigned and
support workcenters are designated. Conducting centralized planning allows the planners
to load the workcenters with the appropriate amount of work and to prepare realistic
estimates of job completion dates. The work requests are completed by the IMA
personnel, the job is accepted as complete and satisfactory by the customer ship, and the
paperwork is completed to clear that work request from the ship's worklist (CSMP).
13

HI. PERFORMANCE MEASURES
This chapter will define and discuss some terms and ideas critical to an
understanding of performance measures. First, the idea of measurement itself will be
examined. Second, various categories of performance measurement will be considered,
including quantity, efficiency, effectiveness, and productivity.
A. MEASUREMENT
"Measure" is defined in the dictionary as "the act, process, or result of determining
the dimensions, capacity, or amount of something" [Ref. 9]. Moore defines it
as follows:
"To measure a property means to assign numbers to units as a way of representing
that property [Ref. 10]."
Useful measures require clear definitions of the property to be measured and the
unit to be used to measure that property.
Some properties and units are widely accepted and understood. For example, it is
difficult to find disagreement about what "length" is and difficult to find anyone who says
"feet" or "meters" are inappropriate units to use to measure length. Unfortunately, there
is not the same agreement about what to measure as an indicator of performance and
what units to use for such measurement. Some common ground must be agreed upon
before any meaningful discourse on performance can take place.
14
B. CATEGORIES OF PERFORMANCE MEASURES
Performance measures can be categorized in many ways. Considering it via the
three categories of quantity, efficiency, and effectiveness is useful because the data
examined later in the thesis in Chapters IV, V, and VI is grouped in that way. Attempts
to measure productivity requires special comment because productivity can be defined
using both an efficiency concept and an effectiveness concept.
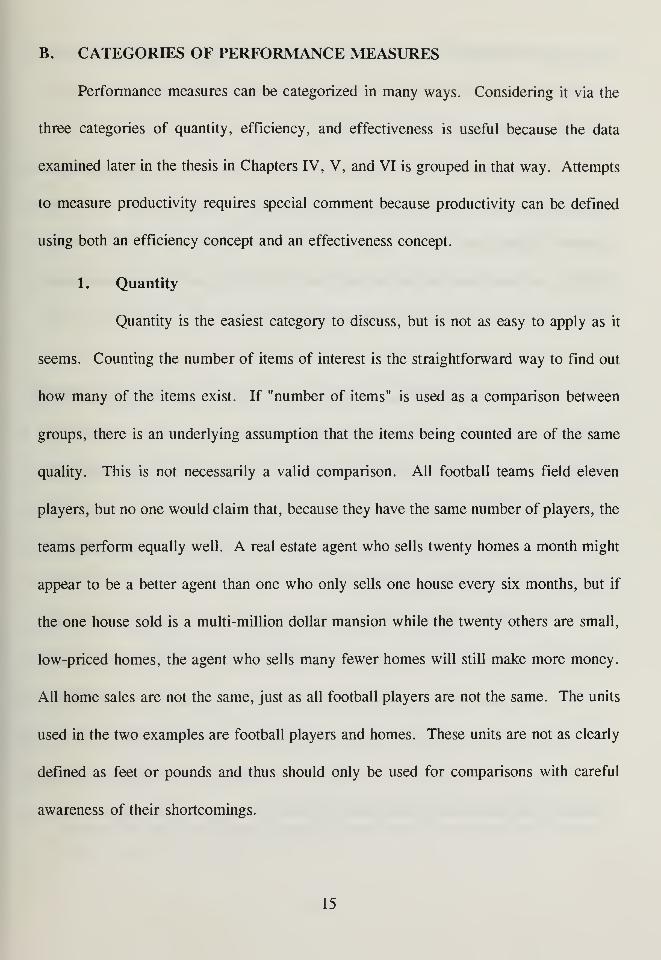
1. Quantity
Quantity is the easiest category to discuss, but is not as easy to apply as it
seems. Counting the number of items of interest is the straightforward way to find out
how many of the items exist. If "number of items" is used as a comparison between
groups, there is an underlying assumption that the items being counted are of the same
quality. This is not necessarily a valid comparison. All football teams field eleven
players, but no one would claim that, because they have the same number of players, the
teams perform equally well. A real estate agent who sells twenty homes a month might
appear to be a better agent than one who only sells one house every six months, but if
the one house sold is a multi-million dollar mansion while the twenty others are small,
low-priced homes, the agent who sells many fewer homes will still make more money.
All home sales are not the same, just as all football players are not the same. The units
used in the two examples are football players and homes. These units are not as clearly
defined as feet or pounds and thus should only be used for comparisons with careful
awareness of their shortcomings.
15

Measures of quantity are best used when the units are well defined, well
understood, and well accepted by those using the measure.
2. Efficiency
Efficiency has been defined as "the ratio of service quantity output to the
amount of input required to produce it [Ref. 11]." Calculation of an efficiency
measure requires a measure of output and a measure of input. An output measure is the
quantity of service units or product units that result from a task. An input measure is
the quantity of a resource that has been applied to a task.
3. Effectiveness
Effectiveness has been defined as "the degree to which the intended public
purposes of a service or activity are being met [Ref. 11]". It is difficult to get a
consensus on what "effectiveness" means because its definition is so context dependent.
Effectiveness is often confused with words like efficiency, performance, and productivity
by imprecise users. Webster's dictionary does not help matters by listing efficient and
productive as synonyms for effective.
Before appropriate measures and units can be selected to measure
effectiveness, the struggle over defining the purpose of a service or activity must be
resolved. Businesses have a readily accepted measure of effectiveness. It's called profit.
If a business doesn't make any money, it is definitely ineffective and will soon go out
of business. Government services and non-profit organizations have a more difficult time
measuring effectiveness because they do not produce goods or services that are
16

exchanged in the marketplace. They have no clearly defined and well-accepted measure
of output like the monetary profit of a business.
The question of effectiveness is especially important in military problems
because the military spends a lot of money doing a lot of tasks where performance is
difficult to measure. How can the military demonstrate that it is spending money
"effectively"? The desired output of the military is "readiness", the ability to respond
in a timely manner to any threat to or assignment from the government. Defining
military effectiveness and then somehow quantifying it will continue to be a challenge.
As used in operations research practice and in this thesis, effectiveness is not
necessarily related to efficiency and productivity. A highly efficient organization may
be ineffectual. For example, a firm that makes slide rules with a minimum number of
workers and small amount of resources, demonstrating high efficiency, will not be very
effective at meeting the calculating needs of today's high school students. They all want
electronic calculators. Likewise, a greatly effective organization may be inefficient,
possessing substantial room for efficiency improvement. A charitable organization might
regularly feed the homeless in its community, but if it's paying a world class chef high
wages to do something volunteers might do equally as well for no pay, it could improve
its efficiency.
4. Productivity
Levitan and Wemeke write,
For analysts of economic performance, productivity denotes the efficiency with
which resources—people, tools, knowledge, and energy—are used to produce goods
and services for the marketplace. [Ref. 12]
17

Once units for output and input are selected, productivity can be defined as the ratio of
output units to input units. Usually the units of output measure how much of a good or
service is produced. The idea is that if the same amount of output is made with less
input, productivity is higher. The interpretation of this definition of productivity is
limited as described by Levitan and Werneke:
An efficiency concept of productivity, however, is narrower than the idea of
product quality, for economic efficiency is concerned only with the output of goods
and services and not with how well the products meet consumers' needs or
wants... Productivity, then, is a concept of production rather than a measurement
of consumption or social welfare. [Ref. 12]
They point out that an efficiency concept of productivity is primarily concerned with
quantity of output. No consideration is given as to whether or not that output is desired
by the customer or is the best use of the resources required to produce it. An
effectiveness concept of productivity can be used to incorporate product quality and
customer satisfaction in the measurement. Rather than using an output measure of
quantity in the productivity ratio, the output measure used is a measure of effectiveness.
The effectiveness concept of productivity is not often used because it is difficult to define
effectiveness measures.
C. SUMMARY
People concerned with money and budgets are often drawn to measures of
efficiency and productivity. However, the customer is concerned with effectiveness. Is
the organization doing what it is supposed to be doing? Is the mission being
accomplished? To what extent is the mission being accomplished? Results are what
18

matters. The proper time to address efficiency and productivity is after effectiveness has
been determined. Only after it has been determined that an organization is accomplishing
its intended mission is it worthwhile to work on improving efficiency and productivity.
19

IV. THE MAINTENANCE RESOURCE MANAGEMENT SYSTEM
This chapter will describe the Maintenance Resource Management System (MRMS)
and discuss the measures of performance calculated by MRMS. It will comment on the
usefulness ofMRMS as an internal management tool. It will describe some dangers that
are present when MRMS data is used to make comparisons between Intermediate
Maintenance Activities (IMAs). Finally, historical MRMS data will be analyzed to
determine what the data show about IMA performance.
A. BACKGROUND
The Maintenance Resource Management System (MRMS) is an automated work
management system used by Navy ship Intermediate Maintenance Activities (IMAs). It
is intended "to provide an information support capability to enhance maintenance
management within the IMA community in order to ensure the material readiness of the
Pacific and Atlantic Fleets" [Ref. 13].
MRMS was selected in 1988 as the common information management system for
all Navy ship Intermediate Maintenance Activities. MRMS is in use at all Pacific Fleet
shore IMAs and at two afloat IMAs. MRMS will be installed aboard the remaining
afloat IMAs by the end of 1993.
MRMS is the most recent product in a series of systems that were specifically
designed to measure productivity. The initial impetus for the development of a
20

maintenance management system was the Department of Defense's increased emphasis
on productivity in the mid nineteen-seventies. The Navy started development of
productivity measurement systems after various Government Accounting Office reports
criticized the absence of any way to quantify productivity at Navy maintenance facilities.
The Maintenance Resource Management System (MRMS) provides extensive
maintenance management capability within a geographic area. It supports the area
maintenance manager and the individual Intermediate Maintenance Activities ashore and
afloat within that geographic area. To accomplish this, MRMS has been designed with
two major components, the Type Commander's Representative (TYCOM Rep)
Component and the Intermediate Maintenance Activity (IMA) Component.
The TYCOM Rep Component provides the area maintenance manager, also known
as the screening authority, with the capability on-line to store, screen, assign and track
intermediate level work that has been requested for accomplishment within his geographic
area. The IMA Component provides the capability on-line to receive, induct, plan, order
material for, schedule, issue and monitor the progress toward completion of the assigned
intermediate level work.[Ref. 14]
The performance measures examined in this chapter are calculated by the IMA
Component of the Maintenance Resource Management System.
The centerpiece of the MRMS IMA Component is a standards-based automated
work planning system which develops output measures for work accomplishment. Using
various work measurement techniques, a database of standard times for work tasks has
been developed. The database is used by IMA planners to "build up" jobs from
21

individual work tasks. After adding time for such things as travel, job set-up, and
worker skill level, each job is assigned a "planned manhour" value. The planned
manhours can be thought of as the potential "worth" or output value of the job. As the
job is completed the planned manhours are converted directly to "earned manhours", the
unit used to measure output in MRMS. An earned manhour is thus a planned manhour
that has been completed. Earned manhours are the only measure of output used to
calculate performance measures in the Maintenance Resource Management System.
Earned manhours are not the same thing as actual manhours expended on a job. The
actual manhours can be greater or less than the earned manhours. Earned manhours can
never exceed the number of planned manhours. Only in an ideal situation with perfect
planning and perfect execution and no variation will earned manhours and actual
expended manhours be equal.
The developers of MRMS state that the system allows maintenance managers to:
• Capture, address and dispose of more customer maintenance items than heretofore,
• Provide efficient area work brokering,
• Improve IMA shop loading,
• Reduce IMA shop throughput time,
• Promote higher quality output and reduce paperwork, and
• Accurately measure EMA output and input, hence performance and productivity.
[Ref. 15]
22
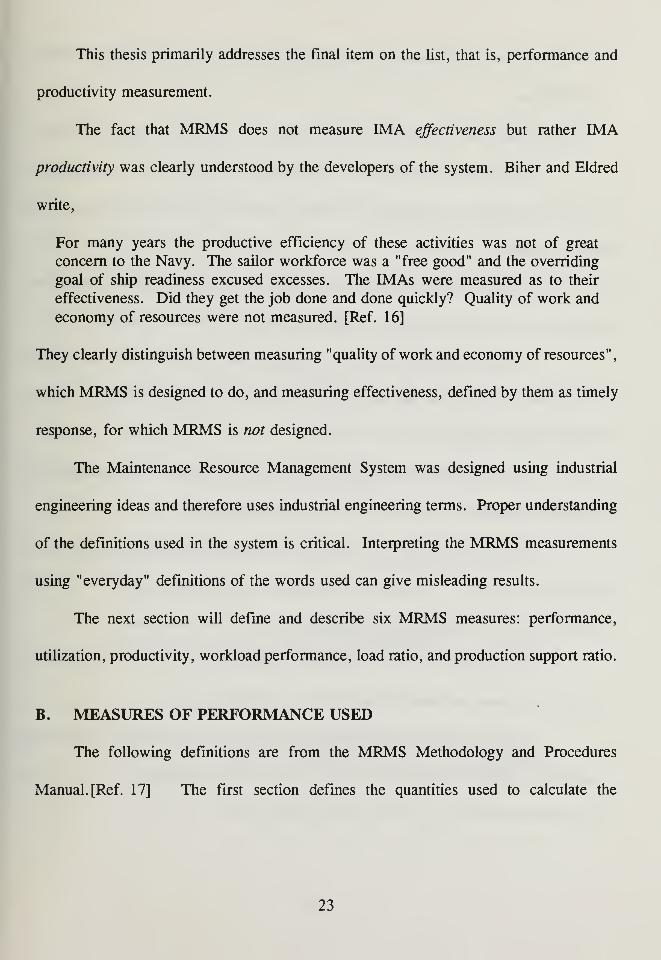
This thesis primarily addresses the final item on the list, that is, performance and
productivity measurement.
The fact that MRMS does not measure IMA effectiveness but rather EMA
productivity was clearly understood by the developers of the system. Biher and Eldred
write,
For many years the productive efficiency of these activities was not of great
concern to the Navy. The sailor workforce was a "free good" and the overriding
goal of ship readiness excused excesses. The IMAs were measured as to their
effectiveness. Did they get the job done and done quickly? Quality of work and
economy of resources were not measured. [Ref. 16]
They clearly distinguish between measuring "quality of work and economy of resources"
,
which MRMS is designed to do, and measuring effectiveness, defined by them as timely
response, for which MRMS is not designed.
The Maintenance Resource Management System was designed using industrial
engineering ideas and therefore uses industrial engineering terms. Proper understanding
of the definitions used in the system is critical. Interpreting the MRMS measurements
using "everyday" definitions of the words used can give misleading results.
The next section will define and describe six MRMS measures: performance,
utilization, productivity, workload performance, load ratio, and production support ratio.
B. MEASURES OF PERFORMANCE USED
The following definitions are from the MRMS Methodology and Procedures
Manual. [Ref. 17] The first section defines the quantities used to calculate the
23

MRMS performance measures. The second section defines the formulas used to calculate
the measures.
1. Definition of Terms
EARNED MAN-HOURS The total number of planned man-hours assigned
to that work which was completed by Repair Department production shops during the
reported period.
TOTAL MAN-HOURS ASSIGNED The total number of man-hours
assigned to the Repair Department production shops for the reported period.
GROSS PRODUCTIVE AVADLABLE MAN-HOURS The total number
of man-hours assigned less the total number of productive support man-hours assigned
for the reported period.
GROSS PRODUCTIVE SUPPORT MAN-HOURS The total number of
productive support man-hours assigned for the reporting period.
NET PRODUCTIVE AVAILABLE MAN-HOURS The total number of
productive man-hours available to production supervisors, equal to GROSS
PRODUCTIVE AVAILABLE MAN-HOURS minus allowed deductions.
NET PRODUCTIVE SUPPORT MAN-HOURS The total number of
productive support man-hours available for the reporting period.
MAN-HOURS UNASSIGNED TO JCNS The total man-hours of time when
technicians, otherwise available for work, are not so assigned because of lack of JCNs
(job control numbers, i.e., work requests) to be worked.
24

The following relationships between terms are true.
TOTAL MHRS ASSIGNED = GROSS PRODUCTIVE AVAILABLE MHRS +
GROSS PRODUCTIVE SUPPORT MHRS.
NET PRODUCTIVE AVAILABLE MHRS = EARNED MHRS + MHRS
UNASSIGNED TO JCNs + explained work delays + difference between mhrs
expended on jobs and mhrs planned for jobs.
Note that the last term on the right hand side of the above equation can be
positive or negative. The details of the last two terms in the final equation are not
presented in this thesis because they are beyond its scope. Complete information is
available in the Maintenance Resource Management System Users Manual, Reference 13.
2. Definition of Measures
The six measures calculated by MRMS are
EARNED MANHOURSPERFORMANCE =NET PRODUCTIVE AVAILABLE MANHOURS
TTrvTT ________ NET PRODUCTIVE AVAILABLE MANHOURSUTILIZATION =GROSS PRODUCTIVE AVAILABLE MANHOURS
25

PRODUCTIVITY = EARNED ^^URSGROSS PRODUCTIVE AVAILABLE MANHOURS '
LOAD RATIO = NET PR0D AVAIL MHRS ~ MHRS UNASSIGNED TO JCNNET PRODUCTIVE AVAILABLE MANHOURS
WORKLOAD
PERFORMANCE = EARNED ^^OURSNET PROD MHRS AVAIL - MHRS UNASSIGNED TO JCN '
PRODUCTIVEGROSS PRODUCTIVE SUPPORT AVAILABLE MHRSSUPPORT RATIO =
GROSS AVAILABLE MANHOURS
Note that PRODUCTIVITY and WORKLOAD PERFORMANCE can be calculated
directly from the other terms. That is,
PRODUCTIVITY = PERFORMANCE x UTILIZATION , and
WORKLOAD PERFORMANCE = PERF0RMANCELOAD RATIO
C. ANALYSIS OF MRMS MEASURES OF PERFORMANCE
The training materials and user's manuals provided by the MRMS developers go
into great detail about how to use the system to evaluate IMA workcenter performance
26
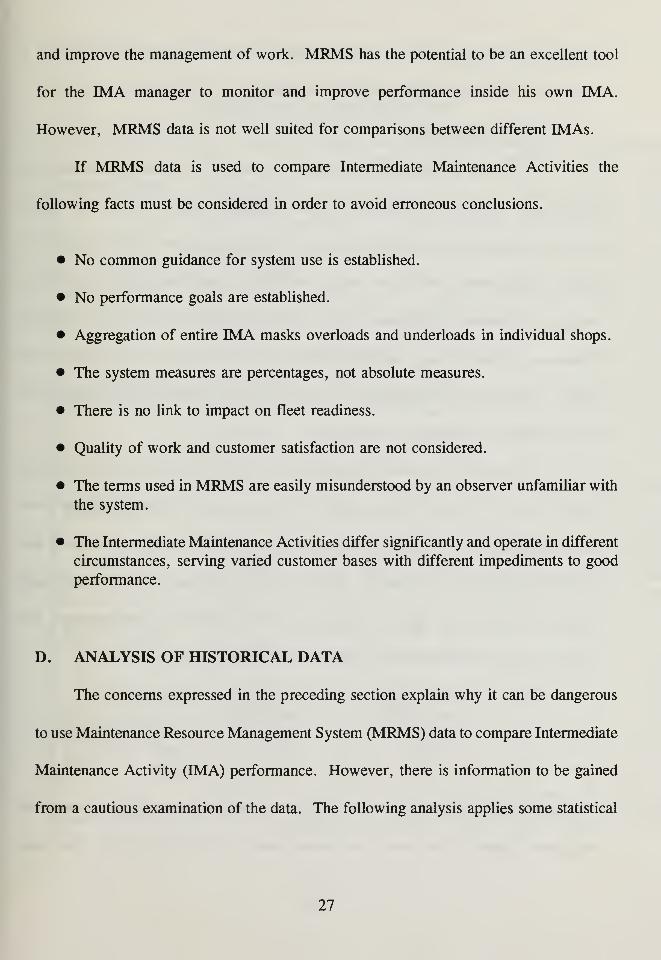
and improve the management of work. MRMS has the potential to be an excellent tool
for the IMA manager to monitor and improve performance inside his own IMA.
However, MRMS data is not well suited for comparisons between different EMAs.
If MRMS data is used to compare Intermediate Maintenance Activities the
following facts must be considered in order to avoid erroneous conclusions.
• No common guidance for system use is established.
• No performance goals are established.
• Aggregation of entire IMA masks overloads and underloads in individual shops.
• The system measures are percentages, not absolute measures.
• There is no link to impact on fleet readiness.
• Quality of work and customer satisfaction are not considered.
• The terms used in MRMS are easily misunderstood by an observer unfamiliar with
the system.
• The Intermediate Maintenance Activities differ significantly and operate in different
circumstances, serving varied customer bases with different impediments to good
performance.
D. ANALYSIS OF HISTORICAL DATA
The concerns expressed in the preceding section explain why it can be dangerous
to use Maintenance Resource Management System (MRMS) data to compare Intermediate
Maintenance Activity (IMA) performance. However, there is information to be gained
from a cautious examination of the data. The following analysis applies some statistical
27

techniques to demonstrate that there are statistical reasons for not using MRMS as a
comparison method as well as qualitative reasons.
1. Data Description
The data analyzed in this section is taken from twenty-seven months of
Maintenance Resource Management System monthly reports from four Shore
Intermediate Maintenance Activities (SIMAs). The four SIMAs are SIMA Long Beach,
SIMA Pearl Harbor, SIMA San Diego, and SIMA San Francisco. The months
considered are January 1990 through March 1992. MRMS data from Tenders and Repair
Ships was available for only one ship because not all ships have been equipped with
MRMS. Because the afloat IMAs are so different from the shore IMAs, the data from
the one ship was not included in the analysis.
Table 3 shows some of the descriptive statistics for the six MRMS measures
for each of the four shore IMAs analyzed. The means and standard deviations were
calculated using the 27 observations of monthly measures. The original numerator and
denominator values were not used because they were not available. Because the monthly
measures are ratios, this approach can lead to errors under some circumstances. For
example, consider UTILIZATION. Suppose three months data is as follows:
month Gross Prod. Net Prod. UTILIZATIONAvail. MHRS Avail. MHRS
1 1000 250 0.25
2 100 50 0.50
3 100 75 0.75 .
The actual average UTILIZATION for the three months, calculated using the sum of the
numerators divided by the sum of the denominators, is 375/1200 = 0.31. The mean
28

TABLE 3
SUMMARY OF MRMS PERFORMANCE MEASURESEXPRESSED AS PERCENTAGES
mean std dev median min max
PERFORMANCE Long Beach 75.5 6.2 76 63 88
Pearl Harbor 91.4 6.4 90 78 107
San Diego 60.5 4.5 61 46 66
San Francisco 76.4 7.8 77 54 91
UTILIZATION Long Beach 60.6 2.5 61 53 64
Pearl Harbor 58.9 6.7 57 48 73
San Diego 70.5 5.4 71 58 81
San Francisco 59.4 6.7 59 46 72
PRODUCTIVITY Long Beach 45.7 4.8 46 33 56
Pearl Harbor 54.1 8.6 52 41 72
San Diego 42.7 5.3 43 31 51
San Francisco 45.8 8.6 45 28 66
LOAD RATIO Long Beach 93.5 2.0 94 90 97
Pearl Harbor 96.9 2.7 97 89 100
San Diego 96.9 1.4 97 95 99
San Francisco 85.0 4.6 84 76 94
WORKLOADPERFORMANCE
Long Beach 80.6 6.9 82 69 91
Pearl Harbor 94.4 5.5 94 83 111
San Diego 62.3 4.3 63 48 68
San Francisco 90.0 7.4 91 62 97
PRODUCTIVESUPPORTRATIO
Long Beach 34.7 2.0 35 30 39
Pearl Harbor 38.3 2.4 39 31 43
San Diego 42.4 1.6 42 40 45
San Francisco 41.0 1.8 40 39 45
29
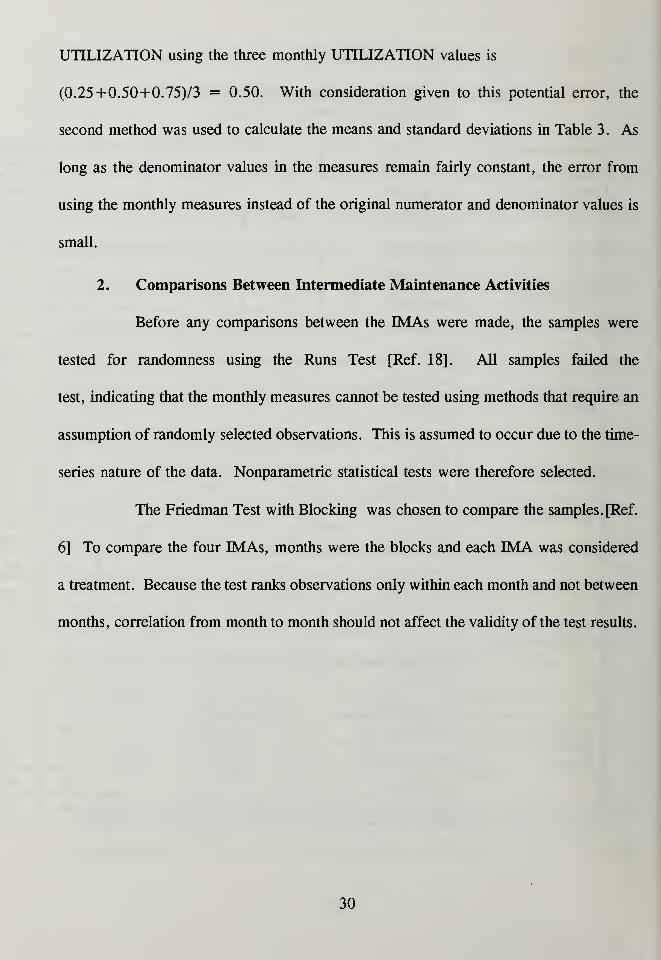
UTILIZATION using the three monthly UTILIZATION values is
(0.25 +0.50+0. 75)/3 = 0.50. With consideration given to this potential error, the
second method was used to calculate the means and standard deviations in Table 3. As
long as the denominator values in the measures remain fairly constant, the error from
using the monthly measures instead of the original numerator and denominator values is
small.
2. Comparisons Between Intermediate Maintenance Activities
Before any comparisons between the IMAs were made, the samples were
tested for randomness using the Runs Test [Ref. 18]. All samples failed the
test, indicating that the monthly measures cannot be tested using methods that require an
assumption of randomly selected observations. This is assumed to occur due to the time-
series nature of the data. Nonparametric statistical tests were therefore selected.
The Friedman Test with Blocking was chosen to compare the samples. [Ref.
6] To compare the four IMAs, months were the blocks and each IMA was considered
a treatment. Because the test ranks observations only within each month and not between
months, correlation from month to month should not affect the validity of the test results.
30

The hypotheses for the Friedman Test are
H : 6^. . .=Qk , and
HA : Not all 6iare equal,
where;is the median of sample i.
The Friedman test statistic is defined as
T =12 * 2
S R 2
bk(k+l)j=iJ
_
-3b(k+l), where
b is the number of blocks,
k is the number of treatments, and
Rj is the sum of the ranks assigned to treatment j.
Table 4 contains the test results when all four IMAs are compared.
The decision rule for the Friedman Test is to reject the null hypothesis at the
level a if the test statistic T exceeds the 1-ex quantile of a chi-square random variable
with k-1 degrees of freedom.
31

TABLE 4
RESULTS OF FRTEDMAN TESTFOR COMPARING IMAs
FOUR AT A TIME
Measure Test Statistic T Decision
PERFORMANCE 65.39 reject Hq
UTILIZATION 49.46 reject Hq
PRODUCTIVITY 26.84 reject Hq
LOAD RATIO 62.94 reject Hq
WORKLOADPERFORMANCE
67.50 reject Hq
PRODUCTIVESUPPORT RATIO
66.50 reject Hq
Decision rule: For a = 0.05, reject H when T > 7.815.
All of the tests reject the null hypothesis that all four sample medians are the
same. That is, there are statistically significant differences between the four IMAs for
all six performance measures. Further comparisons between the IMAs, three at a time
and two at a time, give the results shown in Tables 5 and 6. In several categories, it is
not possible to say with confidence that there are differences in the measures at the four
IMAs. Table 7 summarizes the findings.
It would appear that Pearl Harbor was the "best" IMA of the four because
it has the highest numbers in two of the six measures, and tied for best with San Diego
32
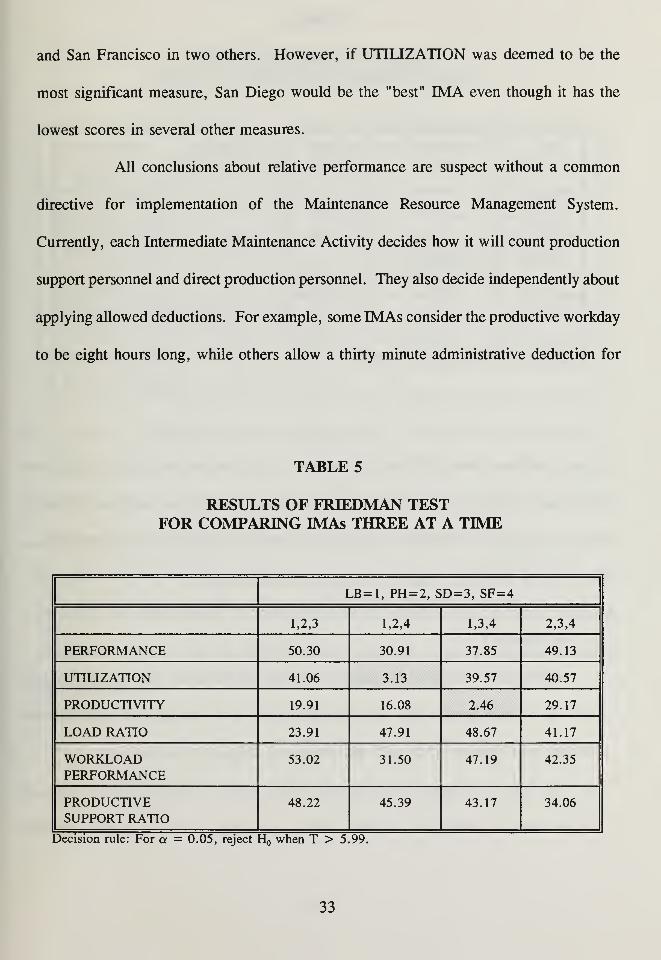
and San Francisco in two others. However, if UTILIZATION was deemed to be the
most significant measure, San Diego would be the "best" IMA even though it has the
lowest scores in several other measures.
All conclusions about relative performance are suspect without a common
directive for implementation of the Maintenance Resource Management System.
Currently, each Intermediate Maintenance Activity decides how it will count production
support personnel and direct production personnel. They also decide independently about
applying allowed deductions. For example, some IMAs consider the productive workday
to be eight hours long, while others allow a thirty minute administrative deduction for
TABLES
RESULTS OF FRIEDMAN TESTFOR COMPARING IMAs THREE AT A TIME
LB=1, PH= 2, SD= 3, SF= 4
1,2,3 1,2,4 1,3,4 2,3,4
PERFORMANCE 50.30 30.91 37.85 49.13
UTILIZATION 41.06 3.13 39.57 40.57
PRODUCTIVITY 19.91 16.08 2.46 29.17
LOAD RATIO 23.91 47.91 48.67 41.17
WORKLOADPERFORMANCE
53.02 31.50 47.19 42.35
PRODUCTIVESUPPORT RATIO
48.22 45.39 43.17 34.06
Decision rule: For a = 0.05, reject Hq when T > 5.99.
33

TABLE 6
RESULTS OF FRIEDMAN TESTFOR COMPARING IMAs TWO AT A TIME
PERFORMANCE LOADRATIO
WORKLOADPERFORMANCE
PRODUCTIVESUPPORTRATIO
LB/PH 19.59 14.81 25.04 19.59
LB/SD 27 16.33 27 27
LB/SF 0.33 27 13.37 27
PH/SD 27 1.33 27 23.15
PH/SF 21.33 27 3.71 17.93
SD/SF 23.15 27 27 5.33
leject H<, at a == 0.05 when T > 3.841
morning muster and afternoon cleanup, giving a seven-and-a-half hour workday. Over
a period of months and hundreds of workers, that thirty minute difference may show
performance differences that are not real, but rather a result of the definition of MRMS
measures policies. The MRMS measures may indeed indicate performance differences,
but the users of MRMS might be measuring different things.
E. SUMMARY
Maintenance Resource Management System performance data should be used
internally by each Intermediate Maintenance Activity as a management tool to monitor
and improve efficiency. After all, the system was designed to do just that.
Officials at Commander, Naval Surface Force, Pacific (COMNAVSURFPAC) must
provide standard guidance to the IMAs for use of MRMS before they can use MRMS
34

TABLE 7
SUMMARY OF COMPARISONSBETWEEN IMAs
Long
Beach
Pearl
Harbor
San
Diego
San
Francisco
PERFORMANCE same 1 4 same
UTILIZATION same same 1 same
PRODUCTIVITY same 1 same same
LOAD RATIO 3 same same 4
WORKLOADPERFORMANCE
3 same 4 same
PRODUCTIVESUPPORT RATIO
1 2 4 3
performance data to compare IMAs. An instruction defining exactly how to categorize
manhours, stating explicitly how to account for authorized deductions, and providing
some reasonable performance goal would be helpful. In addition, they must be careful
to understand what the data does and does not represent. MRMS data measures
efficiency, not effectiveness. COMNAVSURFPAC officials must use other categories
of measures together with the MRMS measurement data to get a complete picture of
IMA performance.
35

V. MONTHLY IMA UTILIZATION REPORT
This chapter describes the Monthly IMA Utilization Report, discusses its use, and
examines Fiscal Year 1991 data from the report.
A. DESCRIPTION
The Monthly IMA Utilization Report is a report of quantities. There is nothing in
the data, as reported, that purports to measure efficiency or effectiveness.
The report is required by Commander, Naval Surface Force, U.S. Pacific Fleet
(COMNAVSURFPAC).[Ref. 19] The data collected in the report are divided
into several sections, some of which are Manning Allocation, IMA Manning Utilization,
Man Hour Utilization, and Work Request Submission.
The instruction establishing the report states,
The efficient and effective utilization of maintenance resources is a high priority
matter for the Navy. Data on utilization is an important input for monitoring IMAperformance, TYCOM decisions on maintenance, meeting CINCPACFLT and
CNO reporting requirements and developing budgetary justification for manpowerand funding. [Ref. 19]
Although the instruction includes the words "efficient" and "effective", it does not
define what is meant by the words in the context of IMA performance. It also does not
explain how the data collected in the report can be used to measure efficiency and
effectiveness.
36

Note that the term "utilization" is used here to mean "usage" or "employment".
It is not the same definition of "utilization" used in the Maintenance Resource
Management System (MRMS) as described in Chapter IV. This dual usage of the same
word, but with different meanings, is a source of much confusion to people using both
the MRMS report and the Monthly EMA Utilization Report.
B. DISCUSSION
The numbers collected in the Monthly IMA Utilization Report answer questions of
the form "How much?" How many manhours were expended on customers this month?
How many work requests were completed? How many work requests were rejected?
How many people were assigned to the Intermediate Maintenance Activity? There is an
implied understanding that more is better in measures of quantity. This is not necessarily
true. Doing more jobs or expending more manhours on customers is not really a goal
of an Intermediate Maintenance Activity.
The assumption that more is obviously better is a common mistake when defining
and using measures of effectiveness. A classic example is that of analysts studying
Allied antisubmarine warfare efforts against German U-boats during World War II
.
Originally, the analysts proposed "number of U-boats sunk" as a measure of
antisubmarine warfare effectiveness. This definition assumes that the goal of
antisubmarine warfare was to sink U-boats. However, the real goal was to get cargo
across the ocean without having it sunk by enemy attack. Thus, an appropriate measure
of antisubmarine warfare effectiveness was merchant ships protected from sinking or tons
37

of cargo delivered, not number of U-boats sunk. The number of U-boats sunk might
actually go down while cargo delivered goes up due to better antisubmarine protection
for cargo ship convoys and less emphasis on submarine sinking. [Ref. 20]
In a like manner, measuring the amount of work done by an Intermediate
Maintenance Activity may not be measuring how well the IMA is achieving its
performance goal. In theory the IMAs could work 24 hours a day making plaques and
sheetmetal cabinets, while pumps and motors and radars and sonars lay broken. The
IMA certainly did a lot of work, but what did it accomplish? What did it contribute to
Fleet readiness? The IMA may fix the pumps and motors and radars and sonars, only
to have them break again due to poor quality work. The IMA will expend more
manhours and complete more jobs because of excessive rework. Is this what is meant
by a "good" or "efficient" or "effective" IMA? Probably not.
The real goal of an IMA is to do, in a timely manner, all the intermediate level
work that needs to be done. It may be true that the reason a particular IMA is doing less
work than another is because there is less work to be done. Perhaps all the customer
ships in their area have excellent maintenance and nothing ever breaks. If all the work
that needs to be done is complete, it's foolish to "make work" just to drive up reported
quantities.
Likewise, an IMA may be working overtime, expending massive amounts of
manhours on customers and completing thousands of jobs, but only half of the work that
needs to be done is being accomplished.
38

The measures of quantity of work reported in the Monthly IMA Utilization Report
do not address any aspect of how much work needs to be done.
Thus, the validity and meaningfulness of the quantities reported depends on the
integrity of the IMA management, screening authority, and customer ships. It must be
assumed that all work that needs to be done is attempted and that only work that needs
to be done and should be done by an EMA is attempted. Cheating, once it is clear that
number of jobs or number of manhours expended is the "important" number, is a
temptation for IMAs more determined to look good than to actually be good. Because
of this, both quantities are looked at with a jaundiced eye. "Gut feeling" and "waterfront
reputation" carry more weight as an evaluation of IMA performance than the numbers
in the Monthly IMA Utilization Report.
In spite of the distrust with which the numbers are viewed, they are collected and
have the potential to provide useful information about IMA performance. The next
section examines data reported in Fiscal Year 1991.
C. DATA
The data examined in this section is from the Monthly IMA Utilization Reports
submitted in Fiscal Year 1991 by all eleven U.S. Pacific Fleet Intermediate Maintenance
Activities (IMAs). Table 8 contains the legend used to identify the IMAs in all graphs
and tables of performance data.
First the data as reported will be examined. Second some derived (calculated)
terms are examined.
39

1. Data as Reported
The two leading ways to quantify the amount of work done by an
Intermediate Maintenance Activity are customer manhours expended and number of work
requests completed. Quantities for Fiscal Year 1991 are shown in Figures 1 and 2. Both
of these measures mask aspects of what was actually accomplished by the IMA.
Counting manhours doesn't indicate how well the workers performed. Did they do the
work in a "reasonable" amount of time or did they use "too much" time? What type of
work was done? What type of work was left undone? There is a potential to overlook
the fact that some IMAs have more personnel than others. It seems obvious that an IMA
with more workers would expend more manhours on customers.
TABLE 8
LEGEND USED IN GRAPHS AND TABLES
AC USS Acadia
(AD-42)
PS Puget Sound
CC USS Cape Cod(AD-43)
NAB NAB Coronado
GOM USS Samuel Gompers
(AD-37)
LB SIMA Long Beach
JA USS Jason
(AR-8)
PH SIMA Pearl Harbor
PR USS Prairie
(AD- 15)
SD SIMA San Diego
SF SIMA San Francisco
40

Customer ManhoursFY 1991
Thousands
1200
1000
800
600
400
200
145 673
264.819
817 962
523.453
123—112 _"34T5B4
-
184 488 201 15
309 207
92.67
AC CC GOM JA PR PS NAB LB PH 5D SF
Figure 1. Manhours Expended on Customers in FY 1991 by EVIAs.
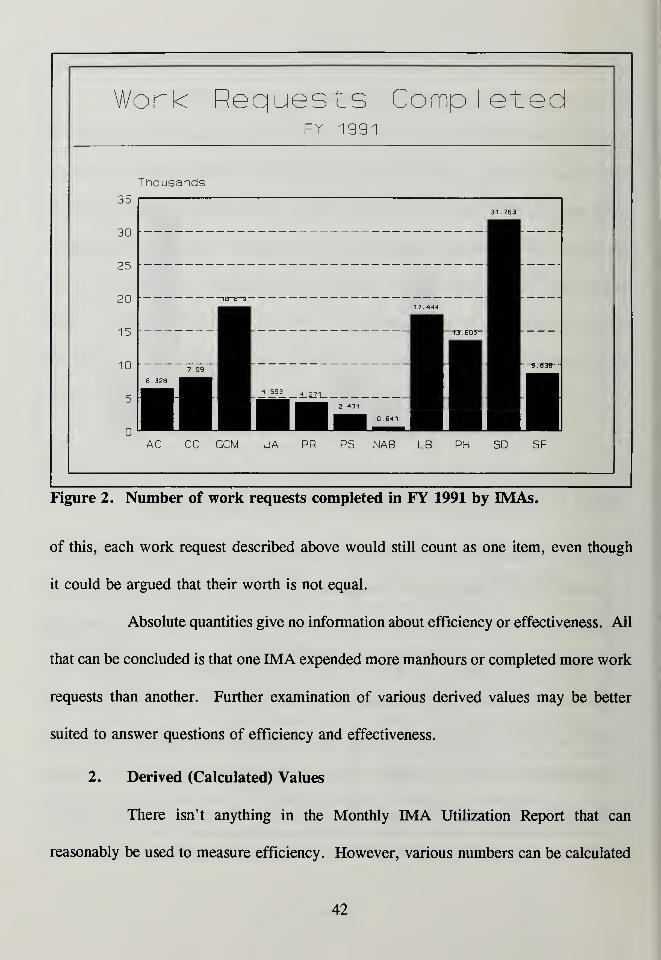
The problem with counting work requests is that the work requests are so
dissimilar. Unlike identical items manufactured on an assembly line, intermediate ship
maintenance tasks are extremely diverse. A work request could require one locksmith
to expend two hours drilling open a locked file cabinet or it could require several
electricians and welders to work many days installing waterline security lights. A job
repairing a main feed pump on a Sunday afternoon might allow a ship to meet a critical
operational commitment on Monday morning, while a job to manufacture decorative
brow skirts could require hours and hours of labor, but have no discernible impact on
readiness. The difficulty and significance of work requests can differ greatly. In spite
41
Work Requests Comp
1
etedFY 1991
Thousands
3531.763
3D
25
20
15
17.444
—TT 505-
10 7 99--Brrar-
6.328
51 693 „ ^^^^^B 1 2 471
uAC CC GOM JA PR PS NAB LB PH SD SF
Figure 2. Number of work requests completed in FY 1991 by EVIAs.
of this, each work request described above would still count as one item, even though
it could be argued that their worth is not equal.
Absolute quantities give no information about efficiency or effectiveness. All
that can be concluded is that one IMA expended more manhours or completed more work
requests than another. Further examination of various derived values may be better
suited to answer questions of efficiency and effectiveness.
2. Derived (Calculated) Values
There isn't anything in the Monthly IMA Utilization Report that can
reasonably be used to measure efficiency. However, various numbers can be calculated
42

to describe IMA performance and that performance can be deemed more or less
effective. It all depends on how "effective" is defined.
a. Percent of Work Requests Accepted
If an effective IMA is defined as one that accepts as many work
requests as are presented to it, then "percent of work requests accepted" is an appropriate
measure of effectiveness (MOE). A higher value would indicate a more effective IMA.
Table 9 lists the percent of work requests accepted by the IMAs in Fiscal Year 1991.
TABLE 9
WORK REQUEST ACCEPTANCE RATE
IMA # wr
accept
# wr reject % accept % reject
AC 7995 73 99 1
CC 8102 420 95 5
GOM 18487 100
JA 6157 100
PR 4695 45 99 1
PS 2991 339 90 10
NAB 823 91 90 10
LB 19545 269 99 1
PH 14872 630 96 4
SD 38719 2522 94 6
SF 11016 983 92 8
43

Work requests can be rejected for good reasons which may not be
caused by a performance deficiency by the EMA. For example, a work request may be
submitted that is beyond the capability of a particular IMA. The customer ships may be
filling out the work requests improperly, providing inaccurate or insufficient information
making it impossible for the IMA to accept the work. A piece of equipment may no
longer be supported by its manufacturer, making repair parts unavailable. Thus, some
percentage of work request rejection is acceptable. Indeed, the 10% rejection rate at
SIMA Puget Sound and NAB Coronado may be caused in part by capability shortcomings
of their extremely limited facilities. Big changes in the MOE at an IMA or an IMA
whose MOE differs greatly from that of the other EMAs should motivate further
investigation as to why that occurred. Again, the importance of using measurement data
as a way to improve performance is emphasized. The reasons for changes in the MOEs
must be sought out and either praised or corrected, else the effort expended in
measurement is wasted.
b. When Work Requests are Accepted
COMNAVSURFPAC divides work requests accepted into three groups
based on when they are accepted: advance, supplemental, and late or emergent. For
Tenders and Repair ships advance is defined as 35 days prior to availability start date.
For Shore EMAs, advance is defined as 45 days prior to availability start date.
Supplemental work requests are those accepted between the advance date and the
availability start date. Late or emergent work requests are work requests received after
44

the availability stan da,e and aU work quests received that a, not associated with an
availability.
Table 10 shows the distribution of work requests accepted by the IMAs
I the three categories. Interpreting the breakdown as an indication of IMA
effectiveness can lead to completely opposite fundings. Consider the percentage of iate
W0rk requests accepted. A high value here could indicate a good performance trait or
. bad performance trait. The good performance trait indicated is a wiUingness to accept
emergent work and/or aggressive identification of work on the customer ships even after
the avadability start date. The bad performance trait indicated is slow response to work
.quests submitted, delaying the work acceptance decision, and/or a failure on the part
of the customer ship to plan ahead and identify work in advance.
A high number of late work requests might result due to short notice
availabilities, scheduled with little lead time. Such availabilities are common for
deployed Tenders and Repair Ships.
The analysis of when work requests were accepted does describe an
aspect of IMA performance, but additional info— as to why the particular
o.stributron occurred is necessary before a given distribution can be characterized as
indicating "good" or "bad" performance.
c. Manhours per Work Request
The two quantities of output measured, customer manhours and number
of work requests, can be combined to calculate manhours per work request. If all IMAs
45
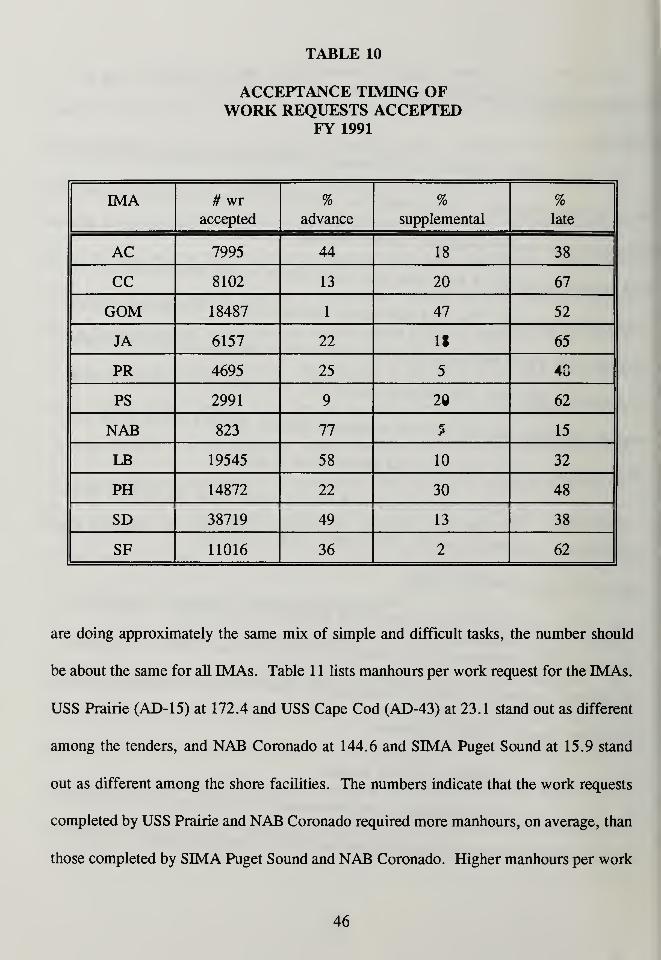
TABLE 10
ACCEPTANCE TIMING OFWORK REQUESTS ACCEPTED
FY 1991
IMA #wraccepted
%advance
%supplemental
%late
AC 7995 44 18 38
CC 8102 13 20 67
GOM 18487 1 47 52
JA 6157 22 13 65
PR 4695 25 5 70
PS 2991 9 29 62
NAB 823 77 8 15
LB 19545 58 10 32
PH 14872 22 30 48
SD 38719 49 13 38
SF 11016 36 2 62
are doing approximately the same mix of simple and difficult tasks, the number should
be about the same for all IMAs. Table 1 1 lists manhours per work request for the IMAs.
USS Prairie (AD-15) at 172.4 and USS Cape Cod (AD-43) at 23.1 stand out as different
among the tenders, and NAB Coronado at 144.6 and SIMA Puget Sound at 15.9 stand
out as different among the shore facilities. The numbers indicate that the work requests
completed by USS Prairie and NAB Coronado required more manhours, on average, than
those completed by SIMA Puget Sound and NAB Coronado. Higher manhours per work
46

request could indicate more complex jobs requiring more time or people to complete,
easy jobs that are just large, or overstaffing on jobs. Lower manhours per work request
could indicate more efficient workmanship, or an unwillingness to accept difficult jobs
that need many manhours to complete. The determination as to whether or not the
significantly different values for manhours per work request indicate a good performance
trait or a bad performance trait can only be made after further investigation.
TABLE 11
DERIVED MEASURES USING MANHOURSFY 1991
IMA mhrs/work
request
mhrs/ima person/month mhrs/ repair labor
person/month
AC 54.3 40.9 81.9
CC 23.1 23.3 42.4
GOM 43.9 98.3 195.5
JA 42.9 48.7 119.9
PR /72.4 71.4 59.1
PS 15.9 24.3 139.5
NAB 144.6 53.1 93.5
LB 30.0 58.7 96.2
PH 27.4 51.3 84.7
SD 36.1 52.8 97.5
SF 30.7 41.4 76.4
47

Table 11 also contains values for customer manhours per person
assigned to the EMA per month and customer manhours per person assigned to repair
labor per month. The first includes all IMA personnel, including both repair labor and
repair support. The second uses only personnel assigned to direct repair production
work. Again, a few observations stand out as noticeably different from the others. USS
Cape Cod (AD-43) has the smallest numbers of customer manhours expended per person
per month in both columns, 23.3 and 42.4. USS Samuel Gompers (AD-37) has the
largest numbers, 98.3 and 195.5. The USS Samuel Gompers numbers are more than
four times the numbers reported by USS Cape Cod. This large difference indicates that
the two ships are probably defining their units of measurement differently.
d. Relation Between Number of Personnel and Amount of Work Done
It seems reasonable to examine the relationship between the amount of
repair labor available to do work and the number of customer manhours expended. More
workers should lead to more work completed. Figure 4 shows a scatter plot of customer
manhours expended per year versus repair labor man-months per year. Superimposed
on the plot is a line fitted using a least squares fit. The commercial software MTNITAB
was used to do the least squares fit.
48

2500 5000 7500 10000
Repair Labor Person-Months per Year
A = cust mhr vs. rpr lab B = RTS4 vs. rpr lab
12500
Figure 3. Plot of customer manhours expended vs. repair labor man-months. Each
point represents one IMA.
49

The eleven data points, one for each IMA, indicate a strong linear
relationship between direct production repair labor man-months and customer manhours
expended. The p-value of the fit is 0.000. The fitted equation is
customer manhours expended per year =
97.59 x repair man-months per year.
This means that on average, each person assigned to direct production repair labor, not
production support labor, expends 97.59 labor hours per month on customers. Obviously
some individuals will work more than others due to the different types of work done in
the various shops. However, the fitted equation does immediately present the question
of what was done during all the other available workhours of the month. Assuming a
work month of twenty 7.5-hour days leaves over fifty hours per month per worker that
are not charged to customer jobs. Perhaps that time is required to fulfill tndning,
internal maintenance, and other administrative needs. Perhaps the time is available for
additional work. Additional study is necessary to determine if the 97.59 labor hours per
month per worker is the appropriate performance level for the IMAs.
There are two observations on the plot that are noticeable as having
large residuals. The one below the line represents USS Cape Cod (AD-43) and the one
above the line represents USS Samuel Gompers (AD-37). Some of the apparent disparity
in performance may represent plain-old better service, although such a huge difference
seems unlikely. Another explanation for the results can be found in the Fiscal Year 1991
50

operating schedules of the two ships. USS Cape Cod was deployed to the Persian Gulf
from February 1991 to May 1991, during Operation Desert Storm. Due to the nature
of the operations in the Persian Gulf, ships were not made available for routine work
availabilities and thus USS Cape Cod did not expend the usual number of labor hours on
customers. Also, USS Cape Cod was underway for 93 days of the year, an unusually
high number for a tender. USS Samuel Gompers, on the other hand, arrived in the
Persian Gulf in May 1991, just as USS Cape Cod was returning to San Diego, and
remained until August 1991. Many of the ships that had postponed routine intermediate
maintenance availabilities were now made available for work and USS Samuel Gompers
had more than the usual amount of work requests to accomplish. USS Samuel Gompers
also had fewer underway days than USS Cape Cod, accumulating only 72 underway days
during the year.
This explanation of the performance differences of the USS Cape Cod
and USS Samuel Gompers is a good example of how measurement data should be used.
Measurements from all eleven EMAs were looked at, but only the extraordinary cases
required additional investigation and explanation.
51

VI. SUGGESTED MEASURE OF EFFECTIVENESS
The Intermediate Maintenance Activity (IMA) performance measures discussed in
Chapters IV and V address efficiency and quantity. The measures are presented in
existing reports or can be calculated from data in those reports. Although the
Maintenance Resource Management System (MRMS) and the Monthly IMA Utilization
Report provide a lot of information, there is still very little information available about
IMA effectiveness. This chapter will propose some measures of effectiveness (MOEs)
for Intermediate Maintenance Activities.
Although it is most appropriate to determine measures of effectiveness first, before
efficiency and quantity measures, effectiveness measures are presented last in this thesis.
This is because the measures presented in this chapter are not currently collected by
COMNAVSURFPAC officials. Measurement data from currently collected reports were
examined first for their usefulness in measuring effectiveness. After it was determined
that additional measures of effectiveness would be desirable, this chapter was prepared
to propose some MOEs to augment the performance data already collected by
COMNAVSURFPAC officials.
52

A. DISCUSSION
The first difficulty encountered when trying to measure effectiveness is defining
effectiveness in the context of Intermediate Maintenance Activity (IMA) performance.
What is an effective IMA?
Because ship maintenance is a service provided to customer ships by the
Intermediate Maintenance Activity, it is appropriate to include the customer in the
definition of IMA effectiveness. What is it that the ships receiving maintenance want?
When discussing the issue of IMA effectiveness with maintenance providers and
maintenance customers, two things are mentioned repeatedly as desirable traits for IMAs:
high quality work and timely response to work requests. That is, an effective IMA is
one that demonstrates willingness to do work, does the work quickly, and does the work
well.
Measuring quality of work is beyond the scope of this thesis. A measure of
timeliness that captures some essence of IMA responsiveness is defined below.
B. SELECTION OF APPROPRIATE TIME INTERVAL
The aspect of effectiveness to be measured is timeliness. Effectiveness can be
defined in absolute or relative terms. A relatively "more effective" IMA is defined as
one that does more work faster than another IMA. An absolute definition of "effective"
could be a certain percentage of jobs completed in a certain number of days. For
example, absolute effectiveness could be defined as 70% of jobs completed in 180 days
or less. The specific time interval used is defined below.
53

Three different time intervals were considered to represent the effectiveness of
Intermediate Maintenance Activities. Two were discarded as inappropriate. The third
was selected even though it has some drawbacks.
The first time interval considered was the time between when an IMA started a job
and when the IMA finished the job. This would measure something primarily within the
control of the IMA but has the same problem of merely counting the number of work
requests completed. It only considers the work the IMA does, not the work it chooses
not to do. It doesn't take into account that the customer ship may have been waiting for
many months to get an IMA to say yes to the job, and then to finally start the job.
The second time interval considered was the time that a job stays on a ship's
worklist. The time interval would be measured from the date the ship's personnel put
the work request on the worklist to the date of completion of the work request by the
IMA workers. The mean-time-on-the-job-list would be calculated for all work requests
for each ship. This does assume that the jobs eventually get done because the time
interval cannot be calculated until the job is completed. If the ships in a particular
homeport had shorter mean-time-on-the-job-list, the IMAs in that port would be defined
as more effective than IMAs in other ports. This idea won't work as a measure of IMA
effectiveness because it doesn't identify individual Intermediate Maintenance Activity
performance. Each ship could be served by many different IMAs and so the mean-time-
on-the-job-list for a particular ship would be more a measure of the individual ship's
effectiveness in using the maintenance system than a measure of IMA effectiveness.
54

The second time interval described above can be used as a measure of IMA
effectiveness if the work requests are grouped by which IMA completes the work
requests rather than by which ship submitted the work requests. The time interval is
measured from the date a work request is put on the ship's worklist to the date the work
request is completed by IMA personnel. The time interval will be named A and is used
to calculate two measures of effectiveness (MOEs) described as follows.
First select the group of work requests to be used to calculate the MOEs. The
group can be all the work requests completed by an IMA in any given time period, for
example, a quarter or a year or a period of several years. Next determine A for each
work request where
A = date completed - date identified by ship.
The measures of effectiveness are
Tp= number of days, A, such that p percent of work requests in the group
considered have A < Tp , and
Pt= percent of work requests in the group considered that have A <, t.
The two measures of effectiveness are related to one another as follows:
P(r
, = x, and
T(pj
x-
For example, consider Tl0 = 25. It follows from the definition that P2S = 10. The
percentage ofjobs completed in 25 days or less, P25 , is 10. The number of days required
55
to complete 10% of the jobs, T10 , is 25. Next consider P30 = 12.8. It follows from the
definition that T12 8= 30. The number of days to complete 12.8% of the jobs, T128 , is
30. The percentage of jobs completed in 30 days or less, P30 , is 12.8. Defining both
Tpand P
tallows the user to emphasize one of two things by selecting the most
appropriate measure. Using Pt , the percentage of work completed in a certain time t is
emphasized. If it is desired to emphasize how long it takes to do a certain percentage
of work p, Tpcan be used.
These are compromise measures of effectiveness that have good points and bad
points. The good point is that the measures do capture the essence of timely response
to customer ship maintenance needs. It measures how long the ship is waiting to get
something done.
The bad point about the timeliness MOEs is that not all of the time interval A is
under the control of the IMA. Both Tpand P
tdepend on how well the maintenance
system as a whole is working. Part of the wait may be unavoidable. The ship
continually identifies problems and places work requests on its worklist even if it is
deployed and knows it will be several weeks before it has a maintenance availability.
Some other factors influencing the length of the time interval A are:
• Accuracy of information provided by ship,
• Responsiveness of screening authority to task IMA,
• Speed of planning department at IMA,
• Making ship available for work (schedule),
56

• Doing the work, and
• Completing paperwork.
It is important to remember that some portion of these delays is an acceptable and
understood part of the time interval A. An MOE doesn't have to be a "perfect", just
"appropriate" . An MOE is not designed to assign blame or accuse an IMA of dereliction
of duty. Rather, it must capture enough of the trait of interest to be helpful in
monitoring performance and identifying potential improvements. If numbers come out
other than expected, or there is something odd, further investigation is indicated.
Remember, measures of performance should be used to identify departure from the
acceptable norm. They are supposed to be a method to indicate ways for performance
improvement.
A measure of effectiveness is something that should change if additional resources
are added, demands are reduced, or procedures are improved. Tpand P
tmeet these
criteria.
C. RESULTS
The two measures of effectiveness, Tpand P
t , were calculated using data provided
by the Naval Sea Logistics Center. The necessary data about all work requests
completed by the IMAs in 1990 and 1991 were extracted from the Maintenance Material
Management (3M) System Central Data Bank. Data for jobs completed by SIMA Puget
Sound, NAB Coronado, and SIMA San Francisco were not available. The time interval
57

A was calculated for each job. Then Tpand P
twere calculated treating the two years of
data as one group. Tables 12 and 13 display the results.
TABLE 12
MEASURE OF EFFECTIVENESS Tp
FOR INTERMEDIATE MAINTENANCE ACTIVITIES
AC CC GOM JA PR LB PH SD
TM 34 23 13 23 18 39 28 25
T2„ 56 32 22 40 32 72 49 43
A 30 79 55 35 56 49 105 69 60
^40 105 77 52 74 70 138 92 81
T50 129 101 72 95 94 173 119 105
T« 154 138 97 120 124 216 155 134
^70 204 174 131 152 163 279 204 174
* 80 243 231 184 203 228 361 292 234
1«>0 372 312 281 323 354 469 418 350
I99 952 858 720 703 840 920 951 793
58

TABLE 13
MEASURE OF EFFECTIVENESS Pt
FOR INTERMEDIATE MAINTENANCE ACTIVITIES
AC CC GOM JA PR LB PH SD
"30 9.2 18.3 26.4 14.4 18.8 7.4 10.6 12.8
P90 33.4 46.3 57.8 48.5 48.4 25.2 39.4 43.8
"120 45.9 57.3 67.3 60.3 58.7 34.9 50.3 55.8
™180 66.3 72.9 79.4 76.3 73.1 51.5 66.3 71.3
*270 83.7 85.8 89.3 86.9 83.5 68.4 77.8 83.9
*360 89.4 91.7 93.6 92.2 90.7 79.9 86.4 90.7
1. Comparison of Empirical Distribution Functions of A
Before individual values of Tpand P
tare examined, the question of statistical
significance of the differences in those measures is addressed. Both measures describe
the empirical distribution function (EDF) of the time intervals A for a particular
Intermediate Maintenance Activity. The measures will differ in a statistically significant
way only if the empirical distribution functions are different. The Kolmogorov-Smirnov
(K-S) Two-Sample Test was used to compare the EDFs [Ref. 18]. At significance level
0.05, the K-S test rejects the null hypothesis that the EDFs are the same in 24 of 28
possible combinations of two IMAs. This means that in almost all cases the empirical
distribution functions of the As do differ significantly from one another, indicating that
differences in Tpand P
tare statistically significant. The cases where the null hypothesis
59

can not be rejected are USS Acadia/SIMA Pearl Harbor, USS Jason/USS Cape Cod, USS
Prairie/USS Cape Cod, and SIMA San Diego/USS Cape Cod.
2. Discussion of Tp
The USS Samuel Gompers (AD-37) has the smallest values of Tpand SIMA
Long Beach has the largest values of Tp
. T50 for USS Samuel Gompers is 72 and Tso for
SIMA Long Beach is 173. This means that 50% of the work requests completed by USS
Samuel Gompers were identified by the customer ships less than or equal to 72 days
prior to completion, and 50% of the work requests completed by SIMA Long Beach were
identified less than or equal to 173 days prior to completion.
The existence of the difference, although not its magnitude, makes sense
because of the differences in how SIMAs and Tenders operate. Tenders are expected to
react to short notice work requests, especially while deployed. Often when the tenders
are deployed, they will be the only repair facility in the area and may have few
customers to service. The tender may ask the customer ships to identify additional work
during the availabilities to more fully load the repair workcenters.
The SIMAs, in contrast, are more dependent on long-term planning and
scheduling of work. As fixed facilities serving many customer ships, they are often
unable to accept additional work identified after the availability work package has been
specified. Because the work packages must be submitted several weeks in advance, it
is not unreasonable that the SIMAs have higher values for Tp
.
60

Four of the tenders show similar values of Tp , all lower than the T
pvalues
of the SIMAs. USS Acadia is an exception, showing Tpvalues that look more like the
SIMA values.
Again, this MOE is merely an indicator of performance. The MOE itself
does not explain why the differences between IMAs occur. Values that stand out from
the others must be investigated further to be explained.
3. Discussion of Pt
Another way of examining the timeliness of work request completion by
Intermediate Maintenance Activities is Pt
. Current Pacific Fleet policy is to schedule
each ship for an intermediate maintenance availability once per quarter. If many jobs
have A > 90 days, that is, F^ is small, it indicates that either ships are not being
scheduled for availabilities quarterly, as desired, and/or the Intermediate Maintenance
Activities are not completing all of the outstanding jobs during the availabilities. Thus,
many work requests are carried on the ships' worklists from one availability to another
until finally there is an opportunity for an IMA to complete the work request.
Note that SIMA Long Beach has the lowest values for Ptand USS Samuel
Gompers has the highest values for Pt
. P^ for USS Samuel Gompers is 57.8 and P^ for
SIMA Long Beach is 25.2. Only 25.2 % of the work requests completed by SIMA Long
Beach were identified less than or equal to 90 days prior to completion, while 57.8% is
the proportion for USS Samuel Gompers.
Since no IMA has a P^ greater than 57.8, it appears that a large number of
work requests linger on ships' worklists for long periods of time. Some of the time
61

delay may be due to ship operating schedules, backlog of work requests caused by
insufficient EMA capacity, or failure of ships' personnel to properly use the maintenance
system. Again, The measure of effectiveness, Pt , is only an indicator of performance.
Explanations as to why the values are what they are must be discovered through further
investigation.
D. SUMMARY
The two measures of effectiveness, Tpand P
t ,provide information about the
timeliness of Intermediate Maintenance Activity response to work requests. They can
be used to identify and correct impediments to a faster turnaround time for completion
of work requests by focusing the attention of COMNAVSURFPAC officials on the IMAs
that are performing poorly. Collected over several periods of time, Tpand P
tcan be
used to monitor trends in performance.
62

Vn. CONCLUSIONS AND RECOMMENDATIONS
This thesis has examined various performance measures for ship Intermediate
Maintenance Activities. Performance measures are currently collected for quantity,
efficiency, and productivity. Effectiveness is not currently measured, but can be
measured as recommended in Chapter VI. All of the measures provide some information
about IMA performance and can be used by Naval Surface Force Pacific officials to
monitor IMA performance. However, two things must be carefully considered by users
of the performance measures to avoid erroneous conclusions.
First, understanding the definitions of what is being measured and what units are
being used is critical. Second, statistical tests are necessary to say with confidence that
the performance of EVIAs differ. Many of the differences in performance measures are
not statistically significant.
No one performance measure can quantify all aspects of IMA performance. Even
all of them together do not tell the whole story of IMA performance. As Moore warns,
Beware the arrogance that says that everything can be measured, or that only things
we can measure are important. The world contains much that is beyond the grasp
of statistics. [Ref. 10]
There are intangibles of Intermediate Maintenance Activity performance that will
augment measurement data when IMA performance is evaluated.
Recommendations for further study can be grouped as additional research in
support of existing performance measures, and as additional ideas for measuring effectiveness.
63

It was shown in Chapter V that, on average, 97.59 manhours were expended on
customers per direct repair production worker per month. It is unknown if this is a
reasonable or acceptable amount. A study should be done to discover how many
manhours per worker are actually available for productive work after all mandatory Navy
programs are completed. Such things as mandatory safety training, career counseling,
equipment maintenance, and other duties reduce the number of manhours available to
expend on customers. Perhaps the 97.59 customer manhours is close to what is actually
available to expend on customers.
More ways to measure effectiveness, in addition to Tpand P
trecommended in
Chapter VI, should be developed. A potentially successful method is a customer
satisfaction survey. A scientifically designed and analyzed survey of customer ships,
taken at regular intervals, would give valuable information about the effectiveness ofIMA
performance.
Both proper use of measurement data and concern for customer satisfaction are
elements of Total Quality Management (TQM), a management philosophy being
embraced by the United States Navy. One author summarizes the key elements of TQM
as follows:
The pillars of the cultural change are: focus on customers (both internal and
external); data-driven continuous improvement; and new ways to involve employees
and management in joint identification and solution of problems. [Ref. 21]
64

Measurement pervades Total Quality Management and is critical to its success. The
discussion presented in this thesis points out facts and concerns about performance
measurement to be addressed whether or not TQM is implemented at ship Intermediate
Maintenance Activities.
65

LIST OF REFERENCES
1. Perigord, Michel. Achieving Total Quality Management . Cambridge, MA:Productivity Press, 1990.
2. Commander in Chief, U.S. Pacific Fleet. Maintenance Division Strategic Plan for
FY 1991.
3. Moe, Christopher M. "Generic Obstacles and Difficulties Associated with the
Measurement and Enhancement of Productivity in Shore Intermediate Maintenance
Activity (SIMA), Norfolk, VA." Masters Thesis. Naval Postgraduate School 1985.
4. Marshall, William J. m. "An Evaluation of the Productivity Enhancing Capital
Investment Process at the Shore Intermediate Maintenance Activity, Little Creek, VA."
Masters Thesis. Naval Postgraduate School 1985.
5. Navy Ship Maintenance and Modernization Program, OPNAVINST 4700.7H, 30 Oct
1987, Enclosure (2), p. 1.
6. Navy Ship Maintenance and Modernization Program, OPNAVINST 4700.7H, 30 Oct
1987, Enclosure (3).
7. Navy Ship Maintenance and Modernization Program, OPNAVINST 4700.7H, 30 Oct
1987, Enclosure (4).
8. Standard Organization Manual, COMNAVSURFPACINST 5000. IF, 7 Dec 1988,
Appendix 4.
9. Webster's II New Riverside Dictionary . New York: Berkley Books, 1984.
10. Moore, David S. Statistics: Concepts and Controversies . San Francisco: W.H.Freeman and Company, 1979.
1 1
.
"Effectiveness Measures: Literature and Practice Review" . U.S. Dept of Housing and
Urban Development, Office of Policy Development and Research. June 1979.
Washington, D.C.
12. Levitan, Sar A. and Werneke, Diane. Productivity: Problems. Prospects, and
Policies . Baltimore: Johns Hopkins University Press, 1984.
66

13. Maintenance Resource Management System (MRMS) Intermediate Maintenance
Activity (IMA) Component Methodology and Procedures Manual, Doc. No. MR12-000.00, Planning Research Corporation, Inc.,October 1991, p. iii.
14. Maintenance Resource Management System (MRMS) Intermediate Maintenance
Activity (IMA) Component Methodology and Procedures Manual, Doc. No. MR12-000.00, Planning Research Corporation, Inc., October 1991, p. 2-1.
15. Maintenance Resource Management System (MRMS) Intermediate Maintenance
Activity (IMA) Component Methodology and Procedures Manual, Doc. No. MR 12-
000.00, Planning Research Corporation, Inc., October 1991, p. 2-1.
16. Biher, Richard A. and Eldred, William A. "A standards-based automated workplanning system for job shop application." Computers and Industrial Engineering 19
(1990): 326-330.
17. Maintenance Resource Management System (MRMS) Intermediate Maintenance
Activity (IMA) Component Methodology and Procedures Manual, Doc. No. MR12-000.00, Planning Research Corporation, Inc., October 1991, pp 6-1 to 6-6.
18. Conover, W. J. Practical Nonparametric Statistics . New York: John Wiley & Sons,
Inc., 1971.
19. IMA Utilization Report, COMNAVSURFPAC INSTRUCTION 4700.7B, 23 April
1990.
20. McCue, Brian. U-Boats in the Bay of Biscay: An Essay in Operations Analysis .
Washington, D.C.: National Defense University Press, 1990.
21. Jasper, Herbert N. "Down the Quality Road." Government Executive . April 1992,
37-40.
67

INITIAL DISTRIBUTION LIST
1. Defense Technical Information Center
Cameron Station
Alexandria, Virginia 22304-6145
2. Library, Code 0142
Naval Postgraduate School
Monterey, California 93943-5002
3. Commanding Officer
Naval Surface Force Pacific
Readiness Support Group
Naval Station, P.O. Box 126
San Diego, California 92136-5126
4. Commander Naval Surface Force,
U.S. Pacific Fleet
Naval Amphibious Base, Coronado
San Diego, California 92155-5035
Attn: CDR Rick Beckhart, Code N41
5. Commanding Officer
SIMA San Francisco
Bldg 162
NAS Alameda
Alameda, California 94501-5000
Attn: LT C.L.Archut, USN
6. Dan C. Boger, Code OR/BONaval Postgraduate School
Monterey, California 93943
7. Glenn Lindsay, Code OR/LSNaval Postgraduate School
Monterey, California 93943
8. Deidre L. McLay1206 Cheyenne Court
Boulder City, Nevada 89005
68


DUDLEY KNOX U8RARYNAVAL POSTGRAD! JATE SCHOOLMONTEREY CA 93343-5101
a-. id—
i
O.^T33l-i OC C3TUO c 3n roo =rra m m ro» ib rj -J *•• (W•i—' robj • 1— -*. r_n c*j EXro»—•». ^jro roo< en ro exS3Xl*>J "vX -* -Ji-» <t> -o nj cr» >-— b a> c-*l-i —• co -J »' GO -*^o- -• CD -^<=>=j CO 3I— O CO !-•<» n co rokjD 3t Oj OJ •jD w- ro OJ^j3 »-• e+ CO kno. CO
DSMGO
