performance measures of warm asphalt mixtures for safe...
TRANSCRIPT

®
The contents of this report reflect the views of the authors, who are responsible for the facts and the accuracy of the information presented herein. This document is disseminated under the sponsorship of the Department of Transportation
University Transportation Centers Program, in the interest of information exchange. The U.S. Government assumes no liability for the contents or use thereof.
Performance Measures of Warm Asphalt Mixtures for Safe and Reliable Freight Transportation Phase II: Evaluation of Friction and Raveling Characteristics of Warm Mix Asphalt Mixtures with Anti-stripping Agents
Report # MATC-UI: 373 Final Report
Hosin “David” Lee, Ph.D., P.E.Professor Civil and Environmental EngineeringUniversity of Iowa
Yongjoo “Thomas” Kim, Ph.D.
2011
A Cooperative Research Project sponsored by the U.S. Department of Transportation Research and Innovative Technology Administration

Performance Measures of Warm Asphalt Mixtures for Safe and Reliable Freight
Transportation Phase II: Evaluation of Friction and Raveling Characteristics of Warm
Mix Asphalt Mixtures with Anti-stripping Agents
Principal Investigator
Hosin ―David‖ Lee, Ph.D., P.E.
Professor
Public Policy Center
Department of Civil and Environmental
Engineering
University of Iowa
Co-Principal Investigator
Yongjoo Kim, Ph.D.
Research Scholar
Public Policy Center
University of Iowa
Researcher
Beomjun Chon, Ph.D.
Postdoctoral Research Scholar
Public Policy Center
University of Iowa
A report from
Public Policy Center
University of Iowa
227 South Quadrangle
Iowa City, IA 52242-1192
http://ppc.uiowa.edu
March 2011
The contents of this report reflect the views of the authors who are responsible for the facts and the accuracy of the
data presented herein. The contents do not necessarily reflect the official views or policies of Mid-America
Transportation Center (MATC). This report does not constitute a standard, specification or regulation.

ii
TECHNICAL REPORT
STANDARD TITLE PAGE
1. Report No. 2.Government Accession No. 3. Recipient’s Catalog No.
25-1121-0001-373
4. Title and Subtitle 5. Report Date
Performance Measures of Warm Asphalt Mixtures for Safe and
Reliable Freight Transportation Phase II: Evaluation of Friction
and Raveling Characteristics of Warm Mix Asphalt Mixtures with
Anti-stripping Agents
March 2011
6. Performing Organization Code
7. Author(s) 8. Performing Organization Report No.
Hosin “David” Lee, Yongjoo Kim and Beomjun Chon
9. Performing Organization Name and Address 10. Work Unit No.
Public Policy Center University of Iowa 227 South Quadrangle Iowa City, IA 52242-1192
11. Contract or Grant No.
12. Sponsoring Agency Name and Address 13. Type of Report and Period Covered
Mid-America Transportation Center, University of Nebraska-Lincoln U.S. Department of Transportation, RITA 2200 Vine St, 262 Whittier Building, P.O. Box 830851 Lincoln, NE 68583-0851
Final
14. Sponsoring Agency Code
MATC TRB Rip No. 24484
15. Supplementary Notes
16. Abstract
The viscosity of asphalt decreased significantly when 0.5% of WMA additive was added, but it remained relatively
steady as the dosage rate increased up to 3.0%. The reduction pattern in viscosity as the dosage rate increases was
similar for both CECABASE RT® and LEADCAP at all test temperatures of 120°C,125°C, 130°C and 135 °C and a
similar pattern was observed for both Sasobit® and Rediset. Based on the ABCD test device, the virgin asphalt binder
PG 64-34 cracked at -51.0°C and the PG 64-28 cracked at -41.3°C. As the WMA additives were increased from 0.5%
to 3.0%, the cracking temperatures increased slightly, but remained steady near the cracking temperature of the virgin
asphalt binder. The ABCD test results confirmed that the cracking temperature of asphalt binder was not significantly
affected by any of these four WMA additives.
The BPN value steadily decreased as the specimen surface was abraded by a rotating rubber although the MTD value
did not change significantly. The most significant change in BPN has occurred between 30 and 45 minutes of abrasion
whereas no significant change was observed between 45 and 65 minutes of abrasion.
The control WMA without additive exhibited the lowest Tensile Strength Ratio (TSR) value of 53.3%, which increased
to 66.6% with lime and 83.5% with an Anti-stripping agent (ASA). WMA-Sasobit exhibited 73.7% but it slightly
decreased to 72.7% with lime and 72.3% with ASA. WMA-LEADCAP exhibited 80.3% but it decreased to 78.5% with
lime and increased to 81.4% with ASA. The control HMA exhibited 82.7% and it increased to 89.3% with lime and
92.6% with ASA. It can be concluded that TSR values of both WMA-Sasobit and WMA-LEADCAP were not affected
by lime or ASA.
A more extensive study should be performed quantifying the temperature-viscosity relationship of asphalt mixed with
varying amounts of WMA additives at different temperatures. An additional study should be performed on the effect of
lime and anti-stripping agent on WMA mixtures with various additives. It is recommended that the skid test should be
performed on WMA pavements in the field after several years of service.
17. Key Words 18. Distribution Statement
Warm mix asphalt (WMA), indirect tensile strength, moisture susceptibility, Skid Resistance, Surface Friction,
19. Security Classification (of this report)
20. Security Classification. (of this page) 21. No of Pages 22. Price
Unclassified Unclassified 66 N/A

iii
TABLE OF CONTENTS
LIST OF TABLES .........................................................................................................................V
LIST OF FIGURES ......................................................................................................................V
ACKNOWLEDGEMENTS ....................................................................................................... IX
1. INTRODUCTION..................................................................................................................... 1
1.1 OBJECTIVES ........................................................................................................................... 3
1.2 BENEFITS ............................................................................................................................... 3
1.3 ADVANTAGES ......................................................................................................................... 3
2. LITERATURE REVIEW ......................................................................................................... 5
3. VISCOSITY AND LOW-
TEMPERATURE CRACKING OF ASPHALT WITH WMA ADDITIVES ........................ 13
3.1 VISCOSITY AND LOW TEMPERATURE CRACKING TESTS ....................................................... 13
3.2 VISCOSITY TESTING PLAN .................................................................................................... 15
3.3 VISCOSITY TEST RESULTS .................................................................................................. 16
3.3.1 Straight Asphalt Binder (A) .......................................................................................... 16
3.3.2 Evotherm J1 (B) ........................................................................................................... 17
3.3.3 Rediset (C) ................................................................................................................... 18
3.3.4 Sasobit® (D) ................................................................................................................ 19
3.3.5 Cecabase RT (E) .......................................................................................................... 21
3.3.6 LEADCAP (F) .............................................................................................................. 22
3.4 SUMMARY OF VISCOSITY TEST RESULTS .............................................................................. 23
3.5 LOW TEMPERATURE CRACKING TEST RESULTS .................................................................... 25
4. EVALUATION OF FRICTION CHARACTERISTIC OF WMA PAVEMENT .............. 28
4.1 SKID RESISTANCE OF PAVEMENTS ........................................................................................ 28
4.2 LABORATORY TESTS OF SKID RESISTANCE ........................................................................... 32
4.2.1 Sand Patch Method ...................................................................................................... 32
4.2.2 British Pendulum Test .................................................................................................. 33
4.2.3 Abrasion Test ................................................................................................................ 36
5. EVALUATION OF MOISTURE SENSITIVITY ................................................................ 40
5.1 MOISTURE SENSITIVITY TESTING PROCEDURE ..................................................................... 41
5.2 MIXING AND COMPACTION TEMPERATURES ......................................................................... 43
iv
5.3 BULK SPECIFIC GRAVITIES AND AIR VOIDS .......................................................................... 47
5.4 RESULTS OF TENSILE STRENGTH RATIO TEST ....................................................................... 47
6. SUMMARY AND CONCLUSIONS ...................................................................................... 56
6.1 CONCLUSIONS ...................................................................................................................... 56
6.2 FUTURE STUDIES ............................................................................................................... 57
REFERENCES ............................................................................................................................ 58

v
LIST OF FIGURES
Figure 2.1 States where WMA projects were implemented 9
Figure 3.1 Mixing and compaction temperature (ASTM 2493) 15
Figure 2.2 Asphalt Binder Cracking Device (ABCD) and environmental chamber 15
Figure 3.3 Plots of viscosity of straight asphalt binder against testing temperature 17
Figure 3.4 Plots of viscosity of asphalt binder using with Evotherm J1 against dosage rate 18
Figure 3.5 Plots of viscosity of asphalt binder using Rediset against dosage rate 19
Figure 3.6 Plots of viscosity of asphalt binder using Sasobit 21
Figure 3.7 Plots of viscosity of asphalt binder using Cecabase RT 22
Figure 3.8 Plots of viscosity of asphalt binder using LEADCAP 23
Figure 3.9 Plots of viscosity of asphalt binder at four different temperatures 25
Figure 3.10 ABCD test results of the LEADCAP with varying amounts 26
Figure 3.11 Temperature at which crack occurs by additive 27
Figure 4.1 Type of the pavement surface texture 30
Figure 4.2 Decreasing skid resistance value as a function of speed (Hibbs 1996) 30
Figure 4.3 Relationship among accident rate, BPN and macrotexture (Alexandros 1997) 31
Figure 4.4 Relationship among SN, Water Film Depth and Speed (Alexandros 1997) 31
Figure 4.5 Tools to measure the surface texture of pavements 33

vi
Figure 4.6 British Pendulum device to measure friction coefficient 34
Figure 4.7 Sliding length needed for BPT 34
Figure 4.8 Contact area between sample and the bottom of the pendulum of BPT Device 35
Figure 4.9 Skid number measured from different contact areas from different samples 36
Figure 4.10 Polishing testing device 37
Figure 4.11 Control WMA mixture after abrasion for 30, 45, and 60 minutes 38
Figure 4.12 WMA-Sasobit mixture after abrasion for 30, 45, and 60 minutes 38
Figure 4.13 WMA-LEADCAP mixture after abrasion for 30, 45, and 60 minutes 38
Figure 4.14 Skid number against polishing time for three different WMA mixtures 39
Figure 5.1 Flow chart of moisture sensitivity test for WMA and HMA specimens 43
Figure 5.2 Mixing and compaction temperatures of WMA and HMA mixtures for moisture
sensitivity test 46
Figure 5.3 Average bulk specific gravities of WMA and HMA mixtures for moisture sensitivity
test 50
Figure 5.4 Average air voids of WMA and HMA mixtures for moisture sensitivity test 52
Figure 5.5 Average indirect tensile strength at dry and wet conditions 54
Figure 5.6 Tensile strength ratio of WMA and HMA mixtures 55

vii
LIST OF TABLES
Table 2.1 List of warm mix asphalt technologies in the world 10
Table 2.2 List of field trials using warm mix asphalt technologies 11
Table 2.3 New construction projects to be documented as part of NCHRP 9-47A 12
Table 2.4 Monitoring projects to be documented as part of NCHRP 9-47A 12
Table 3.1 Dosage rate of WMA additives adopted for this study 16
Table 3.2 Viscosity test results of the straight asphalt binder 16
Table 3.3 Viscosity test results of asphalt binder using Evotherm J1 18
Table 3.4 Viscosity test results of asphalt binder using Rediset 19
Table 3.5 Viscosity test results of asphalt binder using Sasobit 20
Table 3.6 Viscosity test result of asphalt binder with Cecabase RT 22
Table 3.7 Viscosity test results of asphalt binder using LEADCAP 23
Table 3.8 Cracking Temperature of Binders with WMA Additives 27
Table 4.1 Skid resistance measured from different contact area 36
Table 4.2 Skid resistant results of polishing test 38
Table 5.1 Condition of modified Lottman test 41
Table 5.2 Number of gyrations applied to produce WMA and HMA specimens for moisture
sensitivity test 42

viii
Table 5.3 Temperature data of producing WMA and HMA mixtures for moisture sensitivity tests
44
Table 5.4 Temperature data of producing WMA and HMA mixtures for moisture sensitivity tests
(continued) 45
Table 5.5 Bulk specific gravities of WMA and HMA mixtures for moisture sensitivity tests 49
Table 5.6 Air voids of WMA and HMA mixtures for moisture sensitivity tests 51
Table 5.7 Indirect tensile strengths at dry and wet conditions and tensile strength ratio of WMA
and HMA mixtures 53

ix
ACKNOWLEDGEMENTS
The authors would like to thank Nishant Sheth, Anand Sampath, Adam Woods and Tony
Motyko for performing experiments for this study as research assistants. We are grateful for the
financial support provided by the Mid-America Transportation Center (MATC) and Korea
Institute of Construction Technology (KICT).

x
ABSTRACT
The viscosity of asphalt decreased significantly when 0.5% of WMA additive was added,
but it remained relatively steady as the dosage rate increased up to 3.0%. The reduction pattern in
viscosity as the dosage rate increases was similar for both CECABASE RT® and LEADCAP at
all test temperatures of 120°C,125°C, 130°C and 135 °C, and a similar pattern was observed for
both Sasobit® and Rediset. Based on the ABCD test device, the virgin asphalt binder PG 64-34
cracked at -51.0°C and the PG 64-28 cracked at -41.3°C. As the WMA additives were increased
from 0.5% to 3.0%, the cracking temperatures increased slightly but remained steady near the
cracking temperature of the virgin asphalt binder. The ABCD test results confirmed that the
cracking temperature of asphalt binder was not significantly affected by any of these four WMA
additives.
The BPN value steadily decreased as the specimen surface was abraded by a rotating
rubber although the MTD value did not change significantly. The most significant change in
BPN has occurred between 30 and 45 minutes of abrasion whereas no significant change was
observed between 45 and 65 minutes of abrasion. The control WMA without additive exhibited
the lowest Tensile Strength Ratio (TSR) value of 53.3%, which increased to 66.6% with lime and
83.5% with an Anti-stripping agent (ASA). WMA-Sasobit exhibited 73.7% but it slightly
decreased to 72.7% with lime and 72.3% with ASA. WMA-LEADCAP exhibited 80.3% but it
decreased to 78.5% with lime and increased to 81.4% with ASA. The control HMA exhibited
82.7% and it increased to 89.3% with lime and 92.6% with ASA. It can be concluded that TSR
values of both WMA-Sasobit and WMA-LEADCAP were not affected by lime or ASA.
A more extensive study should be performed quantifying the temperature-viscosity
relationship of asphalt mixed with varying amounts of WMA additives at different temperatures.

xi
An additional study should be performed on the effect of lime and anti-stripping agents on WMA
mixtures with various additives. It is recommended that the skid test should be performed on
WMA pavements in the field after several years of service.

1
1. INTRODUCTION
The basic concept of warm mix asphalt (WMA) technologies is to reduce the asphalt
binder viscosity, which allows the asphalt to attain a suitable viscosity to coat the aggregates and
thus compact asphalt mixtures at lower temperatures. The WMA technology was introduced in
the United States in 2002 for lowering emissions and improving the working environment.
Crows (2008) and Newcomb (2009) reported that 45 states in the US have used warm mix
asphalt technology in real construction or field trial projects. Moreover, Alabama, California,
Florida, Illinois, New York, North Carolina, Ohio, Pennsylvania, Texas, Virginia, Washington
and Wisconsin have allowed the use of WMA mixtures on many highway projects.
The WMA mixtures were mainly evaluated for rutting resistance and moisture sensitivity
because a lower mixing temperature may cause the incomplete drying of the aggregate. As a
result, it may affect the adhesion between asphalt and the aggregate increasing the rutting
potential in asphalt pavement. However, from the recent construction projects, it was reported
that the moisture sensitivity and rutting resistance between WMA and HMA were quite similar.
For example, WMA pavements using Aspha-min, Sasobit and Evotherm were constructed at
three separate sites in Missouri. After two years of service life, no rutting was found in either
WMA or HMA pavements. The WMA pavements using Aspha-min, Sasobit and Evotherm were
also constructed in Ohio. It was reported that rutting resistance and moisture damage of the

2
WMA pavements were identical to those of HMA pavements (NCAT 2010).
Phase 1 of the study was performed to evaluate strength, moisture sensitivity, stiffness,
and rutting resistance of WMA mixtures with six WMA additives, which included Cecabase
RT®, Sasobit®, Evotherm J1, RedisetTM
WMX and LEADCAP, along with the control WMA
mixture without additive and the control HMA mixture. Overall, Sasobit®, Evotherm J1 and
RedisetTM
WMX additives were effective in producing WMA mixtures in the laboratory that are
comparable to HMA mixtures.
Based on the moisture susceptibility test results, no WMA mixtures satisfied the
Superpave requirement. Therefore, during the phase 2 study anti-stripping agents were added to
the WMA mixtures in order to improve the moisture susceptibility. To address a safety concern
for WMA pavements under heavy truck traffic with a high tire pressure, the friction and raveling
characteristics were evaluated in the laboratory.
One of main concerns for adding WMA additives to asphalt is that it might reduce the
cracking resistance at a low temperature. To address this concern, this paper presents impacts of
various amounts of WMA additives on the viscosity and low-temperature cracking of asphalt
binder. In addition, the moisture sensitivity test was conducted to investigate the rutting
resistance. For the moisture sensitivity test, both lime and an anti-stripping agent (LOF 65-00)
were used to improve the moisture sensitivity resistance.

3
1.1 Objectives
To provide a safe and reliable highway for truck traffic, warm mix asphalt (WMA)
pavement must meet requirements for moisture sensitivity, raveling and friction resistance.
However, a major difficulty in evaluating WMA mixtures is that there is no national research
evaluating these fundamental characteristics.
The objective of this research is (1) to evaluate impacts of various amounts of WMA
additives on the viscosity and low-temperature cracking of asphalt binder; (2) to evaluate the
skid resistance of WMA mixtures and (3) investigate the effectiveness of anti-stripping agents to
improve moisture sensitivity of warm mix asphalt mixtures.
1.2 Benefits
The main product anticipated from this research is the evaluation results of various warm
mix asphalt (WMA) materials with respect to their moisture sensitivity, raveling and fiction
characteristics. This information would be very useful for pavement engineers who are interested
in implementing the WMA technologies. Identified reliable WMA technologies from this
research would contribute to the road safety by minimizing an accident risk caused by an unsafe
road surface condition for increasing freight movements on the US surface transportation system.
1.3 Advantages
Warm mix asphalt (WMA) technologies are able to reduce the binder resistance to high

4
shear forces, such as mixing and compaction, but maintain the resistance to normal stresses
encountered by traffic loading. The advantages claimed for WMA include:
Less burner fuel required to heat the aggregates
Lower emissions at the asphalt plant
Less hardening of the asphalt binder in mixing and placement
Less worker exposure to fumes and smoke during the placement operation
Lower compaction temperature in the field
Longer construction season
Increased pavement density
Longer haul distances
Ability to incorporate higher percentages of RAP
Ability to place and compact thicker lifts
Ability to open to traffic sooner
The WMA products/processes work differently and are categorized into three groups:
organic additive, foaming additive and chemical additive. These WMA technologies are
emerging rapidly in the United States (NAPA 2007; Brian 2007; Bonaquist 2008; Dukatx 2009;
Hurley at el 2010).

5
2. LITERATURE REVIEW
The use of warm mix asphalt (WMA) is rapidly increasing for the construction of roads
world-wide. To sustain this development, it is necessary to understand the behavior of asphalt
binder when different amounts of WMA additives are used. One of the major impacts of these
WMA additives on the asphalt binder is that they would reduce the asphalt viscosity at a lower
temperature. The reduction in asphalt viscosity allows the asphalt to mix and compact at a lower
temperature. This approach brings about significant savings because the requirement of heating
the aggregates up to 170°C is no longer. This new discovery is currently revolutionizing the road
construction industry.
Hurley and Prowell (2005, 2006) evaluated three different WMA technologies: Aspha-
Min®, Sasobit® and Evotherm™, and concluded that all three technologies improved the
compactibility of the asphalt mixture and resulted in lower air voids compared to HMA. That
said, these technologies showed increasing tendencies to rutting and moisture susceptibility. This
can be attributed to decreased aging of the binder, presence of moisture in the mixture, and
incomplete drying of the aggregates due to a lower temperature. They reported that Sasobit®
increased the PG grade of the binder; therefore, a lower grade binder should be used than the PG
grade specified. They also reported that air void was less in the WMA mixture and the optimum
asphalt content may be lowered to increase the air void. Of course, lowering asphalt content

6
could negatively affect the compactability of the mixtures.
Gandhi and Amirkhanian (2007) demonstrated that two of the three binders maintained
the same PG grade with the addition of Sasobit®. Biro et al. (2007) reported that Sasobit®
changed the flow properties of certain binders from Newtonian flow to shear thinning flow, and
increased the viscosity of the binder at a mid-range temperature of 140°F. They also reported that
Sasobit® significantly reduced a permanent deformation based on the repeated creep recovery
test.
Kristjánsdóttir et al. (2007) reported that HMA producers are unlikely to adopt WMA
technology purely for the benefits of lowered emissions and reduced fuel costs because the
reductions in the latter can be offset by the increased price for the WMA technologies. They also
noted that the reduction in the viscosity makes the best business case for WMA because the
reduced viscosity can alleviate compaction problems associated with cold weather paving while
improving the workability with stiff mixtures.
Nazimuddin et al. (2007) reported that Sasobit® decreased the rut depth which justifies
the increase in high temperature binder grading. Kunnawee et al. (2007) reported AC 60/70
binder modified with 3.0% Sasobit® improved the compactability of asphalt mixture and
resulted in acceptable density at a temperature below a normal compaction temperature by 68°F
to 104°F. In addition, the mixtures modified with Sasobit® exhibited a greater resistance to

7
densification under simulated traffic.
Hensley (1998) recommended that asphalt compaction occur on the field at a target
viscosity of 0.28 + 0.02Pa.s and a corresponding temperature of 160°C. Bahia et al. (2006)
recommended 3 Pa.s as a limiting low shear viscosity for estimating compaction temperature. Lu
& Redelius (2006) studied the effect of asphalt that contains wax naturally. They concluded that
when using waxy asphalt the asphalt mixtures showed a higher fracture temperature. With
regards to moisture sensitivity, they found that adding wax to asphalt does not negatively affect
the moisture sensitivity. The N-alkane rich crystallizing material in asphalt lowered the complex
modulus at temperatures over approximately 40°C and exhibited a stiffening effect at a lower
temperature below 40°C (Kvasnak et al. 2009). Asphalt containing natural waxes has a higher
modulus and a lower phase angle compared to mixtures containing non-waxy asphalt. However,
the significant hardening of some asphalt observed in binder testing by a Bending Beam
Rheometer (BBR) was not observed in the moisture sensitivity test of asphalt mixtures
(Gonzalez-Leon 2009). With organic additives, the viscosity of asphalt is reduced at the
temperature above the melting point in order to produce asphalt mixtures at lower temperatures.
Below the melting point, organic additives tend to increase the stiffness of asphalt (Bonaquist
2008).
To determine the effect of WMA additives on CIR-foam mixtures, Lee et al. (2007)

8
prepared three types of CIR-foam specimens: (1) CIR-foam with 1.5% of Sasobit®, (2) CIR-
foam with 0.3% Aspha-min®, and (3) CIR-foam without any additive. They were evaluated for
the indirect tensile strength test, dynamic modulus test and dynamic creep test. They reported
that WMA additives had improved the compactibility of CIR-foam mixtures resulting in a lower
air void. The indirect tensile strength of CIR-foam mixtures with Sasobit® was the highest, and
the dynamic module of CIR-foam mixture with WMA additives was higher than those without
any additive. Flow number of CIR-foam mixtures with Sasobit® was the highest followed by
ones with Aspha-min® and ones without any additive. Based on the limited test results, they
concluded that WMA additives could improve characteristics of CIR-foam mixtures by
increasing its resistance to both fatigue cracking and rutting.
Prowell and Hurley (2008) evaluated the current WMA technologies that could
significantly benefit the highway transportation system in the United States. NAPA (2008)
published a WMA related document that included mix design and field trial data. As shown in
Figure 2.1, Crews (2008) and Newcomb (2009) concluded that the number of states with WMA
projects has increased significantly.

9
Figure 2.1 States where WMA projects were implemented
As summarized in Table 2.1, a number of WMA technologies have been developed and
implemented in the US. These commercial WMA products/processes are available to produce
asphalt mixtures at significantly lower temperatures than HMA.
Table 2.2 summarizes many field trials that have been performed using various WMA
technologies (NAPA 2008). Overall, the WMA sections achieved a comparable density as the
HMA sections at a significantly lower temperature. The energy savings and the air quality
improvements by using WMA were observed. However, the performance, durability and
compatibility of WMA test sections should be researched further.

10
Table 2.1 List of warm mix asphalt technologies in the world
Category Name Process/Additive Company US Project
Organic
Additive
Sasobit Fischer Tropsch Wax Sasol Wax Americas,
Inc. Yes
Asphaltan-B Montan Wax Romanta No
Licomont BS-100 Fatty Acid Amide Clariant No
Cecabase RT Unspecified Organic Additive Ceca No
Asphaltan® Unspecified Organic Additive Romonta No
Ecoflex Unspecified Organic Additive Colas No
Sonneborn Unspecified Organic Additive Sonneborn Yes
LEADCAP Unspecified Organic Additive Kumho Pertochemical No
Foaming
Aspha-min Zeolite Eurovia Yes
Advera Zeolite PQ Corporation Yes
Double Barrel Green Foaming Nozzle Astec Industries, Inc. Yes
Ultrafoam GX Foaming Nozzle Gencor Industries Yes
Terex® Warm Mix
Asphalt System Foaming Nozzle Terex Roadbuilding Yes
Aqua-Black Foaming Nozzle Maxam Equipment Yes
WMA Foam Soft binder followed by hard
binder
Kolo Veidekke, Shell
Bitumen No
Low Energy Asphalt
Sequential coating using wet
fine aggregate and
unspecified additive
McConnaughay
Technologies Yes
LT Asphalt Absorbent filter Nynas No
ECOMAC Foaming Screg No
LEA, EBE and EBT
Sequential coating using wet
fine aggregate and
unspecified additive
LEACO,Fairco and
EiffageTP Yes
LEAB
Sequential coating using wet
fine aggregate and
unspecified additive
BAM No
Chemical
Additive
Evotherm ET Emulsion with unspecified
additive MeadWestvaco
Asphalt
Innovations
Yes
Evotherm DAT Unspecified additive Yes
Evotherm J1 Unspecified additive Yes
RedisetTM WMA Unspecified additive Akzo Nobel
Surfactants Yes
REVIXTM Unspecified additive
Mathy Technology
and Engineering
Services Inc. and
Paragon Technical
Services Inc.
No

11
Table 2.2 List of field trials using warm mix asphalt technologies
Category Name Field Trial
Organic Additive
Sasobit®
I 95/I 495, Washington D.C. (2005)
Route 211, Route 220 Virginia (2006)
10% RAP, Missouri (2006); 14% RAP, Wisconsin (2006)
M-95, Michigan (2006)
SR 541, Ohio (2006)
I-70 Colorado (2007)
Foaming
WAM-Foam®
First field trial in Norway (1999); RV120, Norway (2000); FV 82 Frogn, Norway (2001)
NCC road, Sweden (2002)
Ooms Abenhorn, Netherlands (2003)
Conglobit, Italy (2004)
Double Barrel® Green
Chattanooga, Tennessee (2007); 50% RAP, Chattanooga, Tennessee (2007)
Johnson County, North Carolina (2007)
Vancouver, British Columbia (2007)
S.R. 46 from US 431 to S.R. 96, Tennessee (2007)
York County, Sacramento (2007)
Ultrafoam GXTM Process
N/A
Terex® Warm Mix
Asphalt System Oklahoma City, Tennessee (2008)
Low Energy Asphalt
(LEA®) Cortland, New York (2006)
RT 11, 98B, Bomax Rd. RT 38, RT 13, RT 79, New York (2007)
Aspha-Min®
With PMA in Germany (2003)
Parking lot in Orlando, Florida (2004)
Charlotte, North Carolina (2004)
Montreal, Quebec, Canada (2004)
Columbus, Ohio (2005)
Hookest, New Hampshire (2005); Belmont, New Hampshire (2006)
OGFC in Orlando, Florida (2006)
SR 541 in Cambridge, Ohio (2006)
Advera WMA
Hillsboro Pike, Tennessee (2007)
City Street, Vermont (2007)
Miller Park, Wisconsin (2007)
Yellowstone NP Entrance Rd, Wyoming (2007)
I-70, Colorado (2007)
Chemical
Additive
RedisetTM WMA Chico, California (2007)
REVIXTM
CTR 11, Goodhue City, Minnesota (2007)
STH 33, La Crosse County, Wisconsin (2007)
State Ret. 53, Gainesboro, Tennessee (2007)
Highway 25, Smithville, Mississippi (2007)
CIR project, HWY 346, Iowa ( 2008)
Emulsion
Additives EvothermTM
County Road 900, Indiana (2005)
County Road, New York (2005)
Binder layer, Canada (2005)
Eskimo road, San Antonio (2005)
NCAT test track, Alabama (2005)
Miller Paving, Canada (2005); Road #46, Canada (2005)
Route 143, Virginia (2006)
SR 541, Cambridge, Ohio (2006)
I-70 Colorado (2007)
As shown in Table 2.3, NCAT (2010) reported that several WMA projects were
completed in 2010, and, as shown in Table 2.4, six existing pavements are being monitored for
the short-term performance.

12
Table 2.3 New construction projects to be documented as part of NCHRP 9-47A
State WMA Technology Estimated Tonnage
Indiana Evotherm DAT, Advera
And Heritage wax 20,000
Michigan Advera and Evotherm 3G 10,000
Virginia Astec DBG 60,000
Montana Evotherm 3G 20,000
Washington AQUABlack 75,000
New York Sonneborn, Hydrogreen
And Cecabase TBD
Pennsylvania Aqua Foam TBD
Florida Terex WMA Foam TBD
Table 2.4 Monitoring projects to be documented as part of NCHRP 9-47A
State Construction Date WMA Technology Total tons placed
Missouri 2006. 09 Evotherm ET,
Sasobit and Asphamin 6,600
New York 2007. 07 LEA 19,000
Colorado 2007. 08 Evotherm ET,
Sasobit and Advera 3,000
Tennessee 2007. 10
Astec DBG, Advera,
Evotherm DAT
And Sasobit
3,500
Texas 2008. 06 Astec DBG 75,000
Washington 2008. 06 Sasobit 13,000

13
3. VISCOSITY AND LOW-TEMPERATURE CRACKING OF ASPHALT WITH WMA
ADDITIVES
The concept of warm mix asphalt technologies is to reduce the asphalt binder viscosity.
This reduction allows the asphalt to attain a suitable viscosity to coat the aggregates and enables
the mixtures to compact at lower temperatures. Therefore, the viscosity level of the asphalt
binder is very essential for the proper coating of asphalt on the aggregates. Many studies have
addressed the benefits of warm mix asphalt, but limited research has been done as to a
comparative study for the effect of viscosity on the asphalt binder with different WMA additives.
It is very difficult to control the temperature in the field and it is often found that the aggregates
are mixed at different temperatures at each construction site.
During this phase 2 study, the effect of temperature on the viscosity of the binder with
WMA additives was investigated to determine the lowest temperature that can be used to mix
asphalt with aggregates. In addition, the impacts of various amounts of WMA additives on low-
temperature cracking of asphalt binder were identified. The viscosity and lowest cracking
temperature of asphalt binder with four WMA additives were measured and compared with those
of straight asphalt binder.
3.1 Viscosity and Low Temperature Cracking Tests
The viscosity is needed to ensure proper handling of the asphalt binder and for quality

14
control and assurance. As shown in Figure 3.1, a chart of viscosity versus temperature was
developed for determining the optimum mixing and compaction temperatures of asphalt mixture
(ASTM 2493). The viscosity of the asphalt binder should be between 0.15 and 0.19 Pa.s for
mixing and 0.25 and 0.31 Pa.s for compaction. The SuperPave specification requires the
viscosity of asphalt binder to be below 3.0 Pa.s at 135°C in order to be pumped through the
asphalt plant.
To characterize the low temperature property of the asphalt binder, as shown in Figure 3.2,
the asphalt binders with WMA additives were tested using the Asphalt Binder Cracking Device
(ABCD) in the environment chamber. The ABCD is a testing device to determine the low
temperature cracking property of asphalt binder, and it was used to quantify the impact of WMA
additives on the low temperature property of asphalt binder. The strain and temperature readings
are recorded on 10-second intervals from strain gauge in a silicone mold shown in Figure 3.2.

15
Figure 3.1 Mixing and compaction temperature (ASTM 2493)
Figure 3.2 Asphalt Binder Cracking Device (ABCD) and environmental chamber
3.2 Viscosity Testing Plan
As summarized in Table 3.1, five different dosage rates (0.5%, 1.0%, 1.5%, 2.0% and
3.0% of asphalt weight) for each WMA additive were selected to measure the viscosity. The
viscosity test was conducted from 120°C to 135°C with increments of 5°C, and three readings
were recorded for each sample at an interval of 60 seconds.

16
Table 3.1 Dosage rate of WMA additives adopted for this study
WMA Additives Dosage Rate (%) Temperature
(°C)
Dosage Rate
recommended by manufacturer
CECABASE RT® 0.5%
1.0%
1.5%
2.0%
3.0%
120°C
125°C
130°C
135°C
0.4% of binder weight
Sasobit® 1.5% of binder weight
LEADCAP 3.0% of binder weight
RedisetTM
WMX 2.0% of binder weight
3.3 Viscosity Test Results
3.3.1 Straight Asphalt Binder (A)
The viscosity of the PG 64-28 virgin asphalt was measured at 120, 125, 130 and 135°C
and the test results are summarized in Table 3.2. The highest viscosity value was 3.01 Pa.s
measured at 120°C and lowest viscosity value was 1.25 Pa.s at 135°C. As Figure 3.9
demonstrates, and as expected, the viscosity has decreased significantly as the temperature
increased from 120 to 135°C. It should be noted that the virgin asphalt would be too stiff to mix
with aggregates at 120 °C.
Table 3.2 Viscosity test results of the straight asphalt binder
Viscosity at 135°C
(Pa.s)
Viscosity at 130°C
(Pa.s)
Viscosity at 125°C
(Pa.s)
Viscosity at 120°C
(Pa.s)
Virgin Asphalt 1.25 2.37 2.85 3.01

17
Figure 3.3 Plots of viscosity of straight asphalt binder against testing temperature
3.3.2 Evotherm J1 (B)
Evotherm J1 was developed without water so that it would reduce an internal friction
between asphalt binder, aggregate, and among coated aggregate particles during mixing and
compaction (Bonaquist 2008; Anderson et al. 2008). Evotherm J1 can be directly added to
asphalt binder at a specified dosage rate by weight of asphalt. Table 3.3 summarizes the viscosity
test results of asphalt binder using Evotherm J1. As shown in Figure 3.4, the viscosity decreased
as the temperature and dosage rate increased. The viscosity decreased significantly when the
small amount of 0.5% was added at temperatures between 120 and 130 °C. It should be noted
that the increase of dosage rate from 0.5% up to 3.0% did not significantly lower the viscosity.

18
Table 3.3 Viscosity test results of asphalt binder using Evotherm J1
Dosage Rate Viscosity at 135°C
(Pa.s)
Viscosity at 130°C
(Pa.s)
Viscosity at 125°C
(Pa.s)
Viscosity at 120°C
(Pa.s)
0.5% 1.11 1.46 1.92 2.25
1.0% 1.07 1.33 1.79 2.10
1.5% 1.05 1.23 1.72 1.95
2.0% 0.95 1.16 1.65 2.04
3.0% 0.84 1.08 1.45 1.84
Figure 3.4 Plots of viscosity of asphalt binder using with Evotherm J1 against dosage rate
3.3.3 Rediset (C)
Rediset additive is a combination of organic additive and surfactants with the aim of
enhancing the adhesion between asphalt and aggregates (Akzo Nobel 2009). It can be directly
added to aggregates at a specified dosage rate by weight of asphalt. Table 3.4 summarizes the
viscosity test results of asphalt binder using Rediset. As shown in Figure 3.5, the viscosity
decreased as the temperature and dosage rate increased. The viscosity decreased significantly

19
when the small amount of 0.5% was added at temperatures between 125 and 130 °C. However,
for a temperature of 120 °C, the reduction in viscosity was not as significant, and the further
reduction in viscosity was achieved by increasing the dosage rate from 0.5 to 1.0%.
Table 3.4 Viscosity test results of asphalt binder using Rediset
Dosage Rate Viscosity at 135°C
(Pa.s)
Viscosity at 130°C
(Pa.s)
Viscosity at 125°C
(Pa.s)
Viscosity at 120°C
(Pa.s)
0.5% 1.20 1.54 2.02 2.49
1.0% 1.13 1.44 1.93 2.14
1.5% 1.12 1.40 1.84 2.09
2.0% 1.11 1.39 1.86 1.99
3.0% 0.94 1.15 1.66 2.07
Figure 3.5 Plots of viscosity of asphalt binder using Rediset against dosage rate
3.3.4 Sasobit® (D)
Sasobit® is a Fischer-Tropsch wax produced from the coal gasification process and is

20
typically added to the asphalt (wet process) or the asphalt mixture (dry process) at a specified
dosage rate by weight of asphalt. Table 3.5 summarizes the viscosity test results of asphalt binder
using Sasobit. As shown in Figure 3.6, the viscosity decreased as the temperature and dosage rate
increased. The viscosity decreased significantly when the small amount of 0.5% was added at
temperatures between 125 and 130 °C. Notwithstanding, for a temperature of 120 °C the
reduction in viscosity was not as significant, and the further reduction in viscosity was achieved
by increasing the dosage rate from 0.5 to 1.5%.
Table 3.5 Viscosity test results of asphalt binder using Sasobit
Dosage Rate Viscosity at 135°C
(Pa.s)
Viscosity at 130°C
(Pa.s)
Viscosity at 125°C
(Pa.s)
Viscosity at 120°C
(Pa.s)
0.5% 1.22 1.54 1.99 2.40
1.0% 1.22 1.46 1.94 2.32
1.5% 1.12 1.38 1.89 2.14
2.0% 0.96 1.32 1.72 2.06
3.0% 0.96 1.23 1.72 2.00

21
Figure 3.6 Plots of viscosity of asphalt binder using Sasobit
3.3.5 Cecabase RT (E)
Cecabase RT is room temperature liquid additive that can be mixed easily into the hot
asphalt binder before the asphalt mix production. The liquid Cecabase RT additive can be added
to asphalt at a specified dosage rate by weight of asphalt. Table 3.6 summarizes the viscosity test
results of asphalt binder using Cecabase RT. As shown in Figure 3.7, the viscosity decreased as
the temperature and dosage rate increased. The viscosity decreased significantly when the small
amount of 0.5% was added at all temperatures. For a temperature of 120 °C, the reduction in
viscosity was not as significant and the further reduction in viscosity was achieved by increasing
the dosage rate from 0.5 to 1.0%. It should be noted that the reduction in viscosity was higher
than any other WMA additives tested in this study.

22
Table 3.6 Viscosity test result of asphalt binder with Cecabase RT
Dosage Rate Viscosity at 135°C
(Pa.s)
Viscosity at 130°C
(Pa.s)
Viscosity at 125°C
(Pa.s)
Viscosity at 120°C
(Pa.s)
0.5% 0.95 1.16 1.44 1.96
1.0% 0.75 0.91 1.20 1.52
1.5% 0.73 0.86 1.11 1.45
2.0% 0.68 0.84 1.06 1.40
3.0% 0.65 0.78 0.99 1.28
Figure 3.7 Plots of viscosity of asphalt binder using Cecabase RT
3.3.6 LEADCAP (F)
LEADCAP is an organic WMA additive, which is a wax-based composition including
crystal controller and adhesion promoter. Crystal controller adjusts the wax crystallinity at the
low temperature. LEADCAP additive can be added to asphalt at a specified dosage rate by the
weight of asphalt. Table 3.7 summarizes the viscosity test results of asphalt binder using
LEADCAP. As shown in Figure 3.8, the viscosity decreased as the temperature and dosage rate
increased. The viscosity decreased significantly when the small amount of 0.5% was added at

23
temperatures between 125 and 130 °C. However, for a temperature of 120 °C, the reduction in
viscosity was not as significant and a further reduction was achieved by increasing the dosage
rate from 0.5 to 1.0%. It should be noted that the reduction in viscosity was significantly higher
than that of Sasobit particularly for temperatures between 120 and 125 °C.
Table 3.7 Viscosity test results of asphalt binder using LEADCAP
Dosage Rate Viscosity at 135°C
(Pa.s)
Viscosity at 130°C
(Pa.s)
Viscosity at 125°C
(Pa.s)
Viscosity at 120°C
(Pa.s)
0.5% 1.12 1.08 1.28 1.81
1.0% 1.03 0.96 1.23 1.71
1.5% 0.89 0.91 1.20 2.08
2.0% 0.77 0.90 1.20 1.80
3.0% 0.76 0.92 1.18 3.18
Figure 3.8 Plots of viscosity of asphalt binder using LEADCAP
3.4 Summary of Viscosity Test Results
For each temperature from 135, 130, 125 to 120°C, the viscosity is plotted against the

24
dosage rate in Figure 3.9 (a), (b), (c), and (d), respectively. As shown in Figure 3.9 (a), the test
results show a steady decline in viscosity with increased dosage of additives. The viscosity of
asphalt decreased significantly when 0.5% of CECABASE RT® was added, but the viscosity did
not decrease when up to 1.0% of Sasobit® was added. Figure 3.9 (b) and (c) show a more drastic
reduction in viscosity when 0.5% of WMA additive was added with the viscosity remaining
relatively steady as the dosage rate increased up to 3.0%. The reduction pattern in viscosity as
the dosage rate increases was similar for both CECABASE RT® and LEADCAP at all test
temperatures and a similar pattern was observed for both Sasobit® and Rediset. Figure 3.9 (d)
shows that the behavior of LEADCAP at 120°C became similar to Sasobit® and Rediset as the
dosage rate increased from 1.0% to 3.0%.
(a) Temperature at 135°C (b) Temperature 130°C

25
(c) Temperature 125°C (d) Temperature at 120°C
Figure 3.9 Plots of viscosity of asphalt binder at four different temperatures
3.5 Low Temperature Cracking Test Results
As shown in Figure 3.10, real-time plots of the strains developed in asphalt binders with
varying amounts of LEADCAP were automatically generated as the test temperature was
gradually lowered. The test ended when the sample was cracked, producing a sudden jump in
strain. When the amount of LEADCAP increased from 0.5 to 3.0%, as can be seen from Figure
3.10, the cracking temperature of asphalt binder slightly decreased from -49.9°C to -48.6°C. This
result indicates that the cracking temperature of asphalt binder would not be significantly
affected by LEADCAP. However, it is interesting to note that when the amount of LEADCAP
increased from 0.5% to 3.0%, the failure strain increased from 130.6 to 167.7 microstrains. This
result supports that LEADCAP increases the ductility of asphalt binder.

26
Figure 3.10 ABCD test results of the LEADCAP with varying amounts
Table 3.8 summarizes the cracking temperatures of asphalt binder with varying amounts
of WMA additives at 0.5, 1.5, 2.5 and 3.0%. The cracking temperature was obtained directly
from the temperature versus strain plot at the strain jump and plotted against the dosage rate in
Figure 3.11. The virgin asphalt binder PG 64-34 cracked at -51.0°C and the PG 64-28 cracked at
-41.3°C. As the WMA additives were increased from 0.5 to 3.0%, the cracking temperatures
increased slightly, but remained steady near the cracking temperature of the virgin asphalt binder.
The ABCD test results confirmed that the cracking temperature of asphalt binder was not
significantly affected by any of these four WMA additives.

27
Table 3.8 Cracking Temperature of Binders with WMA Additives
Dosage Sasobit
(64-34)
Rediset
(64-34)
Leadcap
(64-34)
Leadcap
(64-28)
Ceca
(64-34)
0.50% -48.3 -48.8 -49.8 -39.8 -48.43
1.50% -49.77 -51.5 -48.9 -40.7 -49.5
2.50% -49.29 -49.7 -48.6 -36.9 -48.85
3.00% -48.1 -50.2 -48.6 -39.4 -51.67
Figure 3.11 Temperature at which crack occurs by additive

28
4. EVALUATION OF FRICTION CHARACTERISTIC OF WMA PAVEMENT
The frictional characteristic of pavement is one of the primary factors needed to
determine highway safety. Therefore, friction characteristics of WMA mixtures should be
evaluated before they can be applied as a surface layer on highways. Galambos et al. (1977)
reported that macrotexture is essential in providing escape channels to water in the tire-surface
interaction, thus reducing hydroplaning. Jayawickrama et al. (1996) found that the magnitude of
microtexture depends on initial roughness on the aggregate surface and the ability of the
aggregate to retain this roughness against the polishing action of traffic. Chelliah (2002) reported
that 25% of all traffic accidents occur when pavement surfaces are wet and 13.5 % of those
traffic accidents caused by water film on pavement surfaces are critical. Over the years, the
WMA research has been focused on the moisture susceptibility of the WMA mixtures and their
rutting potential, and there is limited research done about friction characteristics of WMA
pavements.
4.1 Skid Resistance of Pavements
The tire-pavement interactions are affected by road geometric design, paving materials,
weather conditions and micro-topography (Ludema and Gujrati 1973). Over time, the skid
resistance of the pavement surface decreases due to a polishing of pavement surface which is a
result of shearing action from tires. Stephens and Geotz (1967) indicated that angularity of coarse

29
aggregates contribute to tire-pavement friction by establishing point contacts that protrude from
above the tire‘s water level. Geol (1995) reported that the coefficient of friction is significantly
affected by the grading of aggregates used in the preparation of asphalt mixtures. As shown in
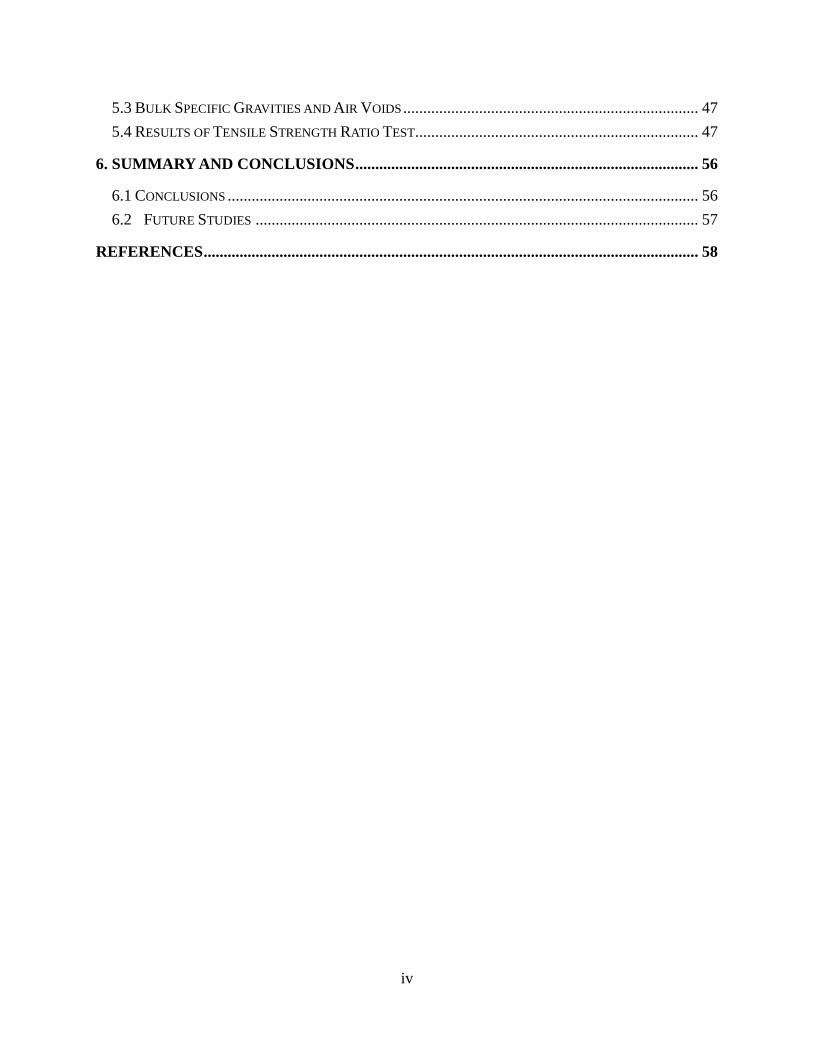
Figure 4.1, the micro-texture would depend on surface aggregate properties in the material and is
responsible mainly for pavement friction at low speeds. The macro-texture is the result of the
size, shape, and arrangement of aggregate particles in the asphalt mixtures.
The locked wheel trailer can be used to measure the skid resistance of the pavement
surface at any speed. The ribbed tire skid resistance values ranges from 27 at 96km/h to 57 at 64
km/h, while the smooth tire resistance values ranges from 11 at 96km/h to 53 at 64km/h on
various types of pavement. Normally, the skid resistance value decreases as the speed increases.
Hibbs (1996) measured the skid resistance on nine test sections at a speed of 56km/ h, 72km/ h,
and 90km/ h. Skid resistance value ranged from 60 at 56km/h to 26 at 90km/h for ribbed and
smooth tires on various pavement surfaces. The skid resistance value of smooth tires was
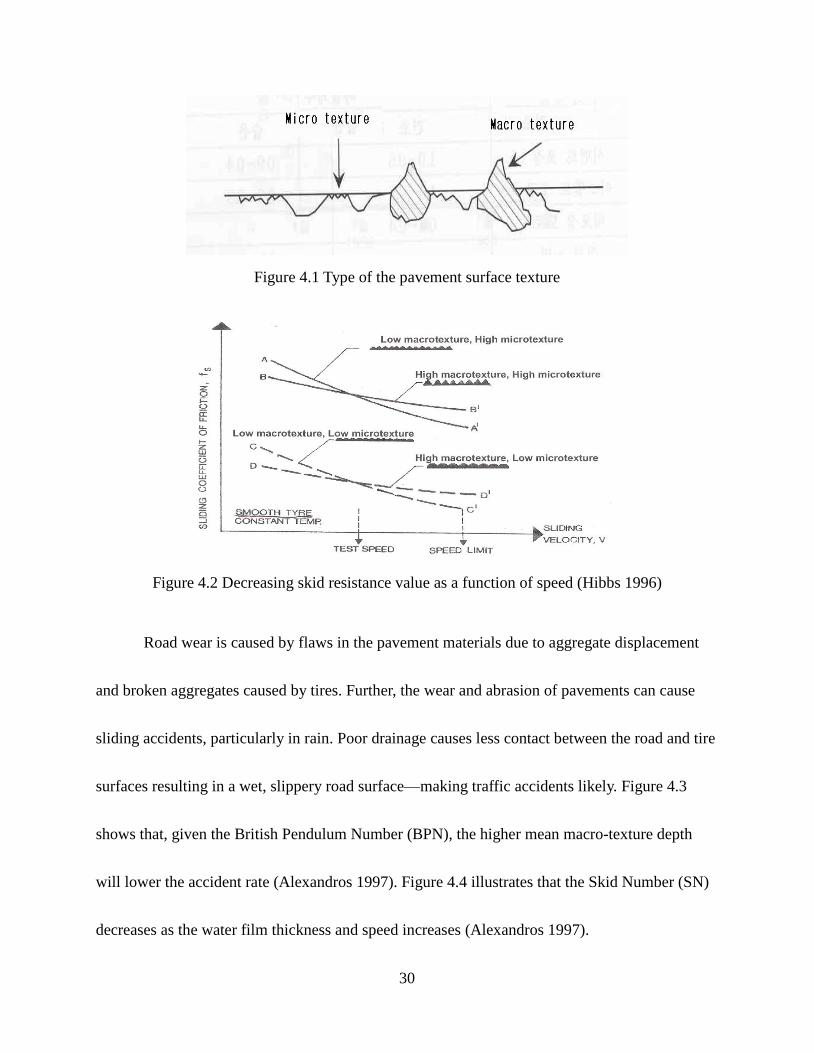
generally lower than that of ribbed tire at high speed. The influence of macro and microtextures
on the sliding friction coefficients are plotted against the speed (Hibbs 1996).
30
Figure 4.1 Type of the pavement surface texture
Figure 4.2 Decreasing skid resistance value as a function of speed (Hibbs 1996)
Road wear is caused by flaws in the pavement materials due to aggregate displacement
and broken aggregates caused by tires. Further, the wear and abrasion of pavements can cause
sliding accidents, particularly in rain. Poor drainage causes less contact between the road and tire
surfaces resulting in a wet, slippery road surface—making traffic accidents likely. Figure 4.3
shows that, given the British Pendulum Number (BPN), the higher mean macro-texture depth
will lower the accident rate (Alexandros 1997). Figure 4.4 illustrates that the Skid Number (SN)
decreases as the water film thickness and speed increases (Alexandros 1997).

31
.
Figure 4.3 Relationship among accident rate, BPN and macrotexture (Alexandros 1997)
Figure 4.4 Relationship among SN, Water Film Depth and Speed (Alexandros 1997)

32
4.2 Laboratory Tests of Skid Resistance
A locked wheel skid trailer (ASTM E 274-97) is one of the more widely used devices to
measure the skid resistance of pavements in the field. In this study, a British Pendulum Test
(BPT), a regularly used mobile device, was used to evaluate the skid resistance of warm mix
asphalt pavement and hot mix asphalt pavement in the laboratory.
4.2.1 Sand Patch Method
To evaluate the surface texture of WMA pavement, as shown in Figure 4.5, the surface
texture depth was measured by the sand patch method following ASTM E965. The sand patch
test procedure is described below.
1. Sweep the pavement surface with a soft hand brush.
2. Fill the cylinder with sand to the top and level with a straight edge.
3. Pour the measured sand on the test surface and, with the rubber disc spreading tool,
sweeping it into a circular patch with the surface depressions filled to the level of the
peaks.
4. Measure the diameter of the sand patch at four or more equally spaced locations and
record to the nearest 1 mm (1/10 in.).
5. Calculate the surface texture depth by dividing the volume of sand by the circular surface
area covered by sand.

33
Figure 4.5 Tools to measure the surface texture of pavements
4.2.2 British Pendulum Test
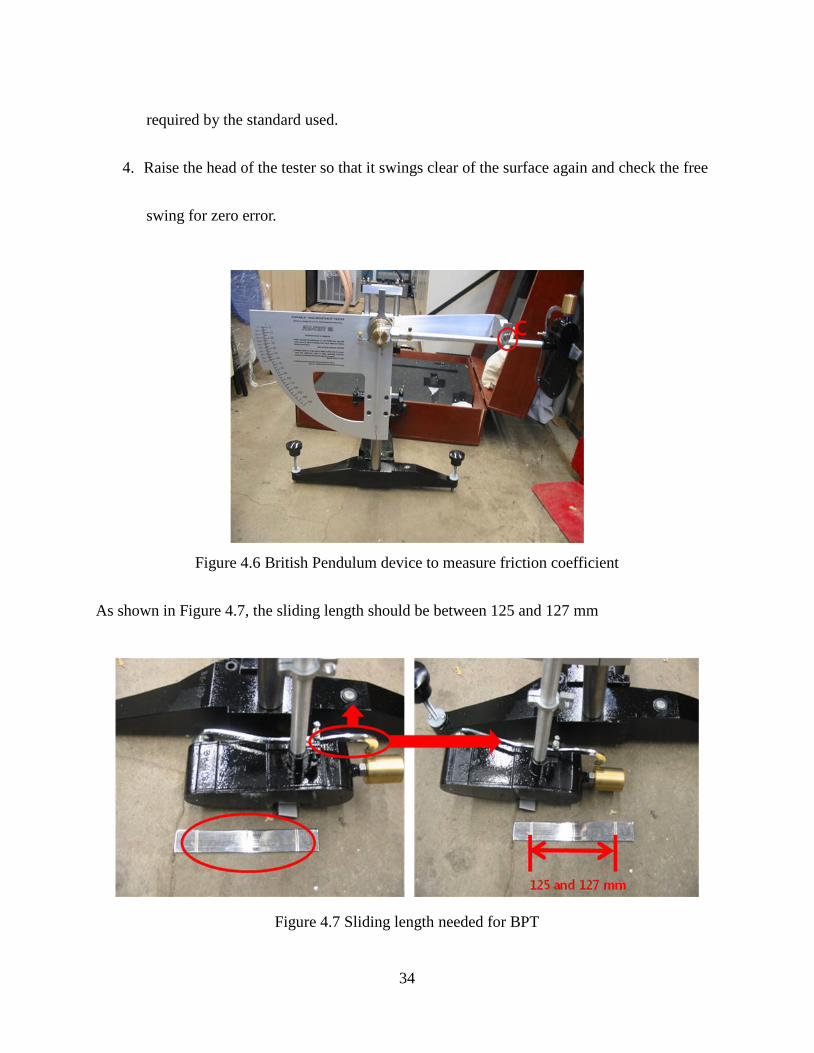
To evaluate the friction characteristic of WMA mixtures, as shown in Figure 4.6, the friction
coefficient was measured from the compacted specimens in the laboratory using the BPT device.
The friction testing procedure using the BPT is summarized as follows:
1. Wet the test surface and slider using distilled water unless a dry test is being carried out.
2. Bring the pointer round to its stop. Release the pendulum arm by pressing the button C
and catch it on its return swing before the slider strikes the road surface. Note the reading
indicated by the pointer.
3. Return the arm and pointer to the release position, keeping the slider clear of the test
surface by utilizing the lifting handle. Repeat swings, spreading the water over the
contact area with a spray between each swing (unless dry testing). Record the readings as
34
required by the standard used.
4. Raise the head of the tester so that it swings clear of the surface again and check the free
swing for zero error.
Figure 4.6 British Pendulum device to measure friction coefficient
As shown in Figure 4.7, the sliding length should be between 125 and 127 mm
Figure 4.7 Sliding length needed for BPT

35
As expected, the friction coefficient was affected by the contact area of the BPT device
on the asphalt specimen in the laboratory. When the bottom of the pendulum of the BPT device
touches the center of the specimen, as shown in Figure 4.8, it will create a contact area in a
rectangular shape. However, if the BPT device is not centered at the specimen, the contact area
would be lessened.
Figure 4.8 Contact area between sample and the bottom of the pendulum of BPT Device
Skid resistance values measured for three samples by different contact area are
summarized in Table 4.1. Although there was no significant difference among three specimens,
as shown in Figure 4.9, the difference in skid resistance values between full and partial contact
areas was very significant, ranging between 15.3 and 16.8.

36
Table 4.1 Skid resistance measured from different contact area
Full BPN MTD SN 40 Partial BPN MTD SN 40
Sasobit 93.0 1.6 72.7 Sasobit 75.7 1.6 57.3
WMA 1 95.0 1.8 75.5 WMA 1 77.0 1.8 59.6
WMA 2 95.0 1.3 72.9 WMA 2 76.0 1.3 56.1
Figure 4.9 Skid number measured from different contact areas from different samples
4.2.3 Abrasion Test
The abrasion test was performed to evaluate the abrasion resistance of WMA mixtures
using the polishing device, as shown in Figure 4.10. First, the WMA mixtures with Sasobit and
LEADCAP were produced at temperatures between 117°C and 121°C whereas the control HMA
mixtures were kept at 147°C. Second, the WMA mixtures were compacted at temperatures
between 112°C and 123°C whereas the control HMA mixture remained between 126°C and
135°C. Two test specimens were prepared for each WMA additive and control HMA. The

37
abrasion head was then rotated while touching on the surface at the speed of 78 rpm for 15
minutes.
Figure 4.10 Polishing testing device
Table 4.2 summarizes BPN, MTD and SN 40 values of WMA specimens with Sasobit,
no additive and LEADCAP. It should be noted that the BPN value steadily decreased although
the MTD value did not change significantly. For all three specimens, as shown in Figure 4.14,
the most significant change in skid number has occurred between 30 and 45 minutes of abrasion
whereas no significant change was observed between 45 and 65 minutes of abrasion. It can be
postulated that the polishing effect on WMA is significant enough to necessitate a skid test on
pavements in the field after several years of service. As shown in Figure 4.11, 4.12 and 4.13, it
can be observed that the surface was worn by a rotating head for up to 60 minutes of abrasion.

38
Table 4.2 Skid resistant results of polishing test
Sasobit Control WMA LEADCAP
Time(min) BPN MTD SN 40 BPN MTD SN 40 BPN MTD SN 40
0 92.0 1.6 71.7 89.3 1.2 67.5 102.0 1.1 78.2
15 93.0 1.6 72.6 89.3 1.1 67.0 95.0 1.1 72.0
30 89.3 1.5 69.1 82.7 1.1 61.1 94.3 1.1 71.4
45 73.3 1.2 53.0 75.7 1.1 54.8 70.3 0.9 49.0
60 73.7 1.2 53.8 76.7 1.1 55.9 70.3 0.9 49.1
Figure 4.11 Control WMA mixture after abrasion for 30, 45, and 60 minutes
Figure 4.12 WMA-Sasobit mixture after abrasion for 30, 45, and 60 minutes
Figure 4.13 WMA-LEADCAP mixture after abrasion for 30, 45, and 60 minutes

39
Figure 4.14 Skid number against polishing time for three different WMA mixtures

40
5. EVALUATION OF MOISTURE SENSITIVITY
It was suspected that WMA mixtures may be more susceptible to moisture damage than
HMA mixtures. The moisture damage in asphalt mixtures is defined as a loss of strength due to
the presence of moisture in terms of a tensile strength ratio (TSR). Hurley and Prowell (2006)
evaluated the moisture susceptibility of WMA mixtures containing Aspha-min®, Sasobit®, and
Evotherm®. They reported that WMA mixtures with Aspha-min® exhibited the lower TSR value
than HMA mixtures below the SuperPave TSR value of 80%. Kvasnak et al. (2009) reported that
the laboratory-produced WMA mixtures using Evotherm® DAT additive was more moisture
susceptible than the plant-produced WMA mixtures. Gonzalez-Leon et al (2009) reported that
WMA mixtures with Cecabase RT® additive achieved a minimum requirement of 0.75, which is
a value derived from a ratio of the fracture force of the wet specimen over the dry specimen.
Xiao et al. (2009) reported that TSR values of WMA mixtures with Sasobit® and Aspha-min®
additives were lower than 85% but increased above 85% when 1.0% or 2.0% hydrated lime was
added.
To evaluate the moisture sensitivity of WMA mixtures, the modified Lottman test was
performed following AASHTO T 283 procedure. The experiment plan and the testing condition
are summarized in Table 5.1.

41
Table 5.1 Condition of modified Lottman test
Classification Specification
Condition Temperature: 25˚C
Dry & Wet Condition
WMA Additive LEADCAP
Sasobit
Sample Type
HMA, HMA+Lime, HMA+Anti-stripping (LOF 65-00)
WMA, WMA+Lime, WMA+ Anti-stripping (LOF 65-00)
WMA (LEADCAP), WMA (LEADCAP)+Lime, WMA (LEADCAP)+ Anti-
stripping (LOF 65-00)
WMA (Sasobit), WMA (Sasobit)+Lime, WMA (Sasobit)+ Anti-stripping
(LOF 65-00)
5.1 Moisture Sensitivity Testing Procedure
To perform the modified Lottman test eight specimens, four for dry condition and four for
wet condition, were prepared for each of the following: the control WMA mixture, WMA
mixture with lime, WMA mixture with anti-stripping, the control HMA mixture, HMA mixture
with lime, HMA mixture with anti-stripping and WMA mixtures with Sasobit additive. To
prepare the test specimens with 7±0.5% air void, as summarized in Table 5.2, all specimens were
compacted at between 11 and 40 gyrations. As shown in Figure 5.1, for dry conditioning, three
specimens in a sealed pack were placed in the water bath at 25˚C for 2 hours, and for wet
conditioning three specimens saturated at between 70% and 80% were placed in a freezer at -
18˚C for 16 hours and in water bath at 60˚C for 24 hours followed by conditioning in water bath
at 25˚C for 2 hours.

42
Table 5.2 Number of gyrations applied to produce WMA and HMA specimens for moisture
sensitivity test
Mix Type
Number of Gyrations
Dry Condition Wet Condition
#1 #2 #3 #4 #1 #2 #3 #4
WMA 26 33 25 25 21 22 28 31
WMA_Lime 24 16 17 14 15 16 17 16
WMA_Anti-stripping (LOF 65 -00) 27 24 29 32 25 26 30 40
LEADCAP 31 26 27 27 26 24 30 34
LEADCAP_Lime 21 18 19 17 19 20 16 23
LEADCAP_Anti-stripping (LOF 65-00) 30 26 31 33 36 30 35 30
Sasobit 23 11 22 - 16 24 17 -
Sasobit_Lime 17 20 21 - 21 18 22 -
Sasobit_ Anti-stripping (LOF 65-00) 26 32 26 - 22 24 22 -
HMA 18 18 17 18 13 17 18 18
HMA_Lime 19 13 22 21 20 26 17 19
HMA_Anti-stripping(LOF 65 00) 16 12 20 11 17 17 11 12

43
Figure 5.1 Flow chart of moisture sensitivity test for WMA and HMA specimens
5.2 Mixing and Compaction Temperatures
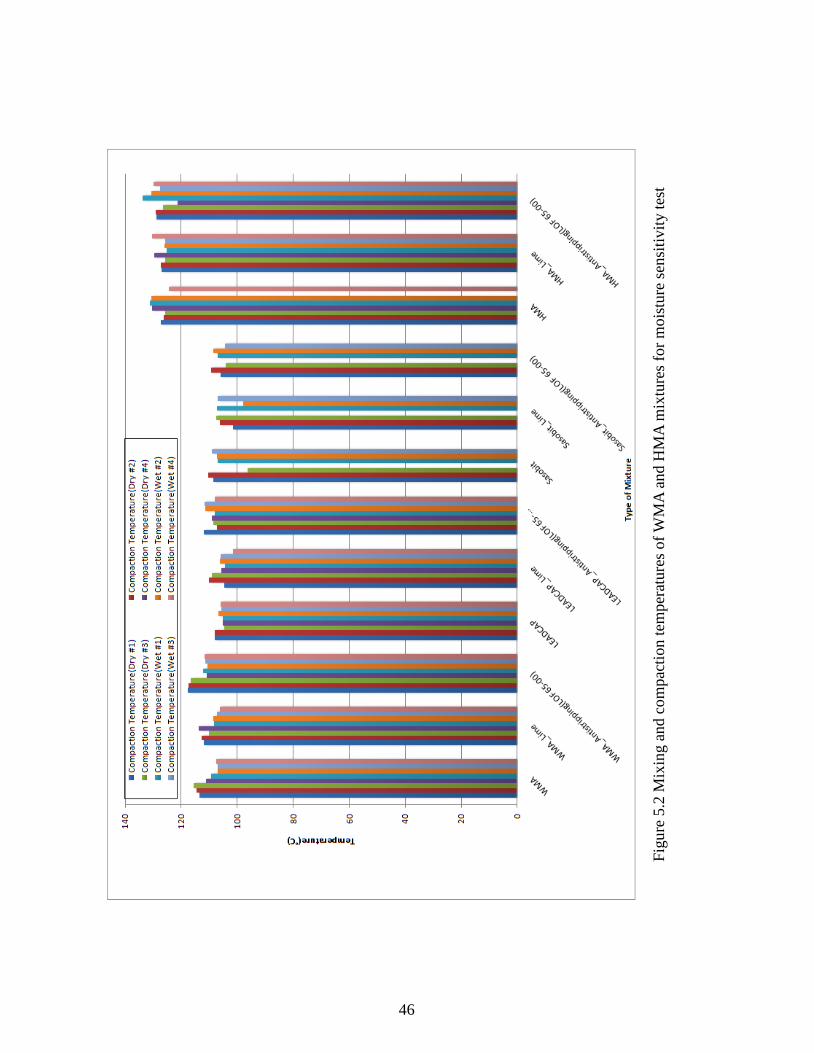
As shown in Table 5.3 and Table 5.4, the temperatures of asphalt, aggregate, mixture and
compacted specimen were recorded throughout the sample preparation process and plotted in
Figure 5.2. WMA mixtures were produced at temperatures of around120°C whereas the control
HMA mixture was kept around 135°C. WMA mixtures were compacted at temperatures between
105°C and 110°C with the control HMA mixture between 125°C and 130°C.

44
Tab
le 5
.3 T
emp
erat
ure
dat
a of
pro
duci
ng W
MA
an
d H
MA
mix
ture
s fo
r m
ois
ture
sen
siti
vit
y t
ests
T
yp
e o
f M
ixtu
re
Co
ntr
ol
W
MA
Co
ntr
ol
WM
A
_L
ime
Co
ntr
ol
WM
A_
An
ti-
stri
pp
ing
WM
A_
LE
AD
CA
P
Wm
a_
LE
AD
CA
P
_L
ime
WM
A_
LE
AD
CA
P_
An
ti-
stri
pp
ing
Sas
ob
it
Sas
ob
it
_L
ime
Sas
ob
it
_A
nti
-
stri
pp
ing
Co
ntr
ol
H
MA
Co
ntr
ol
HM
A
_L
ime
Co
ntr
ol
HM
A_
An
ti-
stri
pp
ing
Asp
hal
t
Bin
der
1
45
14
5
14
5
14
5
14
5
14
5
14
5
14
5
14
5
14
5
14
5
14
5
Aggre
gat
es
1
23
12
5
12
5
12
5
12
5
12
5
12
5
12
5
12
5
14
9
14
9
14
9
Mix
ing
11
9
12
0
12
0
11
9
12
1
11
9
12
0
12
0
11
9
13
7
13
4
13
5
Bef
ore
Co
mp
acti
on
#
1
(Dry
)
11
3.6
111
.8
11
7.7
1
07.9
1
04.6
11
2
10
8.5
1
01.4
1
05.9
1
27.4
1
26.9
1
28.9
Aft
er
Co
mp
acti
on
1
03.7
9
3.8
9
6.9
1
01.3
9
6.2
9
4.1
1
02.1
8
9.5
9
1.4
1
08.6
9
9.3
1
00.5
Bef
ore
Co
mp
acti
on
#
2
(Dry
)
11
4.6
11
2.8
11
7.3
1
07.9
11
0
10
7.3
11
0.4
1
06.1
1
09.3
1
26.3
1
27.4
1
29.1
Aft
er
Co
mp
acti
on
1
06.8
9
1.5
9
7.4
9
0.5
8
9.3
9
5.4
9
9.6
8
6.3
8
7.1
1
04.3
1
01.3
1
03.4
Bef
ore
Co
mp
acti
on
#
3
(Dry
)
11
5.5
11
0.1
11
6.7
1
04.6
1
09.1
1
08.5
9
6.3
1
07.4
1
04.2
1
25.6
1
25.6
1
26.4
Aft
er
Co
mp
acti
on
9
4.2
8
4.2
9
8.6
8
8.9
9
3.4
9
1.3
9
5.6
8
6.3
8
0.4
1
00.4
1
05.9
11
2.3
Bef
ore
Co
mp
acti
on
#
4
(Dry
)
111
.1
11
3.8
11
0.8
1
05.1
1
05.7
1
09.1
-
- -
13
0.3
1
29.6
1
21.3
Aft
er
Co
mp
acti
on
9
1.4
8
7.8
8
9.4
9
1.1
8
4.9
8
8.9
-
- -
10
4.6
1
06.1
1
00.6

45
Tab
le 5
.4 T
emp
erat
ure
dat
a of
pro
duci
ng W
MA
an
d H
MA
mix
ture
s fo
r m
ois
ture
sen
siti
vit
y t
ests
(co
nti
nued
)
T
yp
e o
f M
ixtu
re
Co
ntr
ol
WM
A
Co
ntr
ol
WM
A
_L
ime
Co
ntr
ol
WM
A_
An
tist
rip
pin
g
WM
A_
LE
AD
CA
P
WM
A_
LE
AD
CA
P
_L
ime
WM
A_
LE
AD
CA
P_
An
ti-
stri
pp
ing
Sas
ob
it
Sas
ob
it
_L
ime
Sas
ob
it
_A
nti
-
stri
pp
ing
Co
ntr
ol
HM
A
Co
ntr
ol
HM
A
_L
ime
Co
ntr
ol
HM
A_
An
ti-
stri
pp
ing
Asp
hal
t
Bin
der
1
45
14
5
14
5
14
5
14
5
14
5
14
5
14
5
14
5
14
5
14
5
14
5
Aggre
gat
es
1
23
12
5
12
5
12
5
12
5
12
5
12
5
12
5
12
5
14
9
14
9
14
9
Mix
ing
11
9
12
0
12
0
11
9
12
1
11
9
12
0
12
0
11
9
13
5
13
5
13
6
Bef
ore
Co
mp
acti
on
#
1
(Wet
)
10
9.4
1
08.3
11
2.3
1
05.1
1
04.3
1
07.9
1
06.9
1
07.1
1
06.9
1
31.3
1
25.3
1
33.8
Aft
er
Co
mp
acti
on
1
06.4
8
7.6
9
5.2
9
6.6
9
4
90
.5
10
1.4
9
1.9
9
4.3
11
4.9
1
01.3
1
04.7
Bef
ore
Co
mp
acti
on
#
2
(Wet
)
10
6.9
1
08.4
11
0.7
1
06.8
1
06.1
111
.3
10
7.1
9
7.9
1
08.4
1
30.6
1
26.1
1
30.6
Aft
er
Co
mp
acti
on
1
05.5
9
1.1
8
7.4
9
9.6
8
9.3
9
1
94
.9
88
.3
87
.9
10
9.9
1
03.6
1
02.4
Bef
ore
Co
mp
acti
on
#
3
(Wet
)
10
7.0
1
07.3
111
.5
10
5.7
1
05.9
111
.6
10
9
10
6.9
1
04.3
n
/a
12
5.6
1
27.6
Aft
er
Co
mp
acti
on
9
0.3
9
2.6
8
5.6
8
5.3
9
0.6
9
2.5
9
2.6
8
5.8
8
8.4
1
02.8
1
01.3
1
09.7
Bef
ore
Co
mp
acti
on
#
4
(Wet
)
10
7.5
1
06.3
111
.7
10
5.9
1
01.6
1
08.1
-
- -
12
4.4
1
30.3
1
29.8
Aft
er
Co
mp
acti
on
8
5.4
8
3.6
8
7.3
8
9.3
8
9.5
8
9.9
-
- -
10
5.9
1
01.9
111
.9
46
Fig
ure
5.2
Mix
ing a
nd c
om
pac
tion t
emper
ature
s of
WM
A a
nd H
MA
mix
ture
s fo
r m
ois
ture
sen
siti
vit
y t
est

47
5.3 Bulk Specific Gravities and Air Voids
The bulk specific gravities of each specimen were determined following AASHTO T 166
(AASHTO 2001). Table 5.5 and 5.6 summarize the bulk specific gravities and air voids of the
WMA mixtures and the control HMA mixture and plotted in Figure 5.3 and 5.4, respectively. Air
voids of all specimens ranged between 5.8% and 8.3%.
5.4 Results of Tensile Strength Ratio Test
The tensile strength ratio (TSR) is defined as a ratio of the indirect tensile strength of a
wet specimen over that of a dry specimen as follows:
Tensile strength ratio (TSR) = 100Dry
Wet
ITS
ITS
ITSWet = average indirect tensile strength at wet condition
ITSDry = average indirect tensile strength at dry condition
Table 5.7 summarizes indirect tensile strengths and TSR values of WMA, WMA-LEADCAP,
WMA-Sasobit, and HMA with and without lime or Anti-Stripping Agent (ASA). The indirect
tensile strengths of samples for each category were very consistent with a small standard
deviation value, which indicates that indirect tensile strength tests were performed consistently.
Figure 5.5 and 5.6 show plots of the average indirect tensile strengths and tensile strength ratio,
respectively. The control WMA without additive exhibited the lowest TSR value of 53.3%,
which increased to 66.6% with lime and 83.5% with ASA. WMA-Sasobit exhibited 73.7% but it

48
slightly decreased to 72.7% with lime and 72.3% with ASA. WMA-LEADCAP exhibited 80.3%
but it decreased to 78.5% with lime and increased to 81.4% with ASA. The control HMA
exhibited 82.7% and it increased to 89.3% with lime and 92.6% with ASA. It can be concluded
that TSR values of both WMA-Sasobit and WMA-LEADCAP were not affected by lime or ASA.

49
Tab
le 5
.5 B
ulk
sp
ecif
ic g
ravit
ies
of
WM
A a
nd H
MA
mix
ture
s fo
r m
ois
ture
sen
siti
vit
y t
ests
Co
ndit
ion
Co
ntr
ol
WM
A
Co
ntr
ol
WM
A_
Lim
e
Co
ntr
ol
WM
A_
An
ti-
stri
pp
ing
WM
A_
LE
AD
CA
P
WM
A_
LE
AD
CA
P
_L
ime
WM
A_
LE
AD
CA
P
_A
nti
-
stri
pp
ing
Sas
ob
it
Sas
ob
it
_L
ime
Sas
ob
it_
An
ti-
stri
pp
ing
Co
ntr
ol
HM
A
Co
ntr
ol
HM
A
_L
ime
Co
ntr
ol
HM
A_
An
ti-
stri
pp
ing
Dry
# 1
2
.23
2.2
7
2.2
8
2.2
8
2.2
6
2.2
4
2.2
7
2.2
9
2.2
7
2.2
7
2.2
8
2.2
8
# 2
2
.22
2.2
7
2.2
2
2.2
7
2.2
6
2.2
6
2.2
7
2.2
4
2.2
8
2.2
8
2.2
8
2.2
6
# 3
2
.27
2.2
7
2.2
7
2.2
8
2.2
5
2.2
6
2.2
6
2.2
2
2.2
8
2.2
9
2.2
8
2.2
6
# 4
2
.23
2.2
4
2.2
5
2.2
7
2.2
7
2.2
7
2.2
7
2.2
6
2.2
7
2.2
8
2.2
8
2.2
6
Ave.
2
.24
2.2
6
2.2
6
2.2
8
2.2
6
2.2
6
2.2
7
2.2
5
2.2
8
2.2
8
2.2
8
2.2
6
St.
dev
. 0
.02
0.0
1
0.0
3
0.0
1
0.0
1
0.0
1
0.0
1
0.0
3
0.0
1
0.0
1
0.0
0
0.0
1
Wet
# 1
2
.3
2.2
7
2.2
3
2.2
7
2.2
6
2.2
7
2.2
7
2.2
8
2.2
7
2.2
5
2.2
8
2.2
7
# 2
2
.23
2.2
4
2.2
4
2.2
6
2.2
5
2.2
4
2.2
7
2.2
5
2.2
7
2.2
7
2.2
7
2.2
7
# 3
2
.23
2.2
5
2.2
8
2.2
8
2.2
7
2.2
6
2.2
7
2.2
6
2.2
8
2.2
7
2.2
7
2.2
6
# 4
2
.22
2.2
3
2.2
2
2.2
7
2.2
6
2.2
6
2.2
7
2.2
9
2.2
8
2.2
5
2.2
8
2.2
5
Ave.
2
.25
2.2
5
2.2
4
2.2
7
2.2
6
2.2
6
2.2
7
2.2
7
2.2
8
2.2
6
2.2
8
2.2
6
St.
dev
. 0
.04
0.0
2
0.0
3
0.0
1
0.0
1
0.0
1
0.0
0
0.0
2
0.0
1
0.0
1
0.0
0
0.0
1
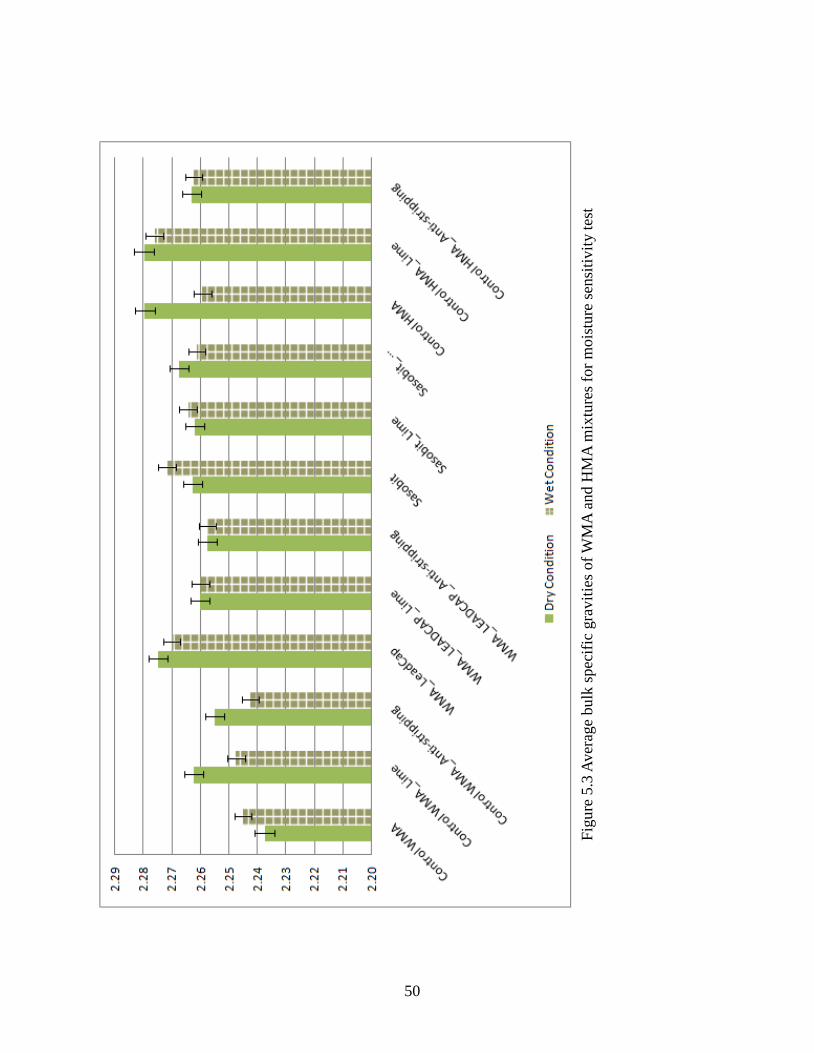
50
Fig
ure
5.3
Aver
age
bulk
spec
ific
gra
vit
ies
of
WM
A a
nd H
MA
mix
ture
s fo
r m
ois
ture
sen
siti
vit
y t
est
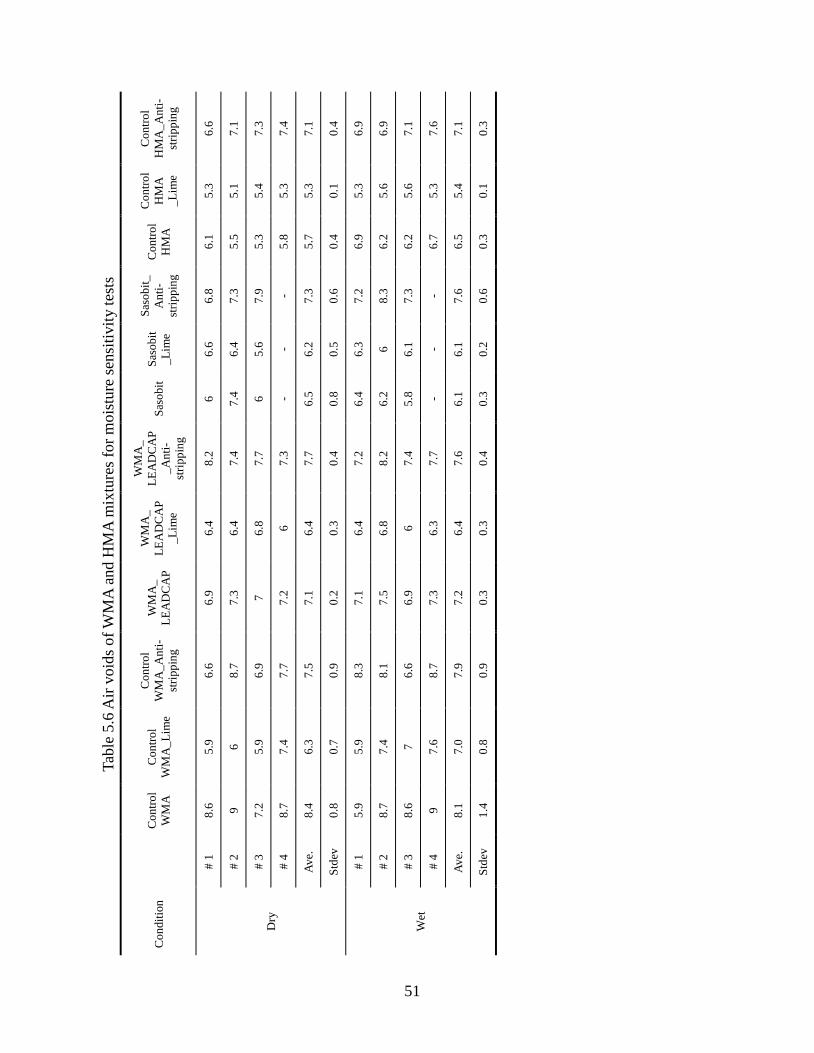
51
Tab
le 5
.6 A
ir v
oid
s o
f W
MA
and H
MA
mix
ture
s fo
r m
ois
ture
sen
siti
vit
y t
ests
Co
ndit
ion
Co
ntr
ol
WM
A
Co
ntr
ol
WM
A_
Lim
e
Co
ntr
ol
WM
A_
An
ti-
stri
pp
ing
WM
A_
LE
AD
CA
P
WM
A_
LE
AD
CA
P
_L
ime
WM
A_
LE
AD
CA
P
_A
nti
-
stri
pp
ing
Sas
ob
it
Sas
ob
it
_L
ime
Sas
ob
it_
An
ti-
stri
pp
ing
Co
ntr
ol
HM
A
Co
ntr
ol
HM
A
_L
ime
Co
ntr
ol
HM
A_
An
ti-
stri
pp
ing
Dry
# 1
8
.6
5.9
6
.6
6.9
6
.4
8.2
6
6
.6
6.8
6
.1
5.3
6
.6
# 2
9
6
8
.7
7.3
6
.4
7.4
7
.4
6.4
7
.3
5.5
5
.1
7.1
# 3
7
.2
5.9
6
.9
7
6.8
7
.7
6
5.6
7
.9
5.3
5
.4
7.3
# 4
8
.7
7.4
7
.7
7.2
6
7
.3
- -
- 5
.8
5.3
7
.4
Ave.
8
.4
6.3
7
.5
7.1
6
.4
7.7
6
.5
6.2
7
.3
5.7
5
.3
7.1
Std
ev
0.8
0
.7
0.9
0
.2
0.3
0
.4
0.8
0
.5
0.6
0
.4
0.1
0
.4
Wet
# 1
5
.9
5.9
8
.3
7.1
6
.4
7.2
6
.4
6.3
7
.2
6.9
5
.3
6.9
# 2
8
.7
7.4
8
.1
7.5
6
.8
8.2
6
.2
6
8.3
6
.2
5.6
6
.9
# 3
8
.6
7
6.6
6
.9
6
7.4
5
.8
6.1
7
.3
6.2
5
.6
7.1
# 4
9
7
.6
8.7
7
.3
6.3
7
.7
- -
- 6
.7
5.3
7
.6
Ave.
8
.1
7.0
7
.9
7.2
6
.4
7.6
6
.1
6.1
7
.6
6.5
5
.4
7.1
Std
ev
1.4
0
.8
0.9
0
.3
0.3
0
.4
0.3
0
.2
0.6
0
.3
0.1
0
.3

52
Fig
ure
5.4
Aver
age
air
vo
ids
of
WM
A a
nd H
MA
mix
ture
s fo
r m
ois
ture
sen
siti
vit
y t
est

53
Tab
le 5
.7 I
ndir
ect
tensi
le s
tren
gth
s at
dry
and w
et c
ondit
ions
and t
ensi
le s
tren
gth
rat
io o
f W
MA
and H
MA
mix
ture
s
T
yp
e o
f M
ixtu
re (
ps)
Co
ndit
ion
Co
ntr
ol
WM
A
Co
ntr
ol
W
MA
_
Lim
e
Co
ntr
ol
WM
A_
An
ti-
stri
pp
ing
WM
A_
L
EA
DC
AP
WM
A_
L
EA
DC
AP
_
Lim
e
WM
A_
L
EA
DC
AP
_
An
ti-
stri
pp
ing
Sas
ob
it
Sas
ob
it
_L
ime
Sas
ob
it_
An
ti-
stri
pp
ing
Co
ntr
ol
HM
A
Co
ntr
ol
HM
A_
Lim
e
Co
ntr
ol
HM
A_
An
ti-
stri
pp
ing
Dry
Co
ndit
ion
# 1
1
03.2
1
23.7
1
31.9
n
/a
12
4.7
1
16.0
1
37.1
1
47.8
1
48.9
1
05.9
1
25.5
1
34.9
# 2
1
10.5
1
16.1
1
23.8
1
04.4
1
34.2
1
20.3
1
28.4
1
49.8
1
46.3
1
16.3
1
34.0
1
27.1
# 3
n
/a
11
1.1
1
27.9
1
11.3
1
34.7
1
16.5
1
35.3
1
54.3
1
46.8
1
17.8
1
41.4
1
35.4
# 4
1
11.5
1
20.2
1
31.8
1
17.8
1
29.8
1
27.4
-
- -
11
6.8
1
37.1
1
28.4
Ave.
1
08.4
1
17.8
1
28.9
1
11.2
1
30.8
1
20.0
1
33.6
1
50.6
1
47.3
1
14.2
1
34.5
1
31.4
St.
dev
. 4
.5
5.4
3
.8
6.7
4
.7
5.2
4
.6
3.3
1
.4
5.6
6
.8
4.3
Wet
Co
ndit
ion
# 1
5
2.3
7
5.1
1
04.5
n
/a
10
0.7
9
7.7
1
00.5
1
10.1
1
06.3
8
8.3
1
08.4
1
19.2
# 2
5
5.0
7
6.1
1
02.3
8
7.4
1
01.9
9
6.7
1
00.0
1
08.1
1
09.4
9
4.2
1
26.2
1
18.9
# 3
5
8.8
8
2.3
1
09.2
8
8.4
1
03.0
9
6.6
9
5.1
1
10.5
1
03.9
9
4.5
1
16.9
1
30.8
# 4
6
4.9
8
0.4
1
14.7
9
2.2
1
05.1
1
00.0
-
- -
10
0.8
1
29.0
1
17.9
Ave.
5
7.8
7
8.5
1
07.7
8
9.3
1
02.7
9
7.7
9
8.5
1
09.5
1
06.5
9
4.5
1
20.1
1
21.7
St.
dev
. 5
.5
3.4
5
.5
2.5
1
.9
1.6
3
.0
1.3
2
.7
5.1
9
.4
6.1
TS
R (
%)
53
.3%
6
6.6
%
83
.5%
8
0.3
%
78
.5%
8
1.4
%
73
.7%
7
2.7
%
72
.3%
8
2.7
%
89
.3%
9
2.6
%

54
Fig
ure
5.5
Aver
age
indir
ect
tensi
le s
tren
gth
at
dry
and w
et c
ondit
ions

55
Fig
ure
5.6
Ten
sile
str
ength
rat
io o
f W
MA
and H
MA
mix
ture
s

56
6. SUMMARY AND CONCLUSIONS
The implementation of Warm mix asphalt (WMA) is rapidly increasing. To provide a safe
and reliable highway for heavier truck traffic with a high tire pressure the WMA mixtures should
provide a sufficient skid resistance and a resistance to low-temperature cracking and moisture
damage. In this study, we evaluated: (1) the temperature-viscosity relationship, (2) resistance to
low-temperature cracking, (3) resistance to abrasion, and (4) the effectiveness of lime and anti-
stripping agents in improving moisture sensitivity.
6.1 Conclusions
Based on the limited laboratory experiment, the following conclusions are derived:
1. The viscosity of asphalt decreased significantly when 0.5% of WMA additive was added,
but it remained relatively steady as the dosage rate increased up to 3.0%. The reduction
pattern in viscosity as the dosage rate increases was similar for both CECABASE RT®
and LEADCAP at all test temperatures of 120°C,125°C, 130°C and 135 °C. A similar
pattern was observed for both Sasobit® and Rediset.
2. Based on the ABCD test device, the virgin asphalt binder PG 64-34 cracked at -51.0°C
and the PG 64-28 cracked at -41.3°C. As the WMA additives were increased from 0.5 to
3.0%, the cracking temperatures increased slightly, but remained steady near the cracking
temperature of the virgin asphalt binder. The ABCD test results confirmed that the

57
cracking temperature of the asphalt binder was not significantly affected by any of these
four WMA additives.
3. The BPN value steadily decreased as the specimen surface was abraded by a rotating
rubber although this did not change the MTD value significantly. The most significant
change in BPN occurred between 30 and 45 minutes of abrasion, whereas no significant
change was observed between 45 and 65 minutes of abrasion.
4. The control WMA without additive exhibited the lowest Tensile Strength Ratio (TSR)
value of 53.3%, which increased to 66.6% with lime and 83.5% with an Anti-stripping
agent (ASA). WMA-Sasobit exhibited 73.7% but it slightly decreased to 72.7% with lime
and 72.3% with ASA. WMA-LEADCAP exhibited 80.3% but it decreased to 78.5% with
lime and increased to 81.4% with ASA. The control HMA exhibited 82.7% and it
increased to 89.3% with lime and 92.6% with ASA. It can be concluded that TSR values
of both WMA-Sasobit and WMA-LEADCAP were not affected by lime or ASA.
6.2 Future Studies
A more extensive study should be performed quantifying the temperature-viscosity
relationship of asphalt mixed with varying amounts of WMA additives at different temperatures.
Additionally, a more extensive study should be performed on the effect of lime and anti-stripping
agent on WMA mixtures with various additives. Finally, it is recommended that the skid test
should be performed on WMA pavements in the field after several years of service.

58
REFERENCES
AASHTO. 2011. ―Bulk Specific Gravity of Compacted Bituminous Mixtures Using Saturated
Surface-Dry Specimens.‖ AASHTO T 166. American Association of State Highway and
Transportation Officials, Washington D.C.
AASHTO. 2007. ―Determining Dynamic Modulus of Hot-Mix Asphalt Concrete Mixtures.‖
AASHTO TP-62-03. American Association of State Highway and Transportation
Officials, Washington D.C.
Akzo Nobel. ―RedisetTM
WMA”
http://www.surfactants.akzonobel.com/asphalt/newwarmmixsystem.cfm
Anderson, R. M., G. Baumgardner, R. May, and G. Reinke. 2008. ―Engineering Properties,
Emissions, and Field Performance of Warm Mix Asphalt Technologies.‖ NCHRP 9-47,
Interim Report. National Cooperation Highway Research Program, Washington D.C.
ASTM. 2000. ―Skid Resistance of Pavements Using a Full-Scale Tire.‖ ASTM E-274-97. Annual
Book of ASTM Standards Vol. 4.03.
Bahia, H., A. Fahim, and K. Nam. 2006. ―Prediction of Compaction Temperatures Using Binder
Rheology.‖ Vols. E-C105: 3-17.
Birgisson, B., R. Roque, J. Kim, and L. V. Pham. 2004. ―The Use of Complex Modulus to
Characterize the Performance of Asphalt Mixtures and Pavements in Florida.‖ Final
Report, 4910-4501-784-12. Florida Department of Transportation.
Biro, S., T. S. Gandhi, and S. N. Amirkhanian. 2007. ―Mid-Range Temperature Rheological
Properties of Warm Asphalt Binder.‖ Submitted for Review to Journal of Materials in
Civil Engineering.
Bonaquist, R. F., D. W. Christensen, and W. Stump. 2003. ―Simple Performance Tester for

59
Superpave Mix Design Development and Evaluations.‖ NCHRP Report 513.
Transportation Research Record, Washington D.C.
Bonaquist, R. 2008. ―Mix Design Practices for Warm Mix Asphalt.‖ NCHRP 9-43, Interim
Report. National Cooperation Highway Research Program, Washington D.C.
Brown, E. R., A. Cooley, B. Prowell, and B. Powell. 2004. ―Evaluation of Rutting Performance
at the 2000 NCAT Test Track.‖ Journal of the Association of Asphalt Pavement
Technologist 73.
Chelliah, T., P. Stephanos, T. Smith, and B. Kochen. 2002. ―Developing a Design Policy to
Improve Pavement Surface Characteristics.‖ Proceedings of Pavement Evaluation,
Roanoke, Va., Oct. 21–25, 1–19.
Clyne, T. R., X. Li, M. O. Marasteanu, and K. Engene. 2003. ―Dynamic Modulus and Resilient
Modulus of Mn/DOT Asphalt Mixtures.‖ Minnesota Department of Transportation,
MN/RC-2003-09.
Crews, E. ―Growth in Warm mix Asphalt Technology.‖ 2008. Caltrans District 5 Warm mix
Asphalt Innovation Project Open House and WMA Workshop, Morro Bay, CA.
Dukatz, E. 2009. ―Warm Mix What is it and how do I use it ?‖ Greater Iowa Asphalt Conference.
EI-Basyoung, M. M, M. Witczck, and K. Kaloush. 2005. ―Development of the Permanent
Deformation Models for the 2002 Design Guide.‖ CD-ROM. TRB 84th
Annual Meeting,
Washington. D.C.
Ekingen, E. R. 2004. ―Determining Gradation and Creep Effects in Mixtures Using the Complex
Modulus Test.‖ Master‘s thesis, University of Florida.
Eurovia Services. ―Aspha-min‖ http://www.aspha-min.de/en/html/news.html;
http://www.eurovia.com/en/

60
Galambos, Viner, Hegmon, Balmer, Rice, Kopac, and Brinkman. 1977. ―Pavement Texture and
Available Skid Resistance.‖ Office of Research, Federal Highway Administration,
Washington, D.C.
Gandhi, T. S., and S. N. Amirkhanian. 2007. ―Laboratory Evaluation of Warm Asphalt Binder
Properties–A Preliminary Investigation.‖ Proceedings of the 5th International Conference
on Maintenance and Rehabilitation of Pavements and Technological Control, U of Iowa
Press.
Geol, V. K., A. K. Gupta, R. M. Vasan, and M. P. S. Chauhan. 1995. ―Effect of Pavement
Materials on Skid Resistance.‖ Proceedings of the International Conference on Roads and
Road Transport Problems (ICORT-95) 1: 399-411.
Gonzalez-Leon, J. A., L. Grampre, and G. Barreto. 2009. ―Warm Mix Asphalt with Low Dosage
Chemical Additives.‖ CD-ROM. TRB 88th
Annual Meeting, Washington D. C.
Hensley, J. 1998. ―Establishing Hot Mix Asphalt Mixing and Compaction Temperatures at the
Project Level.‖ Asphalt Magazine 19-23.
Hibbs, B., and R. Larson. 1996. ―Tire Pavement Noise and Safety Performance: PCC Surface
Texture Technical Working Group.‖ Report No. FHWA-SA-96-068. Federal Highway
Administration. Washington, D.C.
Huang, S. C., M. Tia, and B. E. Ruth. 1995. ―Evaluation of Aging Characteristics of Modified
Asphalt Mixtures.‖ Engineering Properties of Asphalt Mixtures and the relationship to
their Performance, ASTM STP 1265. Philadelphia.
Hurley, G., and B. Prowell. 2005. ―Evaluation of Aspha-Min® for use in Warm Mix Asphalt.‖
NCAT Report 05-04. National Center for Asphalt Technology, Auburn, AL.
Hurley, G., and B. Prowell. 2005. ―Evaluation of Sasobit® for use in Warm Mix Asphalt.‖ NCAT

61
Report 05-06. National Center for Asphalt Technology, Auburn, AL.
Hurley, G., and B. Prowell. 2006. ―Evaluation of Evotherm® for use in Warm Mix Asphalt.‖
NCAT Report 06-02. National Center for Asphalt Technology, Auburn.
Hurley, G., and B. Prowell. 2006. ―Evaluation of Potential Process for use in Warm Mix
Asphalt.‖ Journal of the Association of Asphalt Paving Technologist 75: 41–90.
Hurley, G., and B. Prowell, A. Kvasnak. 2010. Missouri Field Trial of Warm Mix Asphalt
Technologies: Construction Summary. NCAT Report NO. 10-02.
Iowa DOT. 2005. ―Method of Design of Hot Mix Asphalt Mixes.‖ I.M. 510. Iowa Department of
Transportation, Ames, Iowa.
Jayawickrama, P. W., R. Prasanna, and S. P. Senadheera. 1996. ―Survey of State Practices to
Control Skid Resistance on Hot-Mix Asphalt Concrete Pavements.‖ In Transportation
Research Record: Journal of the Transportation Research Board, No. 1536.
Kaloush, K. E., M. W. Witczak, and H. V. Quintus. 2002. ―Pursuit of the Simple Performance
Test for Asphalt Mixture Rutting.‖ Journal of the Association of Asphalt Paving
Technologists 71: 783-810.
Kokkalis, A. G., and O. Panagouli. 1997. ―Fractal Evaluation of Pavement Skid Resistance
Variations [I] Surface Wetting.‖ Chaos Solitons Fractals 8: 764-789.
Kristjánsdóttir, O., L. Michael, S. T. Muench, and G. Burke. 2007. ―Assessing the Potential for
Warm Mix Technology Adoption.‖ Transportation Research Board 86th
Annual Meeting,
Washington D. C.
Kunnawee K., S. Samak, N. Kitae, M. Wilfung, and B. Hussain. 2007. ―Laboratory Study on
Warm Mix Asphalt Additives.‖ CD-ROM. Transportation Research Board of the National
Academic, Washington. D. C.

62
Kvasnak, A., R. West, J. Moore, J. Nelson, and P. Turner. 2009. ―Case Study of Warm Mix
Asphalt Moisture Susceptibility in Birmingham.‖ CD-ROM. TRB 88th
Annual Meeting,
Washington. D. C.
Lee, H., K. Kim, S. Hwang, and K. Jeong. 2007. ―Use of Warm Mix Asphalt Additives for Cold
In-place Recycling using Foamed Asphalt.‖ Proceedings of the 5th International
Conference on Maintenance and Rehabilitation of Pavements and Technological Control,
U of Iowa Press.
Lu, X., and P. Redelius. 2006. ―Effect of bitumen wax on asphalt mixture performance.‖
Construction and Building Materials 21: 1961-1970.
Ludema, K.C., and B.D. Gujrati. 1973. ―An analysis of the literature on tyre-road skid
resistance.‖ ASTM STP 541. Philadelphia.
Lundy, J. R., J. Sandoval-Gil, A. Brickman, and B. Patterson. 2005. ―Asphalt Mix
Characterization Using Dynamic Modulus and APA Testing‖ Final Report, FHWA-OR-
RD-06-09. Oregon Department of Transportation and Federal Highway Administration.
MeadWestvaco Asphalt Innovations. ―Evotherm.‖
http://www.meadwestvaco.com/index.htm?OpenDatabase
Mohammad, L. N., Z. Wu, S. Obulareddy, S. Cooper, and C. Abadie. 2006. ―Permanent
Deformation Analysis of HMA Mixtures Using Simple Performance Tests and the 2002
Mechanistic-Empirical Pavement Design Software.‖ CD-ROM. TRB 85th
Annual
Meeting, Washington. D.C.
NAPA. 2007. ―Warm Mix Asphalt–Best Practices.‖ QIP-125. National Asphalt Pavement
Association, Lanham, MD.
NAPA. 2008. ―Warm mix Asphalt: Contractors' Experiences.‖ IS-134. National Asphalt

63
Pavement Association, Lanham, MD.
Nazimuddin M. W., S. Selvaratnam, M. Z. Musharraf, G. Marie. 2007. ―A Comparative
Laboratory Study of Sasobit® and Aspha-Min® in Warm Mix Asphalt.‖ CD-ROM. TRB 86th
Annual Meeting, Washington. D. C.
Newcomb, D. 2009. ―Warm Mix Asphalt -The Future of Flexible Pavements.‖ MAAPT 56th
Annual Asphalt Conference.
Pan, T., E. Tutumluer, and S. H. Carpenter. 2006. ―Effect of Coarse Aggregate Morphology on
Pavement Deformation Behavior of Hot Mix Asphalt.‖ Journal of Transportation
Engineering ASCE 132.7: 580-589.
Prowell, B. D. 2007. ―Warm Mix Asphalt.‖ American Trade Initiatives.
Prowell, B. D., and G. C. Hurley. 2008. ―Warm Mix Asphalt: Best Practices.‖ NAPA 53rd Annual
Meeting, Phoenix, AZ.
Prowell B., G. C. Hurley, and E. Crews. 2007. ―Field Performance of Warm Mix Asphalt at the
NCAT Test Track.‖ CD-ROM. TRB 86th
Annual Meeting, Washington. D. C.
PQ Corporation. ―Advera WMA.‖
http://www.pqcorp.com/Products/AdveraWMA.asp (accessed April 2009)
Sasol Wax Americas, Inc. ―Sasobit®‖ http://www.sasolwax.com/Sasobit_Technology.html
Stephens, J. E., and W. H. Geotz. 1967. ―Effect of Aggregate Factors on Pavement Friction.‖
Highway Research Bulletin 302: 1-17.
Witczak, M. W., K. Kaloush, T. Pellinen, M. El-Basyouny, and H. Von Quintus. 2002. ‗‗Simple
performance test for superpave mix design.‘‘ NCHRP Rep. No. 465. Transportation
Research Board, National Research Council, National Academy Press, Washington D.C.
Xiao, F., J. Jordan, and S. N. Amirkhanian. 2009. ―Laboratory Investigation of Moisture Damage

64
in Warm Mix Asphalt Containing Moist Aggregate.‖ CD-ROM. TRB 88th
Annual
Meeting, Washington. D. C.