performance modeling for data center power management · 1. performance modeling: performance...
TRANSCRIPT

Performance Modeling forData Center Power Management
Thesis ProposalAnshul Gandhi
Computer Science DepartmentCarnegie Mellon [email protected]
Thesis Committee:David G. Andersen1
Mor Harchol-Balter1 (chair)Jeffrey O. Kephart2
Alan Scheller-Wolf3
Karsten Schwan4
1 Computer Science Department, Carnegie Mellon University2 IBM T.J. Watson Research Center
3 Tepper School of Business, Carnegie Mellon University4 College of Computing, Georgia Institute of Technology
1

Abstract
Data centers play an important role in today’s IT infrastructure. Government organizations, hospi-tals, financial trading firms, and major IT companies such as Google, Amazon, IBM, and HP, all relyon data centers for their daily business activities. However, the enormous energy consumption indata centers makes them very expensive to operate. On the one hand, it is desirable to limit the num-ber of servers to reduce power consumption, but on the other hand, obtaining good response timesrequires having many servers available. This is one of many examples of the power-performancetradeoff faced by data centers today. Thus, an important concern is how to efficiently manage thepower-performance tradeoff in data centers.
In this thesis, we propose to design and implement power-management policies for data centers thatoptimize the power-performance tradeoff. Specifically, we propose to address several important,yet unanswered questions in data center power management, including: (i) How many servers areneeded to handle the incoming load? (ii) When should servers be turned on/turned off/left idle/put tosleep? (iii) At what frequencies should servers be run? (iv) What policy should be used to route jobsto servers? In order to answer the above questions, we follow a two-pronged approach consistingof:
1. Performance Modeling:Performance modeling is a useful tool for analyzing the behavior of large computer systems,and it has been traditionally used to predict and improve system performance. However,power necessitates the development of new models and novel analysis involving multipleCPU operating frequencies, multiple server states (busy, idle, sleep and off) and the varioussetup costs involved in transitioning between server states. Thus, we propose to come up withnew queueing-theoretic models that will allow us to analyze the various power-performancetradeoffs in data centers.
2. Implementation and Experimental Evaluation:While our proposed analysis will guide us in optimizing the power-performance tradeoff, itcannot completely model today’s complex data centers. Thus, we propose to implement andexperimentally evaluate our proposed policies on an experimental test bed. This requiresfiguring out the right experimental setup and workload suite for evaluation. Finally, based onour implementation results, we plan to modify our proposed policies in order to tailor themas practical solutions for real-world data centers.
2

Contents
1 Introduction 41.1 Motivation . . . . . . . . . . . . . . . . . . . . . . . . . . . . . . . . . . . . . . . 41.2 Server farms . . . . . . . . . . . . . . . . . . . . . . . . . . . . . . . . . . . . . . 41.3 Novelty and contributions . . . . . . . . . . . . . . . . . . . . . . . . . . . . . . . 5
2 Optimal power allocation in server farms 72.1 Power-to-frequency . . . . . . . . . . . . . . . . . . . . . . . . . . . . . . . . . . 82.2 Model and theoretical results . . . . . . . . . . . . . . . . . . . . . . . . . . . . . 9
2.2.1 Model . . . . . . . . . . . . . . . . . . . . . . . . . . . . . . . . . . . . . 92.2.2 Theoretical results . . . . . . . . . . . . . . . . . . . . . . . . . . . . . . 9
2.3 Implementation and experimental results . . . . . . . . . . . . . . . . . . . . . . . 102.3.1 Experimental setup . . . . . . . . . . . . . . . . . . . . . . . . . . . . . . 102.3.2 Experimental results . . . . . . . . . . . . . . . . . . . . . . . . . . . . . 10
2.4 Future work . . . . . . . . . . . . . . . . . . . . . . . . . . . . . . . . . . . . . . 11
3 Dynamic power management 113.1 Setup costs . . . . . . . . . . . . . . . . . . . . . . . . . . . . . . . . . . . . . . 11
3.1.1 Theoretical results . . . . . . . . . . . . . . . . . . . . . . . . . . . . . . 123.2 Single-tier applications . . . . . . . . . . . . . . . . . . . . . . . . . . . . . . . . 15
3.2.1 Unpredictable and time-varying arrival rates . . . . . . . . . . . . . . . . . 163.2.2 Future work . . . . . . . . . . . . . . . . . . . . . . . . . . . . . . . . . . 17
4 Proposed work: Dynamic power management for multi-tier applications 174.1 Open questions . . . . . . . . . . . . . . . . . . . . . . . . . . . . . . . . . . . . 184.2 Prior work . . . . . . . . . . . . . . . . . . . . . . . . . . . . . . . . . . . . . . . 194.3 Our approach . . . . . . . . . . . . . . . . . . . . . . . . . . . . . . . . . . . . . 20
4.3.1 Experimental setup . . . . . . . . . . . . . . . . . . . . . . . . . . . . . . 204.3.2 Preliminary results . . . . . . . . . . . . . . . . . . . . . . . . . . . . . . 20
4.4 Plan of action . . . . . . . . . . . . . . . . . . . . . . . . . . . . . . . . . . . . . 21
5 Proposed time line 21
3

1 Introduction
1.1 Motivation
Data center power consumption accounts for more than 1.5% of the total electricity usage in theU.S., at a cost of nearly $4.5 billion [6]. The rising cost of energy and the tremendous growth ofdata centers will result in even more spending on power consumption. The EPA predicts that en-ergy consumption in data centers will exceed 100 billion kWh in 2011, at an estimated cost of $7.4billion [6]. Rising energy costs, regulatory requirements and social concerns over green house gasemissions have made reducing power consumption critical to data center operators.
Reducing power consumption in a data center is a non-trivial task, since there is almost always atradeoff between power and performance. For example, on the one hand, it is desirable to limit thenumber of servers to reduce power consumption, but on the other hand, obtaining good responsetimes requires having many servers available. Another example is whether idle servers should beturned off to save power or not. On the one hand, turning idle servers off can save a lot of power,since idle servers consume about 60% of their peak power [9]. But on the other hand, there isa huge boot up time, which we refer to as setup time, required to turn servers on. Additionally,servers consume almost peak power while they are booting up. Given the setup cost (setup time andpower penalty) associated with turning server on, it is not obvious whether idle servers should beever turned off or not. Another option is to put idle servers into some sleep mode. While a server insleep mode consumes more power than an off server, the setup time for a sleeping server is lowerthan that for an off server. These are some of the examples of the power-performance tradeoff thatexists in data centers today. In this work, when we talk about performance, we mean response time.Formally, response time for a job is defined as the time from when the job arrives into the data centeror server farm, until it has completed service.
1.2 Server farms
Figure 1: Abstract server farm workload model.
Server farms are ubiquitous in data centers, manufacturing systems, call centers and service centers.
4

In this proposal, we will mainly focus on data centers. Figure 1 illustrates a typical data centerarchitecture. Incoming jobs/requests first arrive at a load-balancer, or a front-end proxy server, andare then distributed among middle-tier web servers or application servers. Static content, such asindex pages, are served by the middle-tier servers, and dynamic content, such as customer pro-files or account information, is usually handled by back-end data storage servers. Traditionally,the back-end servers store persistent data on hard drives/disks, usually in the form of databases.However, accessing data via the hard disk significantly slows down the application response time.To improve performance, some data centers today make use of memcache [18], which is essen-tially a tier of servers that cache popular data items. With memcache, most requests for dynamiccontent will be served by the memcache servers, and only a fraction of requests will have to incurthe huge performance hit associated with accessing data via the hard disk. Popular multi-tier ap-plications/workloads include social networking (example, Facebook), online banking, e-commercecompanies (Amazon, e-bay), etc. However, not all applications are multi-tiered. For example, per-sonal home pages, web-sites for small offices, compute-intensive applications such as simulations,stock-trading software, etc., are all single-tier applications. Such applications usually only requirethe middle-tier web/application servers. Other popular examples of single-tier workloads includecall centers, service centers, manufacturing systems, etc.
Traditionally, server farm research has focussed on trying to maximize performance, or minimizeresponse time. However, given the significance of power in today’s data centers, we need to focus on“modern” optimization criterions that address the power-performance tradeoff such as maximizingperformance per watt, minimizing the power consumption given a response time target, minimizingthe response time given a power budget, etc. Both, single-tier and multi-tier applications requireefficient solutions for optimizing the power-performance tradeoff. Some of the important questionsconcerning server farms today include: (i) How many servers are needed to handle the incomingload? (ii) When should servers be turned on/turned off/left idle/put to sleep? (iii) At what frequen-cies should servers be run? (iv) What policy should be used to route jobs to servers? In this thesis,we propose to design and implement power-management policies for server farms that optimize thepower-performance tradeoff. Specifically, we propose to address several important, yet unansweredquestions in data center power management, such as those listed above.
1.3 Novelty and contributions
In order to answer the questions posed above, we propose to conduct both theoretical and experi-mental research. On the theoretical front, analytical tools such as performance modeling and queue-ing theory can help us analyze and optimize the power-performance tradeoff in data centers andserver farms, leading to the design of efficient power management policies. However, our analyti-cal tools cannot completely model today’s complex data centers. For example, our analytical toolsoften assume that a workload uses a single resource on a server, such as the CPU. However, datacenter workloads continually interact with the server’s CPU, memory, I/O subsystem, etc., duringtheir execution. Also, in multi-tiered data centers, the workloads often interact differently with theservers in different tiers. Thus, we propose to implement and experimentally evaluate our proposedpolicies on a real test bed. Further, based on our implementation results, we plan to modify ourproposed policies in order to tailor them as practical solutions for real-world data centers.
The outline for the rest of the paper, along with a summary of our contributions and proposed workfor each section, is as follows.
5

• We start with a single-tier application in Section 2. In this work, we are given a server farmwith an available power budget, and we wish to minimize the mean response time of appli-cations, by finding the optimal allocation of the available power to the servers. Note that thepower allocated to a server is controlled via the server’s voltage and frequency settings. Thus,our objective is to minimize the mean response time given a fixed power budget and our con-trol knob is the amount of power we allocate to each server. Note that given a fixed powerbudget, the amount of power we allocate to each server determines the number of servers wewill use. To fully understand the effect of power allocation on mean response time, we in-troduce a queueing theoretic model, which allows us to predict the optimal power allocationin a variety of scenarios. We then verify our results via extensive experiments on an IBMBladeCenter. Results indicate an excellent agreement between our analytical findings and ourexperimental observations. Further, the results motivate and verify our queueing-theoreticapproach to analyzing data centers. As future work, we propose to extend the optimal powerallocation research to time-varying workloads (see Section 2.4), and time permitting, exploreother optimization criterions such as maximizing the performance per watt or minimizing thepower consumption given a response time target.
• We then consider dynamic power management for single-tier applications, where our goalis to efficiently provision server farms so as to optimize the power-performance tradeoff. InSection 3.1, we first attempt to understand the costs associated with dynamically varying theserver farm provisioning. In particular, we analyze the power and response time penalty, orthe setup cost, associated with turning servers on and off. We derive the first closed-formsolutions and approximations for the mean response time and mean power consumption inserver farms with setup costs. Again, our results lend credibility to our queueing-theoreticapproach to analyzing data centers. Next, we use our knowledge of setup costs to designpower-management policies for server farms 3.2. Here, our objective is to maximize theperformance per watt (see Section 3.2) and our control knob is the number of servers wehave on/off/idle/sleeping at any instant of time. For dynamically varying arrival rates, turningservers on/off will have a much larger impact on power consumption than varying the voltageand frequency settings of individual servers. Thus, we will not be controlling the servers’voltage and frequency settings. This also simplifies our analysis to some extent. With respectto performance per watt, we prove that our proposed policies contain the optimal policy forthe case of a single server, and also contain a near-optimal policy for the case of multi-serversystems, assuming a stationary demand pattern. For the case of time-varying demand patterns,we develop a traffic-oblivious policy that can auto-scale the server farm capacity to adapt tothe incoming load, and prove that this policy is optimal when the arrival process is Poissonwith an unknown arrival rate. Further, via simulations, we show that our traffic-obliviouspolicy also performs well for a Poisson arrival process with an unknown time-varying arrivalrate. As future work, we propose to analyze our traffic-oblivious policy and understand howit affects response time and power consumption (see Section 3.2.2).
• Finally, we consider complex, multi-tier applications (as shown in Figure 1), such as so-cial networking or online banking. We propose to address several important questions formulti-tier applications, including those listed in the beginning of this section. We believe aqueueing-theoretic approach will not suffice in this case due to the complex architecture ofmulti-tier applications. Thus, we will rely heavily on experimental research to address theimportant questions on how to manage the power-performance tradeoff. A complete descrip-tion of our proposed work, along with details of preliminary experimental setup and results
6

in provided in Section 4. Our objective will be to maximize the performance per watt, thoughwe might consider adopting other optimization criterions. Our proposed control knobs forthis work include the number of servers on/off/idle/sleeping at each tier and the job routingscheme at the load-balancer.
2 Optimal power allocation in server farms
Motivation.Servers today consume ten times more power than they did ten years ago [6, 30]. Recent articlesestimate that a 300W high performance server requires more than $330 of energy cost per year [35].Power consumption is particularly pronounced in CPU intensive server farms composed of tens tothousands of servers, all sharing workload and power supply.
Problem statementServer farms often have a fixed peak power budget. This is because large power consumers operat-ing server farms are often billed by power suppliers, in part, based on their peak power requirements.The peak power budget of a server farm also determines its cooling and power delivery infrastruc-ture costs. Hence, companies are interested in maximizing the performance at a server farm givena fixed peak power budget [8, 15, 16, 30]. The power allocation problem we consider is: how todistribute available power among servers in a server farm so as to minimize mean response time.
HardnessUnderstanding power allocation in a server farm is intrinsically difficult for many reasons: First,there is no single allocation scheme which is optimal in all scenarios. For example, it is com-monly believed that operating servers at their maximum frequency, which we refer to as PowMax,is the optimal power allocation scheme [4, 14]. However, as we show later, operating servers attheir lowest frequency, (PowMin) or intermediate frequencies (PowMed) can sometimes outperformPowMax by almost a factor of 1.5. Second, it turns out that the optimal power allocation dependson a very long list of external factors, such as the outside arrival rate, whether an open or closedworkload configuration is used, the power-to-frequency relationship (how power translates to serverfrequency) inherent in the technology, and many other factors. It is simply impossible to examineall these factors via experiments.
Prior workPrior work in power management has been motivated by the idea of managing power at the globaldata center level [15, 29] rather than at the more localized single-server level. Notable prior workdealing with peak power allocation in a server farm includes Raghavendra et al. [30], Femal etal. [17] and Chase et al. [11] among others. Raghavendra et al. [30] present a power manage-ment solution that coordinates different individual approaches to simultaneously minimize averagepower, peak power and idle power wastage. Femal et al. [17] allocate peak power so as to maxi-mize throughput in a data center while simultaneously attempting to satisfy certain operating con-straints such as load-balancing the available power among the servers. Chase et al. [11] present anauction-based architecture for improving the energy efficiency of data centers while achieving somequality-of-service specifications. We differ from the above work in that we specifically deal withminimizing mean response time for a given peak power budget and understanding all the factorsthat affect it.
7

Our approachTo fully understand the effect of power allocation on mean response time in a server farm, we intro-duce a queueing theoretic model which allows us to predict the optimal power allocation in a varietyof scenarios. In particular, our model predicts the mean response time for a given power allocationas a function of the arrival rate, mean job size, type of server farm configuration (open vs. closed)and the power-to-frequency curve. We then derive the optimal power allocation by minimizing themean response time prediction, with the total power budget as our constraint. Finally, we implementthe various power allocation policies (PowMax, PowMed and PowMin) on an IBM BladeCenter testbed and evaluate our theoretical findings via extensive experimentation. Results indicate a strongagreement between our theoretical and experimental results, thus verifying our queueing-theoreticapproach.
2.1 Power-to-frequency
(a) DFS (b) DVFS (c) DVFS+DFS
Figure 2: Power vs. frequency graphs for DFS, DVFS and DVFS+DFS.
Processors today are commonly equipped with mechanisms to reduce power consumption at the ex-pense of reduced server frequency. Common examples of these mechanisms are Intel’s SpeedStepTechnology and AMD’s Cool ‘n’ Quiet Technology. The power-to-frequency relationship in suchservers depends on the specific voltage and frequency scaling mechanism used. In this work, westudy three different scaling mechanisms:1. Dynamic Frequency Scaling (DFS) a.k.a. Clock Throttling or T-states is a technique to man-age power by running the processor at a less-than-maximum clock frequency.2. Dynamic Voltage and Frequency Scaling (DVFS) a.k.a. P-states is a more efficient power-savings mechanism that reduces server frequency by reducing the processor voltage and frequency.3. DVFS+DFS attempts to leverage both DVFS, and DFS by applying DFS on the lowest perfor-mance state available in DVFS.
Figure 2 illustrates the power-to-frequency curves obtained for when running the Intel LINPACKbenchmark [26] on an IBM HS21 blade server (see Section 2.3.1 for server details) using DFS,DVFS and DVFS+DFS. Surprisingly, the power-to-frequency curve varies drastically dependingon the frequency scaling mechanism used. For more details on our power-to-frequency curves,see [24].
8

2.2 Model and theoretical results
2.2.1 Model
Figure 3: Server farm model.
Figure 3 illustrates our queueing model for a server farm with k servers. Jobs at a server time-sharethe CPU among themselves using the Processor-Sharing (PS) scheduling discipline. We assumethat there is a fixed power budget P , which can be split among the k servers, allocating Pi power toserver i where
∑ki=1 Pi = P . The corresponding server speeds are denoted by (s1, . . . , sk). Each
server, i, receives a fraction qi of the total workload coming in to the server farm. Correspondingto any vector of power allocation (P1, . . . ,Pk), there exists an optimal workload allocation vector(q∗1, . . . , q
∗k). We derive the optimal workload allocation for each power allocation and use that
vector, (q∗1, . . . , q∗k), both in theory and in the actual experiments. The details of how we obtain the
optimal (q∗1, . . . , q∗k) are deferred to [24].
A job’s response time, T , is the time from when the job arrives until it has completed service,including waiting time. We aim to minimize mean response time, E[T ]. We consider server farmswhere each incoming job can be routed to any server, i.e., it has no affinity for a particular server.
2.2.2 Theoretical results
We now present a subset of our theoretical results which deal with open loop configurations (jobsarrive from outside the system and leave the system after they complete service). For other results,and proofs, see [24].
Result 1 For DFS, PowMax is optimal.
Result 2 For DVFS, PowMax is optimal at low arrival rates and PowMin is optimal at high arrivalrates.
Result 3 For DVFS+DFS, PowMax is optimal at low arrival rates and PowMed is optimal at higharrival rates.
9

IntuitionFor finding the optimal power allocation, we want to maximize the frequency per Watt. For steeplinear curves, such as DFS in Figure 2 (a), PowMax (operating each server at the maximum power)is optimal, since lowering the power results in a steep drop in frequency. Similarly, we expectPowMin to be optimal for flat linear curves such as DVS in Figure2 (b). For downwards concavepower-to-frequency relationships, such as DVFS in Figure 2 (c), we find that the optimal powerallocation value for each server lies between the maximum and the minimum possible power allo-cation. Hence, PowMed is optimal. However, the above argument still does not take into accountthe mean arrival rate. If the arrival rate is sufficiently low, there are very few jobs in the server farm,hence, few fast servers, or PowMax, is optimal.
2.3 Implementation and experimental results
2.3.1 Experimental setup
Our experimental setup consists of a server farm with up to fourteen IBM BladeCenter HS21 bladeservers featuring two 3.0 GHz dual-core Intel Woodcrest Xeon processors and 1 GB memory perblade, all residing in a single chassis. We installed and configured Apache as an application serveron each of the blade servers to process transactional requests. To generate HTTP requests for theApache web servers, we employ an additional blade server which uses httperf [28] to generateworkload requests. We modified and extended httperf to allow for multiple servers and to specifythe routing probability among the servers. We measure and allocate power to the servers usingIBM’s Amester software.
2.3.2 Experimental results
(a) DFS (b) DVFS (c) DVFS+DFS
Figure 4: Power allocation results for DFS, DVFS and DVFS+DFS.
We now present a subset our experimental results based on the setup discussed in Section 2.3.1, andusing the CPU intensive Intel LINPACK workload [26]. For experimental results using memoryand I/O bound workloads, see [24].Figure 4(a) and (b) plot the mean response time as a function of the arrival rate for DFS and DVFSrespectively, with a power budget of 720 W. Here, PowMax denotes running 3 servers at 240 W andPowMin denotes running 4 servers at 180 W. Clearly, PowMax outperforms PowMin throughoutthe range of arrival rates for DFS. This is in agreement with the predictions of Result 1. Note fromFigure 4 (a) that the improvement in mean response time afforded by PowMax over PowMin is huge;
10

ranging from a factor of 3 at low arrival rates to as much as a factor of 5 at high arrival rates. ForDVFS, we see that when the arrival rate is low, PowMax produces lower mean response times thanPowMin. However, at higher arrival rates, PowMin outperforms PowMax, as predicted by Results 2.Figure 4 (c) plots the mean response time as a function of the arrival rate for DVFS+DFS with apower budget of 1000 W. We see that when the arrival rate is low, PowMax produces lower meanresponse times than PowMed. However, at higher arrival rates, PowMed outperforms PowMax,exactly as predicted by Result 3. Note that PowMin is worse than both PowMed and PowMaxthroughout the range of arrival rates. Thus, we see that our theoretical findings are in excellentagreement with our experimental observations.
2.4 Future work
As future work, we propose to extend the optimal power allocation research to time-varying work-load demands, where it is important to meet response time targets without consuming too muchpower. We plan to first analyze data center workload demands and capture the repeating patternsin them. We can then proactively allocate resources (servers and server frequencies) for predictableworkload demand to meet the response time targets. Thus, the number of active servers mightchange with time, and further, servers might run at different frequencies at different points of time.Of course, we also need to find a way to provision for the unpredictable demand. We propose touse a mix of analysis and experimentation to arrive at our final solution. Also, time permitting, wepropose to explore other metrics such as performance per watt (inverse of the product of mean re-sponse time and mean power consumption) or work done per joule (inverse of the product of meanresponse time and mean energy consumption).
3 Dynamic power management
Thus far we have considered capacity provisioning problems for the case of a static arrival rate(see Section 2). In this section, we propose dynamic power management policies that are traffic-oblivious. In particular, we propose policies that manage the tradeoff between power and perfor-mance (See Section 1.1) by reacting to changes in workload demand. In Section 3.1, we analyzethe dynamics involved in changing the capacity provisioning, viz., the advantages and penalties inturning servers on or off. We then use this knowledge to come up with a near-optimal power man-agement policy for single-tier data centers in Section 3.2. Later, in Section 4, we propose to designand implement power management policies for multi-tier, real-world data-centers.
3.1 Setup costs
Server farms are ubiquitous in data centers, manufacturing systems, call centers and service centers.In data centers and manufacturing systems, machines are usually turned off when they have nowork to do, in order to save on power or operating costs. For example, idle servers in a data centerconsume about 60% [10] of peak power. Likewise, in call centers and service centers, employees canbe dismissed when there are not enough customers to serve. However, there is usually a setup costinvolved in turning on a machine, or in bringing back an employee. This setup cost is typically in theform of a time delay, which we refer to as the setup time. In data centers, there is an additional powerpenalty in turning servers on, since the server consumes peak power during the entire duration of thesetup time. Empirical results for the setup cost in servers is provided in Table 1 for reference. Thus,an important and open question in data centers, manufacturing systems, call centers and servicecenters, is whether it pays to turn machines/employees “off”, when there is not enough work to do.
11

Type Model Setup time Setup power Idle powerLaptop ThinkPad T500 45 s 45 W 18 WDesktop Dell Optiplex 745 100 s 115 W 75 WDesktop Dell PowerEdge T110 60 s 90 W 45 WServer Xeon E5320 200 s 240 W 150 WServer Xeon E5520 250 s 213 W 140 WServer Xeon E5535 130 s 370 W 215 W
Table 1: Observed values of setup time and setup power for different systems.
While setup costs have been analyzed for a single-server as far back as 1964 [37], there is almostno prior work on multi-server systems with setup costs. In this work, we present the first analyticalresults on multi-server systems with setup costs for various scenarios.
3.1.1 Theoretical results
Figure 5 illustrates our server farm model for analyzing setup costs. We model our server farm asa First-Come-First-Server (FCFS) queue with k servers. We assume a Poisson arrival process withtime-varying arrival rate, λ(t), with exponentially distributed job sizes. We define load, ρ(t), tobe the product of mean arrival rate at time t, and the mean job size. Finally, we model the setuptime as an exponentially distributed random variable to ease analysis. In Section 3.2, we relax theexponential assumption on setup time, and assume deterministic setup times. Later, in Section 4,we also relax the FCFS assumption, and deal with real-world processor sharing (PS) systems.
Figure 5: Server farm with setup costs model.
To study the effect of setup costs on mean response time and power, we introduce three policies:
1. ON/IDLE: In this policy, servers are always kept on. Thus, servers are either busy servingjobs, or idle, waiting for new arrivals. This policy is essentially an M/M/k queueing system.We assume that all servers in the server farm are kept on. In Section 3.2, we optimize for the
12

(a) Approximation for mean response time (b) Approximation for mean power
Figure 6: Graphs depicting the accuracy of our approximations for the ON/OFF policy.
number of servers that should be kept on. The ON/IDLE policy is often used in practice bysetting the number of servers to be high enough to handle the peak demand, thus resulting inover-provisioning.
2. ON/OFF: Since idle servers consume a lot of power, the ON/OFF policy immediately shutsservers off when not in use (thus, we have no idle servers under the ON/OFF policy). How-ever, turning a server back on incurs a setup cost (time delay and power penalty). TheON/OFF policy is similar to the PowerNap [27] policy where servers are turned on onlywhen needed to serve a job.
3. ON/OFF/STAG: This is the staggered boot up policy [13, 31], where at most one server canbe in setup at a time. The staggered boot up model is believed to avoid excessive powerconsumption.
While these seemingly trivial policies have been introduced for the purpose of analyzing setup costs,we show in Section 3.2 that they can be quite useful in practice. We now summarize the main resultsof our analysis. For more results and details of our analysis, see [23, 20, 22, 21].
Figure 7 shows our analytical results for the mean response time as a function of load for varioussetup costs, for a server farm with k = 10 servers. The ON/IDLE policy is not affected by thesetup costs, and is very easy to analyze. We see that the mean response time goes up as the loadincreases due to queueing delays. For ON/OFF, we approximate [23] the mean response time andmean power consumption using Markov chain analysis. Figure 6 shows the accuracy of our approx-imations various loads and setup times. We find that the ON/OFF policy has higher mean responsetimes than the ON/IDLE policy due to the setup time required to boot up servers. However, we seethat sometimes the mean response time drops as the load increases. This peculiar behavior can beexplained by the fact that as load increases, the setup cost is amortized over many jobs. Finally,for the ON/OFF/STAG, we prove [22, 21] a surprising decomposition result: The response timefor ON/OFF/STAG is equal, in distribution, to the sum of the setup cost and the response time ofON/IDLE. This explains the ON/OFF/STAG curves in Figure 7.
Figure 8 shows the corresponding analytical results for the mean power consumption. We use theempirical power values observed for the Xeon E5320 (see Table 1) to model the server power con-
13

sumption. As expected, ON/OFF/STAG has the lowest power consumption. However, surprisingly,the power consumption for ON/OFF can sometimes be greater than that of ON/IDLE, especially forhigh setup times. Thus, setup costs can have an adverse effect not only on response times, but alsoon power consumption.
An interesting question to ask is how do the various policies fare when we scale up the numberof servers. While it is next to impossible to experiment with very large server farms, our analysiscan immediately answer such practical questions. Figure 9 shows our analytical results for meanresponse time and mean power consumption as a function of the data center/server farm size. Here,we assume realistic system parameter values such a setup time of 200s (see Table 1), CPU utilizationof 30% and a mean job size of 1s. Note that CPU utilization is simply the load, ρ, divided by thenumber of servers, k. Figure 9 reveals that ON/IDLE is superior for small server farms, but ON/OFFis superior for large server farms. This is because for large server farms, the power consumptionof ON/IDLE is much higher than that of ON/OFF, which can auto-scale the number of servers itneeds.
(a) Setup time = 1s (b) Setup time = 10s (c) Setup time = 100s
Figure 7: Mean response time vs. load for various setup times.
(a) Setup time = 1s (b) Setup time = 10s (c) Setup time = 100s
Figure 8: Mean power vs. load for various setup times.
14
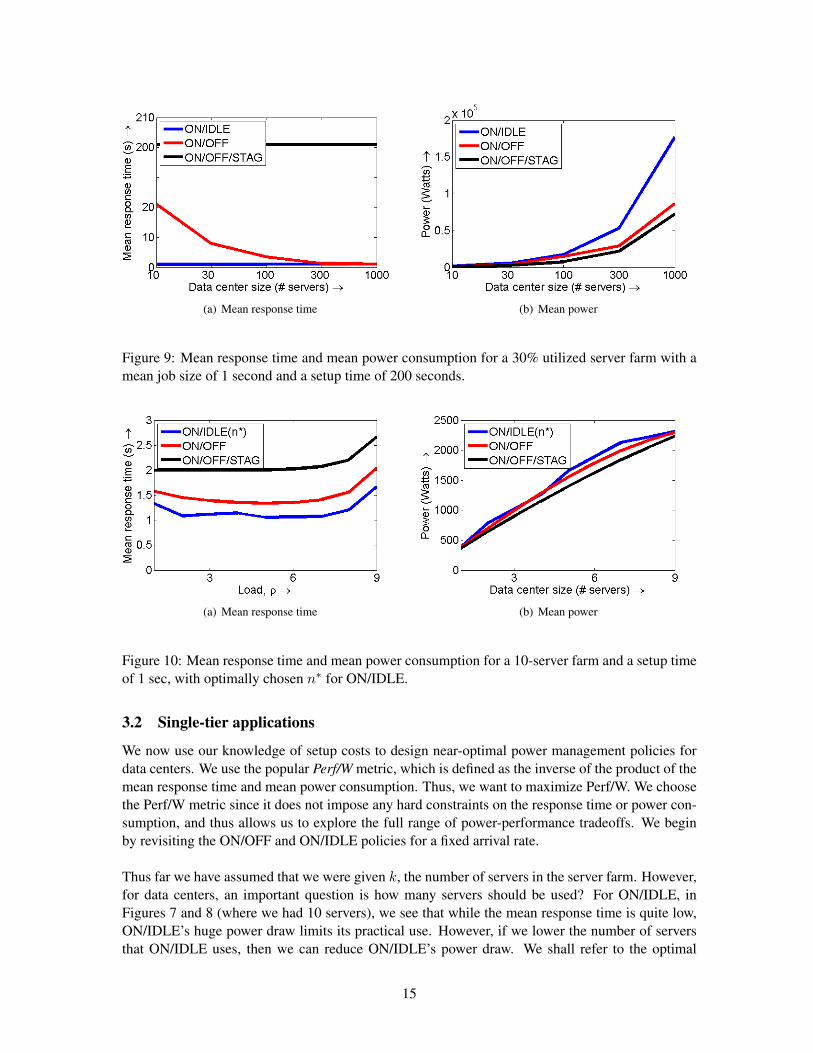
(a) Mean response time (b) Mean power
Figure 9: Mean response time and mean power consumption for a 30% utilized server farm with amean job size of 1 second and a setup time of 200 seconds.
(a) Mean response time (b) Mean power
Figure 10: Mean response time and mean power consumption for a 10-server farm and a setup timeof 1 sec, with optimally chosen n∗ for ON/IDLE.
3.2 Single-tier applications
We now use our knowledge of setup costs to design near-optimal power management policies fordata centers. We use the popular Perf/W metric, which is defined as the inverse of the product of themean response time and mean power consumption. Thus, we want to maximize Perf/W. We choosethe Perf/W metric since it does not impose any hard constraints on the response time or power con-sumption, and thus allows us to explore the full range of power-performance tradeoffs. We beginby revisiting the ON/OFF and ON/IDLE policies for a fixed arrival rate.
Thus far we have assumed that we were given k, the number of servers in the server farm. However,for data centers, an important question is how many servers should be used? For ON/IDLE, inFigures 7 and 8 (where we had 10 servers), we see that while the mean response time is quite low,ON/IDLE’s huge power draw limits its practical use. However, if we lower the number of serversthat ON/IDLE uses, then we can reduce ON/IDLE’s power draw. We shall refer to the optimal
15

number of servers that a policy should use as n∗. Our results from [19] indicate that for a loadof ρ, ON/IDLE should use approximately n∗ = ρ +
√ρ servers. Figure 10 shows how the mean
response time and power consumption change when we use ON/IDLE(n∗) for a server farm with10 servers (thus, ON/IDLE uses min(n∗, 10) servers). We see that while mean response time forON/IDLE(n∗) goes up slightly as compared to that of ON/IDLE in Figure 7 (a), its mean powerconsumption drops significantly for low loads. For the ON/OFF policy, we would ideally like to setn∗ = ∞, since ON/OFF can automatically turn unused servers off. Figure 11 shows the Perf/Wof ON/IDLE(n∗) and ON/OFF(n∗) normalized by the upper bound on Perf/W for a fixed arrivalrate. Here we assume deterministic setup costs, as in the real world. The upper bound on Perf/W isobtained by assuming that there is no queueing delay (thus, mean response time is simply the meanjob size) and there is no setup cost (thus, servers can be turned on and off instantaneously withoutany delay or energy penalty). We see that when the job size is small, ON/IDLE(n∗) is near-optimalsince it can set n∗ based on the fixed arrival rate. However, for large job sizes (large relative to thesetup time), ON/OFF(n∗) is near-optimal, since its setup time is now significantly smaller than themean job size.
(a) Mean job size = 1s (Web workloads). (b) Mean job size = 10000s (Long running jobs).
Figure 11: Perf/W for ON/IDLE(n∗) and ON/OFF(n∗) normalized by the theoretical upper boundon Perf/W.
3.2.1 Unpredictable and time-varying arrival rates
For time-varying arrival rates, On/OFF(n∗) is still a good choice for large job sizes, since ON/OFF(n∗)can auto-scale by turning off unused servers. However, ON/IDLE(n∗) is no longer a good policysince we will have to manually adjust the n∗ value with varying load. To address this issue, we in-troduce DELAYEDOFF, an auto-scaling policy similar to ON/OFF(n∗), except that it waits for twait
seconds before turning an idle server off. For details on how to pick a good twait value, see [19].Thus, if an idle server is not needed to serve any request for twait seconds, it is turned off. However,if a job needs a server, and there are multiple idle servers, DELAYEDOFF routes the job to theMost-Recently-Busy (MRB) idle server, thus giving other idle servers a chance to turn off. Ourresults in [19] indicate that MRB routing is crucial for the performance of DELAYEDOFF. In fact,a conceptual difference between the use of DELAYEDOFF in our work and in related work is theMRB policy. While DELAYEDOFF type schemes have been used extensively for stand-alone de-vices, we are applying DELAYEDOFF to each device in a server farm, and are artificially creatingan arrival process via MRB so as to make the idle periods of the servers highly variable. Highly
16

variable idle periods allow DELAYEDOFF to turn unused servers off, thus making it an auto-scalingpolicy.
We now analyze the Perf/W of DELAYEDOFF. Figure 12(a) plots the Perf/W of DELAYEDOFFnormalized by the upper bound on Perf/W (as described in Section 3.2) for a sinusoidal arrival rate.We also plot the Perf/W of the ORACLE policy, which knows the arrival rate ahead of time, and canthus adjust the number of servers required at any time to maximize the Perf/W. The ORACLE policyis a better yardstick than the theoretical upper bound for the case of time-varying loads, since in suchcases, turning servers on and off is unavoidable. We see that DELAYEDOFF’s Perf/W is almostalways within 10% of that of ORACLE, except when the arrival rate changes frequently (low valuesfor period of curve on the x-axis of Figure 12 (a)). This is because DELAYEDOFF’s scaling capacityis limited by the setup time. However, for most real-world workloads, DELAYEDOFF performsquite well. For example, we see that DELAYEDOFF accurately adjusts capacity in response to areal-world website’s demand trace [3], as shown in Figure 12 (b).
3.2.2 Future work
While we have some asymptotic analysis of DELAYEDOFF in [19], we propose to use the ideasdeveloped in Section 3.1 to either exactly analyze or approximate the response time and powerconsumption of DELAYEDOFF. For example, we can numerically analyze DELAYEDOFF by as-suming exponential setup times and an exponential twait wait time. However, we wish to analyzeDELAYEDOFF for the realistic case of deterministic setup times and deterministic wait times.
(a) DELAYEDOFF (b) Trace-based evaluation for DELAYEDOFF
Figure 12: (a) Perf/W for ORACLE and DELAYEDOFF normalized by the theoretical upper boundon Perf/W. (b) DELAYEDOFF applied to the WorldCup’98 soccer demand trace.
4 Proposed work: Dynamic power management for multi-tier appli-cations
Thus far we have focussed on single-tier applications. In this section, we propose to design andimplement efficient power management policies for multi-tier applications, such as social network-ing, online banking and business transactions. A simplified architecture for multi-tier applicationsis depicted in Figure 1. In most cases, the incoming workload first arrives at a proxy server, or
17

load-balancer, and is then distributed among middle-tier web servers or application servers. Staticcontent, such as index pages, are served by the middle-tier servers, and dynamic content, such ascustomer profiles or account information, is usually handled by back-end servers. Traditionally,the back-end servers store persistent data on hard drives/disks, usually in the form of databases.However, accessing data via the hard disk significantly slows down the application response time.To improve performance, data centers today make use of memcache, which is essentially a tier ofservers that cache popular data items. Recent reports indicate that the hit-rate of memcache is ashigh as 99%. Thus, most of the dynamic content gets served by the memcache layer, and only afraction of the incoming requests need to access the disks. While it is difficult to get real-worldnumbers for multi-tier architectures, we speculate the ratio of middle-tier web servers to that ofback-end memcache and storage servers to be anywhere between 1:1 to 10:1.
4.1 Open questions
Because of the complex architecture of multi-tier applications, there are many opportunities for re-search. The specific questions we propose to address in this work are:
1. Power-aware load balancing (PALB).Traditional scheduling policies such as Round-Robin or Join-the-Shortest-Queue are wellsuited to minimize response times. However, given the growing importance of power in datacenters, it is important to make these policies power-aware. For example, if the incoming loaddrops below a certain threshold, we might want to load-balance requests among fewer serversand turn off the unused servers to save power. We propose to extend traditional schedulingpolicies to make them power-aware and also design novel PALB policies. The question weask with respect to load-balancing policies is “How should we load-balance the incomingrequests among the middle-tier web servers to best manage the tradeoff between power andresponse time?”.
2. Capacity provisioning for middle-tier servers.Capacity provisioning for multi-tier architectures is complicated by the fact that bottleneckscan exist at different tiers at different points of time. However, with the introduction ofmemcache, the bottleneck in performance seems to have shifted away from the back-endservers. Further, with the increasing cost of power, and given the ratio of middle-tier toback-end servers, it has become important to efficiently provision the middle-tier. Importantquestions related to capacity provisioning for middle-tier include “How many servers shouldbe provisioned for the middle-tier web server to handle the incoming load?”, “When shouldthese servers be turned on?”, “Should idle servers be turned off? If so, when should we turnidle servers off?”, etc.
3. Server states.Today’s servers are equipped with an array of sleep and idle states. This makes the questionof capacity provisioning more complicated. For example, we might want to maintain a fewweb server in the sleep state to save power and still allow for short setup times. However,there might be multiple sleep states to choose from. Thus, a related capacity provisioningquestion we ask is “How many servers should be in the sleep state, or the idle state, or the offstate?”.
18

4. Capacity provisioning for back-end servers.Traditional capacity provisioning questions for back-end servers have focussed on sizing ca-pacity of back-end servers to minimize response time delays. While we propose to focusmostly on the middle-tier servers, it is possible that we will find the back-end servers as be-ing the main culprit for increased power consumption and/or response time. Thus, a possiblequestion that we propose to answer is “How many memcache and/or persistent storage servers(or database servers) should we have?”.
4.2 Prior work
Modeling a multi-tier application has been attempted by many research groups in the past. Wenow mention some of the prior work most related to our proposed work. Urgaonkar et al. [33] andWang et al. [36] use a network of queues to approximate the end-to-end response time for a multi-tier web application. While the authors deal with server provisioning in a multi-tier environment,the queueing model is only used to estimate performance. Abdelzaher et al. [5] use a control-theoretic approach to provision resources to applications in a multi-tier architecture. The authorsuse a queueing-theoretic model to predict response times. Their closed-loop approach then managesthe tradeoff between the number of applications hosted on a machine and the amount of resources(CPU or memory) allocated to each application based on the predictions of response time and power.Our proposed work differs from the above related work in that we plan to use queueing-theoreticmodels to optimize performance for multi-tier applications rather than estimating response times.For example, we propose to design novel power-aware load balancers that manage the tradeoff be-tween response times and power consumption. While, modeling a complex multi-tier architecturelike the one shown in Figure 1 remains a formidable challenge, we expect to have at least approxi-mations that explain the behavior of the multi-tier applications. We can then optimize the tradeoffbetween power and performance by tuning the system based on our approximations.
Prior work in systems research, especially in recent years, has focussed a lot on multi-tier appli-cations. We first mention related work dealing with scheduling policies for multi-tier applications.Andreolini et al. [7] study the effect of existing load-dispatching algorithms on the performanceof multi-tier applications via implementation. Chen et al. [12] consider a multi-tier connectionbased architecture and propose a combination of scheduling and capacity provisioning policies tominimize power consumption without adversely affecting response times. The authors then evalu-ate their proposed policies via simulation. In our work, we propose to design novel power-awarescheduling policies that manage the power-performance tradeoff and experimentally evaluate them.Experimentally validating the proposed scheduling policies is crucial since some scheduling policiesmight not scale well with the size of the server farm. For example, complicated scheduling algo-rithms that store a lot of information for every request or algorithms that dispatch incoming requestsbased on tedious calculations will not perform well when the request rate is high. We now men-tion related work dealing with capacity provisioning for multi-tier applications. Horvath et al. [25]employ reactive feedback mechanisms to provision capacity for a multi-tier web application. Theauthors also study the effect of using multiple sleep states in servers, and conclude that using sleepstates in conjunction with the traditional off state can significantly improve energy efficiency. Wanget al. [34] also employ a reactive feedback mechanism to manage the power-performance tradeoff inmulti-tier systems. The authors use DVFS along with capacity provisioning to react to degradationin observed response times. Urgaonkar et al. [32] employ a combination of predictive and reactiveprovisioning to meet response time targets while minimizing power consumption. We note that areactive feedback mechanism was used in all of the above approaches. While reactive feedback
19

mechanisms can theoretically respond to fluctuations in load, they are often not used in practice.Reasons for the limited practical use of reactive solutions include response time violations result-ing from delay in provisioning resources (setup time) and prediction inaccuracies. In this work,we propose to design a robust and simple algorithm that manages the power-performance tradeoffwithout reacting to degradation or violations in response times. For example, by understanding therelationship between workload demand and response times, we can proactively provision serversfor the incoming load.
4.3 Our approach
In this work, we propose to combine theoretical and experimental research in order to design andevaluate efficient power management policies for multi-tier applications in data centers. While it isdifficult to completely model multi-tier architectures, it is possible to model individual tiers. For ex-ample, we have already considered capacity provisioning problems for single-tier applications (seeprevious sections), and are currently focussing on understanding the workload interaction betweenthe middle-tier web servers and the back-end memcache servers by modeling a social networkingworkload.
4.3.1 Experimental setup
Our test bed consists of 14 Intel Xeon E5520 servers, with two quad-core 2.27 GHz processorsand 16 GB of memory. We employ one of these servers as the front-end load generator runninghttperf [28]. Another server is used as the front-end load-balancer, which distributes requests fromthe load generator to the middle-tier servers. Two servers are used to host all the data using thememcached [18] system. The remaining 10 servers are employed as middle-tier web servers run-ning Apache [2]. The middle-tier servers parse the incoming requests are collect the required datafrom the back-end memcache servers. We monitor the power consumption of individual servers byreading the power values off of the power distribution unit (PDU), which updates the power read-ings once every 3 seconds. We use IPMItool [1] to remotely turn these servers on and off.
The workload itself is a key-value store that resides on the memcache servers. We created theworkload to model realistic multi-tier applications such the social networking site, Facebook. Eachgenerated request is a php script, that starts off by requesting a random key. Based on the valueassociated with this key, a bunch of other keys might be requested. This process can continueiteratively. By tuning the number of iterations that each request can spawn, we can control themagnitude of the job sizes. We currently set the mean job size to approximately 150 ms, whichcorresponds to roughly 800 key requests to the memcache.
4.3.2 Preliminary results
An important first step in our implementation is to derive the maximum number of simultaneousrequests a single middle-tier web server can handle. We ran a stress test by sending requests viathe load generator directly to one of the web servers, which then communicates with the back-end memcache servers. To optimize the web server, we increase the file-descriptor limit and theavailable TCP port limit to the maximum allowable setting for the web server. Preliminary resultsindicate that at 100 req/sec, the mean response time is roughly 600 ms, almost four times the meanjob size. Further, the web server CPU is approximately 40% utilized, which is a little higher thanthe reported CPU utilization of today’s web servers [9]. Note that here each request corresponds to
20

one php request, which in turn can create multiple data item requests to the memcache. Thus, webelieve that 100 req/sec is a good upper limit on the number of simultaneous connections each webserver should be allowed to handle.
Another interesting aspect that we have started work on is scheduling policies at the load-balancer.We have currently implemented three traditional scheduling policies: (i) Round-robin, where re-quests are cyclically distributed among the back-end servers, (ii) Random, where each request israndomly assigned to a middle-tier server, and (iii) Join-the-Shortest-Queue (JSQ), where each re-quest is assigned to the server with the least number of active connections. We now want to extendthese policies to make them power-aware. For example, if the incoming load drops below a certainthreshold, we might want to load-balance requests among fewer servers and turn off the unusedservers to save power. We also plan to develop novel power-aware scheduling policies that willmanage the tradeoff between response time and power consumption. One such example would beto extend our novel DELAYEDOFF policy to processor-sharing servers.
4.4 Plan of action
• As a first step, we plan to formalize and verify our experimental setup. This will requirean understanding of today’s multi-tier applications and the architectures they are hosted on.Once we have the right experimental setup, we plan to address each of the four questionslisted in Section 4.1 in order.
• Next, we propose to analyze traditional scheduling policies and design a novel, PALB policy.As mentioned, our search for the novel policy will be inspired by DELAYEDOFF, but mightend up being very different. We expect the design of our PALB policy to involve some anal-ysis. However, we will thoroughly evaluate our PALB policy experimentally by comparingagainst existing load-balancing policies.
• Next, we plan to address the capacity provisioning problem for the middle-tier. However,possibly the PALB policy will already account for some capacity provisioning measures. Forexample, the DELAYEDOFF policy turns servers on when a new job comes in, and turns idleservers off after certain amount of inactivity. Thus, it is possible that our PALB policy willsolve the load-balancing and the capacity provisioning problem simultaneously. We againplan to address the capacity provisioning question via both theory and experimentation.
• Next, we shall address the question of which state a server should be in. In other words,how many servers should we have on vs. idle vs. sleeping, etc. In implementation, we willbe limited by the available sleep states our experimental setup servers are equipped with.However, we should be able to explore a range of possible sleep states via theory.
• Finally, time permitting, we plan to address the capacity provisioning question for the back-end servers. Thus, we want to know how many mamcache and/or database servers should wehave to best manage the tradeoff between power and performance, or response time.
5 Proposed time line
The thesis proposal outlines three future work projects: (i) Extend optimal power/server allocationto time-varying workloads, (ii) Analyze DELAYEDOFF policy, (iii) Dynamic power management
21

for multi-tier applications. I plan to complete my Ph.D. by the summer of 2012. My proposedresearch time line is as follows:
Nov’10-Jan’11
Finalize multi-tier applications’ experimental setup (Section 4.1).Work on PALB and capacity provisioning for middle-tier web servers (Section 4.1).Submit paper to USENIX ATC, deadline January 12.
Feb’11-April’11
Analyze DELAYEDOFF (Section 3.2.2).Analyze the proposed PALB policy, if not already done by Jan’11 (Section 4.1).Possibly submit paper to a theoretical conference or journal, such as QUESTA.
May’11-July’11{
Extend optimal power/server allocation work to time-varying workloads (Section 2.4).Possibly submit paper to a systems conference/workshop.
Aug’11-Dec’11
Work on server states for multi-tier applications (Section 4.1).Time permitting, work on capacity provisioning for back-end servers (Section 4.1).Possibly submit paper to Sigmetrics’12.Start job search.
Jan’12-March’12{
Tie up loose ends.Job search.
April’12-June’12{
Write thesis.Graduate!
References[1] IPMItool. See http://http://ipmitool.sourceforge.net.
[2] The Apache HTTP Server Project. See http://httpd.apache.org.
[3] The internet traffic archives: WorldCup98. Available athttp://ita.ee.lbl.gov/html/contrib/WorldCup.html.
[4] Lesswatts.org: Race to idle. http://www.lesswatts.org/projects/applications-power-management/race-to-idle.php.
[5] Tarek Abdelzaher, Yixin Diao, Joseph Hellerstein, Chenyang Lu, and Xiaoyun Zhu. Introduction tocontrol theory and its applications to computing systems. In Sigmetrics tutorial, 2008.
[6] U.S. Environmental Protection Agency. Epa report on server and data center energy efficiency. 2007.
[7] Mauro Andreolini, Michele Colajanni, and Ruggero Morselli. Performance study of dispatching algo-rithms in multi-tier web architectures. SIGMETRICS Perform. Eval. Rev., 30(2):10–20, 2002.
[8] National Electrical Contractors Association. Data centers - meeting today’s demand. 2007.
[9] Luiz Andre Barroso and Urs Holzle. The case for energy-proportional computing. Computer,40(12):33–37, 2007.
22

[10] Luiz Andre Barroso and Urs Holzle. The case for energy-proportional computing. IEEE Computer,40(12):33–37, 2007.
[11] Jeffrey S. Chase, Darrell C. Anderson, Prachi N. Thakar, and Amin M. Vahdat. Managing energy andserver resources in hosting centers. In In Proceedings of the Eighteenth ACM Symposium on OperatingSystems Principles (SOSP), pages 103–116, 2001.
[12] Gong Chen, Wenbo He, Jie Liu, Suman Nath, Leonidas Rigas, Lin Xiao, and Feng Zhao. Energy-aware server provisioning and load dispatching for connection-intensive internet services. In NSDI’08:Proceedings of the 5th USENIX Symposium on Networked Systems Design and Implementation, pages337–350, 2008.
[13] Intel Corporation. Serial ATA Staggered Spin-Up (White paper), September 2004.
[14] M. Elnozahy, M. Kistler, and R. Rajamony. Energy conservation policies for web servers. In USITS,2003.
[15] Xiaobo Fan, Wolf-Dietrich Weber, and Luiz Andre Barroso. Power provisioning for a warehouse-sizedcomputer. pages 13–23, 2007.
[16] Wes Felter, Karthick Rajamani, Tom Keller, and Cosmin Rusu. A performance-conserving approachfor reducing peak power consumption in server systems. In ICS ’05: Proceedings of the 19th annualInternational Conference on Supercomputing, pages 293–302, New York, NY, USA, 2005. ACM.
[17] Mark E. Femal and Vincent W. Freeh. Boosting Data Center Performance Through Non-Uniform PowerAllocation. In ICAC ’05: Proceedings of the Second International Conference on Automatic Computing,pages 250–261, Washington, DC, 2005.
[18] Brad Fitzpatrick. Distributed caching with memcached. Linux J., 2004(124):5, 2004.
[19] Anshul Gandhi, Varun Gupta, Mor Harchol-Balter, and Michael Kozuch. Optimality analysis of energy-performance trade-off for server farm management. In In Press: Performance Evaluation.
[20] Anshul Gandhi and Mor Harchol-Balter. M/G/k with Exponential Setup. Technical Report CMU-CS-09-166, Carnegie Mellon University, 2009.
[21] Anshul Gandhi, Mor Harchol-Balter, and Ivo Adan. Analysis of an m/m/k system with exponentialsetup times under staggered boot up. In Madrid Conference on Queueing Theory, 2010.
[22] Anshul Gandhi, Mor Harchol-Balter, and Ivo Adan. Decomposition results for an m/m/k with staggeredsetup. In MAMA, 2010.
[23] Anshul Gandhi, Mor Harchol-Balter, and Ivo Adan. Server farms with setup costs. In PerformanceEvaluation, volume 67, pages 1123–1138, 2010.
[24] Anshul Gandhi, Mor Harchol-Balter, Rajarshi Das, and Charles Lefurgy. Optimal power allocationin server farms. In SIGMETRICS ’09: Proceedings of the eleventh international joint conference onMeasurement and modeling of computer systems, pages 157–168, New York, NY, USA, 2009. ACM.
[25] Tibor Horvath and Kevin Skadron. Multi-mode energy management for multi-tier server clusters. InPACT ’08: Proceedings of the 17th international conference on Parallel architectures and compilationtechniques, 2008.
[26] Intel Corp. Intel Math Kernel Library 10.0 - LINPACK.http://www.intel.com/cd/software/products/asmo-na/eng/266857.htm, 2007.
[27] David Meisner, Brian T. Gold, and Thomas F. Wenisch. Powernap: eliminating server idle power. In AS-PLOS ’09: Proceeding of the 14th international conference on Architectural support for programminglanguages and operating systems, pages 205–216, New York, NY, USA, 2009. ACM.
[28] David Mosberger and Tai Jin. httperf—A Tool for Measuring Web Server Performance. ACM Sigmet-rics: Performance Evaluation Review, 26:31–37, 1998.
23
[29] Vivek Pandey, W. Jiang, Y. Zhou, and R. Bianchini. DMA-Aware Memory Energy Management. HPCA’06: The 12th International Symposium on High-Performance Computer Architecture, pages 133–144,11-15 Feb. 2006.
[30] Ramya Raghavendra, Parthasarathy Ranganathan, Vanish Talwar, Zhikui Wang, and Xiaoyun Zhu. No“Power” Struggles: Coordinated Multi-Level Power Management for the Data Center. In ASPLOS XIII:Proceedings of the 13th international conference on Architectural support for programming languagesand operating systems, pages 48–59, 2008.
[31] Mark W. Storer, Kevin M. Greenan, Ethan L. Miller, and Kaladhar Voruganti. Pergamum: replacingtape with energy efficient, reliable, disk-based archival storage. In FAST’08, pages 1–16, Berkeley, CA,USA, 2008. USENIX Association.
[32] Bhuvan Urgaonkar and Abhishek Chandra. Dynamic provisioning of multi-tier internet applications.In ICAC ’05: Proceedings of the Second International Conference on Automatic Computing, pages217–228, Washington, DC, USA, 2005.
[33] Bhuvan Urgaonkar, Giovanni Pacifici, Prashant Shenoy, Mike Spreitzer, and Asser Tantawi. An analyti-cal model for multi-tier internet services and its applications. In In Proc. of the ACM SIGMETRICS2005,pages 291–302, 2005.
[34] Peijian Wang, Yong Qi, Xue Liu, Ying Chen, and Xiao Zhong. Power management in heterogeneousmulti-tier web clusters. International Conference on Parallel Processing, pages 385–394, 2010.
[35] X Wang and M Chen. Cluster-level Feedback Power Control for Performance Optimization. 14th IEEEInternational Symposium on High-Performance Computer Architecture (HPCA 2008), February 2008.
[36] Xiaoying Wang, Zhihui Du, Yinong Chen, and Sanli Li. Virtualization-based autonomic resourcemanagement for multi-tier web applications in shared data center. Journal of Systems and Software,81(9):1591 – 1608, 2008.
[37] P.D. Welch. On a generalized M/G/1 queueing process in which the first customer of each busy periodreceives exceptional service. Operations Research, 12:736–752, 1964.
24