performance of a packed distillation column with induction
TRANSCRIPT

AN ABSTRACT OF THE THESIS OF
GARY LEE HUNDLEY for the M. S. in Chemical Engineering (Name) (Degree) (Major)
Date thesis is presented /9
Title PERFORMANCE OF A PACKED DISTILLATION COLUMN
WITH INDUCTION HEATED PACKING
Abstract approved Redacted for Privacy (Major professor)
An experimental packed distillation column was constructed
and data were taken to evaluate the effects of heating sections of the
column packing during the distillation operation. The experimental
column was packed with carbon Raschig rings and the heating was
accomplished using an induction coil. The carbon tetrachloride and
benzene system was studied.
Heating the packing did not increase the separation of the
components but it did allow a higher flow rate through the column
before flooding conditions developed. The effect of heating relative
to the efficiency of a packed column was opposite to the results ob-
tained in an earlier investigation. Reevaluation of the earlier publi-
cation indicated that the author's conclusions were based on inappro-
priate vapor flow rates,

PERFORMANCE OF A PACKED DISTILLATION COLUMN WITH INDUCTION HEATED PACKING
by
GARY LEE HUNDLEY
A THESIS
submitted to
OREGON STATE UNIVERSITY
in partial fulfillment of the requirements for the
degree of
MASTER OF SCIENCE
June 1967

APPROVED:
Redacted for Privacy Professor of Chemical Engineering
In Charge of Major
Redacted for Privacy
Heady Department of Chemical Engineering
Redacted for Privacy
Dean of Graduate School
Date thesis is presented / j/ /f "7é Typed by Donna L. Olson

ACKNOWLEDGMENT
The author wishes to express his appreciation to Dr. C. E.
Wicks for his help and suggestions during this investigation. A
thank you is extended to Professor J. S. Walton for the use of de-
partmental facilities and to Mr. William B. Johnson for his in-
valuable assistance in constructing the experimental equipment.
The author wishes to express his grateful appreciation to his
wife whose financial assistance made this work possible.

TABLE OF CONTENTS
Page
INTRODUCTION 1
EXPERIMENTAL EQUIPMENT 4
DESCRIPTION OF SYSTEM STUDIED 8
OPERATING PROCEDURE 13
ANALYTICAL PROCEDURE 16
RESULTS AND DISCUSSION 18
BIBLIOGRAPHY 22
APPENDICES 23
APPENDIX A EXPERIMENTAL DATA 23 APPENDIX B VAPOR- LIQUID EQUILIBRIUM DATA
BY FOWLER AND LIM (2) 24 APPENDIX C SAMPLE CALCULATIONS FOR
RUN 9 25

LIST OF FIGURES
Figure Page
1. Packed Distillation Tower and Associated Equipment 5
2. Vapor- Liquid Equilibrium for Benzene- Carbon Tetrachloride at 1 atm Pressure 10
3. Operating Line Location Relative to Equilibrium Curve 11
4. Plot Used to Calculate Number of Transfer Units 12
5. Number of Transfer Units vs. Vapor Flow Rate From Top of Column 19
6. Number of Transfer Units vs. Vapor Flow Rate Entering Column 20

INTRODUCTION
Distillation is one of the most common and important unit
operations in chemical engineering, finding widespread use in many
industries. The process of distillation is a method of separating the
components of a solution due to the differences in vapor pressure of
the constituents. This process depends upon the distribution of the
substances between gas and liquid phases, each phase having dif-
ferent composition.
In the operation of a distillation column, vapor leaves the re-
boiler at the base of the column, travels up through the column and
passes out the top where it is condensed. Part of the condensate is
returned to the top of the column as liquid reflux. As the vapor
passes through the column it contacts the liquid phase travelling
downward. Some of the more volatile components of the liquid phase
are vaporized and enter the gas phase and some of the less volatile
components of the gas phase are condensed in the liquid phase. This
mass transfer takes place throughout the column and produces a
separation of the components. In order to promote contact between
the two phases so that mass transfer may occur, the tower is pro-
vided with trays to disperse the gas phase or with packing material
to disperse the liquid phase. Both types of towers are in common
use in industry. In the case of random packing almost any material
2
will suffice, provided it is inert to the components being separated
and provided it offers a large surface area with a minimum of
volume. Most packing materials are specially manufactured for
this purpose. A common type of packing material is hollow cylinders
called Raschig rings.
Attempts to improve the operating efficiency of packed distilla-
tion columns have been mainly directed toward improved packing
materials and improving the liquid distribution in the column. In
the case of a system in which an appreciable resistance to mass
transfer lies in the liquid phase, introducing turbulence into the
liquid phase should promote mixing and reduce the concentration
gradient in the liquid layer, thereby improving the mass transfer
and increasing the efficiency of the column. One method for pro-
moting this turbulence is to increase the flow rates through the
column. However this is not always practical, particularly in the
case of a column already operating at flow rates near the loading or
flooding points.
Danckwerts et al. (1) describe a phenomenon in distillation
called the thermal distillation effect. These authors propose that
the efficiency of a distillation column can be improved by boiling
the liquid phase on the surface of the packing. This mixes the
liquid phase, reducing its concentration gradient. The boiling also
increases the interfacial area between the gas and liquid phases.

3
However, the boiling of the liquid can also have a reverse effect on
the column efficiency. The slight rise in liquid temperature lessens
the chances for the contacting vapor to condense into the liquid phase
and the heating vaporizes more of the less volatile component.
In a recent study by Somer (3), an experimental column was
operated with electrically heated packing to evaluate the effects of
boiling the liquid phase in the column. Somer applied electrical
energy to the entire length of carbon packing material in his column
and boiled the liquid phase throughout the column. His results in-
dicated an increase in column efficiency. The improvement rose
sharply as the flow rates approached flooding velocities.
This study was undertaken to evaluate the effect of heating
only in the region of the column where flooding first started to occur.
By using induction heating, the specific area of the tower in which
flooding occurs could be heated. This should permit a better control
and observation of this phenomenon.
4
EXPERIMENTAL EQUIPMENT
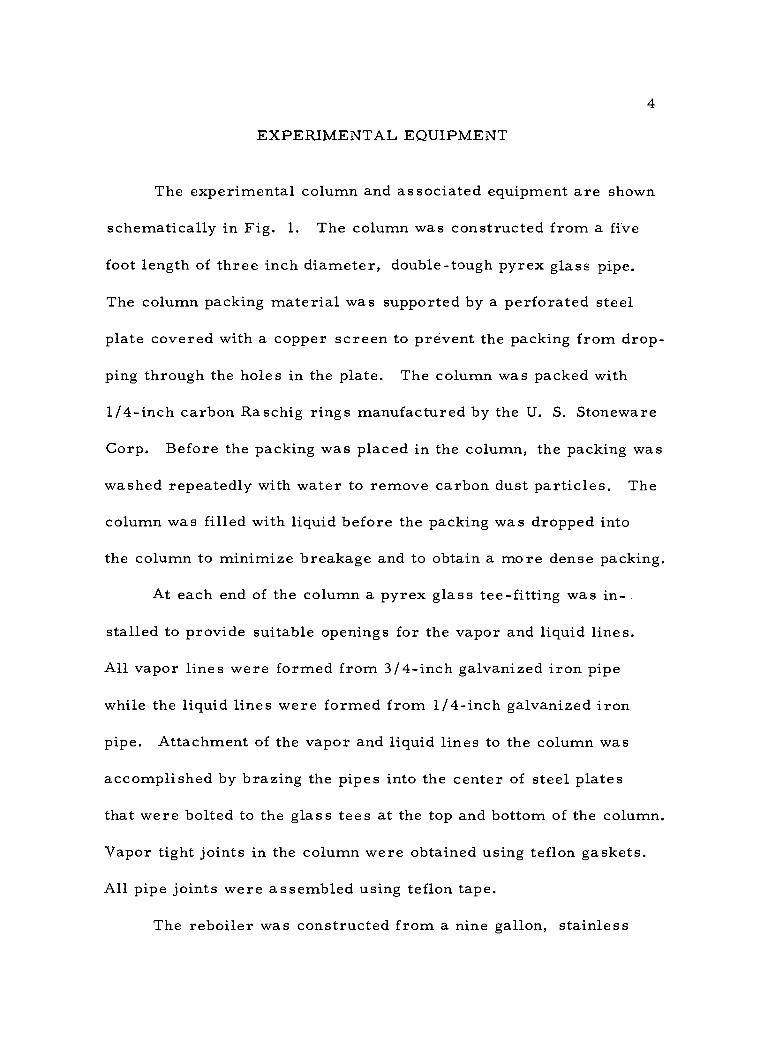
The experimental column and associated equipment are shown
schematically in Fig. 1. The column was constructed from a five
foot length of three inch diameter, double -tough pyrex glass pipe.
The column packing material was supported by a perforated steel
plate covered with a copper screen to prevent the packing from drop-
ping through the holes in the plate. The column was packed with
1/4 -inch carbon Raschig rings manufactured by the U. S. Stoneware
Corp. Before the packing was placed in the column, the packing was
washed repeatedly with water to remove carbon dust particles. The
column was filled with liquid before the packing was dropped into
the column to minimize breakage and to obtain a more dense packing.
At each end of the column a pyrex glass tee - fitting was in-
stalled to provide suitable openings for the vapor and liquid lines.
All vapor lines were formed from 3/4 -inch galvanized iron pipe
while the liquid lines were formed from 1/4 -inch galvanized iron
pipe. Attachment of the vapor and liquid lines to the column was
accomplished by brazing the pipes into the center of steel plates
that were bolted to the glass tees at the top and bottom of the column.
Vapor tight joints in the column were obtained using teflon gaskets.
All pipe joints were assembled using teflon tape.
The reboiler was constructed from a nine gallon, stainless

T/C
Relief valve
Condenser
Cooling water inlet
Cooling water to drain
Packing
Column
Packing Support_
Pressure Gage
Liquid I
level gage 1
Reboiler sample line
T/C
Power stat
-Le-Heated Section
of pipe
115V A. C.
i Reflux sample
line
Rotameter
Centrifugal pump
Immersion heater s
Reboiler
5
Surge tank
1220V A. C.
i
Variac
Figure 1. Packed Distillation Tower and Associated Equipment
-
-O
¡' -+J 1 f (I f
I
I
C3

6
steel tank in which two, 2000 -watt copper immersion heaters were
installed. These heaters were controlled by a seven KVA Variac
operated at 220 volt line voltage. The power into the reboiler was
measured with a Welch wattmeter with a 5000 watt capacity. A
pressure gage, a sight glass liquid level indicator, and a valve for
withdrawing a liquid sample were also installed in the reboiler.
The condenser was a copper shell- and -tube heat exchanger
which used two tube passes and a single shell pass. Water was used
as the cooling medium in the shell side. The condensate from the
condenser flowed by gravity down into a small surge tank that was
fitted with a sight gage liquid -level indicator. From the surge tank,
the condensate flowed into an Eastern Industries centrifugal pump
which was driven by a 1 /25 -HP motor that was controlled by a one
KVA Powerstat. The condensate was pumped through a rotameter
to measure the flow and back into the top of the column. The rota -
meter was a Predictability Flowmeter type 36- 541 -32 manufactured
by the Manostat Corp. The flowmeter used a glass float giving it a
maximum capacity of 805 ml per minute of water. After the con-
densate passed through the flowmeter, it entered a three foot long
section of 1/2 -inch brass pipe where it was heated to the temperature
of the vapor leaving the top of the column. Nichrome wire ribbon,
wound around a thin layer of asbestos insulation covering the brass
pipe, provided the required energy. Several layers of asbestos

7
paper and one inch of fiberglass insulation were placed over the
Nichrome wire. The heating section had a power rating of 300 watts
at 115 volts. The electrical power to the heater wire was controlled
by a one KVA Powerstat. A needle valve to control the rate of flow
through the rotameter and a valve to withdraw a sample of liquid
were installed in the reflux line between the rotameter and heated
pipe.
The temperature of the vapor leaving the top of the column and
the temperature of the reflux entering the column was measured by
iron -constantan thermocouples placed in the flowing streams.
The column was not insulated in order to observe the flow in-
side the column, particularly in the area of the heated section of
packing.
The packing was heated by means of an induction coil. The
induction heating was performed using a 30 KW Lepel converter
connected to a heating coil of 1/4 -inch copper tubing.
No provision was made for measuring the liquid and vapor
temperatures in the heated section of packing as a thermocouple or
thermometer would be heated by induction and would indicate a higher
temperature than the actual temperature.

8
DESCRIPTION OF SYSTEM STUDIED
The binary system of carbon tetrachloride- benzene was chosen
for this investigation. This system was chosen because the vapor -
liquid equilibrium curve is very close and parallel to the 45 degree
line in the experimental range, thus requiring a large number of
transfer units for a small enrichment. Both components are non-
polar and have an appreciable difference in their index of refraction.
The difference in the index of refraction provided a convenient,
accurate method of determining the composition of liquid samples.
The liquids were also relatively low boiling and non -corrosive,
thereby enabling ordinary materials to be used in the construction of
the equipment without worrying about corrosion or high temperatures.
Disadvantages to the system are that the components are poisonous
and are powerful solvents requiring care to be exercised in choosing
suitable gasket materials.
The vapor - liquid equilibrium data at atmospheric pressure was
obtained from the results of Fowler and Lim (2). The data are pre-
sented in Appendix B and are shown for the experimental range in
Figure 2. The data was tested for thermodynamic consistency by
the composition -resolution method of testing vapor - liquid equilibrium
data of Van Ness (5) and was found to be consistent.
The vapor - liquid equilibrium data was necessary to determine

9
the number of transfer units in the column. The number of transfer d units was calculated from the equation, N =
y2 -sue . This tog Y Y° -Y
was evaluated by plotting the function, 1 / (y -y) , vs. y and inte-
grating the area under the curve between the limits of the reflux
composition, y2, and the vapor composition, yl, which is in equili-
brium with the liquid composition, x, in the reboiler. The term,
(y *-y), is the vertical distance between the equilibrium line and the
operating line at constant values of liquid composition. The term,
y, is the vapor composition on the operating line corresponding to
the values of liquid composition. This is illustrated in Figure 3 for
a general case that includes a feed stream. In this experimental
work, the operating line was the 45 degree line since the column
operated at total reflux with no feed streams. A plot of 1 /(y * -y)
vs. y is shown in Figure 4. This calculation procedure is described
in more detail by Treybal (4). The chemicals used in the apparatus
were of reagent grade purity. The benzene was manufactured by
the J. T. Baker Chemical Co. and the carbon tetrachloride was
manufactured by the Matheson Co.
J

0. 9
0. 8
o
r_ia 0.7 U U
o .'.,
u cd
w 0. 6 a)
o
n
', 0. 5
0 4 0. 4 0. 5 0 6 0.7 0. 8
X = mole fraction CC14 in liquid
Figure 2. Vapor- Liquid Equilibrium for Benzene - Carbon Tetra- chloride at 1 atm Pressure
10
0. 9

11
Y^
feed composition
x 2
Figure 3. Operating Line Location Relative to Equilibrium Curve
(y'' - y)
y' 0. vs x
operating lines, y vs x
x w

r-I
90
80
70
60-
50
40 0. 5 0. 6
Y
0.7 0.8
Figure 4. Plot Used to Calculate Number of Transfer Units
12
E I 1

13
OPERATING PROCEDURE
Before any data were taken or before the reagent grade chemi-
cals were placed into the system, the equipment was operated for
two days with two different batches of technical grade chemicals to
remove any impurities from the system. The equipment was then
cleaned and the reagent grade chemicals were placed in the apparatus.
Approximately four gallons each of carbon tetrachloride and benzene
were used in the system. The chemicals were replenished from
time to time as the withdrawl of samples would deplete the amount
of reagents in the reboiler.
Power to the reboiler heaters was adjusted by means of the
Variac until the desired gas flow rate through the column was ob-
tained. The cooling water to the condenser and the power to the
heated section of pipe were adjusted until the reflux into the column
was at the same temperature as the vapor leaving the top of the
tower. The column was operated at total reflux; all of the vapor
leaving the top of the column was returned as liquid reflux. The
flow through the flowmeter was adjusted by means of the needle
valve in the reflux line and by varying the power to the pump motor
until the level in the surge tank held a constant value as indicated by
the sight gage. The thermocouples used an ice bath reference
junction and were connected to a Leeds and Northrup potentiometer

14
Model 8662 to measure the generated EMF.
The column was operated approximately five hours before
samples of the reflux and liquid in the reboiler were collected in
flasks and analyzed for their composition. Two samples were taken
an hour apart and had to agree within one percent before conditions
were adjusted for a new run. Analysis was accomplished using a
Bausch and Lomb Precision Refractometer of the modified Abbe
type. The temperature of the refractometer prisms was maintained
at a constant value of 25oC by means of a constant temperature bath.
A calibration chart was prepared by measuring the index of refrac-
tion of samples of known composition.
A 100 ml sample of the reflux was also collected and weighed
on an analytical balance to determine the density. The density was
necessary to correct the flowmeter reading. The flowmeter was
calibrated with water since the density of the reflux was not known
before the run. Viscosity corrections were also applied but were
found to be insignificant.
The induction converter was operated at its lowest power
step of approximately 12 KW and the geometry of the copper induc-
tion coil was varied by changing the diameter and number of turns to
provide enough heat to the packing to cause the liquid on the surface
of the packing to boil but not too much heat so that the liquid on the
packing would be completely boiled off. After the proper geometry

15
of the coil was determined to provide the desired amount of heat, it
was not varied during the majority of the runs, nor was the position
of the coil varied after the region of the column involving flooding
was determined. Two runs were performed with the induction con-
verter at a power setting of two and one run was performed using a
larger coil at a power setting of one.
A series of runs were obtained by varying the gas flow rate
through the column without induction heating. Then a series of
runs with induction heating was obtained over the same range of gas
flow rates as the previous runs. The number of transfer units was
computed for each run and a comparison was made between the runs
with and without induction heating on the packing.
16
ANALYTICAL PROCEDURE
Samples of the reflux and reboiler liquid were taken and ana-
lyzed for composition with the refractometer. A 100 ml sample of
the reflux was taken in the volumetric flask and weighed to deter-
mine reflux density. Additional data taken was reboiler pressure,
reboiler heater Variac setting, and reflux and top vapor temperature.
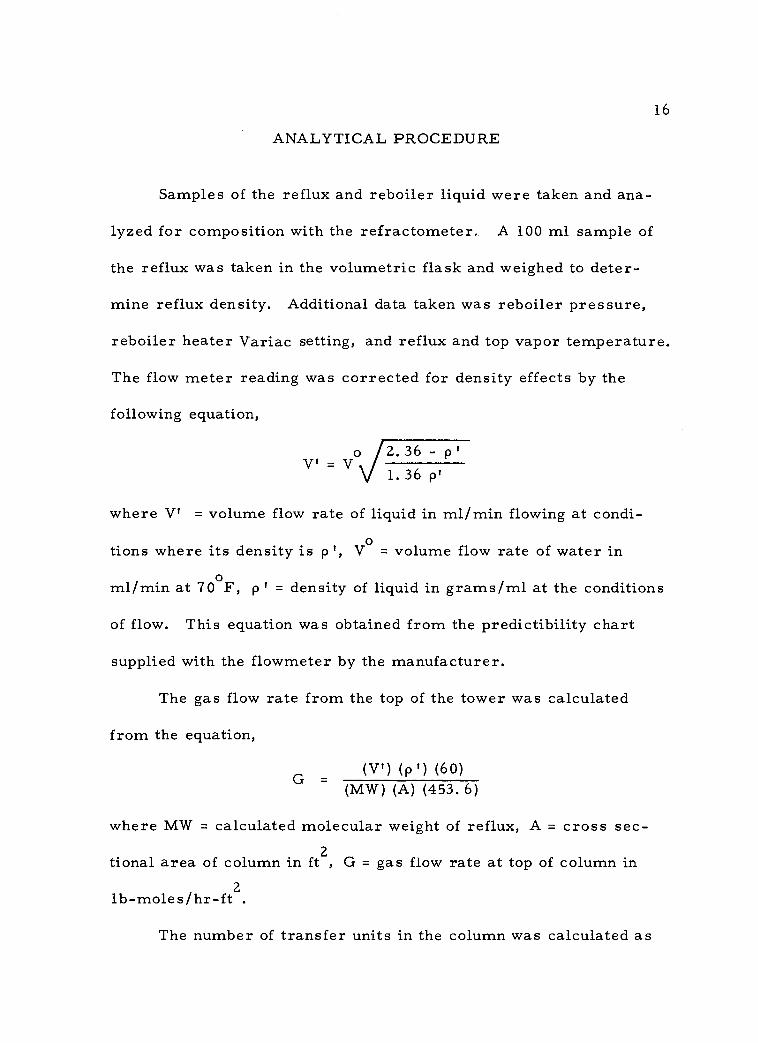
The flow meter reading was corrected for density effects by the
following equation,
V'=V 0 2. 36 - p' 1.36 p'
where V' = volume flow rate of liquid in ml /min flowing at condi-
0 tions where its density is p', V = volume flow rate of water in
ml /min at 70 F, 0 p' = density of liquid in grams /ml at the conditions
of flow. This equation was obtained from the predictibility chart
supplied with the flowmeter by the manufacturer.
The gas flow rate from the top of the tower was calculated
from the equation,
G = (V') (p') (60)
(MW) (A) (453.6)
where MW = calculated molecular weight of reflux, A = cross sec-
tional area of column in ft t
, G = gas flow rate at top of column in
lb- moles /hr -ft 2 .
The number of transfer units in the column was calculated as

17
previously described knowing the top and bottom compositions in the
column.
In addition to determining the vapor flow rate at the top of the
column, the vapor flow rate entering the column was calculated.
This was calculated knowing the power to the reboiler heaters and
the latent heat of vaporization of the liquid in the reboiler. No heat
losses were assumed in this calculation. The calculated vapor flow
rate entering the column should be somewhat greater than the actual
flow rate because of the heat losses from the reboiler. Also, the
vapor flow rate from the top of the column is lower than the actual
flow rate through the column because some vapor is condensed in the
column due to heat losses from the column.
The vapor flow rate from the reboiler was calculated from the
equation,
G o (3.313 Btu /(hr)(watts)(p)
(X)(A)
where P = power in watts into reboiler, X = molar heat of vaporiza-
tion of reboiler liquid in Btu /lb -mole, A = cross sectional area of
column in ft2, Go = vapor flow rate entering the column in 2
lb- moles /hr -ft . A sample calculation is shown in Appendix C.
It is believed that the largest cause of the data scatter is due
to inaccuracies in the reflux flow measurement.

18
RESULTS AND DISCUSSION
The results of this study are presented in Figures 5 and 6 and
in Appendix A. Figure 5 shows the number of transfer units in the
column as a function of the vapor flow rate from the top of the
column. This curve shows that the number of transfer units with
induction heating is less than the number obtained without induction
heating at the same vapor flow rate from the top of the column. A
few runs were made at a higher heating rate and one at a lower heat-
ing rate but these did not appear to be significantly different from the
majority of the runs. The results shown in this figure appears to be
the opposite of the results of Somer (3). However, Somer presented
his data in a misleading manner in that his vapor velocity was the
vapor velocity leaving the reboiler. Since the heating of the packing
generates vapor in the column, the vapor flow rate from the reboiler
is not the true vapor velocity through the column. The vapor flowing
from the top of the column is representative of the actual vapor flow
within the packing; this is the flow rate used to define the operating
line and, in turn, the transfer units within the packed column.
The results of this study are also presented in Figure 6 as a
function of the vapor flow rate from the reboiler. When the data is
presented in this manner the results are similar to those obtained by
Somer, indicating that the heating increases the number of transfer

15
14
13
12
11
10
b0 o
z-ip 9
8
7
6
5
O
l
o No Induction Heating
O Induction Heating - Power Step 1
Induction Heating - Power Step 2
OInduction Heating - Large Coil
0 1 3 4 5 6 7
G, lb- moles /hr -ft2
19
Figure 5. Number of Transfer Units vs. Vapor Flow Rate From Top of Column
2 I

20
z
15 -
14
13
12
11
ó 10
9
8
7
6
O No Induction Heating
O Induction Heating Power Step 1
Induction Heating Power Step 2
O Induction Heating Large Coil
5 1 I I I I I
4 5 6 7 8 9 10 11
Go - lb- moles /hr -ft2
Figure 6. Number of Transfer Units vs. Vapor Flow Rate Entering Column
-p
0
I
-
-
-
-
-
-
-
-
-
-
-
0

21
units at a given vapor flow rate, Since this is a false vapor flow rate,
this conclusion is not representative of what actually takes place.
The decrease in number of transfer units with heated packing
is believed to be the result of the heated section acting as a partial
reboiler. The total height of packing available for mass transfer
was reduced; accordingly, the effectiveness of the entire column
was reduced,
One beneficial effect that was observed in the operation of the
column with heated packing was that the column could be operated at
higher flow rates before flooding started to occur. The experimental
column would start to load and flood at the base of the packing. The
liquid was held up at the packing support. As the flow rates in-
creased, the column would begin to fill with liquid and the pressure
drop would increase through the column. However, when heat was
applied to the packing, the flow rates increased in the column and the
number of transfer units increased but the column did not start to
flood, All the increased liquid flow did not have to pass out of the
column and therefore was not held up at the support.
In conclusion, it appears that the heated packing does not in-
crease the separation of the components but it will allow a higher
flow rate through the column before flooding will occur. Further
study is necessary to evaluate these effects more fully.

22
BIBLIOGRAPHY
1. Danckwerts, P. V., H. Sawistowski and W. Smith. The effects of heat transfer and interfacial tension in distillation. In: Pro- ceedings of the International Symposium on Distillation, Brighton, England, 1960. London, The Institution of Chemical Engineers, 1960. p. 7 -12.
2. Fowler, R. T. and S. C. Lim. Azeotropism in binary solu- tions: carbon tetrachloride- benzene system. Journal of Applied Chemistry 6:74 -78. Feb. , 1956.
3. Somer, Tarik G. Performance of a packed distillation column with electrically heated packing. Journal of the American Institute of Chemical Engineers 11:840 -845. 1965.
4. Treybal, Robert E. Mass transfer operations. New York, McGraw -Hill, 1955. 666 p.
5. Van Ness, H. C. Classical thermodynamics of non - electrolyte solutions. New York, Pergamon Press, 1964. 166 p.

APPENDICES

23
APPENDIX A
EXPERIMENTAL DATA
G is the measured vapor flow rate from the top of the column,
lb- moles /hr -ft 2 ; G is the calculated vapor flow rate entering the
o
column, lb- moles /hr -ft2.
Run No.
No induction heating
y2 y1 G Go Ntog
1 0.697 0.485 3.59 7.90 12.3 2 0.699 0.506 2.81 7.17 11.6 3 0.716 0.500 4.64 8.56 13.3 4 0.714 0.505 4.02 8.14 12.8 5 0.674 0.502 2.03 6.37 9.76 6 0.715 0.460 4.88 9.20 14.9 9 0. 707 0. 505 3. 50 7. 63 12. 3
11 0.697 0.498 2.83 6.60 11.8 14 0.723 0.500 4.51 8.78 13.9 16 0.692 0.512 2.01 6.38 10.7
Induction heating power step 1
7 -I 0.727 0.512 5.66 7.91 13.7 10 -I 0.712 0.504 4.80 6.65 12.8 12 -I 0.707 0.513 4.31 6.65 12.0 13 -I 0.705 0.510 3.70 6.11 11.9 15 -I 0.696 0.515 3.37 5.56 10.9 17 -I 0. 712 0. 510 4. 12 6. 11 12. 5
Induction heating - power step 2
18 -I2 0.710 0.511 4.02 6.22 12.3 19 -I2 0.720 0.507 4.65 6.95 13.3
Induction heating - large coil
20 -I 0.720 0.507 4.04 6.96 12.8
-

24
APPENDIX B
VAPOR- LIQUID EQUILIBRIUM DATA BY FOWLER AND LIM (2)
Isobaric conditions at 760 mm. Hg
x 1
mole fraction CC1 4 in liquid phase
yl mole fraction CC14
in vapor phase
0. 0000 0. 0000 0. 0883 0. 1056 0. 2043 0. 2308 0. 3288 0. 3577 0. 4183 0. 4439 0. 5207 0. 5425 0. 6231 0. 6397 0.7284 0. 7399 0. 8196 0. 8254 0. 9092 0. 9119 0. 9579 0. 9587 1. 0000 1. 0000
25
APPENDIX C
SAMPLE CALCULATIONS FOR RUN 9
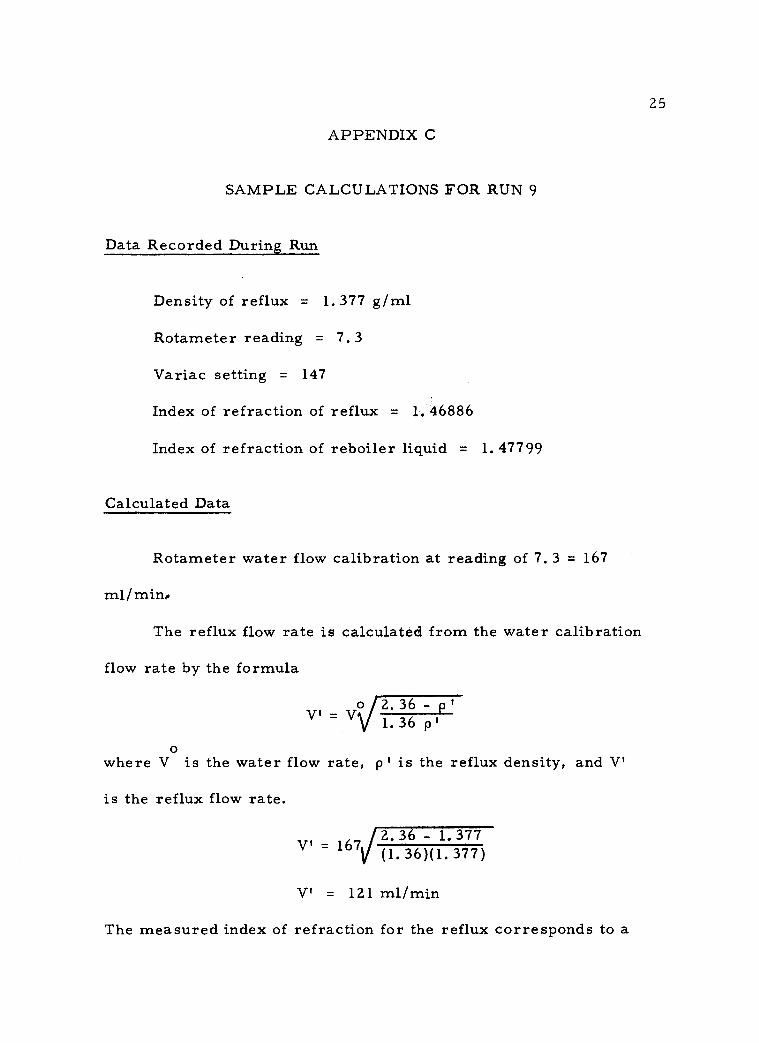
Data Recorded During Run
Density of reflux = 1. 377 g /ml
Rotameter reading = 7.3
Variac setting = 147
Index of refraction of reflux = 1. 46886
Index of refraction of reboiler liquid = 1. 47799
Calculated Data
Rotameter water flow calibration at reading of 7. 3 = 167
ml /min,
The reflux flow rate is calculated from the water calibration
flow rate by the formula
V' = 0 2. 36 - p
1.36 p' o
where V is the water flow rate, p' is the reflux density, and V'
is the reflux flow rate.
V' = 167 2.36 - 1.377 (1. 36)(1. 377)
V' = 121 ml/min
The measured index of refraction for the reflux corresponds to a

26
CC14 mole fraction, y2, of 0. 707 and the reboiler liquid index of
refraction corresponds to a CC14 mole fraction, xw, of 0.481.
From the vapor - liquid equilibrium data, the composition of x cor- es
responds to an equilibrium vapor composition, y , of 0. 505. 1
The curve in Figure 4 is integrated graphically between the
limits of y and y to determine the number of transfer units. The 2
number of transfer units was determined to be 12. 3.
The reflux mass flow rate is calculated from the equation
G' = V' p
G' = (121)(1.377)
= 165 g /min
= 21.8 lb /hr
The molecular weight of the reflux was calculated from the
equation,
MW = (153. 87)(y2) + (78. 11)(1 - y2)
MW = 131.4
The vapor flow rate from the top of the tower was calculated
from the formula,
G = ' G'
(MW)(A)
where A = cross sectional area of column, ft2.
G = (131. 4)(0. 048)
21. 8
2 G = 3. 50 lb- moles /hr -ft
1
27
The variac setting of 147 corresponds to a power input to the
reboiler heaters of 1400 watts. The heat of vaporization of the re-
boiler liquid was calculated by the equation
mix = (12, 854)(x
w ) + (13, 236)(1 - x )
w
X = 13, 043 Btu /lb -mole mix The vapor flow rate entering the column was calculated from
the formula,
G o (3. 414 Btu /watt- hr)(P)
where P is power input, watts.
G° - (3. 414)(1400) (13, 043)(0. 048)
o 2 G = 7. 63 lb- moles /hr -ft
(X)(A)