performance of sealed curtain wall spandrel panels that ... postole.pdf · curtain wall systems...
TRANSCRIPT

1
This paper is prepared for publication in the Journal of Building Physics and a pre-print sent for review is
enclosed to the proceedings of the BEST 4 conference.
PERFORMANCE OF SEALED CURTAIN WALL SPANDREL PANELS THAT DIRECT SUNLIGHT DEEP INTO MULTI-STORY BUILDINGS
Radu Postole1, Patrick Roppel2, Neil Norris3, Kasra Bigdeli4
ABSTRACT
A novel solution to overcome problems associated with the use of excessive window areas and shallow floor plates for daylighting buildings is to use active sunlight tracking systems to deliver controlled sunlight to areas that are inaccessible by conventional methods. This technology is commercially available to designers with minimal limitations to building orientation and form.
The technology tracks the sun at the top of the building with an array of motorized mirrors and redirects a stationary beam of sunlight to concentrating optics located in sunshades and spandrel panels on each floor of the building. The concentrated beam of sunlight from the spandrel is distributed through the building using hybrid light pipe technology and fixtures.
This paper addresses the challenges of integrating an optical system into the building envelope, including limitations on insulation thickness, requirement for clear glass to the exterior and interior of the spandrel, and controlling dust and moisture within the spandrel to maintain the effectiveness of the optics. By means of analysis, testing, and validation, this system is compared with conventional curtain wall spandrels for controlling heat, air, and moisture.
Keywords: daylighting, building envelope, curtain wall, desiccant, thermal analysis
INTRODUCTION
According to the United States Department of Energy, in 2008 commercial buildings consumed 18.4% of the total primary energy demand. Out of this, nearly 26% of the energy was used for lighting (D&R International 2011). While slowly decreasing, there is still a significant amount of energy consumed in commercial buildings for lighting. Using daylighting as a solution has been shown to significantly increase lighting quality and occupant comfort, however, traditional daylighting methods have several limitations (Boyce 2003). These factors provide an opportunity to develop and manufacture new daylighting systems and methods that compete with conventional methods.
This paper introduces a non-traditional daylighting system; one that includes active tracking of the sun, concentration of sunlight, and distribution through hybrid light pipe fixtures deep within the building’s core. The system is designed primarily for office buildings because offices are often occupied during the daytime and have large floor areas that are not fully accessible to daylight. While striving for improved energy efficiency and occupant comfort in buildings, new technologies can often introduce new challenges for designers. Detailed design review,
1 Radu Postole, Building Science Consultant, Morrison Hershfield, Burnaby, BC 2 Patrick J, Roppel, Building Science Specialist, Morrison Hershfield, Burnaby, BC 3 Neil Norris, Building Science Consultant, Morrison Hershfield, Burnaby, BC 4 Kasra Bigdeli, Mechanical Engineer, SunCentral Inc, Richmond, BC

2
testing, and monitoring is required to reduce the uncertainty in the long-term performance of new products for the construction industry and facilitate earlier adoption.
This paper focuses on how the challenges of integrating this new technology into common curtain wall systems were met through design, testing, verification, and long term monitoring. The challenges include physical integration within curtain wall spandrels, meeting thermal performance requirements, and controlling heat, air, and moisture transfer in the spandrel.
A NEW APPROACH TO DAYLIGHTING Traditional daylighting methods are generally limited to the perimeter and top floors of buildings. The active daylighting system examined in this paper tracks the sun to reflect and concentrate sunlight, allowing it to be distributed deep within the building. The system operates on direct sunlight and only transmits a small fraction of diffuse daylight into the building. The system uses an array of motorized mirrors, similar to a venetian blind, to track the sun on two axes, redirecting a parallel beam of sunlight down to mirrors encased in a sunshade. The curved mirrors in the sunshade concentrate the sunlight and reflect it to two stationary mirrors integrated within the spandrel panel. The spandrel panel focuses and further concentrates the beam of light and channels it through a small (75 mm x 200 mm) sealed output window at the backpan into a highly reflective hybrid light pipe. This light pipe transports the light deep within the building, distributing it evenly and integrating LED lighting for cloudy periods or at night (see Figure 1). This approach requires the integration of canopy structures, sunshades, and sealed spandrel panels into the building.
FIGURE 1: Active daylighting system showing the integrated components that collect and distribute sunlight deep into multi-story buildings. Image courtesy: SunCentral Inc.

3
CHALLENGES AND SOLUTIONS FOR BUILDING ENVELOPE INTEGRATION
The daylighting technology analyzed in this paper is designed for integration into commercial curtain wall systems, as curtain wall facades represent a large fraction of the commercial market. To deliver daylight deep into buildings, the daylighting technology relies on sensitive optics and components that must be pre-aligned by the manufacturer and housed in an enclosure to protect them from dust and moisture. The Optics Spandrel Panel (OSP) of this system forms an integral part of the building façade and functions to control heat, air, and moisture transfer between the indoor and outdoor environment. Therefore, the integration of the optics into the spandrel section requires a modular design and fabrication in a controlled environment.
Based on these constraints, the OSP module is designed to be installed into conventional curtain wall systems by either the curtain wall manufacturer or the glazing contractor similar to insulated glazing units (IGUs). The following challenges are faced by this design approach:
- Due to the increased depth occupied by the mirrors in the OSP, the depth of the panel is substantially larger than IGUs. This results in significantly more air volume than an IGU, requiring venting of the air space to prevent large temperature-induced pressure changes.
- With venting, moisture and dirt from the exterior air must be controlled as they are detrimental to the functionality of the optical components. The OSP also requires a clear front pane of glass to allow sunlight to enter so it cannot be opacified similar to common spandrel glass.
- The space required for the optical elements results in limited space for thermal insulation. High performance thin insulation is required for this application to provide insulation levels that are comparable to common spandrel sections.
The OSP is designed to meet these requirements, make adoption simpler, and help comply with energy codes and standards like ASHRAE 90.1. Most glazing spandrels with insulated backpans are opaque elements that generally do not meet the prescriptive insulation values or effective U-values for cold climates. A common approach is to add “continuous” insulation5 inboard of metal-pans in order to keep below the maximum prescriptive thermal transmittance requirements for steel-framed walls. However, this approach often yields spandrel section U-values that do not meet the requirements and can even result in an unacceptable risk of condensation for some applications (Morrison Hershfield 2011).
Since the prescriptive path is generally not used for buildings utilizing spandrel panels, the thermal performance of the OSP is assessed to meet or surpass the thermal performance of spandrel panels used in common practice.
5 The insulation is generally continuous except at floor slabs, anchors, and at the transition to the vision areas

4
Physical Integration into Unitized Curtain Wall
Metal backpans are commonly utilized as part of the air and moisture barrier of curtain wall spandrel sections. Weep holes are provided to vent the air space behind the front glass to the outdoors and create a means for drainage of condensation. Insulation is installed tight to the backpan to reduce convective heat flows around the insulation. The backpan is also commonly used as a stiff backing for insulation and a smoke seal at concrete slabs to provide fire separation between floors. All these functions must be provided by the OSP as well. Figure 2 shows how a spandrel panel is commonly integrated in unitized curtain wall (glass fascia is visible in blue, insulation in yellow, backpan and steel stud wall in gray).
The OSP analyzed in this paper is designed to be integrated into a four-sided structural silicone unitized curtain system that can be delivered to site with the unit pre-installed into the curtain wall system. The OSP can also be installed on-site for stick-built curtain wall applications (see Figure 3). The OSP maintains the air and moisture barrier continuity to the mullions via silicone sealant gaskets and glazing tape similar to common four sided structural silicone glazing. The metal backpan provides the same level of floor separation as common practice. Insulation is also provided inside the enclosure secured to the backpan.
FIGURE 3: Optical panel integrated within standard spandrel area of curtain wall
To integrate the OSP with a standard 25 mm (1 in.) glazing pocket similar to common IGUs, a z-frame extrusion is used to provide a front flange for a glazing spacer and front pane of glass, and a back flange that supports the backpan. This allows for roughly 115 mm (4.5 in.) of space between the backpan and the front glass for optics and insulation in the common 6” mullion systems targeted by the manufacturer. The output window at the back of the spandrel is sealed with a clear pane of glass, allowing transmission of concentrated sunlight into the light pipe. The
FIGURE 2: Typical unitized curtain wall spandrel with insulated metal backpan

5
light pipe fixture is aligned to this output window and distributes the concentrated sunlight deep into the building (See Figure 4).
FIGURE 4: OSP integration with into curtain wall at slab (mirrors not shown)
Thermal Performance The thermal performance of the OSP is compared to common practice for both thermal transmittance and risk of condensation. An objective of the analysis is to demonstrate that the thermal performance is not compromised by this design approach and is at least as adequate as common practice.
Detailed 3D thermal analysis of curtain wall assemblies in the ASHRAE 1365-RP study (Morrison Hershfield 2011) and the Thermal Bridging Guide (Morrison Hershfield 2014) has shown that increasing insulation levels in the spandrel backpan, even if there is sufficient space available, has diminishing returns as a result of the thermal bridges created by the aluminum framing (see Figure 5). Insulating inboard of the metal back pan, within the stud wall cavity, is possible but was not explored in this evaluation.
Since the optical elements within the OSP occupy approximately 90 mm (3.5 in.) of the depth, this results in only 25 mm (1 in.) of space available for insulation. Considering that common spandrels fully insulated with semi-rigid insulation require roughly 100 mm (4 in.) to reach a nominal resistance of R-16.8, a highly insulating material is needed in addition to methods that
FIGURE 5: Diminishing Rate of Return of Insulation Levels in Curtain Wall Spandrels
6
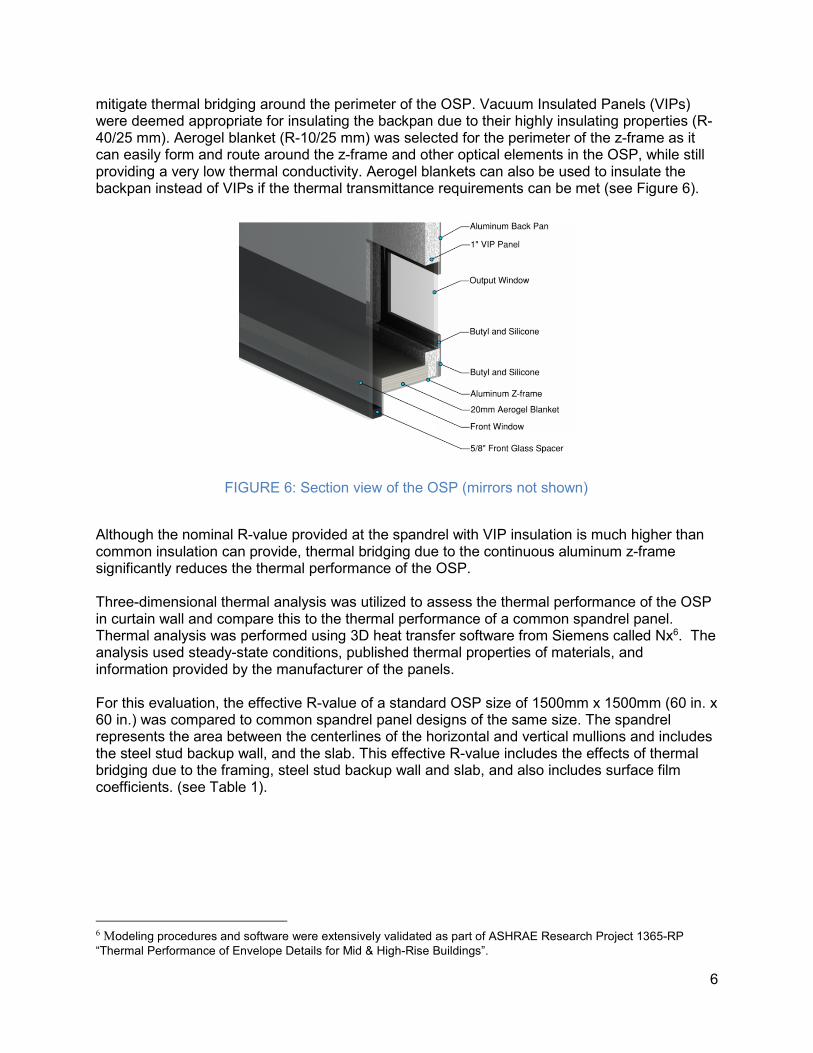
mitigate thermal bridging around the perimeter of the OSP. Vacuum Insulated Panels (VIPs) were deemed appropriate for insulating the backpan due to their highly insulating properties (R-40/25 mm). Aerogel blanket (R-10/25 mm) was selected for the perimeter of the z-frame as it can easily form and route around the z-frame and other optical elements in the OSP, while still providing a very low thermal conductivity. Aerogel blankets can also be used to insulate the backpan instead of VIPs if the thermal transmittance requirements can be met (see Figure 6).
Although the nominal R-value provided at the spandrel with VIP insulation is much higher than common insulation can provide, thermal bridging due to the continuous aluminum z-frame significantly reduces the thermal performance of the OSP. Three-dimensional thermal analysis was utilized to assess the thermal performance of the OSP in curtain wall and compare this to the thermal performance of a common spandrel panel. Thermal analysis was performed using 3D heat transfer software from Siemens called Nx6. The analysis used steady-state conditions, published thermal properties of materials, and information provided by the manufacturer of the panels. For this evaluation, the effective R-value of a standard OSP size of 1500mm x 1500mm (60 in. x 60 in.) was compared to common spandrel panel designs of the same size. The spandrel represents the area between the centerlines of the horizontal and vertical mullions and includes the steel stud backup wall, and the slab. This effective R-value includes the effects of thermal bridging due to the framing, steel stud backup wall and slab, and also includes surface film coefficients. (see Table 1).
6 Modeling procedures and software were extensively validated as part of ASHRAE Research Project 1365-RP
“Thermal Performance of Envelope Details for Mid & High-Rise Buildings”.
FIGURE 6: Section view of the OSP (mirrors not shown)

7
Table 1: Thermal Modeling Results – based on 1500 mm x 1500 mm spandrel
Case and Description
Nominal Spandrel 1D Insulation
hr·ft2·oF/BTU (m2K/W)
Spandrel Area Thermal Performance
R-value hr·ft2·oF/BTU
(m2K/W)
U-value BTU/hr·ft2·oF
(W/m2K)
1 Common spandrel design with R-8.4 insulated metal backpan
8.4 (1.48)
6.27 (1.11)
0.159 (0.905)
2 Common spandrel design with R-16.8 insulated metal backpan (baseline)
16.8 (2.96)
7.50 (1.32)
0.133 (0.757)
3 Optics Spandrel Panel - 25mm Aerogel at backpan (R-10) - 20mm Aerogel at perimeter (R-7.9)
10.0 (1.76)
6.43 (1.13)
0.156 (0.883)
4 Optics Spandrel Panel - 25mm VIP panel at backpan (R-40) - 20mm Aerogel at perimeter (R-7.9)
40.0 (7.04)
8.11 (1.43)
0.123 (0.700)
For the common unitized curtain wall system modeled, with R-16.8 insulation at the backpan, the effective R-value of the spandrel area is reduced to R-7.5 due to the thermal bridging resulting from the highly conductive curtain wall and backpan framing. Different material configurations for the OSP insulation were considered to provide design options for the manufacturer. Case 3 in Table 1 has Aerogel at the backpan and at the perimeter of the Z-frame, whereas Case 4 utilizes a VIP panel at the backpan and Aerogel at the perimeter. Since the VIP is four times less conductive for the same thickness compared to Aerogel, it provides more insulation but also has some limitations on cost and form factor compared to Aerogel. As can be seen in Table 1, the overall R-value for Case 3 surpasses Case 1, and Case 4 surpasses Case 2 (baseline). Therefore, it can be shown that either Case 3 or Case 4 can be used for insulating the OSP depending on the performance requirements of the building where the system will be installed. However, Case 4 will outperform most common spandrels in overall R-value. Through a design optimization process using 3D thermal modeling, interesting results were attained. Extending the Aerogel to the perimeter of the glass to fill the air gap between the z-frame flange and the glass by the foam spacer improved the overall thermal resistance of the OSP by nearly R-2. This demonstrates that detailing of insulation can drastically improve the effectiveness of insulation within the spandrel. The thermal gradient image in Figure 7 identifies areas with higher heat flow with wide bands of single colors and areas of high thermal resistance with narrow bands of different colors spaced closely together. The simulated color chart provides a temperature index with 0 (blue) as the outdoor temperature and 1 (red) as the indoor temperature. As can be seen by the thermal gradient lines at the center of Figure 7, a source of thermal bridging for the OSP is through the small glass output window at the bottom of the backpan where there is no backpan insulation. For the design of the OSP, optical constraints limit the options available for improving the thermal performance in this area, such as using an IGU instead of a single pane of glass to provide added resistance for the output window.

8
FIGURE 7: Thermal Simulation of Optical Spandrel Panel (side view)
When comparing the thermal gradients of the traditional spandrel system (Figure 8) and the OSP (Figure 9), the OSP maintains similar interior frame and slab temperatures compared to the traditional system. The temperature at the output window is slightly reduced relative to the rest of the backpan and poses a slightly higher risk for condensation. However, by conducting heat from the interior, the light pipe connected to the output window will keep this area of the panel warmer.
FIGURE 8: Thermal simulation of traditional spandrel with R-16.8 Insulation
FIGURE 9: Thermal simulation of Optical Spandrel Panel with VIP and Aerogel
Light Pipe (for reference)
Output Window

9
Heat, Air, and Moisture Transfer Through basic calculations, it can be shown the OSP cannot be fully sealed due to the large volume of air within the enclosure and temperature-induced pressure fluctuations that occur when the OSP is exposed to sunlight. A sealed approach similar to an insulated glazing unit is not feasible because unlike IGUs, bowing of the glass does not provide adequate pressure relief in relation to the enclosed volume of air. This is determined according to the ideal gas law as follows:
(1)
Where
P = Pressure, Pa V = Volume, m3
T = Temperature, °K C, t, e = Constants
Assuming that the pressure is kept constant, this formula can be rearranged to find the displaced volume between two temperature conditions:
(2)
A change in temperature of even 60°C, which is within the expected service range of spandrel panels exposed to sunlight, results in a pressure increase of approximately 20 kPa (3 psi) on the glass panel. This exceeds most allowable design stresses for glazing. Therefore, a means to quickly displace roughly 1/5th of the entire air volume is required to prevent a pressure differential when temperature changes occur. Some shadow boxes use breather tubes or weep holes to vent the air space to the exterior environment as the exterior air generally contains a lower moisture load than the indoor environment in most climates. However, traditional shadow boxes relying on a single pane of glass at the front of the panel have historically been prone to condensation issues and visible streaking on the clear front glass. This is an undesirable effect for the OSP as it impacts aesthetics and results in moisture damage to the optics. Improved shadow box designs (See Figure 10) employ an insulated glazed unit (IGU) so that the inside lite (within the spandrel) is warmer than the outside lite. This allows for temperature regulation and reduces the likelihood that the temperature of the inner pane of glass will dip below the dew point of the vented airspace.

10
FIGURE 10: Improved shadow box design with IGU. The vented air cavity is located between
the IGU and the aluminum shadow box.
Although using an IGU is a feasible approach for shadow boxes, the OSP design only allows for a single pane of glass to be used due to the limited depth available for optical components and the need to maximize lighting performance. Therefore, this presents a high risk of condensation for the OSP, especially in conditions when the temperature of the glass is below the temperature of the exterior air due to night-sky-radiation. To make any condensation invisible to the exterior, traditional vented spandrel panels utilizing one pane of glass are generally opacified and rely on weep holes to allow the condensate to drain out of the system. This approach is not an option for the OSP since the front pane of glass has to be clear to allow sunlight to enter the system. To eliminate the risk of condensation for the OSP, desiccant is required to adsorb the moisture in the air and as a result, maintain a low dew point. This is a similar approach to that used to keep IGUs dry, but unlike IGUs, due to the temperature-induced breathing cycles of the OSP, moist air is introduced into the enclosure any time the temperature changes, requiring high levels of desiccant to maintain a dry environment. The challenge is determining the vapor load that the OSP experiences over the product life and as a result, the amount of desiccant required. The goal is to provide pressure equalization, while minimizing free vapor diffusion through the breather tube into the OSP. A prototype was built to size the breather tube and test assumptions for the amount of desiccant required. Breather Tube Sizing An experiment was set up to measure flow rates vs. pressure using the pressure decay method. By pressurizing an enclosure with the same volume as the OSP design, roughly 120L, and releasing the air inside the enclosure through breather tubes of different sizes while measuring time, the proper breather tube diameter was determined. To ensure the pressure inside the OSP will be maintained at safe levels, a target maximum instantaneous change in pressure of 1.0 kPa (0.15 psi) was chosen. A design assumption was that the enclosure air temperature would not change more than 40°C in about 10 minutes due to the thermal lag that the glass, framing, and optical components provide. Therefore, using Equation 2, to maintain pressure

11
equalization, the OSP must allow a maximum flow of roughly 2L/min. These assumptions are validated in the Testing and Validation section of this paper. A pressure gauge was used to measure pressure decay as a function of time for different tube sizes and air filter configurations. The experiment was conducted with tube sizes that were either 3 mm diameter (0.125 in.) or 6 mm diameter (0.25 in.) with and without air filters. The data collected can be seen in Figure 11.
FIGURE 11: Pressure decay curve with various tube sizes
The pressure change over time is converted to flow rate vs. pressure using Equation 1 and plotted as shown in Figure 12. By identifying the maximum design pressure of 1 kPa and the maximum design flow of 2L/min (see dashed lines), the breather tube required to meet this criteria is 6mm in diameter with a filter. The manufacturer specified that the filter was required to reduce dust ingress into the OSP.
FIGURE 12: Flow rate and pressure graph used for sizing of breather tube
The OSP is therefore designed with a breather tube that provides pressure equalization and butyl/silicone perimeter seals similar to common IGUs to control moisture and vapor ingress into the enclosure (Figure 13).

12
FIGURE 13: Section view of the optical spandrel panel
Desiccant Sizing To estimate the amount of moisture that will be adsorbed by the desiccant for the service life of the OSP, three methods were developed:
- Method A: a simplified calculation method that assumes the OSP will encounter one large breathing cycle per day as the air heats up and cools, and relying on known climatic data to determine average vapor loads of the exterior air.
- Method B: experimental technique using a scale prototype with humidity sensors and flow gauges to create a model for expected vapor load (addressed further in the Testing and Validation section of this paper).
- Method C: same approach as Method B but humidity and temperature sensors to
calculate the vapor loads over time (addressed further in the Testing and Validation sections of this paper).
The simplified calculation method (Method A) was utilized before the experimental methods and relied on some basic assumptions. Since the largest temperature fluctuations occur on sunny days when the sun heats the OSP past the temperature of the exterior air, it is assumed that a maximum daily temperature fluctuation for the air inside the OSP will be about 60°C (ie. a gradual temperature swing from 20°C to 80°C). This assumption is based on experience and is validated in the Testing and Validation section using Methods B and C. Due to the thermal lag effect created by heat stored in the aluminum framing, glass, and optical components, it is also assumed that minimal flow is experienced when small exterior temperature fluctuations occur. Therefore, it can be approximated that the enclosure will undergo, on average, one breathing cycle per day – heating up when the sun comes out and cooling down at night time. Based on this assumption and using Equation 1, the daily airflow exchange is calculated for a regular sunny day. Since the OSP has roughly 120 L of air, and the temperature fluctuations induce a 22% volume change, roughly 26 L of air will be displaced per day. These assumptions are

13
conservative in general and the validation of these assumptions is presented in the Testing and Validation section of this paper. To determine the amount of water vapor that has to be adsorbed by the desiccant with each breathing cycle, historical data for various climates was used to find the average vapor density of air throughout the year. For example, in Vancouver, the average air vapor density is around 10 g/m3 for the summer and 5 g/m3 for the winter (see Figure 14). These densities vary by climatic regions in North America, so the upper end of the density (10 g/m3) was used as a conservative number that could be applied for a full year, and in other regions using Method A.
FIGURE 14: Typical seasonal hygrothermal data for Vancouver, British Columbia
By using the breathing cycle volume per day (26 L) and the vapor density of the air, the amount of water vapor that the desiccant must adsorb with each breathing cycle can be determined. The desiccant selected is a Type 4A molecular sieve desiccant due to its ability to adsorb a large quantity of vapor in relation to its weight, and its common use in IGUs. The adsorption capacity of the molecular sieve desiccant is roughly 24 wt%. However, once the desiccant reaches this level, the rate of adsorption is significantly lower and its ability to adsorb additional moisture is reduced. This means that the drying capacity and speed at which the air can be dried is reduced, increasing the likelihood of condensation. To take a conservative approach, the adsorption rate vs. equilibrium water capacity of the desiccant provided by the supplier was assessed and it was determined that the desiccant would still perform as desired at roughly 15 wt% capacity. Therefore, for every 1 g of water vapor adsorbed, roughly 6 g of desiccant is needed. And so, for every breathing cycle, 0.26 g of water is absorbed and this requires around 1.8 g of desiccant per day to keep the OSP dry. Based on the conservative calculations using Method A, to design a system that maintains a dry environment for at least 20 years, a 120L enclosure requires roughly 13 kg (28.5 lb) of desiccant. Due to the high water retention of molecular sieve desiccant, it was assumed that the desiccant will not desorb any moisture that it adsorbs over time.

14
Vapor Diffusion Control Vapor diffusion through the breather tube without airflow movement must also be accounted for and is calculated based on equations provided in ASHRAE Fundamentals. The breather tube selected was 0.3 m long to provide some resistance to free flow diffusion. Applying the diffusion coefficient of moist air (ASHRAE 2009):
(3)
where
DV = Mass diffusivity for air (binary mixture), mm2/h P = Pressure, 101.3 kPa
T = Temperature, 293°K
For this scenario, DV is equal to 25.3 mm2/h. The vapor load on the OSP due to free flow diffusion can be calculated using:
(4)
where
= Mass flow rate of vapor, kg/s DV = Mass diffusivity for binary mixtures, mm2/h MB = Relative Molecular Weight Acs = Cross Sectional Area, m2 Ru = Universal gas constant pb0 = Vapor pressure at one end of tube, kPa pbL = Vapor at the end of tube of length, kPa L = Length of tube, m T = Temperature, 293°K
Using a psychometric chart to determine vapor pressure, with the OSP constantly dried to around 5% RH by the desiccant the vapor pressure differential (pb0 - pbL) between the exterior air relative and the OSP for the summer in Vancouver is approximately 1.5 kPa. This can be assumed as a conservative average value throughout the year. Therefore, using Equation 4 for a breather tube 0.3 m long, the vapor load (0.0025 g H2O/day) due to diffusion is quite negligible relative to the vapor intake during regular breathing cycles. This demonstrates that vapor diffusion through the breather tube with the diameter and length selected introduces a small amount of moisture into the enclosure and does not have a major impact on the desiccant required in the OSP. In addition, due to the dynamic temperatures experienced by the OSP, there are few scenarios where the airflow between the enclosure and the exterior environment will be stagnant.

15
Testing and Validation To validate the calculations related to desiccant lifetime (Method A), and to test the in-field durability of the OSP being developed, full-scale prototypes were constructed. The prototypes were equipped with temperature sensors measuring the air temperature inside and outside the enclosures and the glass/frame temperatures, relative humidity sensors measuring RH inside and outside the enclosure, flow meters measuring flow in/out, and a solar radiation sensor. Enclosure #1 (E1) was the control enclosure, vented to the outside without any desiccant. Enclosure #2 (E2) was desiccated and had roughly 2800 g (6.2 lb) of desiccant on a scale to monitor the amount of water adsorbed over time (see Figure 15).
FIGURE 15: Prototype photos E1 at bottom left, E2 at top left and the desiccant and scale in E2 (right image). Condensation visible on the enclosure was on the outside of the glass.
The exterior humidity and temperatures were monitored to determine the vapor load on the enclosure with each breathing cycle. Interior air temperatures were monitored to calculate the flow in and out of the enclosure to validate the previous assumptions for flow rates (Method A) and to compare to measured flow rates using flow gauges (Method B).
FIGURE 16: Photo of prototype enclosure E2 with desiccant. Components labeled: (1) breather tube (2) R/H sensor (3) air filter (4) desiccant scale (5) desiccant (6) aluminum frame (7) pass-
through sensor connectors (8) data collection unit (9) top and bottom glass.

16
The scale had to be positioned inside the enclosure to prevent having to take the desiccant out of the enclosure for measurements. This introduced some challenges monitoring the weight of the desiccant because of the environmental exposure of the scale. Due to the drop in relative humidity and the temperature fluctuations of the enclosure, the scale was damaged. The scale could not be repaired or replaced without having to open the enclosure and restart the experiment altogether. Even though the scale showed insignificant mass gain even 1 year after the prototype was deployed, the readings are not reliable to use in absolute terms. Although the desiccant could be removed and weighed with another scale, gaining access to the enclosure would permanently disrupt the experiment. This was not done in order to keep the experiment running as part of long term monitoring. Since only a small fraction of the anticipated desiccant weight for an enclosure of this volume was used in the prototype, by monitoring the conditions inside the enclosure over time, a desiccant lifetime can be extrapolated for the design of the OSP. Approximately 2800 grams (6.2 lb) of desiccant was used in the enclosure with 120 L of air volume. Data collected shows that 18 months into the experiment, the relative humidity of the enclosure continues to be kept near 0% RH (within an error margin of 5-10% based on the sensor manufacturer’s specifications). This shows that even with just 1/5th of the desiccant mass required calculated using Method A, the desiccant has not been saturated. From the data collected, it can be determined that an OSP with a desiccant weight of 13 kg (28.5 lb) and this air volume would last at least 8 years in a climate like Vancouver’s (1.5 years already proven x 5 times the desiccant mass). However, since the desiccant is not yet saturated a much longer lifetime can be anticipated and the other validation methods can be relied on to demonstrate this. The desiccant in the prototype will be continuously monitored to further validate the vapor loads and determine if the air inside the enclosure is being dried. Flow rates and anticipated vapor intake was validated using experimental data. Since the flow data for Enclosure #1 and Enclosure #2 were very similar, only data from E2 (containing desiccant) is used for validation. Figure 17 below shows the data collected for July 24 and 25 of 2013. July 24th was a partly sunny day as can be seen in the solar radiation data for the day. As a result of passing clouds, there were continuous fluctuations in the enclosure air temperature, but it is evident that the heat stored in the glass and framing inside the enclosure helps mediate the temperature changes because the fluctuations in air temperature are not as drastic as the changes in solar radiation. Measured flow rates also show changes in the flow direction that correspond with the changing temperature of the air inside the enclosure. July 25th was sunny, resulting in mostly outward flows in the early part of the day and inward flows for the later part of the day as the enclosure air cooled (see Figure 17). The maximum flow rate was approximately 20 L/hour (0.33L/min), which is far below the calculated maximum of 2L/min based on the previous assumption of a maximum change in temperature of 40°C in 10 minutes. This shows that even on sunny days, the temperature spikes induced by periods of clouds/sun are mitigated by the heat stored in the enclosure, keeping the temperature of the air in the enclosure more constant (see Figure 19). Of interest is also the difference between the exterior air temperature at the hottest (roughly 30°C) and the air temperature inside the enclosure (nearly 65°C), which shows a significant increase in air temperature due to solar radiation. When installed in a spandrel section of a building, the OSP will likely experience less temperature swings than the fully exposed prototypes due to thermal regulation provided by the building.

17
FIGURE 17: Data collected for Enclosure #2 from July 24 – July 25
Data collected in December of 2013 also shows similar patterns for sunny days (Dec 4) and partly cloudy day (Dec 5), but with a lower overall flow rate due to the lower temperature fluctuations of the exterior air and reduced effects of solar heat gain on the enclosure. See Figure 18 below.
FIGURE 18: Data collected for Enclosure #2 from Dec 4 – Dec 5
Using exterior temperature and humidity, the vapor density of the exterior air for both days can be determined. On average, the vapor density for July 24-25 was roughly 12 g/m3 of air and for December 4-5, roughly 3 g/m3. These days were selected for comparison in this paper because they help contrast the best case and worst case scenarios for breathing cycles. The two days in December were especially dry with clear nights and sunny days. Other data collected in December shows an average vapor density closer to 5 g/m3. This is consistent with the anticipated vapor densities determined by historical climate data early in the design process.

18
Experimental data collected for the flow rates between the enclosure and exterior is compared to calculated data based on the interior air temperature. The data shows that the measured flow rates are significantly lower than the calculated rates using Equation 2, which assume that a temperature change will be directly proportional to a volume change. However, the data follows the same flow pattern (see Figure 19).
FIGURE 19: Measured flow rates with flow sensors vs. calculated flow using temperature
By summarizing the data for July and December in Table 2, we can compare the three different methods of determining desiccant spent. Method A uses the min/max temperatures and an average vapor density of the air. Method B relies on using the measured flows from the flow sensors and adding up the flows for the entire day. Method C uses the measured temperatures from the interior air and Equation 1 to convert to flows. Both Methods B and C use measured relative humidity to determine vapor loads. As can be seen, using Method C results in nearly twice the amount of desiccant spent for each day relative to Method B. Using Method A is less conservative than Method C and results in a slightly lower desiccant weight spent. For Method A, if we were to use vapor densities of 10 g/m3 of air as per our initial conservative approach, it would result in a slight underestimate for the summer and, as expected, a very conservative estimate for the winter. Table 2: Measured and Calculated Flows
Flow In
(L)
Flow
Out (L)
Desiccant
Spent (g)
Flow In
(L)
Flow
Out (L)
Desiccant
Spent (g)
Flow In
(L)
Flow
Out (L)
Desiccant
Spent (g)
Flow In
(L)
Flow
Out (L)
Desiccant
Spent (g)
ACalculated using
min/max approach11.4 11.4 0.23 9.7 9.7 0.19 18.3 18.3 1.47 18.3 18.3 1.46
BMeasured using flow
sensors8.3 8.0 0.15 7.5 7.0 0.12 15.6 14.9 1.25 12.0 11.0 0.96
CCalculated using
measured temperature13.2 12.8 0.26 12.7 11.9 0.21 34.2 33.9 2.82 22.4 22.6 1.85
December 4th
(sunny)
December 5th
(partly sunny)
July 24
(party sunny)
July 25
(sunny)
Notes:
1) For desiccant spent, mass is calculated based on 15% wt H2O adsorption capacity.
2) For method A, 3 g/m^3 of air is used as the vapor density and for the summer 12 g/m^3 of air is used.
2) For methods B, real-time measured flow is used.
3) For method C, the measured humidity of the air and measured temperature is used.
Method Description

19
Although Method A is a general estimate based on assumptions, it is a reasonable conservative approach to estimating the amount of desiccant required for the desiccant lifetime. The initial modeled estimate using Method A for the desiccant spent value was 1.8 g/day, which compares to the maximums of 2.8 g/day on July 24, and 1.8g/day on July 25 calculated using the measured temperatures in Method C. Using Method B results in even lower values for desiccant spent due to the lower flow rates measured using flow gauges. It should be noted there are several factors that make Method C result in significantly higher amounts of desiccant required than Method B. Typical flow sensors can be inaccurate at detecting very small flows rates, whereas Method C takes into account even the smallest changes in volume due to incremental changes in temperature. Method C also relies on data taken from the temperature sensors inside the enclosure. Though the sensors were shielded from the sun with a reflective metal flap, it is likely they were still receiving radiative heat from the flap and other enclosure components, so the real average interior air temperature was not being accurately recorded and the sensors were susceptible to solar heat gain. Another factor is that the breather tube provides some flow attenuation and sudden changes in the interior air temperature may not result in immediate flow through the tube. As is evident, using either of the methods, the daily desiccant spent in the winter is much lower than the desiccant spent in the summer as the air contains less water vapor mass, and there is a lower temperature induced air flow between the enclosure and the exterior air. On rainy winter days in climates like Vancouver’s, even though the vapor density of air is higher, the temperature-induced flows are even lower because the air temperature is more constant throughout the day without periods of sun. It is also evident that far more flow occurs on partly sunny days in the summer that reach high midday temperatures. These simplified calculation methods can be used to estimate the desiccant required for the product, but to optimize the weight, and to apply these calculations to other regions in North America, further modeling using specific climatic data is required.
NEXT STEPS AND FURTHER CONSIDERATION Further work and modeling will be done for various climates to determine an optimized mass of desiccant for the OSP. Until then, using a safety factor based on conservative assumptions is a good solution for reducing condensation issues in the panels since there is space available around the optical components and excessive use of desiccant is not cost prohibitive. Another consideration for the product is manufacturing workmanship. Previous studies in IGUs and also in similar pressure equalized, desiccated products, have shown that even if sufficient desiccant is provided, workmanship defects can result in more vapor ingress than anticipated, creating moisture problems and streaking on the units (Knowles et al 2010). Lessons learned from these previous failures were applied during the design process of the OSP by using a continuous z-frame with wide glazing flanges that can be securely sealed with butyl and silicone, resulting in less likelihood of workmanship error. The manufacturer of this product will also have to ensure proper procedures for quality control when the units are assembled. The other factor that should be investigated is the impact of wind on the enclosure and resulting breathing cycles. However, since some attenuation is provided through the relatively narrow breather tube and since the panels are designed with a 6 mm (0.25 in.) front glass that is not

20
more than 1.5 m x 1.5 m (5 ft x 5 ft), this is likely not a big concern for introducing added vapor into the enclosure.
SUMMARY Through detailed design, testing, and validation, a new daylighting technology was integrated with common curtain wall construction methods. Challenges of mechanically integrating the OSP into curtain wall were met by applying standard glazing practices and approaching the design similar to an IGU module. Even though the optics introduced space constraints within the OSP, to meet thermal performance goals, detailed analysis and optimization was performed to demonstrate that highly insulating materials can be used to provide adequate insulation for the product. Analysis also showed that using Aerogel and careful detailing can reduce thermal bridging and greatly improves the overall thermal effectiveness of the OSP. To address the complex science behind heat, air and moisture movement through the building envelope, several calculations were performed and validated using measured data from prototypes. The experiments show that conservative calculations can be reliable for determining the amount of desiccant required for the OSP. This paper demonstrates that although integrating new technologies within the building envelope introduce new challenges, solutions can be implemented when a methodical approach is used that includes analysis, testing, monitoring, and validation. This work also presents an opportunity for evaluating similar technologies in shadow boxes that encounter condensation issues or for other building components that are highly visible and require sealing.

21
REFERENCES ASHRAE. 2010. ASHRAE 90.1 Energy Standard for Buildings Except Low-Rise Residential Buildings, Atlanta, GA: American Society of Heating, Refrigerating and Air-Conditioning Engineers Inc. ASHRAE. 2009. Handbook of Fundamentals. Atlanta, GA: American Society of Heating, Refrigerating and Air-Conditioning Engineers Inc. D&R International. 2011. 2010 Building Energy Data Book, Silver Spring, Maryland: United States Department of Energy. P. Boyce, C. Hunter, O. Howlett. 2003. The Benefits of Daylight through Windows. Troy, New York: Lighting Research Center Rensselaer Polytechnic Institute. L. Edwards, P. Torcelli. 2002. A Literature Review of the Effects of Natural Light on Building Occupants. Golden, Colorado: National Renewable Energy Laboratory. Morrison Hershfield Ltd. 2011. ASHRAE 1365-RP Thermal Performance of Building Envelope Construction Details for Mid- and High-Rise Buildings, Atlanta, GA: American Society of Heating, Refrigerating and Air-Conditioning Engineers Inc. Morrison Hershfield Ltd. 2014. Building Envelope Thermal Bridging Guide – Analysis, Applications, and Insights, Vancouver, BC. http://www.bchydro.com/powersmart/business/programs/new-construction.html?WT.mc_id=rd_oldhiperfbuildingprogramWT.mc_id=rd_construction W. Knowles, B. Hubbs, P. Kernan, G. Finch. 2010. A New Paradigm for the Design of Sustainable Buildings. BEST 2 Conference – Energy Efficiency EE3.

National Institute of Building Sciences Provider #G168
BEST4 Conference Nibsbest4 • April 13-15, 2015
Credit(s) earned on completion of this course will be reported to AIA CES for AIA members. Certificates of Completion for both AIA members and non-AIA members are available upon request. This course is registered with AIA CES for continuing professional education. As such, it does not include content that may be deemed or construed to be an approval or endorsement by the AIA of any material of construction or any method or manner of handling, using, distributing, or dealing in any material or product. ___________________________________________ Questions related to specific materials, methods, and services will be addressed at the conclusion of this presentation.

Participants will : 1. Learn how to link the performance of individual building enclosure components in a holistic framework to achieve high-performance buildings. 2. Explore, through built case studies, how building envelope design determines overall energy conservation and sustainability capabilities 3. Learn innovative practices for avoiding heat loss as well as moisture and air infiltration in enclosure design for healthy new and existing buildings. 4. Understand the role of building enclosure commission- ing in the design, construction, and operation and maintenance of commercial facilities.
Learning Objectives

Integrating Active Daylighting Technology Into
the Building Facade
Presented by:
Radu Postole, BASc Morrison Hershfield Ltd.

Overview New Daylighting
Technology
Curtain Wall Integration
Thermal Modeling
Testing + Monitoring
Solutions and Takeaways

Challenges of Daylighting

Active Daylighting Technology Commercially Available Technology Developed at
University of British Columbia

Active Daylighting Technology

Active Daylighting Technology
Tracking Reflecting + Concentrating Distribution

Active Daylighting Technology

Constraints
Optics take up space (3.5”) Limit is 1” insulation
Optics aligned in factory Requires modular design like an IGU
Can’t fully seal Module
Requires pressure equalization
Clear front glass required Must prevent condensation

Pressure – A little Exercise Seal IGU at 20°C, it can reach 80°C with sunlight
Results in 3 psi of pressure. Assume 50” x 50” glass Resulting Pressure: 7500 lb outward force
Bowing of glass cannot provide enough pressure compensation

Pressure Equalized – Shadow Box
Historically prone to condensation Adding IGU at front provides some resistance But also reduces light transmission Need space for optics – not an option!

Pressure Equalized IGU?
Require Desiccant to keep air dry Prevent Condensation
Challenges Far more desiccant than a “sealed” IGU Larger volume and breathing cycles
Approach Calculations and Assumptions Testing and Validation

Calculations and Testing Vapor load of outside air:
Summer ~ 11g H2O/m^3 of air Winter ~ 6g H2O/m^3 of air

Calculations
Some Assumptions: Outside air has 10g H2O/m³ (conservative) Assume every 24 hours, ΔT = 60° Therefore: 30L of air per day exchanged Desiccant capacity is 15% wt (with a bit to spare)
The Conservative Model: Every cycle introduces 0.31g of H2O Every day requires 2g desiccant For minimum 20 year lifetime = 16Kg (35 lbs) desiccant

Testing and Validation

Testing and Validation
Testing Results – Desiccant Spent (g/Day) Winter Summer
Method A (Min/Max Temp + RH) 0.22g 1.5g
Method B (Flow gauges + RH) 0.13g 1.1g
Method C (Incremental Temp/Volume & RH) 0.25g 2.2g

Physical Integration

Physical Integration

Insulation
VIP Panel = R40/25mm Aerogel = R8/25mm

3D Thermal Modeling
Traditional Spandrel Optical Spandrel

3D Thermal Modeling
Light Pipe (for reference)
Output Window

Thermal Results
Case and Description Nominal 1D R-value
Spandrel Area R-value
1 Common spandrel design with R-8.4 8.4 6.27
2 Common spandrel design with R-16.8 16.8 7.50
3 Optics Spandrel Panel (Aerogel) 10.0 6.43
4 Optics Spandrel Panel (VIP + Aerogel) 40.0 8.11
Design Goal: Meet or surpass “Common Practice”

Further Developments
More desiccant modeling Different climates and weather conditions
Testing within buildings
Fire testing/durability testing
Long term monitoring

Takeaways
Integration challenges can be met
Consider Heat, Air, Moisture
Thermal Modeling
Testing
Validation
More Testing

Thank You!