performance of subsea multiphase meters and topside test separator ... · pdf file1...
TRANSCRIPT

1
Performance of subsea multiphase meters and topside test separator during well testing, after Skarv field start-up
Barbara M. Wrobel1, Andrew Hall2, Lukasz H. Wrobel1
1BP Norge AS, 2BP Exploration Operating Company Ltd. 1. Introduction Since start-up of the Skarv field in December 2012, subsea multiphase flow meters (MPFMs), and a topside test separator have been routinely used for well testing of both oil and gas-condensate wells. There are five MPFMs installed on Skarv, with three installed on the oil-producing templates and two on the gas-condensate producing templates. There are two production headers on each template and one test header where the MPFM is located. Flow is directed either to the test or to the first stage separator through one of two risers. Figure 1 shows schematically the options for routing flow from the oil and gas-condensate wells, either through multiphase meters or directly to the test or first stage separators. A number of wells share one MPFM on each of the production templates. Therefore for monitoring and historical tracking purposes, the positions of the diverter valves for each of wells are plotted against time, as shown in Figure 2. The reasons why MPFMs are used for well testing in addition to the test separator include the following: - To allow for metering of flowrates from oil and gas-condensate wells which have been
drilled in different reservoir sections having different CGRs and GORs. This is especially important for a field with a large number of producing wells. There is also the possibility of testing of two or more wells with different GOR using the test separator and interpolating values for individual flowrates for each well from the total flowrate; however, this method would give increased uncertainty;
- Increased testing capacity by using the MPFM when occasionally the test separator is not available, for example due to cleaning or intervention;
- Surveillance of well performance during start-up using the MPFM, while the test and first stage separators are already in use.
According to [1], the main advantage of the MPFM over the test separator is reduction in time to perform measurement. Due to accumulation of liquid, the potential for slugging in the flowlines and risers, and the need to allow the separator to fill and stabilise when changing over wells for test, the response time for stable measurement using the MPFM is much shorter than for the test separator. This paper consists of several examples, presenting performance of the subsea multiphase meters and the test separator on Skarv, as well as associated challenges.

FIGURE 11ST STAG
FIGURE 2MPFM [2]
2. Well Productaccount
- - - -
-
-
SKETCH OF FGE SEPARATO
2 WELL DIVERT].
l conditions
tion testingt the follow
Bottom holWell head pChoke openFlowrates afluctuationsFlowrates afluctuationsIdeally, we
LOW ROUTINGR [2].
TER VALVE IN
s for produ
g of a well ing prerequ
le pressure apressure andning on a wat line conds) - if a test at line cons or slugginll test perio
G FROM WELL
OPEN (1) OR C
uction testin
is based ouisites:
and temperad temperatu
well must be ditions from
is performenditions fromng) - if a testd should las
LS, THROUGH M
CLOSED (0) PO
ng
on a stable
ature must bure must be constant,
m multiphaseed using them test sepat is performst 24 hours.
MULTIPHASE
SITIONS INDIC
period, wh
be constant,constant,
e meter mue meter, arator must
med using th.
METERS TO TE
CATE IF A WEL
hich is dete
,
st be stable
be stable e test separa
EST SEPARAT
LL CONNECTED
ermined tak
e (without n
(without nrator,
2
OR AND
D TO
king into
noise, no
oise, no

3. Subs Measurwater. promotiradiatiotransmiconditioconditioreservohydrocapropertiagainst composconstanfirst coemeasure Skarv mbetweenconsidetemperapressureof 5000
FIGURE 3
In Figumeter ctrianglegas, 100the trianoutside Generalpresenteshowingamount
sea multiph
rement in th A blind-teing flow ho
on source anitters, and aons and theons, using ir fluid coarbon propies) and expPVT data,
sition, densints, such as efficient is ed in situ in
multiphase n 50 and 11eration. Thature rangee is taken a
0 mbar.
3 MEASUREME
ure 3, a smcan be seen e representin0% hydrocangle area (ethe triangle
lly performed in sectig a negativt of condens
hase meter
he subsea mee is locate
omogeneity.nd a detectoa flow comen convertedefined PV
omposition perties (mopected metefrom whichity and salimass attenumeasured, w
n the meter
meters oper10°C, and thhe maximu is from -1s 4500 mba
ENTS FROM TH
mooth transiduring a w
ng the MPFarbon liquide.g. for gas e, this would
mance of mion 6. Initive water reased water w
(MPFM)
meter is pered immedia. The Skarv
or, Venturi tmputer. Oied to volum
VT tables. up to C36
olar mass er operatingh the PVT tanity. In thuation coeffwhile the la[3].
rate at presherefore con
um design p10 to 130°Cara, to allow
HE MPFM DUR
tion of flowwell start-up FM operatind and 100%fraction 50
d suggest a
multiphase mally, the mading (and
was being pr
rformed onately upstrev multiphasthroat, pressil, gas andme rates, w
The PVT 6+ (which and densit
g conditionsables are cr
he meter, thficients for ast three ma
ssures in thnversion ofpressure ofC. For siz
w for fluctua
RING WELL SHU
wrates, preand shut-d
ng range [3]% water, and0% and WLcalibration
meters has meter locatewater cut),
roduced from
n a homogeneam of these meters cosure, differe
water maswhich in tu
tables are is especia
ty of C36+s. Tuning ofeated. Otheere are alsoair (empty
ay be calcul
e range 90f flowrates tf the meterzing purposations which
UT-DOWN AND
ssure and tdown [2]. F]. Verticesd the operatLR 50%). I
issue.
been satisfed on the driven by t
m the gas-co
neous mixte meter witonsist of a dential pressuss rates areurn are con
created bally importa+, saturatiof the PVT mer input intoo initial (refpipe), oil, g
lated based
to 130 barto standard r is 310 bases, the mah may take t
D START-UP [2
temperatureFigure 4 illuof the triangting point liIf an operat
factory, witgas-condenthe fact thaondensate w
ture of gas,th the intendual-energyure and teme measurednverted to sased on useant for oil on pressurmodel is peo the meter ference) calgas and waton compos
ra and tempconditions
ara and theaximum difthe DP to th
2].
e in the muustrates the ngle represenies in the mting point i
th further ensate templat only a vewells.
3
oil and ntion of
y gamma mperature d at line standard er input:
fields), re, STO erformed
is water libration ter. The sition, or
peratures is a key
e design fferential he range
ultiphase solution nt 100%
middle of s shown
evidence late was ry small

This issattenuatdensity coefficigas-wat The gasproductcoefficicalculatadjustinand in Tturned that devthat regpresencdecreas The resgamma positiveamountwater fl A shift may hapressureinstallat
FIGURE 4
sue in genetion coeffic
(compositient for metter mixture
s flowrate mtion was wiient for oilted by keepng the oil mTable 1, 2nd
out not to bviation was gardless of ace of unknose.
sult of recaray energi
e water cutt of liquid mlowrate, the
in empty cave happenee was incotion (unlike
4 THE SOLUTIO
eral can be cients for gation), or bter filled wmust be dim
measuremenithin 2 to 3% and for th
ping the sammass attenuat
d segment).be physicalnot a result
any oil comown non-h
lculation ofes) is preset (adjusted
must remaine condensate
count rate ced for examorrectly m
ely, but poss
ON TRIANGLE W
solved eithas or oil filley 2) chan
with air. Thminished by
nt error by c%. It was the “empty me GVF antion coeffic The requil, since the t of incorrec
mposition, thhydrocarbon
f “empty piented in 3rd
to known n the same, ie flowrate h
ould be a rmple if theeasured, orsible), so it
WITH OPERAT
her by: 1) reed meter, w
nge of the he measuredy the initial
comparison therefore depipe” (as
nd CGR (CGcient to giveired recalcucoefficient
ct calibratiohe coefficienn componen
ipe” mass ad segment o
value) andin order to b
had to drop
result of eithe meter hadr a movemis physicall
TING POINT, US
ecalculationwhich implie
initial “emd attenuatioattenuation
of the multecided to reshown in TGR was bele a known vulated mass t decreased
on of oil pront would nonts, the co
attenuation of Table 1.d unchangedbalance thea little.
her the origd not been ment in thly plausible.
SED FOR CALIB
n or measures change ofmpty pipe”on in the me
for meter f
tiphase metecalculate thTable 1). lieved to bealue of watattenuationand not in
operties. Thot be so lowefficient w
coefficient The modifd GVF. Hpreviously
ginal test befully dry f
he source d.
BRATION OF N
rement of tf hydrocarb
” mass atteeter filled w
filled just w
ter and the the mass atteThe first o
e correct), bter cut (see Fn coefficienncreased, inhis is due to
w, and even would incre
t (for low afied values
However, siy measured n
eing incorrefor the testduring tran
NEGATIVE WA
4
he mass bon fluid enuation with oil-ith air.
total gas enuation one was but only Figure 4
nt for oil ndicating o the fact with the ase, not
and high assured
ince the negative
ect - this t, or the nsit and
TER CUT.

5
TABLE 1 CALIBRATION OF THE MULTIPHASE METER FOR NEGATIVE WATER CUT
1) Current mass attenuation coefficients from diagnostic data: LE HE OIL -0.0248837 -0.0172139 WATER -0.0348428 -0.0170521 GAS -0.0257691 -0.0180237 Calculation of operating point for oil-gas-water mixture from diagnostic data: LE -2.51319 GVF 97.51% HE -1.80647 WC -28.89% 2) Keeping the same GVF, but adjusting OIL LE and HE to give known value of water cut: LE HE OIL -0.0163627 -0.0144886 (not physically possible) 3) Calculation of operating point for empty pipe count rates, to give known, positive value of water cut and the same GVF: March 2009 modified LE 30219 30580 HE 17218 17283 After this procedure was employed, the resulting water flowrate had a positive value (~1 m3/h) and it was still possible to differentiate between the amounts of water from each of the gas-condensate wells, depending on which well was currently connected to the MPFM. In case of the MPFM for the oil wells, the measured water cut was positive from the start of using the meter (water flowrate >3 m3/h). Water cut measured by an MPFM employing a dual energy gamma source is sensitive to the amount of sulphur in oil; therefore it is recommended to test for sulphur and provide it together with the hydrocarbon composition for calculation of correct oil mass attenuation coefficient. The composition used for initial setup of the meter did not contain sulphur content. A recent PVT test of Skarv oil showed that it contains a small amount of sulphur. The PVT will be updated with this information and this will decrease the indicated water flowrate slightly. In order to get confidence with using multiphase meters it is advisable to get to know deeply its working principles, to be aware of ways of calibration and to be acquainted with the multiphase meter standard maintenance procedure, such as updating composition of hydrocarbons and water (including water salinity) whenever they change or to perform in situ tests with oil or water samples [4]. 4. Test Separator The test separator operating pressure has been fairly constant, at around 80 bara, however the temperature fluctuates from 50 to 80oC with a difference of up to 10°C between the gas and oil legs. The gas flowrate out of the test separator is measured by a differential pressure Venturi meter; this meter is instrumented with two differential pressure transmitters, allowing for increased turndown, with a low flowrate range (0 to 7 mbar, 0 to 818 m3/h) and a high flowrate range (0 to 500 mbar, 0 to 6 920 m3/h). The oil flowrate out of the test separator is measured by one of two differential pressure orifice meters (designed for a low flowrate range with a maximum of 22 400 kg/h and a high flowrate range with a maximum of 256 600 kg/h). Water flowrate is measured by a magnetic meter with a measurement range from 6 700 to 67 000 kg/h [5].
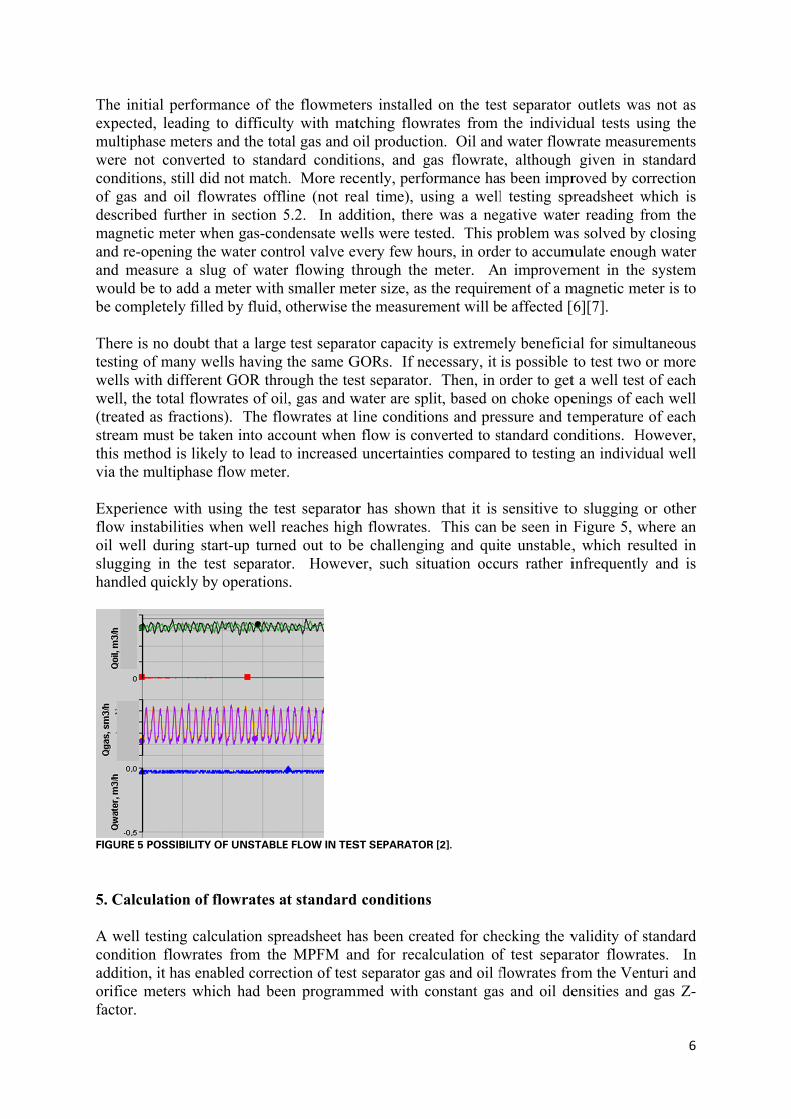
The iniexpectemultiphwere noconditioof gas describemagnetand re-oand mewould bbe comp There istesting wells wwell, th(treatedstream this metvia the m Experieflow inoil wellslugginhandled
FIGURE 5
5. Calc A well conditioadditionorifice factor.
tial performed, leading hase meters ot converteons, still didand oil floed further iic meter whopening theeasure a slube to add a pletely fille
s no doubt tof many we
with differenhe total flowd as fractionmust be takthod is likemultiphase
ence with ustabilities wl during stag in the te
d quickly by
5 POSSIBILITY O
ulation of f
testing calcon flowraten, it has enameters whi
mance of thto difficultand the tota
ed to standd not matchwrates offlin section 5hen gas-cone water contug of watermeter with
ed by fluid,
that a largeells having nt GOR throwrates of oilns). The floken into accely to lead to
flow meter
using the tewhen well rart-up turneest separatoy operations
OF UNSTABLE
flowrates a
culation spres from theabled correcich had bee
he flowmetety with matal gas and oard conditi
h. More recine (not re5.2. In addndensate wetrol valve evr flowing thsmaller meotherwise th
test separathe same G
ough the tesl, gas and wowrates at lcount when o increased r.
st separatorreaches highed out to ber. Howeves.
E FLOW IN TES
at standard
readsheet ha MPFM an
ction of test en programm
ers installedtching flowoil productioions, and gcently, perfoal time), usdition, thereells were tesvery few hohrough the
eter size, as he measurem
ator capacityGORs. If nest separator
water are spline conditioflow is con
d uncertainti
r has shownh flowrates.e challenginer, such sit
ST SEPARATOR
conditions
as been creand for recaseparator g
med with c
d on the teswrates from
on. Oil andgas flowrateormance hasing a welle was a negsted. This pours, in orde
meter. Anthe requiremment will b
y is extremeecessary, it . Then, in olit, based onons and prenverted to sies compare
n that it is. This canng and quittuation occu
R [2].
s
ated for chelculation of
gas and oil fconstant gas
st separator the individ
d water flowe, although s been imprl testing spgative wateproblem waer to accumn improvemment of a me affected [
ely beneficiis possible order to getn choke ope
essure and tetandard con
ed to testing
sensitive tobe seen in te unstable,urs rather i
ecking the vf test separflowrates fros and oil de
r outlets wadual tests uwrate measuh given in sroved by co
preadsheet wer reading fas solved by
mulate enougment in themagnetic me[6][7].
ial for simuto test two t a well testenings of eatemperaturenditions. Hg an individ
o slugging Figure 5, w, which resinfrequently
validity of srator flowrarom the Venensities and
6
as not as using the urements standard orrection which is from the y closing gh water e system eter is to
ltaneous or more
t of each ach well of each
However, dual well
or other where an sulted in y and is
standard ates. In nturi and d gas Z-

7
The correction calculation consists of two parts: for multiphase meters and for the test separator. Petroleum Experts PVTp software has been used for calculation of gas and oil densities, vapour CGR, GOR, Bo and Bg, at any pressure and temperature conditions (within the MPFM and test separation ranges), based on PVT data for the oil and gas-condensate wells. Calculated parameters were used for conversion of flowrates from line conditions (multiphase meter or test separator) to standard conditions [8]. A single-stage flash from line to standard conditions was simulated using Constant Composition Expansion experiment. Although a real fluid separation is performed for three separation stages, a single-stage flash was performed, for consistency with the multiphase meter and test separator calculations. An equation of State (EOS) tuned for Skarv fluids was used in order to minimise uncertainty in the results [9]. In addition, Petroleum Experts PROSPER was used for calculation of water compressibility, Bw, within the operating pressure and temperature ranges. If hydrocarbon composition changes then new PVT properties will need to be calculated. This also applies for changes in water composition and salinity. A well test is performed based on a long series of data (24h test, with test point every 2 minutes), which after conversion of rates to standard conditions is then averaged to single flowrate values, as a final well test result. 5.1 Flowrates at MPFM Conversion of flowrates from multiphase meter line conditions to standard conditions was performed using equations (1) to (3). The total oil flowrate includes oil dissolved in gas, and the total gas flowrate includes gas dissolved in oil at meter conditions, which at standard conditions appear as free phase. Qvo_sc = Qvo_MPFM / Bo_MPFM + CGRMPFM*(Qg_MPFM / Bg_MPFM) (1) Qvg_sc = Qvg_MPFM / Bg_MPFM + GOR *(Qo_MPFM/Bo_MPFM) (2) Qvw_sc = Qvw_MPFM / Bw_MPFM (3) PVTp software produces a table with discrete values at pressure and temperature steps. Therefore, interpolated values at the exact pressure and temperature of the MPFM and test separator are calculated based on weighted average: Bo_av=[(1/x1)*Bo1+(1/x2)*Bo2+(1/x3)*Bo3]/(x1+x2+x3) (4) Where: x1 - is the first smallest distance between Bo @ line p,T and available Bo (at discrete p,T) x2 - is the second smallest distance between Bo @ line p,T and available Bo (at discrete p,T) x3 - is the third smallest distance between Bo @ line p,T and available Bo (at discrete p,T) Comparison of MPFM flowrates at standard conditions to flowrates calculated from the spreadsheet is presented in Figure 6. Average relative errors for gas and oil flowrates are 2% and 3.7%, respectively, with maximum errors of 4% for gas and 10.5% for oil. This deviation is due to differences between the EOS used in the multiphase meter and in the PVTp software, with a higher impact at high operational pressure. Three out of four well tests with Qo error of 9 to 10%, were performed for higher pressure at the MPFM (130 bar) than the average of 97 bara.

FIGURE 6CONDITIO
5.2 Flow Test sepTotal oiin oil awater crecalcul Equatio Qvg_sc =Qvw_sc = Equatio WCsep =Qliq_sc =Qvo_sc =Qw_sc = Correc In additThe prop > 51 bare replPVTp conditio Oil flowconvertof 738
6 QUALITY CHONS.
wrates at T
parator flowil flowrate
at meter conut is measulated to sep
ons for gas a
= Qvg_sep / Bg
= Qvw_sep / B
ons for oil Q
= WCsc*Bw_
= Qliq_sep / (W= (1-WCsc)*
WCsc*Qliq_
ction of flow
tion, gas floogrammed cbara, Z = 0.laced offlinsoftware, w
ons.
wrate from ted to stand
kg/m3 use
HECK OF CON
Test Separa
wrates wereincludes oilnditions, whured at standarator cond
and water:
g_sep + GORBw_sep
Qvo_sc (takes
_sep / (WCsc
WCsep*Bw_se
Qliq_sc + CG_sc
wrates from
owrate at stcalculation .95 for p < ne in the spwhich are
the orifice ard conditio
ed in the m
NVERSION OF
ator
e correctedl dissolved hich at standard condit
ditions, extra
R *Qvo_sc
into accoun
*Bw_sep+(1-ep+(1-WCsep
GRsep*Qg_sep
m test separ
tandard conused a fixe51 bara, andpreadsheet,
dependent
meter on thons in the spmeter [5] is
LINE FLOWR
to standardin gas, and
ndard conditions from tacted from o
nt water in o
-WCsc)*Bw_
p)*Bo_sep)p / Bg_sep
rator gas an
nditions fromd gas Z-facd default gawith calcu
t on gas
he test sepapreadsheet.s replaced
ATES FROM M
d conditiond total gas fltions appeathe test sepaoil and adde
oil):
_sep
nd oil flow
m the Ventctor and fixeas density oulated gas Zcomposition
rator oil leg In additiowith oil d
MULTIPHASE
ns using equlowrate inclar as free pharator oil oued to the wa
gasfree water
water cut liq.=oil + oil withouwater from
meters
turi meter hed gas densf 82.4 kg/m
Z-factor andn, pressure
g reported an, the defauensity calcu
METER TO S
uations (5) ludes gas dhases. In autlet. This ater flowrat
r
@ SC water in oil
ut water m oil
had to be cosity [5] (Z =
m3). These nd gas densie and tem
at line condult fixed oilulated from
8
TANDARD
to (10). dissolved addition, water is e.
(5) (6)
(7) l (8)
(9) (10)
orrected. = 0.9 for numbers ity from
mperature
ditions is l density m PVTp

9
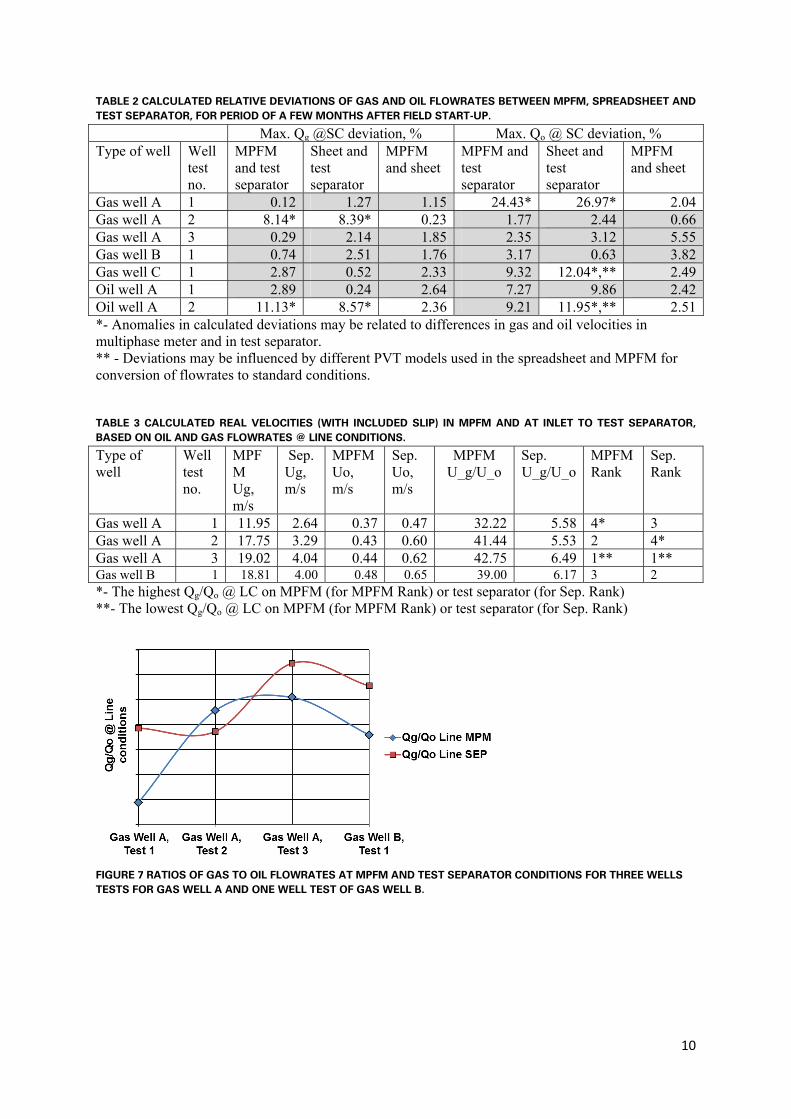
software. Such replacements resulted in changes of gas flowrate up to 33% and oil flowrate up to 18%, which is a significant difference that needed to be accounted for. Water flowrate converted to standard condition resulted in change by 1.5%. Both Venturi and orifice meters are differential pressure flow meters, which are mass (density) dependent. Therefore without knowing correct density, these meters will not give accurate measurement. An improvement in the system would be installation of a densitometer, especially on the oil outlet of the test separator. However, the current offline correction is providing good results with substitution of densities of gas and oil from PVTp software. This calculation will have to be maintained as it requires update as composition changes. 6. Analysis of well testing results Table 2 contains examples of calculated errors of oil and gas flowrates at standard conditions, based on well test results for a few months after field start-up. Flowrates obtained from the multiphase meter and test separator are compared along with the flowrates calculated by the well testing spreadsheet. As a rule of thumb, the aim is to obtain relative differences of up to ~5% for gas and ~10% for oil flowrates between the meter and separator. Cells highlighted in grey in the table represent measurements that are within the target, on average within 1.4% for gas rates and 5.5% for oil rates. This proves good agreement between the test separator and the multiphase flow meters. Measurements marked with * or **, have much bigger deviations. Comparing flowrate deviations between the MPFM and the spreadsheet (columns 5 and 8) for all well tests, it can be seen that errors in white cells are of the same size, as for “good” measurements in grey area. This indicates that conversion of meter rates to standard conditions is not a problem, and rather something else has impact on the deviations. In order to explain these large deviations, consider Table 3. Here, gas and oil flow velocities are calculated at two locations: in the multiphase meter body and at the inlet into the test separator. Velocities were calculated from flowrates at MPFM and test separator conditions, taking into account local gas and liquid fractions. Tests were performed using the MPFM and test separator simultaneously. Comparing ratios of gas to oil velocities (columns 7 and 8), which represent how much faster gas flows in relation to liquid and ranking them for 1 being the highest and 4 being the lowest (columns 9 and 10), it can be seen that it is not necessarily always the case that the MPFM and test separator ranks are the same. For example, for gas well A, test no. 3, gas has the highest velocity compared to liquid in the MPFM and at the inlet to test separator. However, for gas well A, test no. 2, gas has 2nd highest velocity in the MPFM, but it is the lowest on test separator (see, also Figure 7). This can explain why sometimes there is a difference in GOR or CGR between the MPFM and the test separator, defined as gas to oil flowrates at standard conditions due to differences in gas and oil velocities. Such cases happened for well tests lasting 24h, while well conditions and flowrates were stable. The velocity difference is related to decreasing values of pressure and temperature from the MPFM (operating at 100 bara, 100 oC), through the flowline, up to the test separator (operating at 80 bara and 70oC). In addition, the geometry of flowlines may have influence on gas and oil velocity differences. Resulting errors may be even further enlarged, when oil and gas flowrates are converted to standard conditions.
10
TABLE 2 CALCULATED RELATIVE DEVIATIONS OF GAS AND OIL FLOWRATES BETWEEN MPFM, SPREADSHEET AND TEST SEPARATOR, FOR PERIOD OF A FEW MONTHS AFTER FIELD START-UP.
Max. Qg @SC deviation, % Max. Qo @ SC deviation, % Type of well Well
test no.
MPFM and test separator
Sheet and test separator
MPFM and sheet
MPFM and test separator
Sheet and test separator
MPFM and sheet
Gas well A 1 0.12 1.27 1.15 24.43* 26.97* 2.04Gas well A 2 8.14* 8.39* 0.23 1.77 2.44 0.66Gas well A 3 0.29 2.14 1.85 2.35 3.12 5.55Gas well B 1 0.74 2.51 1.76 3.17 0.63 3.82Gas well C 1 2.87 0.52 2.33 9.32 12.04*,** 2.49Oil well A 1 2.89 0.24 2.64 7.27 9.86 2.42Oil well A 2 11.13* 8.57* 2.36 9.21 11.95*,** 2.51*- Anomalies in calculated deviations may be related to differences in gas and oil velocities in multiphase meter and in test separator. ** - Deviations may be influenced by different PVT models used in the spreadsheet and MPFM for conversion of flowrates to standard conditions. TABLE 3 CALCULATED REAL VELOCITIES (WITH INCLUDED SLIP) IN MPFM AND AT INLET TO TEST SEPARATOR, BASED ON OIL AND GAS FLOWRATES @ LINE CONDITIONS.
Type of well
Well test no.
MPFM Ug, m/s
Sep. Ug, m/s
MPFM Uo, m/s
Sep. Uo, m/s
MPFM U_g/U_o
Sep. U_g/U_o
MPFM Rank
Sep. Rank
Gas well A 1 11.95 2.64 0.37 0.47 32.22 5.58 4* 3 Gas well A 2 17.75 3.29 0.43 0.60 41.44 5.53 2 4* Gas well A 3 19.02 4.04 0.44 0.62 42.75 6.49 1** 1** Gas well B 1 18.81 4.00 0.48 0.65 39.00 6.17 3 2 *- The highest Qg/Qo @ LC on MPFM (for MPFM Rank) or test separator (for Sep. Rank) **- The lowest Qg/Qo @ LC on MPFM (for MPFM Rank) or test separator (for Sep. Rank)
FIGURE 7 RATIOS OF GAS TO OIL FLOWRATES AT MPFM AND TEST SEPARATOR CONDITIONS FOR THREE WELLS TESTS FOR GAS WELL A AND ONE WELL TEST OF GAS WELL B.

FiguresMPFM gas-concases. small, aperformprovidesignificsimilar instabilleading higher, thereforvelocity Figure 9multiphsame, c
FIGURE 8SAME CG
FIGURE 9FLOW CO
s 8 and 9 prand the tes
ndensate weThe discrepand for oil
med for anoed flowratecantly overe
PVT comities of floto the test which me
re gas velocy difference
9 presents phase meter pcompared to
8 WELL TESTINGR).
9 WELL TESTS ONDITIONS IN
resent the qst separatorell (gas welpancy betwl flowrate ther gas-cos of gas aestimated th
mposition. ow velocitieseparator. A
eans that gacity will be es between g
plotted GORperformanc
o the test sep
NG OF TWO GA
OF THE SAMEMPFM, BUT N
quality of wr. In Figurell 1). The s
ween gas pois satisfactondensate w
and oil of hem. BothThe behav
es due to rAt the multas has a hmuch lowe
gas and oil a
R from foure was muchparator, whi
AS WELLS PRO
E OIL WELL USOT IN TEST SE
well testing oe 8, the firsscale of ga
oints from tory. How
well (gas wesimilar sca
h wells are viour of thereducing prtiphase metehigher denser than on that the MPFM
ur well tests h more stabich gave sca
ODUCING FROM
SING MPFM ANEPARATOR.
of oil and gst four testss and oil flthe MPFMever, for w
ell 2), it canale to welllocated in
e test separessure ander, the pressity; there ihe test sepaM than at th
of the samble, with vaattered flow
M THE SAME R
ND TEST SEPA
gas-condenswere perfo
lowrates is and the tes
well tests 5n be seen thl 1, while the same r
arator couldd temperatusure and temis more oilarator. Thishe test separ
me oil well. alues from
wrate values
RESERVOIR SE
ARATOR AT TH
sate wells uormed for thsimilar for st separator5-7 that havhat only the
the test sreservoir ad be explaure in the mperature al dissolved s may lead trator.
It can be sall tests alm.
ECTION (WITH
HE SAME TIME
11
using the he same all four
r is very ve been
e MPFM eparator nd have
ained by flowline
are much in gas,
to lower
seen that most the
THE
E - STABLE
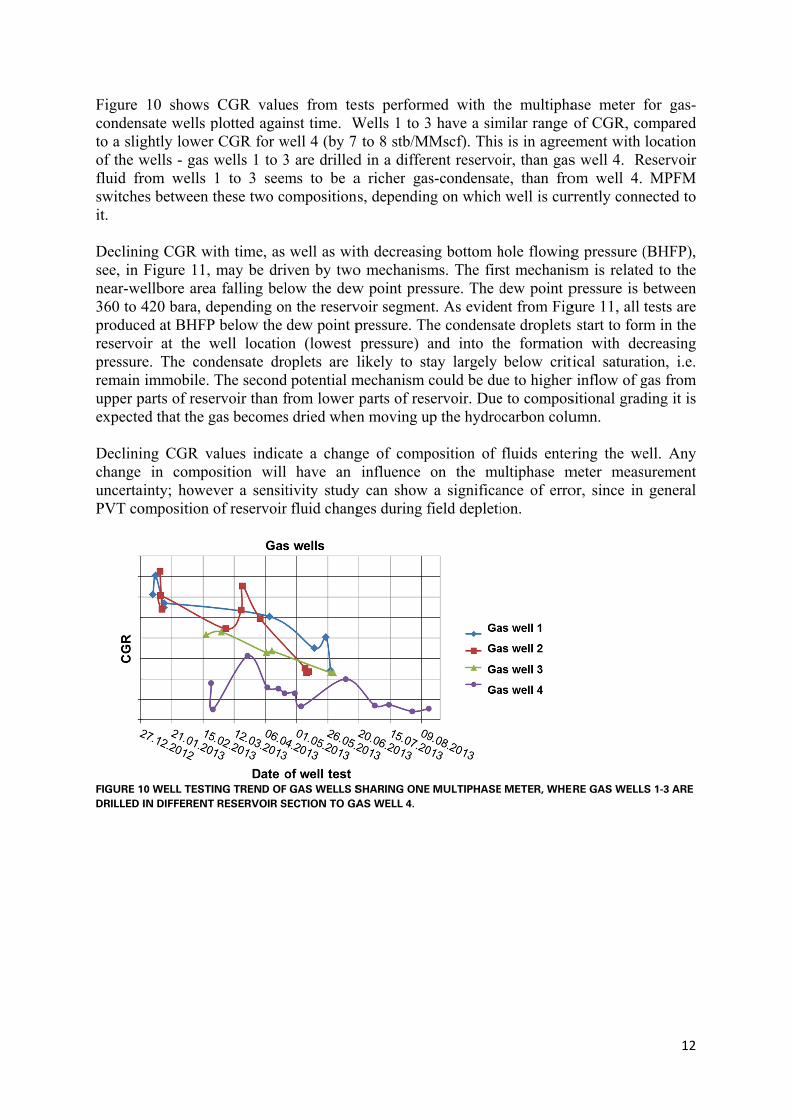
Figure condensto a sligof the wfluid frswitcheit. Declininsee, in near-we360 to 4producereservopressureremain upper pexpecte Declininchange uncertaPVT co
FIGURE 1DRILLED I
10 shows sate wells pghtly lower wells - gas wrom wells es between t
ng CGR wiFigure 11, ellbore area420 bara, deed at BHFPir at the we. The conimmobile. T
parts of reseed that the g
ng CGR vain compo
inty; howevomposition o
0 WELL TESTIIN DIFFERENT
CGR valuplotted agaiCGR for w
wells 1 to 31 to 3 seemthese two co
ith time, as may be dri
a falling belepending on
P below the well locationdensate droThe second
ervoir than fgas becomes
alues indicaosition willver a sensitof reservoir
NG TREND OF RESERVOIR S
es from tenst time. W
well 4 (by 73 are drilledms to be aompositions
well as witiven by twolow the dewn the reservdew point p
on (lowest oplets are l
d potential mfrom lower s dried when
ate a chang have an tivity studyr fluid chang
F GAS WELLS SSECTION TO GA
sts performWells 1 to 3
to 8 stb/Md in a differa richer gass, dependin
th decreasino mechanismw point presvoir segmenpressure. Thpressure) alikely to st
mechanism cparts of resn moving u
ge of compinfluence
y can show ges during f
SHARING ONEAS WELL 4.
med with th3 have a simMscf). Thisrent reservos-condensat
ng on which
ng bottom hms. The firssure. The d
nt. As evidehe condensaand into thtay largely could be du
servoir. Dueup the hydro
position of on the mua significa
field depleti
E MULTIPHASE
he multiphamilar range s is in agreeoir, than gaste, than fro
h well is cur
hole flowingst mechanisdew point pnt from Figate droplets he formatio
below critiue to higher e to composocarbon colu
fluids enterultiphase mance of erroion.
E METER, WHE
ase meter of CGR, co
ement with s well 4. Rom well 4. rrently conn
g pressure (sm is relatepressure is bgure 11, all start to for
on with detical saturatr inflow of gsitional gradumn.
ring the wemeter measor, since in
ERE GAS WELL
12
for gas-ompared location
Reservoir MPFM
nected to
(BHFP), ed to the between tests are m in the creasing tion, i.e. gas from ding it is
ell. Any urement general
LS 1-3 ARE
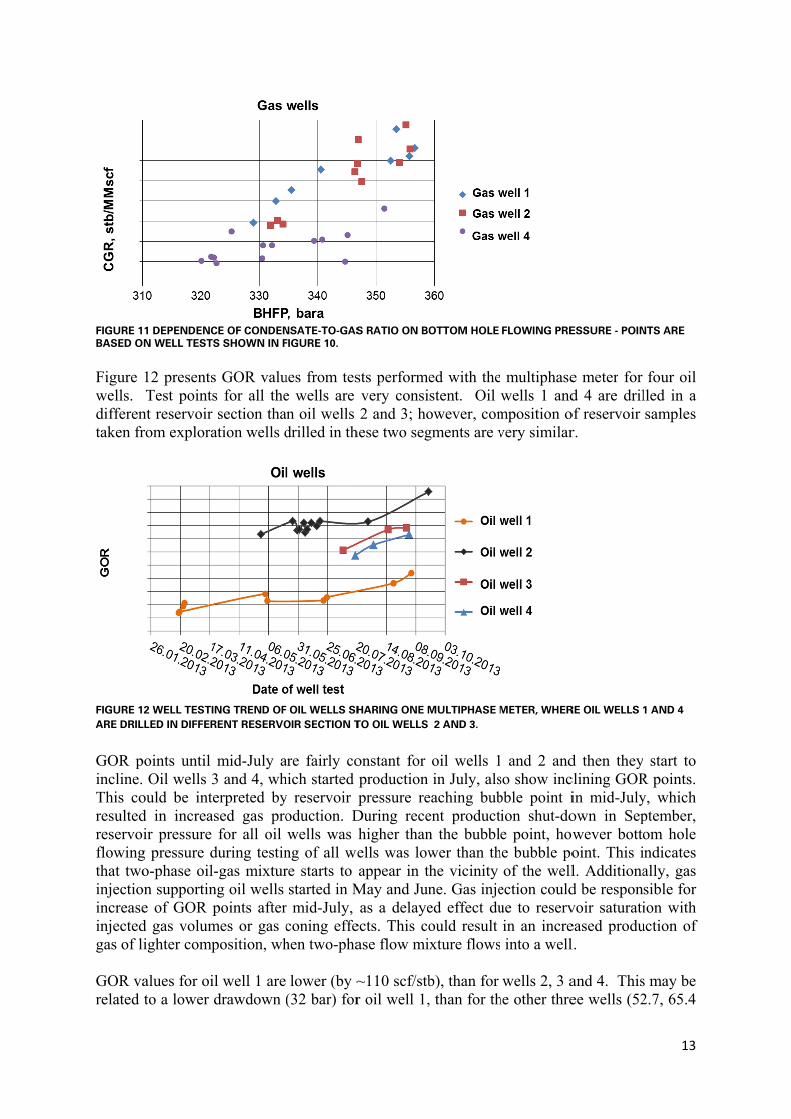
FIGURE 1BASED O
Figure wells. differentaken fr
FIGURE 1ARE DRIL
GOR pincline.This coresultedreservoflowingthat twoinjectioincreaseinjectedgas of l GOR varelated
1 DEPENDENCN WELL TESTS
12 presentsTest points
nt reservoir rom explora
2 WELL TESTILLED IN DIFFER
points until Oil wells 3
ould be inted in increasir pressure
g pressure do-phase oil-
on supportine of GOR pd gas volumighter comp
alues for oilto a lower d
CE OF CONDENS SHOWN IN F
s GOR valus for all thesection tha
ation wells d
NG TREND OFRENT RESERVO
mid-July a3 and 4, wherpreted bysed gas profor all oil
during testin-gas mixtur
ng oil wells points after
mes or gas cposition, wh
l well 1 aredrawdown
NSATE-TO-GASFIGURE 10.
ues from tese wells are an oil wells drilled in th
F OIL WELLS SHOIR SECTION T
are fairly cohich started y reservoir oduction. Dwells was
ng of all were starts to started in M
r mid-July, coning effehen two-pha
lower (by ~(32 bar) for
S RATIO ON BO
sts performevery consi2 and 3; ho
hese two seg
HARING ONE MTO OIL WELLS
onstant for productionpressure re
During recehigher thanells was lowappear in t
May and Junas a delaye
ects. This coase flow mi
~110 scf/stbr oil well 1,
OTTOM HOLE
ed with thestent. Oil owever, comgments are v
MULTIPHASE M 2 AND 3.
oil wells 1in July, als
eaching bubent productn the bubblwer than thhe vicinity ne. Gas injeed effect duould result xture flows
b), than for, than for th
FLOWING PRE
multiphasewells 1 and
mposition overy similar
METER, WHER
and 2 andso show incbble point iion shut-doe point, how
he bubble poof the well
ection couldue to reservin an incre into a well
wells 2, 3 ahe other thre
ESSURE - POIN
e meter for d 4 are dril
of reservoir r.
RE OIL WELLS 1
d then theyclining GORin mid-Julyown in Sep
owever bottooint. This il. Additionad be responvoir saturatieased produl.
and 4. Thisee wells (52
13
NTS ARE
four oil lled in a samples
1 AND 4
start to R points. y, which ptember, om hole indicates ally, gas sible for ion with
uction of
s may be 2.7, 65.4

14
and 54 bar). Drawdown drives oil and gas velocities. With higher drawdown, more free gas is flowing from wells, which is reflected by higher GOR. Based on data shown in Figures 10 to 12 the conclusion is that measured by MPFMs CGR values for gas-condensate wells and GOR values for oil wells are very consistent throughout the time observed. Multiphase meters have provided valuable information about the behaviour of Skarv wells during early field operation, which in addition to production surveillance and wells allocation purposes, are also used for constraining the dynamic model.
7. Summary This paper presents several issues related to performance of subsea multiphase meters and a test separator after start-up of the Skarv oil and gas-condensate field: 1) routing possibilities for oil and gas-condensate wells through the multiphase meters and to the test separator, 2) an issue with negative water readings from multiphase and magnetic meters for very low water flowrate (< 1 m3/h), as well as calibration solutions for the multiphase meter, 3) correction of Venturi and orifice flow meters, due to programmed constant gas and oil densities and gas compressibility factor, 4) potential impact of flow instabilities on the test separator, 5) importance of correct calculation of oil, gas and water flowrates to standard conditions, together with presented equations, 6) presented examples of well test results for Skarv oil and gas-condensate wells, including: - study of short term effects that influence CGR and GOR ratios: individual oil and gas velocities in the multiphase meters and on the inlet to the test separator, PVT models for calculation of standard conditions flow rates, - description of mechanisms that may influence CGR and GOR ratios in long term perspective:
o for the gas-condensate wells: immobile condensate droplets below critical saturation and compositional grading of reservoir fluid,
o for the oil wells: gas injection support, which may affect produced fluid composition and the value of drawdown.
The use of subsea multiphase meter technology in combination with a topside test separator has been demonstrated to provide a robust way to determine well production rates in a system of subsea tiebacks, where wells are manifolded into flowlines and therefore otherwise difficult to test effectively.

15
8. Acknowledgments We would like to acknowledge Skarv Base Management and Reservoir teams for support and interest in performance of the MPFMs and the test separator. We also would like to acknowledge BP and partners in the Skarv field: Statoil Petroleum AS, E.ON E&P Norge AS and PGNiG Upstream International AS for consent for publishing this paper and presenting it at the 31st International North Sea Flow Measurement Workshop conference in Tønsberg in Norway, 2013. 9. Abbreviations MPFM - multiphase meter GOR - gas to oil ratio [Sm3/Sm3] CGR - condensate to gas ratio [Sm3/Sm3] GVF - gas volumetric fraction [-] CVF - condensate volumetric fraction [-] WVF - water volumetric fraction [-] PVT - pressure volume temperature STO - stock tank oil LC - line conditions SC - standard conditions Bg - volume factor for gas [m3/Sm3] Bo - volume factor for oil [m3/Sm3] Bw - volume factor for water [m3/Sm3] BHFP - bottom hole flowing pressure [bara] 10. References [1] Norwegian Society for Oil and Gas Measurement, Tekna. Handbook of multiphase flow
metering; 2005. [2] Skarv ProcessNet pages: well routing to test separator, wells on MPFM, flowrates on
MPFM and test separator. [3] Framo Engineering AS: PhaseWatcher Vx Working Principles [4] Framo Engineering AS: PhaseWatcher Vx Maintenance Procedure. [5] Internal BP document: ICS functional specification system 20, separation and
stabilisation systems. [6] Universal Flow Monitors, www.flowmeters.com. [7] Flow Handbook. A practical guide: measurement technologies - applications - solutions,
Endress+Hauser Flowtec AG, Reinach; 2006. [8] Dake LP. Fundamentals of reservoir engineering. Elsevier Science B.V; 1978. [9] Internal BP document: PERA. Skarv, Snadd, & Idun Surface and Reservoir EOS Fluid
Model. Norway; 2006.