performance of tio2@rgo system-how to efficiently utilize
TRANSCRIPT

A F-ion Assisted Preparation Route to Improve the Photodegradation
Performance of TiO2@rGO System-How to Efficiently Utilize the
Photogenerated Electrons in the Target Organic Pollutants
Linjuan Guo,a,b Zheng Yang,a, b Baiyi Zu,a Bin Lu,a and Xincun Dou*a
Figure S1. (a) C 1s and (b) Ti 2p XPS spectra of the F-doped TiO2@rGO heterojunction.
Figure S2. SEM image of the F-doped TiO2@rGO heterojunction.
Electronic Supplementary Material (ESI) for RSC Advances.This journal is © The Royal Society of Chemistry 2015

Figure S3. The size distribution of the TiO2 nanocrystals of the F-doped TiO2@rGO
heterojunction.
Figure S4. The adsorption equilibrium curve of RhB solution with time in dark.

Figure S5. a) UV-vis absorption spectrum of RhB; b) Fitting curve of UV-vis absorption spectrum
of different concentrations of RhB (2-40 mg/L).
Figure S6. Bar plot showing of the remaining RhB in solution after reaching the adsorption
equilibrium in dark of rGO, F-doped TiO2, the mixture, F-doped TiO2@rGO and P25.

Figure S7. N2 adsorption-desorption isotherms of (a) the F-doped TiO2@rGO heterojunction, (b)
F-TiO2 and (c) the mixture, insets are the corresponding pore size distributions. They all resemble
the Type IV.1
Figure S8. The pH value in the liquid-phase of F-doped TiO2@rGO heterojunction towards
RhB with time under dark and UV-vis light irradiation.
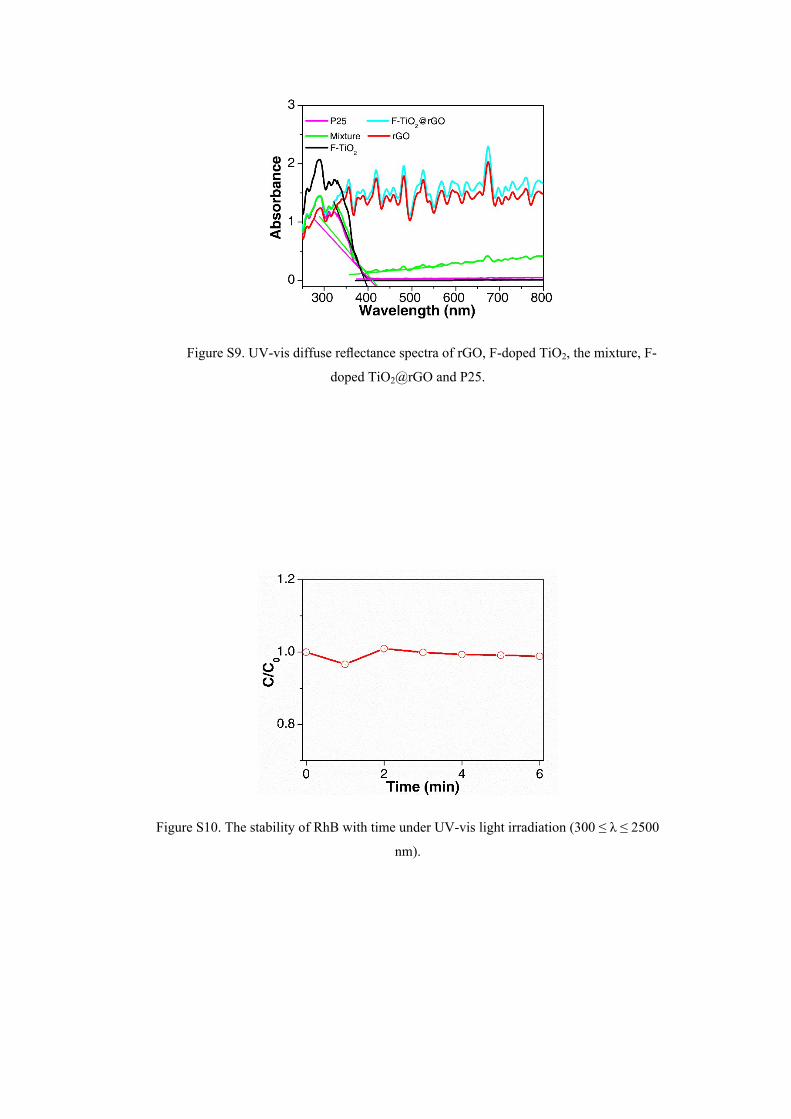
Figure S9. UV-vis diffuse reflectance spectra of rGO, F-doped TiO2, the mixture, F-
doped TiO2@rGO and P25.
Figure S10. The stability of RhB with time under UV-vis light irradiation (300 ≤ λ ≤ 2500
nm).

Figure S11. (a) The size distribution of the TiO2 nanocrystals and (b) N2 adsorption-desorption
isotherm of the pure TiO2@rGO heterojunction, inset is the corresponding pore size distribution.

Figure S12. N2 adsorption-desorption isotherms of the F-doped TiO2@rGO heterojunction with
different weight ratios of rGO ((a) 1%, (b) 5%, (c) 13% and (d) 15%), insets are the corresponding
pore size distributions.

Table S1. Average grain size of the TiO2 nanocrystals in the F-doped TiO2@rGO heterojunction
calculated by Scherrer formula in different diffraction planes.
Table S2. Surface area and average pore diameter of the F-doped TiO2@rGO heterojunction, F-
TiO2, and the mixture (F-TiO2@rGO).
Surface area (m2/g) Average pore diameter (nm)
F-doped TiO2@rGO 192.6 4.58
F-TiO2 44.6 2.1
Mixture 39.4 2.16
Pure TiO2@rGO 262.6 5.32
F-doped TiO2@(rGO-1%) 53.2 26.2
F-doped TiO2@(rGO-5%) 100.6 12.8
F-doped TiO2@(rGO-13%) 203.4 6.31
F-doped TiO2@(rGO-15%) 181.7 7.86
1. K. S. W. Sing, D. H. Everett, R. A. W. Haul, L. Moscou, R. A. Pierotti, et al., Pure Appl. Chem.,
1985, 57, 603-619.
Diffraction plane F-doped TiO2@rGO (nm)
(101) 12.11
(004) 14.97
(105) 26.49
(211) 22.83