performance prediction engineering francine berman u. c. san diego rich wolski u. c. san diego and...
Post on 19-Dec-2015
216 views
TRANSCRIPT
Performance Prediction Engineering
Francine BermanU. C. San Diego
Rich WolskiU. C. San Diego and University of
Tennessee
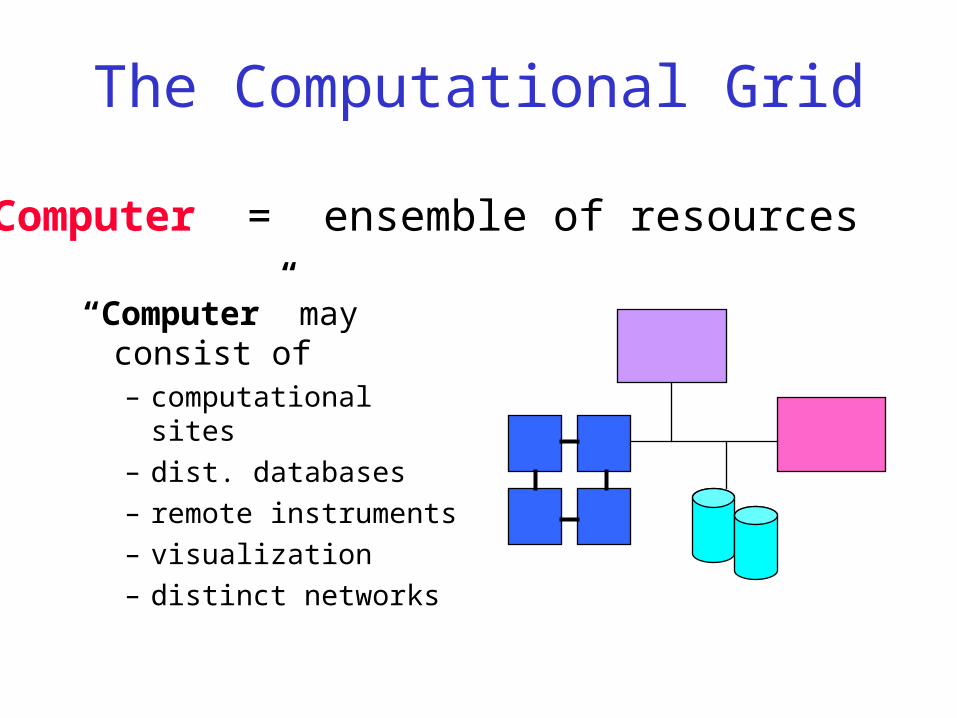
The Computational Grid
“Computer” may consist of– computational sites– dist. databases– remote instruments– visualization– distinct networks
Computer = ensemble of resources
Grid Programs
Grid programs
– may couple distributed and dissimilar resources
– may incorporate tasks with different implementations
– may adapt to dynamic resource load
Performance Models for Grid Programs
• Grid applications may couple dissimilar resources
– models must accommodate heterogeneity
• Grid applications may incorporate tasks with different implementations
– model must accommodate multiple task models
• Grid applications may adapt to dynamic resource load
– models must allow for dynamic parameters
Compositional Models
• Grid programs can be represented as a composition of tasks
• “Tasks” consist of relevant performance activities
• Model parameters may reflect performance variations of grid
– may be parameterized by time
Using Grid Performance Models
• Compositional models particularly useful for grid application scheduling
• Application schedulers use performance prediction models to– select resources– estimate potential performance of candidate
schedules– compare possible schedules

Schedulers and Performance Models
• Predictions may be used at different levels of accuracy– predictions can be “engineered”
• Knowing something about a prediction can make it more useful– performance range of predictions may provide
additional information– meta-information about predictions can improve
schedules
Performance Prediction Engineering
• Performance Prediction Engineering (PPE) System is a methodology for modeling performance in dynamic Grid environments
• 3 Components:– Structural performance prediction models
– Quantitative meta-information
– Dynamic Forecasting
Structural Models• Top-level Model = performance equation
– describes composition of application within a specific time frame (performance grammar)
• Component models
– represent application performance activities (nonterminals)
• Model parameters
– represent system or application values (terminals)

Example: Modeling the Performance of SOR
• Regular, iterative computation
• 5 point stencil
• Divided into a red phase and a black phase
• 2D grid of data divided into strips
• Targeted to WS cluster
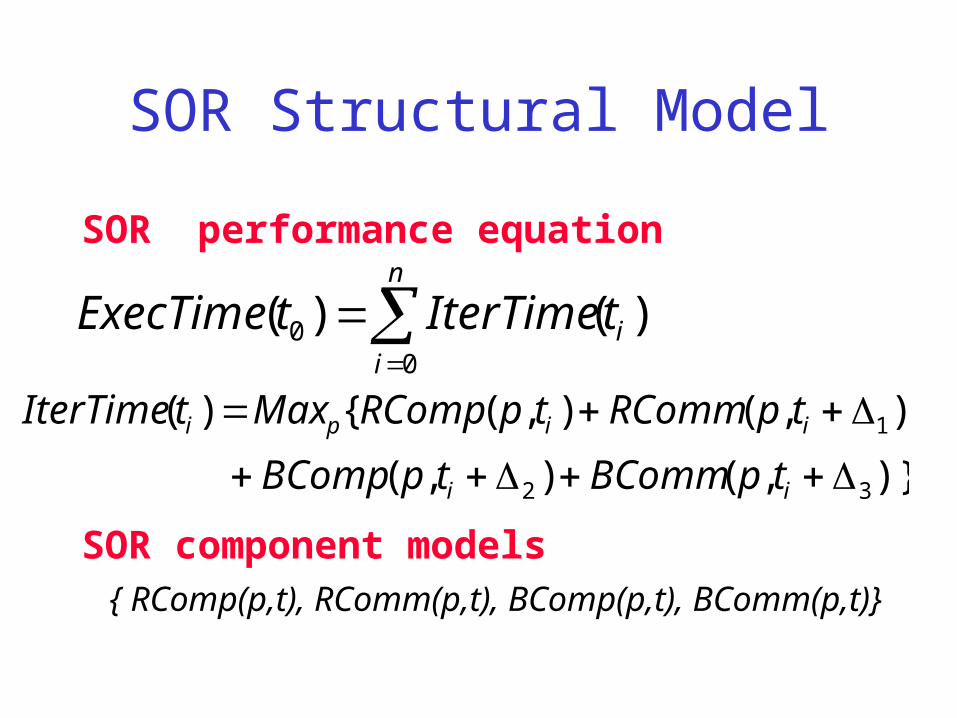
SOR Structural Model
SOR performance equation
SOR component models { RComp(p,t), RComm(p,t), BComp(p,t), BComm(p,t)}
)()(0
0
n
iitIterTimetExecTime
)},(),(
),(),({)(
32
1
ii
iipi
tpBCommtpBComp
tpRCommtpRCompMaxtIterTime

SOR Component Models
Dynamic Parameters FracAvailCPU(p,t), BWAvail(x,y,t)
)',1,(
)(
),1,(
)(),(
tppBWAvail
EltSizeColumnSize
tppBWAvail
EltSizeColumnSizetpRComm
),(
),()(),(
tpPUFracAvailC
EltpBenchmarkpNumEltstpRComp
Single-User Experiments
• Question: How well does the SOR model predict performance in a single-user cluster?
• Platform• heterogeneous Sparc cluster• 10 Mbit ethernet connection• quiescent machines and network
• Prediction within 3% before memory spill
Dedicated Platform Experiments
What happens when other users share the system?
Title:(page14.eps)Creator:(ImageMagick)Preview:This EPS picture was not savedwith a preview included in it.Comment:This EPS picture will print to aPostScript printer, but not toother types of printers.
Non-dedicated SOR ExperimentsTitle:(page15.eps)Creator:(ImageMagick)Preview:This EPS picture was not savedwith a preview included in it.Comment:This EPS picture will print to aPostScript printer, but not toother types of printers.
Improving Predictions
• Many parameters represent values which vary over time
• Range of behavior of time-dependent parameters represented by distributions
• Structural models can be extended to accommodate stochastic parameters and render stochastic predictions

Stochastic PredictionsStochastic predictions capture range of
possible behaviorTitle:(page17.eps)Creator:(ImageMagick)Preview:This EPS picture was not savedwith a preview included in it.Comment:This EPS picture will print to aPostScript printer, but not toother types of printers.
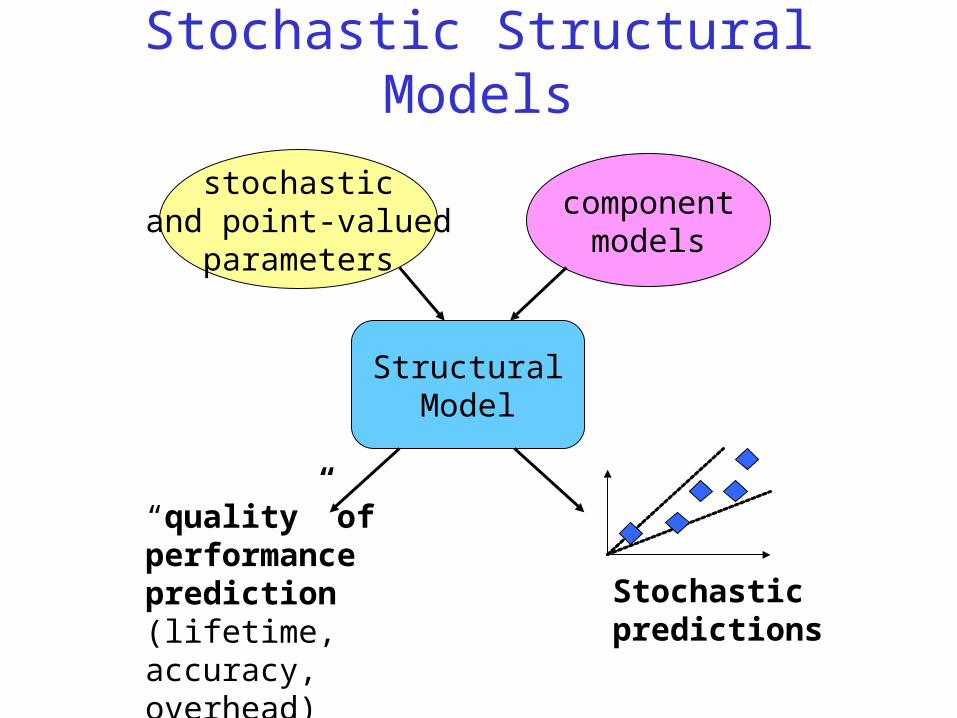
Stochastic Structural Models
Stochastic predictions
StructuralModel
stochasticand point-valued
parameters
componentmodels
“quality” of performance prediction(lifetime, accuracy,overhead)
Stochastic SOR Performance Model
• FracAvailCPU, BWAvail given by stochastic parameters
• Network Weather Service improved to provide better performance information
• First cut: consider stochastic parameters which can adequately be represented by normal distributions
– normal distributions make math tractable
Experiments with Multi-user Systems
• Platform– Sun workstation cluster– 10Mbit ethernet– experiments run in lab environment with
additional generated load
• Experiments run back-to-back for multiple trials

SOR Stochastic ParametersTitle:(page21.eps)Creator:(ImageMagick)Preview:This EPS picture was not savedwith a preview included in it.Comment:This EPS picture will print to aPostScript printer, but not toother types of printers.
BWAvail FracAvailCPU
Title:(f.eps)Creator:(ImageMagick)Preview:This EPS picture was not savedwith a preview included in it.Comment:This EPS picture will print to aPostScript printer, but not toother types of printers.
Data stays within single mode
Data changes modes
Title:(page22.top.eps)Creator:(ImageMagick)Preview:This EPS picture was not savedwith a preview included in it.Comment:This EPS picture will print to aPostScript printer, but not toother types of printers.
Title:(page22.bottom.eps)Creator:(ImageMagick)Preview:This EPS picture was not savedwith a preview included in it.Comment:This EPS picture will print to aPostScript printer, but not toother types of printers.
“Single-mode” Experiments• All values captured by stochastic predictions• Maximum absolute error between means and actual
values is 10%Title:(page29.eps)Creator:(ImageMagick)Preview:This EPS picture was not savedwith a preview included in it.Comment:This EPS picture will print to aPostScript printer, but not toother types of printers.
“Multiple Mode” Experiments• 80% of actual values captured by stochastic prediction
• Max discrepancy between stochastic prediction and actual values is 14%
• Max absolute error between means and actual values is 39%Title:(page32.eps)Creator:(ImageMagick)Preview:This EPS picture was not savedwith a preview included in it.Comment:This EPS picture will print to aPostScript printer, but not toother types of printers.
The Next Step
What if performance range of parameters cannot be adequately represented by normal distributions?– Can we identify distributions for model parameters?
– Can we combine non-normal distributions efficiently? Is the math tractable?
– Can we use empirical data to determine performance ranges if distributions cannot be identified?
Using PPE for Application Scheduling
Basic Strategy:
• Develop structural model for application
• Use stochastic parameters to provide information about performance range
• Use profiling to determine desired level of accuracy for component models
• Use stochastic prediction and meta-information to develop application schedule
Scheduling with Meta-Information
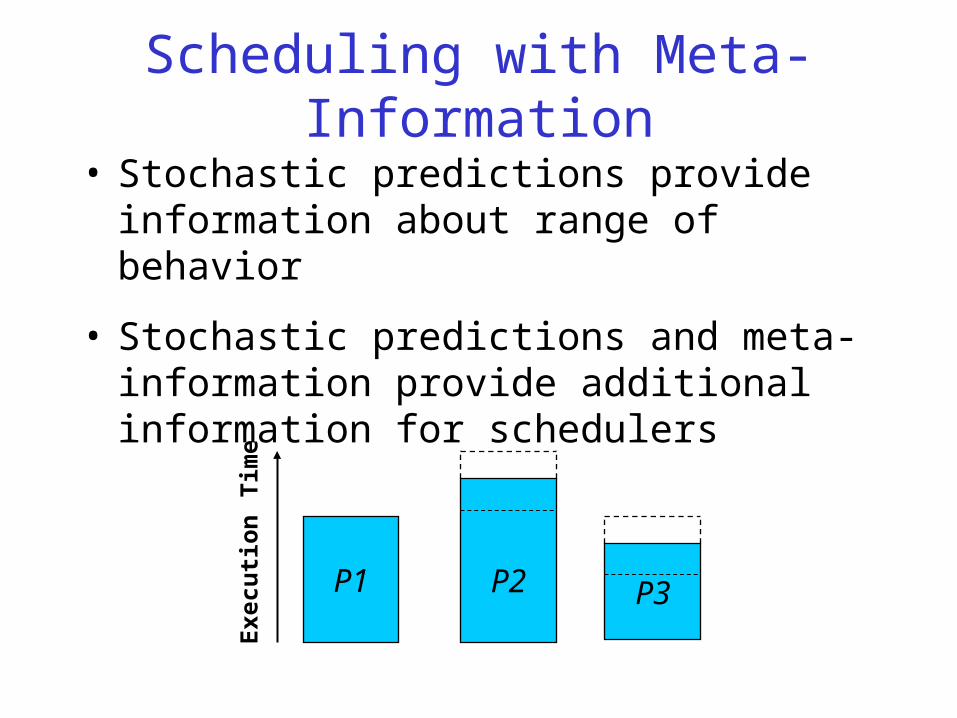
• Stochastic predictions provide information about range of behavior
• Stochastic predictions and meta-information provide additional information for schedulers
P1 P2 P3
Exe
cuti
on T
ime
Quality of Information• Meta-information = Quality of Information
• SOR stochastic predictions provide a measure of accuracy
• Other qualitative measures are possible– lifetime– overhead– complexity
• Quality of Information attributes can be used to improve scheduling
Preliminary Experiments:Application Scheduling with PPE
Simple scheduling scenario:
• SOR with strip decomposition
• Scheduling strategies adjust strip size to minimize execution time
• Multi-user cluster
– machines connected by 10 Mbit ethernet
– available CPU on at least half of the machines is multi-modal with data changing between modes frequently
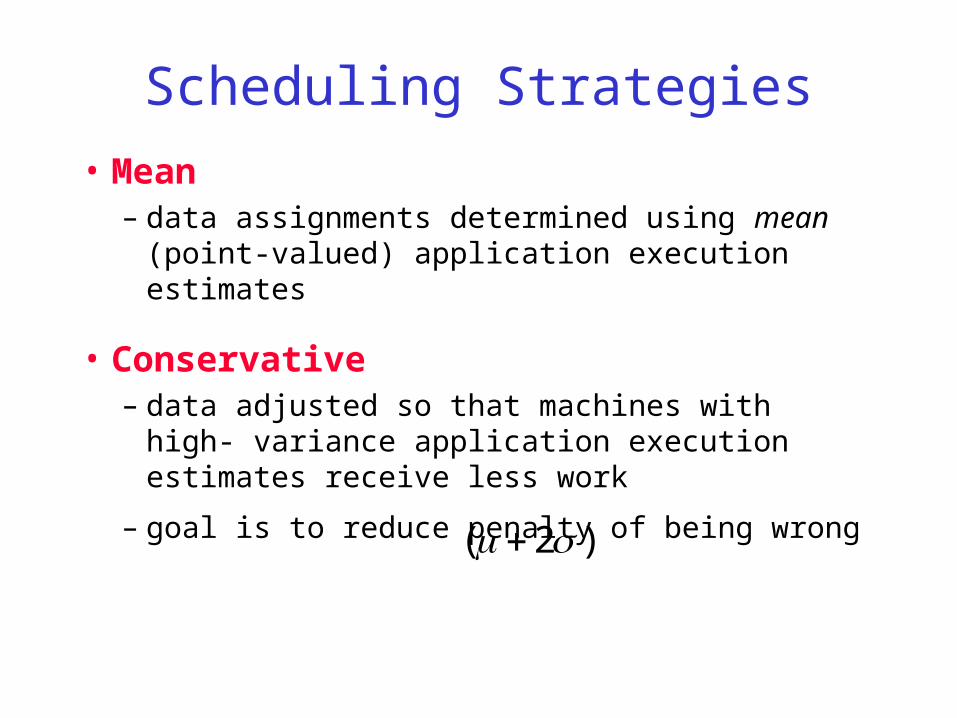
Scheduling Strategies
• Mean – data assignments determined using mean
(point-valued) application execution estimates
• Conservative– data adjusted so that machines with high-
variance application execution estimates receive less work
– goal is to reduce penalty of being wrong)2(
Preliminary Scheduling Results• Conservative scheduling strategy misses big spikes,
but is sometimes too conservative.Title:(page42.eps)Creator:(ImageMagick)Preview:This EPS picture was not savedwith a preview included in it.Comment:This EPS picture will print to aPostScript printer, but not toother types of printers.
Research Directions• Quality of Information (QoIn)
– How can we develop useful mechanisms for obtaining and quantifying performance meta-information?
– How do we combine different QoIn measures?
– How can QoIn measures enhance scheduling?
• Contingency Scheduling– Can we develop schedules which adapt dynamically
during execution?
More Research Directions
• Performance-enhanced Tools
– Netsolve enhanced with NWS and AppLeS scheduling methodology
• Performance contracts
– How should performance information be exchanged and brokered in grid systems?
– How can we develop “grid-aware” programs?
Project Information
• Thanks to Dr. Darema and DARPA for support and very useful feedback.
• Performance Prediction Engineering Home Page:
http://www-cse.ucsd.edu/groups/hpcl/ apples/PPE/index.html
• PPE team: Jennifer Schopf, Neil Spring, Alan Su, Fran Berman, Rich Wolski
Up Next: Rich Wolski
Dynamic Forecasting for Performance
Prediction Engineering with the
Network Weather Service