performance profiling tools & tricks
TRANSCRIPT
© 2015 Phase2
Performance Profiling Tools & Tricks
19 October 2015
All Things Open 2015

© 2015 Phase2
About Me
● Brad Blake● Software Architect● [email protected]● www.phase2technology.com
© 2015 Phase2
Profiling
© 2015 Phase2
Profiling is not
● Benchmarking● Debugging● A dark art
© 2015 Phase2
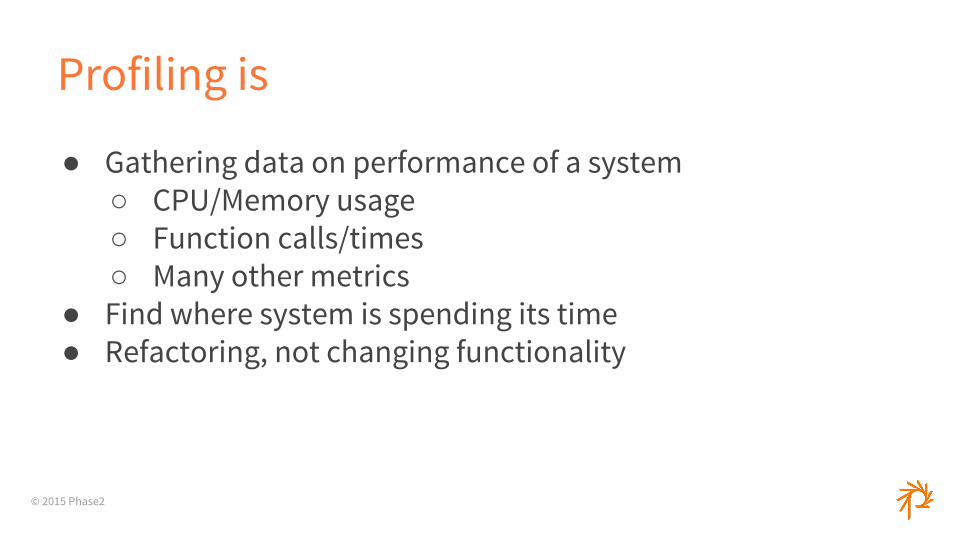
Profiling is
● Gathering data on performance of a system○ CPU/Memory usage○ Function calls/times○ Many other metrics
● Find where system is spending its time● Refactoring, not changing functionality

© 2015 Phase2
Profiling is
© 2015 Phase2
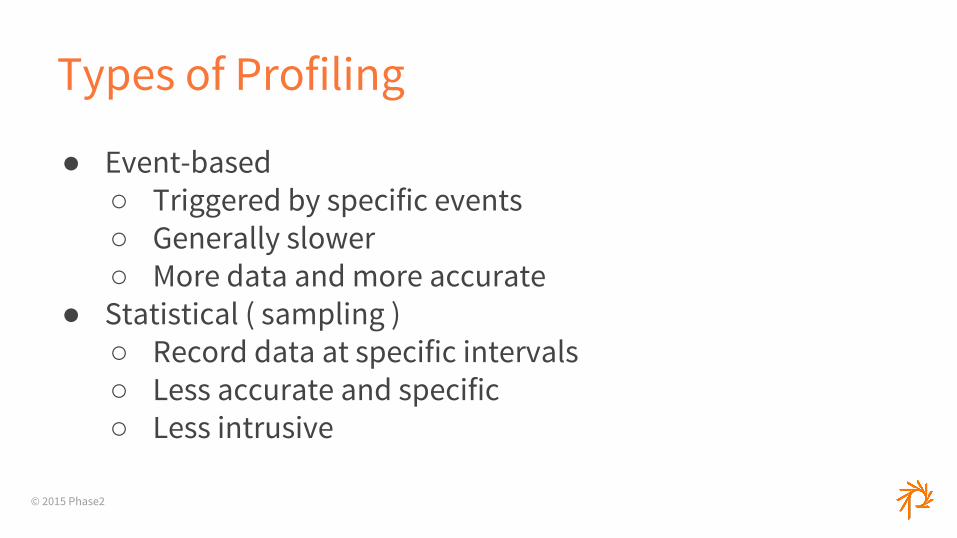
Types of Profiling
● Event-based○ Triggered by specific events○ Generally slower○ More data and more accurate
● Statistical ( sampling )○ Record data at specific intervals○ Less accurate and specific○ Less intrusive
© 2015 Phase2
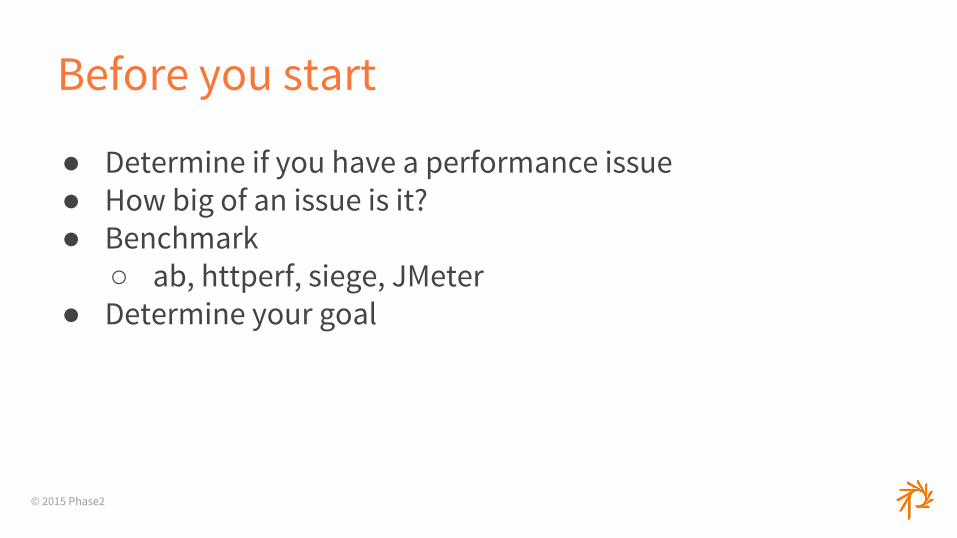
Before you start
● Determine if you have a performance issue● How big of an issue is it?● Benchmark
○ ab, httperf, siege, JMeter● Determine your goal

© 2015 Phase2
Do’s
● Get to a functional system quickly, then measure it○ Needs to be a ‘real’ system○ Alternative is to prematurely optimize
● Be data-driven● tail (-f) (-n) is your friend● Go after items with highest cost
○ Not necessarily the outliers● Test after each change

© 2015 Phase2
© 2015 Phase2
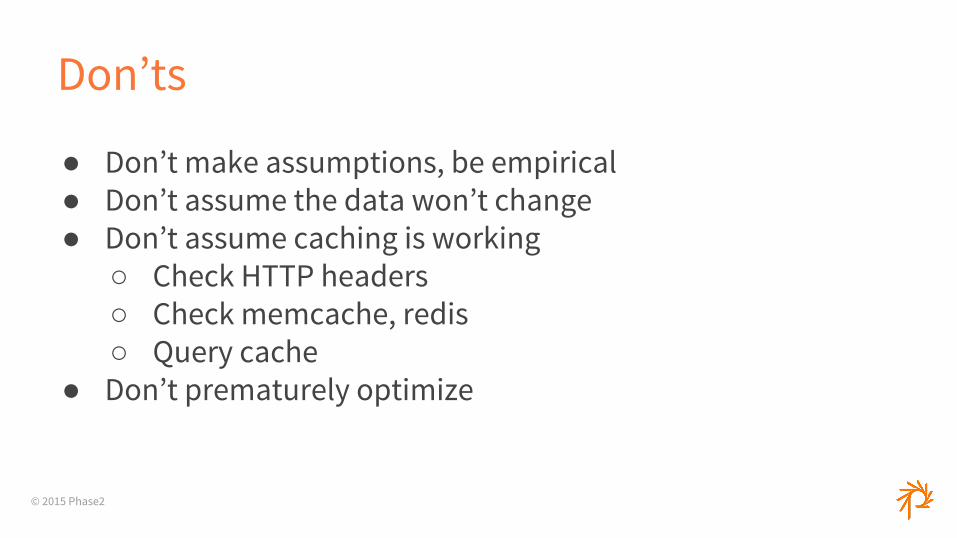
Don’ts
● Don’t make assumptions, be empirical● Don’t assume the data won’t change● Don’t assume caching is working
○ Check HTTP headers○ Check memcache, redis○ Query cache
● Don’t prematurely optimize

© 2015 Phase2
Tips
● Don’t over-optimize● Do data migration early
○ Or use realistic substitute data● Have a good test suite
○ Record metrics, graphs● Implement logging from the beginning
© 2015 Phase2
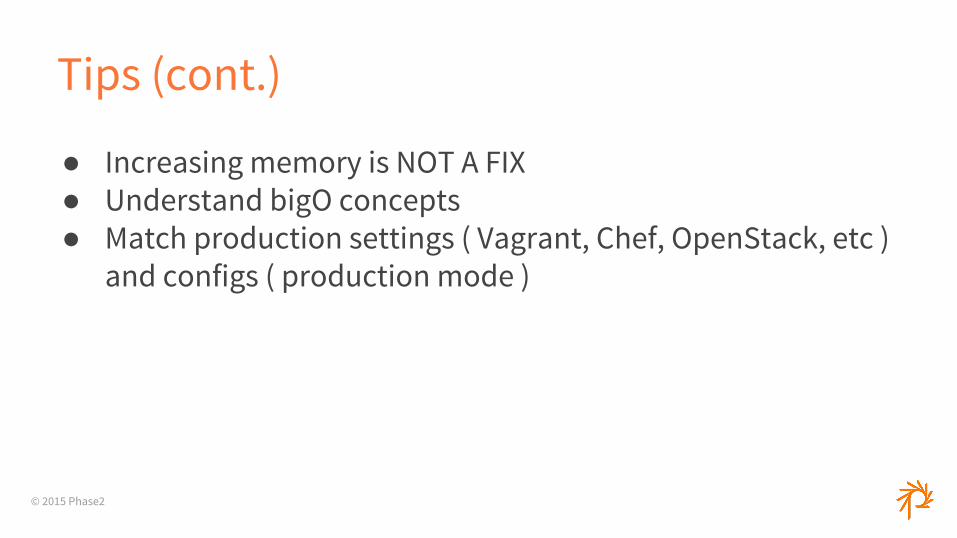
Tips (cont.)
● Increasing memory is NOT A FIX● Understand bigO concepts● Match production settings ( Vagrant, Chef, OpenStack, etc )
and configs ( production mode )
© 2015 Phase2
Tools
© 2015 Phase2
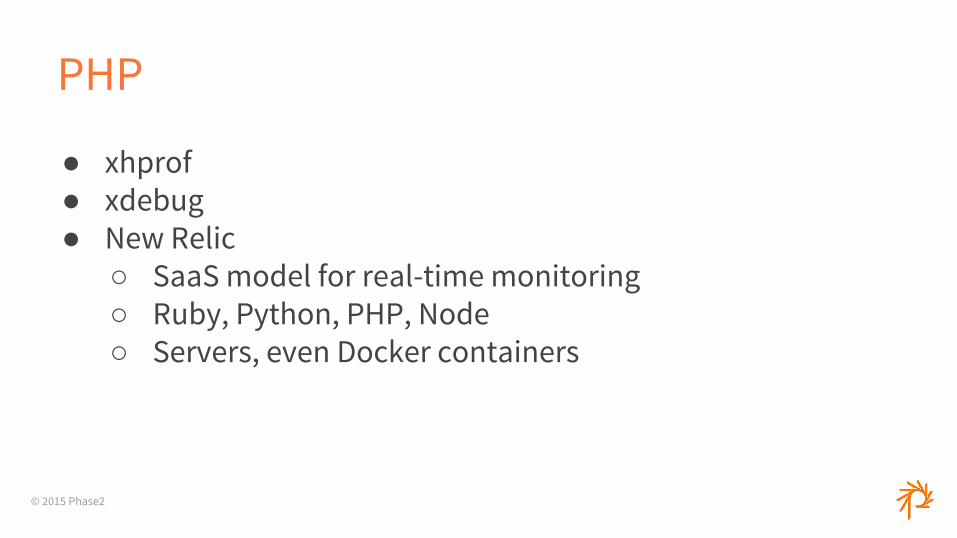
PHP
● xhprof● xdebug● New Relic
○ SaaS model for real-time monitoring○ Ruby, Python, PHP, Node○ Servers, even Docker containers
© 2015 Phase2
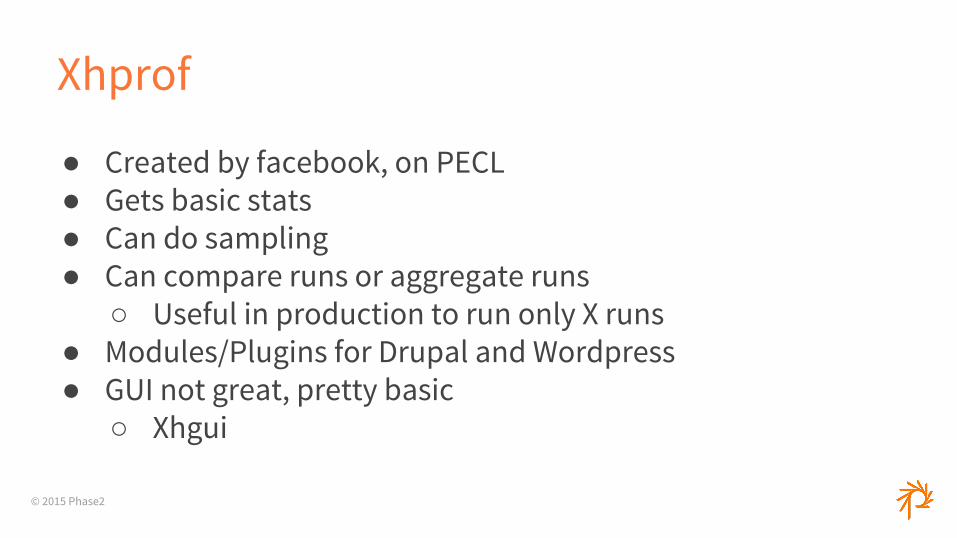
Xhprof
● Created by facebook, on PECL● Gets basic stats● Can do sampling● Can compare runs or aggregate runs
○ Useful in production to run only X runs● Modules/Plugins for Drupal and Wordpress● GUI not great, pretty basic
○ Xhgui

© 2015 Phase2
XDebug
● Debugger and Profiler● Gets a lot of data● Output can be used in kcachegrind ( qcachegrind )● phpStorm integration brew install qcachegrind brew install graphviz qcachegrind path-to-file
© 2015 Phase2
Ruby
● Run with production settings● Built-In Profiler__ module
○ Very basic, limited data

© 2015 Phase2
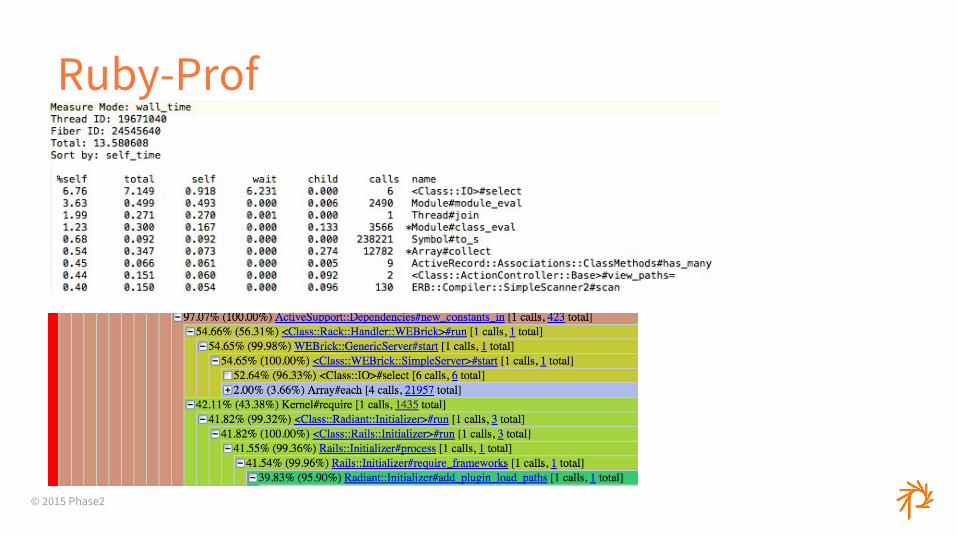
Ruby-Prof
● Event-based● Lots of reports and options
○ Text/HTML reports○ Flat profiles, call graphs, call stacks
● Can profile whole app or blocks of code
© 2015 Phase2
Ruby-Prof
© 2015 Phase2
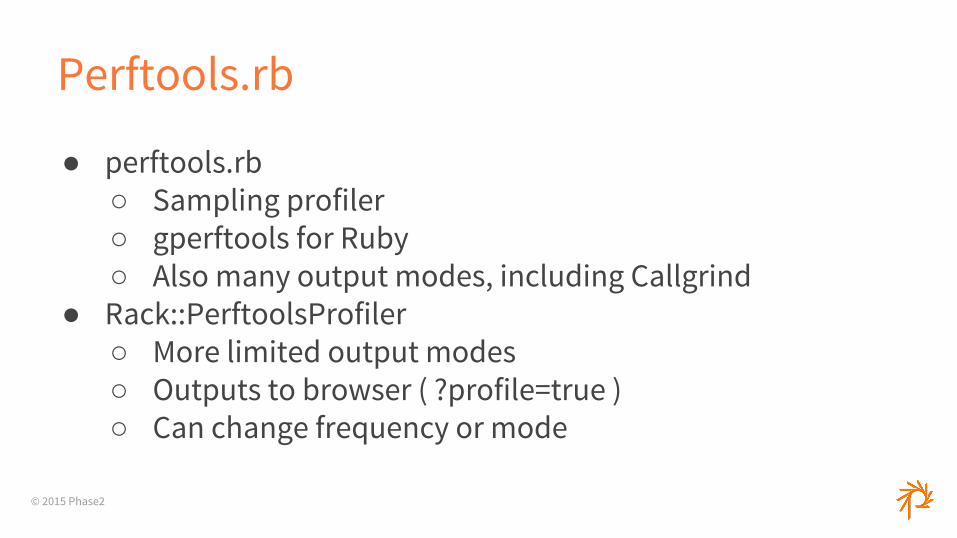
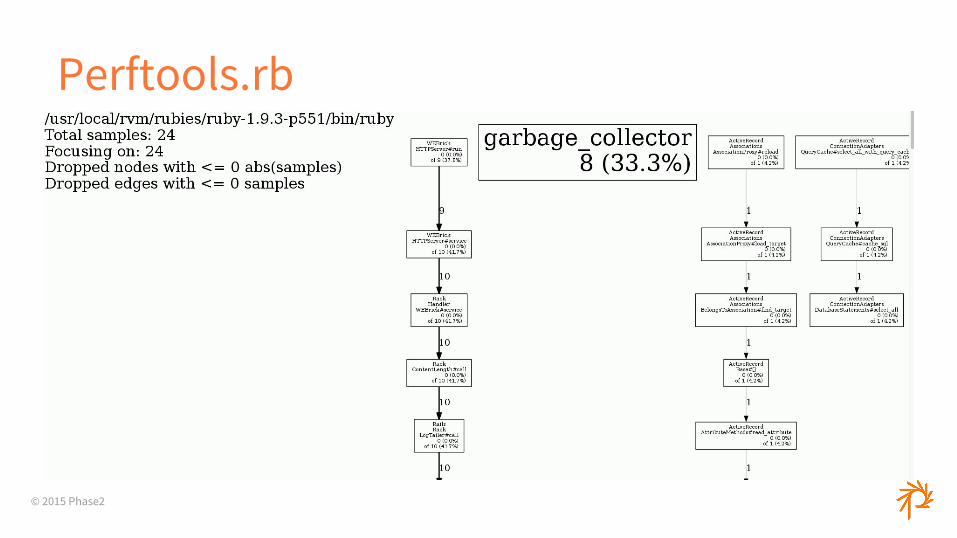
Perftools.rb
● perftools.rb○ Sampling profiler○ gperftools for Ruby○ Also many output modes, including Callgrind
● Rack::PerftoolsProfiler○ More limited output modes○ Outputs to browser ( ?profile=true )○ Can change frequency or mode
© 2015 Phase2
Perftools.rb
© 2015 Phase2
Node.js
● Node-Webkit-Agent● Webstorm● StrongLoop Arc● NodeSource

© 2015 Phase2
Flamegraphs
© 2015 Phase2
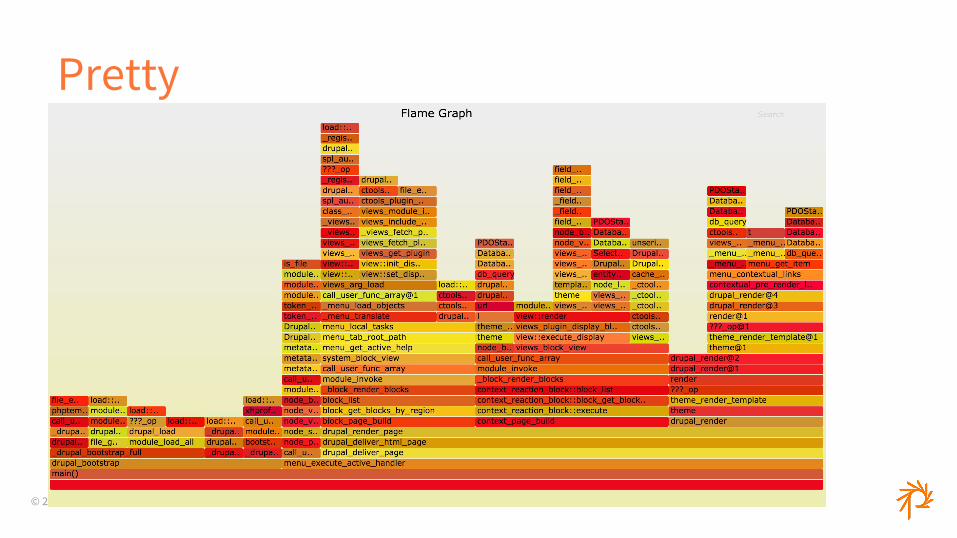
Pretty
© 2015 Phase2
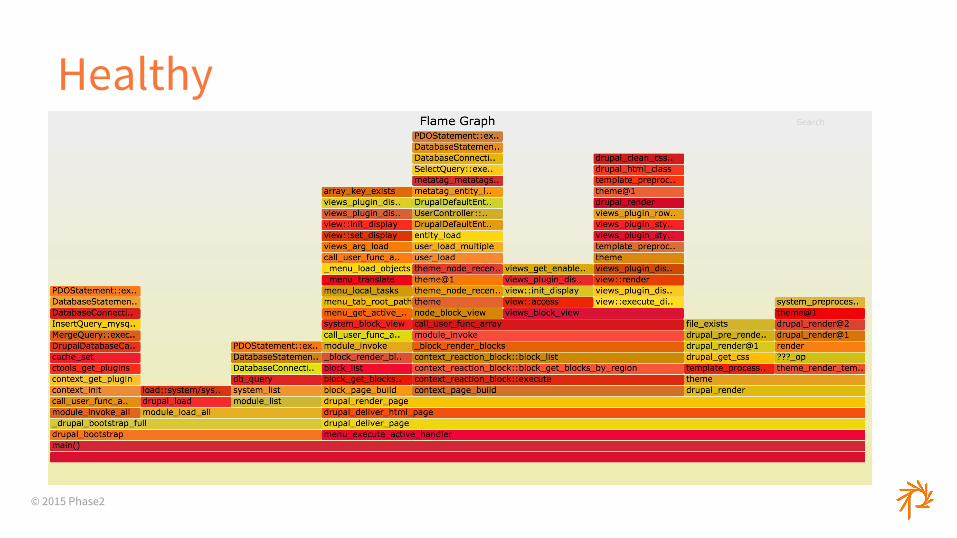
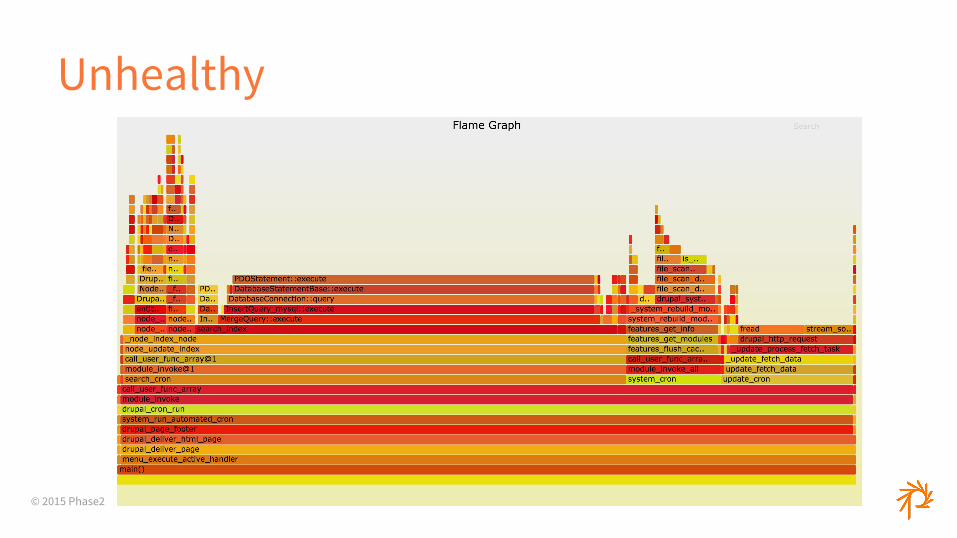
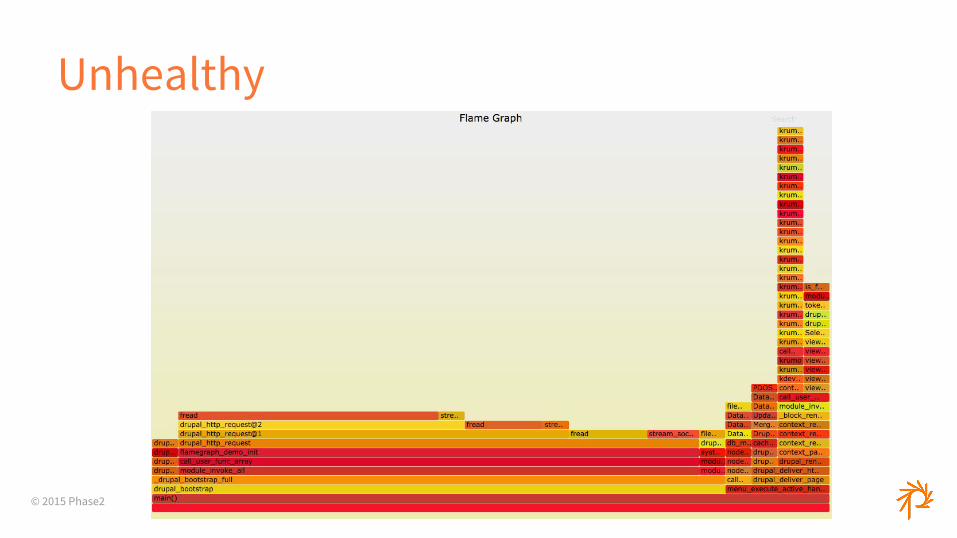
What is a Flamegraph?
● Visual representation of profiled software○ For our purposes, the call stack
● Each layer is a function● Each column is the amount of time spent

© 2015 Phase2
Why use a Flamegraph?
● Easier for non-technical people● Easy to diagnose the quick problems
○ What was on the CPU at each interval● Low overhead● Pretty
© 2015 Phase2
How to Generate
● https://github.com/brendangregg/FlameGraph● Call stack data converted to right format
● PHP○ https://github.com/msonnabaum/xhprof-flamegraphs○ Xdebug○ Drupal: xhprof_sample + xhprof_flamegraph
© 2015 Phase2
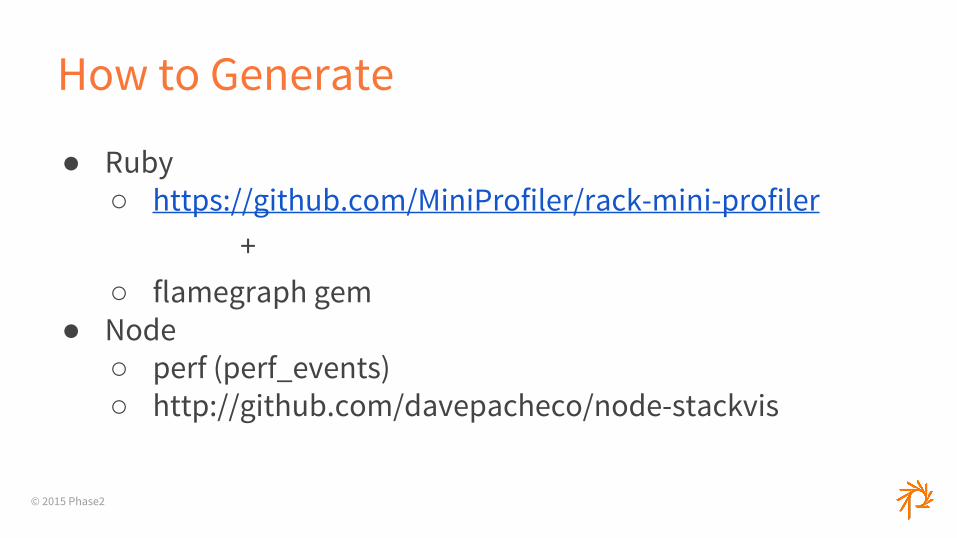
How to Generate
● Ruby○ https://github.com/MiniProfiler/rack-mini-profiler +○ flamegraph gem
● Node○ perf (perf_events)○ http://github.com/davepacheco/node-stackvis
© 2015 Phase2
Healthy
© 2015 Phase2
Unhealthy
© 2015 Phase2
Unhealthy
© 2015 Phase2
Query Tuning
© 2015 Phase2
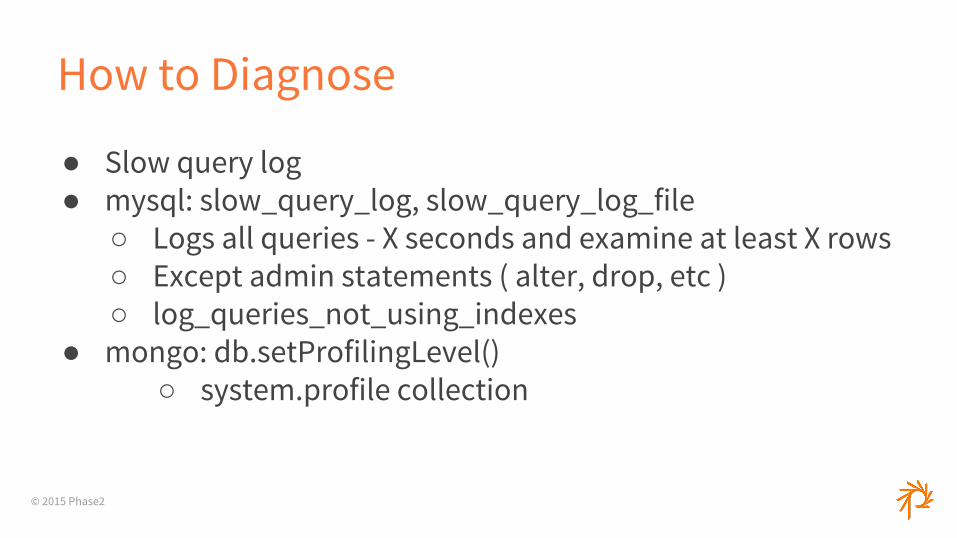
How to Diagnose
● Slow query log● mysql: slow_query_log, slow_query_log_file
○ Logs all queries - X seconds and examine at least X rows○ Except admin statements ( alter, drop, etc )○ log_queries_not_using_indexes
● mongo: db.setProfilingLevel()○ system.profile collection
© 2015 Phase2
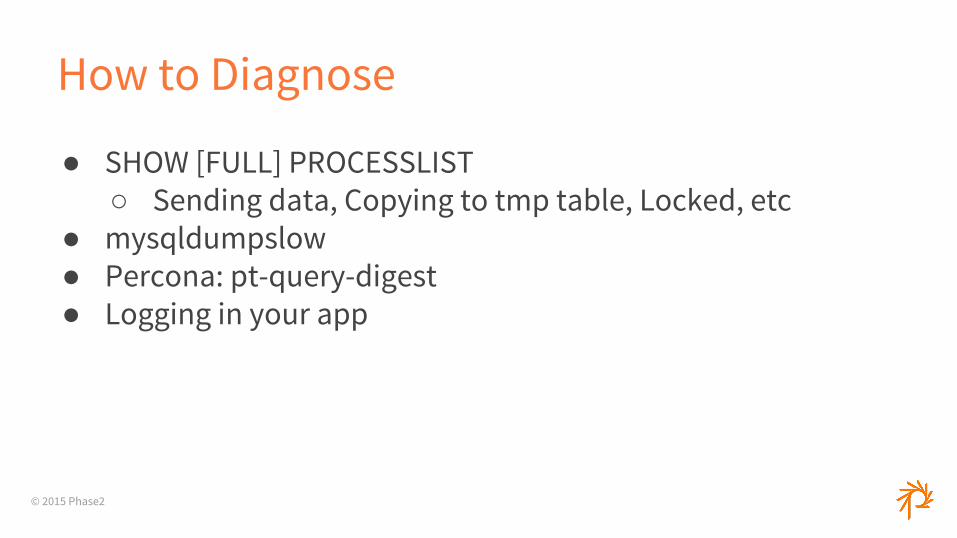
How to Diagnose
● SHOW [FULL] PROCESSLIST○ Sending data, Copying to tmp table, Locked, etc
● mysqldumpslow● Percona: pt-query-digest● Logging in your app
© 2015 Phase2
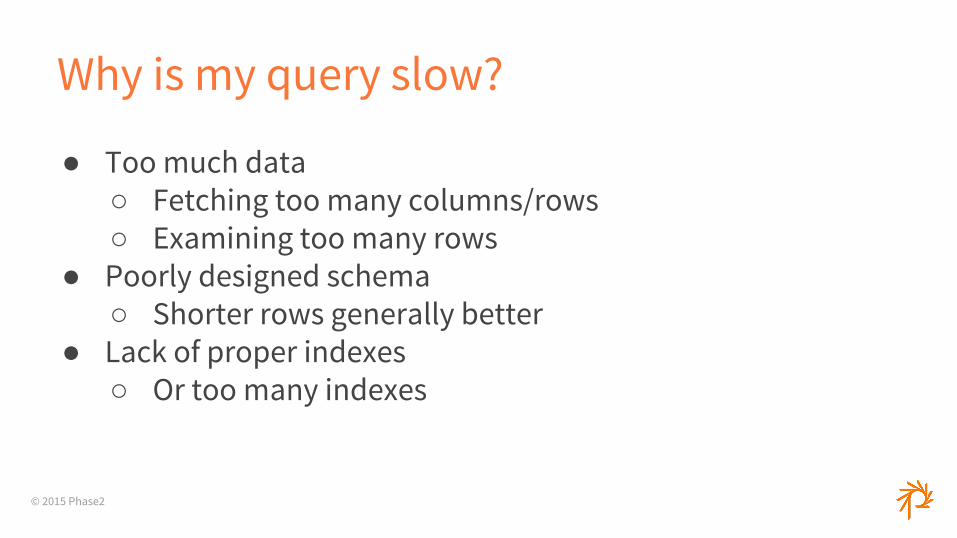
Why is my query slow?
● Too much data○ Fetching too many columns/rows○ Examining too many rows
● Poorly designed schema○ Shorter rows generally better
● Lack of proper indexes○ Or too many indexes
© 2015 Phase2
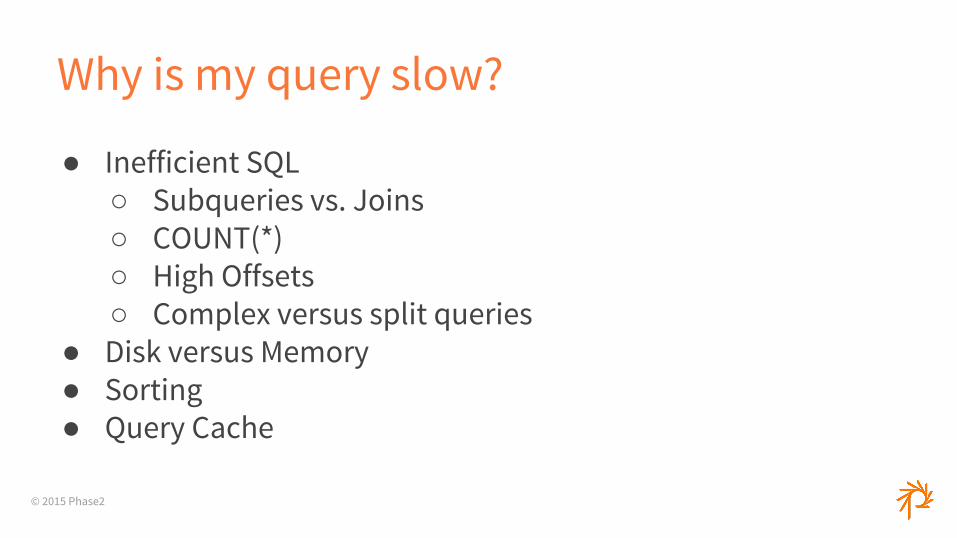
Why is my query slow?
● Inefficient SQL○ Subqueries vs. Joins○ COUNT(*)○ High Offsets○ Complex versus split queries
● Disk versus Memory● Sorting● Query Cache
© 2015 Phase2
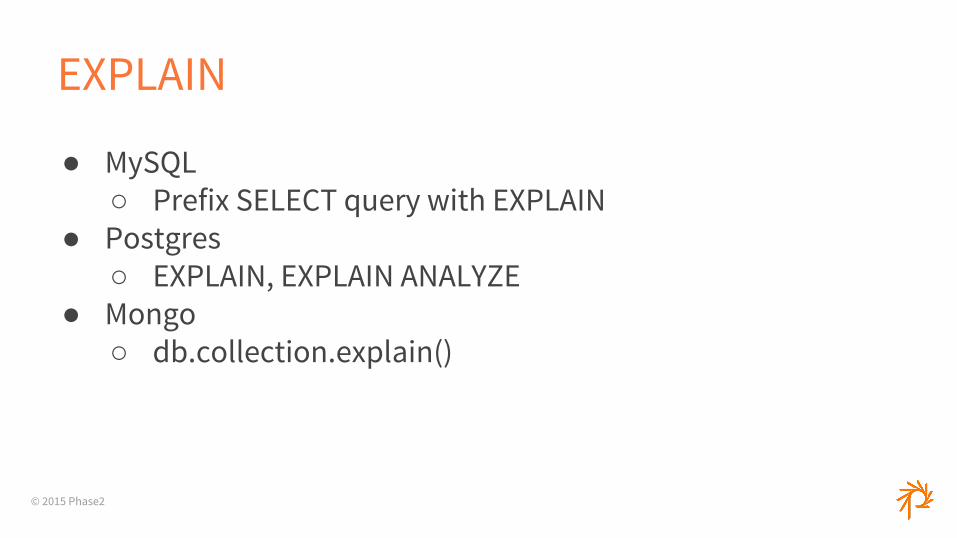
EXPLAIN
● MySQL○ Prefix SELECT query with EXPLAIN
● Postgres○ EXPLAIN, EXPLAIN ANALYZE
● Mongo○ db.collection.explain()
© 2015 Phase2
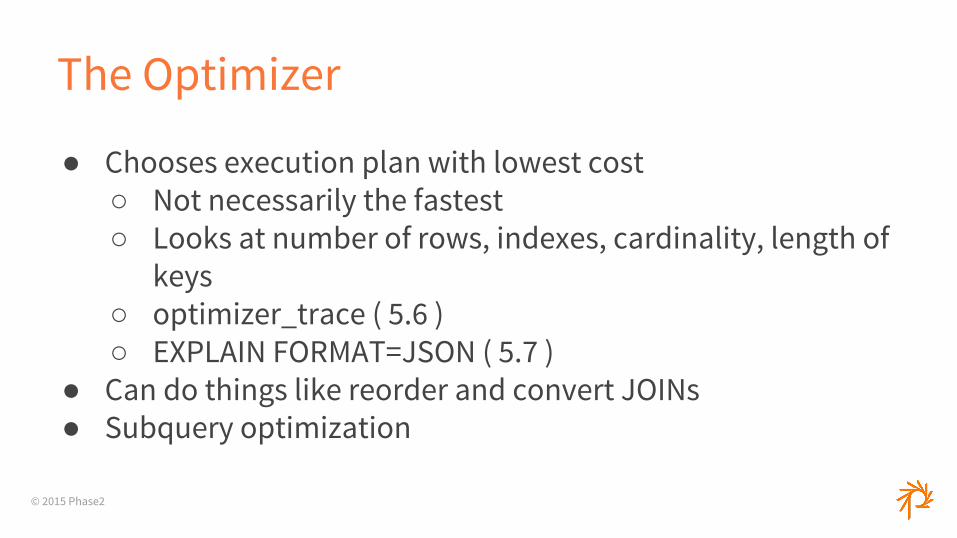
The Optimizer
● Chooses execution plan with lowest cost○ Not necessarily the fastest○ Looks at number of rows, indexes, cardinality, length of
keys○ optimizer_trace ( 5.6 )○ EXPLAIN FORMAT=JSON ( 5.7 )
● Can do things like reorder and convert JOINs● Subquery optimization
© 2015 Phase2
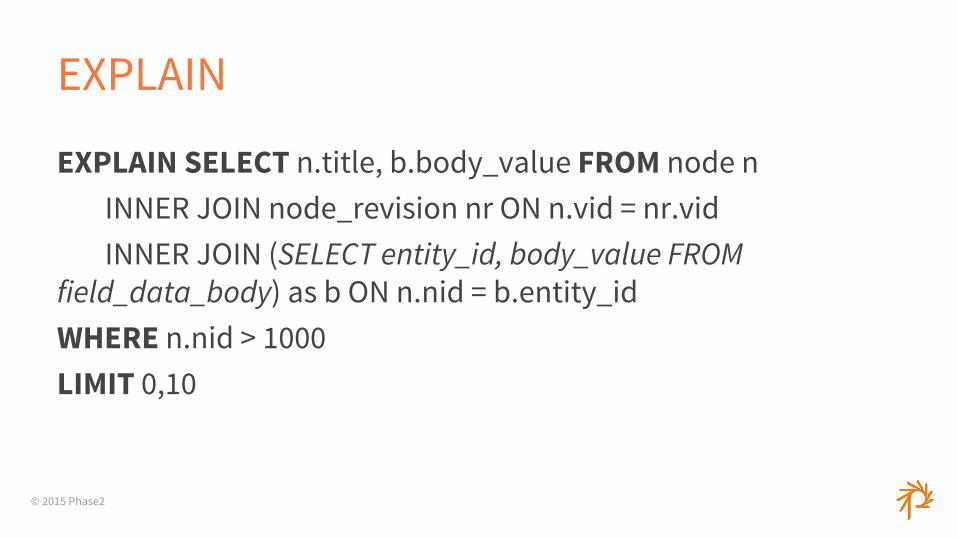
EXPLAIN
EXPLAIN SELECT n.title, b.body_value FROM node nINNER JOIN node_revision nr ON n.vid = nr.vidINNER JOIN (SELECT entity_id, body_value FROM
field_data_body) as b ON n.nid = b.entity_idWHERE n.nid > 1000LIMIT 0,10
© 2015 Phase2
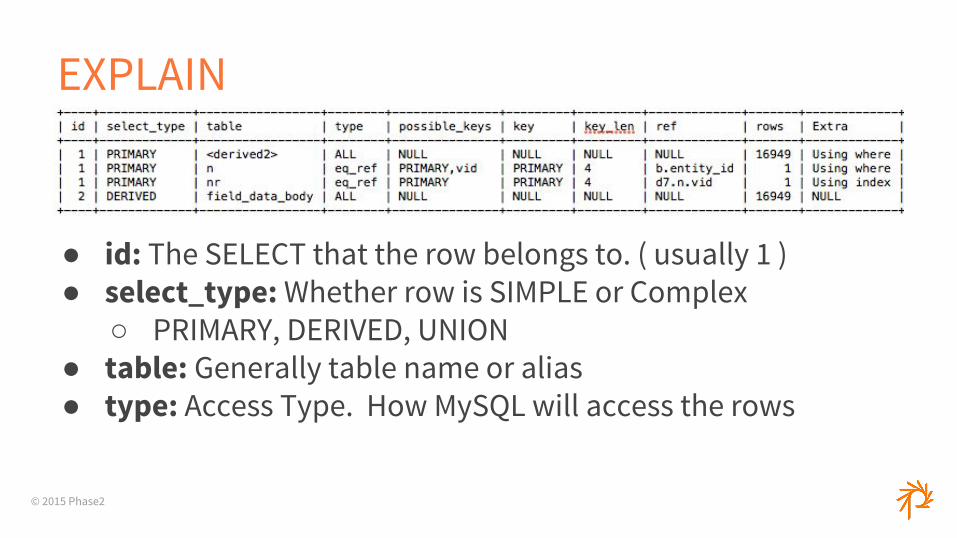
EXPLAIN
● id: The SELECT that the row belongs to. ( usually 1 )● select_type: Whether row is SIMPLE or Complex
○ PRIMARY, DERIVED, UNION● table: Generally table name or alias● type: Access Type. How MySQL will access the rows
© 2015 Phase2
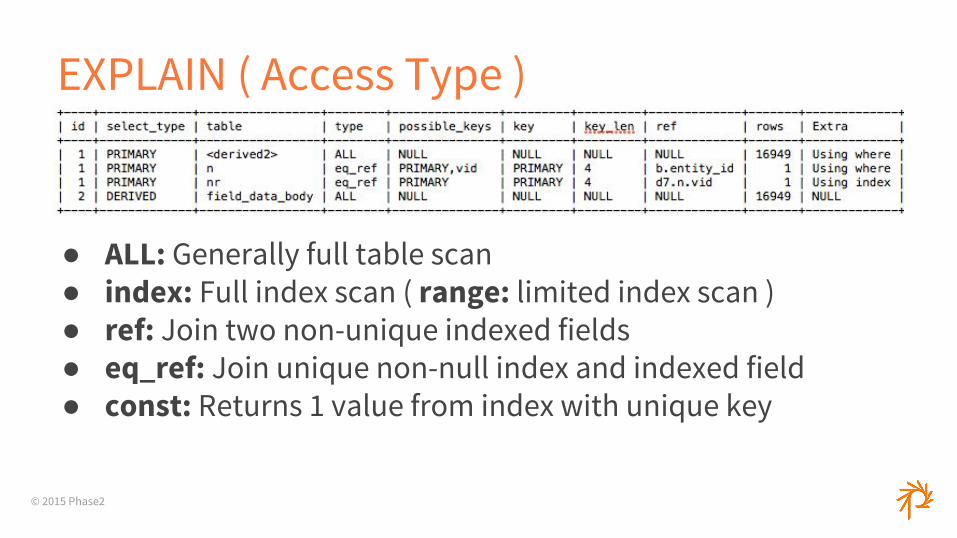
EXPLAIN ( Access Type )
● ALL: Generally full table scan● index: Full index scan ( range: limited index scan )● ref: Join two non-unique indexed fields● eq_ref: Join unique non-null index and indexed field● const: Returns 1 value from index with unique key
© 2015 Phase2
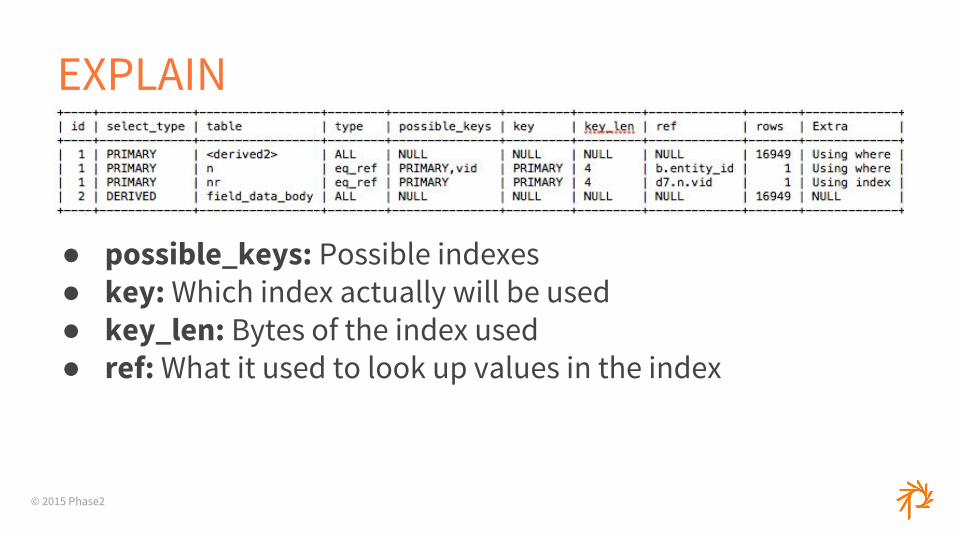
EXPLAIN
● possible_keys: Possible indexes● key: Which index actually will be used● key_len: Bytes of the index used● ref: What it used to look up values in the index
© 2015 Phase2
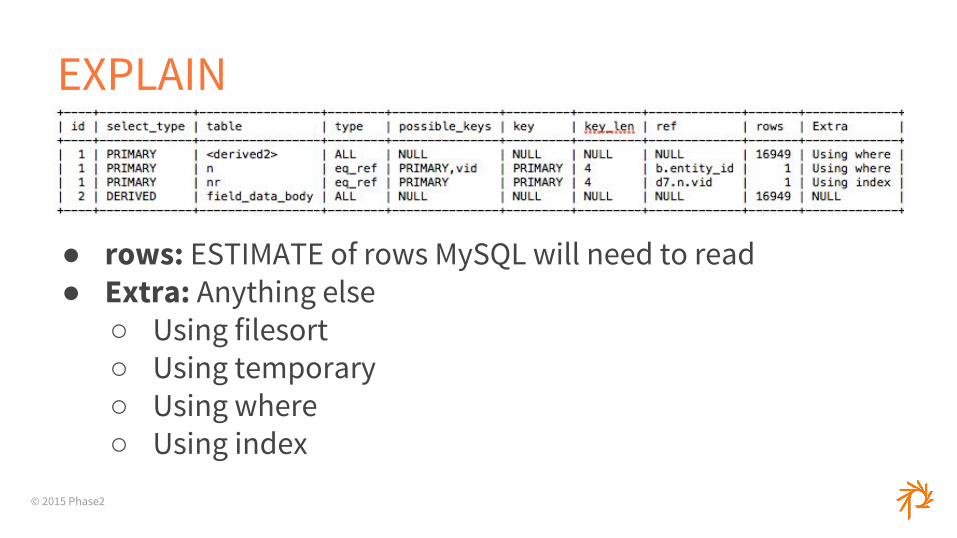
EXPLAIN
● rows: ESTIMATE of rows MySQL will need to read● Extra: Anything else
○ Using filesort○ Using temporary○ Using where○ Using index
© 2015 Phase2
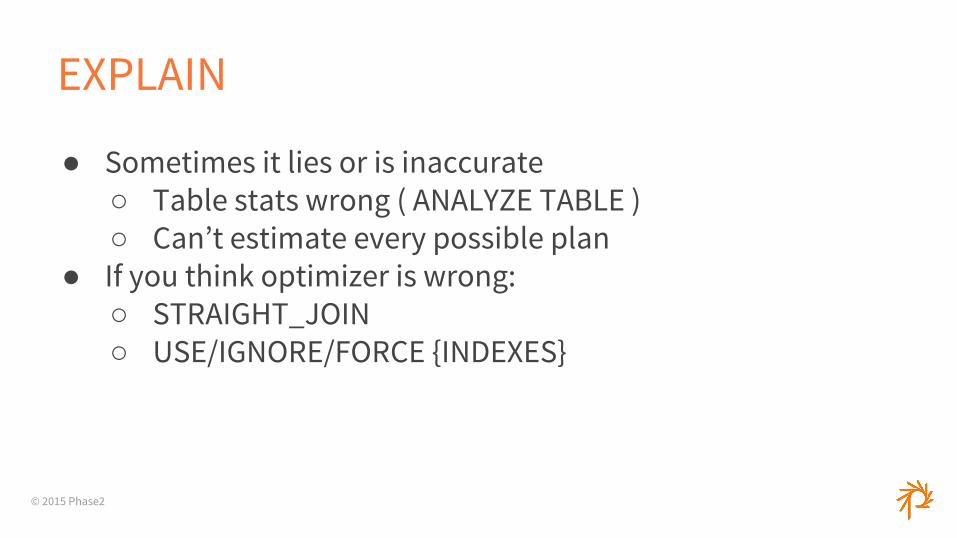
EXPLAIN
● Sometimes it lies or is inaccurate○ Table stats wrong ( ANALYZE TABLE )○ Can’t estimate every possible plan
● If you think optimizer is wrong:○ STRAIGHT_JOIN○ USE/IGNORE/FORCE {INDEXES}