performance sports group ltd
TRANSCRIPT

UNITED STATES
SECURITIES AND EXCHANGE COMMISSIONWashington, D.C. 20549
FORM 10-Q(Mark one)x QUARTERLY REPORT PURSUANT TO SECTION 13 OR 15(d) OF THE SECURITIES EXCHANGE ACT OF
1934For the quarterly period ended February 29, 2016
OR
¨ TRANSITION REPORT PURSUANT TO SECTION 13 OR 15(d) OF THE SECURITIES EXCHANGE ACT OF1934
For the transition period from to
Commission File Number 1-36506
PERFORMANCE SPORTS GROUP LTD.(Exact name of registrant as specified in its charter)
British Columbia, Canada Not applicable.(State or Other Jurisdiction
of Incorporation or Organization) (IRS Employer
Identification No.)
100 Domain Drive
Exeter, New Hampshire 03833-4801(Address of Principal Executive Offices) (Zip Code)
Registrant’s Telephone Number, Including Area Code: (603) 610-5802
Indicate by check mark whether the registrant (1) has filed all reports required to be filed by Section 13 or 15(d) of the Securities Exchange Act of
1934 during the preceding 12 months (or for such shorter period that the registrant was required to file such reports), and (2) has been subject to such
filing requirements for the past 90 days. Yes þ No o
Indicate by check mark whether the registrant has submitted electronically and posted on its corporate Web site, if any, every Interactive Data File
required to be submitted and posted pursuant to Rule 405 of Regulation S-T during the preceding 12 months (or for such shorter period that the
registrant was required to submit and post such files). Yes þ No o
Indicate by check mark whether the registrant is a large accelerated filer, an accelerated filer, a non-accelerated filer, or a smaller reportingcompany. See the definitions of “large accelerated filer,” “accelerated filer” and “smaller reporting company” in Rule 12b-2 of the Exchange Act.
Large accelerated filer o Accelerated filer o Non-accelerated filer þ Smaller reporting company o Indicate by check mark whether the registrant is a shell company (as defined in Rule 12b-2 of the Exchange Act). Yes o No þAs of the close of business on April 13, 2016, there were 45,566,680 shares of the registrant’s Common Stock outstanding.
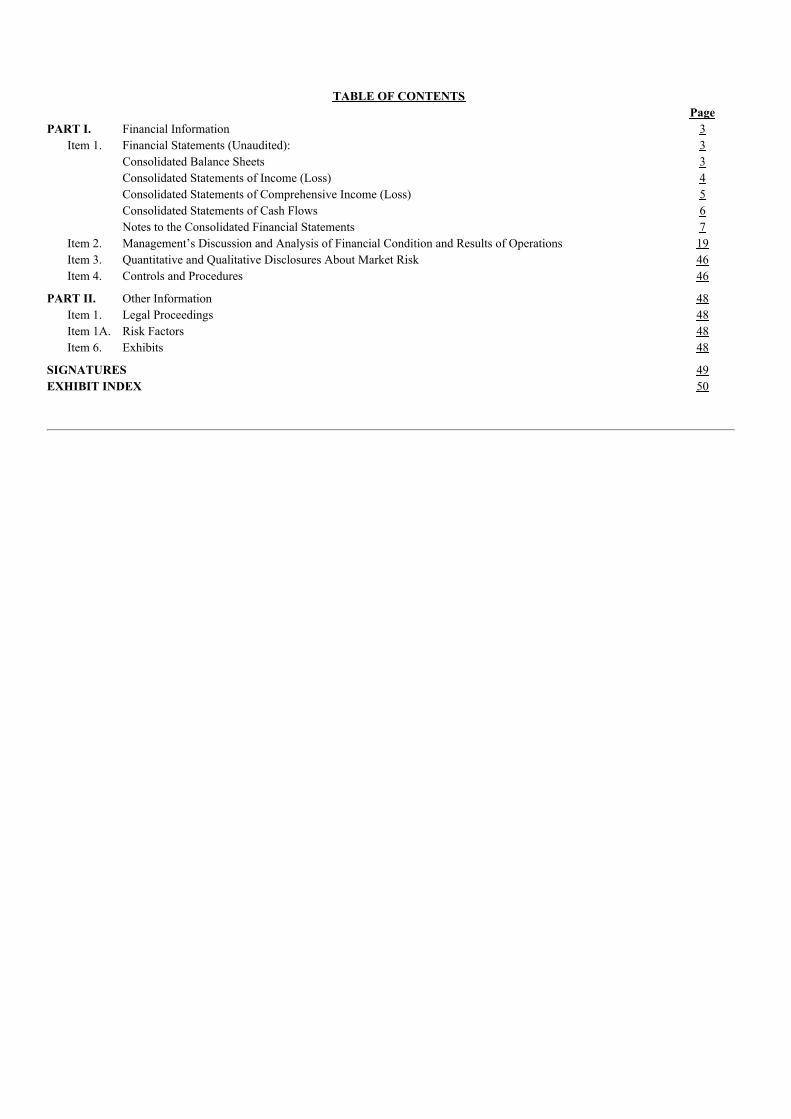
TABLE OF CONTENTS PagePART I. Financial Information 3 Item 1. Financial Statements (Unaudited): 3 Consolidated Balance Sheets 3 Consolidated Statements of Income (Loss) 4 Consolidated Statements of Comprehensive Income (Loss) 5 Consolidated Statements of Cash Flows 6 Notes to the Consolidated Financial Statements 7 Item 2. Management’s Discussion and Analysis of Financial Condition and Results of Operations 19 Item 3. Quantitative and Qualitative Disclosures About Market Risk 46 Item 4. Controls and Procedures 46 PART II. Other Information 48 Item 1. Legal Proceedings 48 Item 1A. Risk Factors 48 Item 6. Exhibits 48 SIGNATURES 49EXHIBIT INDEX 50
PART I - FINANCIAL INFORMATION
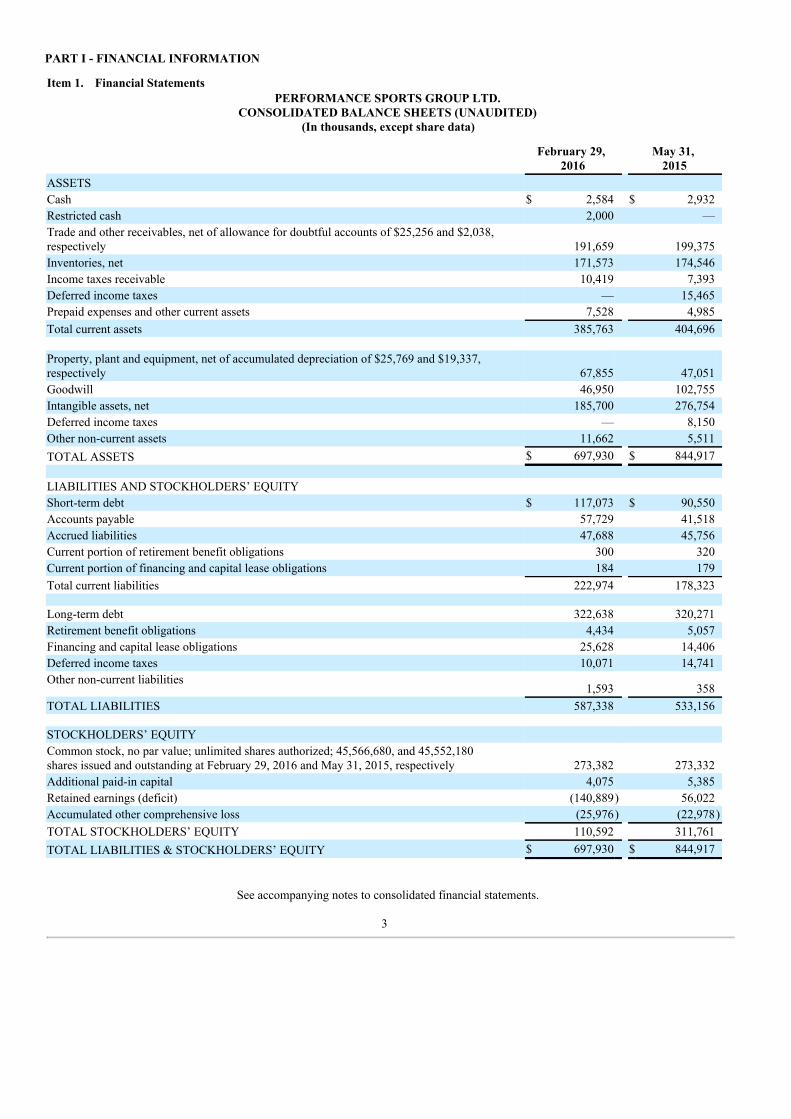
Item 1. Financial StatementsPERFORMANCE SPORTS GROUP LTD.
CONSOLIDATED BALANCE SHEETS (UNAUDITED)(In thousands, except share data)
February 29,
2016 May 31,
2015ASSETS Cash $ 2,584 $ 2,932Restricted cash 2,000 —Trade and other receivables, net of allowance for doubtful accounts of $25,256 and $2,038,respectively 191,659 199,375Inventories, net 171,573 174,546Income taxes receivable 10,419 7,393Deferred income taxes — 15,465Prepaid expenses and other current assets 7,528 4,985Total current assets 385,763 404,696 Property, plant and equipment, net of accumulated depreciation of $25,769 and $19,337,respectively 67,855 47,051Goodwill 46,950 102,755Intangible assets, net 185,700 276,754Deferred income taxes — 8,150Other non-current assets 11,662 5,511TOTAL ASSETS $ 697,930 $ 844,917 LIABILITIES AND STOCKHOLDERS’ EQUITY Short-term debt $ 117,073 $ 90,550Accounts payable 57,729 41,518Accrued liabilities 47,688 45,756Current portion of retirement benefit obligations 300 320Current portion of financing and capital lease obligations 184 179Total current liabilities 222,974 178,323 Long-term debt 322,638 320,271Retirement benefit obligations 4,434 5,057Financing and capital lease obligations 25,628 14,406Deferred income taxes 10,071 14,741Other non-current liabilities
1,593 358TOTAL LIABILITIES 587,338 533,156 STOCKHOLDERS’ EQUITY Common stock, no par value; unlimited shares authorized; 45,566,680, and 45,552,180shares issued and outstanding at February 29, 2016 and May 31, 2015, respectively 273,382 273,332Additional paid-in capital 4,075 5,385Retained earnings (deficit) (140,889) 56,022Accumulated other comprehensive loss (25,976) (22,978)TOTAL STOCKHOLDERS’ EQUITY 110,592 311,761TOTAL LIABILITIES & STOCKHOLDERS’ EQUITY $ 697,930 $ 844,917
See accompanying notes to consolidated financial statements.
3
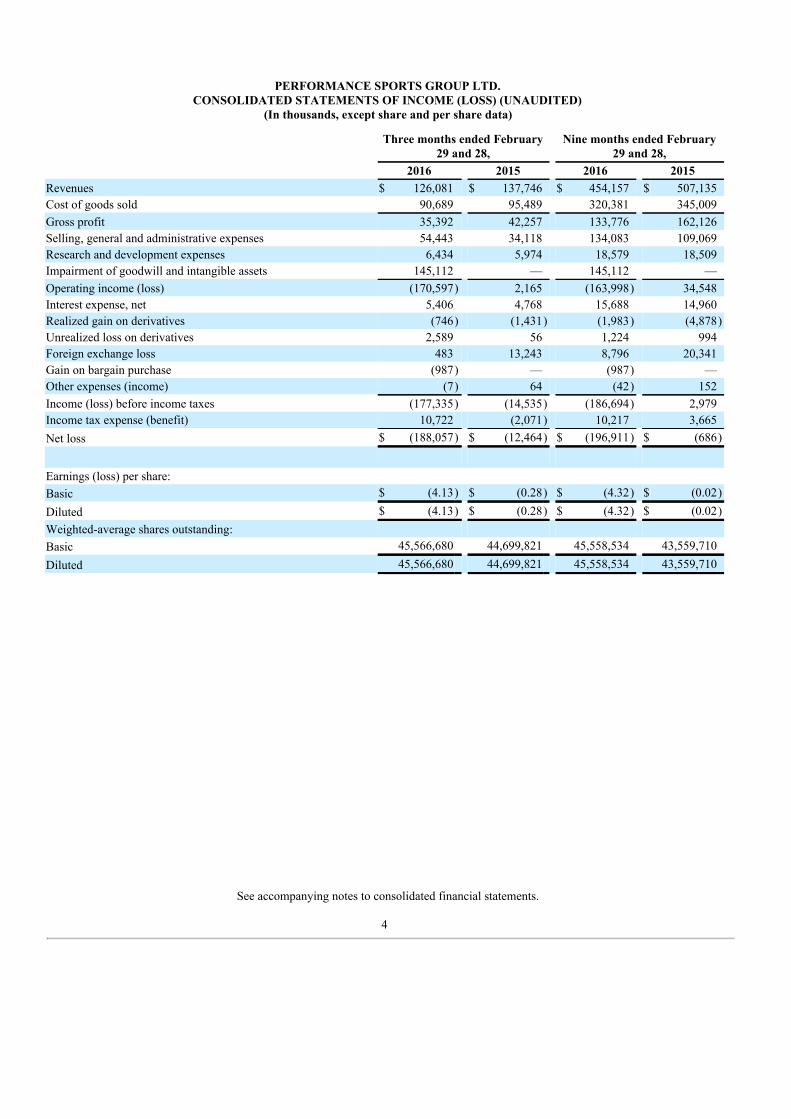
PERFORMANCE SPORTS GROUP LTD.CONSOLIDATED STATEMENTS OF INCOME (LOSS) (UNAUDITED)
(In thousands, except share and per share data)
Three months ended February
29 and 28, Nine months ended February
29 and 28, 2016 2015 2016 2015Revenues $ 126,081 $ 137,746 $ 454,157 $ 507,135Cost of goods sold 90,689 95,489 320,381 345,009Gross profit 35,392 42,257 133,776 162,126Selling, general and administrative expenses 54,443 34,118 134,083 109,069Research and development expenses 6,434 5,974 18,579 18,509Impairment of goodwill and intangible assets 145,112 — 145,112 —Operating income (loss) (170,597) 2,165 (163,998) 34,548Interest expense, net 5,406 4,768 15,688 14,960Realized gain on derivatives (746) (1,431) (1,983) (4,878)Unrealized loss on derivatives 2,589 56 1,224 994Foreign exchange loss 483 13,243 8,796 20,341Gain on bargain purchase (987) — (987) —Other expenses (income) (7) 64 (42) 152Income (loss) before income taxes (177,335) (14,535) (186,694) 2,979Income tax expense (benefit) 10,722 (2,071) 10,217 3,665Net loss $ (188,057) $ (12,464) $ (196,911) $ (686)
Earnings (loss) per share: Basic $ (4.13) $ (0.28) $ (4.32) $ (0.02)Diluted $ (4.13) $ (0.28) $ (4.32) $ (0.02)Weighted-average shares outstanding: Basic 45,566,680 44,699,821 45,558,534 43,559,710Diluted 45,566,680 44,699,821 45,558,534 43,559,710
See accompanying notes to consolidated financial statements.
4

PERFORMANCE SPORTS GROUP LTD.CONSOLIDATED STATEMENTS OF COMPREHENSIVE INCOME (LOSS) (UNAUDITED)
(In thousands)
Three months ended February
29 and 28, Nine months ended February
29 and 28, 2016 2015 2016 2015Net loss $ (188,057) $ (12,464) $ (196,911) $ (686)Other comprehensive income (loss): Foreign currency translation adjustments (144) (5,364) (3,099) (8,321)Defined benefit pension plans, net of tax:
Actuarial gains, net of tax 8 66 101 97Reclassification adjustments included in net income (loss), netof tax — 5 — 15
Other comprehensive loss (136) (5,293) (2,998) (8,209)Comprehensive loss $ (188,193) $ (17,757) $ (199,909) $ (8,895)
See accompanying notes to consolidated financial statements.
5
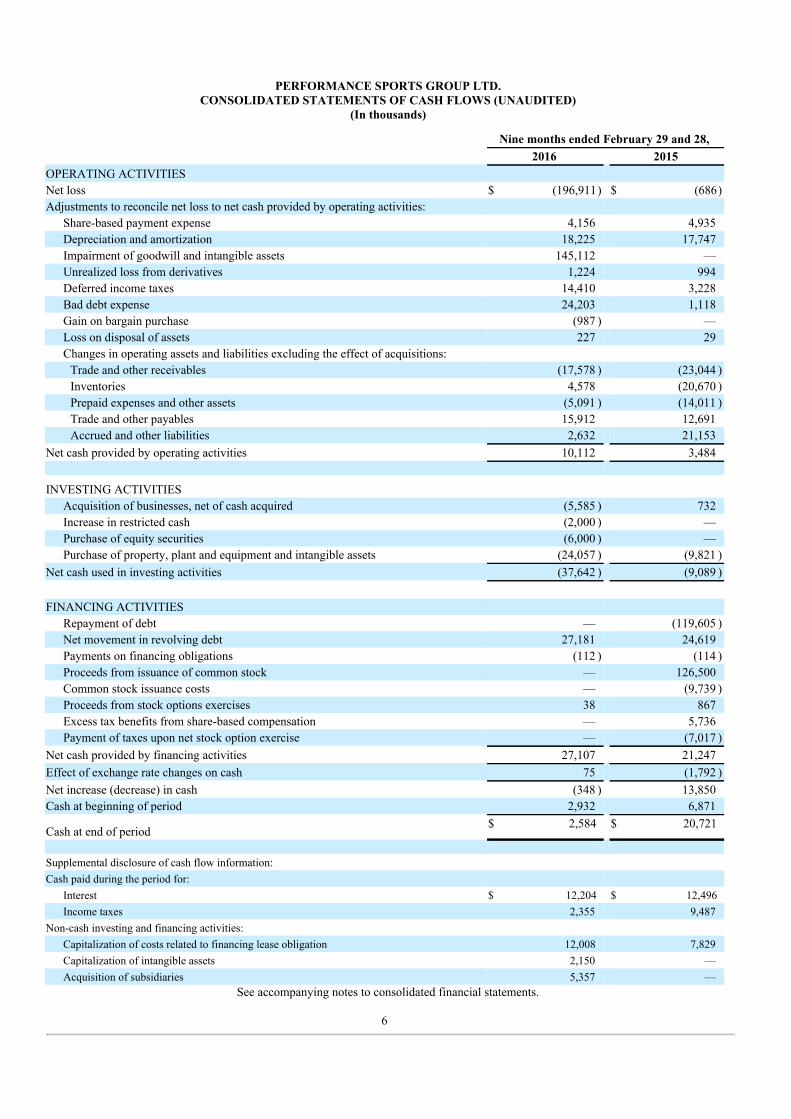
PERFORMANCE SPORTS GROUP LTD.CONSOLIDATED STATEMENTS OF CASH FLOWS (UNAUDITED)
(In thousands)
Nine months ended February 29 and 28, 2016 2015OPERATING ACTIVITIESNet loss $ (196,911) $ (686)Adjustments to reconcile net loss to net cash provided by operating activities:
Share-based payment expense 4,156 4,935Depreciation and amortization 18,225 17,747Impairment of goodwill and intangible assets 145,112 —Unrealized loss from derivatives 1,224 994Deferred income taxes 14,410 3,228Bad debt expense 24,203 1,118Gain on bargain purchase (987 ) —Loss on disposal of assets 227 29Changes in operating assets and liabilities excluding the effect of acquisitions:
Trade and other receivables (17,578 ) (23,044 )Inventories 4,578 (20,670 )Prepaid expenses and other assets (5,091 ) (14,011 )Trade and other payables 15,912 12,691Accrued and other liabilities 2,632 21,153
Net cash provided by operating activities 10,112 3,484 INVESTING ACTIVITIES
Acquisition of businesses, net of cash acquired (5,585 ) 732Increase in restricted cash (2,000 ) —Purchase of equity securities (6,000 ) —Purchase of property, plant and equipment and intangible assets (24,057 ) (9,821 )
Net cash used in investing activities (37,642 ) (9,089 ) FINANCING ACTIVITIES
Repayment of debt — (119,605 )Net movement in revolving debt 27,181 24,619Payments on financing obligations (112 ) (114 )Proceeds from issuance of common stock — 126,500Common stock issuance costs — (9,739 )Proceeds from stock options exercises 38 867Excess tax benefits from share-based compensation — 5,736Payment of taxes upon net stock option exercise — (7,017 )
Net cash provided by financing activities 27,107 21,247Effect of exchange rate changes on cash 75 (1,792 )Net increase (decrease) in cash (348 ) 13,850Cash at beginning of period 2,932 6,871
Cash at end of period$ 2,584 $ 20,721
Supplemental disclosure of cash flow information: Cash paid during the period for:
Interest $ 12,204 $ 12,496Income taxes 2,355 9,487
Non-cash investing and financing activities: Capitalization of costs related to financing lease obligation 12,008 7,829Capitalization of intangible assets 2,150 —Acquisition of subsidiaries 5,357 —
See accompanying notes to consolidated financial statements.
6
PERFORMANCE SPORTS GROUP LTD.NOTES TO CONSOLIDATED FINANCIAL STATEMENTS (UNAUDITED)For the three and nine months ended February 29, 2016 and February 28, 2015
(In thousands, except share and per share data)
1. BASIS OF PRESENTATION AND ORGANIZATION
The accompanying unaudited consolidated financial statements have been prepared in accordance with the rules and regulations of theSecurities and Exchange Commission (the “SEC”). Certain information and footnote disclosures required to be included in completefinancial statements prepared in accordance with accounting principles generally accepted in the United States of America (“U.S. GAAP”)have been condensed or omitted from this report, as is permitted by such SEC rules and regulations. In the opinion of management, theaccompanying unaudited consolidated financial statements contain all normal and recurring adjustments necessary to fairly present theconsolidated financial position of Performance Sports Group Ltd. and its wholly owned subsidiaries (‘‘PSG’’, the ‘‘Company’’, “We” or“Our”), results of operations and cash flows of the Company for the interim periods presented in accordance with U.S. GAAP. Thepreparation of financial statements in conformity with U.S. GAAP requires management to make estimates and assumptions that affect theamounts reported in the financial statements and notes thereto. Results for interim periods are not necessarily indicative of results to beexpected for a full fiscal year.
These unaudited consolidated financial statements should be read in conjunction with the consolidated financial statements and the relatednotes thereto included in the Company’s Annual Report on Form 10-K for the year ended May 31, 2015. The consolidated balance sheet asat May 31, 2015 included herein is derived from the Company’s annual audited consolidated financial statements included in the AnnualReport on Form 10-K for the year ended May 31, 2015.
2. SIGNIFICANT ACCOUNTING POLICIES
There have been no significant changes to the Company’s significant accounting policies as described in the Company’s Annual Report onForm 10-K for the year ended May 31, 2015.
Recent Accounting Pronouncements:
In February 2016, the Financial Accounting Standards Board (“FASB”) issued Accounting Standards Update (“ASU”) No. 2016-02,Leases, which revises the accounting related to lessee accounting. Under the new guidance, lessees will be required to recognize a leaseliability and a right-of-use asset for all leases with terms greater than 12 months. Leases will be classified as either finance or operating,with classification affecting the pattern of expense recognition in the income statement. The provisions of ASU 2016-02 are effective forfiscal years beginning after December 15, 2018 and should be applied through a modified retrospective transition approach for leasesexisting at, or entered into after, the beginning of the earliest comparative period presented in the financial statements. Early adoption ispermitted. The Company is currently evaluating the impact this accounting standard will have on the Company’s consolidated financialstatements.
In January 2016, the FASB issued ASU No. 2016-01 , Recognition and Measurement of Financial Assets and Financial Liabilities. ThisASU revises how entities measure and recognize equity investments and present changes in the fair value of financial liabilities. Theprovisions of ASU 2016-01 are effective for fiscal years beginning after December 15, 2017. Early adoption is permitted under certaincircumstances. The Company is currently evaluating the impact this accounting standard will have on the Company’s consolidatedfinancial statements.
In November 2015, the FASB issued ASU No. 2015-17, Balance Sheet Classification of Deferred Taxes, which eliminates the currentrequirement for companies to present deferred tax liabilities and assets as current and non-current in a classified balance sheet. Instead,companies will be required to classify all deferred tax assets and liabilities as non-current. This ASU is effective for annual reportingperiods beginning after December 15, 2016, including interim reporting periods within that reporting period. Early adoption is permitted.The Company is currently evaluating the impact this accounting standard will have on the Company’s consolidated financial statements.
In August 2015, the FASB issued ASU No. 2015-15, Presentation and Subsequent Measurement of Debt Issuance Costs Associated withLine of Credit Arrangements. This ASU indicates that the guidance in ASU 2015-03 did not address presentation or subsequentmeasurement of debt issuance costs related to line of credit arrangements. Given the absence of authoritative guidance within ASU 2015-03, the SEC staff have indicated that they would not object to an entity deferring and presenting debt issuance costs as an asset andsubsequently amortizing the costs ratably over the term of the line of credit arrangement, regardless of whether there are any outstandingborrowings on the line of credit arrangement. The Company does not expect the adoption of ASU 2015-15 to have any effect on theCompany’s financial position or results of operations.
7

In July 2015, the FASB issued ASU No. 2015-11, Simplifying the Measurement of Inventory. This ASU changes the measurementprinciple for inventory from the lower of cost or market to lower of cost and net realizable value. Net realizable value is defined as theestimated selling price in the ordinary course of business, less reasonably predictable costs of completion, disposal, and transportation whencost is determined on a first-in, first-out or average cost basis. The provisions of ASU 2015-11 are effective for public entities with fiscalyears beginning after December 15, 2016. The Company is currently evaluating the impact this accounting standard will have on theCompany’s consolidated financial statements.
In May 2014, the FASB issued ASU No. 2014-09, Revenue from Contracts with Customers: Topic 606. This ASU outlines a singlecomprehensive model for entities to use in accounting for revenue arising from contracts with customers and supersedes most currentrevenue recognition guidance. In July 2015, the FASB announced a one-year deferral of the effective date of the new revenue recognitionstandard. This accounting standard is now effective for annual reporting periods beginning after December 15, 2017, including interimreporting periods within that reporting period. Early adoption is permitted on the originally scheduled effective date. The Company iscurrently evaluating the impact this accounting standard will have on the Company’s consolidated financial statements.
3. BUSINESS ACQUISITIONS
Easton Hockey
On January 13, 2016 (the “Closing Date”), the Company, through its wholly-owned subsidiaries, Bauer Hockey, Inc. and Bauer HockeyCorp., acquired substantially all of the assets and assumed certain liabilities of Easton Hockey Holdings, Inc. (the “Easton HockeyAcquisition”), a manufacturer and distributor of hockey equipment, pursuant to an asset purchase agreement among Bauer Hockey, Inc.,Bauer Hockey Corp., Easton Hockey Holdings, Inc., Easton Hockey, Inc. and Easton Hockey Canada, Inc. The Easton Hockey Acquisitionprovides the Company with intellectual property that strengthens its research and development portfolio and provides the Company withfull ownership and control of the Easton brand in all sports other than cycling and archery.
The purchase price paid by the Company at closing was $5,585 in cash, with future cash payments of an aggregate of $5,358 payable over10 months following the Closing Date. The Company financed the Easton Hockey Acquisition through additional borrowings on its asset-based revolving loan.
The Company has completed a preliminary valuation of assets acquired and liabilities assumed. The estimates and assumptionsused in determining the preliminary fair values of certain assets and liabilities are subject to change within the measurement period, whichis up to one year from the Closing Date. The primary areas of the allocation of the purchase price that are not yet finalized include tradereceivables, inventories, property, plant and equipment and deferred income taxes since the Easton Hockey Acquisition occurred in thecurrent fiscal quarter. The preliminary allocation of the purchase price to the individual assets acquired and liabilities assumed under thepurchase method of accounting resulted in a gain on bargain purchase of $987. The gain on bargain purchase associated with the EastonHockey Acquisition was due to a distressed sale by the previous owners whose financial position had been deteriorating over time.
The following table presents the preliminary allocation of purchase price related to the Easton Hockey business as of the Closing Date ofthe Easton Hockey Acquisition:
Net assets acquired: Trade receivables $ 5,685Inventories 6,000Property, plant and equipment 350Intangible assets 1,175Other assets 327Total assets acquired 13,537Current liabilities (1,607 )Total liabilities assumed (1,607 )Net assets acquired $ 11,930Consideration paid or payable to seller $ 10,943Gain on bargain purchase $ 987
8

The estimated fair values and useful lives of intangible assets acquired as of the acquisition date were as follows:
Amount
Weighted-AverageRemaining Useful
LifeTrade names and trademarks $ 370 7Customer relationships 155 8Purchased technology 650 7Total intangible assets acquired $ 1,175
The trade names and trademarks and purchased technology were valued using the relief-from-royalty method. The relief-from-royaltymethod recognizes that the current value of an asset may be premised upon the expected receipt of future economic benefit in the use of theacquired technology. These benefits are generally considered to be higher income resulting from the avoidance of a loss in revenue thatwould likely occur without the specific technology.
Customer relationships were valued using the excess earnings method. The excess earnings method recognizes that the current value of anasset may be premised upon the present value of the earnings it generates, net of a reasonable return on other assets also contributing to thatstream of earnings.
The Company incurred acquisition-related costs of $414 in the three and nine months ended February 29, 2016 relating to external legalfees, consulting fees and due diligence costs. These costs are included in selling, general and administrative expenses.
The amounts of Easton Hockey's revenue and net loss excluding the gain on bargain purchase included in the Company’s consolidatedstatements of income for the three and nine months ended February 29, 2016 were $848 and $2,729, respectively.
Pro forma information (Unaudited)
The Company has not provided unaudited pro forma revenue and earnings of the Company as if the Easton Hockey Acquisition hadoccurred on June 1, 2014 due to the effects of the Easton Hockey Acquisition not being considered material.
4. SEASONALITY
Each of our sports demonstrates substantial seasonality. The spring/summer season of baseball/softball is complementary to the fall/winterseason of hockey, and as a result, our quarterly sources of revenue and profitability are more balanced throughout our fiscal year. The moreevenly distributed seasonality of the combined business provides more consistent working capital levels and allows us to improve ourefficiency in our manufacturing, distribution and other efforts.
Generally, our highest sales volumes for hockey occur during the first fiscal quarter of our fiscal year, followed by the next highest salesvolumes in the second fiscal quarter of our fiscal year. Our lowest sales volumes for hockey occur during the third fiscal quarter of ourfiscal year. Launch timing of our products add some variations between fiscal quarters each fiscal year.
In baseball/softball, our highest sales volumes generally occur in the third fiscal quarter of our fiscal year and the lowest sales volumesoccur in the first fiscal quarter of our fiscal year.
In lacrosse, our highest sales volumes occur in the second and third fiscal quarters of our fiscal year.
The shipment of soccer products occurs substantially in the first and fourth fiscal quarters of our fiscal year. We expect our team apparelrevenues, including uniforms for ice hockey, roller hockey, lacrosse and other team sports, to align with the underlying sports’ sellingseasons as we expand our team apparel offering.
5. TRADE AND OTHER RECEIVABLES, NET
The Company recorded bad debt expense of $18,952 and $24,203 in the three and nine months ended February 29, 2016, respectively. Therecorded bad debt in the three months ended February 29, 2016 included a write down of a receivable balance from a U.S. national sportinggoods retailer that has filed under chapter 11 and additional bad debt reserves primarily for certain U.S. hockey customers. The recordedbad debt in the nine months ended February 29, 2016 also included a write down of a
9
receivable balance from an internet baseball retailer that has filed under chapter 11. The Company recorded bad debt expense of $309 and$1,118 in the three and nine months ended February 28, 2015, respectively.
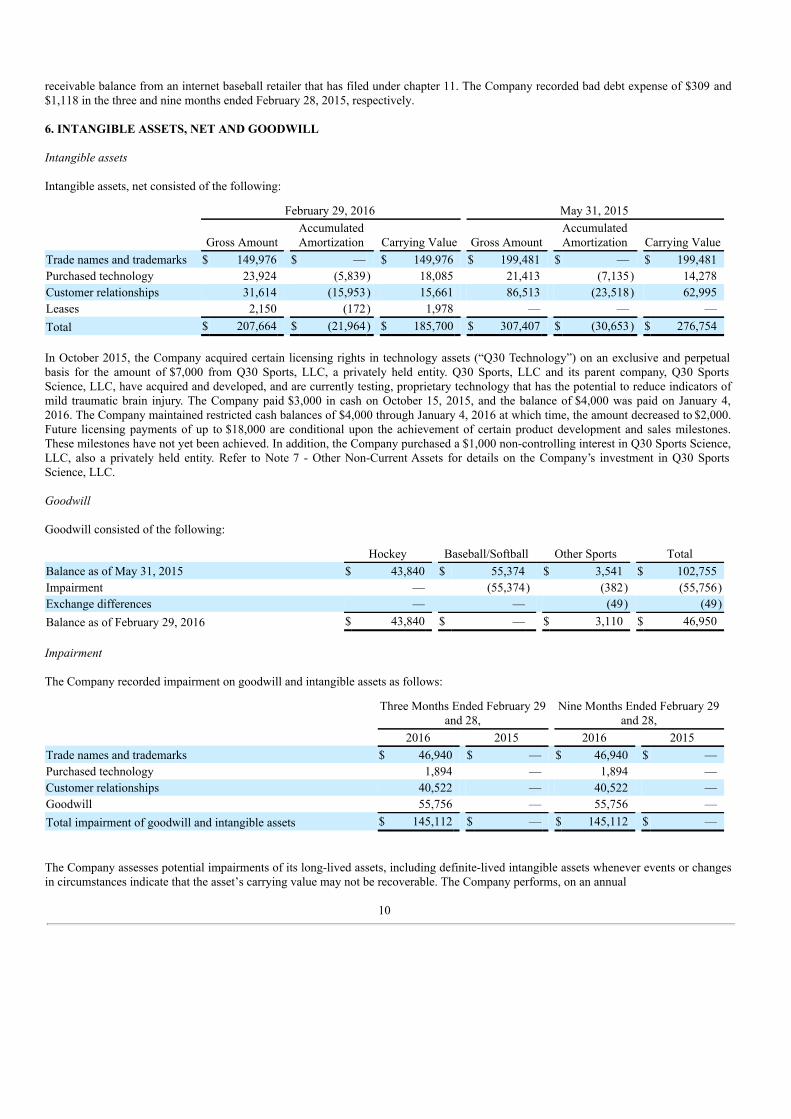
6. INTANGIBLE ASSETS, NET AND GOODWILL
Intangible assets
Intangible assets, net consisted of the following:
February 29, 2016 May 31, 2015
Gross Amount AccumulatedAmortization Carrying Value Gross Amount
AccumulatedAmortization Carrying Value
Trade names and trademarks $ 149,976 $ — $ 149,976 $ 199,481 $ — $ 199,481Purchased technology 23,924 (5,839) 18,085 21,413 (7,135) 14,278Customer relationships 31,614 (15,953) 15,661 86,513 (23,518) 62,995Leases 2,150 (172) 1,978 — — —Total $ 207,664 $ (21,964) $ 185,700 $ 307,407 $ (30,653) $ 276,754
In October 2015, the Company acquired certain licensing rights in technology assets (“Q30 Technology”) on an exclusive and perpetualbasis for the amount of $7,000 from Q30 Sports, LLC, a privately held entity. Q30 Sports, LLC and its parent company, Q30 SportsScience, LLC, have acquired and developed, and are currently testing, proprietary technology that has the potential to reduce indicators ofmild traumatic brain injury. The Company paid $3,000 in cash on October 15, 2015, and the balance of $4,000 was paid on January 4,2016. The Company maintained restricted cash balances of $4,000 through January 4, 2016 at which time, the amount decreased to $2,000.Future licensing payments of up to $18,000 are conditional upon the achievement of certain product development and sales milestones.These milestones have not yet been achieved. In addition, the Company purchased a $1,000 non-controlling interest in Q30 Sports Science,LLC, also a privately held entity. Refer to Note 7 - Other Non-Current Assets for details on the Company’s investment in Q30 SportsScience, LLC.
Goodwill
Goodwill consisted of the following:
Hockey Baseball/Softball Other Sports TotalBalance as of May 31, 2015 $ 43,840 $ 55,374 $ 3,541 $ 102,755Impairment — (55,374) (382) (55,756)Exchange differences — — (49) (49)Balance as of February 29, 2016 $ 43,840 $ — $ 3,110 $ 46,950
Impairment
The Company recorded impairment on goodwill and intangible assets as follows:
Three Months Ended February 29
and 28, Nine Months Ended February 29
and 28, 2016 2015 2016 2015Trade names and trademarks $ 46,940 $ — $ 46,940 $ —Purchased technology 1,894 — 1,894 —Customer relationships 40,522 — 40,522 —Goodwill 55,756 — 55,756 —Total impairment of goodwill and intangible assets $ 145,112 $ — $ 145,112 $ —
The Company assesses potential impairments of its long-lived assets, including definite-lived intangible assets whenever events or changesin circumstances indicate that the asset’s carrying value may not be recoverable. The Company performs, on an annual
10
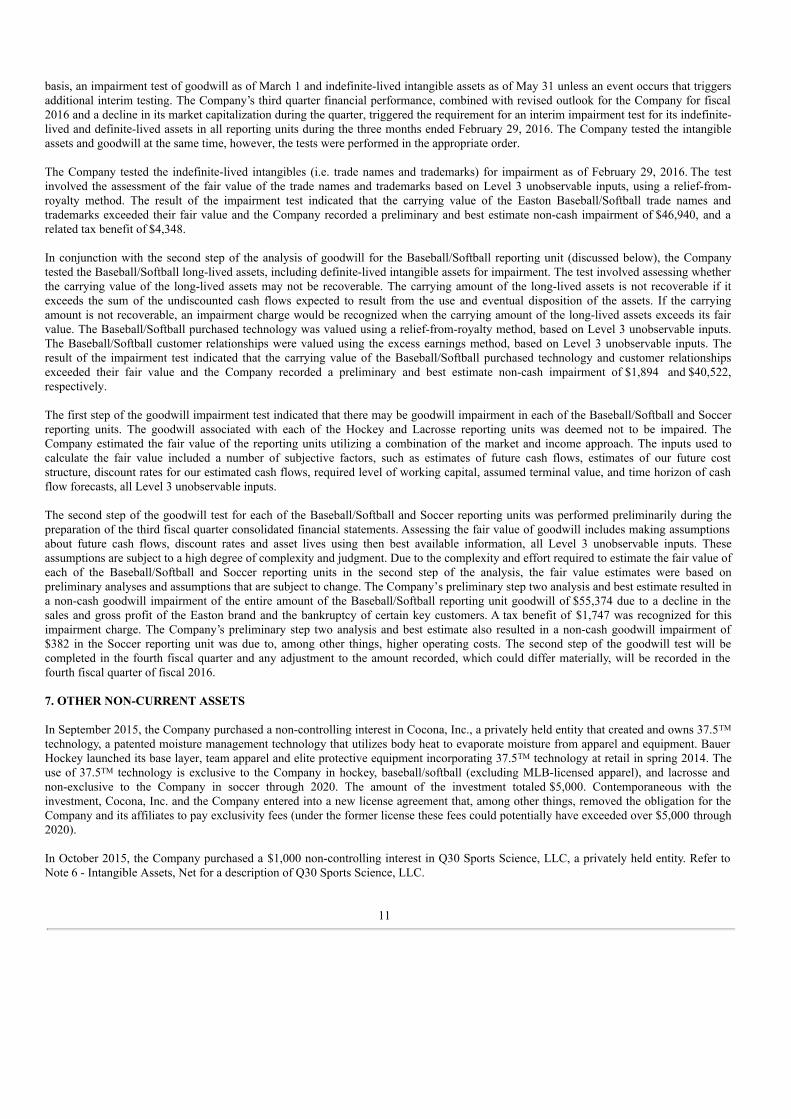
basis, an impairment test of goodwill as of March 1 and indefinite-lived intangible assets as of May 31 unless an event occurs that triggersadditional interim testing. The Company’s third quarter financial performance, combined with revised outlook for the Company for fiscal2016 and a decline in its market capitalization during the quarter, triggered the requirement for an interim impairment test for its indefinite-lived and definite-lived assets in all reporting units during the three months ended February 29, 2016. The Company tested the intangibleassets and goodwill at the same time, however, the tests were performed in the appropriate order.
The Company tested the indefinite-lived intangibles (i.e. trade names and trademarks) for impairment as of February 29, 2016. The testinvolved the assessment of the fair value of the trade names and trademarks based on Level 3 unobservable inputs, using a relief-from-royalty method. The result of the impairment test indicated that the carrying value of the Easton Baseball/Softball trade names andtrademarks exceeded their fair value and the Company recorded a preliminary and best estimate non-cash impairment of $46,940, and arelated tax benefit of $4,348.
In conjunction with the second step of the analysis of goodwill for the Baseball/Softball reporting unit (discussed below), the Companytested the Baseball/Softball long-lived assets, including definite-lived intangible assets for impairment. The test involved assessing whetherthe carrying value of the long-lived assets may not be recoverable. The carrying amount of the long-lived assets is not recoverable if itexceeds the sum of the undiscounted cash flows expected to result from the use and eventual disposition of the assets. If the carryingamount is not recoverable, an impairment charge would be recognized when the carrying amount of the long-lived assets exceeds its fairvalue. The Baseball/Softball purchased technology was valued using a relief-from-royalty method, based on Level 3 unobservable inputs.The Baseball/Softball customer relationships were valued using the excess earnings method, based on Level 3 unobservable inputs. Theresult of the impairment test indicated that the carrying value of the Baseball/Softball purchased technology and customer relationshipsexceeded their fair value and the Company recorded a preliminary and best estimate non-cash impairment of $1,894 and $40,522,respectively.
The first step of the goodwill impairment test indicated that there may be goodwill impairment in each of the Baseball/Softball and Soccerreporting units. The goodwill associated with each of the Hockey and Lacrosse reporting units was deemed not to be impaired. TheCompany estimated the fair value of the reporting units utilizing a combination of the market and income approach. The inputs used tocalculate the fair value included a number of subjective factors, such as estimates of future cash flows, estimates of our future coststructure, discount rates for our estimated cash flows, required level of working capital, assumed terminal value, and time horizon of cashflow forecasts, all Level 3 unobservable inputs.
The second step of the goodwill test for each of the Baseball/Softball and Soccer reporting units was performed preliminarily during thepreparation of the third fiscal quarter consolidated financial statements. Assessing the fair value of goodwill includes making assumptionsabout future cash flows, discount rates and asset lives using then best available information, all Level 3 unobservable inputs. Theseassumptions are subject to a high degree of complexity and judgment. Due to the complexity and effort required to estimate the fair value ofeach of the Baseball/Softball and Soccer reporting units in the second step of the analysis, the fair value estimates were based onpreliminary analyses and assumptions that are subject to change. The Company’s preliminary step two analysis and best estimate resulted ina non-cash goodwill impairment of the entire amount of the Baseball/Softball reporting unit goodwill of $55,374 due to a decline in thesales and gross profit of the Easton brand and the bankruptcy of certain key customers. A tax benefit of $1,747 was recognized for thisimpairment charge. The Company’s preliminary step two analysis and best estimate also resulted in a non-cash goodwill impairment of$382 in the Soccer reporting unit was due to, among other things, higher operating costs. The second step of the goodwill test will becompleted in the fourth fiscal quarter and any adjustment to the amount recorded, which could differ materially, will be recorded in thefourth fiscal quarter of fiscal 2016.
7. OTHER NON-CURRENT ASSETS
In September 2015, the Company purchased a non-controlling interest in Cocona, Inc., a privately held entity that created and owns 37.5TM
technology, a patented moisture management technology that utilizes body heat to evaporate moisture from apparel and equipment. BauerHockey launched its base layer, team apparel and elite protective equipment incorporating 37.5TM technology at retail in spring 2014. Theuse of 37.5TM technology is exclusive to the Company in hockey, baseball/softball (excluding MLB-licensed apparel), and lacrosse andnon-exclusive to the Company in soccer through 2020. The amount of the investment totaled $5,000. Contemporaneous with theinvestment, Cocona, Inc. and the Company entered into a new license agreement that, among other things, removed the obligation for theCompany and its affiliates to pay exclusivity fees (under the former license these fees could potentially have exceeded over $5,000 through2020).
In October 2015, the Company purchased a $1,000 non-controlling interest in Q30 Sports Science, LLC, a privately held entity. Refer toNote 6 - Intangible Assets, Net for a description of Q30 Sports Science, LLC.
11
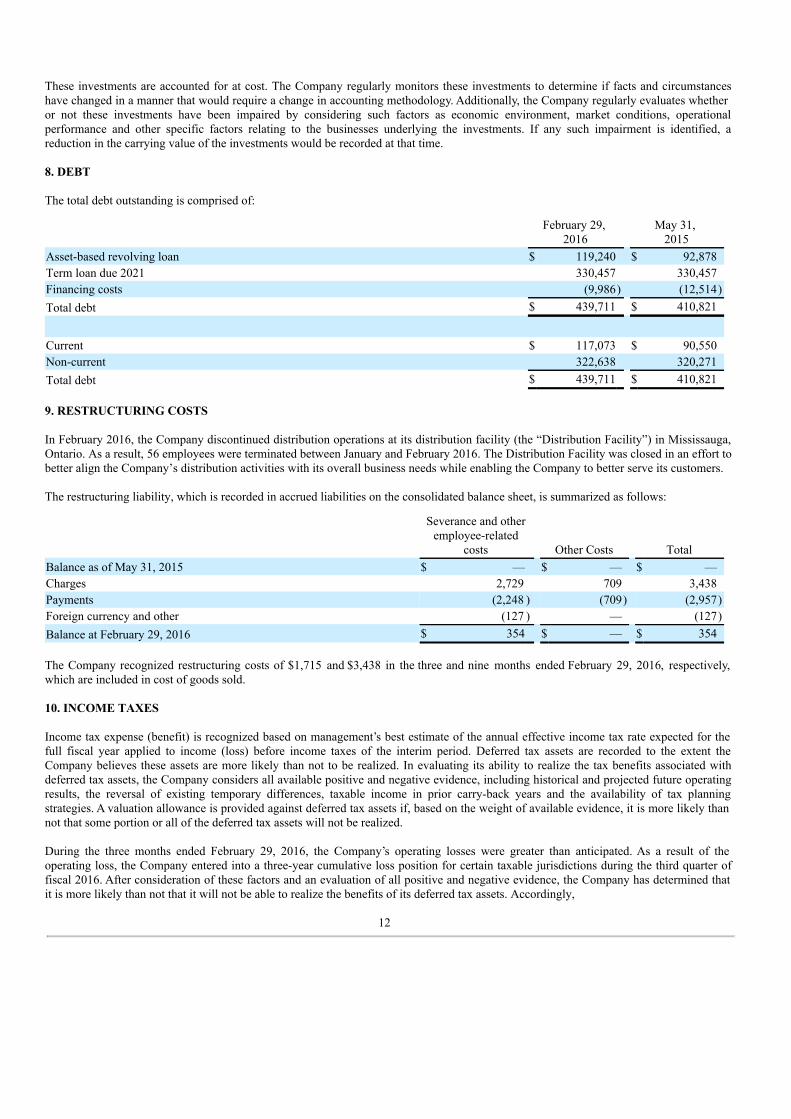
These investments are accounted for at cost. The Company regularly monitors these investments to determine if facts and circumstanceshave changed in a manner that would require a change in accounting methodology. Additionally, the Company regularly evaluates whetheror not these investments have been impaired by considering such factors as economic environment, market conditions, operationalperformance and other specific factors relating to the businesses underlying the investments. If any such impairment is identified, areduction in the carrying value of the investments would be recorded at that time.
8. DEBT
The total debt outstanding is comprised of:
February 29,
2016 May 31,
2015Asset-based revolving loan $ 119,240 $ 92,878Term loan due 2021 330,457 330,457Financing costs (9,986) (12,514)Total debt $ 439,711 $ 410,821
Current $ 117,073 $ 90,550Non-current 322,638 320,271Total debt $ 439,711 $ 410,821
9. RESTRUCTURING COSTS
In February 2016, the Company discontinued distribution operations at its distribution facility (the “Distribution Facility”) in Mississauga,Ontario. As a result, 56 employees were terminated between January and February 2016. The Distribution Facility was closed in an effort tobetter align the Company’s distribution activities with its overall business needs while enabling the Company to better serve its customers.
The restructuring liability, which is recorded in accrued liabilities on the consolidated balance sheet, is summarized as follows:
Severance and otheremployee-related
costs Other Costs TotalBalance as of May 31, 2015 $ — $ — $ —Charges 2,729 709 3,438Payments (2,248 ) (709) (2,957)Foreign currency and other (127 ) — (127)Balance at February 29, 2016 $ 354 $ — $ 354
The Company recognized restructuring costs of $1,715 and $3,438 in the three and nine months ended February 29, 2016, respectively,which are included in cost of goods sold.
10. INCOME TAXES
Income tax expense (benefit) is recognized based on management’s best estimate of the annual effective income tax rate expected for thefull fiscal year applied to income (loss) before income taxes of the interim period. Deferred tax assets are recorded to the extent theCompany believes these assets are more likely than not to be realized. In evaluating its ability to realize the tax benefits associated withdeferred tax assets, the Company considers all available positive and negative evidence, including historical and projected future operatingresults, the reversal of existing temporary differences, taxable income in prior carry-back years and the availability of tax planningstrategies. A valuation allowance is provided against deferred tax assets if, based on the weight of available evidence, it is more likely thannot that some portion or all of the deferred tax assets will not be realized.
During the three months ended February 29, 2016, the Company’s operating losses were greater than anticipated. As a result of theoperating loss, the Company entered into a three-year cumulative loss position for certain taxable jurisdictions during the third quarter offiscal 2016. After consideration of these factors and an evaluation of all positive and negative evidence, the Company has determined thatit is more likely than not that it will not be able to realize the benefits of its deferred tax assets. Accordingly,
12
at February 29, 2016, the Company recorded an incremental charge of $19,227 to establish a full valuation allowance against the impacteddeferred tax assets, including net operating loss carryforwards that expire at various dates in the next 17 years. Realization of theCompany’s deferred tax assets is dependent on generating sufficient taxable income in future years. These events and circumstancescontributed to the Company recording income tax expense for the three and nine months ended February 29, 2016, despite incurring pre-tax losses in those periods of $177,335 and $186,694, respectively.
Income tax expense for the three and nine months ended February 29, 2016 was $10,722 and $10,217, respectively. Income tax expense forboth periods was comprised primarily of discrete items, including a $19,227 expense to record a valuation allowance on deferred tax assets,partially offset by a benefit of $6,131 on impairment expense and a benefit of $3,051 for the amount of tax recoverable by carryback of thecurrent year’s loss to prior years.
Income tax benefit for the three months ended February 28, 2015 was $2,071 on a pre-tax loss of $14,535, for an effective tax rate (“ETR”)of 14.2%. The relatively low ETR was primarily due to unrealized capital losses for which no tax benefit could be recognized. Income taxexpense for the nine months ended February 28, 2015 was $3,665 on pre-tax income of $2,979, for an ETR of 123.0%. The high ETR wasprimarily due to unrealized capital losses for which no tax benefit could be recognized.
11. STOCKHOLDERS’ EQUITY
On June 25, 2014, the Company completed its underwritten public offering in the United States and Canada (the “Offering”) of 8,161,291Common Shares at a price to the public of $15.50 per share, for total gross proceeds of approximately $126,500, including the exercise infull of the over-allotment option. The Company used the net proceeds of the Offering to repay $119,500 of the New Term Loan Facility.The Company incurred $213 and $9,739 in common stock issuance costs in the three and nine months ended February 28, 2015,respectively. These costs are recorded in common stock in the consolidated balance sheets.
12. SHARE-BASED COMPENSATION
The Company recognized share-based compensation expense as follows:
Three Months Ended February 29
and 28, Nine Months Ended February 29
and 28, 2016 2015 2016 2015Share-based compensation for employee awards $ 1,354 $ 1,384 $ 3,403 $ 4,333Share-based compensation for non-employee awards 368 274 753 602Total share-based compensation $ 1,722 $ 1,658 $ 4,156 $ 4,935
Omnibus Equity Incentive Plan
The Omnibus Equity Incentive Plan was adopted by the Board of Directors on August 11, 2015 and approved by the shareholders of theCompany on October 14, 2015 at the Company’s annual and special meeting of shareholders. The Omnibus Equity Incentive Plan providesfor the grant of nonqualified stock options, incentive stock options, stock appreciation rights (“SARs”), restricted stock, restricted stockunits (“RSUs”), deferred stock units (“DSUs”), other stock-based awards, and performance compensation awards. The total number ofCommon Shares reserved for issuance under the Omnibus Equity Incentive Plan is 3,000,000 Common Shares. At February 29, 2016, themaximum number of Common Shares available for future issuance under the Omnibus Equity Incentive Plan was 1,424,209.
The Company grants awards under the Omnibus Equity Incentive Plan to employees, non-employees, and directors of the Company or itsaffiliates. Employee service-based awards have a contractual life of 10 years and typically vest over a period of 4 years from grant-date.Non-employee service-based awards have a contractual life of 10 years and typically vest over a period of up to 6 years. Director service-based awards fully vest on the applicable date of grant and the Company settles the awards following the director’s separation from servicewith the Company in accordance with the Omnibus Equity Incentive Plan and pursuant to the terms and conditions of the applicable grantagreement.
Under the terms of the Omnibus Equity Incentive Plan, each eligible director (‘‘Eligible Directors’’) may elect to receive up to 100% of thecash portion of such director’s compensation in the form of DSUs. If the Eligible Director elects to receive all or a portion of suchdirector’s cash compensation in DSUs, such election is fixed for the ensuing fiscal year. In addition, Eligible Directors receive the equityportion of their compensation in the form of DSU’s. The number of Common Shares awarded to satisfy that liability is variable based onthe value of the Common Shares at the time of settlement of the liability. The DSUs are therefore classified as liability awards.
13

The assumptions used for options granted to acquire Common Shares and the fair value at the date of grant under the Omnibus EquityIncentive Plan is noted in the following table:
Nine Months EndedFebruary 29, 2016
Weighted average expected term (in years) 6.7Weighted average expected volatility 30.54%Weighted average risk-free interest rate 1.68%Weighted average forfeiture rate 1.78%Expected dividend yield —%Weighted average fair value per option granted $3.64
Information concerning options activity under the Omnibus Equity Incentive Plan for options to acquire Common Shares is summarized asfollows:
Nine Months Ended February
29, 2016
Number of
Options
Weighted-Average
Exercise PriceOutstanding, beginning of period — $ —Granted 1,293,178 12.45Forfeited (29,650) 10.54Outstanding, end of period 1,263,528 $ 12.50Options vested and expected to vest, end of period 1,241,350 $ 12.50Options exercisable, end of period — $ —
Information concerning RSUs activity under the Omnibus Equity Incentive Plan is summarized as follows:
Nine Months Ended February 29,
2016
Number of
RSUs
Weighted-Average Fair
ValueOutstanding, beginning of period — $ —Granted 307,433 12.33Forfeited (9,155) 10.37Outstanding, end of period 298,278 $ 12.21Vested, end of period — $ —
Employee Inducement Award
On January 20, 2016, the Company granted non-qualified stock options to acquire 90,000 Common Shares and granted RSUs representingthe right to receive 30,000 Common Shares, pursuant to New York Stock Exchange Rule 303A.08 and Section 613(c) of the Toronto StockExchange Company Manual, as an employee inducement award and outside the terms of the Omnibus Equity Incentive Plan. The awardshave a contractual life of 10 years and vest in 25% cumulative installments on each of the first four anniversaries of the date of grant,subject to continued employment through the applicable vesting dates.
14
The assumptions used for options granted to acquire Common Shares and the fair value at the date of grant for the Employee InducementAward is noted in the following table:
Nine Months EndedFebruary 29, 2016
Weighted average expected term (in years) 6.3Weighted average expected volatility 32.14%Weighted average risk-free interest rate 1.64%Weighted average forfeiture rate 3.07%Expected dividend yield —%Weighted average fair value per option granted $2.21
The RSUs weighted average fair value at date of grant and at February 29, 2016 is $6.30.
Second Amended and Restated 2011 Plan (“2011 Plan”)
In connection with the adoption of the Omnibus Equity Incentive Plan, no further options will be granted under the 2011 Plan. The 2011Plan will continue to govern options previously granted under the 2011 Plan and remain outstanding.
Deferred Share Unit Plan (“DSU Plan”)
In connection with the adoption of the Omnibus Equity Incentive Plan, no further DSUs will be granted under the DSU Plan. The DSUPlan will continue to govern DSUs previously granted under the DSU Plan and remain outstanding.
13. EARNINGS PER SHARE
The following is a reconciliation from basic earnings per Common Share to diluted earnings per Common Share:
Three Months Ended February
29 and 28, Nine Months Ended February 29
and 28, 2016 2015 2016 2015Net income (loss) $ (188,057) $ (12,464) $ (196,911) $ (686)Weighted average common shares outstanding, assumingconversion of proportionate voting shares - Basic 45,566,680 44,699,821 45,558,534 43,559,710Assumed conversion of dilutive stock options and awards — — — —Diluted weighted average common shares outstanding 45,566,680 44,699,821 45,558,534 43,559,710Basic earnings (loss) per common share $ (4.13) $ (0.28) $ (4.32) $ (0.02)Diluted earnings (loss) per common share $ (4.13) $ (0.28) $ (4.32) $ (0.02)
Anti-dilutive stock options and awards excluded from dilutedearnings (loss) per share calculation
808,879 2,398,589 1,307,187 2,440,610
15

14. ACCUMULATED OTHER COMPREHENSIVE INCOME (LOSS)
The changes in accumulated other comprehensive income (loss), net of taxes, are as follows:
Foreign currency
translation Defined benefitpension plans Total
Balance as of May 31, 2014 $ (13,765) $ (934) $ (14,699)Other comprehensive income (loss) before reclassifications (8,321) 97 (8,224)Amounts reclassified from accumulated other comprehensive loss to netincome — 15 15Balance at February 28, 2015 $ (22,086) $ (822) $ (22,908) Balance as of May 31, 2015 $ (21,956) $ (1,022) $ (22,978)Other comprehensive income (loss) before reclassifications (3,099) 101 (2,998)Balance at February 29, 2016 $ (25,055) $ (921) $ (25,976)
15. SEGMENT INFORMATION
The Company has two reportable operating segments, Hockey and Baseball/Softball. The remaining operating segments do not meet thecriteria for a reportable segment and are included in Other Sports. The Hockey segment includes the Bauer, Mission and Easton Hockeybrands. The Baseball/Softball segment includes the Easton Baseball/Softball and Combat brands. Other Sports includes the Lacrosse andSoccer operating segments, which includes the Maverik and Cascade brands for Lacrosse, and the Inaria brand for Soccer.
These operating segments were determined based on the management structure and the financial information, among other factors,reviewed by the Chief Operating Decision Maker (“CODM”) to assess segment performance. Operating segment profit is evaluated usingEBITDA adjusted for items excluded by the CODM, which is not a measure defined by U.S. GAAP, and is reviewed by the CODM.Certain PSG functional platform costs are directly allocated to each operating segment based on usage or other relevant operational metrics.PSG’s functional platform costs consist of expenses incurred by centrally-managed functions, including global information systems,finance and legal, distribution and logistics, sourcing and manufacturing, and other miscellaneous costs.
PSG corporate expenses, currency related gains (losses), acquisition related expenses and other costs are not controlled by the managementat each operating segment and therefore are excluded from segment EBITDA. PSG corporate expenses consist of executive compensationand administration costs, public company compliance and other related costs, certain tax credits and other miscellaneous costs. Currencyrelated gains (losses) consists of foreign exchange gains (losses) and the unrealized gain (loss) on derivative instruments. The realized gain(loss) on derivative instruments is included in the EBITDA of the Hockey operating segment because it currently relates specifically toHockey cost of goods sold. Acquisition related expenses consist of (i) charges to cost of goods sold resulting from the fair market valueadjustment to inventory, (ii) integration costs, (iii) costs related to reviewing corporate opportunities, and (iv) transaction costs. Other costsconsist of share-based payment expenses and items that the CODM excludes from segment EBITDA, including, for example, items that areinfrequent in nature such as costs related to share offerings.
Segment revenue information is summarized as follows:
Three Months Ended February 29
and 28, Nine Months Ended February 29
and 28, 2016 2015 2016 2015Hockey $ 56,297 $ 53,936 $ 285,724 $ 327,734Baseball/Softball 57,259 71,946 140,318 153,531Other Sports 12,525 11,864 28,115 25,870Total revenues $ 126,081 $ 137,746 $ 454,157 $ 507,135
16
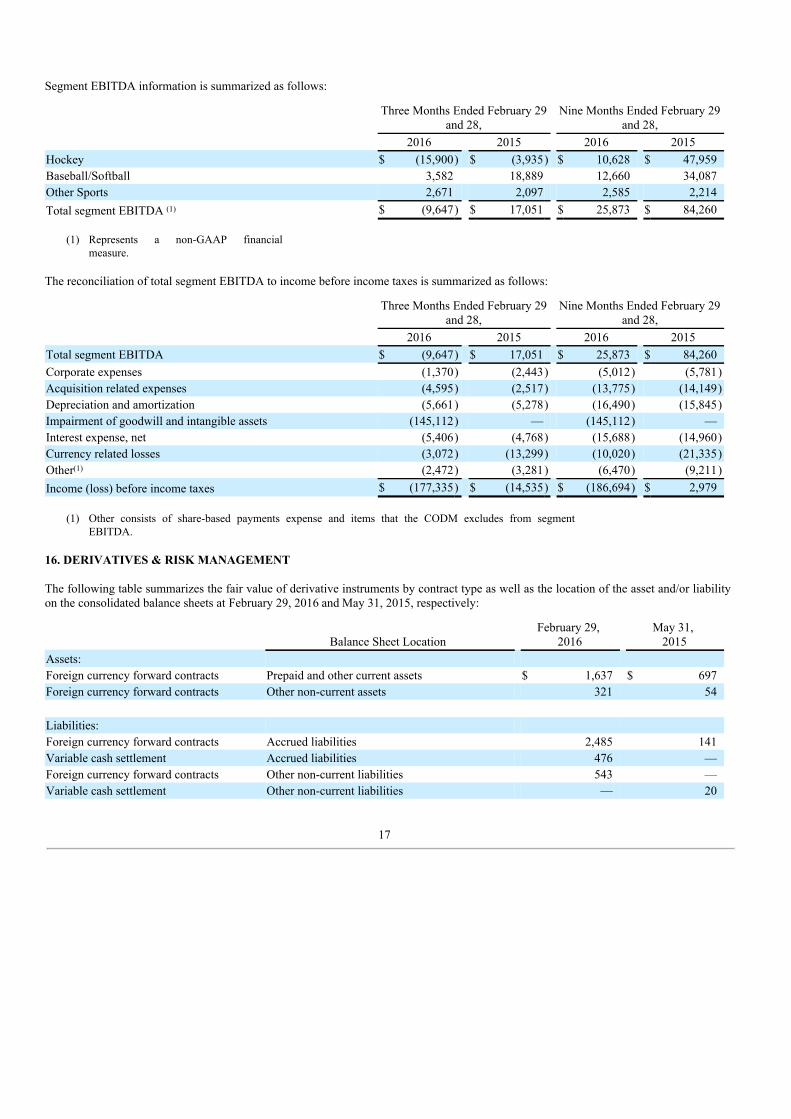
Segment EBITDA information is summarized as follows:
Three Months Ended February 29
and 28, Nine Months Ended February 29
and 28, 2016 2015 2016 2015Hockey $ (15,900) $ (3,935) $ 10,628 $ 47,959Baseball/Softball 3,582 18,889 12,660 34,087Other Sports 2,671 2,097 2,585 2,214Total segment EBITDA (1) $ (9,647) $ 17,051 $ 25,873 $ 84,260
(1) Represents a non-GAAP financialmeasure.
The reconciliation of total segment EBITDA to income before income taxes is summarized as follows:
Three Months Ended February 29
and 28, Nine Months Ended February 29
and 28, 2016 2015 2016 2015Total segment EBITDA $ (9,647) $ 17,051 $ 25,873 $ 84,260Corporate expenses (1,370) (2,443) (5,012) (5,781)Acquisition related expenses (4,595) (2,517) (13,775) (14,149)Depreciation and amortization (5,661) (5,278) (16,490) (15,845)Impairment of goodwill and intangible assets (145,112) — (145,112) —Interest expense, net (5,406) (4,768) (15,688) (14,960)Currency related losses (3,072) (13,299) (10,020) (21,335)Other(1) (2,472) (3,281) (6,470) (9,211)Income (loss) before income taxes $ (177,335) $ (14,535) $ (186,694) $ 2,979
(1) Other consists of share-based payments expense and items that the CODM excludes from segmentEBITDA.
16. DERIVATIVES & RISK MANAGEMENT
The following table summarizes the fair value of derivative instruments by contract type as well as the location of the asset and/or liabilityon the consolidated balance sheets at February 29, 2016 and May 31, 2015, respectively:
Balance Sheet Location February 29,
2016 May 31,
2015Assets: Foreign currency forward contracts Prepaid and other current assets $ 1,637 $ 697Foreign currency forward contracts Other non-current assets 321 54 Liabilities: Foreign currency forward contracts Accrued liabilities 2,485 141Variable cash settlement Accrued liabilities 476 —Foreign currency forward contracts Other non-current liabilities 543 —Variable cash settlement Other non-current liabilities — 20
17

The following table summarizes the location of gains and losses on the consolidated statements of income that were recognized during thethree and nine months ended February 29, 2016, respectively, in addition to the derivative contract type:
Three Months EndedFebruary 29 and 28,
Nine Months EndedFebruary 29 and 28,
Derivatives not designated as hedginginstruments
Location of (gain) loss recognized inincome on derivative instruments 2016 2015 2016 2015
Foreign currency forward contracts Realized gain on derivatives $ (746) $ (1,431) $ (1,983) $ (4,878)Foreign currency forward contracts Unrealized loss on derivatives 2,589 56 1,224 994
Variable cash settlement Selling, general and administrativeexpenses 279 (43) 453 (279)
17. FAIR VALUE MEASURES
The following tables present information about the Company’s assets and liabilities that are measured at fair value on a recurring basis aso f February 29, 2016 and May 31, 2015, respectively, and indicate the level of the fair value hierarchy utilized by the Company todetermine such fair value:
Fair Value Measurements as of February 29, 2016 Using: Level 1 Level 2 Level 3Assets: Foreign currency forward contracts $ — $ 1,958 $ —Liabilities: Foreign currency forward contracts $ 3,028 Variable cash settlement $ — $ 476 $ —
Fair Value Measurements as of May 31, 2015 Using: Level 1 Level 2 Level 3Assets: Foreign currency forward contracts $ — $ 751 $ —Liabilities: Foreign currency forward contracts $ 141 Variable cash settlement $ — $ 20 $ —
Refer to Note 6 - Intangible Assets, Net and Goodwill for details on the fair value measures used in the impairment on goodwill andintangible assets.
18. COMMITMENTS AND CONTINGENCIES
In July 2015, the Company entered into a lease agreement as a second tenant of a property in Thousand Oaks, California (the “ThousandOaks property”) for a lease term of 125 months. Per the terms of the lease agreement and due to the Company’s involvement in therestoration of the facility, the Company was determined to be the owner of the facility during the construction period and recognized anasset and liability in the amount of $12,008. Upon completion of the restoration of the Thousand Oaks property, the Company will assesswhether the lease qualifies for sales recognition under the sale-leaseback accounting guidance. The Company currently expects that thelease for the Thousand Oaks property will qualify for sales recognition under the sale-leaseback accounting guidance and, if that is thecase, will remove the asset and liability from its consolidated balance sheet.
The Company acquired Kohlberg Sports Group Inc. (‘‘KSGI’’) on March 10, 2011. In connection with the acquisition of Bauer Hockey byKSGI in April 2008, a subsidiary of KSGI agreed to pay additional consideration to Nike, Inc. in future periods, based upon the attainmentof a qualifying exit event. At February 29, 2016, the maximum potential future consideration pursuant to such arrangements, to be resolvedon or before April 16, 2016, such date being the eighth anniversary of April 16, 2008, is $10,000. On April 16, 2008, all of the securityholders of KSGI (collectively, the ‘‘Existing Holders’’) entered into a reimbursement agreement with the Company pursuant to which eachof the Existing Holders agreed to reimburse the Company, on a pro rata basis, in the
18
event that the Company or any of its subsidiaries are obligated to make a payment to Nike, Inc. As of February 29, 2016, the Companydetermined that no such qualifying exit event has occurred. The Company will continue to assess whether a qualifying exit event hasoccurred through the eighth anniversary date, such date being April 16, 2016.
In connection with the acquisition of Q30 Technology from Q30 Sports, LLC, a privately held entity, future licensing payments of up to$18,000 are conditional upon the achievement of certain product development and sales milestones. These milestones have not yet beenachieved.
In the ordinary course of business, the Company is involved in various legal proceedings involving contractual and employmentrelationships, product liability claims, trademark rights, and a variety of other matters. On March 18, 2016, a class action securities fraudcomplaint was filed by Brian Apel, individually and on behalf of all others similarly situated, against the Company seeking unspecifieddamages, as well as costs, attorneys’ fees, and other unspecified relief.
Item 2. Management’s Discussion and Analysis of Financial Condition and Results of Operations
This discussion summarizes our consolidated operating results, financial condition and liquidity during the three- and nine-monthperiods ended February 29, 2016 and February 28, 2015. The following Management’s Discussion and Analysis of our FinancialCondition and Results of Operations should be read in conjunction with the accompanying consolidated financial statements and notesthereto and the Company’s Annual Report on Form 10-K for the fiscal year ended May 31, 2015.
This discussion contains forward-looking statements that are based upon current expectations and are subject to risks,uncertainties and assumptions that could cause our results to differ materially from expectations. Factors that might cause such differencesinclude, but are not limited to, those described under “Part I. Item 1A. Risk Factors” of the Company’s Annual Report on Form 10-K,“Note Regarding Forward-Looking Statements” in this quarterly report on Form 10-Q, and elsewhere in this quarterly report on Form 10-Q.
Executive Overview
The Company is a leading developer and manufacturer of ice hockey, roller hockey, lacrosse, baseball and softball sportsequipment, as well as related apparel and soccer apparel. The Company is the global leader in hockey with the strongest and mostrecognized brand, and it is a leader in North America in baseball and softball. Its products are marketed under the BAUER, MISSION,MAVERIK, CASCADE, INARIA, COMBAT and EASTON brand names and are distributed by sales representatives and independentdistributors throughout the world. In addition, the Company distributes its hockey products through its Burlington, Massachusetts andBloomington, Minnesota Own The Moment Hockey Experience retail stores.
Our mission is to elevate player performance and protection through athlete insight and superior innovation. We have a diversifiedand balanced business model and are focused on the following opportunities for growth:
• Grow market share in Baseball/Softball - As we did with Hockey, we are aiming to expand our market share inBaseball/Softball by investing in product development, developing a disciplined category management process andconnecting with our core consumers.
• Continue to grow in Hockey - Although we hold the overall No.1 market share position, we look to continue to expandmarket share in every category, with a particular focus on ice hockey sticks, the largest dollar category in the industry.
• Grow apparel across all sports - The apparel market is highly fragmented and we are aiming to grow apparel across all ofour sports by leveraging the strength of our brands as well as continued R&D investments in apparel.
• Continue rapid growth in lacrosse - Lacrosse continues to expand rapidly across the United States and we are aiming togrow market share and to achieve market leadership by the end of calendar 2016. We are focusing our efforts on the fast-growing youth and high school markets, including the women’s game.
• Commercialize Q30 Technology - In October 2015, we acquired an exclusive, perpetual, worldwide license from Q30Sports, LLC to use its sports-related patents and technology assets in the development of products that are intended toaddress the issue of mild traumatic brain injury in sports and athletic activities. We have initiated the go-to-marketprocess with the U.S. Food & Drug Administration (the “FDA”) and Health Canada and anticipate offering the productsto athletes, subject to obtaining and maintaining the necessary approvals.
19

Summary of Results - Q3 Fiscal 2016 vs. Q3 Fiscal 2015
• Revenues totaled $126.1 million, declining 8.5% (down 4.2% in constantcurrency).
• Adjusted Gross Profit margin was 31.9%, down 170 basis points (up 200 basis points in constantcurrency).
• Gross profit margin was 28.1%, down 260 basis points (up 110 basis points in constantcurrency).
• Adjusted EBITDA was a loss of $11.0 million, compared to Adjusted EBITDA of $14.6 million (Q3 Fiscal 2016 Adjusted EBITDAloss of $5.1 million in constant currency). The decline in year-over-year Adjusted EBITDA was primarily driven by $18.7 million inincremental bad debt expense compared to the prior year and lower revenues from Baseball/Softball.
• Adjusted Net Loss totaled $14.8 million or $(0.32) per diluted share, compared to Adjusted Net Income of $5.6 million or $0.12 perdiluted share (Q3 Fiscal 2016 Adjusted Net Loss of $10.6 million or $(0.23) per diluted share in constant currency). Q3 Fiscal 2016Adjusted Net Loss included $0.25 per diluted share in bad debt expense and an approximate $0.03 per diluted share impact due to alower than expected effective tax rate. This impact is not expected to change the Company’s Fiscal 2016 Adjusted EPS outlook.
• The Company recorded a non-cash impairment charge of $145.1 million in its Baseball/Softball segment and a $19.2 milliondeferred tax asset valuation allowance in Q3 Fiscal 2016.
• Net loss totaled $188.1 million or $(4.13) per diluted share, compared to a net loss of $12.5 million or $(0.28) per diluted share (Q3Fiscal 2016 net loss of $185.7 million or $(4.08) per diluted share in constant currency).
• Net loss excluding intangible asset and goodwill impairment, deferred tax asset valuation allowance and bad debt expense was $18.3million or $(0.40) per diluted share (Q3 Fiscal 2016 net loss of $15.8 million or $(0.35) per diluted share in constant currency withthe same exclusions).
Recent Events
On March 28, 2016, the Company announced that Daniel M. Friedberg, President and Chief Executive Officer of Sagard CapitalPartners Management Corp., was appointed to the Board of Directors (the “Board”) of the Company, effective as of such date. SagardCapital Partners, L.P. (together with Sagard Capital Partners Management Corp. and Sagard Capital Partners GP, Inc., collectively, “SagardCapital”) is currently the Company’s largest shareholder, with beneficial ownership of approximately 15% of the Company’s issued andoutstanding Common Shares based on public filings as of the date hereof. In connection with the appointment of Mr. Friedberg to theBoard, the Company entered into a shareholder nomination agreement with Sagard Capital, which provides for, among other things,customary standstill, nomination, support and confidentiality provisions. A copy of such shareholder nomination agreement was attached asExhibit 99.1 to the Company’s Form 8-K filed with the Securities and Exchange Commission (the “SEC”) on March 28, 2016 and isincluded as Exhibit 10.2 of this quarterly report on Form 10-Q.
On March 22, 2016, the Board announced that it had reached an arrangement with Kevin Davis, the former Chief ExecutiveOfficer of the Company, for his departure from the Company, effective March 22, 2016, and concurrently appointed Amir Rosenthal,President, PSG Brands, as the Company’s Chief Executive Officer on an interim basis pursuant to an offer letter, dated as of March 25,2016, and effective as of March 22, 2016, a copy of which is attached as Exhibit 10.1 of this quarterly report on Form 10-Q. The Board is inthe process of conducting a search for the permanent Chief Executive Officer of the Company. Mr. Rosenthal is among the candidatesunder consideration by the Board.
On March 8, 2016, the Company revised its outlook for its fiscal year ended May 31, 2016 (“Fiscal 2016”) and reportedpreliminary results for its fiscal third quarter ended February 29, 2016. In connection therewith, the Company identified the following threeprimary factors as having contributed to its revised outlook for Fiscal 2016: (i) a write down of the receivable balance from a U.S. nationalsporting goods retailer that has filed under chapter 11 and the related anticipated loss of sales from this retailer; (ii) an anticipated reductionin sales, particularly due to weakness in the baseball/softball market; and (iii) additional bad debt reserves primarily for certain U.S. hockeycustomers and the related anticipated loss of sales from such customers. Contributing to the decline in the Company’s financialperformance was a significant downturn in baseball/softball retail sales, including in the Company’s important bat category. Theweakening of consumer demand, coupled with the chapter 11 filing by one of the largest U.S. national sporting goods retailers and thebankruptcy of an internet baseball retailer, resulted in a reduction of sales for the Company’s baseball/softball products and an increase inthe Company’s bad debt reserves for certain U.S. hockey and baseball/softball customers. Additionally, the consolidation of hockeyretailers in the U.S. reduced customer demand for products as customers’ continued to reduce their inventory levels. The Company alsoannounced on March 8, 2016 that it expects debt reduction of between $35.0 million and $40.0 million during the second half of Fiscal2016.
On February 4, 2016, Easton Baseball/Softball announced an expanded exclusive partnership with Little League through the 2022season. Under this new, long-term partnership, Easton Baseball/Softball will continue to be the Official Team Equipment Supplier to LittleLeague Baseball and Softball.
20
On February 2, 2016, the Company officially unveiled EASTON’s first product offering for Japan. For the first time in its history,Easton Baseball/Softball will offer specifically designed EASTON products for the Japanese market. Management estimates that the sizeof the global baseball equipment market is approximately $1.2 billion, with approximately one third of the market coming from Japan.
On January 27, 2016, the Company provided guidance on debt and leverage levels over the balance of Fiscal 2016 and for Fiscal2017. The Company announced that in Fiscal 2016, the Company’s five-year supply chain initiative is expected to drive $3.0 million incost savings. Introduced in October 2014, the Company’s five-year supply chain initiative is aimed at improving pre-tax profitability byapproximately $35.0 million on an annualized basis by the end of Fiscal 2020. This initiative is designed to enhance the overalleffectiveness of the Company’s supply chain, with a particular focus on product cost reductions, inventory quality improvements andincreased customer service levels and efficiency.
On January 13, 2016, the Company completed the Easton Hockey Acquisition. The purchase price paid by the Company atclosing was $5.6 million in cash, with future cash payments of an aggregate of $5.4 million payable over a period of 10 months from theEaston Hockey Acquisition closing date. The Company financed the Easton Hockey acquisition through additional borrowings on its asset-based revolving loan.
NOTE REGARDING FORWARD-LOOKING STATEMENTS
Certain statements in this quarterly report on Form 10-Q about our current and future plans, expectations and intentions, results,levels of activity, performance, goals or achievements or any other future events or developments constitute “forward-looking statements”under the Private Securities Litigation Reform Act of 1995 and within the meaning of applicable Canadian securities laws (collectively,“forward-looking statements”), including with respect to, among other things, growing market share in baseball/softball and hockey, itscontinued growth in hockey, the growth of apparel across all sports, the Company achieving market leadership in lacrosse by the end ofcalendar 2016, obtaining and maintaining the necessary approvals from the FDA and Health Canada, among others, necessary to marketproducts containing Q30’s patents and technology assets, the Company continuing to pursue strategic acquisitions, the Company’s revisedoutlook for Fiscal 2016, including, with respect to, the Company’s expectation of improving pre-tax profitability by $35.0 million on anannualized basis by the end of Fiscal 2020 due to the Company’s five-year supply chain initiative, the Company’s expectation that the NewABL Facility balance will be under $100.0 million by the end of Fiscal 2016, the following three factors, which the Company hasidentified as being primarily responsible for its revised outlook for Fiscal 2016: (i) a write down of the receivable balance from a U.S.national sporting goods retailer that has filed under chapter 11 and the related anticipated loss of sales from this retailer; (ii) an anticipatedreduction in sales, particularly due to weakness in the baseball/softball market; and (iii) additional bad debt reserves primarily for certainU.S. hockey customers and the related anticipated loss of sales from such customers. Such statements often include words such as “may,”“will,” “would,” “should,” “could,” “expects,” “plans,” “intends,” “trends,” “indicates,” “anticipates,” “believes,” “estimates,” “predicts,”“likely,” or “potential” or the negative or other variations of these words or other comparable words or phrases.
Discussions containing forward-looking statements may be found, among other places, under this Item 2 and “Management’sDiscussion and Analysis of Financial Condition and Results of Operations”. Forward-looking statements are based on estimates andassumptions made by us in light of our experience and perception of historical trends, current conditions and expected future developments,as well as other factors that we believe are appropriate and reasonable under the circumstances, but there can be no assurance that suchestimates and assumptions will prove to be correct. Certain assumptions with respect to, among other things, the reduced sales for ourbaseball/softball products continuing for the remainder of Fiscal 2016 due to the weakening of consumer demand for our products and therecent chapter 11 filing of one of the largest U.S. national sporting goods retailers, the appropriateness of our bad debt reserves, ourcustomers’ ability to make payments when due consistent with historical practice, capital expenditures remaining in line with our forecast,currency rates remaining near current levels for the remainder of Fiscal 2016, interest rates not materially increasing in relation to ouroutstanding indebtedness for the remainder of Fiscal 2016, the Company achieving its expected levels of hockey booking orders andtranslating such booking orders into realized sales, the Company realizing the expected savings from its cost savings and other initiatives,maintaining a tax rate at or near recent historical levels, determination of acquisition accounting, valuation of derivatives, share-basedpayments, claim liabilities, employee future benefits, income taxes, the impairment of assets, and goodwill and intangibles are materialfactors made in preparing forward-looking information and management’s expectations. Readers are cautioned that actual future operatingresults and economic performance of the Company, including with respect to forward-looking statements referred to above, are subject to anumber of risks and uncertainties, including, among other things, those described below, the risk that excess retail inventory in the U.S.baseball/softball market results in more than anticipated cancelled or delayed orders by the Company’s customers, the risk that customersare unable to make payments to the Company when due, changes in foreign currency rates, interest rate changes, inability to translatebooking orders into realized sales, as further described below, inability to introduce new and innovative products, inability to generatedemand for our products, inability to achieve the benefits anticipated from the Company’s cost savings and
21
other initiatives, and general economic, market and business conditions, and could differ materially from what is currently expected as setout above.
Many factors could cause our actual results, level of activity, performance or achievements or future events or developments todiffer materially from those expressed or implied by the forward-looking statements, including, without limitation, the following factors,which are discussed in greater detail in Part I, Item 1A “Risk Factors” section of our Annual Report on Form 10-K for the fiscal year endedMay 31, 2015 and in Part II, Item 1A “Risk Factors” section of this quarterly report on Form 10-Q: inability to maintain and enhancebrands, inability to introduce new and innovative products, intense competition in the sporting equipment and apparel industries, inability toown, enforce, defend and protect intellectual property rights worldwide, costs associated with potential lawsuits to enforce, defend orprotect intellectual property rights, inability to protect our brands and rights to use such brands, infringement of intellectual property rightsof others, inability to translate booking orders into realized sales, including risks associated with changes in the mix or timing of ordersplaced by customers, seasonal fluctuations in our operating results and the trading price of our Common Shares, decrease in popularity ofice hockey, baseball and softball, roller hockey or lacrosse, reduced popularity of the National Hockey League, Major League Baseball orother professional or amateur leagues in sports in which our products are used, adverse publicity of athletes who use our products or thesports in which our products are used, inability to ensure third-party suppliers will meet quality and regulatory standards, reliance on third-party suppliers and manufacturers, disruption of distribution systems, loss of significant customers or suppliers, loss of key customers’business due to customer consolidation, our customers’ ability to make payments when due consistent with historical practice, change inthe sales mix towards larger customers, cost of raw materials, shipping costs and other cost pressures, risks associated with doing businessabroad, inability to expand into international market segments, inability to accurately forecast demand for products, inventory shrinkage,excess inventory due to inaccurate demand forecasts, product liability, warranty and recall claims, inability to successfully design productsthat satisfy testing protocols and standards established by testing and athletic governing bodies, inability to obtain and maintain necessaryapprovals in respect of products that may be considered medical devices, inability to successfully open and operate Own The MomentHockey Experience retail stores, inability to successfully implement our strategic initiatives on anticipated timelines, including ourprofitability improvement initiative, risks associated with our third-party suppliers and manufacturers failing to manufacture products thatcomply with all applicable laws and regulations, inability to source merchandise profitably in the event new trade restrictions are imposedor existing trade restrictions become more burdensome, departure of senior executives or other key personnel with specialized marketknowledge and technical skills, litigation, including certain class action lawsuits, employment or union-related disputes, disruption ofinformation technology systems, including damages from computer viruses, unauthorized access, cyberattack and other securityvulnerabilities, potential environmental liabilities, restrictive covenants in our credit facilities, increasing levels of indebtedness, inability togenerate sufficient cash to fund operations or service the Company’s indebtedness, failure to make, integrate, and maintain newacquisitions, inability to realize growth opportunities or cost synergies that are anticipated to result from new acquisitions such as (i) theacquisition in certain exclusive and perpetual licensing rights in technology assets from Q30 Sports, LLC, (ii) the purchase of a non-controlling interest in Q30 Sports Science, LLC, a privately held entity and parent of Q30 Sports, LLC, and (iii) Easton Hockey,undisclosed liabilities acquired pursuant to recent acquisitions, volatility in the market price for Common Shares, possibility that we willneed additional capital in the future, incurrence of additional expenses as a result of the loss of our foreign private issuer status, assertionthat the acquisition of the Bauer Hockey business at the time of the Company’s initial public offering of Common Shares on the TorontoStock Exchange completed on March 10, 2011 was an inversion transaction, our current intention not to pay cash dividends, dependence onthe performance of subsidiaries given the our status as a holding company, potential inability of investors to enforce judgments against theCompany and its directors, fluctuations in the value of certain foreign currencies, including the Canadian dollar, in relation to the U.S.dollar, and other world currencies, general adverse economic and market conditions, changes government regulations, including tax lawsand unanticipated tax liabilities and natural disasters and geo-political events. These factors are not intended to represent a complete list ofthe factors that could affect us; however, these factors should be considered carefully.
The purpose of the forward-looking statements in this quarterly report on Form 10-Q is to provide the reader with a description ofmanagement’s current expectations regarding the Company’s financial performance and may not be appropriate for other purposes.Accordingly, readers should not place undue reliance on forward-looking statements made herein. Unless otherwise stated, the forward-looking statements contained in this quarterly report on Form10-Q are made as of the date of this quarterly report on Form 10-Q, and wehave no intention and undertake no obligation to update or revise any forward-looking statements, whether as a result of new information,future events or otherwise, except as required by law. The forward-looking statements contained in this quarterly report on Form 10-Q areexpressly qualified by this cautionary statement.
Factors Affecting our Performance
Seasonality
Each of our sports demonstrates substantial seasonality. The spring/summer season of baseball/softball is highly
22
complementary to the fall/winter season of hockey, which helps to balance our quarterly sources of revenue and profitability throughout ourfiscal year. The more evenly distributed seasonality of the combined business provides us with more consistent working capital levels andallow us to improve our efficiency in our manufacturing, distribution and other efforts.
Generally, our highest sales volumes for Hockey occur during the first fiscal quarter of our fiscal year, followed by the nexthighest sales volumes in the second fiscal quarter of our fiscal year. Our lowest sales volumes for Hockey occur during the third fiscalquarter of our fiscal year. In ice hockey, we have three sub-brands of products - VAPOR, SUPREME and NEXUS. In certain fiscal years,we launch new products under more than one sub-brand. Launch timing of our products add some variations between fiscal quarters eachfiscal year.
In Baseball/Softball, our highest sales volumes for EASTON and COMBAT products generally occur in the third fiscal quarter ofour fiscal year and the lowest sales volumes occur in the first fiscal quarter of our fiscal year.
In Lacrosse, our highest sales volumes for MAVERIK and CASCADE products occur in the second and third fiscal quarters ofour fiscal year.
The shipment of INARIA soccer products occurs substantially in the first and fourth fiscal quarters of our fiscal year. We expectour team apparel revenues, including uniforms for ice hockey, roller hockey, lacrosse and other team sports, to align with the underlyingsports’ selling seasons as we expand our team apparel offering.
Revenues
We generate revenues from the sale of performance sports equipment and related apparel and accessories. We offer variouscooperative marketing incentive programs to assist our sales channels with the marketing and selling of our products. These costs arerecorded as a reduction of revenues. Each sport business within the Company manages its own commercial organization and go-to-marketstrategy.
The current sales channels for our sports businesses include (i) retailers in North America and the Nordic countries, (ii) distributorsthroughout the rest of the world (principally, Western Europe, Eastern Europe, and Russia), (iii) direct sales to teams, and (iv) direct salesthrough our Own The Moment Hockey Experience retail stores. Based on the regional mix, our revenues are generated in multiplecurrencies. For revenues, we are exposed to foreign currency exchange rate fluctuations of the U.S. dollar against, among others, theCanadian dollar, the euro, the Swedish krona, Norwegian krone and Danish krone.
The following table highlights revenues for the periods indicated:
Three Months Ended
PeriodOver
PeriodGrowthRate(1)
Nine Months Ended
Period OverPeriod
GrowthRate(2)
(millions of U.S. dollars,except for percentages)
February 29,2016
February 28,2015
February 29,2016
February 28,2015
Revenues: Canada $ 19.7 $ 21.7 (9.2)% $ 101.9 $ 122.9 (17.1)%United States 92.0 101.8 (9.6)% 281.5 294.4 (4.4)%Rest of world 14.4 14.2 1.4 % 70.8 89.8 (21.2)% Total Revenues $ 126.1 $ 137.7 (8.4)% $ 454.2 $ 507.1 (10.4)%
(1) Three-month period ended February 29, 2016 vs. the three-month period ended February 28, 2015.(2) Nine-month period ended February 29, 2016 vs. the nine-month period ended February 28, 2015.
Cost of Goods Sold
Our cost of goods sold is comprised primarily of (i) the cost of finished goods, materials and components purchased from oursuppliers, manufacturing labor and overhead costs in our manufacturing facilities, (ii) supply chain-related costs, such as freight, duties,warehousing and other distribution costs, (iii) warranty costs and (iv) inventory provisions and write-offs. Our warranty costs result from ageneral warranty policy providing coverage against manufacturing defects. Warranties range from 30 days to one year from the date sold tothe consumer, depending on the type of product. Our warranty costs are primarily driven by sales of composite ice hockey sticks andbaseball/softball bats. Amortization associated with certain acquired intangible assets,
23
such as purchased technology and customer relationships, is also included in cost of goods sold. We also include charges to cost of goodssold resulting from the fair market value adjustment to inventory associated with certain acquired inventories.
The Company’s cost of goods sold is exposed to transactional foreign currency risk in the following ways:
• The Company’s subsidiaries purchase finished goods inventory directly from third party factories in U.S. dollars. Thesepurchases generate a foreign currency exposure for the Company’s subsidiaries with a functional currency other than theU.S. dollar, primarily the Company’s Hockey business outside of the U.S. which has a functional currency of primarilyCanadian dollars, Swedish krona and euro. As a result, a stronger U.S. dollar increases the inventory cost incurred by therelevant subsidiary whereas a weaker U.S. dollar decreases its cost. The Company uses foreign currency forwardcontracts to hedge a portion of its exposure to fluctuations in the value of the U.S. dollar against the Canadian dollar. Theresulting realized gain/loss on derivatives is an economic offset to the cost of goods sold.
• We source the majority of our products from suppliers in China and Thailand and agree to buy such products in U.S.dollars. We enter into supplier agreements ranging from six to twelve months with respect to the U.S. dollar cost of ourAsian-sourced finished goods. In these agreements, we adjust for changes in the relevant foreign exchange rates in whichthe factory labor, materials and overhead are denominated. As a result, our cost of goods sold is impacted by thefluctuations of the Chinese renminbi, Thai baht and certain other Asian currencies against the U.S. dollar. Therefore, astrengthening U.S. dollar relative to these Asian currencies decreases the Company’s U.S. dollar sourced product cost,whereas a weakening U.S. dollar increases our sourced product cost. We do not currently hedge our exposure tofluctuations in the value of these factory input cost currencies.
Selling, General and Administrative Expenses
Our SG&A expenses consist primarily of costs relating to our sales and marketing activities, including salaries, commissions andrelated personnel costs, customer order management and support activities, advertising, trade shows and other promotional activities, andbad debt expense. Our marketing expenses include promotional costs for launching new products, advertising and athlete endorsementcosts. Our administrative expenses consist of, among other things, costs relating to information systems, legal and finance functions,professional fees, insurance and other corporate expenses. We also include share-based payment expense, costs related to share offerings,and acquisition costs, including rebranding and integration costs, in SG&A expenses. We expect our SG&A expenses to increase as wecontinue to expand our Bauer Hockey retail business, make investments in such areas as Q30 Technology, and continue to invest in certainCompany platform functions. We are reviewing opportunities to offset these anticipated increases in spending with reductions in otherareas of SG&A.
Research and Development Expenses
R&D expenses consist primarily of salaries and related consulting expenses for technical personnel, contracts with leadingresearch facilities, as well as materials and consumables used in product development. To date, no development costs have beencapitalized. We incur most of our R&D expenses in Canada and are eligible to receive Scientific Research and Experimental Developmentinvestment tax credits for certain eligible expenditures which are recorded as a reduction to income tax expense. We currently expect ourR&D expenses to grow as we focus on enhancing and expanding our product lines. We are reviewing opportunities to offset theseanticipated higher expenses through greater efficiencies in our R&D spending.
Interest Expense
Interest expense is derived from the financing activities of the Company and consists of interest expense on our term loan andrevolving loan, and the amortization of deferred financing fees. As of February 29, 2016, the Credit Facilities (as defined herein) consist of(i) a $450 million secured term loan credit agreement (the “New Term Loan”), denominated in U.S. dollars of which $330.5 million wasdrawn, and (ii) a $200 million secured asset-based revolving credit facility (the “New ABL Facility” and together with the New Term Loan,the “Credit Facilities”), denominated, and able to be drawn in, both Canadian dollars and U.S. dollars, of which $119.2 million was drawn,the availability of which is subject to meeting certain borrowing base requirements. We currently expect the New ABL Facility balance tobe under $100.0 million by the end of Fiscal 2016. The Company is currently working through several additional initiatives that it currentlyexpects to drive further expense reductions and generate free cash flow for debt repayment in Fiscal 2017. Please see “Liquidity andCapital Resources - Indebtedness” for a more detailed discussion of the Credit Facilities.
24
Impact of Foreign Exchange and Hedging Practices
As a global company with significant operations outside the United States, in the normal course of business we are exposed to riskarising from the changes in foreign currency exchange rates. Our primary foreign currency exposures arise from the recording oftransactions denominated in non-functional currencies and the translation of foreign currency denominated results of operations, financialposition and cash flows into U.S. dollars.
Our foreign exchange risk management efforts are intended to lessen the effects of currency fluctuations on our consolidatedresults of operations, financial position, and cash flows. We manage global foreign exchange risk centrally on a portfolio basis to addressthose risks that are material to the Company. We manage these exposures primarily through the use of foreign exchange forward contracts,which are recorded on the consolidated balance sheet at fair value (see Note 16 - Derivatives and Risk Management and Note 17 - FairValue Measures in the accompanying Notes to Consolidated Financial Statements). Our hedging practices are designed to provide stabilityaround the receipt of cash, and at least partially offset the impact of exchange rate changes on the underlying exposures being hedged.Where exposures are hedged, our program has the effect of reducing volatility in our financial results and at least delaying the impact ofexchange rate movements on our consolidated financial statements when a currency’s direction is sustained over a longer period; the lengthof delay is dependent upon hedge horizons. We do not hold or issue derivative instruments for trading or speculative purposes.
The Company primarily uses foreign currency forward contracts to hedge the effect of changes in currency exchange rates on itsproduct costs (see the “Cost of Goods Sold” section above). The resulting realized gain/loss on derivatives is an economic offset to the costof goods sold that are recorded in the Company’s gross profit. The Company has not elected hedge accounting; therefore, the changes inthe fair value of these derivatives are recognized as unrealized gains and losses through profit or loss each reporting period. In the nine-month periods ended February 29, 2016 and February 28, 2015, the Company settled Canadian dollar forward contracts for $78.7 millionand $89.0 million, respectively, at a weighted average exchange rate of 1.26 and 1.04, respectively. As of February 29, 2016, the amount ofCanadian dollar forward contracts outstanding was $127.7 million at a weighted average exchange rate of 1.36. As of February 28, 2015,the amount of Canadian dollar forward contracts outstanding was $13.0 million at a weighted average exchange rate of 1.07.
The Company’s reporting currency is the U.S. dollar. Many of our foreign subsidiaries operate in functional currencies other thanthe U.S. dollar, the most significant of which are in Canadian dollars, Swedish krona, and euro. Fluctuations in currency exchange ratescreate volatility in our reported results as we are required to translate the balance sheets, operational results, and cash flows of thesesubsidiaries into U.S. dollars for consolidated reporting. Balances on the consolidated balance sheets are converted at the month-endforeign exchange rates or at historical exchange rates, and all profit and loss transactions are recognized at monthly average rates. In thetranslation of our consolidated statements of income, a weaker U.S. dollar in relation to the Canadian dollar, Swedish krona, and eurobenefits our consolidated revenues and earnings, whereas a stronger U.S. dollar reduces our consolidated revenues and earnings.Adjustments resulting from translating foreign functional currency balance sheets into U.S. dollars are included in the foreign currencytranslation adjustment, a component of accumulated other comprehensive income (loss) in equity. Re-measurement gains and lossesgenerated by the effect of foreign exchange on recorded assets and liabilities denominated in a currency different from the functionalcurrency of the applicable entity are recorded in foreign exchange gain/loss in the period in which they occur. The Company does notcurrently hedge these translation or re-measurement exposures.
In this quarterly report on Form 10-Q, we provide the impact of foreign exchange on our various financial measures. Theseamounts reflect the impact of translating the current period results at the monthly foreign exchange rates of the prior year period, the effectof changes in the value of the Canadian dollar against the U.S. dollar on our cost of goods purchased for sale outside of the United Statesincluding the related realized gains/losses on derivatives described above, and the realized gains/losses generated from revaluing non-functional currency assets and liabilities. The reported foreign exchange impact does not include the impact of fluctuations in Asiancurrencies against the U.S. dollar and their related effect on our Asian-sourced finished goods. See the “Cost of Goods Sold” section abovefor a more detailed description of these foreign exchange impacts. Also see “Non-GAAP Financial Measures”.
25

The following table summarizes the change in the reported U.S. dollars versus constant currency U.S. dollars for the three-andnine-month periods ended February 29, 2016:
Three Months Ended Nine Months Ended February 29, 2016 February 29, 2016
(millions of U.S. dollars, exceptfor per share amounts) Reported
ConstantCurrency (2)
Impact ofForeign
Exchange%
Change ReportedConstant
Currency (2)
Impact ofForeign
Exchange%
Change Revenues $ 126.1 $ 131.9 $ (5.8) (4.4)% $ 454.2 $ 484.3 $ (30.1) (6.2)% Gross Profit $ 35.4 $ 41.9 $ (6.5) (15.5)% $ 133.8 $ 164.0 $ (30.2) (18.4)% Selling, general & administrative $ 54.5 $ 56.1 $ (1.6) (2.9)% $ 134.1 $ 138.9 $ (4.8) (3.5)% Research & development $ 6.4 $ 6.9 $ (0.5) (7.2)% $ 18.6 $ 19.8 $ (1.2) (6.1)%
Adjusted Gross Profit (1) $ 40.2 $ 47.0 $ (6.8) (14.5)% $ 146.5 $ 177.5 $ (31.0) (17.5)% Adjusted EBITDA (1) $ (11.0) $ (5.1) $ (5.9) 115.7 % $ 20.9 $ 49.8 $ (28.9) (58.0)% Adjusted Net Income (1) $ (14.8) $ (10.6) $ (4.2) 39.6 % $ (2.9) $ 17.9 $ (20.8) (116.2)% Adjusted EPS (1) $ (0.32) $ (0.23) $ (0.09) 39.1 % $ (0.06) $ 0.37 $ (0.43) (116.2)% Adjusted Gross Profit %(1) 31.9% 35.6% (3.7)% — 32.3% 36.7% (4.4)% —
(1) Represents a non-GAAP measure. For the relevant definitions and reconciliations to reported results, see “Non-GAAP Financial Measures”.(2) Represents a non-GAAP measure. For the relevant definition, see “Non-GAAP Financial
Measures”.
The following table summarizes the average of the monthly exchange rates used to translate profit or loss transactions for theperiods indicated, as reported by the Wall Street Journal:
Three Months Ended Nine Months Ended
February 29,
2016 February 28,
2015 %
Change February 29,
2016 February 28,
2015 %
Change CAD / USD 1.365 1.157 (18.0)% 1.307 1.114 (17.3)% EUR / USD 0.921 0.818 (12.6)% 0.905 0.773 (17.1)% SEK / USD 8.553 7.655 (11.7)% 8.458 7.128 (18.7)%
Income Taxes
The Company accounts for income taxes under the asset and liability method, whereby deferred tax assets and liabilities arerecognized for the expected future tax consequences attributable to differences between the financial statement carrying amounts ofexisting assets and liabilities and their respective tax bases. The Company conducts business globally and, as a result, its subsidiaries fileincome tax returns in Canada, U.S. federal and state jurisdictions and various foreign jurisdictions. The Company utilizes its tax loss carryforwards, tax credits and other tax assets, as available, to offset its taxable income.
26
Results of Operations
The following table summarizes our results of operations for the three-month periods ended February 29, 2016 and February 28,2015, and the nine-month periods ended February 29, 2016 and February 28, 2015, and has been derived from our unaudited consolidatedfinancial statements and related notes.
Three Months Ended Nine Months Ended(millions of U.S. dollars, except for percentages andper share amounts)
February 29,2016
February 28,2015
February 29,2016
February 28,2015
Revenues $ 126.1 $ 137.7 $ 454.2 $ 507.1Cost of goods sold 90.7 95.4 320.4 345.0Gross profit $ 35.4 $ 42.3 $ 133.8 $ 162.1Operating expenses: Selling, general & administrative 54.5 34.1 134.1 109.1Research & development 6.4 6.0 18.6 18.5Impairment of intangibles and goodwill $ 145.1 $ — $ 145.1 $ —Operating income (loss) $ (170.6) $ 2.2 $ (164.0) $ 34.5Interest expense, net 5.4 4.8 15.7 14.9Derivative and foreign exchange (gain) loss 2.4 11.9 8.0 16.5Gain on bargain purchase (1.0) — (1.0) —Other expense (income) — — — 0.1Income tax expense (benefit) 10.7 (2.0) 10.2 3.7Net income (loss) $ (188.1) $ (12.5) $ (196.9) $ (0.7) Basic earnings (loss) per share $ (4.13) $ (0.28) $ (4.32) $ (0.02)Diluted earnings (loss) per share $ (4.13) $ (0.28) $ (4.32) $ (0.02) Adjusted Gross Profit (1) $ 40.2 $ 46.3 $ 146.5 $ 181.9Adjusted EBITDA (1) $ (11.0) $ 14.6 $ 20.9 $ 78.5Adjusted Net Income (Loss) (1) $ (14.8) $ 5.6 $ (2.9) $ 38.8Adjusted EPS (1) $ (0.32) $ 0.12 $ (0.06) $ 0.84 As a percentage of revenues: Gross profit 28.1 % 30.7% 29.5% 32.0%Selling, general & administrative 43.3 % 24.8% 29.5% 21.5%Research & development 5.1 % 4.4% 4.1% 3.6%Adjusted Gross Profit (1) 31.9 % 33.6% 32.3% 35.9%Adjusted EBITDA (1) (8.7)% 10.6% 4.6% 15.5%
(1) Represents a non-GAAP measure. For the relevant definitions and reconciliations to reported results, see “Non-GAAP Financial Measures”.
Three months ended February 29, 2016 compared to three months ended February 28, 2015
Revenues
Currency neutral revenues in the three-month period ended February 29, 2016 decreased by $5.8 million, or 4.2%, to $131.9million, primarily due to lower Baseball/Softball revenues, particularly in our important bat category. The chapter 11 filing by one of thelargest U.S. national sporting goods retailers and the bankruptcy of an internet baseball retailer reduced our sales for baseball and softballproducts. Revenues in the Baseball/Softball segment decreased by $14.1 million, or 19.6% compared to the prior year. Revenues in Hockeyincreased by $7.6 million, or 14.0% primarily due to growth in protective, team apparel, goalie and street hockey, higher closeouts, salesfrom the Own the Moment Hockey Experience retail stores, sales from the Easton Hockey business, as well as Hockey equipment priceincreases in Canada. This growth occurred despite a challenging business environment due primarily to the continued consolidation of theU.S. hockey retail market. Revenues in the Other Sports segment increased
27

by $0.7 million, or 6.2%, driven by strong growth in the MAVERIK line of heads, shafts, and protective gear. Currency neutral revenuesacross all segments decreased by 6.5% in North America and increased by 14.1% in the rest of the world.
Including the impact of foreign exchange, revenues decreased by $11.7 million, or 8.5%, to $126.1 million. Overall revenues inNorth America decreased by 9.4%, and decreased by 1.4% in the rest of the world. The translation impact of foreign exchange in the three-month period ended February 29, 2016 reduced our reported revenues by $5.8 million compared to the prior year.
For further detail on our revenues, please refer to the “Segment Results” section.
Cost of goods sold
Cost of goods sold in the three-month period ended February 29, 2016 decreased by $4.8 million, or 5.0%, to $90.7 million,primarily as a result of lower (i) Baseball/Softball revenues, (ii) lower Hockey product costs driven by productivity and sourcing initiativesin connection with the previously announced five-year supply chain initiative, (iii) a reduction in commodity-related factory input costsfrom Asian vendors and (iv) lower costs related to the lacrosse helmet decertification than incurred in the three-month period endedFebruary 28, 2015. These cost decreases were partially offset by higher Hockey volume due to growth in protective, team apparel, goalieand street hockey, higher closeouts, sales from the Own the Moment Hockey Experience retail stores, the acquisition of the Easton Hockeybusiness, and investments to consolidate distribution centers. Cost of goods sold in the three-month period ended February 29, 2016decreased by $5.4 million, excluding the impact of foreign exchange.
Gross Profit
Currency neutral gross profit in the three-month period ended February 29, 2016 decreased by $0.4 million, or 0.9%, to $41.9million, primarily as a result of lower Baseball/Softball revenues as well as investments to consolidate distribution centers, which werepartially offset by, (i) Hockey volume increases, (ii) lower Hockey product costs driven by productivity and sourcing initiatives inconnection with the previously announced five-year supply chain initiative, (iii) a reduction in commodity-related factory input costs fromAsian vendors, (iv) Hockey equipment price increases in Canada and (v) lower costs related to the lacrosse helmet decertification thanincurred in the three-month period ended February 28, 2015. As a percentage of revenues, currency neutral gross profit increased to 31.8%for the three-month period ended February 29, 2016 from 30.7% in the three-month period ended February 28, 2015 due to Hockeyequipment price increases in Canada, product cost reductions as well as lower costs related to the lacrosse helmet decertification thanincurred in the three-month period ended February 28, 2015, which were partially offset by investments to consolidate distribution centers.
Including the impact of foreign exchange, gross profit in the three-month period ended February 29, 2016 decreased by $6.9million, or 16.2%, to $35.4 million due to the factors referred to above as well as the impact of foreign exchange. As a percentage ofrevenues, gross profit decreased to 28.1% for the three-month period ended February 29, 2016 from 30.7% in the three-month period endedFebruary 28, 2015. The impact of foreign exchange in the three-month period ended February 29, 2016 decreased gross profit by $6.5million compared to the prior year. See “Factors Affecting our Performance - Cost of Goods Sold” and “Liquidity and Capital Resources”for more detail on our product costs.
Adjusted Gross Profit
Currency neutral Adjusted Gross Profit (removing purchase accounting related amortization, non-cash charges to cost of goodssold resulting from the fair value adjustment of inventories related to the Easton Baseball/Softball Acquisition, and investments toconsolidate distribution centers) in the three-month period ended February 29, 2016 increased by $0.7 million, or 1.5%, to $47.0 million.Currency neutral Adjusted Gross Profit as a percentage of revenues increased to 35.6% for the three-month period ended February 29, 2016from 33.6% for the three-month period ended February 28, 2015 as a result of (i) lower Hockey product costs driven by productivity andsourcing initiatives in connection with the previously announced five-year supply chain initiative, (ii) a reduction in commodity-relatedfactory input costs from Asian vendors and (iii) Hockey equipment price increases in Canada.
Including the impact of foreign exchange, Adjusted Gross Profit in the three-month period ended February 29, 2016 decreased by$6.1 million, or 13.2%, to $40.2 million. Adjusted Gross Profit as a percentage of revenues decreased to 31.9% for the three-month periodended February 29, 2016 from 33.6% for the three-month period ended February 28, 2015, primarily due to an unfavorable impact fromforeign exchange and partially offset by (i) lower Hockey product costs driven by productivity and sourcing initiatives in connection withthe previously announced five-year supply chain initiative, (ii) a reduction in commodity-related factory input costs from Asian vendors,and (iii) Hockey equipment price increases in Canada. Please see the Adjusted Gross Profit table for the reconciliation of gross profit toAdjusted Gross Profit in the “Non-GAAP Financial Measures” section.
28

Selling, General and Administrative Expenses
SG&A expenses in the three-month period ended February 29, 2016 increased by $20.3 million, or 59.6%, to $54.5 million whichwas primarily due to a write down of the receivable balance from a U.S. national sporting goods retailer that has filed under chapter 11 andadditional bad debt reserves primarily for certain U.S. Hockey and Baseball/Softball customers. SG&A expenses also include (i) start-upand operating costs related to the Own The Moment Hockey Experience retail store initiative, (ii) operating costs related to the EastonHockey business, (iii) costs related to Q30 Technology and (iv) investments in the Company and Easton Baseball/Softball IT infrastructure,which were partially offset by a reduction in performance-based incentives as well as a favorable impact from foreign exchange. Excludingthe impact of one-time acquisition and rebranding related costs, share-based payment expense and start-up costs related to the Own TheMoment Hockey Experience retail store initiative, our SG&A expenses increased by $18.7 million, or 63.6%, to $48.1 million due to thefactors referred to above.
As a percentage of revenues, our SG&A expenses increased to 43.3% for the three-month period ended February 29, 2016 from24.8% of revenues for the three-month period ended February 28, 2015. Excluding the impact of one-time acquisition and rebrandingrelated costs, share-based payment expense and start-up costs related to the Own The Moment Hockey Experience retail store initiative, ourSG&A expenses as a percentage of revenue increased to 38.2% for the three-month period ended February 29, 2016 from 21.4% ofrevenues for the three-month period ended February 28, 2015. The increase is primarily driven by incremental bad debt expense comparedto the same year-ago quarter of 1,470 basis points.
The translation impact of foreign exchange for the three-month period ended February 29, 2016 decreased our reported SG&Aexpenses by $1.6 million compared to prior year.
Research and Development Expenses
R&D expenses in the three-month period ended February 29, 2016 increased by $0.5 million, or 7.7%, to $6.4 million due to ourcontinued focus on innovative product development. As a percentage of revenues, our R&D expenses increased to 5.1% for the three-month period ended February 29, 2016 from 4.4% for the three-month period ended February 28, 2015. The translation impact of foreignexchange for the three-month period ended February 29, 2016 reduced our reported R&D expenses by $0.5 million compared to prior year.
Impairment of Intangibles and Goodwill
The Company’s third quarter financial performance, combined with a reduction in the fourth quarter Adjusted EPS guidance and adecline in its market capitalization during the quarter, triggered the requirement for an interim impairment assessment for the Company’sindefinite-lived and definite-lived assets. The result of the interim impairment assessment of the Company’s indefinite-lived trade namesindicated that the carrying value of the EASTON brand name in Baseball/Softball was impaired. As a result, the Company recorded anestimated non-cash impairment charge of $46.9 million related to the EASTON brand name in Baseball/Softball in the three-month periodended February 29, 2016. The definite-lived asset impairment test resulted in an estimated non-cash intangible asset charge of $40.5 millionrelated to the Easton Baseball/Softball customer relationship intangible asset and an estimated non-cash intangible asset charge of $1.9million related to the Easton Baseball/Softball purchased technology. The impairment for Baseball/Softball was due to, among otherthings, a decline in the sales and gross profit of the EASTON brand and the bankruptcy of certain key customers. No other indefinite-livedand definite-lived assets were determined to be impaired.
The Company then performed an interim impairment test of goodwill allocated to the Company’s reporting units. The interimimpairment test resulted in estimated non-cash goodwill impairment charges of $55.4 million related to the goodwill allocated to theBaseball/Softball reporting unit and $0.4 million related to the goodwill allocated to the Soccer reporting unit. The impairment chargerelated to the Baseball/Softball reporting unit was due to, among other things, a decline in the sales and gross margin of the EASTON brandin Baseball/Softball. The impairment charge related to the Soccer reporting unit was due to, among other things, higher operating costs.The goodwill allocated to the Hockey and Lacrosse reporting units was deemed not to be impaired.
The finalization of the impairment between indefinite-lived intangible assets, definite-lived intangible assets, and goodwill isexpected to be completed in the fourth quarter of Fiscal 2016 and any adjustment to the amount recorded, which could differ materiallyfrom those described above, will be recorded in the fourth quarter of Fiscal 2016. The Company did not record any intangible asset orgoodwill impairment charges in the three-month period ended February 28, 2015.
The impairment of goodwill and intangible assets is a non-cash charge and is not currently expected to adversely affect theCompany’s debt position, compliance with financial covenants, cash flow or liquidity.
29

For further detail, refer to Note 6 - Intangible Assets, net in the accompanying Notes to Consolidated Financial Statements and toPart II, Item 7 “Management’s Discussion and Analysis of Financial Condition and Results of Operations - Critical Accounting Policiesand Estimates - Impairment of Non-Financial Assets” section of our Annual Report on Form 10-K for the fiscal year ended May 31, 2015.
Adjusted EBITDA
Currency neutral Adjusted EBITDA in the three-month period ended February 29, 2016 decreased by $19.7 million, or greaterthan 100%, to negative $5.1 million from $14.6 million in the three-month period ended February 28, 2015 primarily due to (i) a writedown of the receivable balance from a U.S. national sporting goods retailer that has filed under chapter 11, (ii) additional bad debt reservesprimarily for certain U.S. Hockey and Baseball/Softball customers, and (iii) lower Baseball/Softball revenues, particularly in our importantbat category. This downturn in revenues was in addition to the chapter 11 filing by one of the largest U.S. national sporting goods retailersand the bankruptcy of an internet baseball retailer, which also impacted sales for our baseball and softball products. The Baseball/Softballrevenue decline was partially offset by (i) growth in protective, team apparel, goalie and street hockey, (ii) higher closeouts, (iii) sales fromthe Own the Moment Hockey Experience retail stores, (iv) sales from the Easton Hockey business, (v) higher closeouts, (vi) lower Hockeyproduct costs driven by productivity and sourcing initiatives as part of the previously announced five-year supply chain initiative, and (vii)a reduction in commodity-related factory input costs from Asian vendors. As a percentage of revenues, currency neutral Adjusted EBITDAdecreased to negative 3.9% for the three-month period ended February 29, 2016 from 10.6% for the three-month period ended February 28,2015.
Excluding the impact of bad debt reserves, currency neutral Adjusted EBITDA in the three-month period ended February 29, 2016decreased by $1.0 million, to $13.9 million from $14.9 million in the three month period ended February 28, 2015.
Including the impact of foreign exchange and bad debt reserves, Adjusted EBITDA in the three-month period ended February 29,2016 decreased by $25.6 million, or greater than 100%, to a negative $11.0 million from $14.6 million, due to the factors referred to aboveand an unfavorable impact from foreign exchange of $5.9 million. As a percentage of revenues, Adjusted EBITDA decreased to negative8.7% for the three-month period ended February 29, 2016 from 10.6% for the three-month period ended February 28, 2015. Please see theAdjusted EBITDA table for the reconciliation of net income to Adjusted EBITDA in the “Non-GAAP Financial Measures” section.
Interest Expense, net
Interest expense in the three-month period ended February 29, 2016 increased by $0.6 million, or 13.4%, to $5.4 million from $4.8million, due to an increase in interest incurred under our revolving line of credit.
Derivative and Foreign Exchange Gains/Losses
Realized gain on derivatives in the three-month period ended February 29, 2016 decreased by $0.7 million, or 47.9%, to a gain of$0.7 million from a gain of $1.4 million, due to the continued devaluation of the Canadian dollar relative to the hedge rates in effect on theCompany’s forward contracts.
Unrealized loss on derivatives in the three-month period ended February 29, 2016 increased by $2.5 million, or greater than100%, to a loss of $2.6 million from a loss of $0.1 million. The Company has not elected hedge accounting and therefore the changes in thefair value of derivative contracts are recognized through profit or loss each reporting period.
Foreign exchange loss in the three-month period ended February 29, 2016 decreased by $12.8 million, or 96.4%, to a loss of $0.6million from a loss of $13.2 million. The foreign exchange gain/loss represents the realized and unrealized gains/losses generated fromrevaluing non-functional currency assets and liabilities to their respective functional currency. The realized foreign exchange gain in thethree-month period ended February 29, 2016 increased $0.3 million, to $0.5 million from $0.2 million in the three-month period endedFebruary 28, 2015.
See “Factors Affecting Our Performance - Impact of Foreign Exchange and Hedging Practices”.
Income Taxes
During the three-month period ended February 29, 2016, the Company’s operating losses were greater than anticipated. As a resultof the operating loss, the Company entered into a three-year cumulative loss position for certain taxable jurisdictions during the thirdquarter of fiscal 2016. After consideration of these factors and an evaluation of all positive and negative evidence,
30

the Company has determined that it is more likely than not that it will not be able to realize the benefits of its deferred tax assets.Accordingly, at February 29, 2016, the Company recorded an incremental charge of $19.2 million to establish a full valuation allowanceagainst the impacted deferred tax assets including net operating loss carryforwards that expire at various dates in the next 17 years.Realization of the Company’s deferred tax assets is dependent on generating sufficient taxable income in future years. These events andcircumstances contributed to the Company recording income tax expense for the three-and nine-month periods ended February 29, 2016,despite incurring pre-tax losses in those periods of $177.3 million and $186.7 million, respectively.
Income tax expense for the three-month period ended February 29, 2016 was $10.7 million, comprised primarily of discrete items,including a valuation allowance on deferred tax assets of $19.2 million, partially offset by an income tax benefit of $6.1 million related tothe impairment of intangible assets and goodwill and an income tax benefit of $3.1 million for the amount of tax recoverable by carrybackof the current year loss to prior years. Income tax benefit in the three-month period ended February 28, 2015 was $2.0 million on a pre-taxloss of $14.5 million for an effective tax rate of 14.2%. The relatively low effective tax rate was primarily due to unrealized capital lossesfor which no tax benefit could be recognized.
Net Loss
Net loss in the three-month period ended February 29, 2016 increased by $175.6 million, or greater than 100%, to a net loss of$188.1 million from a net loss of $12.5 million in the three-month period ended February 28, 2015, due to the results described above. Theimpact of foreign exchange for the three-month period ended February 29, 2016 decreased our net loss by $2.4 million compared to theprior year.
Currency neutral net loss in the three-month period ended February 29, 2016 excluding goodwill impairment, non-cash valuationallowance and the impact of bad debt reserves decreased by $3.5 million, or 28.5%, to a net loss of $15.8 million from a net loss of $12.3million in the three-month period ended February 28, 2015.
Adjusted Net Income/Loss
Currency neutral Adjusted Net Income in the three-month period ended February 29, 2016 decreased by $16.2 million, or greaterthan 100%, to negative $10.6 million from $5.6 million in the three-month period ended February 28, 2015, due to the operating resultsreflected in the Adjusted EBITDA section, which were partially offset by lower taxes.
Currency neutral Adjusted Net Income in the three-month period ended February 29, 2016 excluding the impact of bad debtreserves decreased by $4.7 million, or 82.5%, to $1.0 million from $5.7 million in the three-month period ended February 28, 2015.
Including the impact of foreign exchange, Adjusted Net Income/Loss in the three-month period ended February 29, 2016decreased by $20.4 million, or greater than 100%, to an Adjusted Net Loss of $14.8 million from an Adjusted Net Income of $5.6 million inthe three-month period ended February 28, 2015, due to the factors referred to above and an unfavorable impact from foreign exchange of$4.2 million. Adjusted Net Income/Loss removes unrealized foreign exchange gains/losses, acquisition-related charges, share-basedpayment expense and other one-time or non-cash expenses. Please see the Adjusted Net Income/Loss table in the “Non-GAAP FinancialMeasures” section for the reconciliation of net income (loss) to Adjusted Net Income/Loss and Adjusted EPS.
Nine months ended February 29, 2016 compared to nine months ended February 28, 2015
Revenues
Currency neutral revenues in the nine-month period ended February 29, 2016 decreased by $22.9 million, or 4.5%, to $484.3million, primarily due to (i) lower Baseball/Softball revenues, (ii) the timing and variation of product launches in ice hockey equipment,(iii) double-digit declines in Hockey performance apparel related to the prior-year launch of 37.5T M apparel, (iv) economic contraction inRussia/Eastern Europe and (v) lower Hockey bookings/repeats due to retail consolidation of U.S. key accounts. Baseball/Softball revenuesdecreased by $12.4 million, or 8.1%, which included declines in our important bat category, and also included the impact from the chapter11 filing by one of the largest U.S. national sporting goods retailers and the bankruptcy of an internet baseball retailer. Hockey revenuesdecreased by $13.0 million, or 4.0%, due primarily to (i) the timing and variation of product launches in ice hockey equipment, (ii) double-digit declines in Hockey performance apparel related to the prior-year launch of 37.5T M apparel, (iii) economic contraction inRussia/Eastern Europe and (iv) lower Hockey bookings/repeats in the U.S. due to retail consolidation of key accounts as well as lower salesdue to the financial difficulties of certain U.S. Hockey customers. Revenues in the Other Sports segment increased by $2.5 million, or9.7%, driven by strong growth in the MAVERIK line of heads, shafts, and protective gear as well as growth in the CASCADE helmets andfacial product category. Currency neutral revenues
31
across all segments decreased by 4.0% in North America and decreased by 6.9% in the rest of the world.
Including the impact of foreign exchange, revenues decreased by $53.0 million, or 10.4%, to $454.2 million. Overall revenues inNorth America decreased by 8.1%, and decreased by 21.2% in the rest of the world. The translation impact of foreign exchange in the nine-month period ended February 29, 2016 reduced our reported revenues by $30.1 million compared to the prior year.
For further detail on our revenues, please refer to the “Segment Results” section.
Cost of goods sold
Cost of goods sold in the nine-month period ended February 29, 2016 decreased by $24.6 million, or 7.1%, to $320.4 million, as aresult of (i) lower Baseball/Softball and Hockey revenues, (ii) lower Hockey product costs driven by productivity and sourcing initiatives inconnection with the previously announced five-year supply chain initiative, (iii) a reduction in commodity-related factory input costs fromAsian vendors, (iv) lower non-cash charges to cost of goods sold resulting from the fair value adjustment of inventories related to theacquisition of Easton Baseball/Softball (the “Easton Baseball/Softball Acquisition”) of $7.1 million in the nine-month period endedFebruary 28, 2015, (v) lower costs related to the lacrosse helmet decertification than incurred in the nine-month period ended February 28,2015, which were partially offset by investments to consolidate distribution centers. Cost of goods sold in the nine-month period endedFebruary 29, 2016 decreased by $24.7 million, excluding the impact of foreign exchange.
Gross Profit
Currency neutral gross profit in the nine-month period ended February 29, 2016 increased by $1.9 million, or 1.2%, due to (i)lower non-cash charges to cost of goods sold resulting from the fair value adjustment of inventories related to the Easton Baseball/SoftballAcquisition of $7.1 million than incurred in the nine-month period ended February 28, 2015, (ii) lower costs related to the lacrosse helmetdecertification than incurred in the nine-month period ended February 28, 2015, (iii) Hockey equipment price increases in Canada, (iv)lower Hockey product costs driven by productivity and sourcing initiatives in connection with the previously announced five-year supplychain initiative and (v) a reduction in commodity related factory input costs from Asian vendors, which were partially offset by lowerBaseball/Softball and Hockey revenues as well as investments to consolidate distribution centers. As a percentage of revenues, currencyneutral gross profit increased to 33.9% for the nine-month period ended February 29, 2016 from 32.0% in the nine-month period endedFebruary 28, 2015.
Including the impact of foreign exchange, gross profit in the nine-month period ended February 29, 2016 decreased by $ 28.4million, or 17.5%, to $133.8 million, due to an unfavorable impact from foreign exchange, which was partially offset by the factorsmentioned above. As a percentage of revenues, gross profit decreased to 29.5% for the nine-month period ended February 29, 2016 from32.0% in the nine-month period ended February 28, 2015. The impact of foreign exchange in the nine-month period ended February 29,2016 decreased gross profit by $30.2 million compared to the prior year. See “Factors Affecting our Performance - Cost of Goods Sold”and “Liquidity and Capital Resources” for more detail on our product costs.
Adjusted Gross Profit
Currency neutral Adjusted Gross Profit (removing purchase accounting related amortization, non-cash charges to cost of goodssold resulting from the fair value adjustment of inventories related to the Easton Baseball/Softball Acquisition and investments toconsolidate distribution centers) in the nine-month period ended February 29, 2016 decreased by $4.4 million, or 2.4%, to $177.5 million.Currency neutral Adjusted Gross Profit as a percentage of revenues increased to 36.7% for the nine-month period ended February 29, 2016from 35.9% for the nine-month period ended February 28, 2015, due to (i) lower Hockey product costs driven by productivity and sourcinginitiatives in connection with the previously announced five-year supply chain initiative, (ii) a reduction in commodity related factory inputcosts from Asian vendors, and (iii) Hockey equipment price increases in Canada.
Including the impact of foreign exchange, Adjusted Gross Profit in the nine-month period ended February 29, 2016 decreased by$35.4 million, or 19.5%, to $146.5 million. Adjusted Gross Profit as a percentage of revenues decreased to 32.3% for the nine-monthperiod ended February 29, 2016 from 35.9% for the nine-month period ended February 28, 2015, primarily a result of an unfavorableimpact from foreign exchange. Please see the Adjusted Gross Profit table for the reconciliation of gross profit to Adjusted Gross Profit inthe “Non-GAAP Financial Measures” section.
32
Selling, General and Administrative Expenses
SG&A expenses in the nine-month period ended February 29, 2016 increased by $25.0 million, or 22.9%, to $134.1 millionprimarily due to (i) a write down of the receivable balance from a U.S. national sporting goods retailer that has filed under chapter 11, (ii) awrite down of the receivable balance for an internet baseball retailer that filed for bankruptcy reorganization (iii) and additional bad debtreserves primarily for certain U.S. Hockey and Baseball/Softball customers. SG&A expenses also include (i) start-up and operating costsrelated to the Own The Moment Hockey Experience retail store initiative, (ii) operating costs related to the Easton Hockey Acquisition,(iii) costs related to Q30 Technology, (iv) higher Company corporate costs, due in part to regulatory compliance costs associated with theCompany’s transition to a U.S. domestic issuer, (v) investments in the Company and Easton Baseball/Softball IT infrastructure and (vi)costs related to the proxy contest in October 2015, which were partially offset by a reduction in performance-based incentives as well as afavorable impact from foreign exchange. Excluding the impact of one-time acquisition and rebranding related costs, share-based paymentexpense, start-up costs related to the Own The Moment Hockey Experience retail store initiative, regulatory compliance costs associatedwith the Company’s transition to being a U.S. domestic issuer and costs related to the proxy contest in October 2015, our SG&A expensesincreased by $20.8 million, or 21.8%, to $116.3 million.
As a percentage of revenues, our SG&A expenses increased to 29.5% for the nine-month period ended February 29, 2016 from21.5% of revenues for the nine-month period ended February 28, 2015. Excluding the impact of acquisition-related costs, share-basedpayment expense, start-up costs related to the Own The Moment Hockey Experience retail store initiative, regulatory compliance costsassociated with the Company’s transition to being a U.S. domestic issuer, costs related to the proxy contest in October 2015 and other one-time or non-cash expenses, SG&A expenses as a percentage of revenue increased to 25.6% for the nine-month period ended February 29,2016 from 18.8% of revenues for the nine-month period ended February 28, 2015. The increase is primarily driven by incremental baddebt expense compared to the same year-ago quarter of 510 basis points.
The translation impact of foreign exchange for the nine-month period ended February 29, 2016 decreased our reported SG&Aexpenses by $4.8 million compared to prior year.
Research and Development Expenses
R&D expenses in the nine-month period ended February 29, 2016 increased by $0.1 million, or 0.4%, to $18.6 million. As apercentage of revenues, our R&D expenses increased to 4.1% for the nine-month period ended February 29, 2016 from 3.6% for the nine-month period ended February 28, 2015 as a result of our continued focus on innovative product development. The translation impact offoreign exchange for the nine-month period ended February 29, 2016 reduced our reported R&D expenses by $1.2 million compared toprior year.
Impairment of Intangibles and Goodwill
In the nine-month period ended February 29, 2016, the Company recorded an intangibles impairment charge of $89.3 million anda goodwill impairment charge of $55.8 million, due to the factors described above in the three-month period ended February 29, 2016. TheCompany did not record any intangible asset or goodwill impairment charges in the nine-month period ended February 28, 2015.
Adjusted EBITDA
Currency neutral Adjusted EBITDA in the nine-month period ended February 29, 2016 decreased by $ 28.7 million, or 36.6%, to$49.8 million from $78.5 million primarily due to (i) a write down of the receivable balance from a U.S. national sporting goods retailerthat has filed under chapter 11, (ii) a write down of the receivable balance for an internet baseball retailer that filed for bankruptcyreorganization (iii) additional bad debt reserves primarily for certain U.S. Hockey and Baseball/Softball customers, and (iv) lowerBaseball/Softball revenues, (v) economic contraction in Russia/Eastern Europe and (vi) lower Hockey bookings/repeats due to retailconsolidation of U.S. key accounts. The revenue declines and bad debt reserves are partially offset by (i) lower Hockey product costs drivenby productivity and sourcing initiatives as part of the previously announced five-year supply chain initiative and (ii) a reduction incommodity-related factory input costs from Asian vendors. As a percentage of revenues, currency neutral Adjusted EBITDA decreased to10.3% for the nine-month period ended February 29, 2016 from 15.5% for the nine-month period ended February 28, 2015.
Excluding the impact of bad debt reserves, currency neutral Adjusted EBITDA in the nine-month period ended February 29, 2016decreased by $5.5 million, to $74.1 million from $79.6 million in the nine-month period ended February 28, 2015.
Including the impact of foreign exchange and bad debt reserves, Adjusted EBITDA in the nine-month period ended
33

February 29, 2016 decreased by $57.6 million, or 73.4%, to $20.9 million from $78.5 million, due to the above factors and an unfavorableimpact from foreign exchange of $28.9 million. As a percentage of revenues, Adjusted EBITDA decreased to 4.6% for the nine-monthperiod ended February 29, 2016 from 15.5% for the nine-month period ended February 28, 2015. Please see the Adjusted EBITDA tablefor the reconciliation of net income to Adjusted EBITDA in the “Non-GAAP Financial Measures” section.
Interest Expense, net
Interest expense in the nine-month period ended February 29, 2016 increased by $0.7 million, or 4.9%, to $15.7 million from$14.9 million due to by an increase in interest incurred under our revolving line of credit.
Derivative and Foreign Exchange Gains/Losses
Realized gain on derivatives in the nine-month period ended February 29, 2016 decreased by $2.9 million, or 59.3%, to $2.0million from $4.9 million, due to the continued devaluation of the Canadian dollar relative to the hedge rates in effect on the Company’sforward contracts.
Unrealized loss on derivatives in the nine-month period ended February 29, 2016 increased by $0.2 million, or 23.1%, to a loss of$1.2 million from a loss of $1.0 million. The Company has not elected hedge accounting and therefore the changes in the fair value ofderivative contracts are recognized through profit or loss each reporting period.
Foreign exchange loss in the nine-month period ended February 29, 2016 decreased by $11.5 million, or 56.8%, to a loss of $8.8million from a loss of $20.3 million. The foreign exchange gain/loss represents the realized and unrealized gains/losses generated fromrevaluing non-functional currency assets and liabilities to their respective functional currency. The realized foreign exchange gain in thethree-month period ended February 29, 2016 decreased $0.3 million, to $1.3 million from $1.6 million in the three-month period endedFebruary 28, 2015.
See “Factors Affecting Our Performance - Impact of Foreign Exchange and Hedging Practices”.
Income Taxes
During the nine months ended February 29, 2016, the Company’s operating losses were greater than anticipated. As a result of theoperating loss, the Company entered into a three-year cumulative loss position for certain taxable jurisdictions during the third quarter ofFiscal 2016. After consideration of these factors and an evaluation of all positive and negative evidence, the Company has determined thatit is more likely than not that it will not be able to realize the benefits of its deferred tax assets. Accordingly, at February 29, 2016, theCompany recorded an incremental charge of $19.2 million to establish a full valuation allowance against the impacted deferred tax assetsincluding net operating loss carryforwards that expire at various dates in the next 17 years. Realization of the Company’s deferred taxassets is dependent on generating sufficient taxable income in future years. These events and circumstances contributed to the Companyrecording income tax expense for the three-and nine-month periods ended February 29, 2016, despite incurring pre-tax losses in thoseperiods of $177.3 million and $186.7 million, respectively.
Income tax expense for the nine-month period ended February 29, 2016 was $ 10.2 million, comprised primarily of discrete items,including a valuation allowance on deferred tax assets of $19.2 million, partially offset by an income tax benefit of $6.1 million related tothe impairment of intangible assets and goodwill and an income tax benefit of $3.1 million for the amount of tax recoverable by carrybackof the current year loss to prior years. Income tax expense in the nine-month period ended February 28, 2015 was $3.7 million on pre-taxincome of $3.0 million, for an effective tax rate of 123%. The high effective tax rate was primarily due to unrealized capital losses forwhich no tax benefit could be recognized.
Net Loss
Net loss in the nine-month period ended February 29, 2016 increased by $196.2 million, or greater than 100%, to a net loss of$196.9 million from a net loss of $0.7 million in the nine-month period ended February 28, 2015 due to the results described above. Theimpact of foreign exchange for the nine-month period ended February 29, 2016 increased our net loss by $19.3 million compared to theprior year.
Currency neutral net loss in the nine-month period ended February 29, 2016, excluding goodwill impairment, non-cash valuationallowance and the impact of bad debt reserves, is $4.6 million, compared with a net loss of $0.0 million in the nine-month period endedFebruary 28, 2015.
34

Adjusted Net Income/Loss
Currency neutral Adjusted Net Income in the nine-month period ended February 29, 2016 decreased by $20.9 million, or 53.9%,t o $17.9 million from $38.8 million in the nine-month period ended February 28, 2015, due to the operating results reflected in theAdjusted EBITDA section which were partially offset by lower taxes.
Currency neutral Adjusted Net Income in the nine-month period ended February 29, 2016 excluding the impact of bad debtreserves decreased by $6.7 million, or 17.0%, to $32.7 million from $39.4 million in the nine-month period ended February 28, 2015.
Including the impact of foreign exchange, Adjusted Net Income/Loss in the nine-month period ended February 29, 2016 decreasedby $41.7 million, or greater than 100%, to an Adjusted Net Loss of $2.9 million from an Adjusted Net Income of $38.8 in the nine-monthperiod ended February 28, 2015, due to the factors referred to above and an unfavorable impact from foreign exchange of $20.8 million.Adjusted Net Income/Loss removes unrealized foreign exchange gains/losses, acquisition-related charges, share-based payment expenseand other one-time or non-cash expenses. Please see the Adjusted Net Income/Loss table in the “Non-GAAP Financial Measures” sectionfor the reconciliation of net income (loss) to Adjusted Net Income/Loss and Adjusted EPS.
Segment Results
The Company has two reportable operating segments: (i) Hockey and (ii) Baseball/Softball. The remaining operating segments donot meet the criteria for a reportable segment and are included in Other Sports. The Hockey segment includes the BAUER, EASTON andMISSION brands. The Baseball/Softball segment includes the EASTON and COMBAT brands. Other Sports includes the lacrosse andsoccer operating segments, which includes the MAVERIK, CASCADE, and INARIA brands. The Hockey segment sales channels include:(i) direct sales to retailers in North America and the Nordic countries, (ii) distributors throughout the rest of the world (principally, WesternEurope, Eastern Europe, and Russia), (iii) direct sales to teams, and (iv) direct sales from our Own The Moment Experience retail stores.The Baseball/Softball segment sales channels primarily consist of retailers and distributors in North America. The Other Sports segmentsales channels primarily include retailers and distributors in North America and direct sales to teams and sports associations.
These operating segments were determined based on the management structure and the financial information, among other factors,reviewed by the Chief Operating Decision Maker (“CODM”) to assess segment performance. The decisions concerning assessing theperformance of segments and allocation of resources to the segments are based on segment revenues and segment EBITDA.
35
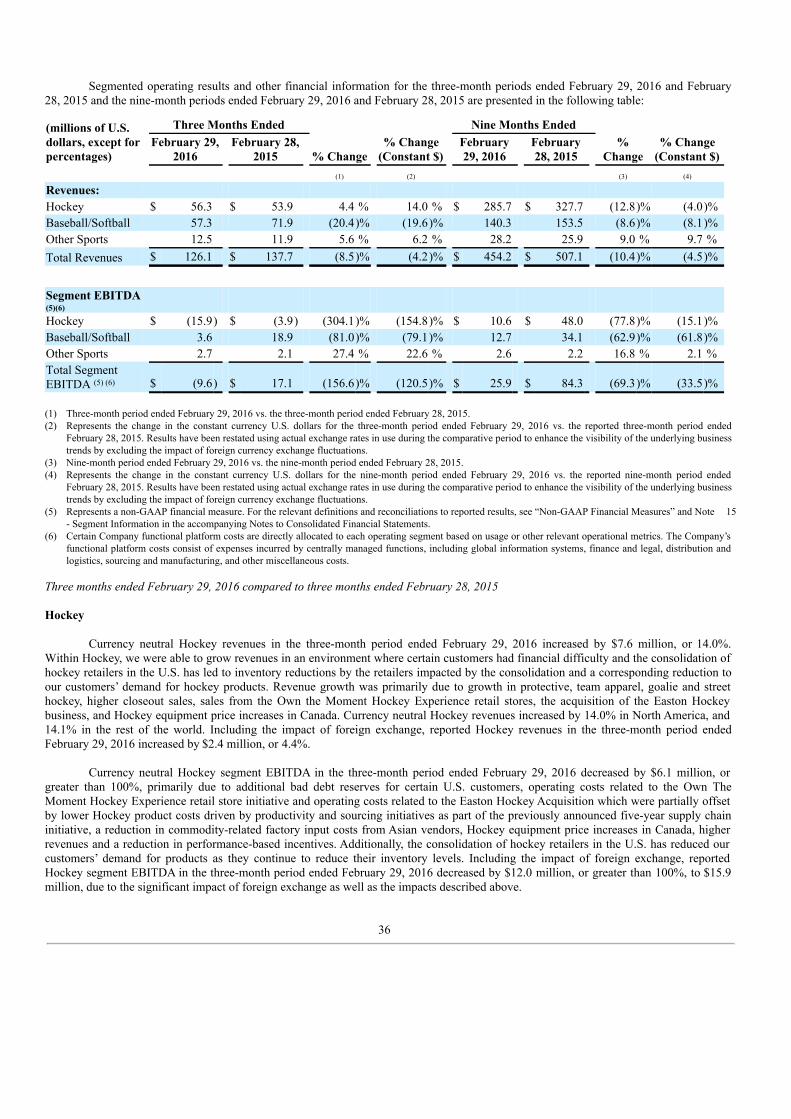
Segmented operating results and other financial information for the three-month periods ended February 29, 2016 and February28, 2015 and the nine-month periods ended February 29, 2016 and February 28, 2015 are presented in the following table:
(millions of U.S.dollars, except forpercentages)
Three Months Ended
% Change
% Change
(Constant $)
Nine Months Ended%
Change% Change
(Constant $) February 29,
2016 February 28,
2015 February29, 2016
February28, 2015
(1) (2) (3) (4)
Revenues: Hockey $ 56.3 $ 53.9 4.4 % 14.0 % $ 285.7 $ 327.7 (12.8)% (4.0)%Baseball/Softball 57.3 71.9 (20.4)% (19.6)% 140.3 153.5 (8.6)% (8.1)%Other Sports 12.5 11.9 5.6 % 6.2 % 28.2 25.9 9.0 % 9.7 %Total Revenues $ 126.1 $ 137.7 (8.5)% (4.2)% $ 454.2 $ 507.1 (10.4)% (4.5)%
Segment EBITDA(5)(6) Hockey $ (15.9) $ (3.9) (304.1)% (154.8)% $ 10.6 $ 48.0 (77.8)% (15.1)%Baseball/Softball 3.6 18.9 (81.0)% (79.1)% 12.7 34.1 (62.9)% (61.8)%Other Sports 2.7 2.1 27.4 % 22.6 % 2.6 2.2 16.8 % 2.1 %Total SegmentEBITDA (5) (6) $ (9.6) $ 17.1 (156.6)% (120.5)% $ 25.9 $ 84.3 (69.3)% (33.5)%
(1) Three-month period ended February 29, 2016 vs. the three-month period ended February 28, 2015.(2) Represents the change in the constant currency U.S. dollars for the three-month period ended February 29, 2016 vs. the reported three-month period ended
February 28, 2015. Results have been restated using actual exchange rates in use during the comparative period to enhance the visibility of the underlying businesstrends by excluding the impact of foreign currency exchange fluctuations.
(3) Nine-month period ended February 29, 2016 vs. the nine-month period ended February 28, 2015.(4) Represents the change in the constant currency U.S. dollars for the nine-month period ended February 29, 2016 vs. the reported nine-month period ended
February 28, 2015. Results have been restated using actual exchange rates in use during the comparative period to enhance the visibility of the underlying businesstrends by excluding the impact of foreign currency exchange fluctuations.
(5) Represents a non-GAAP financial measure. For the relevant definitions and reconciliations to reported results, see “Non-GAAP Financial Measures” and Note 15- Segment Information in the accompanying Notes to Consolidated Financial Statements.
(6) Certain Company functional platform costs are directly allocated to each operating segment based on usage or other relevant operational metrics. The Company’sfunctional platform costs consist of expenses incurred by centrally managed functions, including global information systems, finance and legal, distribution andlogistics, sourcing and manufacturing, and other miscellaneous costs.
Three months ended February 29, 2016 compared to three months ended February 28, 2015
Hockey
Currency neutral Hockey revenues in the three-month period ended February 29, 2016 increased by $7.6 million, or 14.0%.Within Hockey, we were able to grow revenues in an environment where certain customers had financial difficulty and the consolidation ofhockey retailers in the U.S. has led to inventory reductions by the retailers impacted by the consolidation and a corresponding reduction toour customers’ demand for hockey products. Revenue growth was primarily due to growth in protective, team apparel, goalie and streethockey, higher closeout sales, sales from the Own the Moment Hockey Experience retail stores, the acquisition of the Easton Hockeybusiness, and Hockey equipment price increases in Canada. Currency neutral Hockey revenues increased by 14.0% in North America, and14.1% in the rest of the world. Including the impact of foreign exchange, reported Hockey revenues in the three-month period endedFebruary 29, 2016 increased by $2.4 million, or 4.4%.
Currency neutral Hockey segment EBITDA in the three-month period ended February 29, 2016 decreased by $6.1 million, orgreater than 100%, primarily due to additional bad debt reserves for certain U.S. customers, operating costs related to the Own TheMoment Hockey Experience retail store initiative and operating costs related to the Easton Hockey Acquisition which were partially offsetby lower Hockey product costs driven by productivity and sourcing initiatives as part of the previously announced five-year supply chaininitiative, a reduction in commodity-related factory input costs from Asian vendors, Hockey equipment price increases in Canada, higherrevenues and a reduction in performance-based incentives. Additionally, the consolidation of hockey retailers in the U.S. has reduced ourcustomers’ demand for products as they continue to reduce their inventory levels. Including the impact of foreign exchange, reportedHockey segment EBITDA in the three-month period ended February 29, 2016 decreased by $12.0 million, or greater than 100%, to $15.9million, due to the significant impact of foreign exchange as well as the impacts described above.
36

Baseball/Softball
Baseball/Softball revenue in the three-month period ended February 29, 2016 decreased by $14.7 million, or 20.4%, to $57.3million primarily due to declining revenue from our important bat category as well as the loss of sales as a result of the chapter 11 filing byone of the largest U.S. national sporting goods retailers and the bankruptcy of an internet baseball retailer in the second quarter. COMBATrevenue increased 8.9% or $0.2 million compared to prior year related to variations in the launch timing and continued strong sales ofMaxum bats.
Baseball/Softball segment EBITDA in the three-month period ended February 29, 2016 decreased by $15.3 million, or 81.0%, to$3.6 million primarily due to lower revenues as well as a write down of the receivable balance from a U.S. national sporting goods retailerthat has filed under chapter 11, and the increase in bad debt reserves for certain U.S. baseball/softball customers, which was partially offsetby a reduction in performance-based incentives.
Other Sports
Revenues in our Other Sports segment in the three-month period ended February 29, 2016 increased by $0.7 million, or 5.6%, to$12.5 million primarily due to strength in the MAVERIK line of heads, shafts and protective gear.
Other Sports segment EBITDA in the three-month period ended February 29, 2016 increased by $0.6 million, or 27.4%, due torevenue growth as well as lower margins in the prior year related to changes required for the recertification of the CASCADE R helmet.
Nine months ended February 29, 2016 compared to nine months ended February 28, 2015
Hockey
Currency neutral Hockey revenues in the nine-month period ended February 29, 2016 decreased by $13.0 million, or 4.0%, due to(i) the timing and variation of product launches in ice hockey equipment, (ii) double-digit declines in performance apparel related to theprior year launch of 37.5TM apparel, (iii) economic contraction in Russia/Eastern Europe, (iv) lower Hockey bookings/repeats due to retailconsolidation of U.S. key accounts, and (v) lower sales due to the financial difficulties of certain U.S. customers, which were partially offsetby growth in protective, team apparel, goalie and street hockey, higher closeout sales, sales from the launch of the Own the MomentHockey Experience retail stores, the acquisition of the Easton Hockey business, and Hockey equipment price increases in Canada.Currency neutral Hockey revenues declined by 2.8% in North America, and 6.9% in the rest of the world. Including the impact of foreignexchange, reported Hockey revenues in the nine-month period ended February 29, 2016 decreased by $42.0 million, or 12.8%.
Currency neutral Hockey segment EBITDA in the nine-month period ended February 29, 2016 decreased by $7.2 million, or15.1%, primarily due to additional bad debt reserves for certain U.S. customers, and lower revenues which were partially offset by priceincreases in Canada and lower costs for new product launches. Including the impact of foreign exchange, reported Hockey segmentEBITDA in the nine-month period ended February 29, 2016 decreased by $37.3 million, or 77.8%, to $10.6 million, due to the significantimpact of foreign exchange as well as the impacts described above.
Baseball/Softball
Baseball/Softball revenue in the nine-month period ended February 29, 2016 decreased by $13.2 million, or 8.6%, to $140.3million due to a significant downturn in retail sales across most product categories, including bats.
Baseball/Softball segment EBITDA in the nine-month period ended February 29, 2016 decreased by $21.4 million, or 62.9%, to$12.7 million primarily due to lower revenues, a write down of the receivable balance from a U.S. national sporting goods retailer that hasfiled under chapter 11 and a write down of the receivable balance for an internet baseball retailer that filed for bankruptcy reorganization,partially offset by a reduction in performance-based incentives as well as other cost savings initiatives.
37

Other Sports
Revenues in our Other Sports segment in the nine-month period ended February 29, 2016 increased by $2.3 million, or 9.0%, to$28.2 million primarily due to strength in the MAVERIK line of heads, shafts and protective gear and growth in the CASCADE helmetsand facial product category.
Other Sports segment EBITDA in the nine-month period ended February 29, 2016 increased by $0.4 million, or 16.8% due tohigher revenues and margins which were partially offset by bad debt write-offs related to outstanding receivables for customers who havecaused prior concern over such customers’ ability to make timely payments and who continue to make delayed payments.
For operating segments data, please refer to Note 15 of the Notes to Consolidated Financial Statements.
Non-GAAP Financial Measures
This quarterly report on Form 10-Q makes reference to certain non-GAAP measures. These non-GAAP measures are notrecognized measures under U.S. GAAP and do not have a standardized meaning prescribed by U.S. GAAP. When used, these measures aredefined in such terms as to allow the reconciliation to the closest U.S. GAAP measure. These measures are therefore unlikely to becomparable to similar measures presented by other companies. Rather, these measures are provided as additional information tocomplement those U.S. GAAP measures by providing further understanding of the Company’s results of operations from management’sperspective. Accordingly, they should not be considered in isolation nor as a substitute for analysis of the Company’s financial informationreported under U.S. GAAP. We use non-GAAP measures, such as Adjusted Net Income/Loss, Adjusted EPS, Adjusted EBITDA, SegmentEBITDA and Adjusted Gross Profit, to provide investors with a supplemental measure of our operating performance and thus highlighttrends in our core business that may not otherwise be apparent when relying solely on U.S. GAAP financial measures. We also believe thatsecurities analysts, investors and other interested parties frequently use non-GAAP measures in the evaluation of issuers. We also use non-GAAP measures in order to facilitate operating performance comparisons from period to period, prepare annual operating budgets, and toassess our ability to meet our future debt service, capital expenditure, and working capital requirements.
Constant Currency
The Company also presents certain information related to our current period results of operations in “constant currency”, which isa non-GAAP financial measure and should be viewed as a supplement to our results of operations and presentation of reportable segmentsunder U.S. GAAP. These amounts reflect the impact of translating the current period results at the monthly foreign exchange rates of theprior year period, the effect of changes in the value of the Canadian dollar against the U.S. dollar on our cost of goods purchased for saleoutside of the United States including the related realized gains/losses on derivatives, and the realized gains/losses generated fromrevaluing non-functional currency assets and liabilities. The reported foreign exchange impact does not include the impact of fluctuationsin Asian currencies against the U.S. dollar and their related effect on our Asian-sourced finished goods. Constant currency is used toenhance the visibility of the underlying business trends excluding the impact of foreign currency exchange rate fluctuations. We also usethe terms “currency neutral” or “excluding the impact of foreign currency” to describe the constant currency impact. See “FactorsAffecting Our Performance - Impact of Foreign Exchange and Hedging Practices” and “Results of Operations - Segment Results”.
Segment EBITDA
The profitability of the Company’s operating segments is evaluated using EBITDA adjusted for items excluded by the CODM.Certain Company functional platform costs are directly allocated to each operating segment based on usage or other relevant operationalmetrics. The Company’s functional platform costs consist of expenses incurred by centrally-managed functions, including globalinformation systems, finance and legal, distribution and logistics, sourcing and manufacturing, and other miscellaneous costs. Companycorporate expenses, currency related gains (losses), acquisition related expenses and other costs are not controlled by the management ateach operating segment and therefore are excluded from segment EBITDA. Company corporate expenses consist of executivecompensation and administration costs, public company costs, certain tax credits and other miscellaneous costs. See Note 11 - SegmentInformation in the accompanying Notes to Consolidated Financial Statements.
The relevant definition and reconciliation of each of Adjusted Gross Profit, Adjusted EBITDA, Adjusted Net Income/Loss, andAdjusted EPS used and presented by the Company to the most directly comparable U.S. GAAP measures follows below.
38

Adjusted Gross Profit
Adjusted Gross Profit is defined as gross profit plus the following expenses which are part of cost of goods sold: (i) amortizationand depreciation of intangible assets, (ii) charges to cost of goods sold resulting from fair market value adjustments to inventory as a resultof business acquisitions, (iii) reserves established to dispose of obsolete inventory acquired from acquisitions, and (iv) other one-time ornon-cash items. We use Adjusted Gross Profit as a key performance measure to assess our core gross profit and as a supplemental measureto evaluate the overall operating performance of our cost of goods sold.
The table below provides the reconciliation of gross profit to Adjusted Gross Profit:
Three Months Ended Nine Months Ended
(millions of U.S. dollars) February 29,
2016 February 28,
2015 February 29,
2016 February 28,
2015 Gross profit $ 35.4 $ 42.3 $ 133.8 $ 162.1 Amortization & depreciation of intangible assets (1) 3.1 3.4 9.2 10.3 Inventory step-up/step-down & reserves (2) — — — 7.1 Other (3) 1.7 0.6 3.5 2.4 Adjusted Gross Profit $ 40.2 $ 46.3 $ 146.5 $ 181.9
(1) Upon completion of the purchase of the Bauer Hockey business from Nike, Inc. in 2008, the Maverik acquisition in 2010, the Cascade acquisition in June 2012,the Inaria acquisition in October 2012, the Combat acquisition in May 2013, and the Easton Baseball/Softball Acquisition in April 2014, the Company capitalizedacquired intangible assets at fair market value. These intangible assets, in addition to other intangible assets subsequently acquired, are amortized over their usefullife and we recognize the amortization as a non-cash cost of goods sold.
(2) Upon completion of the Easton Baseball/Softball Acquisition, the Company adjusted Easton Baseball/Softball’s inventories to fair market value. Included in thenine-month period ended February 28, 2015 are charges to cost of goods sold resulting from the fair market value adjustment to inventory.
(3) Other represents the impact of the closure of the Mississauga, Ontario distribution center in the three-and nine-month periods ended February 29, 2016. In thethree-and nine-month periods ended February 28, 2015, Other represents the impact of costs related to the lacrosse helmet decertification.
See “Factors Affecting our Performance - Impact of Foreign Exchange and Hedging Practices” for Adjusted Gross Profit inconstant currency. Adjusted EBITDA
Adjusted EBITDA is defined as net income adjusted for income tax expense, depreciation and amortization, losses related toamendments to the credit facilities, gain or loss on disposal of fixed assets, net interest expense, deferred financing fees, unrealizedgains/losses on derivative instruments, and realized and unrealized gains/losses related to foreign exchange revaluation, and beforerestructuring and other one-time or non-cash charges associated with acquisitions, other one time or non-cash items, costs related to shareofferings, as well as share-based payment expenses. We use Adjusted EBITDA as the key metric in assessing our business performancewhen we compare results to budgets, forecasts and prior years. Management believes Adjusted EBITDA is an important measure ofoperating performance and cash flow, and provides useful information to investors because it highlights trends in the business that may nototherwise be apparent when relying solely on U.S. GAAP measures, and eliminates items that have less bearing on operating performanceand cash flow. It is an alternative to measure business performance to net income and operating income, and management believes AdjustedEBITDA is a better measure of cash flow generation than, for example, cash flow from operations, particularly because it removes cashflow fluctuations caused by extraordinary changes in working capital. Adjusted EBITDA is used by management in the assessment ofbusiness performance and used by our Board of Directors as well as our lenders in assessing management’s performance. It is also the keymetric in determining payments under incentive compensation plans.
39

The table below provides the reconciliation of net income (loss) to Adjusted EBITDA:
Three Months Ended Nine Months Ended
(millions of U.S. dollars) February 29,
2016 February 28,
2015 February 29,
2016 February 28,
2015 Net income (loss) $ (188.1) $ (12.5) $ (196.9) $ (0.7) Income tax expense (benefit) 10.7 (2.1) 10.2 3.7 Depreciation & amortization 5.7 5.4 16.5 15.8 Interest expense, net 4.9 4.1 14.0 13.1 Deferred financing fees 0.5 0.6 1.7 1.9 Gain on bargain purchase (1.0) — (1.0) — Unrealized (gain)/loss on derivative instruments,net (1) 2.6 0.1 1.2 1.0 Foreign exchange (gain)/loss (1) 0.5 13.2 8.8 20.3
EBITDA $ (164.2) $ 8.8 $ (145.5) $ 55.1 Acquisition Related Charges:
Inventory step-up/step-down & reserves (2) — — — 7.1
Rebranding/integration costs (3) 3.2 1.2 10.4 4.6
Acquisition costs (4) 1.4 1.4 3.4 2.5 Subtotal $ 4.6 $ 2.6 $ 13.8 $ 14.2
Costs related to share offerings (5) — — — 0.1
Share-based payment expense 1.7 2.4 3.8 5.8
Impairment of intangibles and goodwill 145.1 — 145.1 —
Other (6) 1.8 0.8 3.7 3.3 Adjusted EBITDA $ (11.0) $ 14.6 $ 20.9 $ 78.5
(1) The unrealized gain/loss on derivatives is the change in fair market value of the foreign currency forward contracts and interest rate contracts. The Company hasnot elected hedge accounting and therefore the changes in the fair value of these derivatives are recognized through profit or loss each reporting period. Theforeign exchange gain/loss is the realized and unrealized gains and losses generated by the effect of foreign exchange on recorded assets and liabilitiesdenominated in a currency different from the functional currency of the applicable entity are recorded in foreign exchange (gain) loss, as applicable, in the periodin which they occur.
(2) Upon completion of the Easton Baseball/Softball Acquisition, the Company adjusted Easton Baseball/Softball’s inventories to fair market value. Included in thethree-and nine-month periods ended February 28, 2015 are charges to cost of goods sold resulting from the fair market value adjustment to inventory.
(3) The rebranding/integration costs for the three-and nine-month periods ended February 29, 2016 are associated with the integration of the Easton Hockeyacquisition, Easton Baseball/Softball Acquisition, integration costs related to the Own The Moment Hockey Experience retail stores, costs related to theacquisition in certain exclusive and perpetual licensing rights in technology assets from Q30 Sports, LLC, and costs related to the Company’s profitabilityimprovement initiative. Also included in the nine-month periods ended February 29, 2016 are costs related to the Company’s transition to a U.S. domestic issuerand costs related to the proxy contest in October 2015. The rebranding/integration costs for the three-and nine-month periods ended February 28, 2015 areassociated with the integration of the Inaria acquisition, Combat acquisition and the Easton Baseball/Softball Acquisition.
(4) Acquisition-related transaction costs include legal, audit, and other consulting costs. The three-and nine-month periods ended February 29, 2016 include costsrelated to the Easton Hockey acquisition, start-up costs related to the Own The Moment Hockey Experience retail stores, and costs related to the acquisition incertain exclusive and perpetual licensing rights in technology assets from Q30 Sports, LLC. The three-and nine-month periods ended February 28, 2015 includecosts related to the Easton Baseball/Softball Acquisition. All periods presented include costs related to reviewing corporate opportunities.
(5) The costs related to share offerings in the nine-month period ended February 28, 2015 include legal, audit, and other consulting costs incurred as part of thesecondary offerings of Common Shares completed by funds managed by Kohlberg Management VI, LLC on October 17, 2012, February 6, 2013 and November1, 2013, respectively (collectively the “Kohlberg Offerings”).
(6) Other represents the impact of the closure of the Mississauga, Ontario distribution center in the three-and nine-month periods ended February 29, 2016. In thethree-and nine-month periods ended February 28, 2015, Other represents the impact of costs related to the lacrosse helmet decertification.
See “Factors Affecting our Performance - Impact of Foreign Exchange and Hedging Practices” for Adjusted EBITDA in constantcurrency.
Adjusted Net Income/Loss and Adjusted EPS
Adjusted Net Income/Loss is defined as net income adjusted for all unrealized gains/losses related to derivative instruments andunrealized gains/losses related to foreign exchange revaluation, non-cash or incremental charges associated with acquisitions, amortizationof acquisition-related intangible assets for acquisitions since the IPO in Canada in March 2011, costs related to share
40

offerings, share-based payment expense and other non-cash or one-time items. Adjusted EPS is defined as Adjusted Net Income/Lossdivided by the weighted average diluted shares outstanding. We use Adjusted Net Income/Loss and Adjusted EPS as key metrics forassessing our operational business performance and to assist with the planning and forecasting for the future operating results of theunderlying business of the Company. We believe Adjusted Net Income/Loss and Adjusted EPS are useful information to investors becausethey highlight trends in the business that may not otherwise be apparent when relying solely on U.S. GAAP measures.
The table below provides the reconciliation of net income (loss) to Adjusted Net Income/Loss and to Adjusted EPS:
Three Months Ended Nine Months Ended(millions of U.S. dollars,except share and per share amounts)
February 29, 2016
February 28, 2015
February 29, 2016
February 28, 2015
Net income (loss) $ (188.1) $ (12.5) $ (196.9) $ (0.7) Foreign exchange loss / (gain) (1) 3.6 13.4 11.5 20.2 Costs related to share offerings (2) — — — 0.1 Acquisition-related charges (3) 7.4 5.6 22.3 23.6
Impairment of intangibles and goodwill 145.1 — 145.1 — Share-based payment expense 1.7 2.4 3.8 5.8 Other (4) 0.6 0.8 2.7 3.3 Tax impact on above items 14.9 (4.1) 8.6 (13.5) Adjusted Net Income (Loss) $ (14.8) $ 5.6 $ (2.9) $ 38.8 Average diluted shares outstanding 46,375,559 47,098,364 46,963,821 46,000,320 Adjusted EPS $ (0.32) $ 0.12 $ (0.06) $ 0.84
(1) The foreign exchange loss/gain represents the unrealized gain/loss on derivatives and the unrealized portion of the foreign exchange gain/loss from the AdjustedEBITDA table. The unrealized portion of the foreign exchange gain/loss in the three-and nine-month periods ended February 29, 2016 was a loss of $1.0 millionand a loss of $10.3 million, respectively. The unrealized portion of the foreign exchange gain/loss in the three-and nine-month periods ended February 28, 2015was a loss of $13.3 million and a loss of $19.2 million, respectively.
(2) The costs related to share offerings in the nine-month period ended February 28, 2015 include legal, audit, and other consulting costs incurred as part of theKohlberg Offerings.
(3) Acquisition-related charges include rebranding/integration costs, and legal, audit, and other consulting costs associated with acquisition transactions. The three-and nine-month periods ended February 29, 2016 include integration of the Easton Baseball/Softball Acquisition, start-up and integration costs related to the OwnThe Moment Hockey Experience retail stores, costs related to the acquisition in certain exclusive and perpetual licensing rights in technology assets from Q30Sports, LLC, and costs related to the Company’s profitability improvement initiative. Also included in the nine-month period ended February 29, 2016 are costsrelated to the Company’s transition to a U.S. domestic issuer and costs related to the proxy contest in October 2015. The three-and nine-month periods endedFebruary 28, 2015 include costs related to the Inaria acquisition, Combat acquisition and the Easton Baseball/Softball Acquisition. All periods presented includecosts related to reviewing corporate opportunities. The charges also include amortization of intangible assets in the three-and nine-month periods ended February29, 2016 of $2.8 million and $8.5 million, respectively, and the three-and nine-month periods ended February 28, 2015 of $3.1 million and $9.4 million,respectively. Also included are charges to cost of goods sold resulting from the fair market value adjustment to inventory in the nine-month period ended February28, 2015 of $7.1 million.
(4) Other represents the impact of the closure of the Mississauga, Ontario distribution center offset by the $ 1.0 gain on bargain purchase related to the EastonHockey acquisition in the three-and nine-month periods ended February 29, 2016. In the three-and nine-month periods ended February 28, 2015, Other representsthe impact of costs related to the lacrosse helmet decertification.
See “Factors Affecting our Performance - Impact of Foreign Exchange and Hedging Practices” for Adjusted Net Income (Loss)and Adjusted EPS in constant currency.
Liquidity and Capital Resources
Cash Flows
The primary sources of the Company’s cash are net cash flows from operating activities and funds available under its New ABLFacility (as defined in the Company’s Annual Report on Form 10-K). We believe that ongoing operations and associated cash flows, inaddition to our cash resources and New ABL Facility, provide sufficient liquidity to support our business operations for at least the next 12months. Furthermore, as of February 29, 2016, the Company held cash of $4.6 million, our working capital was $305.5 million, and we hadavailability of $79.5 million under the New ABL Facility, which provides flexibility to meet any unanticipated cash requirements due tochanges in working capital commitments or liquidity risks associated with financial instruments. Such changes may arise from, amongother things, the seasonality of our business (see “Factors Affecting our Performance - Seasonality” and “Liquidity and CapitalResources”), the failure of one or more customers to pay their obligations
41

(see Item 3, “Quantitative and Qualitative Disclosures About Market Risk”) or from losses incurred on derivative instruments, such asforeign currency forwards and interest rate contracts (see “Factors Affecting our Performance - Interest Expense”).
The following table summarizes our net cash flows provided by and used in operating, investing and financing activities:
Nine Months Ended
(millions of U.S. dollars) February 29,
2016 February 28,
2015 Net cash flows from (used in) operating activities $ 10.1 $ 3.5 Net cash flows from (used in) investing activities (37.6) (9.1) Net cash flows from (used in) financing activities 27.1 21.2 Effect of exchange rate changes on cash — (1.8) (Decrease) / increase in cash (0.4) 13.8 Beginning cash 2.9 6.9 Ending cash $ 2.5 $ 20.7
Net Cash From (Used In) Operating Activities
Our largest source of operating cash flows is cash collections from the sale of inventory. Our primary cash outflows fromoperating activities are inventory purchases, personnel-related expenses, occupancy costs, payment of interest and payment of taxes. Netcash from operating activities for the nine-month period ended February 29, 2016 was $10.1 million, an increase of $6.6 million, comparedto net cash from operating activities of $3.5 million for the nine-month period ended February 28, 2015, primarily driven by the following:
• $33.0 million lower source of cash due to a receivable collected from BRG Sports, Inc. (formerly Easton-Bell Sports, Inc.)in the nine-month period ended February 28, 2015 which consisted of cash receipts from customers collected by BRGSports, Inc. during the period April 15, 2014 through May 31, 2014 that were owed to the Company as of May 31, 2014;
• $18.5 million higher use of cash from accrued liabilities due to timing of settlement for theliabilities;
• $17.7 million higher use of cash as a result of lower cash earnings; partially offsetby
• $8.9 million lower use of cash related to the timing of payments for prepaidexpenses;
• $3.2 million higher source of cash from accounts payable related to the timing of payments for inventorypurchases;
• $38.0 million higher source of cash from accounts receivable due to an increase in payments received for receivables;and
• $25.2 million higher source of cash from inventory driven by the Company’s cash flow improvement initiative that istargeting an improvement in net cash flow from working capital of $30 million in Fiscal 2016 (excluding certain non-recurring costs or one-time costs that may be required to implement some of the related initiatives).
Net Cash From (Used In) Investing Activities
Our cash outflows used in investing activities are primarily for acquisitions and the purchase of property, plant and equipment andintangible assets. Net cash used in investing activities for the nine-month period ended February 29, 2016 was $37.6 million, an increase of$28.5 million, compared to net cash used of $9.1 million for the nine-month period ended February 28, 2015, primarily due to thefollowing:
• $6.9 million of higher cash outflow related to the purchase of property, plant andequipment;
• $8.3 million of higher cash outflow related to the acquisition in certain exclusive and perpetual licensing rights intechnology assets from Q30 Sports, LLC, a privately held entity and a purchase of a non-controlling interest in Q30Sports Science, LLC, a privately held entity and parent of Q30 Sports, LLC and $2.0 million of higher
42
cash outflow related to an increase in restricted cash in connection with the Company’s acquisition of technology assetsfrom Q30 Sports, LLC;
• $5.6 million of higher cash outflow related to the Easton Hockey acquisition;and
• $5.0 million of higher cash outflow related to the purchase of a non-controlling interest in Cocona, Inc., a privately heldentity that created and owns 37.5™ technology, a patented moisture management technology that utilizes body heat toevaporate moisture from apparel and equipment.
Net Cash From (Used In) Financing Activities
Our cash flows from financing activities consist primarily of proceeds from and repayment of debt, proceeds from the issuance ofCommon Shares and share issuances under stock option plans. Net cash from financing activities for the nine-month period ended February29, 2016 was $27.1 million, an increase of $5.9 million, compared to net cash from financing activities of $21.2 million for the nine-monthperiod ended February 28, 2015, primarily due to the following:
• $2.6 million increase in net cash inflow related to the net movement in revolvingdebt;
• $119.6 million increase in net cash inflow related to repayment of debt in the nine-month period ended February 28,
2015; partially offset by
• $117.0 million decrease in net cash inflow related to the net proceeds of the U.S. Initial Public Offering (“U.S. IPO”) inthe nine-month period ended February 28, 2015.
Indebtedness
Credit Facilities
At April 15, 2014, the Company entered into the New Term Loan Facility and the Company and certain of its subsidiaries enteredinto the New ABL Facility. The New Term Loan Facility and the New ABL Facility (referred to herein together as the “Credit Facilities”)replaced the Company’s existing credit facilities. The New Term Loan Facility is an amortizing term credit facility in the principal amountof $450 million U.S. dollars and matures on April 15, 2021. The New ABL Facility is a revolving, non-amortizing asset-based creditfacility in an amount equal to the lesser of $200 million U.S. dollars (or the Canadian dollar equivalent thereof) and the Borrowing Base (asdefined herein). The New ABL Facility matures on April 15, 2019.
The borrowing base (the “Borrowing Base”) equals the sum of the Canadian Borrowing Base (as defined herein) and the U.S.Borrowing Base (as defined herein). The “Canadian Borrowing Base” means, subject to customary reserves and eligibility criteria, the sumof: (a) 85% of the Canadian ABL Borrowers’ eligible accounts receivable; plus (b) the lesser of 70% of the cost (valued on a first in, firstout basis) of the Canadian ABL Borrowers' eligible inventory, or 85% of the appraised net orderly liquidation value of the Canadian ABLBorrowers’ eligible inventory. The “U.S. Borrowing Base” means, subject to customary reserves and eligibility criteria, the sum of:(a) 85% of the U.S. ABL Borrowers’ eligible accounts receivable; plus (b) the lesser of 70% of the cost (valued on a first in, first out basis)of the U.S. ABL Borrowers’ eligible inventory, or 85% of the appraised net orderly liquidation value of the U.S. ABL Borrowers' eligibleinventory.
The New ABL Facility contains a Consolidated Fixed Charge Coverage Ratio that measures our ability to cover certain fixedcharges including interest payments. The minimum ratio is set to 1.0 to 1.0 tested for the most recently ended four fiscal quarter period forwhich financial statements have been delivered, and is defined as the ratio of (a) Consolidated EBITDA for such period, minus (x) capitalexpenditures paid in cash for such period and (y) the amount of cash payments made during such period in respect of federal, state,provincial, local, and foreign income taxes to (b) Consolidated Fixed Charges for such period. The Consolidated Fixed Charge CoverageRatio covenant is a springing covenant and is not triggered unless, on any date, Excess Availability is less than the greater of (i) 10% of theLine Cap (being the lesser of the aggregate commitments under the New ABL Facility at such time and the then applicable BorrowingBase), and (ii) $15.0 million.
As of February 29, 2016, $330.5 million was drawn under the New Term Loan Facility and $119.2 million was drawn under theNew ABL Facility. The interest rate on the Credit Facilities for the nine-month period ended February 29, 2016 ranged from 1.93% to4.50%. As of February 29, 2016, there are three letters of credit totaling $1.3 million outstanding under the New ABL Facility.
43

Leverage Ratio
The Credit Facilities define Leverage Ratio as Net Indebtedness divided by EBITDA, as described in this paragraph, for the mostrecent four fiscal quarter period for which financials have been delivered. Net Indebtedness includes such items as the Company’s termloan, capital lease obligations, subordinated indebtedness, and average revolving loans for the last 12 months as of the reporting date, lessthe average amount of cash for the last 12 months as of the reporting date. EBITDA is defined in the Credit Facilities as consolidated netincome/(loss) for the applicable period; plus, among other things, interest expense, provision for taxes, depreciation and amortizationexpense, share-based payment expense, certain fees, costs, and expenses incurred in connection with corporate transactions, certainrestructuring charges or reserves and business optimization expenses and the pro forma amount of certain projected savings, improvementsand synergies projected to be realized by the Borrower from certain transactions and operational changes, in each case incurred within theapplicable period. The amount of restructuring charges or reserves and business optimization expenses together with the pro forma amountof certain projected savings, improvements and synergies costs added back to EBITDA shall not exceed an amount equal to 15% ofEBITDA for the applicable four fiscal quarter period.
The following table depicts the Company’s Leverage Ratio:
As of As of As of As of As of As of As of February 29, November 30, August 31, May 31, February 28, November 30, August 31, 2016 (1) (2) 2015 2015 2015 2015 2014 2014Leverage Ratio 10.98 6.61 5.73 4.29 3.87 3.62 3.61
(1) Using the definition of EBITDA per the Credit Facilities, as described above, the Leverage Ratio was 19.93.(2) Excluding the impact of foreign exchange on the Company’s trailing twelve month EBITDA, the Leverage Ratio was 5.72.
Off-Balance Sheet Arrangements
We enter into agreements with our manufacturing partners on tooling requirements for our manufactured products. Theseagreements form an important part of the Company’s supply chain strategy and cash flow management. The following table summarizesour vendor tooling commitments as of February 29, 2016 and Fiscal 2016:
(millions of U.S. dollars)
Vendor
Toolingacquisition
value Cost paid
Owed amountsas of February 29,
2016
Open purchaseorders
amortizationvalue
Outstandingliability Fiscal
2016 Supplier A $ 7.4 $ 5.9 $ 1.5 $ 0.1 $ 1.4 Supplier B 7.5 7.0 0.5 0.2 0.3 Supplier C 1.6 1.0 0.6 0.1 0.5 Supplier D 0.7 0.7 — — — Supplier E 0.9 0.6 0.3 — 0.3 Supplier F 0.2 0.2 — — — Supplier G 0.1 0.1 — — — Supplier H 0.1 0.1 — — — Total $ 18.5 $ 15.6 $ 2.9 $ 0.4 $ 2.5
Capital Expenditures
In the three-month period ended February 29, 2016 and the three-month period ended February 28, 2015, we incurred capitalexpenditures of $4.7 million and $4.9 million, respectively. In the nine-month period ended February 29, 2016 and the nine-month periodended February 28, 2015, we incurred capital expenditures of $16.8 million and $9.8 million, respectively. As a percentage of revenues, ourcapital expenditures for the trailing twelve-months ended February 29, 2016 were 4.1% of revenues, compared to 2.0% of revenues for thetrailing twelve-months ended February 28, 2015. The capital investments were incurred for information systems to assist in streamliningour growing organization, investments related to the Own The Moment Hockey Experience retail stores, leasehold improvements related tothe Thousand Oaks, California Easton Baseball/Softball facility, tooling,
44
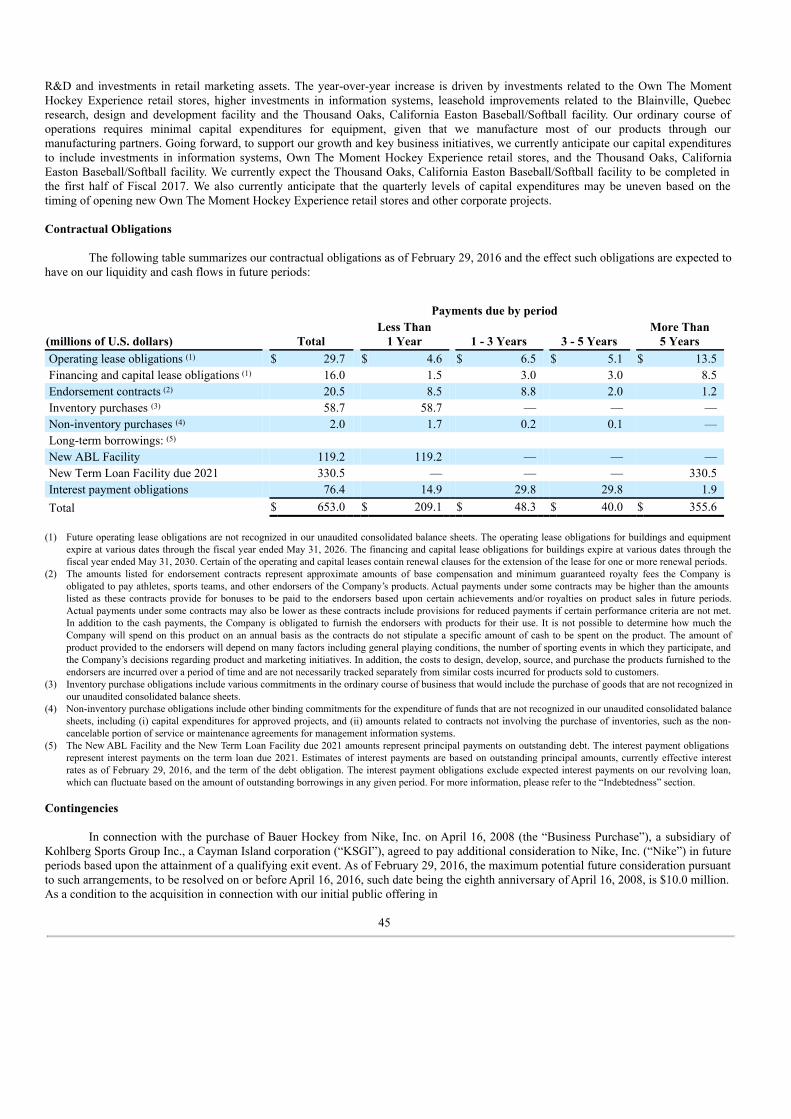
R&D and investments in retail marketing assets. The year-over-year increase is driven by investments related to the Own The MomentHockey Experience retail stores, higher investments in information systems, leasehold improvements related to the Blainville, Quebecresearch, design and development facility and the Thousand Oaks, California Easton Baseball/Softball facility. Our ordinary course ofoperations requires minimal capital expenditures for equipment, given that we manufacture most of our products through ourmanufacturing partners. Going forward, to support our growth and key business initiatives, we currently anticipate our capital expendituresto include investments in information systems, Own The Moment Hockey Experience retail stores, and the Thousand Oaks, CaliforniaEaston Baseball/Softball facility. We currently expect the Thousand Oaks, California Easton Baseball/Softball facility to be completed inthe first half of Fiscal 2017. We also currently anticipate that the quarterly levels of capital expenditures may be uneven based on thetiming of opening new Own The Moment Hockey Experience retail stores and other corporate projects.
Contractual Obligations
The following table summarizes our contractual obligations as of February 29, 2016 and the effect such obligations are expected tohave on our liquidity and cash flows in future periods:
Payments due by period
(millions of U.S. dollars) Total Less Than
1 Year 1 - 3 Years 3 - 5 Years More Than
5 Years Operating lease obligations (1) $ 29.7 $ 4.6 $ 6.5 $ 5.1 $ 13.5 Financing and capital lease obligations (1) 16.0 1.5 3.0 3.0 8.5 Endorsement contracts (2) 20.5 8.5 8.8 2.0 1.2 Inventory purchases (3) 58.7 58.7 — — — Non-inventory purchases (4) 2.0 1.7 0.2 0.1 — Long-term borrowings: (5) New ABL Facility 119.2 119.2 — — — New Term Loan Facility due 2021 330.5 — — — 330.5 Interest payment obligations 76.4 14.9 29.8 29.8 1.9 Total $ 653.0 $ 209.1 $ 48.3 $ 40.0 $ 355.6
(1) Future operating lease obligations are not recognized in our unaudited consolidated balance sheets. The operating lease obligations for buildings and equipmentexpire at various dates through the fiscal year ended May 31, 2026. The financing and capital lease obligations for buildings expire at various dates through thefiscal year ended May 31, 2030. Certain of the operating and capital leases contain renewal clauses for the extension of the lease for one or more renewal periods.
(2) The amounts listed for endorsement contracts represent approximate amounts of base compensation and minimum guaranteed royalty fees the Company isobligated to pay athletes, sports teams, and other endorsers of the Company’s products. Actual payments under some contracts may be higher than the amountslisted as these contracts provide for bonuses to be paid to the endorsers based upon certain achievements and/or royalties on product sales in future periods.Actual payments under some contracts may also be lower as these contracts include provisions for reduced payments if certain performance criteria are not met.In addition to the cash payments, the Company is obligated to furnish the endorsers with products for their use. It is not possible to determine how much theCompany will spend on this product on an annual basis as the contracts do not stipulate a specific amount of cash to be spent on the product. The amount ofproduct provided to the endorsers will depend on many factors including general playing conditions, the number of sporting events in which they participate, andthe Company’s decisions regarding product and marketing initiatives. In addition, the costs to design, develop, source, and purchase the products furnished to theendorsers are incurred over a period of time and are not necessarily tracked separately from similar costs incurred for products sold to customers.
(3) Inventory purchase obligations include various commitments in the ordinary course of business that would include the purchase of goods that are not recognized inour unaudited consolidated balance sheets.
(4) Non-inventory purchase obligations include other binding commitments for the expenditure of funds that are not recognized in our unaudited consolidated balancesheets, including (i) capital expenditures for approved projects, and (ii) amounts related to contracts not involving the purchase of inventories, such as the non-cancelable portion of service or maintenance agreements for management information systems.
(5) The New ABL Facility and the New Term Loan Facility due 2021 amounts represent principal payments on outstanding debt. The interest payment obligationsrepresent interest payments on the term loan due 2021. Estimates of interest payments are based on outstanding principal amounts, currently effective interestrates as of February 29, 2016, and the term of the debt obligation. The interest payment obligations exclude expected interest payments on our revolving loan,which can fluctuate based on the amount of outstanding borrowings in any given period. For more information, please refer to the “Indebtedness” section.
Contingencies
In connection with the purchase of Bauer Hockey from Nike, Inc. on April 16, 2008 (the “Business Purchase”), a subsidiary ofKohlberg Sports Group Inc., a Cayman Island corporation (“KSGI”), agreed to pay additional consideration to Nike, Inc. (“Nike”) in futureperiods based upon the attainment of a qualifying exit event. As of February 29, 2016, the maximum potential future consideration pursuantto such arrangements, to be resolved on or before April 16, 2016, such date being the eighth anniversary of April 16, 2008, is $10.0 million.As a condition to the acquisition in connection with our initial public offering in
45
Canada in March 2011, the former securityholders of KSGI, who sold KSGI and its subsidiaries to the Company on March 10, 2011pursuant to the acquisition agreement dated March 3, 2011 (the “Existing Holders”), entered into a reimbursement agreement with theCompany pursuant to which each of the Existing Holders agreed to reimburse the Company, on a pro rata basis, in the event that theCompany or any of its subsidiaries are obligated to make such a payment to Nike. The Company currently expects that a qualifying exitevent will not be attained.
In connection with the acquisition of certain exclusive and perpetual licensing rights in technology assets from Q30 Sports, LLC, aprivately held entity, future licensing payments of up to $18.0 million are conditional upon the achievement of certain productdevelopment and sales milestones. These milestones have not yet been achieved.
In addition to the matters above, during the ordinary course of its business, the Company is involved in various legal proceedingsinvolving contractual and employment relationships, product liability claims, trademark rights and a variety of other matters.
For further detail on legal proceedings, please refer to Part II. Item 1 “Legal Proceedings” section.
Critical Accounting Policies and Estimates
Our discussion and analysis of our financial condition and results of operations are based upon our unaudited consolidatedfinancial statements, which have been prepared in accordance with U.S. GAAP. The preparation of these financial statements requires us tomake estimates and judgments that affect the reported amounts of assets, liabilities, revenues and expenses, and related disclosure ofcontingent assets and liabilities.
We believe that the estimates, assumptions and judgments involved in the accounting policies described in the “Management’sDiscussion and Analysis of Financial Condition and Results of Operations” section of our Annual Report on Form 10-K have the greatestpotential impact on our financial statements, so we consider these to be our critical accounting policies. Actual results could differ from theestimates we use in applying our critical accounting policies. We are not currently aware of any reasonably likely events or circumstancesthat would result in materially different amounts being reported.
New Accounting Pronouncements
See Item 1 of Part I, “Financial Information - Notes to Consolidated Financial Statements - Significant Accounting Policies -Recent Accounting Pronouncements”.
Item 3. QUANTITATIVE AND QUALITATIVE DISCLOSURES ABOUT MARKET RISK
Except as otherwise described below, as of February 29, 2016, there have been no material changes from the informationpreviously reported under Part II, Item 7A. in the Company’s Annual Report on Form 10-K for the fiscal year ended May 31, 2015. See“Factors Affecting Our Performance - Impact of Foreign Exchange and Hedging Practices” for more information.
Our customers in the retail industry continue to experience consolidation and some may face financial difficulties from time totime. A large portion of our sales are to specialty and “big box” sporting goods retailers, certain of whom are not strongly capitalized.Adverse conditions in the sporting goods retail industry can adversely impact the ability of retailers to purchase our products, or could leadretailers to request credit terms that would adversely affect our cash flow and involve significant risks of non-payment. As a result, we mayexperience a loss of customers or the un-collectability of accounts receivable in excess of amounts against which we have reserved, whichcould adversely affect our business and financial condition.
Item 4. CONTROLS AND PROCEDURES
As required by Rule 13a-15(b) of the Securities Exchange Act of 1934, as amended (the “Exchange Act”), the Company’smanagement, including the Company’s Chief Executive Officer and Chief Financial Officer, has evaluated the effectiveness of theCompany’s disclosure controls and procedures as of the end of the period covered by this quarterly report on Form 10-Q. Based on thatevaluation, the Chief Executive Officer and Chief Financial Officer have concluded that the Company’s disclosure controls and procedures(as defined in Rule 13a-15(e) under the Exchange Act) were effective as of the end of the period covered by this quarterly report on Form10-Q.
46

As required by Rule 13a-15(d) under the Exchange Act, the Company’s management, including the Company’s Chief ExecutiveOfficer and Chief Financial Officer, has evaluated the Company’s internal control over financial reporting (as defined in Rules 13a-15(f)and 15d-15(f) under the Exchange Act) to determine whether any changes occurred during the quarter covered by this quarterly report onForm 10-Q that have materially affected, or are reasonably likely to materially affect, our internal control over financial reporting. Basedon that evaluation, there have been no such changes during the quarter covered by this quarterly report on Form 10-Q.
47

PART II - OTHER INFORMATION
Item 1. LEGAL PROCEEDINGS
Except as otherwise described below, as of February 29, 2016, there have been no material developments with respect to theinformation previously reported under Part I, Item 3 of our Annual Report on Form 10-K for the fiscal year ended May 31, 2015.
On March 18, 2016, Brian Apel, individually and on behalf of all others similarly situated, filed a class action complaint against usand certain of our current and former executive officers in the United States District Court for the Central District of California. Thecomplaint alleges that we and certain of our current and former executive officers made false and/or misleading statements and failed todisclose material adverse facts about our business, operations, prospects and performance in violation of Sections 10(b) (and Rule 10b-5promulgated thereunder) and 20(a) of the Exchange Act. The plaintiff seeks unspecified damages, as well as costs, attorneys’ fees, andother unspecified relief. We intend to vigorously defend this matter.
In addition to the matters above, during the ordinary course of its business, the Company is involved in various legal proceedingsinvolving contractual and employment relationships, product liability claims, trademark rights and a variety of other matters.
Item 1A. RISK FACTORS
As of February 29, 2016, there have been no material changes in our risk factors from those disclosed in Part I, Item 1A of ourAnnual Report on Form 10-K for the fiscal year ended May 31, 2015, and in Part II, Item 1A of our Quarterly Report on Form 10-Q for thefiscal quarter ended November 30, 2015.
Item 6. EXHIBITS
The following exhibits are filed as part of this quarterly report on Form 10-Q:
ExhibitNumber
Description
10.1 Offer Letter to Amir Rosenthal, dated as of March 25, 2016 and effective as of March 22, 2016. 10.2
Shareholder Nomination Agreement, dated March 28, 2016, between Performance Sports Group Ltd. and Sagard CapitalPartners, L.P. (incorporated by reference to Exhibit 99.1 to Performance Sports Group Ltd.’s Form 8-K filed with theSecurities and Exchange Commission on March 28, 2016, File No. 001-36506).
31.1
Certification of Chief Executive Officer pursuant to Section 302 of the Sarbanes-Oxley Act of 2002, with respect to theCompany’s quarterly report on Form 10-Q for the three-month period ended February 29, 2016.
31.2
Certification of Chief Financial Officer pursuant to Section 302 of the Sarbanes-Oxley Act of 2002, with respect to theCompany’s quarterly report on Form 10-Q for the three-month period ended February 29, 2016.
32.1
Certification of Chief Executive Officer pursuant to Section 906 of the Sarbanes-Oxley Act of 2002, with respect to theCompany’s quarterly report on Form 10-Q for the three-month period ended February 29, 2016.
32.2
Certification of Chief Financial Officer pursuant to Section 906 of the Sarbanes-Oxley Act of 2002, with respect to theCompany’s quarterly report on Form 10-Q for the three-month period ended February 29, 2016.
48

SIGNATURES
Pursuant to the requirements of the Securities Exchange Act of 1934, the registrant has duly caused this report to be signed on itsbehalf by the undersigned thereunto duly authorized.
PERFORMANCE SPORTS GROUP LTD.
Dated: April 14, 2016 By: /s/ Mark Vendetti Mark Vendetti Executive Vice President/Chief Financial Officer
49

EXHIBIT INDEX
ExhibitNumber
Description
10.1 Offer Letter to Amir Rosenthal, dated as of March 25, 2016 and effective as of March 22, 2016. 10.2
Shareholder Nomination Agreement, dated March 28, 2016, between Performance Sports Group Ltd. and Sagard CapitalPartners, L.P. (incorporated by reference to Exhibit 99.1 to Performance Sports Group Ltd.’s Form 8-K filed with theSecurities and Exchange Commission on March 28, 2016, File No. 001-36506).
31.1
Certification of Chief Executive Officer pursuant to Section 302 of the Sarbanes-Oxley Act of 2002, with respect to theCompany’s quarterly report on Form 10-Q for the three-month period ended February 29, 2016.
31.2
Certification of Chief Financial Officer pursuant to Section 302 of the Sarbanes-Oxley Act of 2002, with respect to theCompany’s quarterly report on Form 10-Q for the three-month period ended February 29, 2016.
32.1
Certification of Chief Executive Officer pursuant to Section 906 of the Sarbanes-Oxley Act of 2002, with respect to theCompany’s quarterly report on Form 10-Q for the three-month period ended February 29, 2016.
32.2
Certification of Chief Financial Officer pursuant to Section 906 of the Sarbanes-Oxley Act of 2002, with respect to theCompany’s quarterly report on Form 10-Q for the three-month period ended February 29, 2016.
50
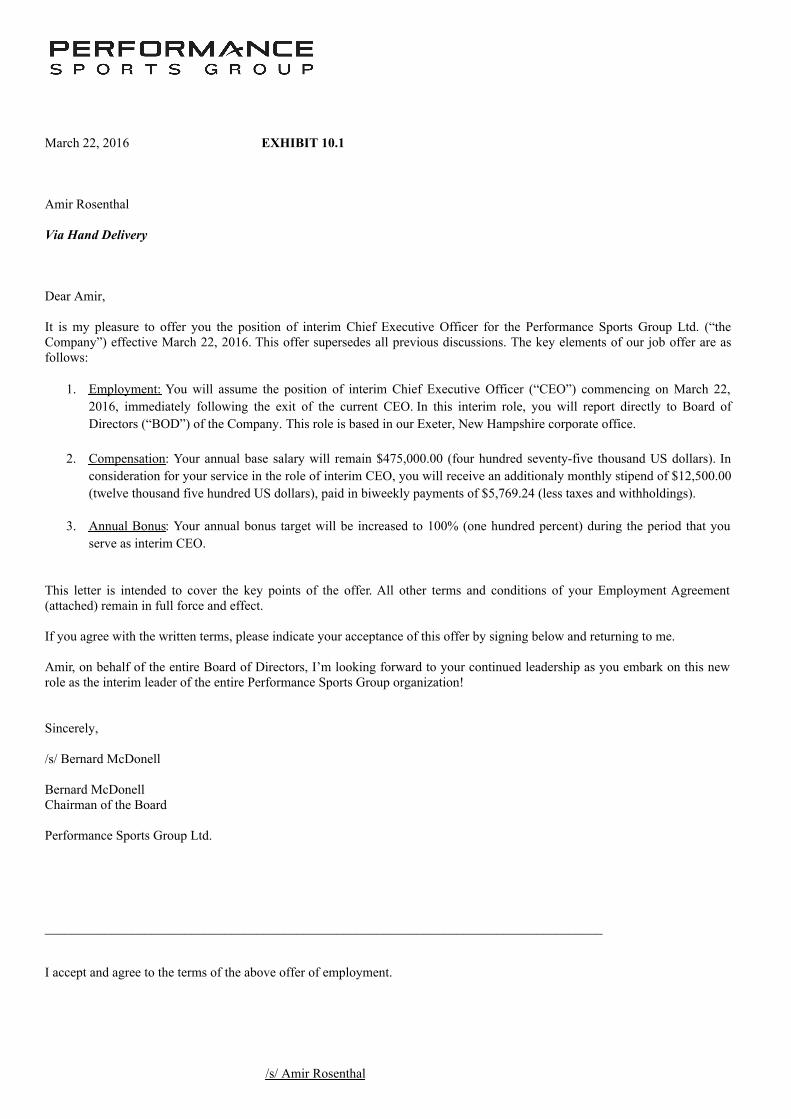
March 22, 2016 EXHIBIT 10.1
Amir Rosenthal
Via Hand Delivery
Dear Amir,
It is my pleasure to offer you the position of interim Chief Executive Officer for the Performance Sports Group Ltd. (“theCompany”) effective March 22, 2016. This offer supersedes all previous discussions. The key elements of our job offer are asfollows:
1. Employment: You will assume the position of interim Chief Executive Officer (“CEO”) commencing on March 22,2016, immediately following the exit of the current CEO. In this interim role, you will report directly to Board ofDirectors (“BOD”) of the Company. This role is based in our Exeter, New Hampshire corporate office.
2. Compensation: Your annual base salary will remain $475,000.00 (four hundred seventy-five thousand US dollars). Inconsideration for your service in the role of interim CEO, you will receive an additionaly monthly stipend of $12,500.00(twelve thousand five hundred US dollars), paid in biweekly payments of $5,769.24 (less taxes and withholdings).
3. Annual Bonus: Your annual bonus target will be increased to 100% (one hundred percent) during the period that youserve as interim CEO.
This letter is intended to cover the key points of the offer. All other terms and conditions of your Employment Agreement(attached) remain in full force and effect.
If you agree with the written terms, please indicate your acceptance of this offer by signing below and returning to me.
Amir, on behalf of the entire Board of Directors, I’m looking forward to your continued leadership as you embark on this newrole as the interim leader of the entire Performance Sports Group organization!
Sincerely,
/s/ Bernard McDonell
Bernard McDonellChairman of the Board
Performance Sports Group Ltd.
____________________________________________________________________________________
I accept and agree to the terms of the above offer of employment.
/s/ Amir Rosenthal_______________________________

Amir Rosenthal
Date: _March 25, 2016___________________________

Exhibit 31.1
SECTION 302 CERTIFICATION
I, Amir Rosenthal, certify that:
1. I have reviewed this quarterly report on Form 10-Q of Performance Sports Group Ltd. (the“registrant”);
2. Based on my knowledge, this report does not contain any untrue statement of a material fact or omit to state a material fact necessary tomake the statements made, in light of the circumstances under which such statements were made, not misleading with respect to theperiod covered by this report;
3. Based on my knowledge, the financial statements, and other financial information included in this report, fairly present in all materialrespects the financial condition, results of operations and cash flows of the registrant as of, and for, the periods presented in this report;
4. The registrant’s other certifying officer(s) and I are responsible for establishing and maintaining disclosure controls and procedures (asdefined in Exchange Act Rules 13a-15(e) and 15d-15(e)) and internal control over financial reporting (as defined in Exchange ActRules 13a-15(f) and 15d-15(f)) for the registrant and have:
(a) Designed such disclosure controls and procedures, or caused such disclosure controls and procedures to be designed under oursupervision, to ensure that material information relating to the registrant, including its consolidated subsidiaries, is madeknown to us by others within those entities, particularly during the period in which this report is being prepared;
(b) Designed such internal control over financial reporting, or caused such internal control over financial reporting to be designedunder our supervision, to provide reasonable assurance regarding the reliability of financial reporting and the preparation offinancial statements for external purposes in accordance with generally accepted accounting principles;
(c) Evaluated the effectiveness of the registrant’s disclosure controls and procedures and presented in this report our conclusionsabout the effectiveness of the disclosure controls and procedures, as of the end of the period covered by this report based onsuch evaluation; and
(d) Disclosed in this report any change in the registrant’s internal control over financial reporting that occurred during theregistrant’s most recent fiscal quarter (the registrant’s fourth fiscal quarter in the case of an annual report) that has materiallyaffected, or is reasonably likely to materially affect, the registrant’s internal control over financial reporting; and
5. The registrant’s other certifying officer(s) and I have disclosed, based on our most recent evaluation of internal control over financialreporting, to the registrant’s auditors and the audit committee of the registrant’s board of directors (or persons performing theequivalent functions):
(a) All significant deficiencies and material weaknesses in the design or operation of internal control over financial reportingwhich are reasonably likely to adversely affect the registrant’s ability to record, process, summarize and report financialinformation; and
(b) Any fraud, whether or not material, that involves management or other employees who have a significant role in theregistrant’s internal control over financial reporting.
Date: April 14, 2016 By: /s/ Amir Rosenthal Amir Rosenthal Interim Chief Executive Officer, President, PSG Brands
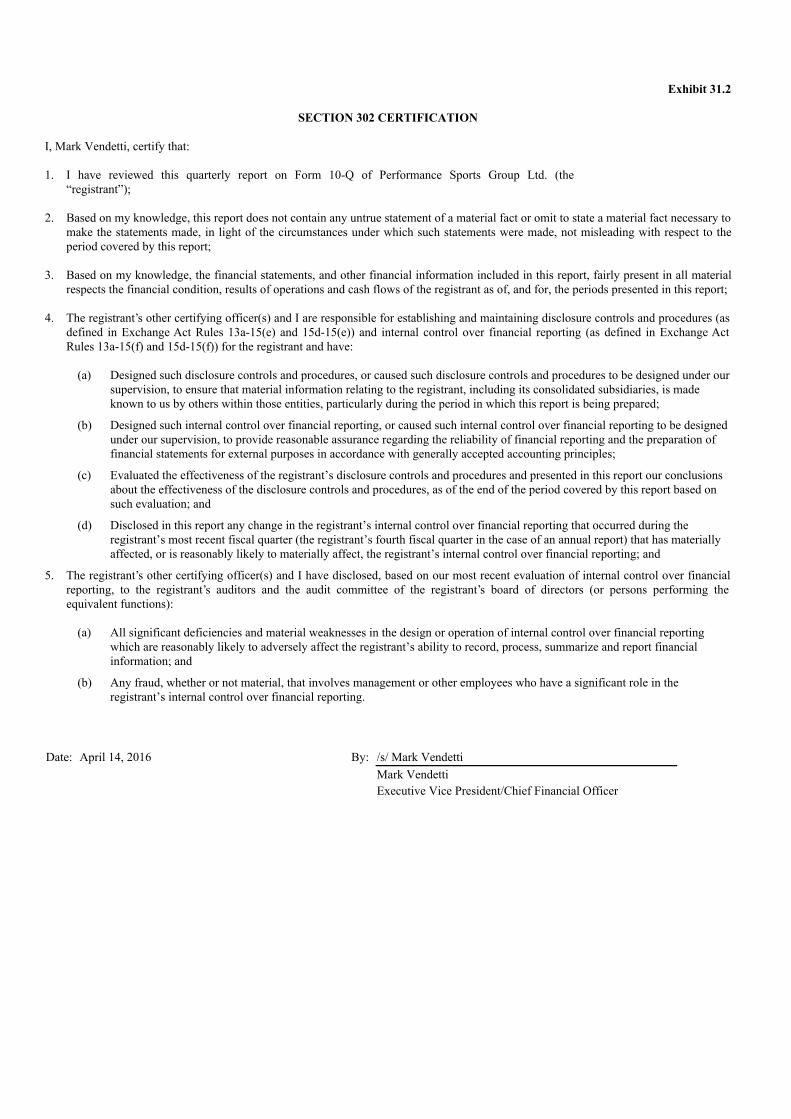
Exhibit 31.2
SECTION 302 CERTIFICATION
I, Mark Vendetti, certify that:
1. I have reviewed this quarterly report on Form 10-Q of Performance Sports Group Ltd. (the“registrant”);
2. Based on my knowledge, this report does not contain any untrue statement of a material fact or omit to state a material fact necessary tomake the statements made, in light of the circumstances under which such statements were made, not misleading with respect to theperiod covered by this report;
3. Based on my knowledge, the financial statements, and other financial information included in this report, fairly present in all materialrespects the financial condition, results of operations and cash flows of the registrant as of, and for, the periods presented in this report;
4. The registrant’s other certifying officer(s) and I are responsible for establishing and maintaining disclosure controls and procedures (asdefined in Exchange Act Rules 13a-15(e) and 15d-15(e)) and internal control over financial reporting (as defined in Exchange ActRules 13a-15(f) and 15d-15(f)) for the registrant and have:
(a) Designed such disclosure controls and procedures, or caused such disclosure controls and procedures to be designed under oursupervision, to ensure that material information relating to the registrant, including its consolidated subsidiaries, is madeknown to us by others within those entities, particularly during the period in which this report is being prepared;
(b) Designed such internal control over financial reporting, or caused such internal control over financial reporting to be designedunder our supervision, to provide reasonable assurance regarding the reliability of financial reporting and the preparation offinancial statements for external purposes in accordance with generally accepted accounting principles;
(c) Evaluated the effectiveness of the registrant’s disclosure controls and procedures and presented in this report our conclusionsabout the effectiveness of the disclosure controls and procedures, as of the end of the period covered by this report based onsuch evaluation; and
(d) Disclosed in this report any change in the registrant’s internal control over financial reporting that occurred during theregistrant’s most recent fiscal quarter (the registrant’s fourth fiscal quarter in the case of an annual report) that has materiallyaffected, or is reasonably likely to materially affect, the registrant’s internal control over financial reporting; and
5. The registrant’s other certifying officer(s) and I have disclosed, based on our most recent evaluation of internal control over financialreporting, to the registrant’s auditors and the audit committee of the registrant’s board of directors (or persons performing theequivalent functions):
(a) All significant deficiencies and material weaknesses in the design or operation of internal control over financial reportingwhich are reasonably likely to adversely affect the registrant’s ability to record, process, summarize and report financialinformation; and
(b) Any fraud, whether or not material, that involves management or other employees who have a significant role in theregistrant’s internal control over financial reporting.
Date: April 14, 2016 By: /s/ Mark Vendetti Mark Vendetti
Executive Vice President/Chief Financial Officer
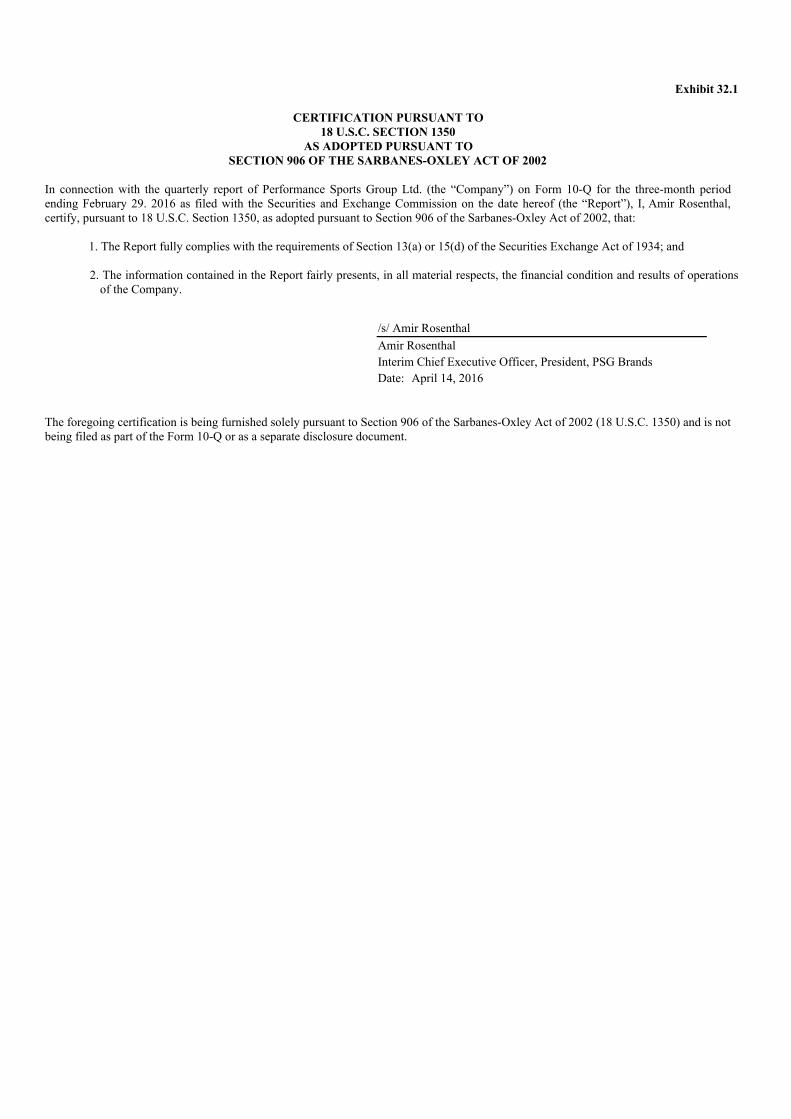
Exhibit 32.1
CERTIFICATION PURSUANT TO18 U.S.C. SECTION 1350
AS ADOPTED PURSUANT TOSECTION 906 OF THE SARBANES-OXLEY ACT OF 2002
In connection with the quarterly report of Performance Sports Group Ltd. (the “Company”) on Form 10-Q for the three-month periodending February 29. 2016 as filed with the Securities and Exchange Commission on the date hereof (the “Report”), I, Amir Rosenthal,certify, pursuant to 18 U.S.C. Section 1350, as adopted pursuant to Section 906 of the Sarbanes-Oxley Act of 2002, that:
1. The Report fully complies with the requirements of Section 13(a) or 15(d) of the Securities Exchange Act of 1934; and
2. The information contained in the Report fairly presents, in all material respects, the financial condition and results of operationsof the Company.
/s/ Amir Rosenthal Amir Rosenthal Interim Chief Executive Officer, President, PSG Brands Date: April 14, 2016
The foregoing certification is being furnished solely pursuant to Section 906 of the Sarbanes-Oxley Act of 2002 (18 U.S.C. 1350) and is notbeing filed as part of the Form 10-Q or as a separate disclosure document.
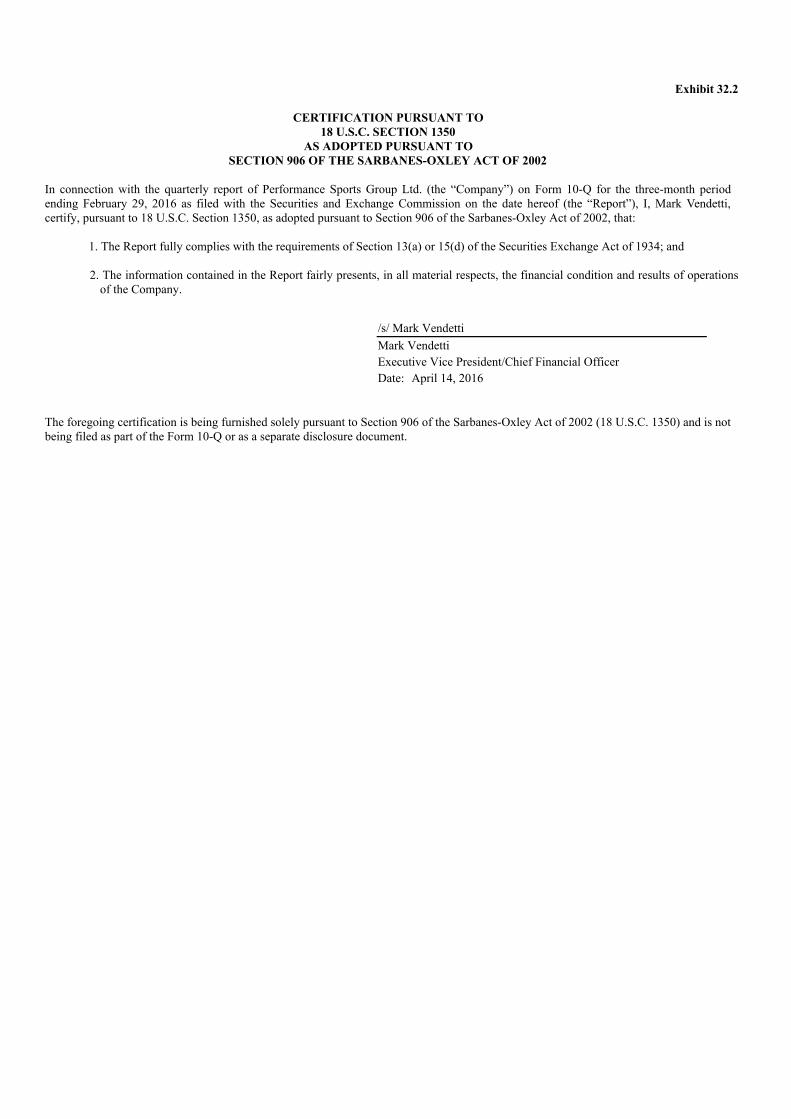
Exhibit 32.2
CERTIFICATION PURSUANT TO18 U.S.C. SECTION 1350
AS ADOPTED PURSUANT TOSECTION 906 OF THE SARBANES-OXLEY ACT OF 2002
In connection with the quarterly report of Performance Sports Group Ltd. (the “Company”) on Form 10-Q for the three-month periodending February 29, 2016 as filed with the Securities and Exchange Commission on the date hereof (the “Report”), I, Mark Vendetti,certify, pursuant to 18 U.S.C. Section 1350, as adopted pursuant to Section 906 of the Sarbanes-Oxley Act of 2002, that:
1. The Report fully complies with the requirements of Section 13(a) or 15(d) of the Securities Exchange Act of 1934; and
2. The information contained in the Report fairly presents, in all material respects, the financial condition and results of operationsof the Company.
/s/ Mark Vendetti Mark Vendetti Executive Vice President/Chief Financial Officer Date: April 14, 2016
The foregoing certification is being furnished solely pursuant to Section 906 of the Sarbanes-Oxley Act of 2002 (18 U.S.C. 1350) and is notbeing filed as part of the Form 10-Q or as a separate disclosure document.