performance standard for laboratories undertaking chemical
TRANSCRIPT

Performance Standard for Laboratories Undertaking
Chemical Testing of Soil
Environment Agency November 2018
Version 5

Record of amendments Version 5 December 2018
• Document reformatted and reordered to comply with changes to ISO 17025 • Clause 6.4.7 clarification of PH meter calibration requirements • Clause 7.2.2.3 Clarification of calibration requirements during validation • Clause 7.7.1.1 clarification of first paragraph to ensure QC samples are
measured within the batch they are prepared • Clause 7.7.1.2 Clarification of requirements for QC of multiparameter organic
methods
ii

Foreword The Environment Agency has established its Monitoring Certification Scheme: MCERTS to ensure high quality environmental measurements. The scheme provides for the product certification of instruments, the competency certification of personnel and the accreditation of laboratories based on international standards. For the chemical testing of soil where results are to be submitted to us for regulatory purposes, we require laboratories to be accredited to the current version of the European and international standard, EN ISO/IEC 17025 for this MCERTS performance standard. Accreditation is undertaken by an appropriate national organisation, which in the United Kingdom is the United Kingdom Accreditation Service (UKAS). The MCERTS performance standard provides an application of EN ISO/IEC 17025 specifically for the chemical testing of soil and covers:
• performance targets • the selection and validation of test methods • sample pre-treatment and preparation • ongoing quality control • participation in proficiency testing schemes • the reporting of results and information The benefits of MCERTS for the chemical testing of soil are that the scheme:
• provides formal accreditation of laboratories in accordance with European and international standards
• provides assurance to all stakeholders (including industrial process operators, laboratories, regulators and the public) of the reliability of data from tests
• establishes a level playing field in this competitive market, based on the Environment Agency’s requirements
• indicates that the chemical testing of soil is a critical component in producing defensible data for regulatory purposes
• promotes and raises the professional standing of laboratories by establishing “quality standards” to which all should aspire and be judged
Some of the requirements of the performance standard are described in general terms. This is to allow a degree of flexibility for a laboratory and to allow the laboratory to take advantage of technological developments. In this way, a laboratory is not excluded simply because, for example, it lacks specific equipment. However, along with this flexibility is the need for the provision of appropriate information. For example, if test data are to be generated for a specific site over an extended period it is essential that consistent and meaningful comparisons can be made. Where we assess data for regulatory purposes, all relevant information must be recorded and be available to us, if requested. Most of the requirements of this performance standard are aimed at laboratory activities. However, if data are to be submitted to us for regulatory purposes, the procurer of the analytical services must ensure that the requirements are satisfied and that the appropriate information is provided to us, if requested. It is recognised that variations due to sampling can be greater than those introduced via analysis; however, this performance standard does not specifically cover sampling or the competency of personnel in relation to sampling procedures and strategies.
iii

If you have any questions regarding the accreditation process, or would like further information on how to apply, please contact: UKAS 2 Pine Trees Chertsey Lane Staines-upon-Thames TW18 3HR Telephone: 01784 429000
Email: [email protected] For more information on MCERTS and for copies of the performance standards and further guidance, see our web-site at:www.mcerts.net If you have any general questions about MCERTS, please contact our National Customer Contact Centre: [email protected]
iv
Contents Introduction ............................................................................................................... 1
.................................................................................................................. 1
......................................................................................................... 2
1 Scope2 References
2.1 Normative references ............................................................................................................. 2
...................................................................................................................... 2 2.2 Text references
3 ....................................................................................... 3
....................................................................................... 5
.............................................................................................................................. 5
Terms and definitions4 General requirements
4.1 Impartiality
4.2 Confidentiality ......................................................................................................................... 5
.................................................................................... 5
.................................................................................... 5
................................................................................................................................... 5
5 Structural requirements6 Resource requirements
6.1 General
6.2 Personnel ............................................................................................................................... 5
................................................................................. 5
.............................................................................................................................. 6
6.3 Facilities and environmental conditions
6.4 Equipment
6.5 .......................................................................................................... 7 ............................................................................ 7
....................................................................................... 7
............................................................................ 7
Metrological traceability
6.6 Externally provided products and services
7 Process requirements7.1 Review of requests, tenders and contracts
7.2 ................................................................... 7
.............................................................................................................................. 13
..................................................................................... 13 ................................................................................................................. 14
Selection, verification and validation of methods
7.3 Sampling
7.4 Handling of test or calibration items
7.5 Technical records
7.6 ............................................................................... 14
............................................................................................. 14
.............................................................................................................. 17
........................................................................................................................... 18
........................................................................................................... 18
Evaluation of measurement uncertainty
7.7 Ensuring the validity of results
7.8 Reporting of results
7.9 Complaints
7.10 Non conforming work
.......................................................................... 18
............................................................... 18
............................................ 19
............................................................ 23
7.11 Control of data – information management
8 Management system requirementsAnnex A (normative): Performance CharacteristicsAnnex B (normative): Statistical AnalysisAnnex C (normative): Production and use of Control Charts ............................. 32
....................... 35
............................ 36
Annex D (informative): Estimation of soil organic matter (SOM)Annex E (normative): Accreditation of hydrocarbon banding
v

Performance standard for laboratories undertaking chemical testing of soil
Introduction The extension of MCERTS to include the chemical testing of soil is built on proven international standards to ensure that the quality of test data is high. This performance standard details the requirements for a laboratory undertaking the chemical testing of soil and the procurer of analytical services to the MCERTS performance standard. The general requirements for the competence of testing and calibration laboratories are described in the European and international standard EN ISO/IEC 17025. Where data are submitted to the Environment Agency for regulatory purposes, those data shall be generated using methods that have been accredited to the European and international standard EN ISO/IEC 17025 for this MCERTS performance standard. Such methods shall be included within an accredited laboratory’s scope of activities. This performance standard contains requirements that a laboratory must meet if it wishes to demonstrate that it operates a management system, is technically competent and able to generate valid results, and wishes to be considered as a laboratory registered under the MCERTS performance standard for the chemical testing of soil. In addition, there are also requirements for a procurer of analytical services that wishes to submit data to the Environment Agency for regulatory purposes. The MCERTS performance standard for laboratories undertaking the chemical testing of soil does not restate all the provisions of EN ISO/IEC 17025 which must be complied with. It states only those additional requirements which must also be complied with, in order for a laboratory to become registered under MCERTS for the chemical testing of soil. The clause numbers in this document align with those of EN ISO/IEC 17025:2017, and will not be the same as those in other dated versions of EN ISO/IEC 17025. The text of EN ISO/IEC 17025 is not repeated, and where no additional requirements are needed, this is stated.
1 Scope The chemical testing of soil can be undertaken for a wide range of parameters using a wide range of methods. The methods that a laboratory uses to generate data that are submitted to the Environment Agency for regulatory purposes shall be accredited to EN ISO/IEC 17025 for this MCERTS performance standard. These methods shall be defined in the laboratory’s scope of activities. This performance standard is applicable to all laboratories and procurers of analytical services where results, generated for the chemical testing of soil, are submitted to the Environment Agency for regulatory purposes. When a laboratory satisfies all of the appropriate requirements of this performance standard, that laboratory will have demonstrated that it meets the Environment Agency’s MCERTS requirements for the chemical testing of soil. If a laboratory complies with the appropriate requirements of this performance standard, it will be regarded by the Environment Agency as demonstrating its
MCERTS chemical testing of soil Version 5 December 2018 1 of 39

competence and of being capable of undertaking the chemical testing of soil to the Environment Agency’s requirements, for its published scope of activities. Its details shall be defined in a scope of accreditation published on the UKAS website.
2 References 2.1 Normative references
EN ISO/IEC 17025 - General requirements for the competence of testing and calibration laboratories.
2.2 Text references a) ISO TR 13530:1997 “Water Quality - A Guide to Analytical Quality Control for
Water Analysis”. b) “A Manual on Analytical Quality Control for the Water Industry”, R. V.
Cheeseman and A. L. Wilson, revised by M. J. Gardner, NS 30, Water Research Centre, 1989. ISBN 0-902156-85-3
c) “Valid Analytical Methods and Procedures”, C. Burgess, Royal Society of Chemistry, 2000. ISBN 0-85404-482-5.
d) “Guidelines for achieving quality in trace analysis”, M. Sargent and G. MacKay, Royal Society of Chemistry, 1995, ISBN 0-85404-402-7.
e) “Technical aspects of site investigation”, Environment Agency R&D Technical Report P5-065/TR, 2000.
f) “Secondary model procedures for the development of appropriate soil sampling strategies for land contamination”, Environment Agency R&D Technical Report P5-066/TR, 2000.
g) “Sampling as a source of measurement uncertainty: techniques for quantification and comparison with analytical sources”. Journal of Analytical Atomic Spectrometry, M. H. Ramsey, 1998, 13(2), 97-104.
h) “S L R Ellison and A Williams (Eds). Eurachem/CITAC guide: Quantifying Uncertainty in Analytical Measurement, Third edition, (2012) ISBN 978-0-948926-30-3”. Download from the Eurachem website.
i) “V. Barwick (Ed), Eurachem/CITAC Guide: Guide to Quality in Analytical Chemistry: An Aid to Accreditation (3rd ed. 2016). ISBN 978-0-948926-32-7.” Down load from the Eurachem website.
j) “B. Magnusson and U. Örnemark (eds.) Eurachem Guide: The Fitness for Purpose of Analytical Methods – A Laboratory Guide to Method Validation and Related Topics, (2nd ed. 2014). ISBN 978-91-87461-59-0.” Down load from the Eurachem website.
k) “Development and Harmonisation of Measurement Uncertainty Principles – Part (d): Protocol for uncertainty evaluation from validation data.” V J Barwick, S L R Ellison, LGC/VAM/1998/088.
l) “Handbook for Calculation of Measurement Uncertainty in Environmental Laboratories”. Version 4, Nordtest Report TR 537 November 2017.
MCERTS chemical testing of soil Version 5 December 2018 2 of 39

m) “The J-chart: a simple plot that combines the capabilities of Shewhart and cusum charts, for use in analytical quality control”. Analytical Methods Committee technical brief No.12, Royal Society of Chemistry 2003.
n) “Quality Control Charts in Routine Analysis”, M J Gardner, WRc Report CO4239 1996.
o) “Guidelines for the In-House Production of Reference Materials” – version 2, B Brookman, R Walker 1998 LGC/VAM/1998/040.
p) “Applications of Reference Materials in Analytical Chemistry” - V. Barwick, S. Burke, R. Lawn, P. Roper and R. Walker Royal Society of Chemistry, Cambridge, 2001 ISBN 0-85404-448-5.
q) EN ISO 10523 “Water quality. Determination of pH”.
3 Terms and definitions In the context of this performance standard, the following terms and definitions apply: It is recognised that some terms used in this document may have slightly different meanings to those used in other publications. Air-dried sample - Sample that has been dried at ambient temperatures not exceeding 30°C. Analytical Quality Control (AQC) - The overall process of ensuring that the application of an analytical method is controlled within specified tolerances. Assisted-dried sample - A sample that has undergone a specified accelerated drying process. This may involve oven-assisted drying at a specified temperature, freeze-drying or some other process. As submitted basis - The sample as it is received at the laboratory for direct analysis of either the entire sample, or of a representative sub-sample, i.e. without further sample pre-treatment. Batch - A number of samples prepared for a discrete analytical run. Bias - Bias, which may be positive or negative is the difference (expressed as a percentage) between the mean of a number of determinations obtained under repeatability conditions and the true or accepted concentration.
%Bias = (mean of determinations - true or accepted value) x 100 True or accepted value
Bias can be estimated where appropriate certified reference materials are available and a stated (certified) concentration has been quoted. Recovery data can be used to estimate bias via spiking experiments (see spiking recovery). Certified Reference Material (CRM) - Reference material, accompanied by a certificate, one or more of whose property values are certified by a procedure which establishes its traceability to an accurate realization of the unit in which the property values are expressed, and for which each certified value is accompanied by an uncertainty at a stated level of confidence. [ISO/IEC-Guide 30] Concentration - Concentration is usually expressed as mass per unit mass, for example mg kg-1. It may be quoted on an “as submitted” basis, a “wet weight” basis,
MCERTS chemical testing of soil Version 5 December 2018 3 of 39

or on a “dry weight” basis. (In certain circumstances the term concentration is not appropriate, for example in the determination of pH values). Critical level of interest - This is the concentration value around which a decision is often required, for example is the concentration above or below a certain value. It may be for example a “soil guideline value” (which may be found for certain parameters on the Environment Agency website), a regulatory limit, or some other concentration of importance. A method is usually deemed acceptable if, when used properly, it is capable of establishing within defined limits of bias and precision, whether a concentration is above or below the critical level of interest. Laboratory - A laboratory, or sub-contracting laboratory, that undertakes the chemical testing of soil. Parameter - Within the sample, this is the determinand, measurand, analyte, substance, or group of substances, the concentration of which needs to be determined. It shall be clearly and unambiguously defined. Performance characteristics - Those performance values, such as precision, bias (or recovery, as appropriate) and limit of detection that need to be estimated before a method is used routinely. Precision - This is the distribution of a number of repeated determinations, expressed in this document as the % relative standard deviation (RSD).
%RSD = S x 100 M
Where S = total standard deviation, M is the mean of results, both as indicated in section 7.2.2.3. Repeatability conditions - Those conditions where analyses are carried out in one laboratory by one or more analysts, using the same equipment and reagents, within a short period of time. Sample - That (uniquely identified) material removed from a site and submitted to the laboratory for analysis. Spiking recovery - The addition of a known quantity of a parameter to a sub-sample, followed by analysis to establish that fraction or percentage recovered by the use of a defined method.
%Recovery = (D – P) x 100 A
Where: D = the measured amount of parameter in sub-sample following addition of known amount of parameter; P = the measured amount of parameter in sub-sample prior to addition of known amount of parameter; A = amount of parameter added to sub-sample.
This technique is often used as the only viable option for the analyst when appropriate certified reference materials are not available and bias cannot be determined directly. When this is so, bias is calculated from
MCERTS chemical testing of soil Version 5 December 2018 4 of 39
%Bias = %Recovery - 100 Statistical control - When the result or results of quality control samples are shown to be within defined limits of recognised acceptability, a method is said to be in statistical control. When these limits are breached, the method is considered out of control. Sub-sample - A representative or homogenised portion of the sample. This portion is used in the analysis. Wet-weight basis - The sample as it is received at the laboratory for direct analysis either of the whole sample or of a representative sub-sample, i.e. without further sample pre-treatment.
4 General requirements 4.1 Impartiality No additional requirements to EN ISO/IEC 17025.
4.2 Confidentiality No additional requirements to EN ISO/IEC 17025.
5 Structural requirements 5.1 - 5.3 No additional requirements to EN ISO/IEC 17025. 5.4 For data to be submitted to the Environment Agency for regulatory purposes,
the laboratory shall carry out its sampling, testing and calibration activities in such a way as to meet the requirements of this performance standard.
5.5 - 5.7 No additional requirements to EN ISO/IEC 17025.
6 Resource requirements 6.1 General No additional requirements to EN ISO/IEC 17025.
6.2 Personnel No additional requirements to EN ISO/IEC 17025.
6.3 Facilities and environmental conditions 6.3.1 Equipment, reagents and samples shall be protected from damage or
degradation, during collection, transportation and subsequent storage, as appropriate. Note: There may be methods specifying the procedures necessary for
protecting the integrity of samples and reagents during transportation and storage such as collection into suitable containers and storage out of direct sunlight at specified temperatures etc.
The laboratory shall have procedures in place and use appropriate practices to ensure that conditions do not adversely affect the measurement result.
6.3.2 – 6.3.5 No additional requirements to EN ISO/IEC 17025.
MCERTS chemical testing of soil Version 5 December 2018 5 of 39

6.4 Equipment 6.4.1 – 6.4.5 No additional requirements to EN ISO/IEC 17025. 6.4.6 Equipment shall be calibrated, and if appropriate with each batch of samples,
using measurement standards that are traceable to national or international standards except where they have been derived from natural physical constants, or where this degree of traceability is not possible.
6.4.7 For instrumental methods, calibration solutions may be taken through the entire method or be prepared solely for the determination stage. In either case, solutions shall be matched to the sample extract solution to be determined, both in terms of acid strength and content or solvent composition. In addition, the calibration shall cover the range of interest for the samples being analysed, and should, ideally, be linear over that range. At least three calibration points (not including the calibration blank) are required, but more shall be necessary for a non-linear calibration. Calibration solutions, and standard solutions used for quality control purposes, should, where possible, be prepared by different analysts and from different lots or sources of materials. When calibrating pH instruments, the procedure in EN ISO 10523 (ref q) may be used. Note: Two appropriate calibration standards are used, and a third used to
check linearity. Recalibration is required if the third standard is outside limits. Full details are in the standard.
At least one blank sample, containing negligible amounts of the parameters of interest, should be taken through the entire analytical system (including sample preparation if appropriate) with each batch of samples. Laboratories shall demonstrate, according to written procedures, how blank samples are utilised. Blank sample results that show evidence of contamination shall be investigated and may require the analysis of the entire batch of samples to be repeated. This may not be appropriate for some determinations, for example pH.
6.4.8 No additional requirements to EN ISO/IEC 17025. 6.4.9 The response of instruments may fall due to, for example, deterioration in a
detector. This may not be immediately obvious from internal quality control sample results but might coincide with deterioration in both precision and limit of detection of the analytical system. The initial calibration should, therefore, meet with appropriate predefined system suitability limits. Examples include the use of peak area or signal to noise ratio and for chromatographic methods criteria for acceptable peak shape and peak resolution for closely eluting peaks.
6.4.10 Confirmation of the continuing validity of calibration shall be achieved by analysis of calibration check standards regularly throughout the analytical batch according to a defined procedure. The instrument shall not be re-calibrated using the check standard. If a check standard fails to meet appropriate predefined limits the instrument shall be recalibrated and affected samples reanalysed, unless it can be demonstrated that the results would not
MCERTS chemical testing of soil Version 5 December 2018 6 of 39

be affected. Where appropriate, procedures shall be in place to ensure calibration is valid through to the end of an analytical run.
6.4.11 – 6.4.13 No additional requirements to EN ISO/IEC 17025.
6.5 Metrological traceability No additional requirements to EN ISO/IEC 17025.
6.6 Externally provided products and services No additional requirements to EN ISO/IEC 17025.
7 Process requirements 7.1 Review of requests, tenders and contracts 7.1.1 For data to be submitted to the Environment Agency for regulatory purposes,
the requirements of the methods to be used shall be clearly and unambiguously defined and documented. The laboratory shall demonstrate that the requirements of the methods to be used shall be understood by those who undertake the analysis. Note: The laboratory may or may not be aware that the data it generates will
be submitted to the Environment Agency for regulatory purposes. However, the laboratory’s customer or procurer of the analytical service should be aware that if it wishes to submit the data to the Environment Agency for regulatory purposes, then the requirements of this performance standard need to be satisfied.
For data to be submitted to the Environment Agency for regulatory purposes, the appropriate test and/or calibration method shall be selected and shall satisfy the requirements of this performance standard. A laboratory may sub-contract the chemical testing of soil to another laboratory. It is the responsibility of the laboratory to ensure that the sub-contracted laboratory is registered under MCERTS for the scope of work sub-contracted. The provisions of this clause do not apply to samples submitted to a laboratory by an external quality control or inter-laboratory proficiency-testing scheme organiser.
7.1.2 – 7.1.8 No additional requirements to EN ISO/IEC 17025.
7.2 Selection, verification and validation of methods 7.2.1 Selection and verification of methods 7.2.1.1 The laboratory shall demonstrate and provide justification that suitable
methodology (including sample pre-treatment and preparation) has been used in the analysis of a particular matrix and parameter and that it is appropriate with respect to the concentration of the parameter in the sample. The laboratory shall demonstrate and provide justification that method validation procedures have been undertaken in such a manner as is appropriate to the sample matrix undergoing analysis. Full details of the method and method validation procedures shall be made available to the Environment Agency, if requested.
7.2.1.2 – 7.2.1.3 No additional requirements to EN ISO/IEC 17025.
MCERTS chemical testing of soil Version 5 December 2018 7 of 39

7.2.1.4 The Environment Agency will not prescribe those analytical methods that an organisation should use, but the method used shall be appropriate for the matrix and determinand at the level of concentration being analysed. Where results are submitted to the Environment Agency for regulatory purposes, a clear and unambiguous description of the method used to generate the results shall be provided to the Environment Agency, if requested. This description, which need not be fully comprehensive, shall comprise more than the title of the method and shall clearly indicate the determinand, scope, principle and matrix or matrices for which the method is applicable. The description of the method, parameter and matrix shall be sufficiently detailed to allow direct comparisons with similar methods, parameters and matrices that might be used and determined by other analysts or laboratories. For example, when an extraction technique is used to isolate or concentrate a particular parameter, the name of the solvent or full details of the composition of the solvent mixture shall be given. Also, the amount of soil taken for analysis and the amount of solvent used in the extraction shall be reported. In addition, where the analytical determination of an extract is undertaken and, for example, this involves the use of a specific wavelength or mass number, then details shall also be given. The term “contaminated land” will not be sufficient to describe the matrix, which shall include reference to the major constituents and components. Note: The description of the sample matrix may, for example, be in the form
“an organic-rich (predominantly loam) soil visibly contaminated with hydrocarbons” or “an industrial soil of mostly clay and sand (containing brick debris) from a former manufacturing site” possibly with a statement of the manufactured product.
A fully documented method shall be made available to the Environment Agency, if requested.
7.2.1.5 – 7.2.1.7 No additional requirements to EN ISO/IEC 17025. 7.2.2 Validation of methods 7.2.2.1 Before any method for a particular matrix and parameter is used for
generating data for submission to the Environment Agency that method shall be accredited to EN ISO/IEC 17025 for this performance standard. Only those results generated using these methods will be eligible for submission to the Environment Agency for regulatory purposes. The process of full validation provides confidence that the established performance characteristics are based on robust experimental determinations and are statistically sound. Validation procedures include a number of operations. These shall include the analyses of, where available and appropriate, matrix certified reference materials relevant to the matrices, parameters and range of parameter concentrations under investigation. The method shall be validated for each parameter analysed on matrices likely to be analysed within the laboratory. This validation shall include at least three different soil matrices. Sample pre-treatment and preparation is an important part in the validation process and shall be considered, as this may not be monitored by the use of certified reference materials. In these cases a separate exercise to determine the effects of sample pre-treatment and preparation shall be undertaken.
MCERTS chemical testing of soil Version 5 December 2018 8 of 39

Note: Whilst it is not expected that every sample submitted should require its own validated method, it is recognised that a single validated method established for one particular matrix but used for every sample, irrespective of its matrix, is not appropriate.
In the absence of suitable certified reference materials, recovery estimates relevant to the matrix and parameter under investigation shall be determined by the use of spiking experiments. Where possible these experiments shall cover the entire method (including pre-treatment, extraction and determination). The addition of a parameter to a sub-sample followed by immediate extraction is not a satisfactory test for estimating spiking recovery, as sufficient time must elapse to allow possible matrix-parameter interactions to occur. The laboratory shall demonstrate that its use of spiking experiments and the spiking procedures employed is appropriate. Where a suitable certified reference material is, initially, not available, but then, after recovery estimates have been undertaken, becomes available, then the newly available certified reference material shall be used to check the bias is satisfactory. The number of replicate determinations required to detect a bias at a target level (for example MCERTS performance targets) can be estimated if the precision of the measurement is known. For spiking experiments, the concentrations of the solutions used in the validation procedures shall be appropriate to the concentrations found in samples being routinely analysed. Recovery estimates shall be obtained using two significantly different but appropriate concentration levels, for example, at 20 % and 80 % of the expected range. All solutions shall either be taken from bulk stock solutions that are known (and have been shown) to be stable over the entire period of testing or, if solutions are not stable over the entire period of testing, be prepared immediately before the analysis of each validation batch. The traceability of these solutions shall have been established. When Isotope Dilution Mass Spectrometry [IDMS] is employed, with appropriate labelled analogues of the parameters spiked into all samples - including calibration standards and matrix AQC standards,- then equilibrated appropriately before sample preparation is undertaken, the results obtained will be recovery corrected. The recovery corrected values of spiked samples and/or CRMs obtained in this manner shall be used to estimate bias against the certified CRM and/or added spike.
7.2.2.2 Revalidation After an analytical method has been validated and accredited, it is inevitable that in time some modification of procedures will take place. Any modifications to a method routinely used within a laboratory may affect the resulting performance. Any changes made to a method already accredited against the MCERTS requirements shall be notified to the national accreditation organisation. These changes could range from replacing a piece of equipment to a fundamental procedural modification, such as a different extraction procedure. Minor changes to the analytical system may not require revalidation, but care should be taken to ensure the cumulative effects of several changes do not
MCERTS chemical testing of soil Version 5 December 2018 9 of 39

affect system performance by, for example, closely monitoring internal and external AQC, and reanalysing CRMs used for validation. If an instrument is being replaced by one of the same model, and performance is not expected to fundamentally change, laboratories need only demonstrate that the new instrument performs as well as the old instrument. This could be achieved, for example, by analysing several replicates of a representative matrix such as a spiked soil, a CRM or a soil AQC sample. If a fundamental change is made to the analytical procedure or the equipment used then a full validation on a minimum of 3 matrices is required in accordance with this performance standard. These changes may include, for example, replacing ICPOES with ICPMS, using a new extraction technique etc. It is recognised that an intermediate degree of validation should be carried out if significant changes are made to a method that are not considered fundamental to performance. A partial validation shall be performed (for example analysis of 6 batches of duplicates), using only one spiked sample from the lower end of the calibration range, or preferably a CRM, for all appropriate matrices. If a laboratory judges that this level of validation is required, then it shall notify and gain the approval of UKAS. Laboratories shall ensure that the amendments to the analytical system and any procedures that may be affected are included in the revalidation.
7.2.2.3 Validation procedures For the method, parameter and matrix, the performance characteristics shall be determined with a minimum of ten degrees of freedom. This shall be carried out by analysing each certified reference material or spiked samples in duplicate in different analytical batches. Ideally, each analytical batch shall be analysed with a new calibration, to ensure between batch variations are fully reflected. However if a fixed calibration or infrequent calibration is applied in routine operation of a method, and can be demonstrated to be appropriate for the method under test, fewer calibrations may be required. The amended validation procedure shall be agreed with UKAS and the Environment Agency.11 batches of duplicates will guarantee a minimum of ten degrees of freedom. However, it may be that 10 degrees of freedom will be achieved in less than 11 batches, this can be checked after each batch of results (see references a) and b) for appropriate procedures). Validation shall be undertaken in a period of time not less than six days and no more than three months. If a method is routinely calibrated monthly for example, the analytical batched used for validation shall be spread over the 3 month period. Note 1: This procedure is often termed an 11 x 2 test, as 11 batches
containing 2 replicates of each test material are analysed. Precision should then be estimated using analysis of variance (ANOVA), from which different sources of error (for example within batch and between batch random errors) can be estimated and combined to give a total error as a standard deviation. Details of the statistical procedures for ANOVA and recovery (bias) estimation are given in references a) and b), see also Annex B of this performance standard.
MCERTS chemical testing of soil Version 5 December 2018 10 of 39

Note 2: The use of a validated method for one particular soil matrix may not be suitable for the analysis of a different soil matrix. This may also be the case when analysing samples of the same soil matrix containing significantly different concentrations of the same parameter.
The laboratory shall demonstrate that the certified reference material for the matrix, methodology, parameter and concentration of parameter being analysed is appropriate. When a method has been validated, its stated performance shall reflect the routine capability of the method. That is, when the method is used routinely, its day to day performance shall be typical of and maintained at the level of the stated validation performance. The limit of detection of a method used to analyse highly contaminated samples may be higher than the limit of detection of a method used to analyse slightly contaminated samples. The reported limit of detection shall be fit for the intended purpose and appropriate to the concentration level of interest required of the analysis. The limit of detection shall be calculated as described in Annex B1. The limit of detection should never be used in isolation of other method validation data to judge the appropriateness of a method. Note 3: The maximum value of the limit of detection usually regarded as being
fit for purpose is 10 % of the concentration regarded as the critical level of interest.
Performance criteria The Environment Agency has specified that the following performance characteristics are acceptable for the validation of methods for the chemical testing of soil, bearing in mind the need to take meaningful decisions, current analytical capabilities and other likely sources of variation. The bias (or systematic error) of individual results determined for the entire method shall not be significantly greater than the figure indicated in Annex A (Tables 1 – 4) expressed as a percentage. The certified reference value of the certified reference material shall be used as the true or accepted value when calculating bias. If a critical level of interest is known, the target bias value used can be taken as one-twentieth of the critical level of interest and either bias value used whichever is the greater. Laboratories shall demonstrate that the bias satisfies the stated requirement at the critical level of interest. The precision, as expressed as the % relative standard deviation, of individual results determined for the entire method shall not be significantly greater than the figure indicated in Annex A (Tables 1 – 4). Precision shall be estimated using analysis of variance to determine total standard deviation. If a critical level of interest is known, the target precision value used can be taken as one-fortieth of the critical level of interest and either precision value used whichever is the greater. Laboratories shall demonstrate that the precision satisfies the stated requirement at the critical level of interest. Testing for significance shall be carried out as described in Annex B2. If, for a particular parameter, testing shows a significant difference exists, then further method development or refinement is required, or a different analytical method used.
MCERTS chemical testing of soil Version 5 December 2018 11 of 39

Annex A (Tables 1 – 4) specifies the performance characteristics for a selection of parameters (which are not to be regarded as exhaustive). Note 4: In the context of soil analysis, bias and recovery can be regarded as
synonymous. The use of certified reference materials is preferred to spiked soils, but if appropriate certified reference materials are not available (either for the matrix, parameter or parameter concentration under investigation) then spiking experiments may offer the only suitable means of estimating recovery. Where the analysis involves preparation and steps (for example drying and grinding) that are not required for the certified reference material, then a combination of CRM analyses and spiked soil analyses may be required.
When a laboratory requests accreditation of additional parameters not listed in Annex A of this standard, the following performance requirements shall be enforced: Metals – 7.5% precision and 10% bias Organometallics – 15% precision and 30% bias Inorganics – 10% precision and 20% bias Organics – 15% precision and 30% bias If a laboratory is unable to meet these requirements due to matrix effects or fitness for purpose issues it shall propose alternative performance characteristics and submit them to the Environment Agency via UKAS for assessment. Unvalidated matrices If a laboratory subsequently receives soils of a different matrix to those on which full validation has been carried out, then for each sample type/matrix the laboratory shall undertake replicate analyses and carry out spike recovery tests with batches of samples as they are received. Spikes and replicates should be included at random, each at a minimum frequency 1 per 20 samples. If the batch size is less than twenty, one spike and one replicate sample shall still be required. The results from the spiked and unspiked samples should be used to calculate the percentage recovery. Results of sample spikes and replicates should be reported. For some parameters a high background concentration may make it difficult to assess spike recovery. An alternative approach may therefore be required, such as pre-dilution of spiked samples before analysis. An alternative to spiking and replicating samples for unvalidated matrices is the use of isotopically labelled surrogate compounds to establish the recovery of each parameter for each sample. A known amount of the isotopically labelled surrogate compound shall be added to every sample prior to sample analysis. The recovery of the surrogate compound shall fall within acceptable limits and should be reported with the associated sample results.
7.2.2.4 No additional requirements to EN ISO/IEC 17025.
MCERTS chemical testing of soil Version 5 December 2018 12 of 39

7.3 Sampling 7.3.1 A sample shall be analysed using either all of the sample or a representative
or homogenised sub-sample. If a parameter is known to be unstable, or suspected of being unstable, or begins to degrade once the sample has been taken, then the analysis shall be carried out without undue delay.
7.3.2 The analysis shall be undertaken on a sub-sample of the sample as removed from the site or preserved or stabilised on site. The results of this analysis shall then be converted to, and reported on, a dry-weight basis of the sample submitted to the laboratory. Thus, the sample shall be analysed on a “wet-weight” or “as submitted” basis, but results reported on a dry-weight basis, and this fact recorded. The procedures used to establish the dry-weight basis shall be defined and reported by the laboratory, as shall drying temperature.
7.3.3 No additional requirements to EN ISO/IEC 17025.
7.4 Handling of test or calibration items 7.4.1 When a sample is stabilised, or preserved and subsequently analysed, then
this fact shall be recorded when the results are reported and details of the stabilising or preserving agent shall be recorded. Where a party independent of the analysing laboratory performs this activity (for example the provider of the samples), the laboratory should obtain this information and report it as above. When a sample has been dried and is subsequently analysed, sufficient information shall be provided to establish the stability of the parameter analysed. Such information shall provide justification for analysing the dried sample, rather than analysing the sample on a “wet-weight” or “as submitted” basis. Note 1: This information may be in the form of a statement, or describe the
work undertaken to justify the approach adopted. The procedures used to prepare dried samples shall be defined and reported by the laboratory. This may include air-drying and/or assisted-drying. The temperature at which the drying is to be undertaken shall be appropriate to the parameter being determined to ensure that the parameter does not undergo degradation or is lost from the sample. If a sample is to be described as air-dried the drying temperature shall not be more than 30 0C. When a sample is removed from the site, it often contains a variety of substances and constituents other than the soil and contaminants under investigation. If, after drying, the sample is to be crushed, ground and/or sieved, or certain constituents removed, then appropriate details of the sieve and any material remaining on the sieve, or any constituent parts removed, shall be recorded and reported. These details shall include, for example, the amount, type and nature of such materials. It shall be noted whether any constituent parts removed or material not crushed, ground and/or sieved undergoes the same analysis as that carried out on material that is crushed, ground and/or sieved. All relevant information (including details of the sieve) shall be provided to establish whether the analysis of the sub-sample relates to all, or constituent parts, of the sample submitted to the laboratory.
MCERTS chemical testing of soil Version 5 December 2018 13 of 39

Note 2: It is recognised that different practices exist for sample preparation and pre-treatment and that theses practices depend on the nature of the sample submitted, the site from where samples are taken and the need for the analysis. It is of paramount importance that relevant information is reported.
7.4.2 - 7.4.4 No additional requirements to EN ISO/IEC 17025.
7.5 Technical records 7.5.1 The laboratory shall retain records for a defined period of time of not less than
six years. This period of time shall take into account the need of the customer (procurer of the analytical services) and the need to submit these records to the Environment Agency, if requested.
7.5.2 No additional requirements to EN ISO/IEC 17025.
7.6 Evaluation of measurement uncertainty No additional requirements to EN ISO/IEC 17025. Note: Useful information regarding the estimation of measurement uncertainty is
given in references h), k) and l).
7.7 Ensuring the validity of results 7.7.1 Internal Quality Control 7.7.1.1 For internal quality control, the performance of each analytical method shall
be verified for each batch of samples analysed. Control samples shall be analysed within the analytical batch with which they have been prepared. Note 1: The internal quality control requirements for hydrocarbon banding
methods can be found in appendix 5 In each analytical batch, a minimum of 5% of samples shall be laboratory control samples. Laboratory control samples may be certified reference materials, reference materials, in-house reference materials or spiked soils, in that order of preference. If the batch size is less than twenty, one laboratory control sample per batch is still required. In order to monitor the variation of laboratory control samples, results shall be recorded or plotted on quality control charts (see Annex C). These charts shall be reviewed regularly, and the control limits updated as necessary (see Annex C). To be able to demonstrate statistical control, a minimum of 30 points should be plotted in a 12 month cycle, spread evenly over the period. Note 2: When control limits are updated, estimates of measurement
uncertainty should also be updated. If an analytical procedure is carried out infrequently, it shall be necessary to employ a greater degree of AQC to ensure statistical control of the method is maintained. The approach taken shall be fully justified. Note 3: Examples of greater degree of quality control include increasing the
number of control samples in a batch, use of the standard additions approach, and use of isotopically labelled surrogate compounds in organic analysis.
MCERTS chemical testing of soil Version 5 December 2018 14 of 39

If laboratories use their own reference materials or spiked soils, the actual values used must conform to the traceability criteria as described in EN ISO/IEC 17025. The following types of control material may be suitable:
1. Certified Reference Material or Reference Material– A sample of the target matrix, the concentration of parameter being certified to a quoted uncertainty and preferably traceable to an international/national Standard. Note 4: It is recommended to use reference materials from producers that
meet ISO 17034. ISO Guide 33 provides guidance on the selection and use of reference materials.
2. In-house Reference Material – A sample produced by the laboratory. It is vital that the sample is fully homogenised so that variations in repeat analyses reflect the analytical method performance and not inhomogeneity of the sample. The amount of material should be large enough to provide consistent and stable samples for as long a period as possible. An advantage of using in-house reference materials is the ability to match the parameter concentration and matrix of the material to samples normally encountered in the laboratory. Note 5: Guidance on the production of in-house reference materials can be
found in references o) and p). Note 6: Traceability for this material may be achieved by characterisation
against a certified reference material, for example during method validation or by comparison with the analysis of the material by accredited third-party laboratories.
3. Spiked Soil – A soil representative of the matrix being analysed, to which a known quantity of a parameter standard solution is added before analysis. A parameter that has been added to the soil may not be present in its “natural” state or fully integrated with the sample matrix, but (for example when the parameter is unstable or volatile) this may be the only option available. Standards used for spiking the sample should be from a different source to that used for calibration. Suitable contact times between spiking and extraction should be determined to provide interaction between spike and sample and to ensure there is no degradation of the parameter. Note 7: Estimates of bias are often complicated with “recovery” terms,
especially if the method involves an extraction stage. An estimate of precision is easily obtainable, but the apparent precision of the spike is a combination of the precision of the sample and that of the spiked sample.
4. Other Options – Duplicate analyses of individual samples as submitted to the laboratory should be considered when a test is carried out infrequently, as should the use of duplicate control charts. Standard addition techniques may be appropriate. Other alternative procedures or a combination of approaches may be necessary to demonstrate control of infrequently performed tests.
7.7.1.2 For the individual parameters listed in Annex A (Tables 1-4) quality control results shall be plotted on appropriate control charts. In multi-parameter organic methods (for example volatile organic compounds (VOCs) or semi-volatile organic compounds (SVOCs)), all parameters shall also be plotted on a control chart. All parameters listed in Annex A and a
MCERTS chemical testing of soil Version 5 December 2018 15 of 39

minimum of 20% of parameters not listed shall be used for immediate laboratory quality control. Groups of parameters with similar properties shall have representative parameters selected for this. The selection of these parameters should include critical parameters, for example those most likely to be laboratory contaminants, and for chromatographic methods, parameters that elute at the beginning and end of a chromatogram, or those whose peaks are poorly resolved. Laboratories shall justify their approach. The other results shall be recorded and shall be reviewed as part of regular AQC performance review. Precision and bias shall not statistically exceed 15% precision and 30% bias performance requirements.
7.7.1.3 Laboratories shall have documented procedures that define loss of statistical control and specify actions to be taken (control rules) when control limits are breached. All breaches shall be investigated, and the findings and actions recorded and made available to the Environment Agency, if requested. Samples in an analytical batch where laboratory control samples breach the defined control rules shall be reanalysed. The investigation shall include but shall not be restricted to the following checks:
• changes in concentration of stock standard solutions and reagents and that expiry date has not been exceeded
• calibration of instruments used in the analytical process • documented methods were strictly adhered to • that system suitability check data meet requirements • significant drift does not occur for automated determinations • service/fault records • recent proficiency testing scheme results Records shall include:
• identification of control sample and all associated sample results • control rules in force at time of breach and breach result • investigation details, conclusions and actions taken • action taken with respect to affected sample results (i.e. analysis repeated
or results reported – see Annex C3) 7.7.2 Participation in interlaboratory comparison or proficiency-testing
programmes 7.7.2.1 The laboratory shall participate in an appropriate external quality control or
inter-laboratory proficiency-testing scheme. Where possible, samples from the scheme organiser should reflect typical matrices and parameter concentrations analysed within the laboratory. Note: The Environment Agency will encourage scheme organisers to provide
appropriate samples (in terms of matrices, parameters and concentrations of parameters) for distribution that reflect real-life situations and site investigations where data need to be generated.
7.7.2.2 As far as is possible, the methods, used by the laboratory to generate analytical data for the chemical testing of soil which are submitted under
MCERTS chemical testing of soil Version 5 December 2018 16 of 39

MCERTS, shall be the same as those methods used by the laboratory for the analysis of samples distributed by the proficiency-testing scheme organiser. In addition, as far as is possible, samples distributed by the proficiency-testing scheme organiser should be treated by the laboratory in the same manner as normal routine samples submitted for chemical testing of soils. For example, procedures for registration, storage, analysis and the recording and reporting of results should be similar.
7.7.2.3 Full details of the scheme, including the number of samples, parameters and analyses to be undertaken by the laboratory and the types of matrices to be analysed, shall be made available. The reports of the results of all analyses submitted by the laboratory to the scheme organiser shall be made available.
7.7.2.4 The laboratory shall have a documented system in operation to review, investigate and address the results submitted to the proficiency scheme organiser that are considered unsatisfactory, and examine trends in performance. If a significant deterioration in method performance is detected and cannot be corrected within a reasonable period of time the method should be re-validated. This review procedure should take into consideration the number of other laboratories participating in the scheme and whether these laboratories use the same or similar analytical methods.
7.7.3 No additional requirements to EN ISO/IEC 17025.
7.8 Reporting of results 7.8.1 General
No additional requirements to EN ISO/IEC 17025 7.8.2 Common requirements for reports (test, calibration or sampling)
No additional requirements to EN ISO/IEC 17025 7.8.3. Specific requirements for test reports 7.8.3.1 For data submitted to the Environment Agency for regulatory purposes,
appropriate information shall be included in the report that clearly identifies and locates the sample relating to the results. This information shall require the recording of all data necessary to allow a complete audit trail to be made. Relevant information includes:
• location of sample, including depth where necessary • unique sample code or reference • date/time sample taken • name of laboratory • name of any sub-contracting laboratories, if used • date sample analysis completed • parameter analysed, including whether sample was preserved or stabilised
at sampling site • whether analysis carried out on dried, air-dried or “as submitted” basis • result of analysis on dry-weight basis
MCERTS chemical testing of soil Version 5 December 2018 17 of 39

• other relevant comments, for example, visual characteristics of sample Note: It is recognised that some of this information may only be available
from, or be able to be provided by, the procurer of the analytical service and not the laboratory.
However results are determined all values shall be calculated and reported on a dry-weight basis. The laboratory shall report the procedures used, how air-dried and dry-weight have been determined and defined, and the drying temperature. Results that are submitted to the Environment Agency shall be accompanied with a statement indicating whether the results have been recovery corrected or not, as the case may be, and if so, the criteria used, including the manner of calculation. Whenever possible and where appropriate, individual compounds should be analysed and individual results reported. Where a group of similar compounds is analysed and the combined concentrations of these compounds are expressed as the sum of individual concentrations, the laboratory shall record the number and identity of each compound analysed. This information shall be reported with the results. If this approach is not possible or appropriate, the laboratory shall define the analysis undertaken and the calculated result. This information shall be reported with the result.
7.8.3.2 No additional requirements to EN ISO/IEC 17025. 7.8.4 – 7.8.8 No additional requirements to EN ISO/IEC 17025.
7.9 Complaints No additional requirements to EN ISO/IEC 17025.
7.10 Non conforming work No additional requirements to EN ISO/IEC 17025.
7.11 Control of data – information management No additional requirements to EN ISO/IEC 17025.
8 Management system requirements No additional requirements to EN ISO/IEC 17025.
MCERTS chemical testing of soil Version 5 December 2018 18 of 39

Annex A (normative): Performance Characteristics Table 1 - Metals and organometallics
Parameter1 Precision2 Bias3
antimony 7.5 15 arsenic 7.5 15 barium 7.5 10 beryllium 7.5 10 boron (water soluble) 10 20 cadmium 7.5 10 cobalt 7.5 10 copper 7.5 10 chromium 7.5 10 hexavalent chromium 7.5 10 iron 7.5 10 lead 7.5 10 manganese 7.5 10 mercury 7.5 15 molybdenum 7.5 10 nickel 7.5 10 organolead compounds 15 30 organotin compounds 15 30 selenium 7.5 15 thallium 7.5 10 vanadium 7.5 10 zinc 7.5 10
Notes 1. Whilst no limit of detection has been specified, it shall be fit for purpose, especially, for example when compared to “soil guideline values” or critical levels of interest. 2. Precision expressed as percent relative standard deviation. 3. Bias expressed in percentage terms.
MCERTS chemical testing of soil Version 5 December 2018 19 of 39
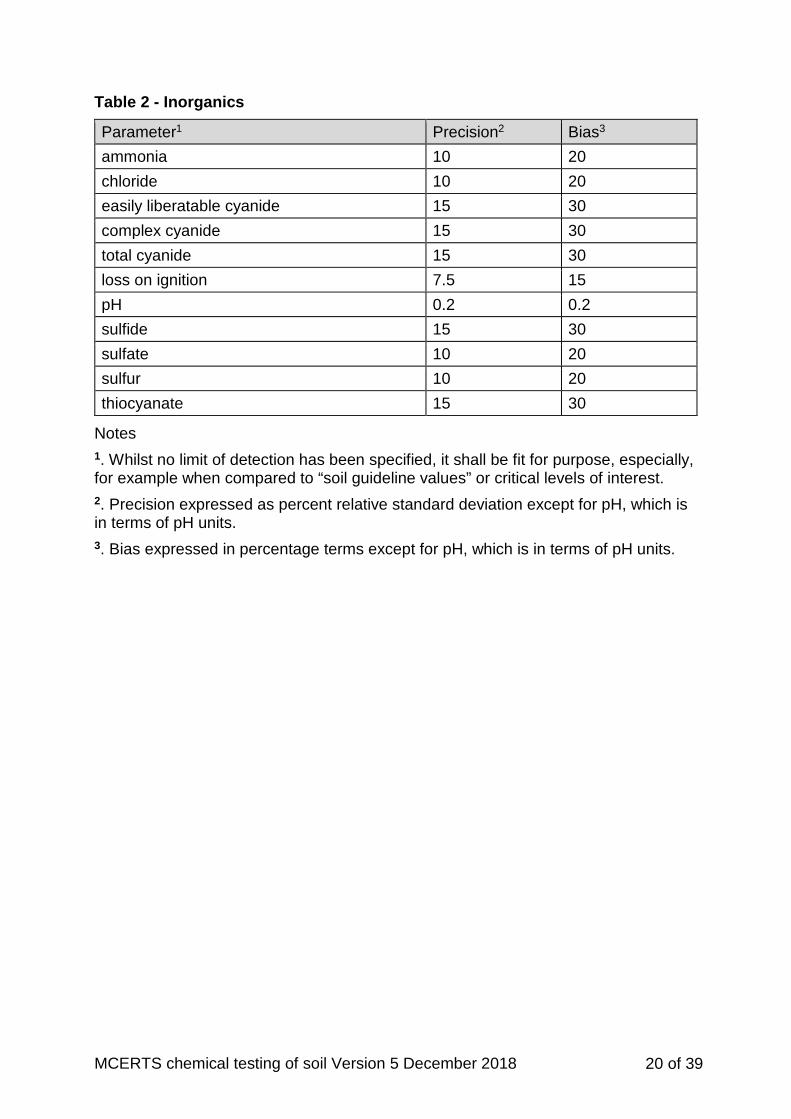
Table 2 - Inorganics
Parameter1 Precision2 Bias3
ammonia 10 20 chloride 10 20 easily liberatable cyanide 15 30 complex cyanide 15 30 total cyanide 15 30 loss on ignition 7.5 15 pH 0.2 0.2 sulfide 15 30 sulfate 10 20 sulfur 10 20 thiocyanate 15 30
Notes 1. Whilst no limit of detection has been specified, it shall be fit for purpose, especially, for example when compared to “soil guideline values” or critical levels of interest. 2. Precision expressed as percent relative standard deviation except for pH, which is in terms of pH units. 3. Bias expressed in percentage terms except for pH, which is in terms of pH units.
MCERTS chemical testing of soil Version 5 December 2018 20 of 39

Table 3 - Organics
Parameter1 Precision2 Bias3
benzene 15 30 benzo[a]pyrene 15 30 chlorobenzene 15 30 chloromethane 15 30 chlorophenol 15 30 chlorotoluene 15 30 dichloroethane 15 30 1,2-dichloroethene 15 30 dichloromethane 15 30 dioxins5 15 30 explosive substances4 15 30 ethylbenzene 15 30 furans5 15 30 hexachloro-1, 3-butadiene 15 30 petroleum hydrocarbons6 15 30 nitroaromatics5 15 30 pentachlorophenol 15 30 phenols5 15 30 phthalate esters5 15 30 polyaromatic hydrocarbons5 15 30 polychlorinated biphenyls5 15 30 tetrachloroethane 15 30 tetrachloroethene 15 30 tetrachloromethane (carbon tetrachloride) 15 30 total organic carbon (soil organic matter estimation) 10 20
toluene 15 30 trichloroethane 15 30 trichloroethene 15 30 trichloromethane (chloroform) 15 30 vinyl chloride 15 30 xylene 15 30
Notes 1. Whilst no limit of detection has been specified, it shall be fit for purpose, especially, for example when compared to “soil guideline values” or critical levels of interest. 2. Precision expressed as percent relative standard deviation. 3. Bias expressed in percentage terms. 4. Covers organic explosive compounds as listed in Environment Agency guidance.
MCERTS chemical testing of soil Version 5 December 2018 21 of 39

5. Performance targets are for individual compounds within these groups. If a total (e.g. total PAH) result is requested, then each individual component should be determined and reported with the total. See section 7.8.3.1. 6. Requirements for validation of hydrocarbon banding methods can be found in appendix E Table 4 – Additional parameters
Method/Parameter1 Precision (%)2 Bias (%)3 extractable phosphate content (Olsen) 10 15 extraction of potassium
the exchangeable cations in soil: 10 15
extraction of magnesium
the exchangeable cations in soil: 10 15
extraction of sodium
the exchangeable cations in soil: 10 15
organic carbon content % Black
modified Walkley 5 10
determination of electrical conductivity 5 15 metals by nitric acid extraction and microwave digestion 7.5 10
total nitrogen 5 15 determination of carbonate content volumetric method
– 6 10
fluoride 10 20
Notes 1. Whilst no limit of detection has been specified, it shall be fit for purpose, especially, for example when compared to “soil guideline values” or critical levels of interest. 2. Precision expressed as percent relative standard deviation. 3. Bias expressed in percentage terms.
MCERTS chemical testing of soil Version 5 December 2018 22 of 39

Annex B (normative): Statistical Analysis B1 Limits of detection and reporting B1.1 Introduction The limit of detection (LOD) is widely but inappropriately used as the primary performance measure of an analytical system, but does not indicate whether a method is fit for purpose. For example, a very low LOD value does not mean that the method is suitable for a particular purpose, as precision and bias could be unacceptable at the critical level of interest. The LOD is not specified in this performance standard. However, a common approach to the estimation of LOD is desirable in order to allow a laboratory’s performance to be evaluated in a consistent and comparable way. If data reported to the Environment Agency are to include results reported as less than values, the LOD shall be estimated using the following protocol. For further guidance on estimation of LOD for hydrocarbon banding methods see Appendix E2.3 B1.2 Choice of sample and sample pre-treatment The blank sample used to estimate LOD shall be a soil containing a small but measurable amount of parameter(s) of interest. If it can be demonstrated that a suitable soil cannot be obtained then a sand containing a negligible amount of parameter of interest shall be used. Note 1: The sample used for estimating LOD should be as similar as possible to the
matrix being analysed. Using a single sample for the determination of LOD for a given method will not take into account different matrix effects.
Ideally analysis of the blank sample will produce normally distributed results scattered around zero; i.e. both negative and positive results will be generated. It is usually possible for the blank sample to have a sufficiently small background concentration of the parameter to fulfil this requirement. However, this may not always be possible because in some analytical systems negative or low results cannot be obtained. In these cases the blank sample should be spiked with a small amount of the parameter, sufficient to produce a small but significant response from the analytical system, i.e. close to the expected LOD. This concentration shall not exceed 5 times the LOD. The blank or spiked sample shall be put through the entire analytical process (including, as necessary, drying, grinding, extraction, clean-up and measurement). The extraction and measurement of blank solutions based only on solvent or reagent blanks is not sufficient for estimating LODs for the purpose of satisfying MCERTS requirements. The blank samples or spikes shall be processed in the same manner and using the same equipment and reagents as other samples in a batch. Note 2: For commonly occurring substances such as iron, zinc, chloride and sulfate
etc., where soils may contain a significant amount of these substances, the method used to determine an LOD for that substance using a pure sand or silica blank can give an optimistic (lower concentration) LOD. Alternatively if an "uncontaminated natural" soil is used to determine the LOD and it contains a significant amount of these substances then a pessimistic (higher concentration) LOD will be obtained.
MCERTS chemical testing of soil Version 5 December 2018 23 of 39

Note 3: It is important that users of results should appreciate that the LOD for these common substances obtained by all MCERTS accredited laboratories should be adequate for all these commonly (naturally) occurring substances. However, it is unlikely that LOD will be an issue with these substances, as adequate precision and bias at the level of interest is more pertinent.
Note 4: For commonly occurring substances the variation in blank values should be consistent and within acceptable limits. Ideally all blank values for these substances should be less than 10% of the critical level of interest.
B1.3 Calculation For the purpose of this performance standard, LOD is defined by the equation:
LOD = 2√2.t (df,α= 0.05). 𝑆𝑆𝑤𝑤where:
df is the number of degrees of freedom (minimum 10) t is the one-sided Student’s t-test statistic (95% confidence level)
𝑆𝑆𝑤𝑤 is the within-batch standard deviation of results from samples ideally containing negligible concentration of the parameter of interest.
An estimate of the LOD can be made when initial validation studies are undertaken. Pairs of sample blanks shall be analysed in at least 10 different analytical runs or batches. Ideally these blanks should contain a negligible amount of the parameter being determined and should be consistent with and similar to the matrices of the samples being analysed. These sample blanks shall not be used as a calibration blank, and if the analytical procedure requires samples to be blank corrected, then the sample blanks used to estimate LOD should also be blank corrected. Results shall not be rounded before being used for the estimation of LOD. In the most general case, where m batches of different numbers of replicates ni give a series of within-batch standard deviations, 𝑆𝑆𝑖𝑖:
The pooled value of 𝑆𝑆𝑤𝑤 is given by:
∑𝑆𝑆 2
𝑆𝑆𝑤𝑤 (𝑝𝑝𝑝𝑝𝑝𝑝𝑝𝑝𝑝𝑝𝑝𝑝) = � 𝑖𝑖 × (𝑛𝑛𝑖𝑖 − 1)∑(𝑛𝑛𝑖𝑖 − 1)
where:
𝑆𝑆𝑖𝑖= individual batch standard deviation,
𝑛𝑛𝑖𝑖 = number of results in the batch. Where the batches all contain the same number of results, this equation simplifies to:
𝑆𝑆𝑤𝑤 (𝑝𝑝𝑝𝑝𝑝𝑝𝑝𝑝𝑝𝑝𝑝𝑝) = �∑𝑆𝑆𝑖𝑖2
𝑚𝑚 with m(n-1) degrees of freedom
for example for 10 batches of 2 blanks:
𝑆𝑆𝑤𝑤 (𝑝𝑝𝑝𝑝𝑝𝑝𝑝𝑝𝑝𝑝𝑝𝑝) = �∑𝑆𝑆𝑖𝑖2
10 with 10 degrees of freedom
MCERTS chemical testing of soil Version 5 December 2018 24 of 39

Since t (α = 0.05) for a one sided t-test with 10 degrees of freedom is 1.812
Then LOD = 2√2.t. 𝑤𝑤 = 5.13𝑆𝑆𝑤𝑤 𝑆𝑆If a different number of batches and replicates is used a minimum of 10 degrees of freedom shall be obtained. Where more than 10 batches of replicates are determined, all valid results shall be used in calculating the LOD. As an ongoing check, an estimate of LOD can be obtained by analysing 11 blank samples in the same batch, here st (total standard deviation) equates to sw, with 10 degrees of freedom. This procedure should be used when a matrix is analysed by a method that has not been fully validated for that matrix. B1.4 Form of expression For a multi-parameter method such as PAH, each individual PAH will need to have its own LOD estimated. For TPH and similar parameters, it would not be appropriate to estimate the LOD using just one of the hydrocarbons within the analytical range. Blank sample data shall be generated in the same way as normal sample data to obtain the results used in estimating LOD. LOD values shall always be reported in the same units as the parameters they represent. The calculated value may be rounded up for convenience and ease of use. B1.5 Reporting limit For the purposes of this MCERTS performance standard the reporting limit will be the limit of detection calculated as above. However, a laboratory may use higher reporting limits than calculated LODs, for example a laboratory calculated LOD for a method as <0.2 mg/kg but prefer to report <1 mg/kg due to issues with reporting software and customer requirements. This is considered wholly acceptable by the Agency, as long as LOD is calculated in the correct way. If samples are diluted before analysis then the LOD must be scaled up, i.e. if a sample is diluted 1:5, and the analytical result is <5, then <25 should be reported. B2 The use of statistical significance tests in the interpretation of method performance. B2.1 Introduction Method validation aims to produce data on the precision of analysis and to provide an indication of any susceptibility to systematic error or bias. Assuming that validation has been carried out as described in section 5.4.5 and that Analysis of Variance (ANOVA) has been applied to the results, there should be sufficient data to assess whether method performance complies with Annex A criteria (see section 5.4.5.3). B2.2 Assessment of precision The convention in analysis has been to consider precision to be satisfactory if the measured standard deviation is found not to be statistically significantly larger than the target standard deviation.
MCERTS chemical testing of soil Version 5 December 2018 25 of 39

This implies there is uncertainty about the measured standard deviation value, although this uncertainty is minimised by specifying its calculation with at least 10 degrees of freedom. Assessment of precision is in three stages:
1. Determine the target standard deviation at the concentration of interest, in accordance with section 5.4.5.3.
2. If the measured standard deviation is less than the target standard deviation, the target has been achieved.
3. If, however, the measured standard deviation is greater than the target it is still possible to comply with the requirements of this standard if it is not significantly greater. To assess this significance a statistical test is required.
B2.3 F-Test of standard deviation. The F-test or variance ratio test is a way of determining whether or not differences between two standard deviations are statistically significant (at a chosen probability level). The procedure is to calculate the F ratio as shown below:
𝐹𝐹 =𝑆𝑆𝑡𝑡2
𝑍𝑍2
where St is the measured total standard deviation, estimated using between batch and within batch mean squares in ANOVA, and Z is the target standard deviation. The calculated value of F is then compared with a reference value obtained from statistical tables. The reference value of F is obtained using the correct probability (5% for this performance standard) and using the relevant degrees of freedom for St and Z. Z is a target standard deviation and therefore has infinite degrees of freedom. In the case of St, the number of degrees of freedom is calculated during the analysis of variance. If a complete 11x2 validation is performed, the equation can be simplified to:
𝒅𝒅𝒅𝒅 =𝟏𝟏𝟏𝟏𝟏𝟏[𝑴𝑴𝟏𝟏 + 𝑴𝑴𝟏𝟏]𝟐𝟐
𝟏𝟏𝟏𝟏𝑴𝑴𝟏𝟏𝟐𝟐 + 𝟏𝟏𝟏𝟏𝑴𝑴𝟏𝟏
𝟐𝟐
where M1 and M0 are the within batch and between batch mean squares respectively, each obtained from ANOVA. If the F ratio is less than the tabulated reference F value then the measured standard deviation is not significantly greater than the target value i.e. performance passes If the F ratio is greater than the tabulated reference F value then the measured standard deviation is significantly greater than the target value i.e. performance is not satisfactory. B2.4 Assessment of systematic error or bias This assessment is only relevant and should only be carried out if the assessment of precision is acceptable.
MCERTS chemical testing of soil Version 5 December 2018 26 of 39

The assessment of bias depends on independent knowledge of a “true” value with which to compare the average of measured data. This is accomplished by the use of reference materials or by spiking recovery experiments. To assess bias and its associated uncertainty the procedure is to calculate the mean recovery for each batch and to use the batch mean recoveries to estimate the overall recovery and its standard deviation (strictly its standard error). Significance is assessed by means of calculating the confidence interval about the mean and checking to see if this overlaps the limits of tolerable bias.
Overall Mean Recovery = 𝑀𝑀 = ∑𝑹𝑹𝒊𝒊𝒎𝒎
Standard Error of Recovery = 𝑆𝑆𝑒𝑒 = 𝑆𝑆𝑅𝑅√𝑚𝑚
90% Confidence Interval of Recovery = = 𝑀𝑀 ± 𝑆𝑆𝑒𝑒 × 𝑡𝑡(0.05,𝑚𝑚−1)
Where: m = number of batches Ri = %Recovery of the ith batch SR = standard deviation of batch recoveries t(0.05,m-1) = single-sided Student’s t value at 5% probability level and (m-1) degrees of freedom
If there is an overlap (i.e. one or both of the target recovery limits is within the confidence interval), the recovery is not significantly worse than required and should be regarded as acceptable. Note: When a bias is estimated it is either positive or negative, therefore a one sided
t-test at the 95% confidence level is used to assess if observed bias is greater than permitted bias. However, by definition, a confidence interval is two sided, therefore the significance test is at the 95% confidence level but the resulting confidence interval is 90%.
Examples Two examples are presented below to illustrate the application of the statistical tests mentioned above. The first considers a spiking exercise for cadmium, the second a CRM used to validate a method for benzo(b)fluoranthene.
MCERTS chemical testing of soil Version 5 December 2018 27 of 39

Example 1: cadmium mg/kg in soil – spiked samples
Batch Replicate Recovered low spike sample 4 mg/kg
Recovered High spike
sample 40 mg/kg
Batch mean
values low sample
Batch mean %recovery low sample
Batch mean values high
sample
Batch mean % recovery
high sample
1 1 3.60 47.0 3.705 92.625 47.75 119.38
1 2 3.81 48.5
2 1 3.83 42.6 3.895 97.375 42.85 107.13
2 2 3.96 43.1
3 1 4.02 47.5 4.06 101.5 48.4 121
3 2 4.10 49.3
4 1 4.12 44.0 4.21 105.25 45.05 112.63
4 2 4.30 46.1
5 1 4.05 47.02 3.945 98.625 46.695 116.74
5 2 3.84 46.37
6 1 3.70 40.12 3.805 95.125 40.405 101.01
6 2 3.91 40.69
7 1 3.44 41.93 3.39 84.75 41.625 104.06
7 2 3.34 41.32
8 1 3.68 43.4 3.755 93.875 44.135 110.34
8 2 3.83 44.87
9 1 3.85 42.19 3.825 95.625 42.57 106.42
9 2 3.80 42.95
10 1 3.52 43.46 3.42 85.5 43.23 108.08
10 2 3.32 43.0
11 1 4.02 43.81 3.96 99.0 44.075 110.09
11 2 3.90 44.34
Overall mean 3.815 44.25
Overall mean recovery 95.39 110.63
MCERTS chemical testing of soil Version 5 December 2018 28 of 39

Precision test (From ANOVA)
Low sample High sample Mean 3.815 44.25 Within-Batch sd 0.112 0.812 Between-Batch sd 0.234 2.46 Total sd 0.26 2.58 Relative sd % 6.8% 5.9% Target sd (5% of mean) 0.19 2.21 F 0.05 from tables1 1.75 1.79 F-Value calculated2 1.86 1.37 Estimate degrees freedom 12 11 Assessment FAIL PASS Overall mean recovery 95.39% 110.63%
1 This is obtained from statistical tables for the estimated degrees of freedom at the 5% probability level (p=0.05) 2 This value is calculated as (total sd /target sd) 2
In this example the observed standard deviation of the low concentration sample is greater than the target standard deviation, so an F test is performed. F calculated is greater than the tabulated reference F value so the standard deviation of the low sample is significantly different than 5% and therefore fails to meet the MCERTS target. In the case of the high concentration sample the measured total sd is larger than target but the F test shows that this is not significantly larger – hence this is judged to meet MCERTS requirements.
Recovery for high sample
Reference concentration 40 Mean measured value 1 44.25 Overall mean recovery 110.63% sd of mean recovery 6.306 Standard error of mean recovery 2 1.901 90 % Confidence interval of recovery 3 +/-3.44 Recovery range 107.2% - 114.1% Assessment PASS
1 This value is the average of the mean recovery for each batch 2 This value is the relative sd of overall mean recovery divided by the square root of the number of batches 3 This value is the standard error of mean recovery multiplied by the Student’s t value (p=0.05 single sided) for degrees of freedom equal to number of batches – 1 (t=1.812 for 11 batches)
MCERTS chemical testing of soil Version 5 December 2018 29 of 39

The bias target for cadmium is 10% so the tolerable range of recovery in this example is 90-110%. In the case of the high sample this overlap of confidence interval with the tolerable range means that although recovery is nominally outside this range it is not significantly so and is therefore acceptable. Note that the precision must be acceptable before this test can be applied, so it would not be appropriate to test the low sample.
Example 2: CRM for Benzo(b)fluoranthene This CRM has a certified concentration of 26 µg/kg
Batch Replicate Result Batch mean values Batch mean %recovery
1 1 18.4 18.75 72.12 1 2 19.1 2 1 17.2 18.3 70.38 2 2 19.4 3 1 21.6 20.5 78.85 3 2 19.4 4 1 15.8 16.25 62.5 4 2 16.7 5 1 17.4 19.4 74.62 5 2 21.4 6 1 18.0 18.45 70.96 6 2 18.9 7 1 16.8 17.1 65.77 7 2 17.4 8 1 17.6 18.15 69.81 8 2 18.7 9 1 16.2 16.0 61.54 9 2 15.8 10 1 16.2 17.25 66.35 10 2 18.3 11 1 17.4 16.8 64.62 11 2 16.2 Overall mean 17.91 Overall mean recovery 68.86
MCERTS chemical testing of soil Version 5 December 2018 30 of 39

Precision test (From ANOVA)
Mean 17.91 Within-Batch sd 1.27 Between-Batch sd 1.04 Total sd 1.64 Relative sd % 9.16% Target sd (15% of mean) 2.7 F 0.05 from tables F-Value calculated Estimate degrees freedom Assessment PASS Estimated Bias -31.14%
In this example the requirements for precision has been met without the need for significance testing. However, the bias appears to be outside of the 30% target. As precision is acceptable the significance test for bias can be carried out. Bias test (From ANOVA)
Reference concentration 26 µg/kg Mean measured value 17.91 Overall mean recovery 68.9% sd of mean recovery 5.2823 Standard error recovery
of mean 1.5927
90% Confidence interval of recovery +/-2.9
Recovery range 66.0% - 71.8%
Assessment PASS
The calculated recovery range overlaps with the required range of 70-130% so the bias is not significantly different to the MCERTS requirement, at the 95% confidence level (p=0.05).
MCERTS chemical testing of soil Version 5 December 2018 31 of 39

Annex C (normative): Production and use of Control Charts C1 Introduction The interpretation of results from the analysis of internal laboratory control samples is usually carried out using control charts. These charts are used to compare current results against limits set after estimating the variability of an analytical system operating under statistical control. A method is said to be in statistical control when the variability within the analytical system arises from a stable sources of random analytical variability. Various forms of control chart may be appropriate for use, for example:
• Shewhart charts (individual result) the most common in use • cusum charts – more sensitive to bias detection than Shewhart charts • zone control chart (J-chart) – combines Shewhart and cusum charts
capabilities As a minimum a Shewhart chart should be used, as described below (the use of other charts is described in references b), m) and n)). C2 Setting up and updating Shewhart control charts Control charts should be set up using estimates of mean (M) and standard deviation (sd) obtained from results of at least 20 control samples that are analysed when the analytical system is under statistical control. This data shall initially have been obtained during method validation procedures. The properties of the normal distribution allow the prediction that for on-going analysis, 95% of results will fall within M ± 2sd and that 99.7% of results will fall within M ± 3sd given no deterioration in method performance. An example is shown in Fig.1. The chart is constructed as follows:
• The y-axis is concentration, the x-axis time (that is date of analysis) • The mean laboratory control standard value M is plotted as a line (“mean”) • Two warning limits are plotted as lines at M ± 2sd (“2SD”) • Two Action limits are plotted as lines at M ± 3sd (“3SD”) • The laboratory control standard nominal value may be plotted as a line
(“value”). As laboratory control sample results become available, they are plotted individually and consecutively against date of analysis. They shall not be averaged before plotting. As they are plotted, control rules to indicate a system failure include:
• one laboratory control Standard result outside the control chart action limit • two consecutive laboratory control Standard results outside the control chart
warning limit In addition, nine successive laboratory control Standard results on the same side of the chart mean could indicate a change in the bias of the analytical system, and should be investigated. However, this may be due to a small insignificant change and laboratories should use other methods of identifying significant changes in bias. For example, if a number of control standards are measured in each analytical batch of a high throughput method, then the average value can be plotted to monitor bias only.
MCERTS chemical testing of soil Version 5 December 2018 32 of 39

However, a separate chart of individual values shall still be required for control of precision. Fig 1 A Shewhart control chart
Control Chart
197.8814 200.9924
213.4362 216.5472
207.2143
190
195
200
205
210
215
220
2/2/05 3/2/05 4/2/05 5/2/05 6/2/05 7/2/05 8/2/05 9/2/05 10/2/05 11/2/05 12/2/05 13/2/05 14/2/05 15/2/05 16/2/05 17/2/05 18/2/05 19/2/05 20/2/05 21/2/05 22/2/05 23/2/05 24/2/05 25/2/05 26/2/05 27/2/05 28/2/05 1/3/05 2/3/05 3/3/05 4/3/05 5/3/05 6/3/05 7/3/05 8/3/05 9/3/05 10/3/05
199 MN_CL Manganese mg/kg
Date Printed: 02/02/2005 std value: 204.84
- 3 sd - 3 sd - 2 sd - 2 sd
value value mean mean
+ 2 sd + 2 sd + 3 sd + 3 sd
Control Chart
197.9 201
213.4 216.5
207.2
190
195
200
205
210
215
220
2/2/05 3/2/05 4/2/05 5/2/05 6/2/05 7/2/05 8/2/05 9/2/05 10/2/05 11/2/05 12/2/05 13/2/05 14/2/05 15/2/05 16/2/05 17/2/05 18/2/05 19/2/05 20/2/05 21/2/05 22/2/05 23/2/05 24/2/05 25/2/05 26/2/05 27/2/05 28/2/05 1/3/05 2/3/05 3/3/05 4/3/05 5/3/05 6/3/05 7/3/05 8/3/05 9/3/05 10/3/05
199 MN_CL Manganese mg/kg
Date Printed: 02/02/2005 std value: 204.84
- 3 sd - 3 sd - 2 sd - 2 sd
value value mean mean
+ 2 sd + 2 sd + 3 sd + 3 sd
As further data are obtained, a new chart should be produced based on the latest 60-100 results (depending on frequency of analysis), giving a new and more robust estimate of M and sd. If any of the data points have breached the control rules and a cause is assigned (for example use of wrong standard, air in flow-cell etc.), then it should not be used. However, since some legitimate results, which are part of the normal distribution, will breach the limits, then these should be used where no specific reason for the breach can be assigned. The precision and bias shall not be allowed to exceed targets given in Annex A of this performance standard for a given parameter. If required, statistical significance tests should be applied (see Annex B). A senior member of staff shall review AQC performance on a regular basis. The timescale will depend on frequency of analysis. All significant changes should be investigated, even if precision and bias are still within the MCERTS targets. If a statistically significant change has occurred, then the new values are used in the control rules, and new control limits should established and drawn on the control chart. If no significant changes are detected then no changes should be made. At least annually, mean and standard deviation values should be estimated from new data and should be checked to see if any significant changes have occurred. If necessary, the significance of a change in precision (as standard deviation) can be tested using an F test at the 95% confidence level, and if the mean has changed significantly using a student's t test, again at the 95% confidence level (see Annex B). The targets given in Annex A of the MCERTS standard for a given parameter shall not be statistically significantly exceeded, but all significant changes should be investigated, even if precision and bias are still within the MCERTS requirements. If
MCERTS chemical testing of soil Version 5 December 2018 33 of 39

the MCERTS targets are significantly exceeded and cannot be corrected, then a statistically significant change in performance has occurred, and it will be necessary to re-validate the analytical method. C3 Reporting Results associated with failed AQC samples shall not be reported as MCERTS accredited results. In some circumstances customers may request that results be released. Whenever results associated with failed AQC are required by the customer they should only be issued under the direct authority of an appropriate manager. Any report issued, which contains results associated with failed AQC samples shall include a printed disclaimer as to this effect.
MCERTS chemical testing of soil Version 5 December 2018 34 of 39

Annex D (informative): Estimation of soil organic matter (SOM) The Environment Agency has published soil guideline values (SGVs) to aid the risk assessment of contaminated land. SGVs for contaminant organic compounds such as toluene, ethylbenzene and phenol address the fact that these compounds tend to adsorb onto soil organic matter (SOM), and so plant uptake and volatilisation to air are reduced. As SOM increases less contaminant is available for these exposure pathways. The SGV calculated for these compounds therefore varies with the SOM, the higher the SOM the higher the SGV. It follows therefore that SOM needs to be estimated. The Environment Agency considers that the most appropriate way to proceed is to measure the fraction of organic carbon (foc) and then calculate an estimate of the SOM. The definition of SOM used in the CLEA model is: %SOM = foc x (100/0.58) This assumes that SOM has a carbon content of 58%. A method of estimation of foc is via the determination of total organic carbon (TOC) after prior removal of inorganic carbon with acid by dry combustion at 900°C, and measurement of released carbon dioxide. This does not preclude other appropriate analytical methods. foc = TOC x 10-6 where TOC is expressed in units of mg/kg
∴ %SOM = TOC / 0.58 where TOC is expressed as a percentage
An estimate of SOM can also be obtained from the loss on ignition method. However, laboratories will need to develop a conversion factor that will depend on the matrix of the soil being analysed and the temperature of ignition.
MCERTS chemical testing of soil Version 5 December 2018 35 of 39

Annex E (normative): Accreditation of hydrocarbon banding E1 Introduction Many laboratories have obtained accreditation for TPH (total petroleum hydrocarbons) or EPH (extractable petroleum hydrocarbons). However, reporting of petroleum hydrocarbon concentrations in soils using bands that are defined by carbon number is becoming increasingly important for contaminated land assessment. Note 1: The term EPH is often used to describe the fraction C10 to C40, and VPH
(volatile petroleum hydrocarbons) the fraction C6 to <C10 and the sum of the two fractions being reported as TPH. This convention is not strictly adhered to and some laboratories quote different ranges. It is not the purpose of this document to define these terms or fractions or how these fractions are divided into specific bands. Laboratory methods and their associated scopes should do this. The requirements of the Environment Agency will be stated elsewhere.
Note 2: TPH analysis is usually performed on an as received sample, rather than a dried and crushed sample, to minimise loses of the volatile fraction.
E2 Validation E2.1 Hydrocarbon banding (without separation into aliphatic and aromatic
fractions) A laboratory requiring accreditation for hydrocarbon banding without separation into aliphatic and aromatic fractions shall use the following procedure:
• The bands that are reported will contain both aliphatic and aromatic hydrocarbons.
• The beginning and end for integration of each band shall be defined by running a mixture that contains n-alkanes (straight chain, unsaturated hydrocarbons) with carbon numbers whose range covers the bands defined in the method.
Note: It is not acceptable to report bands to odd carbon numbers using solely even numbered hydrocarbons.
• A minimum of three soil matrices shall be used in the validation.
• If available and appropriate, matrix CRMs shall be used.
• The performance characteristics shall be determined with a minimum of 10 degrees of freedom by analysing batches of duplicates. If CRMs are not available, each matrix should be spiked at two significantly different but appropriate concentration levels, for example, at 20 % and 80 % of the range of the method, using a spike composed predominantly of a mixture of petroleum hydrocarbon fractions to ensure that there are adequate amounts of appropriate hydrocarbons in each of the bands for which accreditation is sought. This oil mixture may be fortified with n-alkanes or PAHs if necessary but use of a spike containing individual n-alkanes or PAHs alone or containing predominantly individual n-alkanes or PAHs alone is inappropriate and shall not be used.
• Soil matrices should be extracted, analysed and the resulting chromatogram interpreted using the method for which accreditation is sought.
MCERTS chemical testing of soil Version 5 December 2018 36 of 39

Performance targets:
• The precision of the method for the sum of the bands shall not significantly exceed 15% and the bias of the method for the sum of the bands shall not significantly exceed 30%.
• The precision of the method for each individual band shall not significantly exceed 15%.
E2.2 Aliphatic and aromatic fractions and subsequent banding The validation protocol is exactly the same as that outlined in E2.1 above and the performance targets are as follows:
• If total TPH is derived from summing the aliphatic and aromatic fractions, or the bands of those fractions, then the precision of the method for the sum of the bands shall not significantly exceed 15% and the bias of the method for the sum of the bands shall not significantly exceed 30%.
• The precision for the aromatic and aliphatic fractions shall not significantly exceed 15%.
• The precision of the method for each individual band shall not significantly exceed 15%.
In this case the precision obtained by laboratories for each band will be reviewed and changed if deemed necessary. Accreditation for banding and splitting into aliphatic and aromatic fractions and subsequent banding will only be granted if each and all of the bands within the range defined by ‘total’ EPH/TPH can be shown to meet the specified targets. E2.3 Limit of Detection (see also Annex B1) A soil containing a small but detectable amount of the parameter of interest shall be analysed for determining the limit of detection for TPH [total, aromatic/aliphatic split and banded] in soils. This sample can be prepared by spiking. The low spiking solution for LoD estimation should use a spike composed predominantly of a mixture of petroleum hydrocarbon fractions ensuring that there are adequate [but not greater than 5 times the resulting LOD] amounts of appropriate hydrocarbons in each of the bands for which accreditation is sought. This oil mixture should be the same as that used for the spiking experiments and may be fortified with n-alkanes or PAHs if necessary. Use of a spike containing individual n-alkanes or PAHs alone or containing predominantly individual n-alkanes or PAHs alone is inappropriate and shall not be used. The low spiked sample shall be put through the entire analytical process (including, as necessary, drying, grinding, extraction, clean-up and measurement). The extraction and measurement of blank solutions based only on solvent or reagent blanks is not sufficient for estimating LODs for the purpose of satisfying MCERTS requirements. The low spiked samples shall be processed in the same manner and using the same equipment as other samples. The limit of detection shall be calculated as described in Annex B1.
MCERTS chemical testing of soil Version 5 December 2018 37 of 39

E3 Quality assurance for hydrocarbon banding; aliphatic and aromatic split and subsequent banding
E3.1 Quality control AQC samples shall be representative soils spiked at an appropriate level with an oil mixture as described in the validation protocol. This shall be extracted and analysed, a minimum of 1 sample in every 20 samples shall be an AQC sample. AQC performance targets are 15% for precision and 30% for bias. With respect to the evaluation of AQC results obtained the minimum that is expected is outlined in Diagram 1. Note: The frequency at which AQC data is monitored (where plotting is not
mandatory) is at the discretion of the laboratory. However, if at the monitoring/review stage laboratories find that the targets have not been met any associated results shall be treated as non-conforming work that may necessitate the re-issuing of reports. If a laboratory wishes to plot for all AQCs analysed, this is acceptable.
Diagram 1
For AQC data required to be plotted it shall be plotted on a chart and the statistical acceptance rules as detailed in Annex C shall be followed. For AQC data required to be monitored, AQC samples shall include the parameters of interest and AQC results shall be recorded. Performance of monitored AQC shall be reviewed as part of
AROMATIC (Total) Plot AQC Data
TPH (Total) Plot AQC Data
TPH (Bands) Monitor AQC Data
ALIPHATIC (Total) Plot AQC Data
AROMATIC (Bands)
Monitor AQC Data
ALIPHATIC (Bands)
Monitor AQC Data
MCERTS chemical testing of soil Version 5 December 2018 38 of 39

regular AQC performance review and precision and bias shall not statistically exceed the targets given in this Annex. E3.2 System suitability Where splitting into aliphatic and aromatic fractions is performed there are additional requirements with respect to system suitability checks to ensure adequate separation column efficiency. With every batch of new column material a synthetic aliphatic and aromatic mixture shall be separated and analysed. This mixture shall cover the range of hydrocarbons analysed and shall be composed of aliphatic and aromatic components. A full range of hydrocarbons shall be present in the mixture and shall include critical compounds in each fraction (such as naphthalene, decane and corresponding compounds in the C30- C40 range). Recoveries for the aliphatic and aromatic fractions shall be estimated concurrently with the method validation, and used to set limits for subsequent analysis. As a minimum, records of the recovery of the critical compounds in each fraction shall be maintained.
LIT 6625
MCERTS chemical testing of soil Version 5 December 2018 39 of 39