performance task framework - · pdf fileoral presentation-content: ... midterm exam pm #2: see...
TRANSCRIPT

© Pennsylvania Department of Education
Template #5-Performance Task Framework–May 2014 1
PERFORMANCE TASK FRAMEWORK
This template is used to organize performance tasks used in the SLO process. [OPTIONAL]
Performance Measure
a. Performance
Measure Name Function Family Project
SLO Alignment
b. Class/Course Title Honors Precalculus c. Grade(s)/
Level 10-12
d. PA Standards
CC.2.2.HS.D.4
Understand the relationship between zeros and factors of polynomials to make
generalizations about functions and their graphs.
CC.2.2.HS.C.1
Use the concept and notation of functions to interpret and apply them in terms of their
context.
CC.2.2.HS.C.2
Graph and analyze functions and use their properties to make connections between the
different representations.
CC.2.2.HS.C.3
Write functions or sequences that model relationships between two quantities.
CC.2.2.HS.C.4
Interpret the effects transformations have on functions and find the inverses of functions.
CC.2.2.HS.C.6
Interpret functions in terms of the situation they model.
e. Performance
Measure Purpose
This project is designed to have students explore and explain all facets (domain, range,
transformations, combinations, compositions and applications) of a family of functions of
their choosing and based on the types of functions that were studied during the semester:
polynomial, rational, exponential and logarithmic.
Section 1. Administration (Teacher)
1a. Administration
Frequency Once, near the end of the first semester
1b.
Unique Task
Adaptations/
Accommodations
All Accommodations will be handled on an individual basis as required. Additional time
will be available for all students to produce a quality product.
1c. Resources/
Equipment Laptops, external headsets and microphones as needed
Section 2. Process (Student)
2a. Task Scenarios
A variety of functions and their characteristics have been studied this semester. Each
function has a function family that retains the characteristics of the function. For this
project, your team must select a function, create a function family and explain all of the
critical components that were discussed during the semester (see the rubric). The
presentation will be conducted for the entire class, and can be designed using the tool of
your choice. The presentation will also be made available on the class wiki so that all can
review prior to the midterm exam.
© Pennsylvania Department of Education
Template #5-Performance Task Framework–May 2014 2
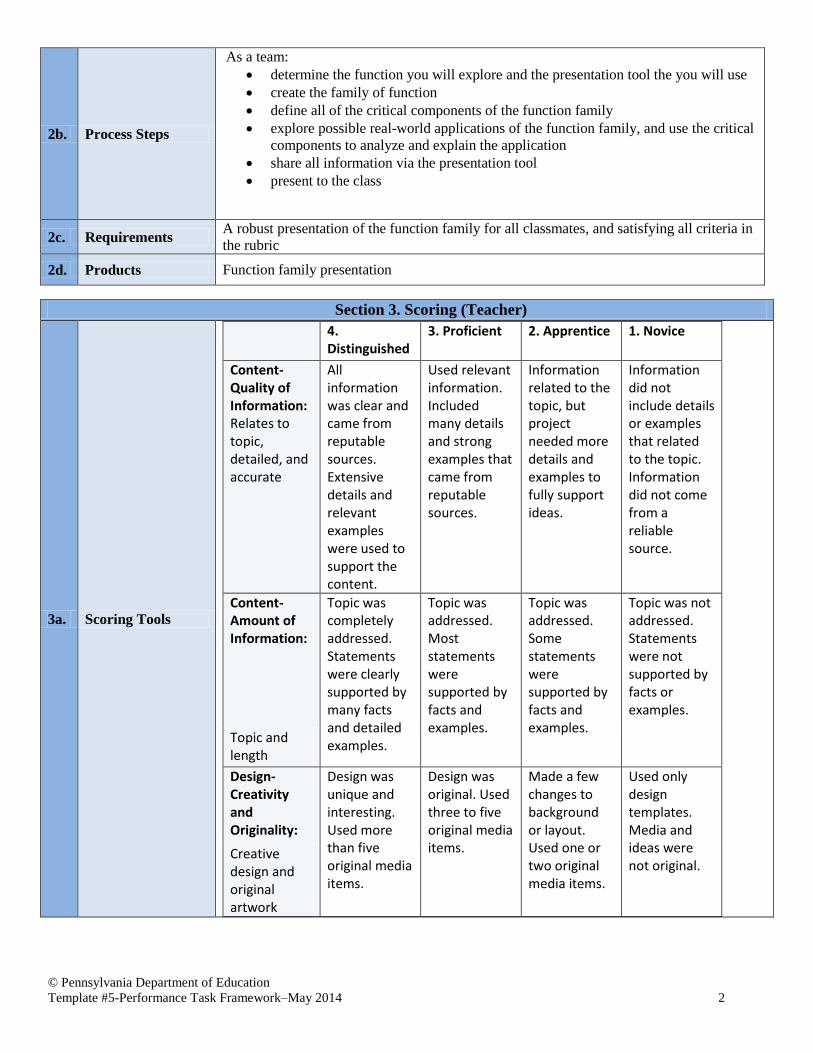
2b. Process Steps
As a team:
determine the function you will explore and the presentation tool the you will use
create the family of function
define all of the critical components of the function family
explore possible real-world applications of the function family, and use the critical
components to analyze and explain the application
share all information via the presentation tool
present to the class
2c. Requirements A robust presentation of the function family for all classmates, and satisfying all criteria in
the rubric
2d. Products Function family presentation
Section 3. Scoring (Teacher)
3a. Scoring Tools
4. Distinguished
3. Proficient 2. Apprentice 1. Novice
Content-Quality of Information: Relates to topic, detailed, and accurate
All information was clear and came from reputable sources. Extensive details and relevant examples were used to support the content.
Used relevant information. Included many details and strong examples that came from reputable sources.
Information related to the topic, but project needed more details and examples to fully support ideas.
Information did not include details or examples that related to the topic. Information did not come from a reliable source.
Content-Amount of Information:
Topic was completely addressed. Statements were clearly supported by many facts and detailed examples.
Topic was addressed. Most statements were supported by facts and examples.
Topic was addressed. Some statements were supported by facts and examples.
Topic was not addressed. Statements were not supported by facts or examples.
Topic and length
Design-Creativity and Originality:
Design was unique and interesting. Used more than five original media items.
Design was original. Used three to five original media items.
Made a few changes to background or layout. Used one or two original media items.
Used only design templates. Media and ideas were not original.
Creative design and original artwork
© Pennsylvania Department of Education
Template #5-Performance Task Framework–May 2014 3
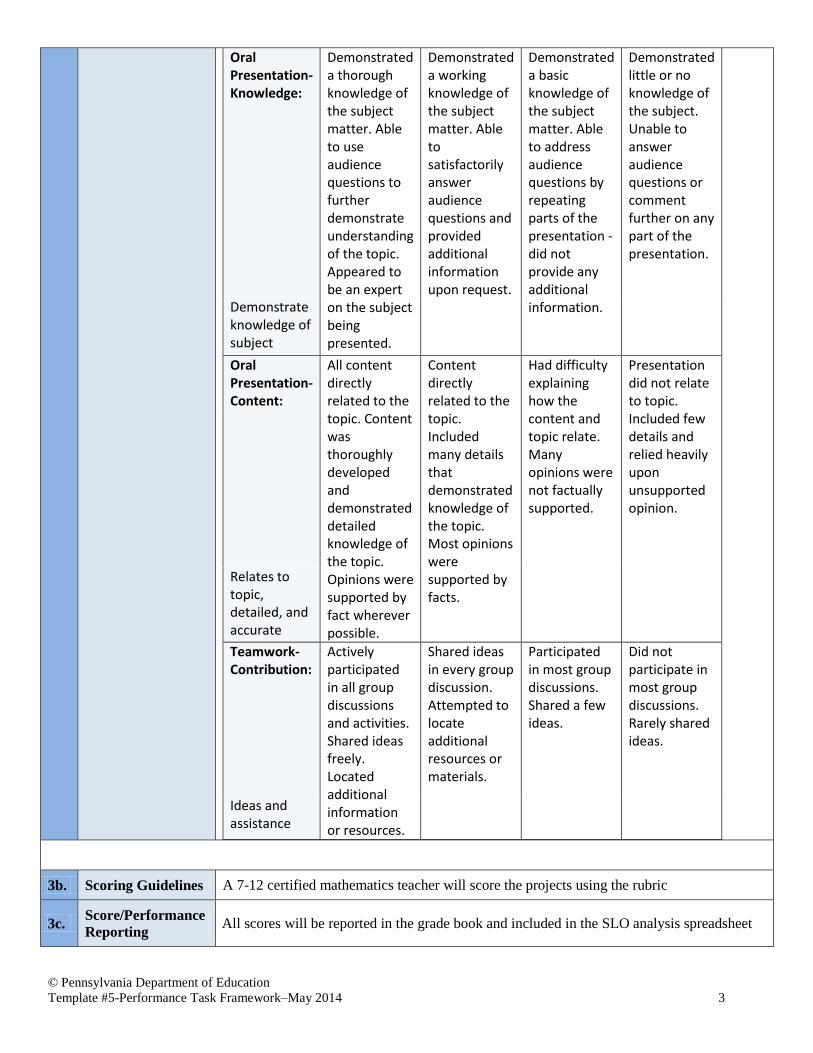
Oral Presentation-Knowledge:
Demonstrated a thorough knowledge of the subject matter. Able to use audience questions to further demonstrate understanding of the topic. Appeared to be an expert on the subject being presented.
Demonstrated a working knowledge of the subject matter. Able to satisfactorily answer audience questions and provided additional information upon request.
Demonstrated a basic knowledge of the subject matter. Able to address audience questions by repeating parts of the presentation - did not provide any additional information.
Demonstrated little or no knowledge of the subject. Unable to answer audience questions or comment further on any part of the presentation.
Demonstrate knowledge of subject
Oral Presentation-Content:
All content directly related to the topic. Content was thoroughly developed and demonstrated detailed knowledge of the topic. Opinions were supported by fact wherever possible.
Content directly related to the topic. Included many details that demonstrated knowledge of the topic. Most opinions were supported by facts.
Had difficulty explaining how the content and topic relate. Many opinions were not factually supported.
Presentation did not relate to topic. Included few details and relied heavily upon unsupported opinion.
Relates to topic, detailed, and accurate
Teamwork-Contribution:
Actively participated in all group discussions and activities. Shared ideas freely. Located additional information or resources.
Shared ideas in every group discussion. Attempted to locate additional resources or materials.
Participated in most group discussions. Shared a few ideas.
Did not participate in most group discussions. Rarely shared ideas.
Ideas and assistance
3b. Scoring Guidelines A 7-12 certified mathematics teacher will score the projects using the rubric
3c. Score/Performance
Reporting All scores will be reported in the grade book and included in the SLO analysis spreadsheet

© Pennsylvania Department of Education
Template #4-SLO Process Template – May 2014
STUDENT LEARNING OBJECTIVE (SLO) PROCESS TEMPLATE SLO is a process to document a measure of educator effectiveness based on student achievement of content standards. SLOs are a
part of Pennsylvania’s multiple-measure, comprehensive system of Educator Effectiveness authorized by Act 82 (HB 1901).
1. Classroom Context
1a. Name Trixie Trigonometry 1b. School Pythagoras HS 1c. District STEM
1d. Class/
Course Title Honors Precalculus
1e. Grade
Level 10-12
1f. Total # of
Students 31
1g. Typical
Class Size 28-35
1h. Class
Frequency
Daily for entire
school year 1i. Typical
Class Duration 50 minutes
2. SLO Goal
2a. Goal Statement
Students will demonstrate an understanding of families of functions and behaviors that can be
recognized across representations. Functions will be transformed, combined, and composed
to create new functions in mathematical and real world situations.
2b. PA Standards
CC.2.2.HS.D.4
Understand the relationship between zeros and factors of polynomials to make
generalizations about functions and their graphs.
CC.2.2.HS.C.1
Use the concept and notation of functions to interpret and apply them in terms of their
context.
CC.2.2.HS.C.2
Graph and analyze functions and use their properties to make connections between the
different representations.
CC.2.2.HS.C.3
Write functions or sequences that model relationships between two quantities.
CC.2.2.HS.C.4
Interpret the effects transformations have on functions and find the inverses of functions.
CC.2.2.HS.C.6
Interpret functions in terms of the situation they model.
CC.2.2.HS.C.8
Choose trigonometric functions to model periodic phenomena and describe the properties of
the graphs.
2c. Rationale Students must be able to make connections between different types of functions so that they
can apply and interpret functional relationships that occur in the real world.
Ratings Indicators Measures Goal Context

© Pennsylvania Department of Education
Template #4-SLO Process Template – May 2014
3. Performance Measures (PM)
3a.
Name
PM #1: Constructed Response Items on
Midterm Exam
PM #2: Function Family Project
PM #3: Constructed Response Items 1-3 on
Final Exam
PM #4:
PM #5:
3b.
Type
District-designed Measures and Examinations
Nationally Recognized Standardized Tests
Industry Certification Examinations
Student Projects
Student Portfolios
Other:___________________________
3c.
Purpose
PM #1: See Performance Task Framework for
Midterm Exam
PM #2: See Performance Task Framework for
Function Family Project
PM #3: See Performance Task Framework for
Final Exam
PM #4:
PM #5:
3d.
Metric
Growth (change in student performance across
two or more points in time)
Mastery (attainment of a defined level of
achievement)
Growth and Mastery
3e.
Administration
Frequency
PM #1: Once in January
PM #2: Once in December/January
(near the end of the first semester)
PM #3: Once in May/June
PM #4:
PM #5:
3f.
Adaptations/
Accommodations
IEP
ELL
Gifted IEP
Other (504)
3g.
Resources/
Equipment
PM #1: Exams
PM #2: Laptop cart, external headsets
and microphones
PM #3: Exams
PM #4:
PM #5:
3h.
Scoring Tools
PM #1: District approved scoring
key with point distributions
PM #2: Scoring Rubric
PM #3: District approved scoring
key with point distributions
PM #4:
PM #5:
3i.
Administration
& Scoring
Personnel
PM #1: 7-12 certified math teacher
PM #2: 7-12 certified math teacher
PM #3: 7-12 certified math teacher
PM #4:
PM #5:
3j.
Performance
Reporting
PM #1: Data will be managed in a
spreadsheet
PM #2: Data will be managed in a
spreadsheet
PM #3: Data will be managed in a
spreadsheet
PM #4:
PM #5:

© Pennsylvania Department of Education
Template #4-SLO Process Template – May 2014
4. Performance Indicators (PI)
4a.
PI Targets:
All Student Group
PI Target #1: Students will score at least 37/50 points on the Constructed Response Items on
the Midterm Exam
PI Target #2: Students will score 3 or greater in at least 4 of the 6 categories of the Function
Family project rubric
PI Target #3: Students will score at least 15/20 points on the first 3 Constructed Response
Items on the Final Exam
PI Target #4:
PI Target #5:
4b.
PI Targets:
Focused Student Group
(optional)
PI Target #1:
PI Target #2:
PI Target #3:
PI Target #4:
PI Target #5:
4c.
PI Linked
(optional)
4d.
PI Weighting
(optional)
PI Weight
#1
#2
#3
#4
#5
5. Elective Rating
5a. Level
Failing 0% to 59% of
students will meet the
PI targets.
Needs Improvement
60% to 74% of
students will meet the
PI targets.
Proficient
75% to 89% of
students will meet the
PI targets.
Distinguished
90% to 100% of
students will meet the
PI targets.
Teacher Signature _________________________Date______ Evaluator Signature _____________________Date______
5b. Rating
Distinguished (3)
Proficient (2)
Needs Improvement (1)
Failing (0)
Notes/Explanation
Teacher Signature _________________________Date______ Evaluator Signature _____________________Date______
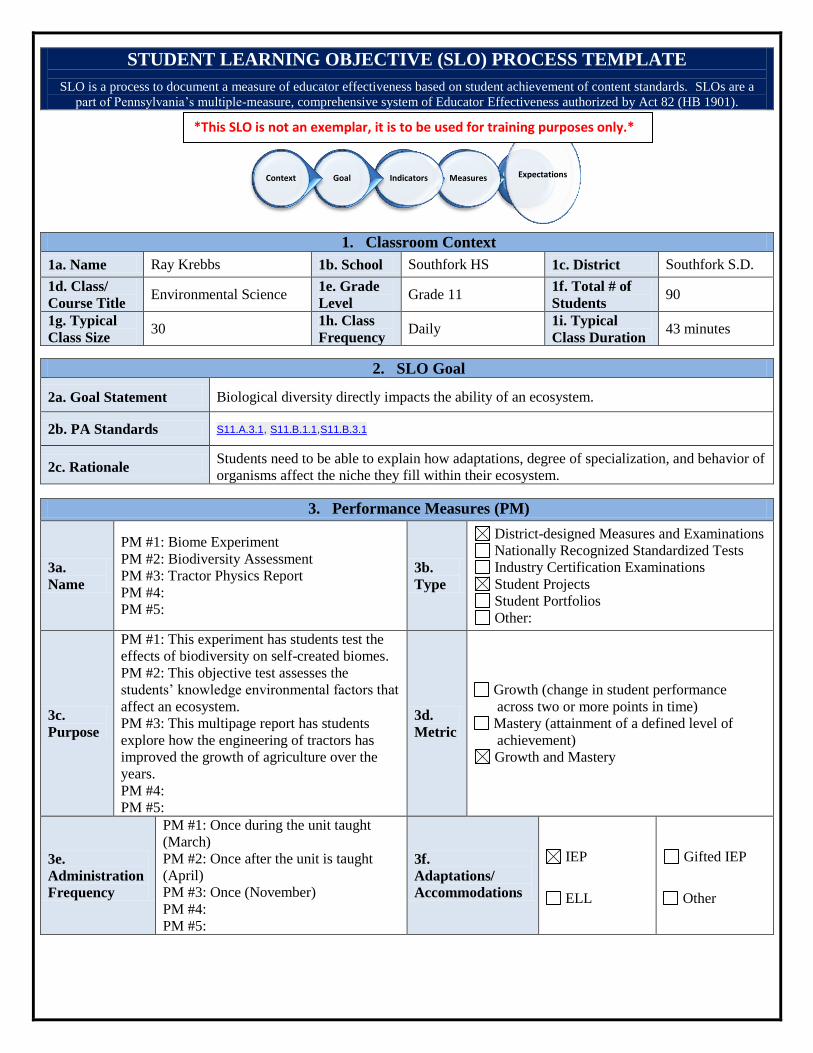
STUDENT LEARNING OBJECTIVE (SLO) PROCESS TEMPLATE
SLO is a process to document a measure of educator effectiveness based on student achievement of content standards. SLOs are a
part of Pennsylvania’s multiple-measure, comprehensive system of Educator Effectiveness authorized by Act 82 (HB 1901).
1. Classroom Context
1a. Name Ray Krebbs 1b. School Southfork HS 1c. District Southfork S.D.
1d. Class/
Course Title Environmental Science
1e. Grade
Level Grade 11
1f. Total # of
Students 90
1g. Typical
Class Size 30
1h. Class
Frequency Daily
1i. Typical
Class Duration 43 minutes
2. SLO Goal
2a. Goal Statement Biological diversity directly impacts the ability of an ecosystem.
2b. PA Standards S11.A.3.1, S11.B.1.1,S11.B.3.1
2c. Rationale Students need to be able to explain how adaptations, degree of specialization, and behavior of
organisms affect the niche they fill within their ecosystem.
3. Performance Measures (PM)
3a.
Name
PM #1: Biome Experiment
PM #2: Biodiversity Assessment
PM #3: Tractor Physics Report
PM #4:
PM #5:
3b.
Type
District-designed Measures and Examinations
Nationally Recognized Standardized Tests
Industry Certification Examinations
Student Projects
Student Portfolios
Other:
3c.
Purpose
PM #1: This experiment has students test the
effects of biodiversity on self-created biomes.
PM #2: This objective test assesses the
students’ knowledge environmental factors that
affect an ecosystem.
PM #3: This multipage report has students
explore how the engineering of tractors has
improved the growth of agriculture over the
years.
PM #4:
PM #5:
3d.
Metric
Growth (change in student performance
across two or more points in time)
Mastery (attainment of a defined level of
achievement)
Growth and Mastery
3e.
Administration
Frequency
PM #1: Once during the unit taught
(March)
PM #2: Once after the unit is taught
(April)
PM #3: Once (November)
PM #4:
PM #5:
3f.
Adaptations/
Accommodations
IEP
ELL
Gifted IEP
Other
Expectations Measures Indicators Goal Context
*This SLO is not an exemplar, it is to be used for training purposes only.*
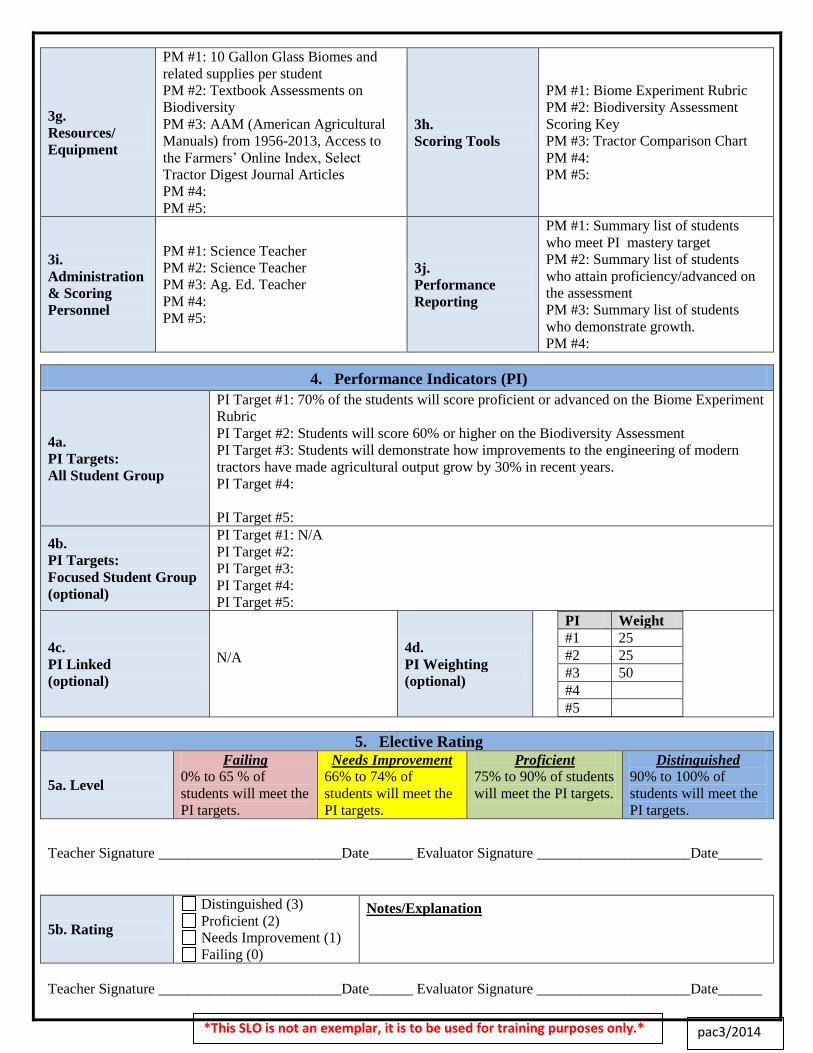
3g.
Resources/
Equipment
PM #1: 10 Gallon Glass Biomes and
related supplies per student
PM #2: Textbook Assessments on
Biodiversity
PM #3: AAM (American Agricultural
Manuals) from 1956-2013, Access to
the Farmers’ Online Index, Select
Tractor Digest Journal Articles
PM #4:
PM #5:
3h.
Scoring Tools
PM #1: Biome Experiment Rubric
PM #2: Biodiversity Assessment
Scoring Key
PM #3: Tractor Comparison Chart
PM #4:
PM #5:
3i.
Administration
& Scoring
Personnel
PM #1: Science Teacher
PM #2: Science Teacher
PM #3: Ag. Ed. Teacher
PM #4:
PM #5:
3j.
Performance
Reporting
PM #1: Summary list of students
who meet PI mastery target
PM #2: Summary list of students
who attain proficiency/advanced on
the assessment
PM #3: Summary list of students
who demonstrate growth.
PM #4:
4. Performance Indicators (PI)
4a.
PI Targets:
All Student Group
PI Target #1: 70% of the students will score proficient or advanced on the Biome Experiment
Rubric
PI Target #2: Students will score 60% or higher on the Biodiversity Assessment
PI Target #3: Students will demonstrate how improvements to the engineering of modern
tractors have made agricultural output grow by 30% in recent years.
PI Target #4:
PI Target #5:
4b.
PI Targets:
Focused Student Group
(optional)
PI Target #1: N/A
PI Target #2:
PI Target #3:
PI Target #4:
PI Target #5:
4c.
PI Linked
(optional)
N/A
4d.
PI Weighting
(optional)
PI Weight
#1 25
#2 25
#3 50
#4
#5
5. Elective Rating
5a. Level
Failing 0% to 65 % of
students will meet the
PI targets.
Needs Improvement
66% to 74% of
students will meet the
PI targets.
Proficient
75% to 90% of students
will meet the PI targets.
Distinguished
90% to 100% of
students will meet the
PI targets.
Teacher Signature _________________________Date______ Evaluator Signature _____________________Date______
5b. Rating
Distinguished (3)
Proficient (2)
Needs Improvement (1)
Failing (0)
Notes/Explanation
Teacher Signature _________________________Date______ Evaluator Signature _____________________Date______
*This SLO is not an exemplar, it is to be used for training purposes only.* pac3/2014

STUDENT LEARNING OBJECTIVE (SLO) PROCESS TEMPLATE
SLO is a process to document a measure of educator effectiveness based on student achievement of content standards. SLOs are a
part of Pennsylvania’s multiple-measure, comprehensive system of Educator Effectiveness authorized by Act 82 (HB 1901).
1. Classroom Context
1a. Name Jeremy Wendell 1b. School Westar Middle Sch 1c. District Southfork S.D.
1d. Class/
Course Title Math 7
1e. Grade
Level Grade 7
1f. Total # of
Students 32
1g. Typical
Class Size 30
1h. Class
Frequency Daily
1i. Typical
Class Duration 42 minutes
2. SLO Goal
2a. Goal Statement Numerical measures describe the center and spread of numerical data.
2b. PA Standards
2c. Rationale The collection, analysis, organization, and interpretation of data help students to answer real
world questions.
3. Performance Measures (PM)
3a.
Name
PM #1: Data Set Research Presentation
PM #2: Basic Skills Test
PM #3: Homework
PM #4:
PM #5:
3b.
Type
District-designed Measures and Examinations
Nationally Recognized Standardized Tests
Industry Certification Examinations
Student Projects
Student Portfolios
Other: Homework
3c.
Purpose
PM #1: Students conduct a research project
and share their data via different mathematical
data representations
PM #2: To test students’ ability to perform
basic mathematical operations
PM #3: To check for daily understanding
PM #4:
PM #5:
3d.
Metric
Growth (change in student performance
across two or more points in time)
Mastery (attainment of a defined level of
achievement)
Growth and Mastery
3e.
Administration
Frequency
PM #1: Once (April)
PM #2: Twice (March, May) before and
after Numerical Measures unit
PM #3: Daily
PM #4:
PM #5:
3f.
Adaptations/
Accommodations
IEP
ELL
Gifted IEP
Other
3g.
Resources/
Equipment
PM #1: Mathexpress Program
PM #2: N/A
PM #3: N/A
PM #4:
PM #5:
3h.
Scoring Tools
PM #1: Presentation Rubric
PM #2: Test Scoring Key
PM #3: HW Answer Keys
PM #4:
PM #5:
Expectations Measures Indicators Goal Context
*This SLO is not an exemplar, it is to be used for training purposes only.*

3i.
Administration
& Scoring
Personnel
PM #1: Math Certified Teacher
PM #2: Math Certified Teacher
PM #3: Peer Students
PM #4:
PM #5:
3j.
Performance
Reporting
PM #1: Summary Report of
Proficient/Advanced PIs
PM #2: Summary Report of Growth
PM #3: Homework Summary Report
PM #4:
4. Performance Indicators (PI)
4a.
PI Targets:
All Student Group
PI Target #1: All students will score Needs Improvement or higher on the Data Set Research
Presentation rubric
PI Target #2: All students will show 10 point growth from first to second administration of
the Basic Skills Test.
PI Target #3: All students will complete homework 90% of the time it is given.
PI Target #4:
PI Target #5:
4b.
PI Targets:
Focused Student Group
(optional)
PI Target #1: N/A
PI Target #2:
PI Target #3:
PI Target #4:
PI Target #5:
4c.
PI Linked
(optional)
N/A
4d.
PI Weighting
(optional)
PI Weight
#1 35
#2 25
#3 35
#4
#5
5. Elective Rating
5a. Level
Failing 0% to 69 % of
students will meet the
PI targets.
Needs Improvement
70% to 79% of
students will meet the
PI targets.
Proficient
80% to 89% of students
will meet the PI targets.
Distinguished
90% to 100% of
students will meet the
PI targets.
Teacher Signature _________________________Date______ Evaluator Signature _____________________Date______
5b. Rating
Distinguished (3)
Proficient (2)
Needs Improvement (1)
Failing (0)
Notes/Explanation
Teacher Signature _________________________Date______ Evaluator Signature _____________________Date______
*This SLO is not an exemplar, it is to be used for training purposes only.*
pac3/2014