performing arts market center theater reuse centerville
TRANSCRIPT

City of Fremont Performing Arts Market Center Theater Reuse
Centerville Fire Station
FINAL REPORT MAY 2009
AMS Planning & Research 915 D Street
Petaluma, CA 94952 707.778.8445
http://AMS-online.com

Fremont Performing Arts Market / Center Theater Reuse / Centerville Fire Station Study Final Report
May, 2009
Table of Contents
I. INTRODUCTION ............................................................................................ 1 Background ............................................................................................................................................ 1 Research Summary ................................................................................................................................ 3
II. PERFORMING ARTS MARKET STUDY ....................................................... 5 Market Assessment ............................................................................................................................... 5 Regional versus Local Performing Arts Center ..............................................................................11 Competitive Analysis ..........................................................................................................................12 Use Analysis .........................................................................................................................................15 Performing Arts Center Building Programs ....................................................................................16 Needs Assessment ...............................................................................................................................18 Performing Arts Center Sites.............................................................................................................19
III. CENTER THEATER REUSE STUDY ......................................................... 21 Center Theater .....................................................................................................................................21 Centerville .............................................................................................................................................21 Center for Investment in the Arts Project ......................................................................................22 Film, Food, & Arts Venue .................................................................................................................24
IV. CENTERVILLE FIRE STATION STUDY ................................................... 36 Building Assessment ...........................................................................................................................36 Potential Uses .......................................................................................................................................36
V. RECOMMENDED NEXT STEPS ................................................................ 38 APPENDIX A: PERSONS CONTACTED ................................................................ 39 APPENDIX B: ORGANIZATIONS RECEIVING SURVEY ................................... 40 APPENDIX C: DEMOGRAPHIC SUMMARY ......................................................... 41

Fremont Performing Arts Market / Center Theater Reuse / Centerville Fire Station Study Final Report
May, 2009
Table of Figures
Figure 1: Centerville ............................................................................................................................. 2 Figure 2: Center Theater ..................................................................................................................... 3 Figure 3: Market Area Map ................................................................................................................. 6 Figure 4: Market Area Key Demographics....................................................................................... 8 Figure 5: Market Potential Indices ................................................................................................... 10 Figure 6: Regional Performing Arts Centers Surveyed ................................................................. 12 Figure 7: Local Performing Arts Centers Surveyed ...................................................................... 13 Figure 8: Regional Performing Arts Centers Service Areas ......................................................... 14 Figure 9: Local Performing Arts Center Service Area .................................................................. 15 Figure 10: Projected Use ................................................................................................................... 15 Figure 11: Site Criteria ....................................................................................................................... 16 Figure 12: Location Preferences ...................................................................................................... 16 Figure 13: Regional Performing Arts Space Program ................................................................... 17 Figure 14: Local Performing Arts Center Program....................................................................... 18 Figure 15: Bay Area Specialty Film Venues .................................................................................... 27 Figure 16: Center Theater ................................................................................................................. 31 Figure 17: Building Concept: Section .............................................................................................. 31 Figure 18: Building Concept: Ground Floor Plan ......................................................................... 32 Figure 19: Building Concept: Upper Floor Plan ............................................................................ 32 Figure 20: Project Cost Estimate ..................................................................................................... 34 Figure 21: Building Element Areas .................................................................................................. 34 Figure 22: Operating Forecast .......................................................................................................... 35 Figure 23: Centerville Fire Station ................................................................................................... 37
Fremont Performing Arts Market / Center Theater Reuse / Centerville Fire Station Study Final Report
May 2009 1
I. INTRODUCTION
Background
AMS Planning & Research was engaged by the City of Fremont’s Office of Housing & Redevelopment in October 2008 to address several questions related to the potential market for performing arts facilities in the City. Among the questions posed were:
• What is the market demand for a regional performing arts center and/or a local community performing arts venue?
• What venues are currently serving the area?
• What size and type of facilities would be recommended for Fremont?
• What location would be suitable? Proposed locations included:
o the Center Theater, on Fremont Boulevard in Centerville;
o Downtown Fremont, defined as the area between Fremont Boulevard, Paseo Padre Parkway, Mowry Avenue, and Walnut Avenue; and
o Central Park at Stevenson Boulevard and Paseo Padre Parkway.
AMS’s analysis of the market for such facilities is contained in Section II of this report.
In the course of our initial research, a business plan for performing arts at the Center Theater was provided by City staff. The plan, conducted by VenueTech Management Group of San Francisco and dated November 2007, outlined a program and building concept for the adaptive reuse of the Center Theater as a “Center for Investment in the Arts.” This concept involves the renovation of the theater for use as a 400 – 450-seat performance space, and the construction of a new building in the rear of the theater of about 10,000 square feet to house rehearsal, office, performer support, and production facilities. In addition to the scope of work described above, AMS was asked to conduct a “peer review” of the plan. Our analysis of the plan is presented in Section III of this report.
Following our analysis of the market for performing arts facilities in Fremont and our review of the concepts put forth for the Center Theater, AMS was asked to consider alternate uses for the Center Theater. Our research eventually focused on a “film & food” or “theater-pub” concept as one which may be viable in the Center Theater and would meet the goals of the City for the Centerville neighborhood. Descriptions of the

Fremont Performing Arts Market / Center Theater Reuse / Centerville Fire Station Study Final Report
May 2009 2
film & food concept and projections related to building and operations are contained in Section III of this report.
Finally, AMS was asked to consider the former Fremont Fire Station #6, also known as the Centerville Fire Station, located across Fremont Boulevard from the Center Theater. We analyzed the fire station’s current condition and determined what the building would require in order for it to be reused for a range of activities. The fire station analysis is presented in Section IV of this study.
Recommended next steps for the performing arts in Fremont, for the reuse of the Center Theater, and for the Centerville Fire Station appear in Section V of this report.
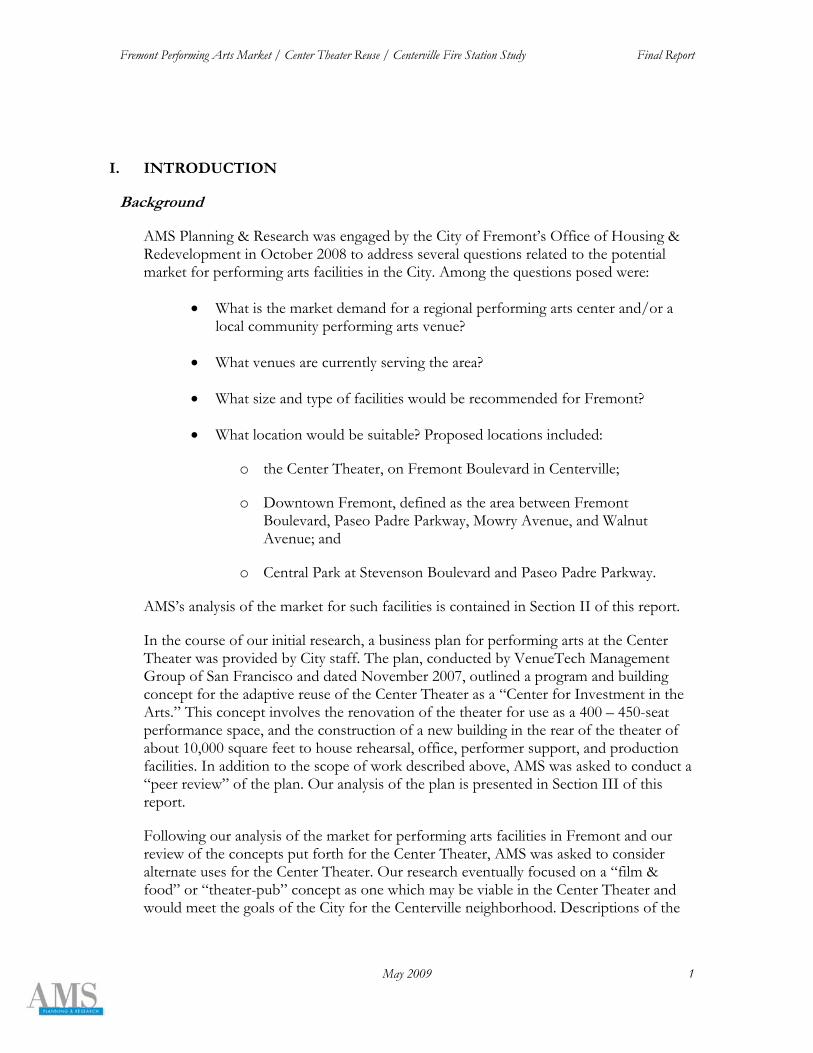
Figure 1: Centerville
Center Theater
Centerville Fire Station

Fremont Performing Arts Market / Center Theater Reuse / Centerville Fire Station Study Final Report
May 2009 3
Figure 2: Center Theater
Research Summary
In the course of this analysis, AMS undertook extensive research, all of which contributed to our overall knowledge of Fremont. Our research tasks and methodologies are described briefly below.
Interviews
AMS interviewed more than fifty individuals in Fremont, the Bay Area, and nationally. Those interviewed included: Fremont residents, Fremont’s elected leaders and staff, representatives of the arts community in Fremont, leaders of the South Asian, Afghani, Chinese, and Latino communities, and operators in the film exhibition and film & food industries. The context, perspectives, and information gained through these interviews were critical to all aspects of our study and conclusions.
Market Assessment
AMS conducted a market assessment for a primary market and trade area for the performing arts in Fremont, including demographics, market segmentation, and market potential analysis. Details on the methodology of this assessment and the results are included in Section II.
Competitive Analysis
AMS collected use and attendance data from twelve performing arts venues around the Bay Area that may be viewed as competitors. The conclusions from this analysis are presented in the Competitive Analysis portion of Section II of this report.

Fremont Performing Arts Market / Center Theater Reuse / Centerville Fire Station Study Final Report
May 2009 4
User Survey
AMS prepared and administered a survey of possible users of a potential performing arts facility in Fremont. Using lists of organizations gained from the Fremont Cultural Arts Council and the Alameda County Arts Commission, as well as our own research, 24 organizations with potential interest in a performing arts center were identified and invited to participate in the survey. Survey respondents were contacted by email and mail, and in some cases were personally interviewed. Eight responses were received, five of which indicated interest in potential use of performing arts facilities. The results of this survey are discussed in the Use Analysis portion of Section II of this report, while the relationship between the survey and the need for a performing arts facility is discussed in the Needs Assessment portion of Section II.

Fremont Performing Arts Market / Center Theater Reuse / Centerville Fire Station Study Final Report
May 2009 5
II. PERFORMING ARTS MARKET STUDY
As described earlier, a primary goal of our work in Fremont involved the market for either a regional or local performing arts center, or both (please see “Regional versus Local Performing Arts Center” later in this section). As such, AMS embarked upon a comprehensive market assessment to determine the suitability of the market for such a venture.
Market Assessment
AMS prepared an assessment of the market for the performing arts in Fremont and two associated market areas, described below. Data were provided by Nielsen Claritas, the nation’s foremost market data provider.
Market Areas
AMS initiated the Market Assessment by selecting geographic areas for analysis. The “primary market,” in which approximately 80 percent of a performing arts facility’s patrons may be expected to live, was determined to be the cities of Fremont, Union City, and Newark. This selection was based on geography, travel time, transportation, and historical patterns of use and affiliation. The larger “trade area,” in which the majority of the balance of a facility’s users live, is typically defined as a 20-30 mile radius or 30-minute drive-time from a venue. In Fremont, interviews confirmed this basic evaluation, and we further refined the trade area as the corridor between San Francisco Bay and the East Bay hills, defined on the north by Interstate 238 in Hayward and on the south by State Route 237 in Milpitas. This area is approximately 22 miles from end to end (See Figure 3). In Figure 3, the primary market is depicted in green. The trade area is represented by the primary market plus areas marked in blue.
The market area for a locally-serving performing arts venue (fewer than 1,000 seats) in Fremont would approximately correspond to the primary market as defined above, while the market area for a regional performing arts center would approximately correspond to the trade area.

Fremont Performing Arts Market / Center Theater Reuse / Centerville Fire Station Study Final Report
May 2009 6
Figure 3: Market Area Map

Fremont Performing Arts Market / Center Theater Reuse / Centerville Fire Station Study Final Report
May 2009 7
Demographics
When analyzing demographic data as it pertains to performing and visual arts, three statistics are generally regarded as key: population, income, and education. In Fremont, all three are very positive indicators for the performing arts. Please see Figure 4 for a detailed table of demographic data.
The population of the City of Fremont is estimated to be 211,6621 in the spring of 2009. The primary market population is estimated at 325,737 and the total trade area population at 605,148. High population figures such as these do not necessarily predict use of or attendance at a performing arts venue, but when viewed in conjunction with other demographics and consumer data, and with market opportunity (discussed in Competitive Analysis, below), it suggests a positive outlook.
High educational attainment, measured in percentage of adults over age 25 with at least a bachelor’s degree, is a useful predictor of the likelihood of residents to participate in the arts. The City of Fremont’s educational attainment is 43.2 percent, while figures for both the United States and California are around 25 percent. Figures for the primary market and trade area are also high, though lower than those in Fremont, at 37.9 percent and 31.8 percent, respectively.
While educational attainment is a predictor of likelihood of arts attendance, household income is useful in analyzing the possible frequency of attendance. Again, indicators for Fremont and the associated market areas are strong. Median household income for Fremont is estimated at $93,420 – over 40 percent higher than for the nation, and over 30 percent higher than statewide. The primary market is only slightly lower at $91,265, with the trade area at $80,936. Along with indications of a highly-educated population, the high median household income in Fremont and the associated market areas is a very positive indicator for performing arts attendance.
1 Per Fremont city website.

Fremont Performing Arts Market / Center Theater Reuse / Centerville Fire Station Study Final Report
May 2009 8
Figure 4: Market Area Key Demographics
Variable Fremont Primary Market Trade Area
2009 Estimated Population 211,662 325,737 605,148 2000 Population 203,413 312,815 581,885 Median Age 36.7 36.4 36.0
% Generation Y (5-17 yrs) 19.2% 19.8% 19.7%% Generation X (18-34 yrs) 29.9% 29.6% 30.2%% Baby Boomers (35-59 yrs) 26.6% 26.3% 25.3%% Mature (60+ Yrs) 9.6% 9.6% 9.9%
Median Household Income $93,420 $91,265 $80,936% over $75,000 53.3% 53.2% 46.1%
% with College Degree 43.2% 37.9% 31.8%Households with Children 43.4% 45.2% 43.6%% Black 2.8% 3.5% 5.9%% Asian 47.1% 45.4% 39.5%% Hispanic (all races) 14.0% 18.6% 24.5%

Fremont Performing Arts Market / Center Theater Reuse / Centerville Fire Station Study Final Report
May 2009 9
Market Segmentation
In order to better understand the characteristics of the performing arts market in Fremont, AMS analyzed consumer data for the area. Our analysis utilizes PrizmNE, a market segmentation system from Claritas which encompasses a variety of information about consumer markets, including travel, eating out, shopping, auto purchases, leisure pursuits, and more. The system categorizes the households in a given area into market segments by their consumption history and patterns, which include arts participation and attendance.
In Fremont and the associated market areas, two segments are dominant: “Bohemian Mix,” comprising almost 28 percent of households in the City of Fremont, the primary market and the trade area; and “American Dreams,” comprising an average of 24 percent of the households in the City, primary market, and trade area.
The Bohemian Mix market segment is characterized by mid-level to high income and high educational attainment, a high degree of ethnic diversity, white-collar and professional jobs, and a relatively youthful demographic. The lifestyle of this segment is urban, curious, and lively.
The American Dreams market segment is of mid-level educational attainment and income, somewhat older than Bohemian Mix, and is also highly diverse. The lifestyle is less urban, with white-collar and service-sector jobs, and is heavily multilingual.
While neither “Bohemian Mix” nor “American Dreams” are among the market segments most closely associated with arts participation, their presence remains a positive one for the performing arts market in Fremont, given their high education and affluence, and dynamic, curious, urban lifestyles.

Fremont Performing Arts Market / Center Theater Reuse / Centerville Fire Station Study Final Report
May 2009 10
Market Potential Indices (MPIs)
A final component of the market analysis is Market Potential Indices, or MPIs. These measures evaluate the market potential or propensity of residents of the market areas to participate in a range of arts activities. The indices do not measure actual attendance or consumption, simply the likelihood of taking part in various activities. “Average” propensity or interest in a particular activity is indexed at 100 – thus, scoring 200 for a particular activity would indicate that the market there is twice as likely to participate, for example. Scoring 50 would mean it is 50 percent less likely to participate.
Fremont and its associated market areas show very strong MPIs for the arts, as shown in Figure 5. At 206, residents of the City of Fremont are more than twice as likely to belong to an arts association, and at 175, they are 75 percent more likely to attend live theater. Similar numbers prevail for all activities in Fremont, the primary market, and the trade area.
Figure 5: Market Potential Indices
Fremont’s Ethnic Market
In the course of our studies, AMS spoke to many individuals in an effort to understand the tremendous ethnic diversity of Fremont and how that diversity may impact the market for the performing arts. Our general conclusions follow:
• Individuals from various ethnic communities interviewed, including South Asian, Afghani, Chinese, and Latino, characterize their communities as diverse in opinions and taste; in addition, there are multiple differences within ethnic communities on matters including language, religion, politics, and cuisine.
Lifestyle Attribute Fremont Primary Market Trade Area
Belong to an Arts Association 206 203 188
Buy Classical Music 187 182 167
Go to Live Theater 175 172 160
Go to Museum 168 164 152
Go to Music/Dance Performance 150 147 139
Go to Rock/Pop Concert 168 164 153
Make Charitable Contribution 126 125 118
Interested in the Arts 139 138 132
Fremont Performing Arts Market / Center Theater Reuse / Centerville Fire Station Study Final Report
May 2009 11
• Attendance at mainstream (i.e., not ethnic-specific) arts and cultural activities can be correlated to a number of factors, including higher education or income, younger age, and a longer period of time living in the United States. Evidence suggests that members of ethnic communities who are older, first-generation immigrants, or have lower educational attainment or affluence are more likely to be interested in ethnic-specific arts, cinema, television, etc.
• Although younger members of ethnic communities are more likely to be interested in mainstream culture than their elders, connection with home countries is more deeply maintained in the 21st century than at earlier moments in America’s immigration history. This phenomenon is explained by the relative ease and affordability of international travel and communication. A sustained interest in the arts and culture of home countries could be one result.
• Potential for “cross-over” appeal of arts and cultural programs between ethnic communities was described by interviewees as somewhat limited. On the other hand, anecdotal evidence suggests that there is interest among the White non-Hispanic population in attending multi-cultural events. The performing arts, particularly dance and music, were described as having slightly more cross-over appeal, given the general absence of a language barrier for these forms. To a certain degree, there appears to be an appetite for mainstream American culture across ethnic lines.
Regional versus Local Performing Arts Center
To understand the need for a performing arts center in Fremont, it is necessary to distinguish between regionally-serving and locally-serving venues, as their markets and programmatic scope differ, as well as their size and cost.
As discussed earlier in this report, local venues essentially serve the primary market, or approximately a 10 to 15-mile radius. Their seating capacity may range from 300 to 700 seats, but commonly averages around 500 seats. Their stages and support spaces accommodate programs of relatively modest size – local organizations, community events, small-scale touring productions – in a range of artistic forms, but typically not the largest symphonies, operas, ballets, or theater productions. Examples of such venues in the Bay Area include the Smith Center for Performing Arts at Ohlone College, Fairfield Center for Creative Arts, the Lucie Stern Theatre, and the under-construction Firehouse Arts Center in Pleasanton.
A regional performing arts center serves a larger trade area, typically a 20- to 30-mile radius, and possibly beyond, for niche programs. Such venues have seating capacities of 1,000 seats and up, although occasionally as low as 800-900 seats. They can accommodate large scale productions of many art forms and can accommodate major,

Fremont Performing Arts Market / Center Theater Reuse / Centerville Fire Station Study Final Report
May 2009 12
world-class artists and companies. Examples in the Bay Area include Zellerbach Auditorium at UC Berkeley, the San Jose Center for the Performing Arts, and the Flint Center in Cupertino. Livermore’s proposed regional performing arts center would also fit into this category.
Competitive Analysis
AMS collected data on 24 venues, both regional and local, that may be considered “competitors” to a prospective venue in Fremont by virtue of the size and programmatic scope. We interviewed representatives of 12 of the 24 venues.
These venues represent capacities ranging from 400 to over 3,000 seats. Excluded from the sample were venues which are home to a producing organization such as Davies Symphony Hall, the War Memorial Opera House, Berkeley Repertory Theatre and American Conservatory Theatre. Commercial venues such as the Warfield Theatre, and San Francisco’s Broadway-style theaters were also excluded from the analysis. All of the venues reviewed are open to the public in some way – for rentals, or for public programs, or both. Performing arts theaters that are primarily for private use, such as school auditoriums, were excluded from the analysis. Please see Figure 6 and Figure 7 for a list of those venues surveyed.
Figure 6: Regional Performing Arts Centers Surveyed
Venue Name Seat Count Location
Berkeley Community Theatre 3,500 BerkeleyParamount Theatre 3,040 OaklandSan Jose Center for the Performing Arts 2,665 San JoseFlint Center for the Performing Arts 2,427 CupertinoZellerbach Auditorium 2,014 BerkeleyMarin Center 2,000 San RafaelSan Mateo Performing Arts Center 1,600 San MateoFox Theatre 1,464 Redwood CityChabot College Performing Arts Center 1,432 HaywardCalifornia Theatre 1,170 San JosePalace of Fine Arts Theatre 962 San FranciscoHerbst Theatre 916 San Francisco

Fremont Performing Arts Market / Center Theater Reuse / Centerville Fire Station Study Final Report
May 2009 13
Figure 7: Local Performing Arts Centers Surveyed
Figures collected from responding venues suggest that while there is a range of attendance and use, many venues are often only half-full, and are utilized below their potential. In addition, sizeable subsidies are typically required to compensate for operating losses at larger venues.
The average attendance at those venues which reported ticket sales was 48 percent, and ranged from a high of 76 percent capacity, to 16 percent. The number of days per year the venues were utilized ranged from 27 to over 300, averaging 177. Figures such as these suggest that most venues average an event every two days – a not unreasonable frequency, given the demands of “loading-in” and tearing down shows. But the busiest venues demonstrate that use rates well above the average, of 200 or over 300 events per year, are achievable. The moderate figures of even the busiest venues suggest that many performing arts centers around the Bay Area, like their national counterparts, suffer from the interrelated problems of underinvestment in programming and marketing, underpaid and inexperienced management, and deteriorated facilities.
Venue Name Seat Count Location
Lesher Center for the Arts 785 Walnut CreekYerba Buena Center for the Arts 757 San FranciscoEl Campanil Theatre 700 AntiochDougherty Valley Performing Arts Center 600 San RamonMountain View Center for the Performing Arts 600 Mountain ViewAmador Theatre 591 PleasantonMontgomery Theater 536 San JoseMexican Heritage Plaza Theater 535 San JoseBankhead Theatre 500 LivermoreEmpress Theatre 466 VallejoLucie Stern Theatre 428 Palo AltoSmith Center for the Performing Arts 405 Fremont

Fremont Performing Arts Market / Center Theater Reuse / Centerville Fire Station Study Final Report
May 2009 14
Figure 8: Regional Performing Arts Centers Service Areas
While the current state of venues such as these in the Bay Area is not encouraging, positive signs for Fremont may be seen in the relative “gap” that exists between the major existing performing arts centers congregated in at the north and south ends of Fremont’s trade area. Figure 8 illustrates this situation, depicting the four significant competitors to a Fremont regional performing arts center (UC Berkeley’s Zellerbach Auditorium, downtown Oakland’s Paramount Theatre, the Flint Center in Cupertino, and the San Jose Performing Arts Center), and 20-mile radii that constitute their approximate trade areas. Fremont is located on the edge of the market areas of several centers, and could potentially capitalize upon this “gap.” The most important consideration for the City would be the need to adequately capitalize a performing arts project, not only to create a “state of the art” venue but to adequately fund ongoing operations.
When considering the competitive “gap” for a local performing arts center, an even starker picture emerges. As illustrated in Figure 9, only Ohlone College’s Smith Center lies within the 10-mile market area that is typical for a locally-serving venue. The Smith Center is technically adequate, and of an appropriate size for many of Fremont’s performing arts organizations.
However, many user groups report difficulties in securing performance dates on the Smith Center’s busy calendar (most use is by Ohlone College programs). Interviewees also reported that many audience members find the Smith Center’s campus location, parking situation, and hilly terrain problematic.

Fremont Performing Arts Market / Center Theater Reuse / Centerville Fire Station Study Final Report
May 2009 15
Figure 9: Local Performing Arts Center Service Area
Use Analysis
In order to project use by the Fremont arts community of a performing arts venue, AMS surveyed organizations from throughout the projected trade area, collecting data on number of days per year each organization might use a facility, what size they would be interested in, and where they would like it to be located. We collected a list of 24 organizations from area arts councils and from our own research, and surveyed them via mail, email, and personal interviews (see Appendix B for the list of organizations contacted). Follow-up calls were made to many organizations.
Figure 10: Projected Use
OrganizationMinimum Venue Size
Optimum Venue Size
Maximum Venue Size
Projected Annual
Performance Use (Low)
Projected Annual
Performance Use (High)
Chinese Artist Network 100 200 500 1 2Jensen Performing Arts 300 800 1000 5 8Music Teachers Association 100 500 2 4Stage 1 Theatre 150 250 500 24 40Star Struck Theatre 250 400-500 600 10 22

Fremont Performing Arts Market / Center Theater Reuse / Centerville Fire Station Study Final Report
May 2009 16
Of the eight organizations that responded to the survey, five indicated interest in a performance venue. Please see Figure 10 for details on the responding organizations. In addition to those organizations listed in Figure 10, we interviewed the Fremont Symphony and Opera, and the Fremont Cultural Arts Council. The Symphony and Opera currently perform at Ohlone College’s Smith Center, which they report is technically well-suited to their needs. However, interest was expressed in a venue with larger seating capacity.
Organizations were also surveyed as to their preference for the location of a new performance venue, and as to what criteria were most important to them in the development of a new venue. Details on the results of these questions appear in Figure 11 and Figure 12.
Figure 11: Site Criteria
Figure 12: Location Preferences
Performing Arts Center Building Programs
AMS has prepared sample “order of magnitude” building programs for regional and local performing arts centers that would meet the stated needs of potential users and of appropriate seating capacity for the market.
Cost of UseProximity to
TransitAvailability of Parking
Nearby Amenities (shopping,
dining)
Freeway Access
Aesthetics / Ambiance
Technical Capabilities
Chinese Artist Network 1 2 3 5 6 7 4Jensen Performing Arts 1 3 1 5 4 5 7Music Teachers Association 1 3 2 5 4 6 7Stage 1 Theatre 1 2 3 5 6 4 7Star Struck Theatre 1 2 4 3 6 5 7Average Score 1 2 3 5 5 5 6
Organization
Site CriteriaRespondents ranked the criteria on a scale of 1 (most imporant) to 7 (least important)
Central Park
Downtown Fremont (Mowry &
Fremont Blvd)
Mission San Jose
Irvington Niles Centerville
Chinese Artist Network 1 3 2Jensen Performing Arts* • • •Music Teachers Association 1 2 3Stage 1 Theatre 2 1 3Star Struck Theatre 1 2 3Average Score 1 2 3 3*no order specified
Organization
Location PreferencesRespondents indicated their top 3 preferences, where 1 was favorite.

Fremont Performing Arts Market / Center Theater Reuse / Centerville Fire Station Study Final Report
May 2009 17
Regional Performing Arts Center
Please see Figure 13 for a sample building program for a 2,000-seat proscenium (picture-frame) stage regional performing arts center. Such a center could be expected to include full theatrical technical capabilities, including fly loft, orchestra pit, orchestra shell; backstage loading and preparatory space; performer support spaces including multiple dressing rooms, toilets, showers, and green room; “front of house” public-service spaces including lobby, concessions, box office, and restrooms; and administrative offices. The estimated net square feet has been increased or “grossed up” by a factor of 1.5 to account for necessary but non-programmed building components such as circulation, wall thickness, utility spaces, and others. The resulting figure is the total, or gross, square footage of the facility.
Figure 13: Regional Performing Arts Space Program
At an estimated project cost of $1,000 per square foot, a typical benchmark cost for a project of this kind, the facility described would cost approximately $85.5 million (2009 dollars) excluding land costs and parking.
Local Performing Arts Center
Please see Figure 14 for a sample building program for a 500-seat locally-serving performing arts center. Such a center could be expected to include many, but not all, theatrical capabilities, such as lighting, sound, and fly gallery; performer support spaces, including a rehearsal space for local organizations; patron accommodations; and administrative offices. The program for a local performing arts center has been grossed up by a factor of 1.4, in recognition of the facility’s smaller size and reduced complexity.
Space Category Square Feet
Auditorium & Stage 31,000 Public Areas 19,000 Backstage Support 5,000 Administration 2,000
Subtotal (Net) 57,000
Grossing Factor (1.5) 28,500 Total (Gross) 85,500

Fremont Performing Arts Market / Center Theater Reuse / Centerville Fire Station Study Final Report
May 2009 18
Figure 14: Local Performing Arts Center Program
At an estimated project cost of $650 per square foot, a typical benchmark cost for a facility of this kind, the facility described would cost approximately $18.5 million (2009 dollars), excluding land costs and parking.
Needs Assessment
Blending our market assessment, competitive analysis of regional and local performing arts centers, and user analysis leads us to an assessment of the need for a regional or local performing arts center in Fremont.
Regional Performing Arts Center
AMS finds that the need for a regional performing arts center in Fremont is not high at this time, despite favorable market conditions and the existence of a market “gap.” A certain degree of community support is present, but fundraising capacity, community leadership, and demand by user organizations is not high. The approximately $80 to $100 million investment, plus an operating subsidy of $1 million or more per year, may be difficult to justify under these conditions.
Local Performing Arts Center
The indicated need for a locally-serving performing arts center in Fremont is somewhat more positive than for a regional center. A local facility would benefit from the same favorable market characteristics as a regional center, and a similar market “gap” exists. Fremont lacks a locally-serving performing arts facility; the Smith Center at Ohlone College has limited availability and is not well located.
However, Fremont’s arts community, which would comprise the core users of such a facility, is not robust, and has been challenged over the past decade to enlist strong leadership and increase fundraising capacity. With a maximum of only 76 use-days
Space Category Square Feet
Auditorium & Stage 9,000 Public Areas 5,300 Backstage Support 5,000 Administration 1,000
Subtotal (Net) 20,300
Grossing Factor (1.4) 8,120 Total (Gross) 28,420

Fremont Performing Arts Market / Center Theater Reuse / Centerville Fire Station Study Final Report
May 2009 19
projected by the organizations responding to our organizational survey (see Figure 10), and assuming that additional organizations step forward to utilize the facility, a local performing arts center will likely be dark many nights of the year. While the cost to develop a local performing arts center will be significantly lower than for a regional performing arts center, $15 to $20 million will still be required, plus an operating subsidy of $500,000 per year or more, based on experience elsewhere.
Performing Arts Center Sites
Three potential sites for a performing arts facility were identified by City staff and have been evaluated. A set of common criteria, including Image, Proximity, Transportation & Parking, Capacity, Cost, Visibility, Context, and Expediency have been applied.
Downtown Fremont
Downtown Fremont, defined for the purposes of this study as the area bounded by Mowry and Walnut Avenues, Paseo Padre Parkway, and Fremont Boulevard, is an area currently occupied by a mix of single-family homes, office buildings (including Fremont City Hall and other municipal offices), commercial development, and several large at-grade parking lots. The area also includes various undeveloped or under-developed parcels, most notably located between Liberty and California Streets, and Walnut and Beacon Avenues.
Shopping and dining abound in the immediate vicinity and downtown is home to Fremont’s only cinema, the Naz 8. However, the area is not an attractive, pedestrian-oriented district, and is filled with generally undistinguished architecture. The City is exploring partnerships to enhance the appeal of the area and create a higher-density, more attractive downtown core. Transportation to and within the area is easy and uncomplicated, but it is not close to major freeways. However, given the area’s central location, and proximity to the Fremont BART station, access for transit riders and pedestrians would not be problematic. At approximately six acres in size, the largest vacant parcel in the area would be adequate to accommodate a performing arts center, assuming structured or shared parking. Other sites may be possible, though it may be necessary to raze existing buildings or re-route some interior streets.
This area offers tracts of vacant land, and proximity to Fremont’s business and governmental core. These facts make it an expedient, and relatively lower cost option, site for a performing arts center. The Downtown Fremont site was the second-most highly favored by respondents to our organizational survey (see Figure 12).
Central Park
A Central Park site, defined for this study as the corner of Stevenson Boulevard and Paseo Padre Parkway, has been the subject of much planning energy related to civic

Fremont Performing Arts Market / Center Theater Reuse / Centerville Fire Station Study Final Report
May 2009 20
facilities, including a plan for a regional performing arts center 1993. Like the Downtown Fremont site(s), large arrays of undeveloped land and open space exist, although as a part of Fremont’s beloved Central Park, use as a site for a performing arts center may be contested by some members of the community. However, a Central Park site was the most-popular location for a performing arts center among respondents to our organizational survey (see Figure 12).
Central Park lacks amenities like shopping and dining, but the image of the area is positive and one to which Fremont residents respond well. The Pavilion and recreational facilities at the Park are well known and used. Transportation access to the area is relatively uncomplicated, although the distance from freeways and BART is greater at Central Park than the other sites considered. The site is adequate to contain a performing arts center and there is some existing parking available. Seismic issues have been problematic at the Central Park site in previous planning efforts, and would need to be carefully analyzed before proceeding with a performing arts center there.
Overall, the area offers a more positive “feel” and a more appealing physical location than almost anywhere else in Fremont, but seismic concerns and the conversion of parkland for development may prevent serious consideration of this location.
Centerville
None of the respondents to our organizational survey placed Centerville among their top three locations for a performing arts center. Despite being one of Fremont’s historic downtowns, the neighborhood contains many neglected buildings suffering from deferred maintenance, although there have been successful efforts to improve some of the buildings in the neighborhood. The area is not proximate to other civic amenities or attractions, and while ethnic dining exists in the neighborhood, mainstream food and shopping is not available. While served by bus lines, the area is not convenient to BART, parking in the area can be difficult, and Centerville was frequently cited in interviews as problematic to reach from the rest of Fremont. The neighborhood contains a rail station that serves Amtrak and ACE trains. The area’s dense, downtown nature means a parcel or parcels with adequate capacity for a performing arts center may be difficult to acquire, and since most of the properties in Centerville are privately owned, acquisition may be more difficult and costly than elsewhere.
Despite these drawbacks, Centerville offers some advantages over Downtown Fremont and Central Park. As a true downtown neighborhood, it offers strong historical and cultural resonance with performing arts use, and introducing new activity into the area may have stronger and more positive multiplier effects on nearby businesses (such as restaurants and event centers) than in other parts of the City. It has been suggested by some Centerville community leaders that the neighborhood’s diverse ethnic makeup could be leveraged to create a unique destination emphasizing South Asian cultures (including Afghan).

Fremont Performing Arts Market / Center Theater Reuse / Centerville Fire Station Study Final Report
May 2009 21
III. CENTER THEATER REUSE STUDY
In addition to considering the market for a performing arts center in Fremont, AMS was asked to evaluate the role that the Center Theater, located at 37411 Fremont Boulevard in the Centerville district, should play in the arts and cultural life of its neighborhood and the City.
Center Theater
The Center Theater opened in 1946 as a movie theater, originally seating 700. It was operated as a first-run venue until the 1970s, with a varied history thereafter, accommodating church services, Spanish-language films, adult, and discount second-run films. In 1990, it began operating as the Naz Cinema, showing Indian-language films with some success. The Naz operation relocated to a larger multiplex cinema in 2000, and full-time use of the Center as a cinema ended. Since then, the theater has been renamed the Park Theater and is used as an event venue, as a church, and for occasional screenings of Asian movies.2 Investment has been made in up-to-date film projection (both analog and digital) and sound equipment, as well as seating renovations.
The property includes two retail spaces adjacent to the lobby and multiple residential rental units behind the building.
Centerville
Description
Centerville, one of the original five towns comprising Fremont, features a business district running from Central Avenue to Thornton Avenue, centered on railroad tracks serving ACE and Amtrak. The Center Theater is only a hundred yards away from the railroad corridor. The business district is characterized by a mix of buildings dating from both before and after the Second World War, serving a wide variety of functions. There are no fewer than four event spaces in the neighborhood: the Center Theater, a Masonic hall, the Diamond Palace and the Century House, located in a former funeral home.
Many structures need rehabilitation, with deteriorated retail buildings in the central commercial corridor along Fremont Boulevard. As a result, empty storefronts are evident in the commercial core. The presence of several large parcels of cleared land awaiting redevelopment is a frequently-mentioned sore spot among Centerville residents and businesses.
The area is generally regarded as safe, although some respondents interviewed for this study expressed worries about parking their vehicles and walking on dark streets at night.
2 http://cinematreasures.org/theater/2613/ Retrieved on April 23, 2009.
Fremont Performing Arts Market / Center Theater Reuse / Centerville Fire Station Study Final Report
May 2009 22
Current Planning Situation
A Centerville Specific Plan was prepared by HGHB Architecture for the City of Fremont in 1993, last amended in 2006, though not comprehensively updated. The current plan does not mention the Center Theater, although it cites the “preservation and creation of civic, cultural and educational facilities and amenities as a catalyst for area revitalization” as a specific goal of the Centerville Redevelopment Plan. This goal, number 22 of 23, was adopted by the City’s Redevelopment Agency in 1997.3
A need for an area-specific economic development strategy was cited by many neighborhood and City leaders.
Center for Investment in the Arts Project
Review
The Center Theater has been the subject of many planning efforts over the past decade, including an extensive study and business plan prepared by VenueTech Management Group, working in concert with the Center Theater Preservation Group, a non-profit community organization. The current plan calls for the creation of a “Center for Investment in the Arts,” consisting of a Center Theater extensively renovated for use by the live performing arts and seating 400, and a “Cultural Arts Resource Center.” The Cultural Arts Resource Center, also known as the “Arts Incubator,” would consist of new construction totaling about 10,000 square feet to the rear of the existing theater (demolition of existing apartments would be required) that would house rehearsal, office, classroom, and production facilities, as well as serve as loading and backstage access for the renovated theater. Users of the Center for Investment in the Arts are projected to be “non-profit, community and professional performing arts organizations from around Fremont and the Tri Cities.” In addition to providing physical facilities for such organizations, various programs are planned, including a “volunteer clearinghouse.” The plan states that the Center’s overarching mission is dedicated to:
• “Building alliances between artists, arts organizations, and those individuals and businesses that are committed to funding artistic and creative development.
• Encouraging cultural growth in Fremont and the surrounding Region.
• Stimulating the economic benefits of the arts and ensuring that the Fremont business community participates in the significant impact of economic activity generated by the arts sector.
3 Centerville Specific Plan (1993-2006, amended), pg. 134.

Fremont Performing Arts Market / Center Theater Reuse / Centerville Fire Station Study Final Report
May 2009 23
• Offering an environment for artists and arts organizations to develop creative ideas, experiment with new concepts and produce programs that are appealing to a regional audience.
• Providing tools which will help facilitate the development of professional nonprofit arts organizations and foster a more business-like arts sector.”
A cost estimate has also been prepared by the consultants, based on comparison with two other projects in the Bay Area, a new recreation center in Danville and the historic restoration of a movie theater in Alameda.
The cost for construction, renovation, and theatrical equipment is estimated at $7.4 million, not including acquisition, demolition, fees, owners’ costs, or furniture, fixtures, and equipment. Operational cost forecasts had not been provided to AMS as of this writing, although the Center Theater Preservation Group has stated their intention to raise $4 million towards endowment, an amount that could be projected to generate (at 5 percent per year) $200,000 annually towards operations.
Assessment
A review of the VenueTech plan reveals numerous concerns:
• Given the survey responses of local organizations in regard to the location of a performing arts center (see “Use Analysis” on page 15), the Center Theater and Centerville do not present themselves as prime candidates for the extensive investment that will be required to make the Center Theater a viable performing arts venue.
• Projected utilization is uncertain. Discussion with leadership representing three of Fremont’s oldest and largest performing arts companies indicate concern about the proposed theater facilities:
o The Fremont Symphony orchestra indicated that the stage is too small to accommodate their full orchestra.
o The new Fremont Opera also expresses concern about the stage size and theater systems.
o The City’s premier youth theater, StarStruck, has indicated they are satisfied with their situation at Ohlone College and foresee limited use of the Center Theater.
• Over the past ten years community organizers have struggled to gain public support and raise funds for the project.

Fremont Performing Arts Market / Center Theater Reuse / Centerville Fire Station Study Final Report
May 2009 24
• The vast majority of cultural facilities of this type and size require the ongoing support of public (tax) funds and the City of Fremont has clearly indicated its lack of financial capacity to provide operating support.
Film, Food, & Arts Venue
In addition to the Performing Arts Market Study and the review of the Center for Investment in the Arts project, AMS was asked to consider alternate uses for the Center Theater.
Our investigation of possible alternate uses for the Center Theater began by codifying the City’s goals for the building and the neighborhood, based on interviews with citizens, City leaders and neighborhood representatives. AMS discerns these goals as follows:
• Providing a cultural amenity for residents of Centerville and Fremont, with a particular emphasis on a “quality” experience.
• Revitalizing Centerville by using an active, restored Center Theater to catalyze retail and other development and drive pedestrian traffic to the area.
• A project that is self-sustaining, following an initial capital investment.
AMS identified a concept known as “film & food,” or “theater pub,” which could fulfill the City’s goals. Blending this concept with the ability to provide for live performing arts events could also address the identified need for a locally-serving performing arts center in Fremont, at least in the short-term.
Film & Food Industry Characteristics
Film & food venues, or theater pubs, are widely scattered around North America, with a strong concentration in the Pacific Northwest. While there are some commonalities between various venues, as an industry they defy easy categorization. The basic themes are:
• A programming mix differentiated in some way from first-run movie theatres, including mainstream films in secondary release (often called “sub-runs” or “move-overs”), independent, art, foreign-language, cult (e.g., Napoleon Dynamite, Rocky Horror Picture Show) and repertory/classic films (e.g., Citizen Kane, Rear Window).
• Food and beverage (typically limited to beer and wine) service that patrons may take into the theater and consume on tables or counters.

Fremont Performing Arts Market / Center Theater Reuse / Centerville Fire Station Study Final Report
May 2009 25
Ownership of film & food venues is mostly by dedicated entrepreneurs, not national or regional chains. The complex nature of the business seems to have kept chains away for now, but corporate interest in the concept is beginning to be seen.
One reason for the programming mix commonly seen at film & food venues is the revenue-share model that prevails between film distributors (the middleman between studios and theaters) and exhibitors. First-run venues turn over from 70 to 90 percent of ticket revenue to a limited number of distributors, turning a profit, if any, on sales of concessions, advertising, and other non-admission revenue. The films most commonly shown by film & food venues pay at most 35-40 percent of ticket revenue to a large number of distributors.
The food component of the model varies as widely as the film programming, from pizza and pub fare to “white tablecloth” dining. Typically, venues offer a middle-of-the-road menu, with pizza, salads, appetizers, sandwiches, pasta, and wine, beer, and soft drinks. High-quality popcorn is essential, and desserts and familiar movie theater confections round out the offerings. The “food” component of a film & food venue is able to achieve restaurant-level profit margins of approximately 5-7 percent (after rent), which, although modest, are a significant contribution to a venue’s bottom line.
Other common, but not universal, elements of the film & food model include:
• A propensity to use renovated historic theaters or other adapted spaces, rather than newly-constructed facilities.
• Lower price points and, frequently, a value-oriented competitive advantage. Ticket prices range nationally from $3 to $7 (approximately 50 to 70 percent off ticket prices at first-run cinemas), and food and beverage prices are around $3 to $9, though high-end venues may offer entrees in the $15-$25 range.
• Special events, which can include “mommy & me” matinee screenings, where crying infants are welcomed; film festivals; filmmaker Q and A and panel discussions; corporate events and fundraisers; live music, comedy; and availability for rental by the community.
In the course of our research, we spoke with a number of film & food operators, who left us with several important findings:
• Every venue, market, and community is unique, and the programming that is appropriate at one may not be at another. Learn about your community and create a balance between its desires and what you would like to offer.

Fremont Performing Arts Market / Center Theater Reuse / Centerville Fire Station Study Final Report
May 2009 26
• Large profits are not to be made in this industry, although a living can be made, and venues have been sustained for many years.
• These venues are challenged to exist in a competitive marketplace and overcrowded entertainment landscape, which includes first-run cinemas, home theaters, movies and television available online, and more. Thin profit margins are the norm, and active and engaged management is required for success.
• The quality of patron experience matters, from the moment patrons leave their car, walk along city streets to the theater, purchase tickets, enter, order food, and then consume both food and film. For aficionados, experience quality extends to the quality of the film print itself. Views such as these were echoed by the community.
Competitive Analysis
In the Bay Area, three venues have been identified that incorporate film & food, to varying degrees.
• The Cerrito Speakeasy Theater, in the renovated historic Cerrito Theater in El Cerrito, is a strong exemplar for the concept. Operating on two screens, with 120 and 140 seats, the programming and menu options are almost exactly as described above. A trademark of this venue is its use of sofas and armchairs as part of the audience seating, which provides a laid-back, “living room” atmosphere.4
• Foreign Cinema, in San Francisco’s Mission District, offers a higher-end twist on the film & food concept. Patrons there may enjoy white-tablecloth dining, with entrees up to $30. Film programming at the Foreign Cinema is geared towards foreign-language films, with some second-run mainstream or independent American movies.
• The Kabuki Cinema, operated by Sundance Cinemas (associated with Robert Redford’s Sundance Institute), in San Francisco, offers another upscale film & food experience. Food and beverages are available from three restaurants or bars within or adjacent to the venue, and certain items may be brought into one of seven screening rooms. This venue offers other higher-end amenities, such as elegant architecture and finishes and reserved seating. Film programming is somewhat more mainstream than the Cerrito or Foreign
4 On May 22, 2009, the operators of the Cerrito Theater announced the venue’s immediate closure “until further notice” due to financial difficulties. The City of El Cerrito is reportedly seeking a new operator for the venue.

Fremont Performing Arts Market / Center Theater Reuse / Centerville Fire Station Study Final Report
May 2009 27
Cinema, but is diverse and includes foreign, independent, and other staples of the film & food concept.
None of the three venues offering film & food in the Bay Area is within or proximate to the Fremont market area.
Figure 15: Bay Area Specialty Film Venues
City Venue Name
Albany Albany TwinElmwood TheatrePacific Film ArchiveShattuck Cinemas
El Cerrito Cerrito TheatreFremont Naz 8 CinemasLarkspur Lark Theater
Los Gatos Los Gatos CinemaMenlo Park Guild Theatre
Milpitas Serra TheatreOakland Piedmont Theatre
Aquarius TheatreStanford TheatreBridge TheatreClay TheatreEmbarcadero Center CinemaForeign CinemaKabuki TheatreLumiere TheatreOpera Plaza CinemaRed Vic Movie HouseRoxie CinemaYerba Buena Center for the ArtsCamera 3Camera 7Camera 12Indian Movie Center 6
San Rafael Rafael Film CenterSanta Rosa Rialto Lakeside Cinemas
San Francisco
Palo Alto
Berkeley
San Jose

Fremont Performing Arts Market / Center Theater Reuse / Centerville Fire Station Study Final Report
May 2009 28
However, film and food venues compete with other “specialty” (i.e., not first-run) movie theaters, and the distribution of this kind of venue around the Bay Area is widespread. Please see Figure 15 for a list of venues identified by AMS. The venues on this list that are closest to the Center Theater are the Naz 8 Cinemas, in downtown Fremont, and the Serra Theatre, in Milpitas. Both of these venues exclusively showcase Indian movies and other films of South Asia. The existence of the Naz and the Serra – as well as a third theater, the Indian Movie Center 6, in San Jose – suggests that the Center Theater should not screen foreign-language films from South Asia, and should embrace a broader programming mix.
Since all entertainment venues, like movie theaters, essentially compete with the full range of consumer leisure-time pursuits, we include first-run movie theaters in the competitive analysis. Fremont’s only first-run venue, Cinedome 8, closed its doors in March, 2009. If the venue’s neighbor, Cinedome 7 in Newark, closes later this year (as is expected), the only first-run theater in the Tri Cities will be the Century 25 theater in Union City, approximately six miles from the Center Theater (Cinedome 7 is almost four miles from the Center Theater). The demise of these theaters reflects the uncertainty of the market for first-run films in the Tri Cities. However, the closures do not diminish the prospects for a film & food concept in the Center Theater. Our anecdotal research suggests that the demographics for the film & food market are broader than those for first-run cinema.
According to a recent movie attendance study, moviegoing in the United States is dominated by attendees in the 12-24 year-old age group. This cohort is the largest group of attendees, attends more frequently, and attends out of proportion to its size within the general population. 5 Unlike this first-run market, which is dominated by a young demographic whose primary motivation is to see the newest films, AMS believes that the film & food concept would be attended by moviegoers of all ages, motivated by a diverse set of factors. Such motivations may include food and beverage service, eclectic film offerings, low prices, and the social experience of dining while attending a movie. Such attendance patterns are the norm at existing film & food venues around the United States.
A film & food concept in the Center Theater may help to address the consumer appetite for movies in the Tri Cities, and AMS believes that such a concept in the Center Theater would neither directly compete for market share with first-run theaters nor be subject to the same market forces which resulted in the closure of Cinedome 8 and possibly Cinedome 7.
5 Motion Picture Association of America 2007 Movie Attendance Study, available at: http://www.mpaa.org/movieattendancestudy.pdf.

Fremont Performing Arts Market / Center Theater Reuse / Centerville Fire Station Study Final Report
May 2009 29
Program Concept
At the Center Theater, a program concept is envisioned that blends the film & food concept with a capacity to present or host smaller-scale live performing arts. The components of the concept are:
• Diverse film programming. Fremont currently lacks a venue offering independent, art, foreign-language (apart from Indian-language), or classic films. The film & food concept in the Center Theater would touch upon most or all of these programming areas, as well as offering mainstream films in secondary release, thus satisfying consumers that might ordinarily attend a first-run venue.
• Food and beverage service with broad appeal. During our interviews, we were informed that “food, language, and politics” are three hot-button areas best avoided when different ethnic populations assemble, thus it would appear that it would be best for the Center Theater to offer relatively mainstream cuisine akin to that on the menu at existing film & food venues like the Cerrito Theater.
Some operators of existing film & food venues informed us that they are able to earn revenue from catering during events which rent their venues. If such a business model were to be implemented at the Center Theater, more diverse food offerings tailored to the tastes of user groups could be made available.
• Performing arts capability and programming. Thanks to the Center Theater’s high ceilings and large footprint, there is room for a stage and modest technical accommodations, which would support live performing arts use. (Please see Building Concept, below, for details on the proposed renovation and construction of the facility.) By dovetailing such use around film programming, the Center Theater could partially accommodate performance needs of arts organizations in Fremont.
In addition to use on a rental basis by community arts organizations, the venue could be available for rent by individuals and organizations seeking a meeting or event space.
The Center Theater would only address the need for performance space for small-scale productions and short-term runs. The need in Fremont for performance space for more elaborate and longer-term runs must be addressed by a different facility.

Fremont Performing Arts Market / Center Theater Reuse / Centerville Fire Station Study Final Report
May 2009 30
• Operation by private/non-profit entity. We project that the Center Theater, after acquisition and renovation by the City, could attract an operator from the private or non-profit sector. Such an operator may pay monthly rent, or a portion of profits or revenue, or both, to the city. An operator could also be expected to maintain access to the facility for performing arts, community, or other uses that the City may wish to accommodate.
Building Concept
AMS engaged Kurt Schindler, AIA, a principal at ELS Architecture & Urban Planning in Berkeley, to advise us on the physical condition of the Center Theater and the requirements for film & food use. A building concept that would accommodate the program concept was developed, which includes:
• Construction of a lateral wall at the theater’s cross-aisle to divide the theater into two screening rooms. This wall would have the added benefit of adding seismic stability to the building.
The preliminary analysis indicates that the upper room will accommodate 142 seats, the lower room 218 seats in cinema mode, 204 seats in playhouse mode.
• Installation of a portable modular stage in the lower screening room, of approximately 700 square feet. The stage could be removed for film screenings. A fixed grid for lighting, sound, and stage equipment would be installed over the stage, along with other modest upgrades to the theater’s existing lighting and sound package.
• Addition of tables for use by dining patrons. Myriad schemes exist for adding tables or counters, but according to one layout developed by ELS, the upper screening room could accommodate tables between seats, while the lower room could accommodate counters attached to seat-backs. Addition of sofas or other non-traditional seating, or a different table system may increase or decrease the seat count.
• Demolition of the building behind the theater.
• Construction of an addition of approximately 1,000 gross square feet behind the theater. This structure would contain performer support spaces, including dressing rooms, a green room, and performers’ bathrooms, and space for loading scenery and equipment into the theater.

Fremont Performing Arts Market / Center Theater Reuse / Centerville Fire Station Study Final Report
May 2009 31
• Renovation of the theater’s lobby and the attached restaurant spaces. The lobby would be enlarged and reorganized to accommodate the “front of house” food and beverage operation, while one of the restaurant kitchens would be renovated and/or expanded to become the theater’s kitchen.
Figure 16: Center Theater
Figure 17: Building Concept: Section
Center Theater

Fremont Performing Arts Market / Center Theater Reuse / Centerville Fire Station Study Final Report
May 2009 32
Figure 18: Building Concept: Ground Floor Plan
Figure 19: Building Concept: Upper Floor Plan

Fremont Performing Arts Market / Center Theater Reuse / Centerville Fire Station Study Final Report
May 2009 33
Project Budget
AMS and ELS have prepared a preliminary project budget for the program and building concepts described above for the Center Theater. Please see Figure 20 for the estimated project budget, and Figure 21 for square-footage details. Assumptions for this budget include:
• Construction and renovation includes all necessary accessibility and seismic upgrades (elevator, wall reinforcement, etc.). Cost per square foot for construction and renovation: $450.
• Demolition of the residential units at the rear of the theater. Cost per square foot for demolition: $50.
• Fees and owners’ costs (“soft costs”) estimated at 30 percent of construction and renovation costs. This allowance includes architectural, engineering, and legal fees, permits, impact studies, testing, and developer fee.
• Cost for furniture, fixtures, and equipment (“FF&E”) estimated at 5 percent of construction and renovation costs. This allowance includes all audience seating.
• In addition to standard FF&E, allowances are included for the purchase of specialized theatrical, kitchen, and film projection equipment (although the Center Theater currently has one projection room, an additional projection room will be required).
• Contingency estimated at 10 percent of total project cost.
This estimate does not include acquisition of the building or cost escalation (all figures are in 2009 dollars).

Fremont Performing Arts Market / Center Theater Reuse / Centerville Fire Station Study Final Report
May 2009 34
Figure 20: Project Cost Estimate
Figure 21: Building Element Areas
Operational Forecast
AMS prepared an operating forecast for a base stable year of operation at the Center Theater, renovated and operating according to the building and program concepts described above. Please see Figure 22 for summary revenue and expense figures. All figures are in 2009 dollars.
Assumptions for this forecast include:
• Film: An average ticket price of $5, and an average of 40 percent paid capacity and an average of 28 film screenings per week.
• Food & Beverage: Average revenue of $6 per patron.
• Performing Arts: An average of two events per month, each yielding net revenue of $500.
Element Cost Estimate
Construction & Renovation $4,640,000Demolition $150,000Fees & Owners' Costs $1,392,000Furnishings, Fixtures, & Equipment $232,000Theater Equipment $180,000Kitchen Equipment $125,000Film Equipment $100,000Contingency $681,000
Total Project Cost $7,500,000
Building Element Gross Square Feet
Theater 8,400 Restaurant 912 Performer Support (New) 1,000
Total 10,312
Residental Units (estimated) 3,000

Fremont Performing Arts Market / Center Theater Reuse / Centerville Fire Station Study Final Report
May 2009 35
• Occupancy: Annual cost (including utilities, insurance, security, and routine maintenance) of $12 per square foot.
• Payments to City: Payments to the City as “rent” or on a revenue-sharing basis may be a possibility.
Figure 22: Operating Forecast
Revenue Expense
Film admissions $495,000 Payment to film distributor $173,000Food & beverage sales $594,000 Non-food & beverage labor $187,000Rental events $12,000 Food & beverage
Total $1,101,000 Cost of goods $178,000Labor $196,000Direct operating $59,000General & administration $12,000
Occupancy $124,000Administrative overhead $12,000Marketing $39,000Equipment maintenance $24,000Credit card fees $8,000Allowance for capital repair $50,000
Total $1,062,000

Fremont Performing Arts Market / Center Theater Reuse / Centerville Fire Station Study Final Report
May 2009 36
IV. CENTERVILLE FIRE STATION STUDY
AMS and ELS assessed the Centerville Fire Station (formerly designated Fire Station #6 by the Fremont Fire Department) to determine what renovations or construction would be required for the building’s reuse. We also assessed some possible uses for the structure.
Building Assessment
The Centerville Fire Station was constructed in 1954, and includes approximately 4,500 square feet on two floors, along with a large covered driveway at the rear of the building constituting 750 square feet. The station was abandoned by the fire department in the fall of 2008 for reasons including the building’s inability to accommodate modern firefighting apparatus.
As currently configured, the station’s ground floor is almost entirely occupied by a high-ceilinged apparatus bay, along with a small restroom and utility rooms. The ground floor features large roll-up garage doors at either end. The upper floor, also featuring high ceilings, includes a kitchen, bathroom with showers, office, dormitory, and multi-purpose “day room.” A small patio is connected to the kitchen, and is accessible from an exterior staircase. A single interior staircase connects the ground and upper floors. The building is unremarkable architecturally or historically. The fire station is located across Fremont Boulevard from the Center Theater.
A number of accommodations would be necessary in order for the fire station to be suitable for use by the public. An elevator or wheelchair lift would be required to make the upper floor accessible, and more complete restrooms for both sexes would need to be installed in the ground floor, at a minimum, and possibly the upper floor as well. The seismic concerns that prompted (in part) the departure of the fire station would also have to be addressed.
Potential Uses
The building could be renovated and reconfigured in many ways; one which could utilize the existing accommodations for arts-related activities could include:
• The ground floor could become a multi-purpose room for performance, rehearsal, or classes. Such a space could accommodate up to 100 audience members, with a performance area of 500 square feet. It would be well-suited to small-scale music, spoken word, and other intimate performances and to dance or other movement classes or rehearsals.
• Renovations to the upper floor could include converting the dormitory room into classrooms for performing or fine arts classes, maintaining the kitchen,

Fremont Performing Arts Market / Center Theater Reuse / Centerville Fire Station Study Final Report
May 2009 37
and converting the other spaces into offices. Enclosing the patio may be required to accommodate this scheme.
The renovations described above, including those related to seismic and accessibility concerns, would render the fire station useable by arts or community organizations for programs, production space and offices – many of the functions envisioned in the plan for the Center Theater “incubator” project. Other possible uses may be imagined, such as recreational classes that would take advantage of the building’s high ceilings, wide clear spans, and prime street frontage.
The cost for renovations such as those described above could be as low as approximately $225 per square foot, yielding a budget of around $1 million for construction and renovation (not including fees, FF&E, and other costs).
Figure 23: Centerville Fire Station

Fremont Performing Arts Market / Center Theater Reuse / Centerville Fire Station Study Final Report
May 2009 38
V. RECOMMENDED NEXT STEPS
AMS recommends that the City undertake several steps in order to ensure the best possible outcome for the future of the performing arts in Fremont.
• Convene one or more town hall-style community workshops, in which community members may hear the results of this study and express their opinions, desires, and needs. In gatherings like this, the City should endeavor to build consensus around a plan and cultivate community leadership that will be critical to any plan’s success.
• Begin working to acquire the Center Theater from the current owner, or obtain an option to acquire the theater at a later time at an established price.
• Begin the process of identifying an operator for a renovated Center Theater. In the course of our research, AMS identified four current film venue or film and food venue operators who expressed preliminary interest in a new endeavor.
• Explore potential uses for the Centerville Fire Station, including, but not limited to: a home for city programs, community uses, commercial opportunities, etc.

Fremont Performing Arts Market / Center Theater Reuse / Centerville Fire Station Study Final Report
May 2009 39
APPENDIX A: PERSONS CONTACTED
Terry Alderete Prescott Allen Ana Apodaca Bernice Baeza Naren Bakshi Jasmine Bojic Christopher Booras Geneva Bosques Dorothy Bradley Suzanne Chan Bruce Davis Fred Diaz Melissa Dile Daren Fields Catherine Fischer Kyle Fischer Julie Gilson Taryn Hanen Bill Harrison Tim Hills Annabell Holland John C.K. Hsieh Patrick Hubley Shiraz Jivani Jill Keimach David King Kapir Kumar Dirk Lorenz
Andy MacRae Bill Marshak Sharon Marshak Nina Moore Farzana Nabi Anu Natarajan Debbie Otterstetter Rona Popal Alanna Powell Susan Rose Scott Rowits Vivian Sam Vishnu Sharma Suzanne Shenafil Sudev Sheth David Sidiq Jaideep Singh David Sloss Sue Stevens Lori Stokes June Swift Phil Swift Margaret Thornberry Bob Wasserman Stephanie Wesley Bob Wieckowski Garrett Yee

Fremont Performing Arts Market / Center Theater Reuse / Centerville Fire Station Study Final Report
May 2009 40
APPENDIX B: ORGANIZATIONS RECEIVING SURVEY Academy of Chinese Performing Arts Chinese Artist Network Fremont Art Association Fremont Cultural Arts Council Fremont Symphony Orchestra Fremont Opera Friends of Children with Special Needs Music at the Mission Olive Hyde Art Gallery The You in Me, Inc. League of Volunteers Newark Symphonic Winds Stage 1 Theatre StarStruck Theater Broadway West Theatre Company Brask House Concerts Yoko's Dance and Performing Arts Academy Music for Minors II Music Teachers Association (Southern Alameda County Branch) Fremont Education Foundation Calaveras Repertory Theatre Jensen School for the Performing Arts Mission Dance & Performing Arts Step 2 This Dance Studio

Fremont Performing Arts Market / Center Theater Reuse / Centerville Fire Station Study Final Report
May 2009 41
APPENDIX C: DEMOGRAPHIC SUMMARY Please see attached pages for the complete Demographic Summary.

Demographic Summary ReportAnalysis Geography 1: Fremont City 5/1/2009Analysis Geography 2: Primary MarketAnalysis Geography 3: Trade AreaComparison Geography: Polygon (Defined by Block Groups) AMS Planning & Research Corp.
Key Demographic Indicators
City Primary Trade Area Polygon2008 Estimated Population 205,931 320,006 599,417 582,991Age Analysis:# of Children, Ages 5-14 29,144 45,389 84,721 82,764 % Children, Ages 5-14 14.2% 14.2% 14.1% 14.2%# of Adults, Ages 35-59 79,727 121,522 223,201 215,973 % Adults, Ages 35-59 38.7% 38.0% 37.2% 37.0%# of Adults, Ages 60+ 29,187 45,544 86,328 86,201 % Adults, Ages 60+ 14.2% 14.2% 14.4% 14.8%
2008 Estimated Households 67,691 99,896 187,091 182,753Income Analysis:# of Households with Income > $75,000 36,048 53,127 86,277 83,820% Households with Income > $75,000 53.3% 53.2% 46.1% 45.9%Median Household Income* $103,587 $99,430 $90,240 $89,684*half above, half belowAverage Household Income (mean) $124,600 $118,570 $108,103 $107,303% 2003 Households Below Poverty 3.9% 4.2% 5.1% 5.0%
Educational Attainment% Adults (25+) with Bachelors Degree or Higher 43.2% 37.9% 31.8% 31.2%
Race/Ethnicity% Population Hispanic (independent of race) 14.0% 18.6% 24.5% 24.8%% Population Black/African American 2.8% 3.5% 5.9% 6.0%% Population Asian/Pacific Islander 47.1% 45.4% 39.5% 38.5%
Marital Status & Children% Single 25.2% 26.4% 28.2% 27.8%% Married 62.5% 61.6% 58.5% 58.6%% Previously Married 12.3% 12.1% 13.3% 13.6%
# of Households with Children 29,381 45,251 82,097 80,226 % Households with Children 43.4% 45.3% 43.9% 43.9%
Travel Time to Work, 2008 Pop. 16+ Yrs.% Less than 15 minutes/Work At Home 19.7% 19.3% 19.3% 18.8%% 60+ Mins. Travel to Work 13.1% 13.1% 11.9% 12.4%Average Commute Time (in minutes) 34.7 34.7 33.3 33.8Data reflect resident population only. Transient populations (e.g., seasonal residents, students)are not included. Data source: Claritas, U.S. Census, and updates.

Demographic Summary ReportAnalysis Geography 1: Fremont City 5/1/2009Analysis Geography 2: Primary MarketAnalysis Geography 3: Trade AreaComparison Geography: Polygon (Defined by Block Groups) AMS Planning & Research Corp.
Population and Growth
City Primary Trade Area PolygonPOPULATION
2013 Projection 209,895 327,931 616,384 597,593 2008 Estimate 205,931 320,006 599,417 582,991 2000 Census 203,413 312,815 581,885 569,642 1990 Census 173,331 264,982 484,044 477,130 Growth 2008 - 2013 1.9% 2.5% 2.8% 2.5%
HOUSEHOLDS
2013 Projection 68,096 100,902 190,143 184,7112008 Estimate 67,691 99,896 187,091 182,7532000 Census 68,237 99,895 184,947 182,5541990 Census 60,195 87,939 162,343 162,466Growth 1990 - 2000 13 4% 13 6% 13 9% 12 4%Growth 1990 - 2000 13.4% 13.6% 13.9% 12.4%
POPULATION GROWTH Change In Population, 1990-2000, Est. 30,082 47,833 97,841 92,512 Change In Population, 2000-2008, Est. 2,518 7,191 17,532 13,349 Change In Population, 2008-2013, Proj. 3,964 7,925 16,967 14,602 Cumulative Change In Pop., 1990-2013 36,564 62,949 132,340 120,463
17.4%
1.2%1.9%
18.1%
2.3% 2.5%
20.2%
3.0% 2.8%
19.4%
2.3% 2.5%
0%
5%
10%
15%
20%
25%
1990 - 2000 (Census) 2000 - 2008 (Est.) 2008 - 2013 (Proj.)
% G
RO
WTH
(PER
IOD
S D
IFFE
R)
City Primary Trade Area Polygon
COMPARATIVE POPULATION GROWTH, 1990 - 2013

Demographic Summary ReportAnalysis Geography 1: Fremont City 5/1/2009Analysis Geography 2: Primary MarketAnalysis Geography 3: Trade AreaComparison Geography: Polygon (Defined by Block Groups) AMS Planning & Research Corp.
City Primary Trade Area Polygon2008 EST. POPULATION BY AGE 205,931 320,006 599,417 582,991
Age 0 - 4 7.5% 7.6% 7.7% 7.8% Age 5 - 9 7.1% 7.1% 7.2% 7.2% Age 10 - 14 7.0% 7.0% 6.9% 7.0% Age 15 - 17 4.2% 4.3% 4.1% 4.1% Age 18 - 20 3.4% 3.7% 3.8% 3.8% Age 21 - 24 4.5% 4.8% 4.9% 4.9% Age 25 - 34 13.3% 13.3% 13.7% 13.4% Age 35 - 44 16.6% 16.4% 16.4% 16.2% Age 45 - 49 8.6% 8.3% 8.0% 8.0% Age 50 - 54 7.3% 7.2% 6.9% 6.9% Age 55 - 59 6.1% 6.2% 5.9% 6.0%
Age
Age 60 - 64 4.6% 4.7% 4.5% 4.5% Age 65 - 74 5.6% 5.7% 5.6% 5.7% Age 75 - 84 2.9% 2.8% 3.1% 3.3% Age 85 and over 1.1% 1.1% 1.2% 1.3%
Median Age 36.74 36.35 36.00 36.13Average Age 36.20 36.00 35.93 36.09
7.5% 7.6% 7.7% 7.8%
7.1% 7.1% 7.2% 7.2%
7.0% 7.0% 6.9% 7.0%
4.2% 4.3% 4.1% 4.1%
0%
5%
10%
15%
20%
25%
30%
City Primary Trade Area Polygon
% O
F TO
TAL
POP.
Age 15 - 17
Age 10 - 14
Age 5 - 9
Age 0 - 4
% OF EST. 2008 TOTAL POPULATION,CHILDREN BY AGE GROUP

Demographic Summary ReportAnalysis Geography 1: Fremont City 5/1/2009Analysis Geography 2: Primary MarketAnalysis Geography 3: Trade AreaComparison Geography: Polygon (Defined by Block Groups) AMS Planning & Research Corp.
Age
3.4% 3.7% 3.8% 3.8%4.5% 4.8% 4.9% 4.9%
13.3% 13.3% 13.7% 13.4%
16.6% 16.4% 16.4% 16.2%
0%
5%
10%
15%
20%
25%
30%
35%
40%
45%
City Primary Trade Area Polygon
% O
F TO
TAL
POP.
Age 35 - 44
Age 25 - 34
Age 21 - 24
Age 18 - 20
% OF EST. 2008 TOTAL POPULATION,GENERATION X (24-44) BY AGE GROUP
3.4% 3.7% 3.8% 3.8%4.5% 4.8% 4.9% 4.9%
13.3% 13.3% 13.7% 13.4%
16.6% 16.4% 16.4% 16.2%
0%
5%
10%
15%
20%
25%
30%
35%
40%
45%
City Primary Trade Area Polygon
% O
F TO
TAL
POP.
Age 35 - 44
Age 25 - 34
Age 21 - 24
Age 18 - 20
% OF EST. 2008 TOTAL POPULATION,GENERATION X (24-44) BY AGE GROUP
16.6% 16.4% 16.4% 16.2%
8.6% 8.3% 8.0% 8.0%
7.3% 7.2% 6.9% 6.9%
6.1% 6.2% 5.9% 6.0%
4.6% 4.7% 4.5% 4.5%
5.6% 5.7% 5.6% 5.7%
2.9% 2.8% 3.1% 3.3%
1.1% 1.1% 1.2% 1.3%
0%
5%
10%
15%
20%
25%
30%
35%
40%
45%
50%
55%
60%
1 2 3 4
% O
F TO
TAL
POP.
Age 85 And Over
Age 75 - 84
Age 65 - 74
Age 60 - 64
Age 55 - 59
Age 50 - 54
Age 45 - 49
Age 35 - 44
% OF EST. 2008 TOTAL POPULATION,ADULTS 35+
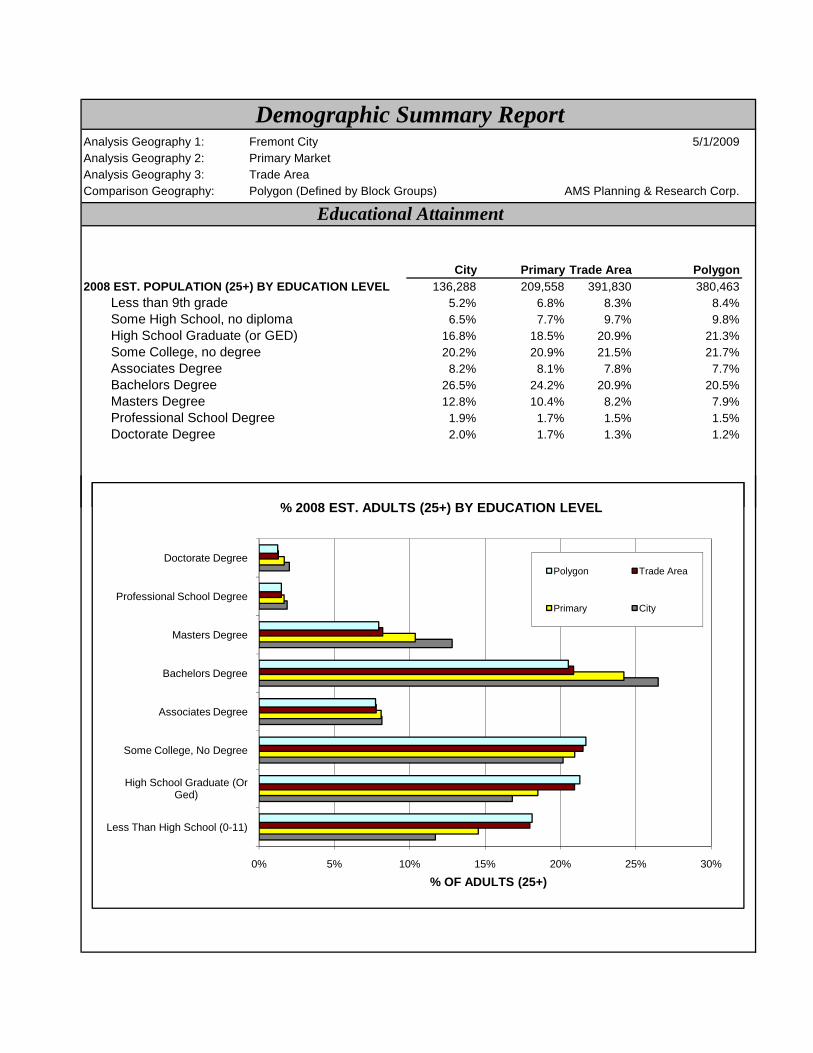
Demographic Summary ReportAnalysis Geography 1: Fremont City 5/1/2009Analysis Geography 2: Primary MarketAnalysis Geography 3: Trade AreaComparison Geography: Polygon (Defined by Block Groups) AMS Planning & Research Corp.
Educational Attainment
City Primary Trade Area Polygon2008 EST. POPULATION (25+) BY EDUCATION LEVEL 136,288 209,558 391,830 380,463
Less than 9th grade 5.2% 6.8% 8.3% 8.4%Some High School, no diploma 6.5% 7.7% 9.7% 9.8%High School Graduate (or GED) 16.8% 18.5% 20.9% 21.3%Some College, no degree 20.2% 20.9% 21.5% 21.7%Associates Degree 8.2% 8.1% 7.8% 7.7%Bachelors Degree 26.5% 24.2% 20.9% 20.5%Masters Degree 12.8% 10.4% 8.2% 7.9%Professional School Degree 1.9% 1.7% 1.5% 1.5%Doctorate Degree 2.0% 1.7% 1.3% 1.2%
% 2008 EST ADULTS (25+) BY EDUCATION LEVEL
0% 5% 10% 15% 20% 25% 30%
Less Than High School (0-11)
High School Graduate (Or Ged)
Some College, No Degree
Associates Degree
Bachelors Degree
Masters Degree
Professional School Degree
Doctorate Degree
% OF ADULTS (25+)
Polygon Trade Area
Primary City
% 2008 EST. ADULTS (25+) BY EDUCATION LEVEL

Demographic Summary ReportAnalysis Geography 1: Fremont City 5/1/2009Analysis Geography 2: Primary MarketAnalysis Geography 3: Trade AreaComparison Geography: Polygon (Defined by Block Groups) AMS Planning & Research Corp.
Income
City PrimaryTrade Area Polygon
2008 EST. HOUSEHOLDS BY INCOME 67,691 99,896 187,091 182,753Less than $15,000 4.5% 4.8% 6.0% 6.0%$15,000 - $24,999 3.8% 3.9% 5.1% 5.2%$25,000 - $34,999 4.3% 4.5% 5.9% 6.1%$35,000 - $49,999 8.3% 8.6% 10.7% 10.8%$50,000 - $74,999 16.6% 16.9% 18.4% 18.8%$75,000 - $99,999 17.1% 17.4% 16.5% 16.5%$100,000 - $149,999 24.5% 24.7% 21.5% 21.3%$150,000 - $249,999 15.6% 14.8% 12.3% 11.9%$250,000 - $499,999 3.9% 3.3% 2.7% 2.5%$500,000 and more 1.5% 1.2% 0.9% 0.9%
2008 Est. Average HH Income $113,993 $109,327 $98,539 $97,1892008 Est. Median HH Income $93,420 $91,265 $80,936 $79,6212008 Est. Income Per Capita $37,763 $34,351 $31,076 $30,721
0%
5%
10%
15%
20%
25%
30%
Less than $15,000
$15,000 -$24,999
$25,000 -$34,999
$35,000 -$49,999
$50,000 -$74,999
$75,000 -$99,999
$100,000 -$149,999
$150,000+
% o
f HO
USE
HO
LDS
City: Median = $93,420
Primary: Median = $91,270
Trade Area: Median = $80,940
Polygon: Median = $79,620
EST. 2008 HOUSEHOLD INCOME

Demographic Summary ReportAnalysis Geography 1: Fremont City 5/1/2009Analysis Geography 2: Primary MarketAnalysis Geography 3: Trade AreaComparison Geography: Polygon (Defined by Block Groups) AMS Planning & Research Corp.
Race
City Primary Trade Area Polygon2008 ESTIMATED POPULATION 205,931 320,006 599,417 582,991
White 37.8% 36.0% 36.0% 36.6%Black 2.8% 3.5% 5.9% 6.0%Asian & Pacific Islander 47.1% 45.4% 39.5% 38.5%Other Races 12.3% 15.1% 18.6% 18.9%Hispanic Origin (Independent Of Race) 14.0% 18.6% 24.5% 24.8%
2008 HISPANICS BY RACE 28,750 59,478 146,872 144,455White Alone 44.9% 43.6% 41.6% 41.3%Black 1.0% 1.0% 1.1% 1.1%Other 54.1% 55.4% 57.4% 57.7%
2008 EST. POP. BY HISPANIC OR LATINO BY ORIGIN 205,931 320,006 599,417 582,991Not Of Hispanic Origin 86 0% 81 4% 75 5% 75 2%Not Of Hispanic Origin 86.0% 81.4% 75.5% 75.2%HISPANIC OR LATINO: 28,750 59,478 146,872 144,455Mexican 69.2% 72.4% 71.9% 71.8%Puerto Rican 4.5% 3.8% 4.1% 4.1%Cuban 0.6% 0.5% 0.5% 0.5%Other Hispanic 25.7% 23.3% 23.5% 23.6%
0% 5% 10% 15% 20% 25% 30% 35% 40% 45% 50%
Hispanic*
Other
Asian/Pac. Isl.
Black
White
% OF POPULATION*Independent of Race
Polygon Trade Area Primary City
RACE/ETHNICITY

Demographic Summary ReportAnalysis Geography 1: Fremont City 5/1/2009Analysis Geography 2: Primary MarketAnalysis Geography 3: Trade AreaComparison Geography: Polygon (Defined by Block Groups) AMS Planning & Research Corp.
Marital Status & Household Composition
City Primary Trade Area PolygonMARITAL STATUS PERSONS 15+ 161,297 250,365 468,258 454,940
SINGLE MALE 14.5% 15.1% 16.2% 15.9%SINGLE FEMALE 10.7% 11.3% 12.0% 11.9%MARRIED 57.8% 56.2% 52.1% 52.4%PREVIOUSLY MARRIED MALE 4.0% 3.9% 4.5% 4.5%PREVIOUSLY MARRIED FEMALE 8.3% 8.2% 8.8% 9.1%
HOUSEHOLDS WITH CHILDREN UNDER 18 (2008) TOTAL HOUSEHOLDS 67,691 99,896 187,091 182,753HOUSEHOLDS WITH CHILDREN 29,381 45,145 81,560 79,793% HOUSEHOLDS WITH CHILDREN 43.4% 45.2% 43.6% 43.7%% MARRIED COUPLE FAMILY 62.5% 63.3% 58.5% 58.6%
HOUSEHOLDS BY TYPEHOUSEHOLDS BY TYPEwith 1 or more People Age 18 or under: 67,691 99,896 187,091 182,753 Married Couple 35.1% 36.2% 33.2% 33.3% Other Family-Male Head 2.4% 2.6% 2.9% 2.9% Other Family-Female Head 5.6% 6.2% 7.3% 7.3% Nonfamily-Male Head 0.3% 0.3% 0.3% 0.3% Nonfamily-Female Head 0.1% 0.1% 0.1% 0.1%with no People Age 18 or under: Married Couple 27.3% 27.1% 25.3% 25.3% Other Family-Male Head 2.3% 2.4% 2.5% 2.5% Other Family-Female Head 3.7% 3.9% 4.3% 4.4% Nonfamily-Male Head 12.5% 11.3% 12.4% 12.1% Nonfamily-Female Head 10.7% 10.1% 11.5% 11.8%
0%
10%
20%
30%
40%
50%
60%
70%
Single Male Single Female Married Couple Other Family-Male Head
Other Family-Female Head
Family Households
% O
F TO
TAL
City Primary Trade Area Polygon
HOUSEHOLD COMPOSITION ANALYSIS

Demographic Summary ReportAnalysis Geography 1: Fremont City 5/1/2009Analysis Geography 2: Primary MarketAnalysis Geography 3: Trade AreaComparison Geography: Polygon (Defined by Block Groups) AMS Planning & Research Corp.
Property Values & Housing Stock
City Primary Trade Area PolygonOWNER OCCUPIED PROPERTY VALUES 42,922 65,763 116,502 114,118
Less than $20,000 0.10% 0.14% 0.17% 0.20%$20,000 - $39,999 0.26% 0.32% 0.40% 0.39%$40,000 - $59,999 0.79% 0.79% 1.02% 0.90%$60,000 - $79,999 1.30% 1.39% 1.22% 1.18%$80,000 - $99,999 0.80% 0.87% 1.09% 0.94%$100,000 - $149,999 1.41% 1.51% 2.23% 2.01%$150,000 - $199,999 0.82% 0.87% 1.62% 1.49%$200,000 - $299,999 2.69% 3.27% 4.50% 4.59%$300,000 - $399,999 6.13% 7.26% 10.61% 11.19%$400,000 - $499,999 9.89% 10.89% 15.21% 15.77%$500,000 + 75.81% 72.68% 61.92% #REF!
2008 MEDIAN PROPERTY VALUE $677,935 $651,555 $584,454 $581,447
YEAR ROUND UNITS IN STRUCTURE 69,321 102,069 192,079 187,400 1 Unit Attached 10.2% 10.6% 10.1% 9.5% 1 Unit Detached 58.5% 60.5% 57.0% 58.6% 2 Units 0.8% 1.0% 1.4% 1.4% 3 to 19 Units 12.1% 11.5% 12.8% 12.7% 20 to 49 Units 4.9% 4.1% 4.7% 4.9% 50 or More Units 12.4% 10.5% 10.4% 10.0% Mobile Home Or Trailer 1.2% 1.7% 3.6% 2.9% Boat, RV, Van, etc. 0.0% 0.0% 0.0% 0.0%
SINGLE/MULTIPLE UNIT RATIO 2.28 2.62 2.29 2.36
HOUSING UNITS BY YEAR BUILT 69,321 102,069 192,079 187,400Built 1999 to present 6.4% 7.2% 8.6% 7.7%Built 1995 to 1998 5.6% 5.8% 5.0% 4.6%Built 1990 to 1994 6.4% 5.9% 6.3% 5.5%Built 1980 to 1989 23.3% 21.8% 17.3% 17.6%Built 1970 to 1979 23.2% 25.8% 22.0% 22.0%Built 1960 to 1969 21.3% 20.4% 18.3% 18.5%Built 1950 to 1959 10.6% 9.6% 15.3% 16.3%Built 1940 to 1949 1.7% 1.9% 4.8% 5.3%Built 1939 Or Earlier 1.5% 1.6% 2.4% 2.5%
2008 EST. TENURE OF OCCUPIED HOUSING UNITS 67,691 99,896 187,091 182,753Owner Occupied 63.4% 65.8% 62.3% 62.4%Renter Occupied 36.6% 34.2% 37.7% 37.6%

Demographic Summary ReportAnalysis Geography 1: Fremont City 5/1/2009Analysis Geography 2: Primary MarketAnalysis Geography 3: Trade AreaComparison Geography: Polygon (Defined by Block Groups) AMS Planning & Research Corp.
No. of Vehicles & Travel Time To Work
City Primary Trade Area Polygon2008 EST. HOUSEHOLDS BY NO. OF VEHICLES 67,691 99,896 187,091 182,753
NO VEHICLES 4.8% 4.8% 5.8% 6.0%1 VEHICLE 26.5% 25.1% 27.6% 27.4%2 VEHICLES 44.1% 43.2% 41.3% 41.3%3 VEHICLES 17.3% 18.4% 16.9% 17.0%4 VEHICLES 5.2% 6.0% 5.8% 5.9%5 OR MORE VEHICLES 2.0% 2.5% 2.5% 2.5%
2008 EST. POPULATION 16+ BY TRAVEL TIME TO WORK 99,066 151,876 277,244 269,111LESS THAN 15 MINUTES 19.7% 19.3% 19.3% 18.8%15 - 29 MINUTES 28.0% 28.3% 32.2% 31.7%30 To 44 MINUTES 24.8% 25.2% 24.4% 24.6%45 To 59 MINUTES 14.3% 14.2% 12.1% 12.5%60 OR MORE MINUTES 13.1% 13.1% 11.9% 12.4%
EST. AVERAGE TRAVEL TIME IN MINUTES 34.7 34.7 33.3 33.8
2008 EST. POPULATION 16+ BY TRANSPORTATION TO WORK 101,808 155,598 283,206 274,983DROVE ALONE 77.4% 76.2% 75.1% 74.6%CAR POOLED 12.3% 13.8% 14.6% 14.9%PUBLIC TRANSPORTATION 5.0% 5.1% 5.3% 5.4%WALKED 1.1% 1.1% 1.4% 1.3%MOTORCYCLE 0.3% 0.3% 0.3% 0.3%BICYCLE 0.6% 0.6% 0.5% 0.5%OTHER MEANS 0.6% 0.7% 0.8% 0.8%WORKED AT HOME 2.7% 2.4% 2.1% 2.1%
13%
13%
12%
12%
14%
14%
12%
13%
25%
25%
24%
25%
28%
28%
32%
32%
20%
19%
19%
19%
0% 10% 20% 30% 40% 50% 60% 70% 80% 90% 100%
City
Primary
Trade Area
Polygon
% OF ADULT POP.
60+ Minutes 45 To 59 Minutes 30 To 44 Minutes 15 To 29 Minutes Under 15 Minutes / Work At Home
2008 ESTIMATED POPULATION (16+) BY DRIVE TIME TO WORK

Demographic Summary ReportAnalysis Geography 1: Fremont City 5/1/2009Analysis Geography 2: Primary MarketAnalysis Geography 3: Trade AreaComparison Geography: Polygon (Defined by Block Groups) AMS Planning & Research Corp.
Occupation
City Primary Trade Area Polygon2008 EST. POPULATION 16+ BY OCCUPATION 103,791 158,937 289,472 281,130
EXECUTIVE AND MANAGERIAL 18.8% 17.1% 15.1% 14.9%PROFESSIONAL AND RELATED SERVICES 31.1% 27.7% 24.7% 24.1%SERVICE 7.8% 9.1% 10.3% 10.4%SALES AND OFFICE 24.7% 25.6% 26.5% 26.9%FARMING / FISHING / FORESTRY 0.1% 0.1% 0.2% 0.2%CONSTRUCTION / EXTRACTION / MAINTENANCE 6.2% 6.9% 8.0% 8.3%TRANSPORTATION AND MATERIAL MOVING 11.3% 13.6% 15.2% 15.2%
0% 5% 10% 15% 20% 25% 30% 35%
Production, Transportation and Material Moving
Construction, Extraction and Maintenance
Farming, Fishing and Forestry
Sales and Office
Service
Professional and Related Services
Management, Business and Financial Operations
% 2008 POP. 16+
Polygon Trade Area Primary City
2008 % POPULATION 16+ BY OCCUPATION