periodicals mail study joint report of the united states...
TRANSCRIPT


Contents
Executive Summary. . . . . . . . . . . . . . . . . . . . . . . . . . . . . . . . . . . . . . . . . . . . . . . . . 1
1 Introduction . . . . . . . . . . . . . . . . . . . . . . . . . . . . . . . . . . . . . . . . . . . . . . . . . . . . . 5Mandate for Report . . . . . . . . . . . . . . . . . . . . . . . . . . . . . . . . . . . . . . . . . . . . . . . . . . . . . . . . . . . . 5
Data Quality. . . . . . . . . . . . . . . . . . . . . . . . . . . . . . . . . . . . . . . . . . . . . . . . . . . . . . . . . . . . . . . . 5
Efficiencies and Pricing Incentives . . . . . . . . . . . . . . . . . . . . . . . . . . . . . . . . . . . . . . . . . . . . . . 5
Description of Periodicals Class. . . . . . . . . . . . . . . . . . . . . . . . . . . . . . . . . . . . . . . . . . . . . . . . . . . 6
Issues Related to Periodicals Mail’s Shape and Characteristics . . . . . . . . . . . . . . . . . . . . . . . . . . 7
2 Classification and Pricing . . . . . . . . . . . . . . . . . . . . . . . . . . . . . . . . . . . . . . . . . . 11History. . . . . . . . . . . . . . . . . . . . . . . . . . . . . . . . . . . . . . . . . . . . . . . . . . . . . . . . . . . . . . . . . . . . . . . 11
Periodicals Under the Postal Reorganization Act . . . . . . . . . . . . . . . . . . . . . . . . . . . . . . . . . . . 11
Review Team 1997–1999 . . . . . . . . . . . . . . . . . . . . . . . . . . . . . . . . . . . . . . . . . . . . . . . . . . . . . 16
Periodicals Complaint Case . . . . . . . . . . . . . . . . . . . . . . . . . . . . . . . . . . . . . . . . . . . . . . . . . . . 18
Docket No. R2006-1 . . . . . . . . . . . . . . . . . . . . . . . . . . . . . . . . . . . . . . . . . . . . . . . . . . . . . . . . . 19
Pricing and the Postal Accountability and Enhancement Act . . . . . . . . . . . . . . . . . . . . . . . . . . . . 20
Mail Volume and Cost Coverage 1972–2010 . . . . . . . . . . . . . . . . . . . . . . . . . . . . . . . . . . . . . . . . . 21
Publications Database Analysis . . . . . . . . . . . . . . . . . . . . . . . . . . . . . . . . . . . . . . . . . . . . . . . . . . . 23
3 Operational Context. . . . . . . . . . . . . . . . . . . . . . . . . . . . . . . . . . . . . . . . . . . . . . . 31Introduction. . . . . . . . . . . . . . . . . . . . . . . . . . . . . . . . . . . . . . . . . . . . . . . . . . . . . . . . . . . . . . . . . . . 31
Network, Facilities and Logistics . . . . . . . . . . . . . . . . . . . . . . . . . . . . . . . . . . . . . . . . . . . . . . . . . . 31
Network . . . . . . . . . . . . . . . . . . . . . . . . . . . . . . . . . . . . . . . . . . . . . . . . . . . . . . . . . . . . . . . . . . . 31
Postal Processing Facilities (Plants) . . . . . . . . . . . . . . . . . . . . . . . . . . . . . . . . . . . . . . . . . . . . . 33
Logistics . . . . . . . . . . . . . . . . . . . . . . . . . . . . . . . . . . . . . . . . . . . . . . . . . . . . . . . . . . . . . . . . . . 34
Flat-Shaped Mail Volume . . . . . . . . . . . . . . . . . . . . . . . . . . . . . . . . . . . . . . . . . . . . . . . . . . . . . . . . 35
Packaging and Presort . . . . . . . . . . . . . . . . . . . . . . . . . . . . . . . . . . . . . . . . . . . . . . . . . . . . . . . . . . 36
Flats Processing Equipment. . . . . . . . . . . . . . . . . . . . . . . . . . . . . . . . . . . . . . . . . . . . . . . . . . . . . . 37
Bundle Sortation . . . . . . . . . . . . . . . . . . . . . . . . . . . . . . . . . . . . . . . . . . . . . . . . . . . . . . . . . . . . 37
Automation Piece Sortation . . . . . . . . . . . . . . . . . . . . . . . . . . . . . . . . . . . . . . . . . . . . . . . . . . . 39
Manual Sortation . . . . . . . . . . . . . . . . . . . . . . . . . . . . . . . . . . . . . . . . . . . . . . . . . . . . . . . . . . . . 42
Mail Entry . . . . . . . . . . . . . . . . . . . . . . . . . . . . . . . . . . . . . . . . . . . . . . . . . . . . . . . . . . . . . . . . . . . . 42
Mail Entry. . . . . . . . . . . . . . . . . . . . . . . . . . . . . . . . . . . . . . . . . . . . . . . . . . . . . . . . . . . . . . . . . . 42
Origin Entry . . . . . . . . . . . . . . . . . . . . . . . . . . . . . . . . . . . . . . . . . . . . . . . . . . . . . . . . . . . . . . . . 43
Destination Entry . . . . . . . . . . . . . . . . . . . . . . . . . . . . . . . . . . . . . . . . . . . . . . . . . . . . . . . . . . . . 43
Facility Access and Shipment Tracking . . . . . . . . . . . . . . . . . . . . . . . . . . . . . . . . . . . . . . . . . . 43
September 2011 i
Contents
Mail Flow. . . . . . . . . . . . . . . . . . . . . . . . . . . . . . . . . . . . . . . . . . . . . . . . . . . . . . . . . . . . . . . . . . . . . 46
Mail Flow and Mailing Requirements . . . . . . . . . . . . . . . . . . . . . . . . . . . . . . . . . . . . . . . . . . . . . . . 48
Importance of Defining Requirements . . . . . . . . . . . . . . . . . . . . . . . . . . . . . . . . . . . . . . . . . . . 48
Changes in Requirements Promote Mail Efficiencies . . . . . . . . . . . . . . . . . . . . . . . . . . . . . . . . 50
4 Service Performance Standards. . . . . . . . . . . . . . . . . . . . . . . . . . . . . . . . . . . . . 51Introduction. . . . . . . . . . . . . . . . . . . . . . . . . . . . . . . . . . . . . . . . . . . . . . . . . . . . . . . . . . . . . . . . . . . 51
Background . . . . . . . . . . . . . . . . . . . . . . . . . . . . . . . . . . . . . . . . . . . . . . . . . . . . . . . . . . . . . . . . . . 51
FY 2008. . . . . . . . . . . . . . . . . . . . . . . . . . . . . . . . . . . . . . . . . . . . . . . . . . . . . . . . . . . . . . . . . . . . . . 52
Interim Reporting Approach . . . . . . . . . . . . . . . . . . . . . . . . . . . . . . . . . . . . . . . . . . . . . . . . . . . 53
5 Costs, Trends, and Data Quality . . . . . . . . . . . . . . . . . . . . . . . . . . . . . . . . . . . . . 57Introduction. . . . . . . . . . . . . . . . . . . . . . . . . . . . . . . . . . . . . . . . . . . . . . . . . . . . . . . . . . . . . . . . . . . 57
Cost Revenue Analysis Methodology. . . . . . . . . . . . . . . . . . . . . . . . . . . . . . . . . . . . . . . . . . . . . . . 57
Data Quality Study and Methodology Changes . . . . . . . . . . . . . . . . . . . . . . . . . . . . . . . . . . . . . . . 61
Testing Data Quality and Ongoing Work . . . . . . . . . . . . . . . . . . . . . . . . . . . . . . . . . . . . . . . . . . . . 62
Data for Within County Periodicals. . . . . . . . . . . . . . . . . . . . . . . . . . . . . . . . . . . . . . . . . . . . . . . . . 63
Analysis of FY 2010 Outside County Periodicals Costs. . . . . . . . . . . . . . . . . . . . . . . . . . . . . . . . . 64
FY 2010 Outside County Periodicals Attributable Costs . . . . . . . . . . . . . . . . . . . . . . . . . . . . . . . . 64
Mail Processing. . . . . . . . . . . . . . . . . . . . . . . . . . . . . . . . . . . . . . . . . . . . . . . . . . . . . . . . . . . . . 65
Delivery Costs . . . . . . . . . . . . . . . . . . . . . . . . . . . . . . . . . . . . . . . . . . . . . . . . . . . . . . . . . . . . . . 67
Periodicals Outside County Unit Cost Trends Over the Past Decade . . . . . . . . . . . . . . . . . . . . . . 69
Comparison of Periodicals Flats Cost Estimates to Standard Mail Flats Cost Estimates . . . . . . . 71
Manual Sortation Costs . . . . . . . . . . . . . . . . . . . . . . . . . . . . . . . . . . . . . . . . . . . . . . . . . . . . . . . . . 76
Machinability Requirements . . . . . . . . . . . . . . . . . . . . . . . . . . . . . . . . . . . . . . . . . . . . . . . . . . . 76
Failure to Meet Critical Entry Time . . . . . . . . . . . . . . . . . . . . . . . . . . . . . . . . . . . . . . . . . . . . . . 76
Hot-2C Procedures . . . . . . . . . . . . . . . . . . . . . . . . . . . . . . . . . . . . . . . . . . . . . . . . . . . . . . . . . . 77
AFSM 100 Capacity . . . . . . . . . . . . . . . . . . . . . . . . . . . . . . . . . . . . . . . . . . . . . . . . . . . . . . . . . 77
Small Parcel and Bundle Sorter and Automated Parcel and Bundle Sorter Efficiency/Capacity . . . . . . . . . . . . . . . . . . . . . . . . . . . . . . . . . . . . . . . . . . . . . . . . . . . . . 78
Mail Transport Equipment Shortages . . . . . . . . . . . . . . . . . . . . . . . . . . . . . . . . . . . . . . . . . . . . 78
Postal Regulatory Commission Comments . . . . . . . . . . . . . . . . . . . . . . . . . . . . . . . . . . . . . . . 78
United States Postal Service Comments . . . . . . . . . . . . . . . . . . . . . . . . . . . . . . . . . . . . . . . . . 79
6 Operations Strategies for Increasing Efficiency of Periodicals Mail. . . . . . . . 81Introduction. . . . . . . . . . . . . . . . . . . . . . . . . . . . . . . . . . . . . . . . . . . . . . . . . . . . . . . . . . . . . . . . . . . 81
Full Deployment and Development of the Flats Sequencing System . . . . . . . . . . . . . . . . . . . . . . 81
Ensure Packaging Integrity for Bundles and Pallets. . . . . . . . . . . . . . . . . . . . . . . . . . . . . . . . . . . . 82
Reduce or Eliminate Bundle Breakage Issues . . . . . . . . . . . . . . . . . . . . . . . . . . . . . . . . . . . . . 82
Enhance Pallet Integrity. . . . . . . . . . . . . . . . . . . . . . . . . . . . . . . . . . . . . . . . . . . . . . . . . . . . . . . 83
Expand Comailing and Co-palletization Options . . . . . . . . . . . . . . . . . . . . . . . . . . . . . . . . . . . . . . 83
Lower Transportation Costs . . . . . . . . . . . . . . . . . . . . . . . . . . . . . . . . . . . . . . . . . . . . . . . . . . . 84
Build Best Practices and Standardize Where Possible. . . . . . . . . . . . . . . . . . . . . . . . . . . . . . . 85
ii Periodicals Mail Study
Contents
Use Existing Equipment to Move Flat Mail “Up the Ladder” . . . . . . . . . . . . . . . . . . . . . . . . . . . . . 85
Further Standardize Mail Entry and Mail Flows . . . . . . . . . . . . . . . . . . . . . . . . . . . . . . . . . . . . . . . 86
Hot-2C Practices Have Been Eliminated . . . . . . . . . . . . . . . . . . . . . . . . . . . . . . . . . . . . . . . . . 86
Merge Mail Classes at Destination Sort . . . . . . . . . . . . . . . . . . . . . . . . . . . . . . . . . . . . . . . . . . 86
Enhance Tracking of Flats Operations Performance . . . . . . . . . . . . . . . . . . . . . . . . . . . . . . . . 87
Reduce Flats Mail Preparation Costs . . . . . . . . . . . . . . . . . . . . . . . . . . . . . . . . . . . . . . . . . . . . . . . 87
Finalize Bundles Requiring Distribution Early in Process . . . . . . . . . . . . . . . . . . . . . . . . . . . . . 87
Reduce Handlings and Increase Unit/Container Density . . . . . . . . . . . . . . . . . . . . . . . . . . . . . 87
Change Mailing Requirements to Promote Efficiencies . . . . . . . . . . . . . . . . . . . . . . . . . . . . . . 87
Continue to Collaborate with Mailers on Customer Participation and Worksharing Programs . . . 88
Align Periodicals Preparation with Processes. . . . . . . . . . . . . . . . . . . . . . . . . . . . . . . . . . . . . . 88
Increase Customer-Applied Barcoded Flats Volume . . . . . . . . . . . . . . . . . . . . . . . . . . . . . . . . 89
Entry/Induct Periodicals Where First Process Occurs . . . . . . . . . . . . . . . . . . . . . . . . . . . . . . . 89
7 Findings. . . . . . . . . . . . . . . . . . . . . . . . . . . . . . . . . . . . . . . . . . . . . . . . . . . . . . . . . 91Introduction. . . . . . . . . . . . . . . . . . . . . . . . . . . . . . . . . . . . . . . . . . . . . . . . . . . . . . . . . . . . . . . . . . . 91
Key Issues. . . . . . . . . . . . . . . . . . . . . . . . . . . . . . . . . . . . . . . . . . . . . . . . . . . . . . . . . . . . . . . . . . . . 91
Streamline Periodicals Pricing . . . . . . . . . . . . . . . . . . . . . . . . . . . . . . . . . . . . . . . . . . . . . . . . . . . . 93
Postal Service Findings . . . . . . . . . . . . . . . . . . . . . . . . . . . . . . . . . . . . . . . . . . . . . . . . . . . . . . . . . 95
Flats Sequencing System – Complete Phase I . . . . . . . . . . . . . . . . . . . . . . . . . . . . . . . . . . . . . 95
Shift Flats Up the Ladder . . . . . . . . . . . . . . . . . . . . . . . . . . . . . . . . . . . . . . . . . . . . . . . . . . . . . 96
Automated Parcel and Bundle Sorter . . . . . . . . . . . . . . . . . . . . . . . . . . . . . . . . . . . . . . . . . . . . 96
Postal Regulatory Commission Findings . . . . . . . . . . . . . . . . . . . . . . . . . . . . . . . . . . . . . . . . . . . . 97
8 Conclusion . . . . . . . . . . . . . . . . . . . . . . . . . . . . . . . . . . . . . . . . . . . . . . . . . . . . . . 101
September 2011 iii
Appendices
Appendices
Appendix A — Periodicals Pricing Structure. . . . . . . . . . . . . . . . . . . . . . . . . . . . . A-1
Appendix B — Within County Periodicals . . . . . . . . . . . . . . . . . . . . . . . . . . . . . . . B-1
Appendix C — History of the Periodicals Mail Class . . . . . . . . . . . . . . . . . . . . . . C-1
Appendix D — Periodicals Industry Overview. . . . . . . . . . . . . . . . . . . . . . . . . . . . D-1
Appendix E — Pieces of Mail Handled, Number of Post Offices, Income, and Expenses 1789 to 2010 . . . . . . . . . . . . . . . . . . . . . . . . . . . . . . . . E-1
Appendix F — Total Periodicals Historical Volume And Revenue . . . . . . . . . . . F-1
Appendix G — Standardized Destination Entry Critical Entry Time Matrix for Periodicals Mail . . . . . . . . . . . . . . . . . . . . . . . . . . . . . . . . . . . . G-1
Appendix H — Select Mailer Interviews and Feedback . . . . . . . . . . . . . . . . . . . . H-1
Appendix I — Calculation of Amount of Applicable Change in CPI-U and Price . . . . . . . . . . . . . . . . . . . . . . . . . . . . . . . . . . . . . . . . . . . . . . . . . I-1
Appendix J — Derivation of CVs of Unit Volume Variable Costs of Postal Products . . . . . . . . . . . . . . . . . . . . . . . . . . . . . . . . . . . . . . . . . . . . . . . . . J-1
Appendix K — 2010 Periodicals Volume by Shape. . . . . . . . . . . . . . . . . . . . . . . . K-1
Appendix L — Additional Operations Information . . . . . . . . . . . . . . . . . . . . . . . . L-1
Appendix M — Second-Class Mail Within-County Rates History January 1, 1970 – February 2, 1991. . . . . . . . . . . . . . . . . . . . . . . . . . . . . . . . . . M-1
Appendix N — Second Class Mail Regular Rate and Publisher’s Commingled Rate History . . . . . . . . . . . . . . . . . . . . . . . . . . . . . . . . . . . . . . . . . N-1
Appendix O — Periodicals Outside County Unit Cost Trends Over the Past Decade—Additional Analysis . . . . . . . . . . . . . . . . . . . . . . . . . . O-1
Appendix P — List of Acronyms. . . . . . . . . . . . . . . . . . . . . . . . . . . . . . . . . . . . . . . P-1
iv Periodicals Mail Study
List of Figures
Figure 1: Comparison of Real per Piece Costs Across Mail ClassesAll Shapes, FY 1990–FY 2010 . . . . . . . . . . . . . . . . . . . . . . . . . . . . . . . . . . . . . . . . . . . . . . . . . . . . . . 8
Figure 2: Comparison of Total Unit Attributable Costs for Flats Across Mail Classes, FY 1999–FY 2010 . . . . . . . . . . . . . . . . . . . . . . . . . . . . . . . . . . . . . . . . . . . . . . . . . . . . . . . . . . . . . . . 9
Figure 3: Historical Periodicals Mail Volume 1972–2010 . . . . . . . . . . . . . . . . . . . . . . . . . . . . . . . . . . 22
Figure 4: Historical Weight per Piece and Revenue per Piece for Outside County Periodicals 2004–2010 . . . . . . . . . . . . . . . . . . . . . . . . . . . . . . . . . . . . . . . . . . . . . . . . . . . . . . . . . . . 23
Figure 5: FY 2009 Cost Coverage and Dollar Losses by Volume Category . . . . . . . . . . . . . . . . . . . . 24
Figure 6: FY 2009 Cost Coverage of Periodicals Grouped by Delivery . . . . . . . . . . . . . . . . . . . . . . . 25
Figure 7: Percent of Volume Presorted to Carrier Route by Total Publication Volume. . . . . . . . . . . . 28
Figure 8: Percent Postal Service Loss in Contribution from Periodicals by Publication. . . . . . . . . . . 29
Figure 9: FY 2010 Flat Volume Percentage by Class . . . . . . . . . . . . . . . . . . . . . . . . . . . . . . . . . . . . . 35
Figure 10: Automated Package Processing Systems . . . . . . . . . . . . . . . . . . . . . . . . . . . . . . . . . . . . . 38
Figure 11: Small Parcel and Bundle Sorter . . . . . . . . . . . . . . . . . . . . . . . . . . . . . . . . . . . . . . . . . . . . . 39
Figure 12: Automated Flat Sorting Machine 100. . . . . . . . . . . . . . . . . . . . . . . . . . . . . . . . . . . . . . . . . 40
Figure 13: Upgraded Flats Sorting Machine 1000 (UFSM 1000) . . . . . . . . . . . . . . . . . . . . . . . . . . . . 41
Figure 14: Flats Sequencing System. . . . . . . . . . . . . . . . . . . . . . . . . . . . . . . . . . . . . . . . . . . . . . . . . . 42
Figure 15: Periodicals End-to-End Flow Chart . . . . . . . . . . . . . . . . . . . . . . . . . . . . . . . . . . . . . . . . . . 46
Figure 16: Periodicals Flow (FSS and non-FSS) . . . . . . . . . . . . . . . . . . . . . . . . . . . . . . . . . . . . . . . . . 47
Figure 17: Newspaper Roll . . . . . . . . . . . . . . . . . . . . . . . . . . . . . . . . . . . . . . . . . . . . . . . . . . . . . . . . . 48
Figure 18: Person Hand Sorting Newspaper Manually . . . . . . . . . . . . . . . . . . . . . . . . . . . . . . . . . . . . 49
Figure 19: Flat Folded Mailpiece . . . . . . . . . . . . . . . . . . . . . . . . . . . . . . . . . . . . . . . . . . . . . . . . . . . . . 49
Figure 20: Bundle Tied with Plastic String on Rollers . . . . . . . . . . . . . . . . . . . . . . . . . . . . . . . . . . . . . 49
Figure 21: Single Sack on Pallet . . . . . . . . . . . . . . . . . . . . . . . . . . . . . . . . . . . . . . . . . . . . . . . . . . . . . 50
Figure 22: Fiscal Year 2010 Service Standard Performance for Periodicals . . . . . . . . . . . . . . . . . . . 55
Figure 23: Process of Attributing Costs to Mail Products. . . . . . . . . . . . . . . . . . . . . . . . . . . . . . . . . . 59
Figure 24: FY 2010 Distribution of Outside County Periodicals Unit Costs by Function . . . . . . . . . . 65
Figure 25: Periodicals Outside County Unit Cost Trends . . . . . . . . . . . . . . . . . . . . . . . . . . . . . . . . . . 69
Figure 26: Periodicals versus Standard Mail Carrier Route Percent of Total Flats by Presort Level FY 2010 . . . . . . . . . . . . . . . . . . . . . . . . . . . . . . . . . . . . . . . . . . . . . . . . . . . . . . . . . . . . 75
September 2011 v
Periodicals Mail Study
List of Tables
Table 1: Historical Periodicals Contribution to Institutional Costs 1972-2010 ($ in Millions) . . . . . . . 14
Table 2: Mail Characteristics and Contribution per Piece for Publications Grouped by Delivery Frequency . . . . . . . . . . . . . . . . . . . . . . . . . . . . . . . . . . . . . . . . . . . . . . . . . . . . . . . . . . . . . . 26
Table 3: Standardized Destination Entry Critical Entry Time for Periodicals . . . . . . . . . . . . . . . . . . . 44
Table 4: Outside County Periodicals Mail Processing Costs by Facility/Operation Type — FY 2010 (cents per piece) . . . . . . . . . . . . . . . . . . . . . . . . . . . . . . . . . . . . . . . . . . . . . . . . . . . . . . . . . 66
Table 5: Outside County Periodicals Delivery Costs FY 2010 (cents per piece) . . . . . . . . . . . . . . . . . . . . . . . . . . . . . . . . . . . . . . . . . . . . . . . . . . . . . . . . . . . . . . . . . 68
Table 6: Outside County Periodicals versus Standard Mail Flats Costs FY 2010 . . . . . . . . . . . . . . . 72
Table 7: Cost-Driving Characteristics of Outside County Periodicals Flats and Standard Basic Carrier Route and Non-Carrier Route . . . . . . . . . . . . . . . . . . . . . . . . . . . . . . . . . . . . . . . . . . . . 73
Table 8: Outside County Periodicals Flats versus Standard Mail Flats Mail Processing Costs (Labor and Indirect) by Facility/Operation Type FY 2010 (cents per piece) . . . . . . . . . . . . . . 74
Table 9: Projected Upper-Bound Savings From Operational Changes . . . . . . . . . . . . . . . . . . . . . . . 95
vi Periodicals Mail Study
Executive Summary
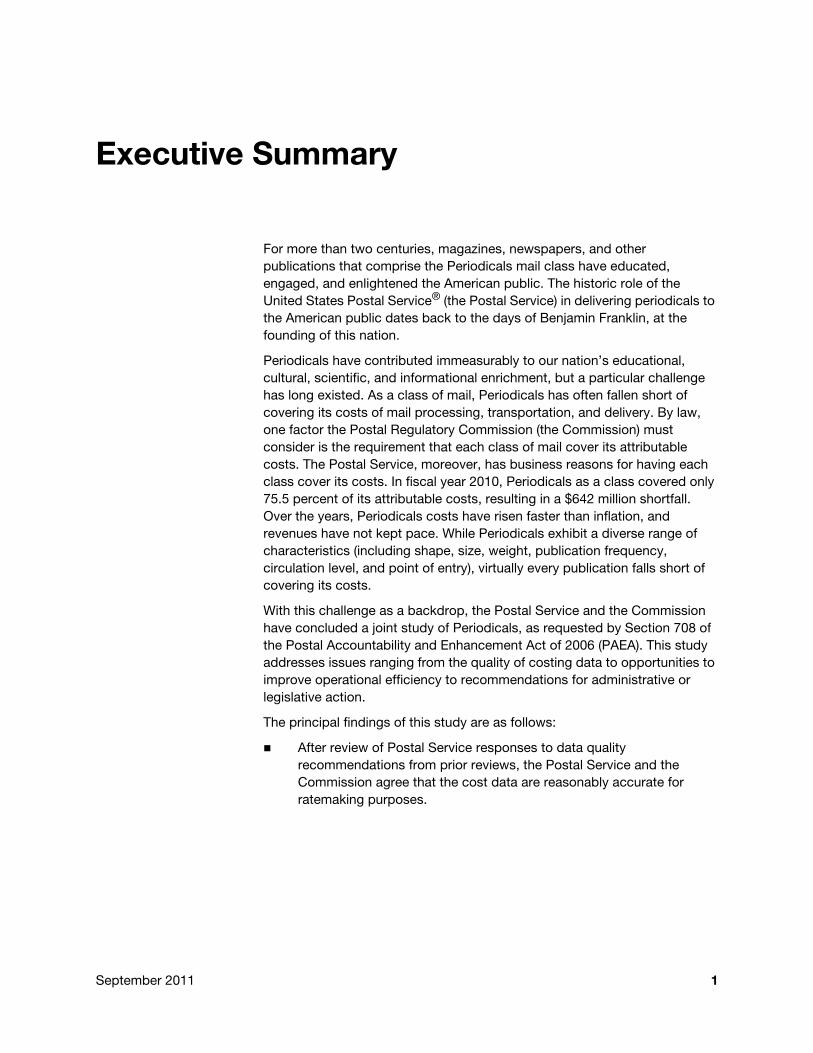
For more than two centuries, magazines, newspapers, and other publications that comprise the Periodicals mail class have educated, engaged, and enlightened the American public. The historic role of the United States Postal Service® (the Postal Service) in delivering periodicals to the American public dates back to the days of Benjamin Franklin, at the founding of this nation.
Periodicals have contributed immeasurably to our nation’s educational, cultural, scientific, and informational enrichment, but a particular challenge has long existed. As a class of mail, Periodicals has often fallen short of covering its costs of mail processing, transportation, and delivery. By law, one factor the Postal Regulatory Commission (the Commission) must consider is the requirement that each class of mail cover its attributable costs. The Postal Service, moreover, has business reasons for having each class cover its costs. In fiscal year 2010, Periodicals as a class covered only 75.5 percent of its attributable costs, resulting in a $642 million shortfall. Over the years, Periodicals costs have risen faster than inflation, and revenues have not kept pace. While Periodicals exhibit a diverse range of characteristics (including shape, size, weight, publication frequency, circulation level, and point of entry), virtually every publication falls short of covering its costs.
With this challenge as a backdrop, the Postal Service and the Commission have concluded a joint study of Periodicals, as requested by Section 708 of the Postal Accountability and Enhancement Act of 2006 (PAEA). This study addresses issues ranging from the quality of costing data to opportunities to improve operational efficiency to recommendations for administrative or legislative action.
The principal findings of this study are as follows:
After review of Postal Service responses to data quality recommendations from prior reviews, the Postal Service and the Commission agree that the cost data are reasonably accurate for ratemaking purposes.
September 2011 1
Periodicals Mail Study
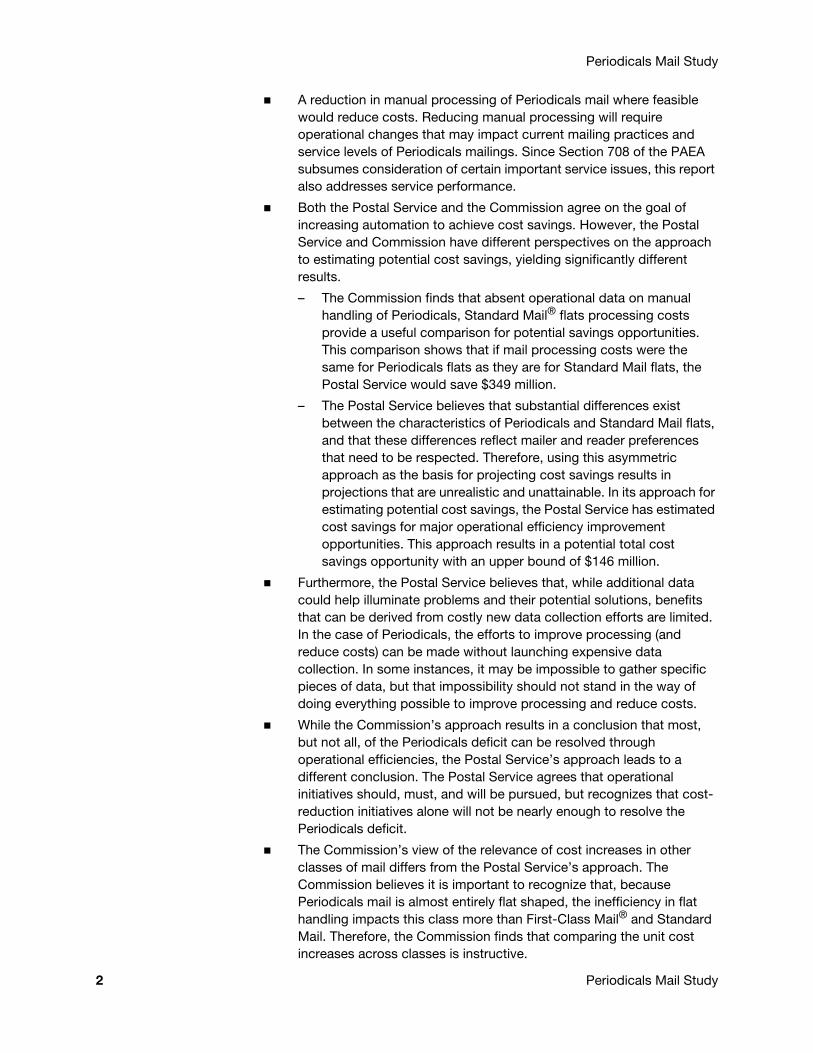
A reduction in manual processing of Periodicals mail where feasible would reduce costs. Reducing manual processing will require operational changes that may impact current mailing practices and service levels of Periodicals mailings. Since Section 708 of the PAEA subsumes consideration of certain important service issues, this report also addresses service performance.
Both the Postal Service and the Commission agree on the goal of increasing automation to achieve cost savings. However, the Postal Service and Commission have different perspectives on the approach to estimating potential cost savings, yielding significantly different results.
– The Commission finds that absent operational data on manual handling of Periodicals, Standard Mail® flats processing costs provide a useful comparison for potential savings opportunities. This comparison shows that if mail processing costs were the same for Periodicals flats as they are for Standard Mail flats, the Postal Service would save $349 million.
– The Postal Service believes that substantial differences exist between the characteristics of Periodicals and Standard Mail flats, and that these differences reflect mailer and reader preferences that need to be respected. Therefore, using this asymmetric approach as the basis for projecting cost savings results in projections that are unrealistic and unattainable. In its approach for estimating potential cost savings, the Postal Service has estimated cost savings for major operational efficiency improvement opportunities. This approach results in a potential total cost savings opportunity with an upper bound of $146 million.
Furthermore, the Postal Service believes that, while additional data could help illuminate problems and their potential solutions, benefits that can be derived from costly new data collection efforts are limited. In the case of Periodicals, the efforts to improve processing (and reduce costs) can be made without launching expensive data collection. In some instances, it may be impossible to gather specific pieces of data, but that impossibility should not stand in the way of doing everything possible to improve processing and reduce costs.
While the Commission’s approach results in a conclusion that most, but not all, of the Periodicals deficit can be resolved through operational efficiencies, the Postal Service’s approach leads to a different conclusion. The Postal Service agrees that operational initiatives should, must, and will be pursued, but recognizes that cost-reduction initiatives alone will not be nearly enough to resolve the Periodicals deficit.
The Commission’s view of the relevance of cost increases in other classes of mail differs from the Postal Service’s approach. The Commission believes it is important to recognize that, because Periodicals mail is almost entirely flat shaped, the inefficiency in flat handling impacts this class more than First-Class Mail® and Standard Mail. Therefore, the Commission finds that comparing the unit cost increases across classes is instructive.
2 Periodicals Mail Study
Executive Summary
The Postal Service compares the cost of Periodicals to costs for flats, both workshared and non-workshared, in other mail classes, reflecting the belief that Periodicals operational costs are most reasonably compared to pieces which can be processed using similar operations.
The Postal Service and the Commission will continue to work together to identify and address challenges related to Periodicals.
September 2011 3

Periodicals Mail Study
This page intentionally left blank
4 Periodicals Mail Study
Chapter 1 Introduction
Mandate for Report
This report on Periodicals responds to Section 708 of the Postal Accountability and Enhancement Act (PAEA). Section 708 directs the United States Postal Service® (the Postal Service) and the Postal Regulatory Commission (the Commission) to jointly address matters of special importance to Periodicals: (1) quality of data for attributing costs and (2) opportunities for operational efficiencies, including pricing incentives.
The Postal Service and the Commission established a joint task force to assess the Section 708 mandate, develop a study plan, and pursue research and related efforts. This report reflects the Postal Service’s and Commission’s considered review of the joint task force’s work and recommendations. In some instances, the Postal Service’s and the Commission’s perspectives on specific issues differ. These differences are noted in the text. A list of acronyms is provided in Appendix P.
Data Quality This report provides a detailed perspective on data quality by:
Defining the term “attributable costs” and several other key postal terms and concepts.
Explaining how the Postal Service, with Commission oversight on methodological approach, estimates the attributable costs, and resolved issues in estimation dating from the 1990s.
Explaining the relationship of attributable costs to pricing (rates) before and after enactment of the PAEA.
Efficiencies and Pricing IncentivesSection 708’s second directive requires the identification of “opportunities for improving efficiencies in collection, handling, transportation, or delivery of periodicals, including any appropriate pricing incentives.” This report responds to this mandate by:
Describing how Periodicals are typically processed in current operations.
Identifying current operational initiatives designed to increase efficiency in the processing of Periodicals and addressing some potential sources of additional efficiencies and cost savings in the PAEA environment, as well as restrictions under the current law.
September 2011 5
Chapter 1 Introduction
Detailing the Postal Service position that the statutory price cap in PAEA restricts the Postal Service’s ability to resolve the cost coverage challenge.
Describing the focus—and results—of efforts to address operational concerns by product, both prior to enactment of the PAEA and in the PAEA era.
Description of Periodicals Class
The Postal Service offers Periodicals prices for newspaper, magazine, journal, and newsletter distribution. There are specific requirements for eligibility.1 Periodicals must be published at regular intervals, at least four times a year from a known office of publication, and be formed of printed sheets. (The frequency can be from two or more times a day to once a quarter. Typical publication schedules are daily, weekly, or monthly.)
To qualify for Periodicals prices, publishers must prove that at least 50 percent of the copies they distribute are mailed or delivered to subscribers who either pay or make direct requests for them.
Periodicals is a diverse class of mail with a wide range of characteristics. Periodicals are printed by churches, schools, clubs, publishers of hometown newspapers, academic societies, nonprofit organizations, small businesses, multinational corporations, and others. Some Periodicals weigh less than one ounce, but publications are allowed to weigh up to 70 pounds. While 98.69 percent of Periodicals are prepared as flats,2 some are letter-size, and a few are prepared as parcels. Periodicals formats range from perfect-bound magazines to newspapers of varying sizes (e.g., broad sheet tabloid, and other sizes).
The Periodicals class is composed of two products: Outside County and Within County. Most Outside County mail is mailed in one county and delivered in another. Within County prices apply to small publications that are mailed and delivered in the same county, or when most of a publication’s mail is delivered in the county of publication. Mail that is mailed and delivered in the same county will not qualify for Within County prices, if neither of the conditions in the DMM (i.e., either under 10,000 circulation or more than 50 percent distribution within county of publication) is met.3 A more detailed description of the Periodicals pricing structure is provided in Appendix A.
The Outside County product is composed of three categories: Regular, which includes Science of Agriculture publications, Classroom, and Nonprofit. The Outside County and Within County products differ significantly in terms of volume and revenue. The volume of Outside County in FY 2010 was 6.6 billion pieces, which generated $1.8 billion in revenue; while 695 million pieces of Periodicals mail were mailed at Within County prices, generating $73 million in revenue.
1. See Mailing Standards of the U.S. Postal Service, Domestic Mail Manual (DMM®) sections 707.4.2 and 4.4.1.2. FY 2010 Periodicals piece related rate elements by shape and presort level.3. DMM, section 707.11.3.1.
6 Periodicals Mail Study
Introduction Chapter 1
In FY 2010, Within County Periodicals had a cost coverage of 74.2 percent, while Outside County Periodicals had a cost coverage of 75.0 percent. The overall cost coverage of the Periodicals class was 75.5 percent.4
In general, rate design issues for Within County were not as controversial as those in Outside County. One reason is that Within County’s structure traditionally has been less complex, as it does not distinguish between advertising and editorial content.5 Another reason is that worksharing opportunities introduced in Outside County generally also were extended, to the extent applicable, to Within County mailers.6
Issues Related to Periodicals Mail’s Shape and Characteristics
The Commission believes that the PAEA mandate for studying Periodicals arose from concern that Periodicals costs were increasing more rapidly than costs for other classes of mail. An important reason for the cost increases is that the class is comprised predominately of flat-shaped mail (nearly 99 percent of Periodicals pieces are flats), and the Postal Service has been unable to capture the same level of efficiencies for flats as it has for letters.
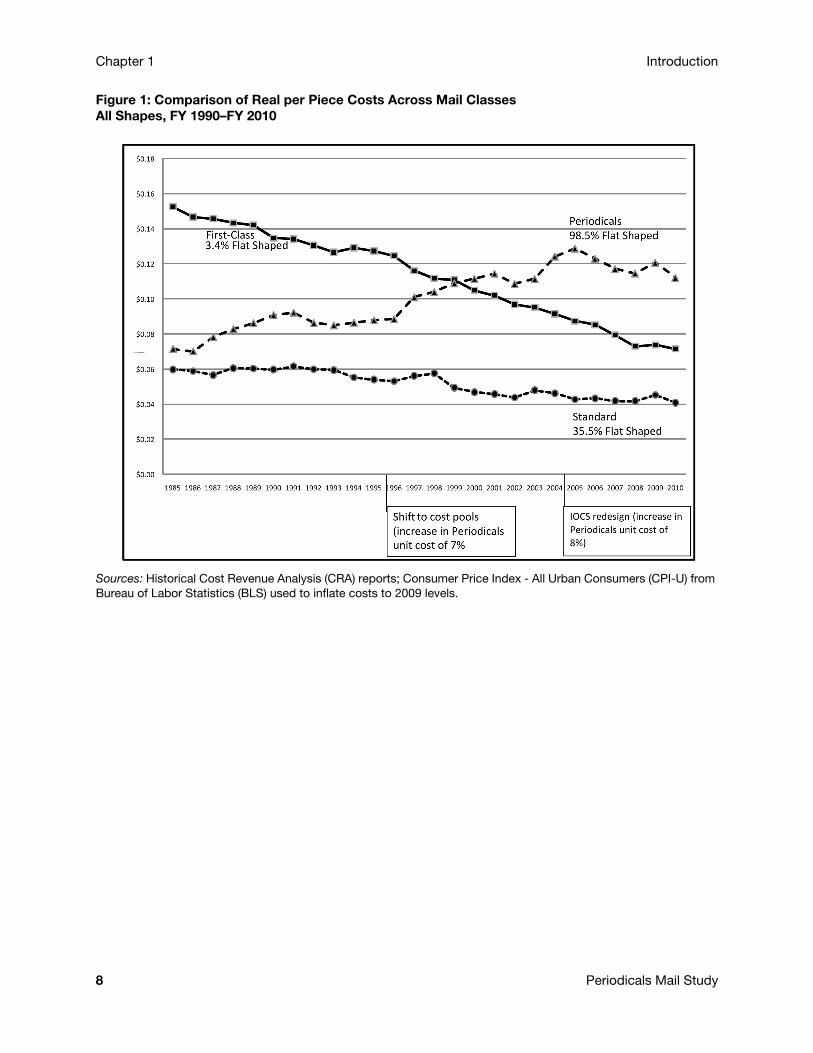
In the Commission’s view, comparing the real cost of Periodicals with the cost of First-Class Mail and Standard Mail provides insight into the divergent long-term cost trends for letters and flats, the genesis of this joint study of Periodicals. As seen in Figure 1, the unit cost of Periodicals mail, which is comprised almost entirely of flat-shaped pieces, has risen in real terms since FY 1990. The unit cost of Standard Mail, which is comprised of both letter and flat-shaped mail, has remained essentially the same. The unit cost of First-Class Mail, which is comprised mostly of letter mail, has declined. The differences in unit cost among these three classes of mail stem largely from the higher percentage of flat-shaped mail in the Periodicals class.
4. Cost and Revenue Analysis, FY 2010. For details on the cost coverage see Chapter 2.5. For details on Within County Periodicals see Appendix B.6. See, for example, PRC Op. R97-1 at para. 5848.
September 2011 7
Chapter 1 Introduction
Figure 1: Comparison of Real per Piece Costs Across Mail ClassesAll Shapes, FY 1990–FY 2010
Sources: Historical Cost Revenue Analysis (CRA) reports; Consumer Price Index - All Urban Consumers (CPI-U) from Bureau of Labor Statistics (BLS) used to inflate costs to 2009 levels.
8 Periodicals Mail Study
Introduction Chapter 1
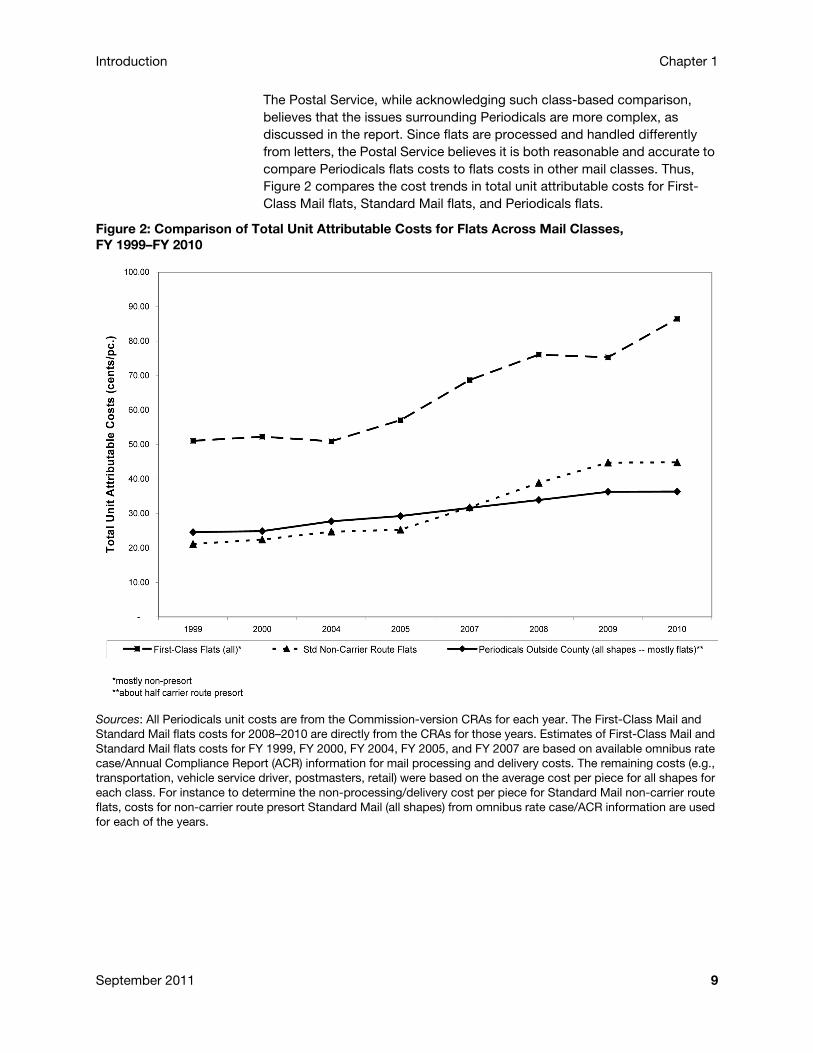
The Postal Service, while acknowledging such class-based comparison, believes that the issues surrounding Periodicals are more complex, as discussed in the report. Since flats are processed and handled differently from letters, the Postal Service believes it is both reasonable and accurate to compare Periodicals flats costs to flats costs in other mail classes. Thus, Figure 2 compares the cost trends in total unit attributable costs for First-Class Mail flats, Standard Mail flats, and Periodicals flats.
Figure 2: Comparison of Total Unit Attributable Costs for Flats Across Mail Classes, FY 1999–FY 2010
Sources: All Periodicals unit costs are from the Commission-version CRAs for each year. The First-Class Mail and Standard Mail flats costs for 2008–2010 are directly from the CRAs for those years. Estimates of First-Class Mail and Standard Mail flats costs for FY 1999, FY 2000, FY 2004, FY 2005, and FY 2007 are based on available omnibus rate case/Annual Compliance Report (ACR) information for mail processing and delivery costs. The remaining costs (e.g., transportation, vehicle service driver, postmasters, retail) were based on the average cost per piece for all shapes for each class. For instance to determine the non-processing/delivery cost per piece for Standard Mail non-carrier route flats, costs for non-carrier route presort Standard Mail (all shapes) from omnibus rate case/ACR information are used for each of the years.
September 2011 9
Chapter 1 Introduction
Although mail shape drives much of the processing and transportation costs analyzed in detail in this report, the extent to which mail is workshared also impacts cost. Virtually all of First-Class Mail flats are non-workshared. Standard Mail non-carrier route flats, as depicted in Figure 2, are workshared, but to a much less extent than overall Periodicals. How worksharing affects unit costs is examined later in Chapter 5 of this report. In addition, processing and transportation costs are affected by differences in piece weight, differences in mail preparation (such as amount of pieces per pallet), and by service requirement differences.
10 Periodicals Mail Study
Chapter 2 Classification and Pricing
History
Since its inception, Periodicals postage, formerly known as second-class mail,7 has been kept relatively low because of periodicals’ intrinsic societal value. The history of Periodicals pricing and classification is critical to understanding the current cost challenges of the Periodicals class and why the many efforts to reform it have not yet yielded permanent solutions.
Throughout the colonial period, newspapers served as a vehicle for information dissemination. At the birth of the nation, newspapers were critical to the development of the American Republic. From the enactment of the first postal laws in the 1790s until the Postal Reorganization Act (PRA) of 1970, Congress legislated low postage rates for newspapers and magazines, rates that fell far short of covering the actual costs of handling and transporting such mail.8 Congress subsidized postage on periodical publications by charging more for letters and, when necessary, appropriating funds from the U.S. Treasury.9 See Appendix C for an extended history.
Periodicals Under the Postal Reorganization ActIn 1970, the PRA was enacted, transforming the United States Post Office Department into “an independent establishment of the executive branch”10 called the United States Postal Service (the Postal Service). The PRA also established the Postal Rate Commission. Under the PRA, 39 U.S.C § 3601 stated that “The Postal Rate Commission is an independent establishment of the executive branch of the Government of the United States.” The PRA shifted rate-making authority to nine Presidentially appointed Governors of the Postal Service, chosen to represent the public interest. From 1971 to 2006, postal rates were adjusted using the following general process:
1. When a financial need was identified, the Governors requested a Commission-recommended decision on prices;
2. The Commission considered rate changes proposed by the Postal Service based on a projected revenue requirement which included a financial breakeven requirement;
3. The Commission issued a Recommended Decision;
7. The term “second-class mail” dates from 1863 when mail was divided into classes. Act of March 3, 1863 (12 Stat. 701, 705). The second-class mail class was renamed “Periodicals” following Docket No. MC95-1. See Opinion and Recommended Decision, Docket No. MC95-1, Appendix Two, page 43.
8. In 1970, Congress largely removed itself from the rate-making process, as discussed in Appendix C. 9. For historical data on postal income versus expenses, see Appendix E. 10. 39 U.S.C § 201.
September 2011 11
Chapter 2 Classification and Pricing
4. The Governors could accept, reject, or modify the recommendations of the Presidentially appointed Postal Rate Commission (the Commission, now called the Postal Regulatory Commission11).
The PRA required that each class or type of mail, including Periodicals, “bear the direct and indirect postal costs attributable to that class or type plus that portion of all other costs of the Postal Service reasonably assignable to such class or type.”12 In 1976, an additional criterion was established which required that “the educational, cultural, scientific, and informational value to the recipient of mail matter” be considered in establishing rates. [39 U.S.C. § 3622(b)(8)]. This criterion, often referred to as “Educational, Cultural, Scientific, and Informational” (“ECSI”) value, tended to be a factor that resulted in a lower markup above costs for Periodicals.
Prior to the PRA, Congressional subsidies were provided for most classes of mail, including First-Class Mail. Subsidies had a notable effect on the Periodicals mail class because they tended to obscure the cost coverage,13 which was actually lower than in other mail classes. With the enactment of the PRA, subsidies for commercial publications were phased out.14 Periodicals rates more than tripled from 1971 to 1976, in order to move Periodicals closer to full cost coverage.15 Postal costs, including Periodicals costs, also increased substantially during this period, primarily because of inflation.
For a number of years, preferred-rate categories of mail, including some categories within Periodicals, were supported to varying degrees by appropriations from Congress, referred to as “revenue foregone” appropriations. These appropriations reimbursed the Postal Service for revenue that was not received because of the lower rates mandated by Congress for preferred-rate mail (including Within County, Nonprofit, Classroom, and Science of Agriculture). However, the Revenue Foregone Reform Act of 1993 (as amended) eliminated congressional appropriations for preferred-rate mail, except for free mail for the blind and voting rights [107 Stat. 1267].16
11. The Postal Rate Commission was redefined as the Postal Regulatory Commission and its authority expanded in the Postal Accountability and Enhancement Act (PAEA) of 2006. See Appendix C.
12. Former 39 U.S.C § 3622(b)(3), before amendment by PAEA.13. Cost coverage is defined as revenue divided by attributable cost.14. A subsidy continued for nonprofit and classroom publications.15. For historical rates for Outside County and Within County mail, see Appendices L and M, respectively.16. For further information, see the Congressional Research Service’s Report for Congress RS21025, December 28, 2005, “The
Postal Revenue Forgone Appropriation: Overview and Current Issues,” by Nye Stevens (www.policyarchive.org/handle/10207/bitstreams/3514.pdf).
12 Periodicals Mail Study
Classification and Pricing Chapter 2
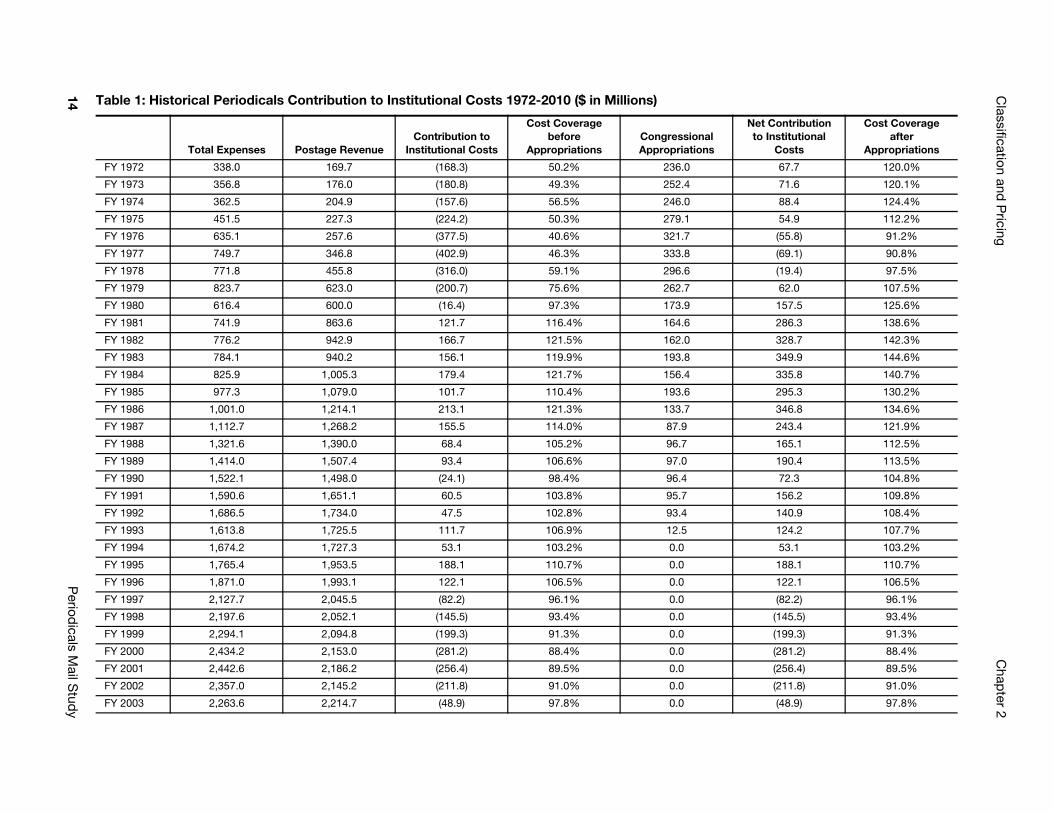
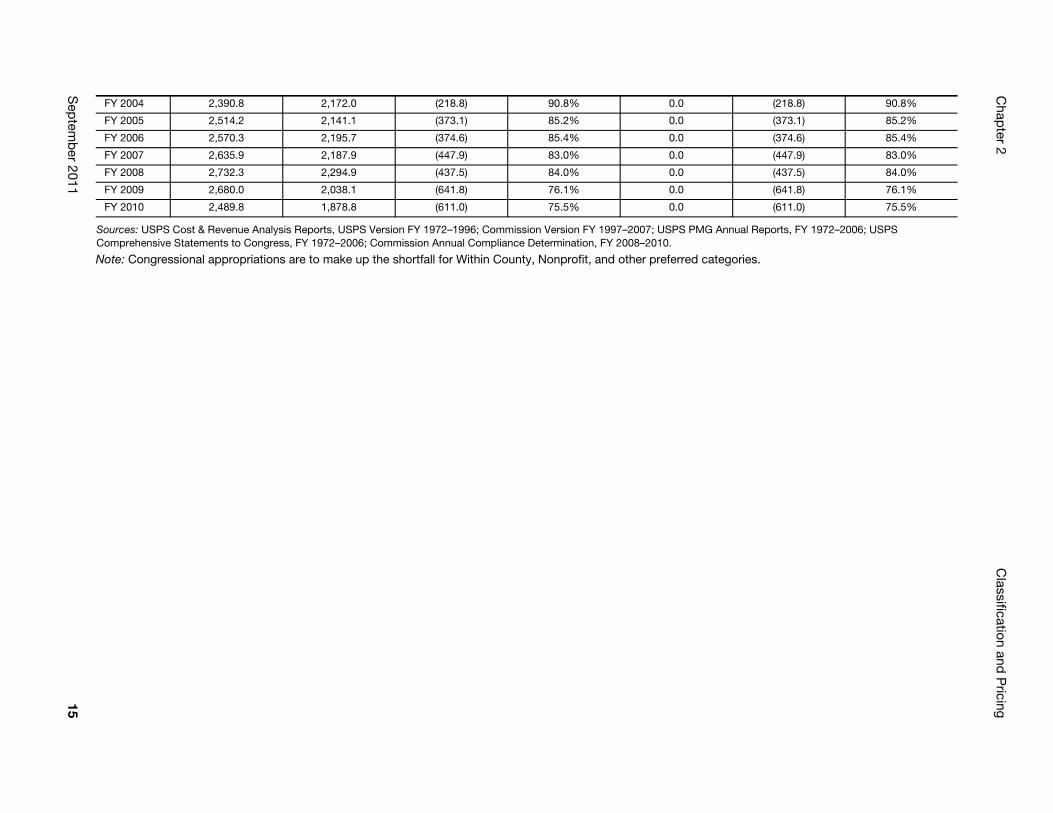
As seen in Table 1, without congressional appropriations, Periodicals cost coverage would have been well below 100 percent throughout the 1970s. Congressional appropriations continued until 1993, resulting in cost coverage that exceeded 100 percent in many years during the 1980s and early 1990s. For fiscal years 1994, 1995, and 1996, the cost coverage was above 100 percent even without congressional appropriations. In 1997, a methodological change in attribution of mail processing costs increased attributable costs for Periodicals by about 7 percent. Rates for Periodicals did not increase comparably; however, an increase in overall attribution does not, by itself, lead to price increases. There was not an increase in total costs, therefore the breakeven provision was met. Thus, the methodological change did not reflect a true increase in “costs” themselves, because it did not reflect an increased expenditure of resources, only the measurement and attribution of those resources, making comparisons over time less “pure.” The only effect of the methodological change was to reduce the “markups” needed to break even.
In 1997 Periodicals cost coverage fell to below 100 percent.17 Cost coverage has remained below 100 percent since then. Table 1 gives a perspective on key data since implementation of the PRA.
17. Beginning in 1997, the Management Operating Data System cost pools have been used to attribute mail processing costs in the Cost Revenue Analysis report rather than the previous program/method called LIOCATT. The impact of this change is demonstrated in the Docket No. R97-1 rate case where the Commission’s 1996 attributable cost of Periodicals (based on the cost pool methodology) is about 7 percent higher than that reported in the 1996 CRA (which had been based on the old LIOCATT method).
September 2011 13
Classification and
Pricing
Chap
ter 2
14P
eriodicals M
ail Stud
y
Net Contribution to Institutional
Costs
Cost Coverage after
Appropriations
67.7 120.0%
71.6 120.1%
88.4 124.4%
54.9 112.2%
(55.8) 91.2%
(69.1) 90.8%
(19.4) 97.5%
62.0 107.5%
157.5 125.6%
286.3 138.6%
328.7 142.3%
349.9 144.6%
335.8 140.7%
295.3 130.2%
346.8 134.6%
243.4 121.9%
165.1 112.5%
190.4 113.5%
72.3 104.8%
156.2 109.8%
140.9 108.4%
124.2 107.7%
53.1 103.2%
188.1 110.7%
122.1 106.5%
(82.2) 96.1%
(145.5) 93.4%
(199.3) 91.3%
(281.2) 88.4%
(256.4) 89.5%
(211.8) 91.0%
(48.9) 97.8%
Table 1: Historical Periodicals Contribution to Institutional Costs 1972-2010 ($ in Millions)
Total Expenses Postage RevenueContribution to
Institutional Costs
Cost Coverage before
AppropriationsCongressional Appropriations
FY 1972 338.0 169.7 (168.3) 50.2% 236.0
FY 1973 356.8 176.0 (180.8) 49.3% 252.4
FY 1974 362.5 204.9 (157.6) 56.5% 246.0
FY 1975 451.5 227.3 (224.2) 50.3% 279.1
FY 1976 635.1 257.6 (377.5) 40.6% 321.7
FY 1977 749.7 346.8 (402.9) 46.3% 333.8
FY 1978 771.8 455.8 (316.0) 59.1% 296.6
FY 1979 823.7 623.0 (200.7) 75.6% 262.7
FY 1980 616.4 600.0 (16.4) 97.3% 173.9
FY 1981 741.9 863.6 121.7 116.4% 164.6
FY 1982 776.2 942.9 166.7 121.5% 162.0
FY 1983 784.1 940.2 156.1 119.9% 193.8
FY 1984 825.9 1,005.3 179.4 121.7% 156.4
FY 1985 977.3 1,079.0 101.7 110.4% 193.6
FY 1986 1,001.0 1,214.1 213.1 121.3% 133.7
FY 1987 1,112.7 1,268.2 155.5 114.0% 87.9
FY 1988 1,321.6 1,390.0 68.4 105.2% 96.7
FY 1989 1,414.0 1,507.4 93.4 106.6% 97.0
FY 1990 1,522.1 1,498.0 (24.1) 98.4% 96.4
FY 1991 1,590.6 1,651.1 60.5 103.8% 95.7
FY 1992 1,686.5 1,734.0 47.5 102.8% 93.4
FY 1993 1,613.8 1,725.5 111.7 106.9% 12.5
FY 1994 1,674.2 1,727.3 53.1 103.2% 0.0
FY 1995 1,765.4 1,953.5 188.1 110.7% 0.0
FY 1996 1,871.0 1,993.1 122.1 106.5% 0.0
FY 1997 2,127.7 2,045.5 (82.2) 96.1% 0.0
FY 1998 2,197.6 2,052.1 (145.5) 93.4% 0.0
FY 1999 2,294.1 2,094.8 (199.3) 91.3% 0.0
FY 2000 2,434.2 2,153.0 (281.2) 88.4% 0.0
FY 2001 2,442.6 2,186.2 (256.4) 89.5% 0.0
FY 2002 2,357.0 2,145.2 (211.8) 91.0% 0.0
FY 2003 2,263.6 2,214.7 (48.9) 97.8% 0.0
Chap
ter 2C
lassification and P
ricing
Sep
temb
er 201115
ual Reports, FY 1972–2006; USPS
ories.
(218.8) 90.8%
(373.1) 85.2%
(374.6) 85.4%
(447.9) 83.0%
(437.5) 84.0%
(641.8) 76.1%
(611.0) 75.5%
Sources: USPS Cost & Revenue Analysis Reports, USPS Version FY 1972–1996; Commission Version FY 1997–2007; USPS PMG AnnComprehensive Statements to Congress, FY 1972–2006; Commission Annual Compliance Determination, FY 2008–2010.
Note: Congressional appropriations are to make up the shortfall for Within County, Nonprofit, and other preferred categ
FY 2004 2,390.8 2,172.0 (218.8) 90.8% 0.0
FY 2005 2,514.2 2,141.1 (373.1) 85.2% 0.0
FY 2006 2,570.3 2,195.7 (374.6) 85.4% 0.0
FY 2007 2,635.9 2,187.9 (447.9) 83.0% 0.0
FY 2008 2,732.3 2,294.9 (437.5) 84.0% 0.0
FY 2009 2,680.0 2,038.1 (641.8) 76.1% 0.0
FY 2010 2,489.8 1,878.8 (611.0) 75.5% 0.0
Chapter 2 Classification and Pricing
Since 1995, several proposals impacting the structure of Periodicals have been considered. One was the Postal Service’s Docket No. MC95-1 proposal to divide Periodicals customers into two subclasses: (1) large, high-density and/or (2) high-circulation publications, and smaller publications. The large publications would have been required to meet mail preparation requirements designed to lower costs and enable lower rates, while rates for smaller circulation and/or less dense publications would have increased. The Commission rejected the proposal to split Periodicals into two subclasses because it felt that small mailers would face large and potentially disruptive rate increases.18 Instead it retained the existing rate categories, with new rates that more closely recognized cost savings resulting from mailer worksharing.19
Review Team 1997–1999For many years during the PRA era, concerns about seemingly disproportionate increases in Periodicals costs were raised in a series of omnibus rate cases and at industry meetings with the Postal Service. Prior to Docket No. R1997-1, the persistence of these concerns prompted a coalition of Periodicals to press for definitive examination of this cost phenomenon. In June 1997, the Postal Service agreed to form a Periodicals Operations Review Team (Review Team) with two trade associations: the American Business Press and the Magazine Publishers of America (now MPA, the Association for Magazine Media).
The Review Team established five ground rules:20
1. The Review Team’s focus would be on examining operational issues to determine what could have led to the rapid increase in Periodicals costs;
2. The Review Team’s focus would be forward-looking, in the sense of finding ways to stem or reverse the Periodicals cost trend;
3. The study would be led by Postal Service operations managers, with costing systems excluded from review;
4. The study would be conducted using a joint team of industry and Postal Service personnel knowledgeable about the makeup and processing of Periodicals, with in-depth observation of postal operations; and
5. The team agreed that formal start-up of the study would be delayed until completion of the then-pending omnibus rate case (Docket No. R97-1).
The Review Team concluded that there were systemic inefficiencies and other inherent characteristics of Periodicals that contributed to, but did not fully explain, the large increases in Periodicals costs. It also concluded that plant managers seemed to be motivated to take added—and sometimes
18. Docket No. MC95-1, Opinion and Recommended Decision, p. V-138, paragraph 5322.19. Examples of postal costs that are avoided by mailers and recognized under worksharing include costs avoided by presentation
to different levels of presort and costs avoided by drop-shipping (i.e., entering mail deeper within the postal system) to different entry points.
20. Source: Report of the Periodicals Operations Review Team at 9.
16 Periodicals Mail Study

Classification and Pricing Chapter 2
costly—steps to speed delivery of Periodicals due to complaints of late delivery from recipients. [Id. at 3].
The Team cited the following practices as examples of circumstances that contributed to higher Periodicals costs:
Periodicals received high levels of manual processing compared with First-Class Mail and Standard Mail flats (a situation that facility managers said occurred, in many instances, based on the rationale that larger volumes of Standard Mail provided longer, more efficient machine runs and because smaller Periodicals volumes were not sufficient to justify machine set-up time);
Processing procedures for Periodicals did not follow standardized protocols but instead reflected substantial variation in methods, staffing levels, and productivity;
The very high visibility of Periodicals often gave local managers an incentive that often resulted in “spending for Periodicals service” and “making bottom line on other classes”;
Supervisory capability was not uniformly adequate to ensure optimal operational flow;
Periodicals bundle integrity was not adequate to withstand current postal bundle processing equipment and methods;
Postal personnel appeared to occasionally accept improperly prepared mail without providing adequate feedback to publishers about makeup irregularities;
Many Periodicals costs appeared to derive from the opening unit21 and other non-distribution operations.
The Review Team identified short- and long-term actions that industry, local postal managers, and national postal management should take to improve Periodicals processing and drive costs from the system. The team also identified possible changes in regulations to facilitate better alignment between worksharing and mail preparation practices with field practices, improved communications, more efficient equipment utilization, and streamlined allied operations.
The Review Team also emphasized that further study of postal operations and analysis of cost attribution (which the team had not reviewed) would be needed to obtain a full understanding of Periodicals cost behavior and maximum cost containment. Overall the Review Team recommended a reduction in the number of handlings and a greater focus on cost issues by Postal Service field employees and managers.
21. An opening unit is an operational area within a mail processing facility where pouches, sacks, and containers of mail are received from arriving dispatches and are opened and prepared for distribution.
September 2011 17
Chapter 2 Classification and Pricing
A summary of the issues is as follows:
The Review Team also recommended face-to-face meetings between the Review team and stakeholders, including senior Postal Service and Periodicals industry management, to provide more information about the study and its recommendations. It further suggested that a designated joint team meet approximately six months after the publication of the report to review progress and develop additional plans as needed.
Periodicals Complaint CaseIn 2004, five large publishers filed a formal complaint (Docket No. C2004-1) seeking a more cost-based rate schedule for Periodicals. The complainants sought to separate charges for bundles, sacks, and pallets, as well as the traditional pounds and pieces. They also wanted the Postal Service to charge more for editorial matter when it traveled farther in the postal mailstream. The Complaint was supported by most large publications but was opposed by many smaller publications. See Order No. 1446, Appendix A.
a. Have closer alignment of mail makeup (preparation standards) with postal processing configurations.
b. Optimize containerization to help reduce costs.
c. Encourage address quality to significantly reduce rehandling costs.
d. Enforce entry/acceptance regulations and communication of irregularities to the publisher and printer.
e. Further develop and communicate the Flats Operation Plan.
f. Separation of mail classes (in the incoming mailstream) is of questionable value and may add to costs without necessarily improving service.
g. Improved bundle preparation by mailers and improved materials handling by the Postal Service will reduce bundle breakage (and breakage appears to increase Periodicals costs significantly).
h. Focus operations management on the importance of efficiently managing processes and equipment.
i. Better utilize cubic capacities in transportation and reduction of redundant “hot” service trips provide cost-reduction opportunities.
j. Use of annexes to deploy additional equipment and accommodate increased mail volumes results in additional costs, which may fall disproportionately on Periodicals.
k. More effective use of automated flat-sorting equipment provides an opportunity for cost reduction.
l. Interclass cost impacts may require further study; recognition of what may be best for the Postal Service’s operational “bottom line” may not be best for Periodicals.
m. An immediate step can be taken to publicize and emphasize that cost and service are not mutually exclusive, and both are important.
n. Cost attribution methodologies should be reviewed in light of operational observations.
o. The Periodicals rate structure should be reviewed to ensure that it is consistent with the overall Periodicals processing strategy and induces appropriate mailer behavior.
18 Periodicals Mail Study
Classification and Pricing Chapter 2
The Commission found that the existing rate schedule did not clearly violate PRA policies and denied the complaint. [Order No. 1446 at 6.] However, the Commission urged the Postal Service to review the rate design features that would improve the efficiency of Periodicals, with a focus on quickly incorporating the most promising and least disruptive components. [Id.] The Commission concluded that the flat editorial pound charge effectively fosters the public policies of the PRA. [Order No. 1446 at 7, App. B.] The Commission also suggested that the Postal Service and Periodicals mailers consider the potential benefits of implementing a bifurcated opt-in rate schedule for Outside County Periodicals, with one rate schedule designed to recognize low-cost mail as much as possible. [Order No. 1446 at 6–7, App. C.]
Docket No. R2006-1In Docket No. R2006-1, the Postal Service proposed rate design modifications that made the rates somewhat more cost based. Time Warner proposed a rate design similar to what it supported in the complaint case, except this time it did not propose to eliminate the flat editorial pound rate. The Commission recommended Time Warner’s proposed approach. [PRC Op., Docket No. R2006-1, at 348–49.]
The Commission recommended a rate design which included separate rates for bundles, sacks, and pallets. [PRC Op., Docket No. R2006-1, at 348–49.] The restructuring involved several related changes based on updated costs, mail flow analyses, and industry developments. First, the piece and pound elements in the longstanding rate structure were retained, but were “de-averaged” by establishing separate charges for bundles, sacks, and pallets. (Sacks and pallets are sometimes collectively referred to as containers. Bundles typically are placed in sacks or on pallets.) Second, key linkages were established between the three new elements and their presort level and point of entry into the system. This included a new set of drop-ship discounts for editorial matter. Third, mailpiece machinability was recognized, in addition to automation compatibility. Fourth, the Basic Rate piece category was de-averaged into Area Distribution Center (ADC) and Mixed ADC categories. Finally, prebarcoding and presorting continued to be recognized, but in a new way, by establishing important linkages between sacks and pallets and the locations where these containers are entered into the postal system.
These changes made the structure more dynamic and allowed mailers to recognize the consequences of choices they made in preparing mailings. The Commission said: “This framework closely mirrors postal operations in most respects, and recognizes the strengths of the private sector in providing co-mailing and related services. It follows logical patterns and development of rates is straightforward.” PRC Op. [R2006-1 at 348.] However, so far the new structure has not driven substantial costs out of the system, because the Order accepting the model phased full costs in over time to avoid rate shock.
September 2011 19
Chapter 2 Classification and Pricing
Pricing and the Postal Accountability and Enhancement Act
Under the Postal Accountability and Enhancement Act of 2006 (PAEA) the “requirement that each class of mail or type of mail service bear the direct and indirect costs attributable to that class or service” is one of 14 factors that “the Commission shall take into account for market dominant products.” [39 U.S.C. § 3622(c)(2).] Each year the Commission reviews the cost coverage of each product as reported in the Postal Service’s Annual Compliance Report, and presents the results of its analysis in its Annual Compliance Determination.
The PAEA generally limits price increases for each class to changes in the Consumer Price Index (CPI). [39 U.S.C. § 3622(d)(1)(A).] The Postal Service is allowed to change individual prices within the Periodicals class by different percentages, in order to better align prices with the actual costs of processing and delivering mail on a piece-by-piece basis. The PAEA also retained provisions for recognizing ECSI value of certain mail classes and products. [39 U.S.C. § 3622(c)(11).]
The PAEA generally limits Market Dominant rate increases by mail class to the rate of inflation as measured by the CPI, but it also requires the Commission to take into account the requirement that each class of mail bear its attributable costs. These considerations are currently in conflict. In FY 2010, Periodicals covered just 75.5 percent of its attributable costs; at the time the Postal Service filed its price change scheduled to be effective in April 2011, the price cap limited a Periodicals rate increase to less than 1.741 percent.
With the rate increase limitations in the PAEA, it becomes even more difficult to overcome the revenue shortfalls for Periodicals. Greater price increases than permitted under the inflation-based price cap are likely needed to cover costs.
Aside from the price cap, when a Periodicals mailpiece is priced, the Postal Service takes into account the combined cost of accepting, processing, transporting, and delivering the mailpiece to its final destination. Postage for Periodicals mail includes a pound price, piece price, and bundle and container prices for Outside County mail, and any discounts for which the mail qualifies under the corresponding standards.
If mail is entered at a location closer to where the mail will be delivered, it is eligible for a drop-ship discount because entry closer to the destination allows the mail to bypass postal facilities and the costs of performing operations at those facilities. Comailing and copalletization also can lower postage by allowing greater presorting and justifying more drop-shipping.22 When mailers present the material to the Postal Service in package order, grouping together items that will be delivered within the same service area, mailers are eligible for other worksharing discounts, which are discussed below. Authorized Nonprofit and Classroom publications receive a discount
22. See Chapter 3 for a description of these programs.
20 Periodicals Mail Study
Classification and Pricing Chapter 2
of 5 percent off the total Outside County postage excluding the postage for advertising pounds. Science of Agriculture also receives a discount.
In addition to the new annual price cap, the PAEA includes provisions addressing some longstanding newspaper publishers’ concerns about rate eligibility for subscribers outside the county of publication, either in contiguous counties or farther away. For example, under the PAEA, all copies on a carrier route originating in the county of publication, including copies distributed to another county, qualify for Within County Rates. [39 U.S.C. 3626(g)(3).] In addition, copies distributed outside the county of publication can be mailed at Within County rates, assuming the publisher does not mail more than 5,000 copies to Outside County subscribers. [39 U.S.C. 3626(g)(4)(A).] Moreover, a rate eligibility requirement, which calls for distribution of a simple majority of total paid circulation within the county of publication, has been eliminated for an issue of a publication with less than 10,000 in total paid circulation. [39 U.S.C. 3626(g)(2).]
Mail Volume and Cost Coverage 1972–2010
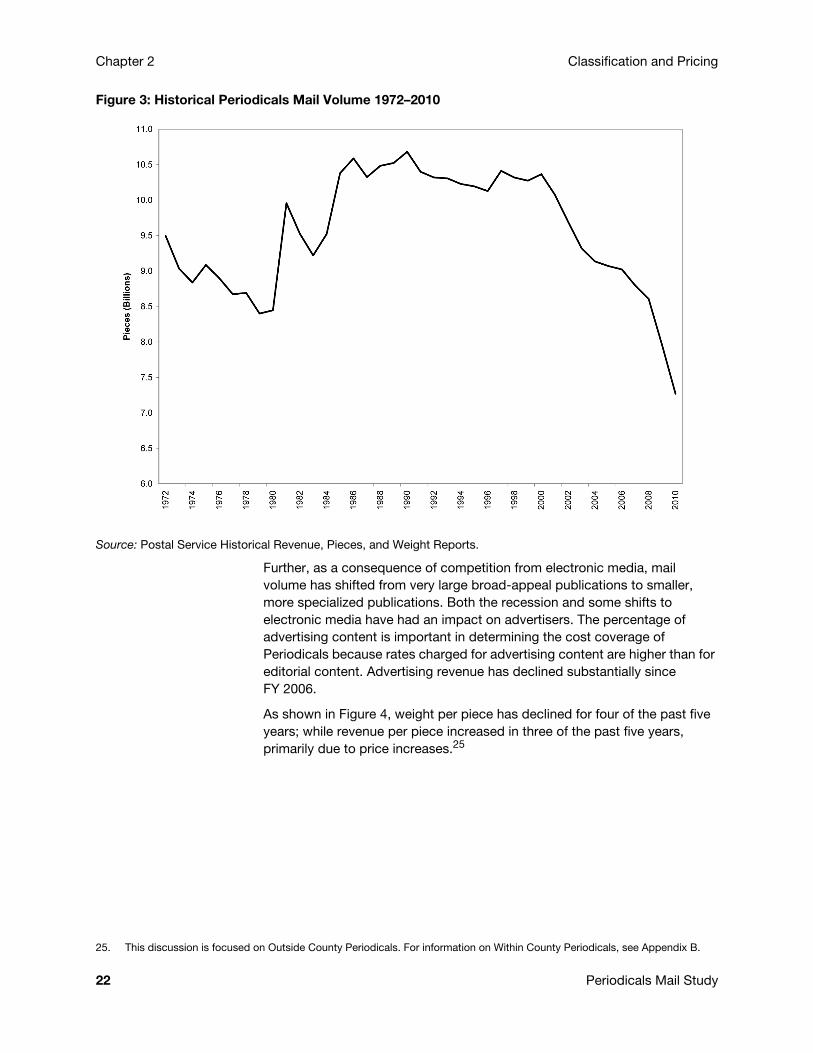
Periodicals volume peaked in 1990 at 10.7 billion pieces. It has declined each year since 2000.23 Figure 3 illustrates the steep decline in volume in recent years. Volumes have continued to decline due in large part to electronic substitution for hard-copy publications.24 In 2009 the decline was exacerbated by the impact of the severe recession that started in December 2007.
23. See Periodicals Historical Volume and Revenue in Appendix F for historical volume data. Historical RPW Reports (1980–2010). 24. See Appendix D for an overview of the periodicals industry.
September 2011 21
Chapter 2 Classification and Pricing
Figure 3: Historical Periodicals Mail Volume 1972–2010
Source: Postal Service Historical Revenue, Pieces, and Weight Reports.
Further, as a consequence of competition from electronic media, mail volume has shifted from very large broad-appeal publications to smaller, more specialized publications. Both the recession and some shifts to electronic media have had an impact on advertisers. The percentage of advertising content is important in determining the cost coverage of Periodicals because rates charged for advertising content are higher than for editorial content. Advertising revenue has declined substantially since FY 2006.
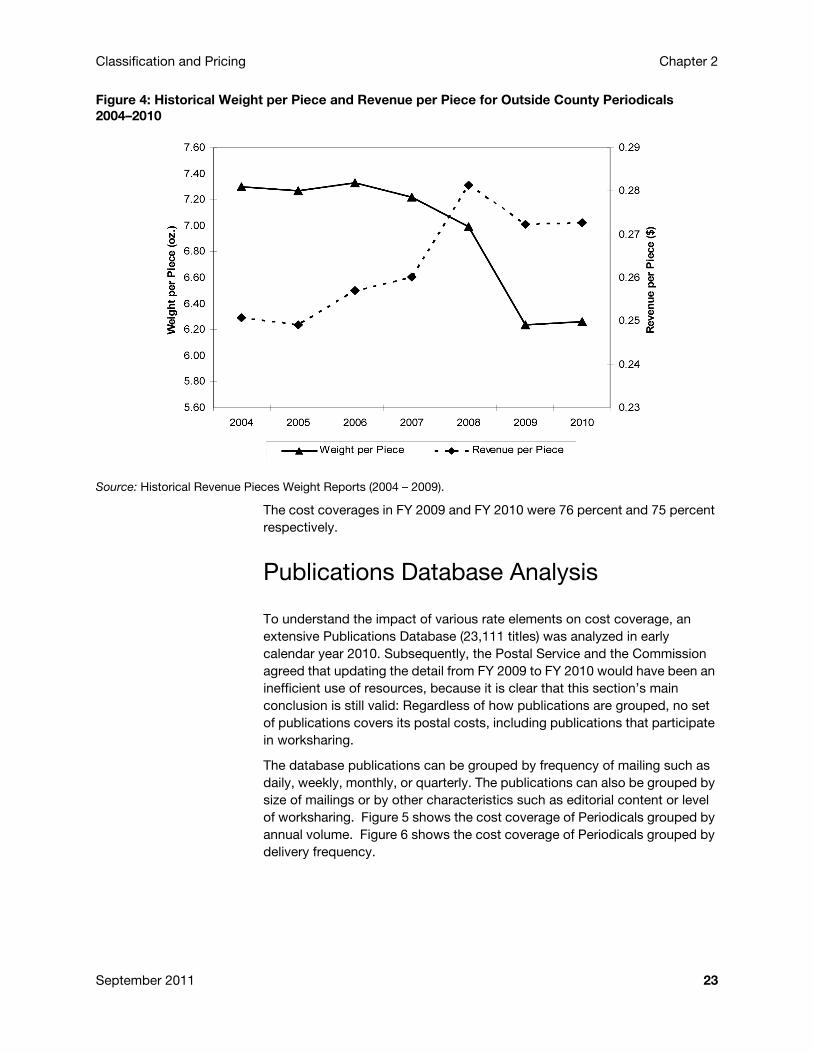
As shown in Figure 4, weight per piece has declined for four of the past five years; while revenue per piece increased in three of the past five years, primarily due to price increases.25
25. This discussion is focused on Outside County Periodicals. For information on Within County Periodicals, see Appendix B.
22 Periodicals Mail Study
Classification and Pricing Chapter 2
Figure 4: Historical Weight per Piece and Revenue per Piece for Outside County Periodicals 2004–2010
Source: Historical Revenue Pieces Weight Reports (2004 – 2009).
The cost coverages in FY 2009 and FY 2010 were 76 percent and 75 percent respectively.
Publications Database Analysis
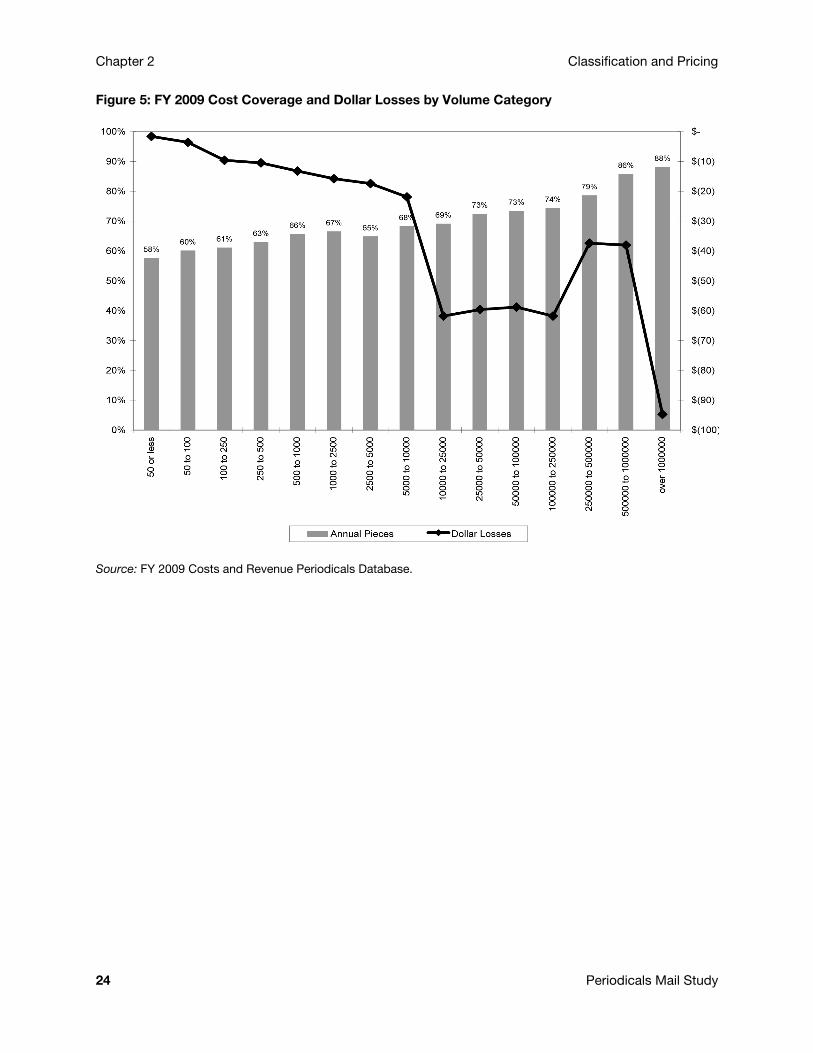
To understand the impact of various rate elements on cost coverage, an extensive Publications Database (23,111 titles) was analyzed in early calendar year 2010. Subsequently, the Postal Service and the Commission agreed that updating the detail from FY 2009 to FY 2010 would have been an inefficient use of resources, because it is clear that this section’s main conclusion is still valid: Regardless of how publications are grouped, no set of publications covers its postal costs, including publications that participate in worksharing.
The database publications can be grouped by frequency of mailing such as daily, weekly, monthly, or quarterly. The publications can also be grouped by size of mailings or by other characteristics such as editorial content or level of worksharing. Figure 5 shows the cost coverage of Periodicals grouped by annual volume. Figure 6 shows the cost coverage of Periodicals grouped by delivery frequency.
September 2011 23
Chapter 2 Classification and Pricing
Figure 5: FY 2009 Cost Coverage and Dollar Losses by Volume Category
Source: FY 2009 Costs and Revenue Periodicals Database.
24 Periodicals Mail Study
Classification and Pricing Chapter 2
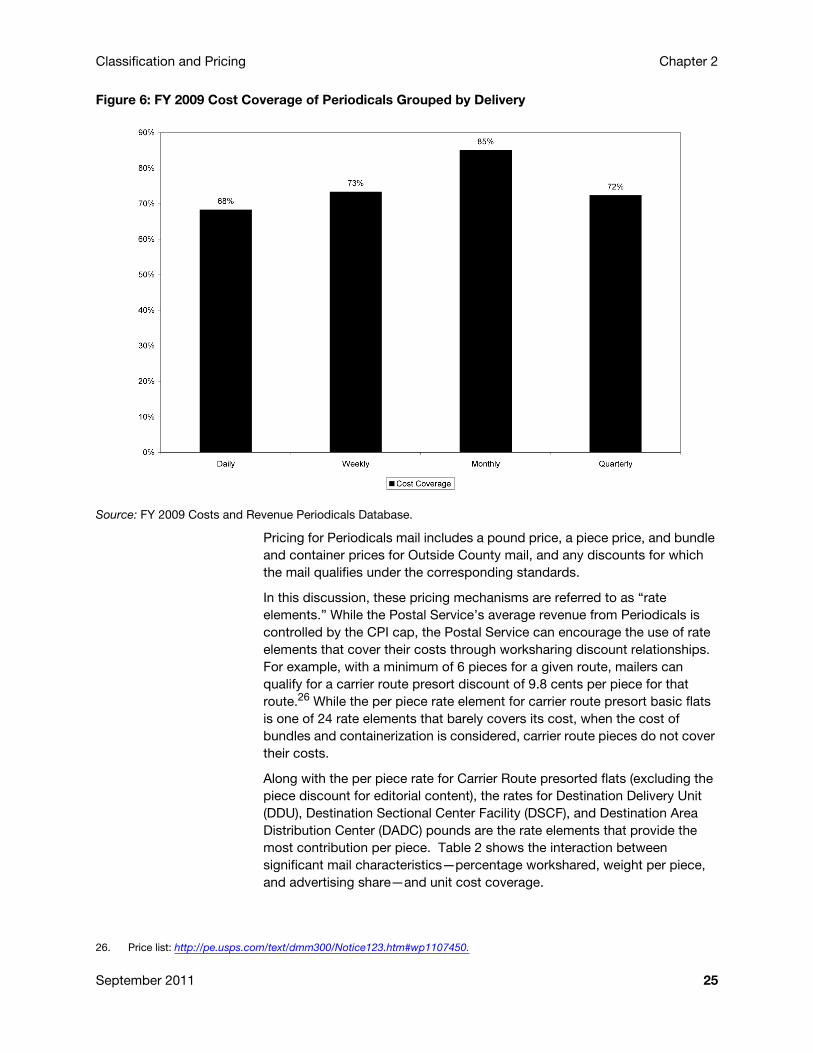
Figure 6: FY 2009 Cost Coverage of Periodicals Grouped by Delivery
Source: FY 2009 Costs and Revenue Periodicals Database.
Pricing for Periodicals mail includes a pound price, a piece price, and bundle and container prices for Outside County mail, and any discounts for which the mail qualifies under the corresponding standards.
In this discussion, these pricing mechanisms are referred to as “rate elements.” While the Postal Service’s average revenue from Periodicals is controlled by the CPI cap, the Postal Service can encourage the use of rate elements that cover their costs through worksharing discount relationships. For example, with a minimum of 6 pieces for a given route, mailers can qualify for a carrier route presort discount of 9.8 cents per piece for that route.26 While the per piece rate element for carrier route presort basic flats is one of 24 rate elements that barely covers its cost, when the cost of bundles and containerization is considered, carrier route pieces do not cover their costs.
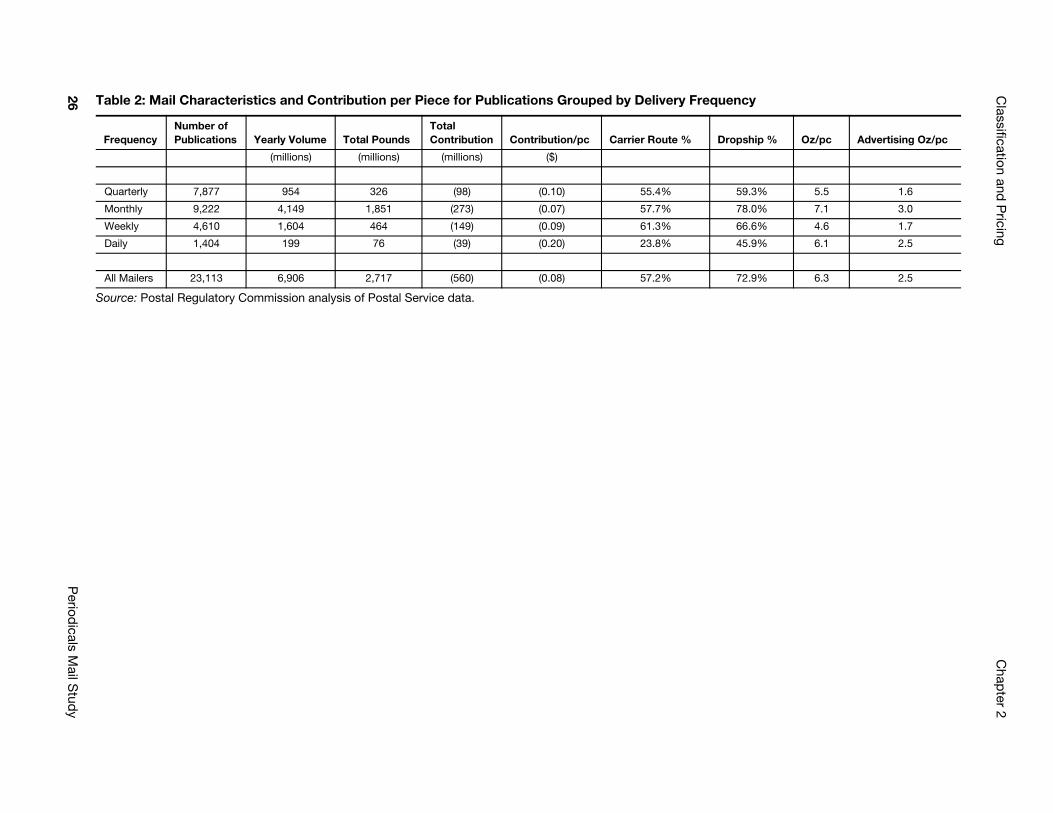
Along with the per piece rate for Carrier Route presorted flats (excluding the piece discount for editorial content), the rates for Destination Delivery Unit (DDU), Destination Sectional Center Facility (DSCF), and Destination Area Distribution Center (DADC) pounds are the rate elements that provide the most contribution per piece. Table 2 shows the interaction between significant mail characteristics—percentage workshared, weight per piece, and advertising share—and unit cost coverage.
26. Price list: http://pe.usps.com/text/dmm300/Notice123.htm#wp1107450.
September 2011 25
Classification and
Pricing
Chap
ter 2
26P
eriodicals M
ail Stud
y
ncy
pship % Oz/pc Advertising Oz/pc
59.3% 5.5 1.6
78.0% 7.1 3.0
66.6% 4.6 1.7
45.9% 6.1 2.5
72.9% 6.3 2.5
Table 2: Mail Characteristics and Contribution per Piece for Publications Grouped by Delivery Freque
Source: Postal Regulatory Commission analysis of Postal Service data.
FrequencyNumber of Publications Yearly Volume Total Pounds
Total Contribution Contribution/pc Carrier Route % Dro
(millions) (millions) (millions) ($)
Quarterly 7,877 954 326 (98) (0.10) 55.4%
Monthly 9,222 4,149 1,851 (273) (0.07) 57.7%
Weekly 4,610 1,604 464 (149) (0.09) 61.3%
Daily 1,404 199 76 (39) (0.20) 23.8%
All Mailers 23,113 6,906 2,717 (560) (0.08) 57.2%
Classification and Pricing Chapter 2
Monthly publications have the highest percentage of Carrier Route presorted pieces, drop-shipped pounds, and advertising ounces and are closer to breakeven, on a per piece basis, than Periodicals mailed at other frequencies. Factors that lead to drop-shipping and carrier route presorting include publication circulation, subscriber density, national or local distribution, and production timelines. Although monthly publications have the lowest negative contribution per piece, they account for more than 50 percent of Periodicals volume and represent about 37 percent of the total negative contribution from the Periodicals class.
While daily publications have the second highest average amount of advertising ounces per piece, a much lower percentage of these mailpieces is Carrier Route presorted than pieces mailed at other frequencies. The percentage of drop-shipped pounds is also below the class average. The contribution for this category is negative 20 cents per piece, representing 7 percent of the total negative contribution.
Contribution can also be analyzed based on the amount of editorial content contained in a publication. A minimum of 25 percent editorial content is required to qualify for the Periodicals class.27 Editorial content is given preference in both the piece and pound elements of the rate design. Over 5,000 publications consist of exclusively (100 percent) editorial content, and the average mailed volume for these publications is less than 80,000 pieces per year. These publications have an average contribution per piece of negative 19 cents. Although this negative contribution can be attributed in part to the editorial discount, these pieces exhibit lower levels of carrier route presorting and drop-shipping than publications with less editorial content. Publications with less editorial content—or conversely, more advertising content—are drop-shipped at a much higher rate, averaging over 80 percent of drop-shipped pounds. They are also more frequently presorted to carrier route. On a unit basis, these publications have a negative contribution of between four and seven cents. However, collectively these publications represent over two-thirds of Periodicals volume and account for much of the contribution shortfall.
Two factors impact calculation of a publication’s volume: subscriber circulation level and frequency of mailings. A higher circulation level tends to increase density, allow more pieces per bundle and container, and may make drop-shipping more cost effective for the mailer. Figure 7 shows the percentages of carrier route presort per mailing by publication volume for all Periodicals.
27. The editorial content in Periodicals must average at least 25 percent annually. For any individual Periodicals mailing, the advertising content must be at least 10 percent.
September 2011 27

Chapter 2 Classification and Pricing
Figure 7: Percent of Volume Presorted to Carrier Route by Total Publication Volume
Source: Postal Regulatory Commission analysis of Postal Service data.
Figure 7 highlights the interaction between annual publication volume and the decision or ability to presort to the carrier route level. Most Periodicals mailers (80 percent) mail fewer than 100,000 Outside County copies per year. These mailers average less than 15 percent Carrier Route volume. This suggests that average low volume mailers have fewer pieces per mailing and may not have the density to qualify for carrier route and drop-ship discounts. Thus, they employ mail preparation options that make extensive use of the Postal Service’s processing network. Sixteen percent of publications mail more than 100,000 but fewer than 1,000,000 pieces per year, and these mailers average 35 percent Carrier Route presorted volume.
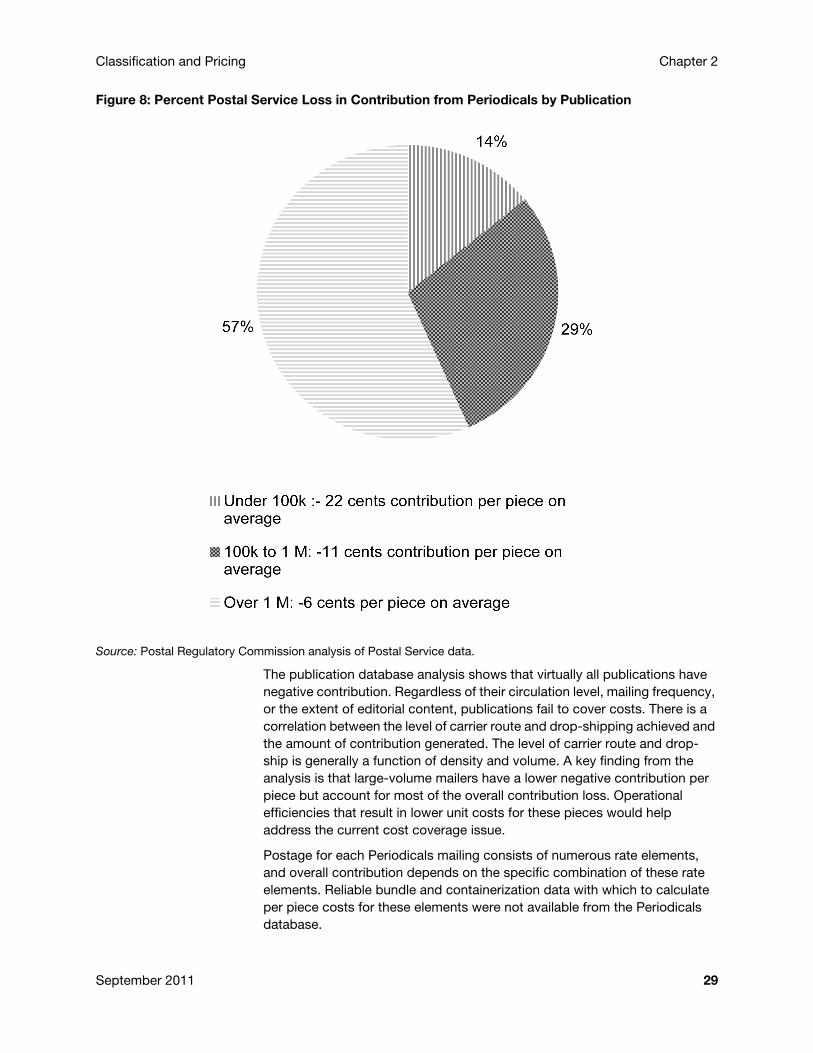
The analysis of the mailer database shows that the publications with the lowest mailed annual volume provide the least contribution to institutional costs (overhead) on a per piece basis. However, the publications with the highest mailed annual volume contribute the most to the overall loss from Periodicals. Figure 8 shows that publications that mailed fewer than 100,000 pieces annually in FY 2009 had a contribution of negative 22 cents per piece but accounted for only 14 percent of the over $600 million contribution shortfall for the Periodicals class in total. Publications with annual volume over 1 million pieces had a contribution of only negative 6 cents per piece but accounted for 57 percent of the Periodicals contribution shortfall.
28 Periodicals Mail Study
Classification and Pricing Chapter 2
Figure 8: Percent Postal Service Loss in Contribution from Periodicals by Publication
Source: Postal Regulatory Commission analysis of Postal Service data.
The publication database analysis shows that virtually all publications have negative contribution. Regardless of their circulation level, mailing frequency, or the extent of editorial content, publications fail to cover costs. There is a correlation between the level of carrier route and drop-shipping achieved and the amount of contribution generated. The level of carrier route and drop-ship is generally a function of density and volume. A key finding from the analysis is that large-volume mailers have a lower negative contribution per piece but account for most of the overall contribution loss. Operational efficiencies that result in lower unit costs for these pieces would help address the current cost coverage issue.
Postage for each Periodicals mailing consists of numerous rate elements, and overall contribution depends on the specific combination of these rate elements. Reliable bundle and containerization data with which to calculate per piece costs for these elements were not available from the Periodicals database.
September 2011 29
Chapter 2 Classification and Pricing
The Postal Service agrees with the conclusions that no grouping of mail by circulation or publication frequency covers its costs, but disagrees with the specific approach of a portion of the Commission’s analysis presented because it overstates the total unit profitability of Carrier Route mail. While it is true that the precise Carrier Route per piece rate element covers the cost of the Carrier Route per piece cost, it is impossible to enter a Carrier Route piece without it also being entered in a Carrier Route bundle, and Carrier Route bundles do not cover their costs. While a comparison of the per piece bundle costs of carrier route and 5-digit mail would be informative, the data to perform such an analysis are not available. The Postal Service believes that such detailed data collection efforts are neither practicable nor cost-effective and would not fit with current or planned data collection and cost attribution methods.
Furthermore, this analysis does not take into consideration the editorial piece discount which can apply to Carrier Route pieces. Because the per piece editorial discount is greater than the per piece contribution from the carrier route rate element, when the editorial discount is incorporated into the analysis, Carrier Route pieces are not covering their per piece costs.
The Commission believes that there is a correlation between the level of carrier route and drop-shipping achieved and the amount of negative contribution generated. The level of carrier route and drop-ship is generally a function of density, and volume often drives density.
Both the Postal Service and the Commission agree that a key finding from the analysis is that large volume mailers have a lower negative contribution per piece but account for most of the overall contribution loss. Consequently, if these pieces could achieve breakeven, the overall loss would be substantially lower.
30 Periodicals Mail Study
Chapter 3 Operational Context
Introduction
As stated previously, virtually all Periodicals mail is flat-shaped. Therefore, to understand current Periodicals postal operations, it is necessary to examine current flats processing.
Although there are standard operating procedures, these procedures are subject to some local management discretion. Not all postal processing plants are set up identically; that would be both impossible and undesirable due to the varying types of postal functions or a combination of functions performed at different facilities. There are differences in real estate footprint [i.e., size and design of building(s)], equipment available for mandated functions, and other conditions, such as available labor, characteristics of incoming mail volumes, and weather. The most critical element to improvement in all flats processing is straightforward: postal automation, along with efficient mailer preparation, can optimize turnaround times, minimize (but may not eliminate) manual handling, and lower costs.28
At times, the move toward standardization and best practices may conflict with a culture that has traditionally been geared towards trying to meet customer requests for specialized service. While meeting customer requests can be desirable for individual mailers, it often circumvents the Postal Service’s efforts to standardize and automate handling, and can add significant additional labor costs. This chapter provides an in-depth discussion of Periodicals mail processing.
Network, Facilities and Logistics
NetworkThe Postal Service operates one of the largest, most complex distribution and logistics networks in the world. The mail processing and delivery network is composed of more than 500 mail processing facilities29 and related logistics centers and transfer facilities. The network distributes mail to and from some 930 3-digit ZIP Code™ service areas, which contain over 32,000 Post Office/delivery units and their associated retail units30 (where customers purchase stamps and mail packages). This complex network includes delivery to nearly 150 million city, rural, Post Office box, and
28. Mail prepared for automation may be manually handled for many reasons; these are discussed in Chapter 3.29. 2010 Annual Report, USPS, Usage of Facilities, Processing Facilities chart, page 37.30. Ibid, Usage of Facilities, Postal-Managed Retail and Delivery Facilities chart, page 37, 2010 data.
September 2011 31
Chapter 3 Operational Context
highway contract route delivery points,31 six days a week. The logistics surface network supports flat mail processing and delivery operations, with over 203,000 postal operated vehicles32 and 15,900 transportation contracts providing services over 1.6 billion highway miles in 2010.33 Mail of various product categories and shapes is entered at a number of acceptance points in the network and flows through complex, often highly automated processing streams, with flat mail processed on over 1,10034 bundle and flat mail processing machines.
The Postal Service processing and distribution network is the product of an evolutionary process that has expanded to serve a growing nation. It is a network of transportation, mail processing, and distribution support. Management of this network requires constant adaptations to a changing environment.35 The Postal Service accepts and processes over 170 billion pieces of mail annually.36 In FY 2010, Periodicals mail comprised 4.3 percent of this volume, at 7.3 billion pieces.37
Periodicals mail processing and distribution begins with mail deposited into the postal system and transported to a centralized processing facility (plant). Most commercial mailers with larger volumes deposit their mail at the dock of a processing facility. Based on the mail’s characteristics and ultimate destination, it is then directed to different sorting operations. Mail for local delivery can be sorted to the delivery office, the various carrier routes within a delivery office, and the actual sequence in which mail is delivered on the route itself. This mail is later transported to the local delivery office for next-day delivery.
All mail is routed by ground transportation to a destinating mail-processing plant. At the destinating plant, the incoming mail is commingled with other mail for similar destinations, whether it is mail generated locally, from longer distances, or commercial mail (i.e., Periodicals and Standard Mail) entered at origin or destination by mailers and sorted to the appropriate delivery office. From there, local transportation brings it to the delivery office for final delivery.
Area Distribution Center NetworkAn Area Distribution Center (ADC) is a network designation for a mail processing point that receives and distributes mail destined for specific ZIP Code ranges. The ADC is one of the points within the national distribution network. Each ADC is defined by the first three digits of the ZIP Code of the Post Offices it serves and is located by association with a Processing and Distribution Center facility (P&DC). Other types of postal facilities are
31. Ibid, pp. 150, 155, 461.32. Ibid, USPS 2010 Annual Report, Vehicle Inventory, page 37, combination of Delivery and Collection, Mail Transport Equipment
(Tractor and Trailers) and Mail Transport (3–9 Ton).33. Information compiled as supplied by Supply Management, Surface Transportation Contracts, EDW report Logistics, Q4 - FY10.34. Information compiled as supplied by USPS Processing Operations as of October 2010, internal MIRS data on location of
equipment types and facility types.35. Examples include changing space needs; improvements in processing equipment; shifting population centers; mail volume
fluctuations and declines; changes in mailer behavior, such as greater levels of presorting and the deposit of mail at different points into the system.
36. Ibid, Section 2, Financial Highlights, Mail Volume by Type of Service, page 43.37. Ibid, page 43.
32 Periodicals Mail Study
Operational Context Chapter 3
Sectional Center Facilities (SCFs), Network Distribution Centers (NDCs), and Post Office/Delivery Units (DDUs), described below.
Sectional Center Facility NetworkA Sectional Center Facility (SCF) is a postal facility that serves as the processing point for Post Offices in a designated geographic area as defined by the first three digits of the ZIP Codes of those offices. Some SCFs serve more than one 3-digit ZIP Code range. The SCF network can reach within and beyond a 600 mile origin facility radius, utilizing both air and surface transport including rail.
Network Distribution CenterA Network Distribution Center (NDC) is a postal facility that consolidates the processing of originating mail into fewer sites to increase operational efficiency and decrease costs, while expanding the surface transportation reach for more products. Some NDCs process destinating mail and originating turn-around mail for specific service areas in addition to surface transportation containerization and dispatch functions. Some NDCs handle mail for destinations outside the service area and some NDCs function as gateway sites for consolidating mail from the other NDCs.
Post Office/Delivery UnitA Post Office/Delivery Unit performs carrier mail delivery functions and has primary responsibility for collection and delivery in a very specific geographic area (one or more 5-digit Zip Codes).
Postal Processing Facilities (Plants)Processing and Distribution Centers (P&DCs) and Processing and Distribution Facilities (P&DFs) are sectional center facilities that service one or more 3-digit ZIP Code service areas. This processing network is comprised of 424 facilities with 895 automated and mechanized flat mail processing machines.38 Typically, each center is a dedicated mail processing facility that receives incoming mail from other facilities and accepts drop-shipped mail from mailers for processing and delivery within its service area.
The 21 NDCs39 are highly mechanized and automated mail processing facilities that service all P&DC/Fs, often over a multi-state service-wide area. This nationwide network is comprised of 65 automated and mechanized flat mail processing machines. There are three tiers of NDCs. Tier 1 NDCs handle the distribution of only local and destination flat mail and Package Services pieces, while the Tier 2 and Tier 3 NDCs handle local and network mail for transport to other NDCs. All NDCs handle surface transfer center containerization and dispatch operations for outgoing and incoming mail.
38. USPS 2010 Annual Report, page 37, Processing Facilities chart, combined Processing and Distribution Centers together with Customer Service Facilities, 2010 data.
39. NDCs were formerly designated as Bulk Mail Centers.
September 2011 33
Chapter 3 Operational Context
Logistics and Distribution Centers (L&DCs) serve primarily to perform shape-based piece distribution, typically for parcels and/or bundles aggregated from more than one P&DC/F. The multiple L&DC locations have 63 automated and mechanized flat mail processing machines. L&DCs typically consolidate the dispatch, receipt, and transfer of containerized mail for their service area facilities.40
The Delivery Unit is a facility that has carrier mail delivery functions. A Delivery Unit is also known as a Post Office, Associate Office, station, branch or carrier annex. There are over 32,000 delivery unit facilities41 that can be co-located at a Post Office with retail service operations. Mailers in some instances have product(s) that may qualify for deposit at a Delivery Unit (DDU entry). Flat mail distribution activities are performed manually by delivery unit personnel. Carriers from delivery units serve nearly all of the 150 million delivery service points.42 Transportation to a delivery unit from a servicing P&DC/F is provided by both postal-operated and contract transportation vehicles.
LogisticsThe Postal Service operates one of the largest vehicle fleets in the nation. Postal-operated transportation includes over 193,000 delivery and collection vehicles and over 8,000 heavy duty trucks.43 This heavy duty fleet services the facility network of P&DCs, NDCs, L&DCs, and Annexes, while the delivery and collection fleet operates to serve delivery units and nearly 150 million service points.
Supplementing the postal vehicle fleet are contract transportation services which typically perform longer distance highway transportation trips between NDCs, P&DC/Fs, L&DCs, and Annexes. Local, short distance highway contract services are used in rural communities across the nation to perform mail delivery similar to what postal employees provide elsewhere. In 2010 there were 8,100 long distance contract transport services between networked facilities,44 and 7,800 carrier delivery service routes45 servicing over 2.7 million rural delivery points.46
40. Annexes and other transfer facility types serve as central mail facilities that distribute and dispatch incoming and outgoing mail for one or more P&DC/F. There are over 50 annexes and other centralized locations with 96 automated and mechanized flat mail processing equipment pieces (source: United States Postal Service 2010 Annual Compliance Report (ACR), December 29, 2010).
41. 2010 ACR, page 37.42. USPS, 2010 Comprehensive Statement on Postal Operations, Delivery Points by Type of Delivery chart, page 30.43. USPS 2010 Annual Report, page 37.44. Information compiled as supplied by Supply Management, Surface Transportation Contracts, EDW report Logistics, Q4 –
FY10, 8,100 is the net differential between 15,900 total contracts less 7,800 contracted delivery service routes.45. USPS 2010 Comprehensive Statement on Postal Operations, Number of Routes by Type of Delivery chart, page 30.46. Information compiled as supplied by Supply Management, Surface Transportation Contracts, EDW report Logistics, Q4 –
FY10.
34 Periodicals Mail Study
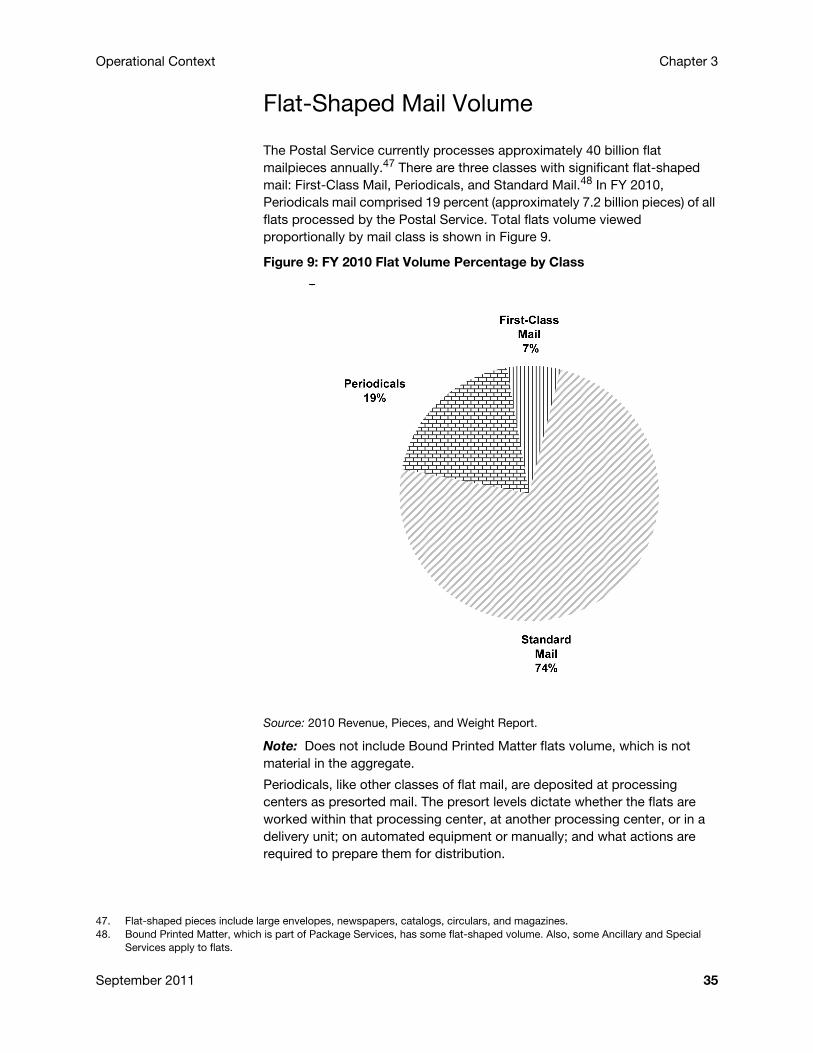
Operational Context Chapter 3
Flat-Shaped Mail Volume
The Postal Service currently processes approximately 40 billion flat mailpieces annually.47 There are three classes with significant flat-shaped mail: First-Class Mail, Periodicals, and Standard Mail.48 In FY 2010, Periodicals mail comprised 19 percent (approximately 7.2 billion pieces) of all flats processed by the Postal Service. Total flats volume viewed proportionally by mail class is shown in Figure 9.
Figure 9: FY 2010 Flat Volume Percentage by Class
Source: 2010 Revenue, Pieces, and Weight Report.
Note: Does not include Bound Printed Matter flats volume, which is not material in the aggregate.
Periodicals, like other classes of flat mail, are deposited at processing centers as presorted mail. The presort levels dictate whether the flats are worked within that processing center, at another processing center, or in a delivery unit; on automated equipment or manually; and what actions are required to prepare them for distribution.
47. Flat-shaped pieces include large envelopes, newspapers, catalogs, circulars, and magazines.48. Bound Printed Matter, which is part of Package Services, has some flat-shaped volume. Also, some Ancillary and Special
Services apply to flats.
September 2011 35
Chapter 3 Operational Context
Packaging and Presort
Periodicals mailers are required to package flat-size mailpieces for different presort destinations into groups. These groups are referred to as bundles. A bundle is a group of addressed pieces secured together as a unit. Bundles can vary in size and can be secured with bands or shrink-wrap. Banding includes plastic bands, rubber bands, twine, string, or similar material. Bundles are expected to withstand normal transit and handling without breaking.
Bundles are then further presorted on pallets or in sacks. Approximately 80 percent of Periodicals bundles are entered on pallets and the remainder in sacks, or in a few instances, flat tubs. Pallets and sacks are received at designated processing centers based upon the particular make-up (presort). Less than one percent of Periodicals is deposited directly at a delivery unit, bypassing all upstream processing center handlings.
Approximately 90 percent of bundles on pallets and in sacks require a bundle distribution process involving allied labor shuttling pallets and sacks to and from preparation areas and then to an Automated Package Processing System (APPS) or a Small Parcel and Bundle Sorting System (SPBS). In processing centers without bundle sorting equipment, bundle distribution is a manual process. The bundle distribution (sorting) separates the Periodicals bundles for the next handling or pieces process.
Less than 10 percent of Periodicals are received as 5-digit carrier route pallets (with all mail sorted to the individual carrier routes within a single ZIP Code); these pallets require a simple dock transfer and transportation to the identified delivery units. Periodicals arrive at the Bulk Mail Entry Unit (BMEU), where the postage is recorded, and the mail container is labeled and prepared for staging. Most Periodicals require at least some processing at Postal Service facilities, but sacks and pallets containing only carrier route mail for one DDU will be isolated and cross-docked49 for transportation to the appropriate DDU.
Approximately 59 percent of Periodicals presorted by mailers are carrier route bundles. Much of the remaining mail is presorted to the particular 5-digit ZIP Code. When mailers have insufficient volume to make 5-digit bundles, they group a combination of 5-digit ZIP Codes which have the same first three digits (such as 22301, 22304, 22306, etc). These bundles are referred to as 3-digit working mail because it will require an initial piece sort to separate by 5-digit ZIP Codes before it can be sorted to the carrier route. During the bundle distribution process, carrier route bundles processed in other than Flats Sequencing System (FSS) zones are separated and then transported to the designated delivery office. All other bundles of 5-digit and 3-digit mail require one or more piece sortations before they can be sent to the individual carrier for manual sequencing and delivery (except for FSS zones, which are discussed below).
49. Cross-docking is a warehouse activity involving receiving a load and placing it in the staging area to be loaded and shipped to another location.
36 Periodicals Mail Study
Operational Context Chapter 3
This piece sorting is done either automatically on high-speed sorters or manually. Mail that is prepared to Postal Service specifications for machinability and automation may qualify for lower prices (to reflect the barcoding and other preparation features), and would be designed to be handled on automation. Mail that is not barcoded—or by virtue of its size or other characteristics is nonmachinable—will be handled manually.
Flats Processing Equipment
Over 90 percent of Periodicals mail arriving at a processing facility in pallets or sacks requires an initial bundle separation (also referred to as distribution). The Postal Service processes bundles using APPS, the mechanized SPBS, or a manual sort process. Bundles are sorted and placed into Mail Transport Equipment such as hampers or cardboard containers on pallets, known as triwalls,50 for transfer between operations or other downstream facilities.
The presort level for each bundle of flats can be identified by “Optional Endorsement Line” information included in the address block or by separate adhesive labels. Not all bundles for a single ZIP Code (also referred to as zone) are sorted in the same manner due to different presort levels within the bundles. Fifty-nine percent of Periodicals bundles contain pieces for a single carrier route, and therefore do not require further separation before sequencing to the delivery address. Instead, they can be transported to the FSS for automated sequencing (where available) or to the delivery unit (in non-FSS zones) for manual sequencing by the carrier. Carrier Route bundles have sequence or line of travel requirements which facilitate the manual sorting by a carrier and create greater efficiencies. Bundles not sorted to carrier route that contain mail for a single ZIP Code can also be transported to the FSS, but non-FSS zones would require an additional single piece sort in order to separate the flats for each carrier. Bundles containing pieces presorted to a 3-digit level or less will require an initial piece distribution to separate the 5-digit ZIP Codes, and then a second operation to reach the carrier route sort. Single piece distribution is completed using the Automated Flat Sorting Machine 100 (AFSM 100), Upgraded Flats Sorter Machine 1000 (UFSM 1000), or a manual process.
Bundle Sortation
Automated Package Processing Systems The Automated Package Processing Systems (APPS) is the preferred machine for flat mail bundle sortation, as it sorts at processing rates greater than that of the mechanized SPBS. See Figure 10. Using address recognition software, barcode readers, optical character readers, and the remote encoding process when needed, the APPS determines the bundle presort level as well as ZIP Code. The 74 APPS machines sort up to 9,500 bundles per hour into as many as 200 output bins. Each bundle flows to the
50. Triwalls are made of cardboard like a box, but the box has no bottom and no top. Triwalls sit on pallets, so the Postal Service can use pallet jacks to move them around. Mailers prepare pallets by stacking bundles of publications on the pallet surface and then use a shrink-wrap to hold everything in place for transit.
September 2011 37
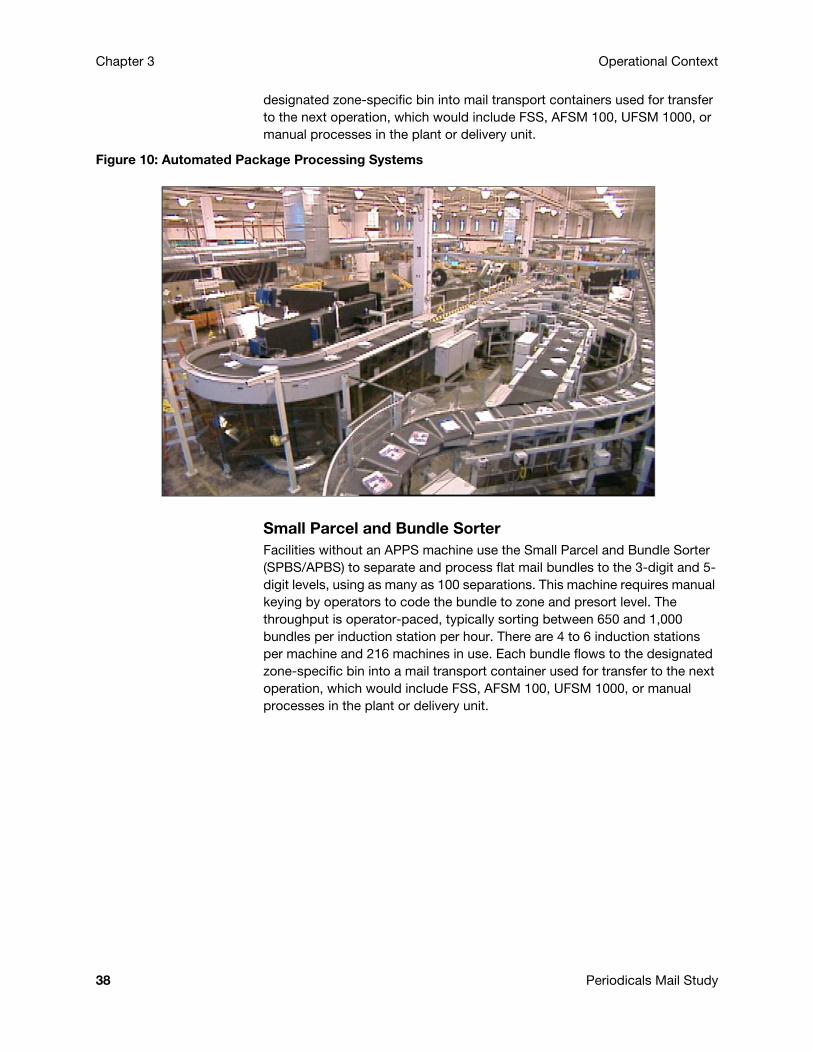
Chapter 3 Operational Context
designated zone-specific bin into mail transport containers used for transfer to the next operation, which would include FSS, AFSM 100, UFSM 1000, or manual processes in the plant or delivery unit.
Figure 10: Automated Package Processing Systems
Small Parcel and Bundle Sorter Facilities without an APPS machine use the Small Parcel and Bundle Sorter (SPBS/APBS) to separate and process flat mail bundles to the 3-digit and 5-digit levels, using as many as 100 separations. This machine requires manual keying by operators to code the bundle to zone and presort level. The throughput is operator-paced, typically sorting between 650 and 1,000 bundles per induction station per hour. There are 4 to 6 induction stations per machine and 216 machines in use. Each bundle flows to the designated zone-specific bin into a mail transport container used for transfer to the next operation, which would include FSS, AFSM 100, UFSM 1000, or manual processes in the plant or delivery unit.
38 Periodicals Mail Study
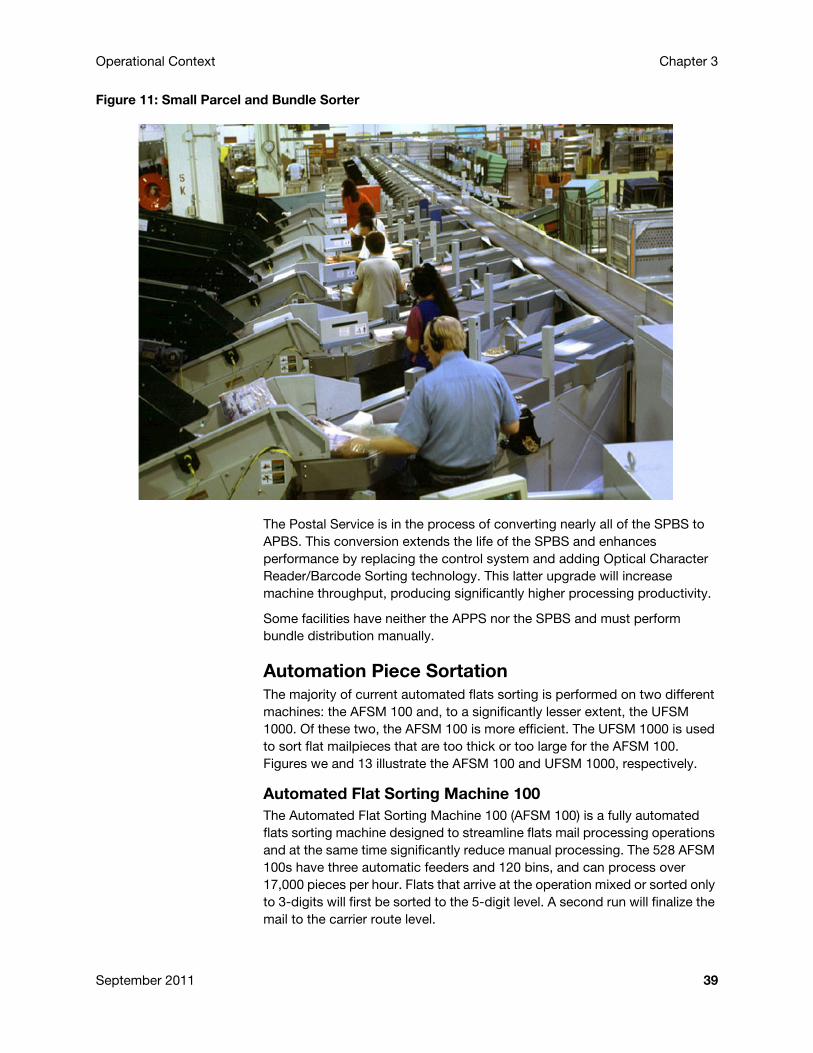
Operational Context Chapter 3
Figure 11: Small Parcel and Bundle Sorter
The Postal Service is in the process of converting nearly all of the SPBS to APBS. This conversion extends the life of the SPBS and enhances performance by replacing the control system and adding Optical Character Reader/Barcode Sorting technology. This latter upgrade will increase machine throughput, producing significantly higher processing productivity.
Some facilities have neither the APPS nor the SPBS and must perform bundle distribution manually.
Automation Piece SortationThe majority of current automated flats sorting is performed on two different machines: the AFSM 100 and, to a significantly lesser extent, the UFSM 1000. Of these two, the AFSM 100 is more efficient. The UFSM 1000 is used to sort flat mailpieces that are too thick or too large for the AFSM 100. Figures we and 13 illustrate the AFSM 100 and UFSM 1000, respectively.
Automated Flat Sorting Machine 100 The Automated Flat Sorting Machine 100 (AFSM 100) is a fully automated flats sorting machine designed to streamline flats mail processing operations and at the same time significantly reduce manual processing. The 528 AFSM 100s have three automatic feeders and 120 bins, and can process over 17,000 pieces per hour. Flats that arrive at the operation mixed or sorted only to 3-digits will first be sorted to the 5-digit level. A second run will finalize the mail to the carrier route level.
September 2011 39
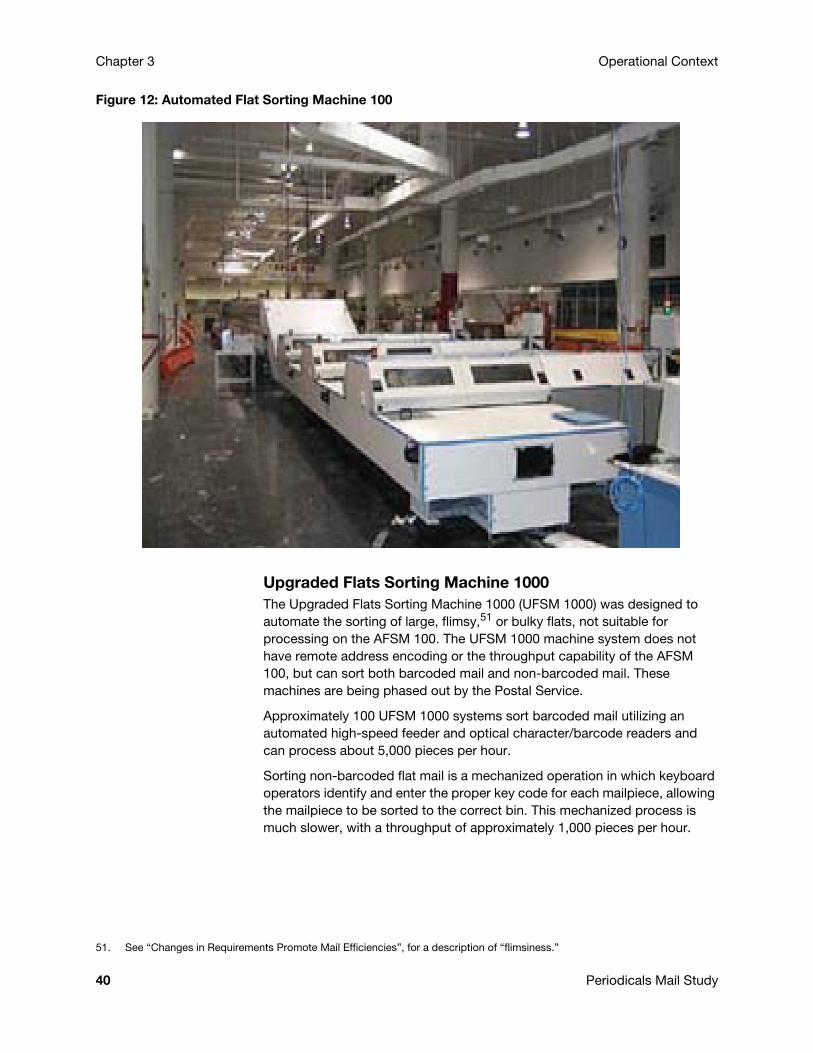
Chapter 3 Operational Context
Figure 12: Automated Flat Sorting Machine 100
Upgraded Flats Sorting Machine 1000 The Upgraded Flats Sorting Machine 1000 (UFSM 1000) was designed to automate the sorting of large, flimsy,51 or bulky flats, not suitable for processing on the AFSM 100. The UFSM 1000 machine system does not have remote address encoding or the throughput capability of the AFSM 100, but can sort both barcoded mail and non-barcoded mail. These machines are being phased out by the Postal Service.
Approximately 100 UFSM 1000 systems sort barcoded mail utilizing an automated high-speed feeder and optical character/barcode readers and can process about 5,000 pieces per hour.
Sorting non-barcoded flat mail is a mechanized operation in which keyboard operators identify and enter the proper key code for each mailpiece, allowing the mailpiece to be sorted to the correct bin. This mechanized process is much slower, with a throughput of approximately 1,000 pieces per hour.
51. See “Changes in Requirements Promote Mail Efficiencies”, for a description of “flimsiness.”
40 Periodicals Mail Study
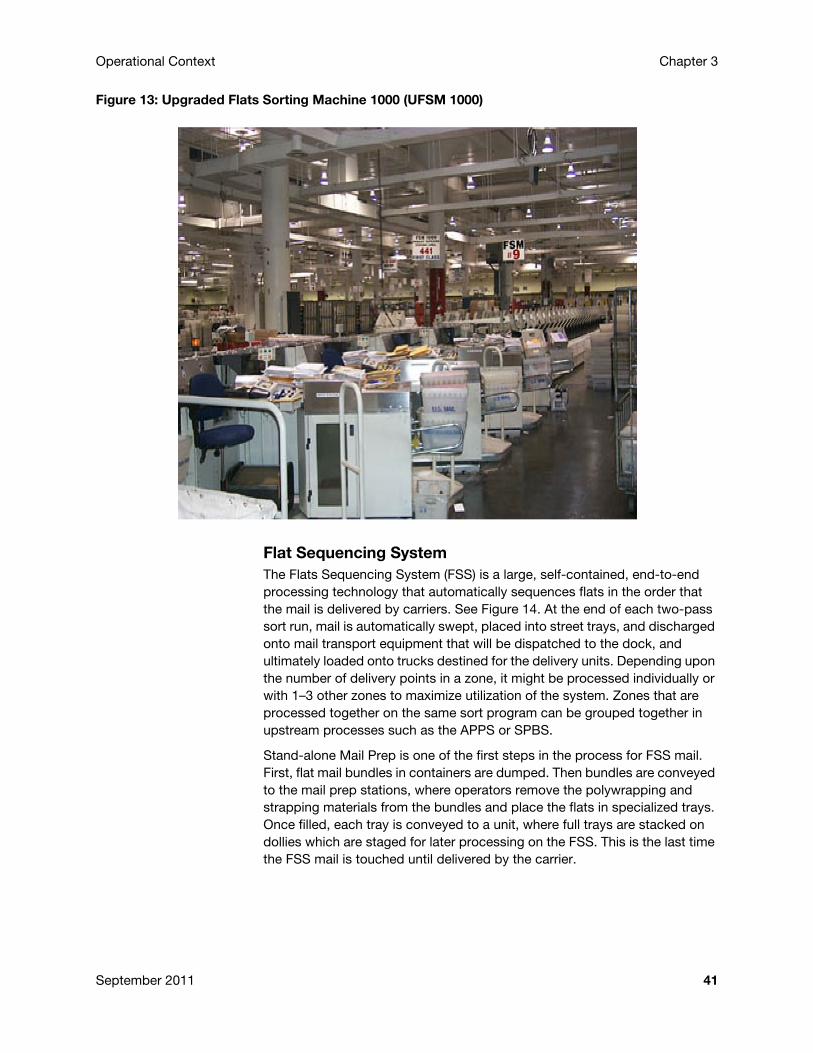
Operational Context Chapter 3
Figure 13: Upgraded Flats Sorting Machine 1000 (UFSM 1000)
Flat Sequencing SystemThe Flats Sequencing System (FSS) is a large, self-contained, end-to-end processing technology that automatically sequences flats in the order that the mail is delivered by carriers. See Figure 14. At the end of each two-pass sort run, mail is automatically swept, placed into street trays, and discharged onto mail transport equipment that will be dispatched to the dock, and ultimately loaded onto trucks destined for the delivery units. Depending upon the number of delivery points in a zone, it might be processed individually or with 1–3 other zones to maximize utilization of the system. Zones that are processed together on the same sort program can be grouped together in upstream processes such as the APPS or SPBS.
Stand-alone Mail Prep is one of the first steps in the process for FSS mail. First, flat mail bundles in containers are dumped. Then bundles are conveyed to the mail prep stations, where operators remove the polywrapping and strapping materials from the bundles and place the flats in specialized trays. Once filled, each tray is conveyed to a unit, where full trays are stacked on dollies which are staged for later processing on the FSS. This is the last time the FSS mail is touched until delivered by the carrier.
September 2011 41
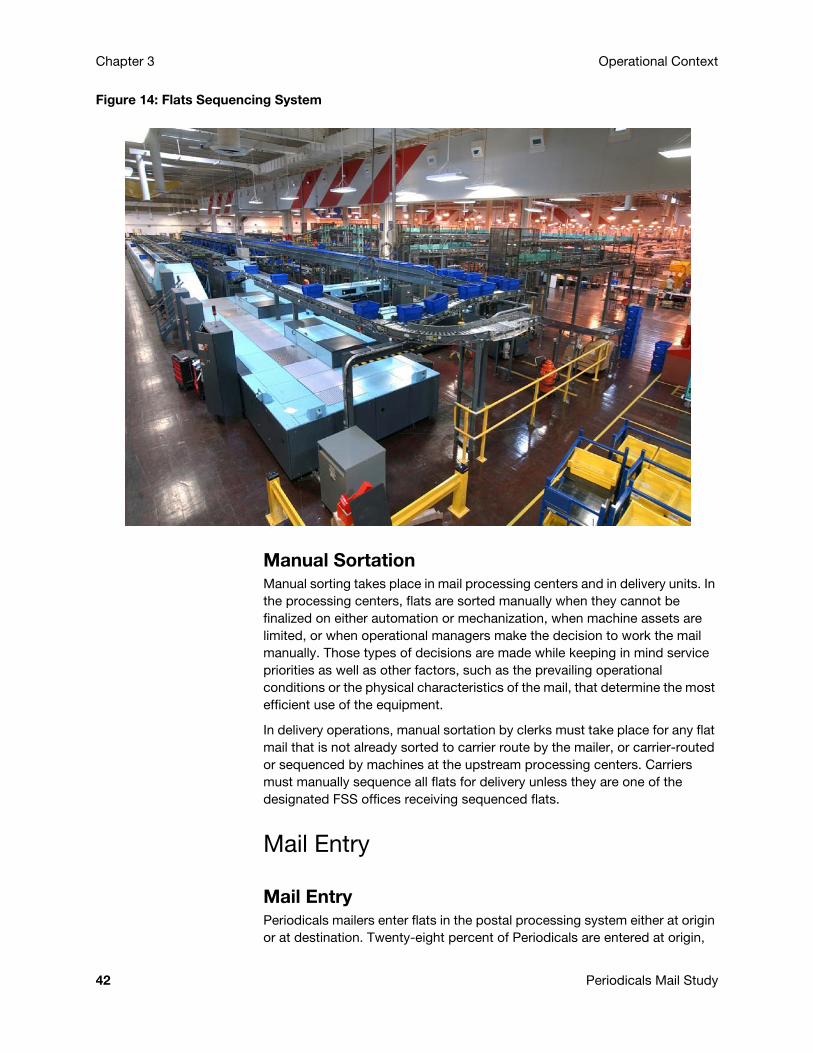
Chapter 3 Operational Context
Figure 14: Flats Sequencing System
Manual SortationManual sorting takes place in mail processing centers and in delivery units. In the processing centers, flats are sorted manually when they cannot be finalized on either automation or mechanization, when machine assets are limited, or when operational managers make the decision to work the mail manually. Those types of decisions are made while keeping in mind service priorities as well as other factors, such as the prevailing operational conditions or the physical characteristics of the mail, that determine the most efficient use of the equipment.
In delivery operations, manual sortation by clerks must take place for any flat mail that is not already sorted to carrier route by the mailer, or carrier-routed or sequenced by machines at the upstream processing centers. Carriers must manually sequence all flats for delivery unless they are one of the designated FSS offices receiving sequenced flats.
Mail Entry
Mail EntryPeriodicals mailers enter flats in the postal processing system either at origin or at destination. Twenty-eight percent of Periodicals are entered at origin,
42 Periodicals Mail Study
Operational Context Chapter 3
and 72 percent are entered at destination. Flat mail whether entered at origin or destination will merge at some point (early on) in the processing flow.
Origin EntryOrigin entry mail is verified, accepted, and entered at an origin postal facility BMEU. Thus, origin entry mail is verified and accepted at the same location.
Destination EntryDestination entry mail is accepted via the plant-verified drop-shipment (PVDS) program, in which verification and postage payment is performed at an origin facility, and then the mail is transported by the mailer, at the mailer’s expense, to a destination processing facility. The term “drop-shipment” is generally used instead of PVDS. Under the drop-shipment program, USPS employees in many cases are assigned to a detached mail unit (DMU) at a mailer's plant. The shipments are verified at the mailer’s plant and released for mailer transportation that bypasses the origin processing facility.
The following four destination entry prices are used with Periodicals:
1. DNDC: Destination Network Distribution center price.
2. DADC: Destination Area Distribution center price.
3. DSCF: Destination Sectional Center Facility price.
4. DDU: Destination Delivery Unit price.
Facility Access and Shipment Tracking The Postal Service offers the Facility Access and Shipment Tracking (FAST) system for its mailers to schedule appointments. FAST is an electronic appointment scheduling system that allows mailers to make appointments and obtain information generated by the destination facility. Periodicals mailers’ appointments for their drop-shipments provide visibility to the postal staff on site. They will know when the mail should arrive, what publication it is, and how much volume is being mailed.
FAST allows the Postal Service to collect and monitor data about drop-shipments. The main objective of FAST is to improve dock efficiency time. FAST is designed to interface with other postal applications and systems to enable ongoing transformation to an environment where the mail product is visible to the Postal Service and customers from entry to delivery.
Each drop-shipment mailing claimed at a destination price must be dropped at the location established by the Postal Service within the available window for appointments. Prior to arriving with a drop-shipment, the mailer is required to have a valid drop-shipment appointment with that facility.
Periodicals customers have been directed to schedule drop-shipment appointments. However, Periodicals mailers who arrive without an appointment are not turned away and are accepted as unscheduled arrivals after Periodicals mailers who have scheduled an appointment in FAST.
September 2011 43

Chapter 3 Operational Context
Late-arriving Periodicals appointments are unloaded as soon as possible after other Periodicals appointments arriving on time or early. Late-arriving Periodicals appointments are placed in queue behind other Periodicals shipments, but not behind Standard Mail or Package Services shipments.
Operating Plan, Critical Entry Time, and Hot-2C
Operating PlanA facility’s operating plan is a structured document that takes into account mail classes, mail processing equipment (automation and mechanization), average daily volumes, and target times. When considered in total, the operating plan reflects the operational structure, strategy, processing goals, and customer commitments of a postal facility. The development of an accurate operating plan for each facility is required, and is intended to aid the facility in the scheduling, processing, and delivery of its mail volume.
Critical Entry TimeThe Critical Entry Time (CET) is a key component of the operating plan. The CET is the last time a mail class or product can be received at the designated induction points in the postal network for it to be processed that day, consistent with the operating plan and service standards.52 The Postal Service has standardized CETs for Periodicals nationally to ensure that Periodicals are processed as efficiently as possible, so that costs are reduced.53 The national standardized CETs are for destination entry Periodicals. This policy does not affect the CET processing of DDU-entered Periodicals. 3-Digit areas which are sequenced on the FSS will have earlier CETs than non-FSS 3-Digit areas, due to the longer processing window of the FSS operation, which begins as early as noon. Containers requiring a bundle sort will have earlier CETs than those that do not require a bundle sort. Table 3 shows the national CETs as of July 1, 2011.
Table 3: Standardized Destination Entry Critical Entry Time for Periodicals
The standard hierarchy is automated, then mechanized processes (keying or a higher degree of human intervention), before moving to manual processes.
Within the Periodicals class there are four distinct publication types, commonly referred to as dailies, weeklies, monthlies, and quarterlies. Dailies and weeklies are often referred to within the Postal Service as “News.” These are typically subscription-based publications dropped at postal plants with expected delivery the next day.54
52. Mail that is entered at origin is subject to a Critical Acceptance Time (CAT). The Postal Service is currently working toward development of a national CAT for Periodicals.
53. See Standardized Destination Entry Critical Entry Time for Periodicals Mail in Appendix G.
Zone Bundle Sort Needed No Bundle Sort Needed
FSS 08:00 11:00
Non-FSS 16:00 17:00
54. Most daily Periodicals are dropped at plants around the country, and those dailies are processed manually to a 5-digit office for distribution to the carriers or PO Boxes, and then delivery.
44 Periodicals Mail Study
Operational Context Chapter 3
Currently, many weekly publications have a next day/day-certain/same day expectation delivery schedule as well. For example, Publication X might expect delivery all around the country on a specific day, every week. Until standardized CETs were established, weekly drops were routinely made in the late afternoon and late evening hours for next day delivery, even though the mailing had missed the CET.
In addition to meeting the CET, mailers must also consider the Critical Acceptance Time (CAT), which is the latest time mail can be presented at a BMEU for verification and still be considered to have entered the mailstream that business day, so that the clock is started for service performance measurement (i.e., the Day-0 date). When mailings are verified at the customer location by business mail acceptance personnel and transported by the Postal Service, the CAT represents the latest time a container can be dispatched from the mailer facility in order to receive that day as the Day-0 date.
Hot-2CHot-2C,55 also known as Hot Periodicals or Hot Pubs, was an unofficial practice that took place in many processing facilities and delivery units to create awareness of selected publications.56 This practice resulted in publications receiving expedited mail processing regardless of the parameters of the daily schedule and the facility operating plan. The Hot-2C practice was instituted by local management over time and, in general, publications were placed on a list based on requested or expected delivery days. Inclusion on the list was in response to frequent missed-delivery complaints, or external measurement systems that monitor selected publications for service performance. In some cases the lists were prominently displayed in the processing centers and delivery units by means of a sign or poster. The lists varied significantly from site to site, with as few as eight publications to as many as 130 publications.
Increased manual processing occurred due to management’s emphasis on meeting specific delivery days and service expectations of the publications on the lists.
55. The term “Hot-2C” is derived from the former name of the Periodicals mail class (second-class mail). 56. Effective July 1, 2011, all Hot-2C operations and bullpens have ceased and all Hot-2C signs have been removed.
September 2011 45
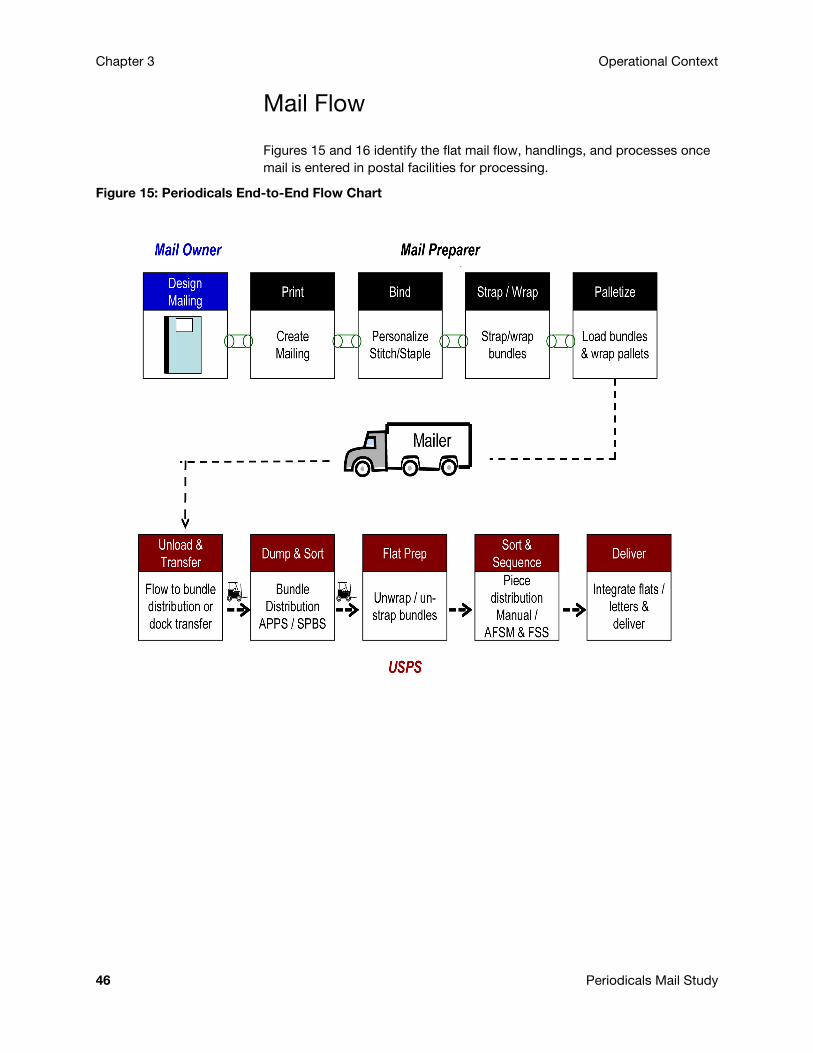
Chapter 3 Operational Context
Mail Flow
Figures 15 and 16 identify the flat mail flow, handlings, and processes once mail is entered in postal facilities for processing.
Figure 15: Periodicals End-to-End Flow Chart
46 Periodicals Mail Study
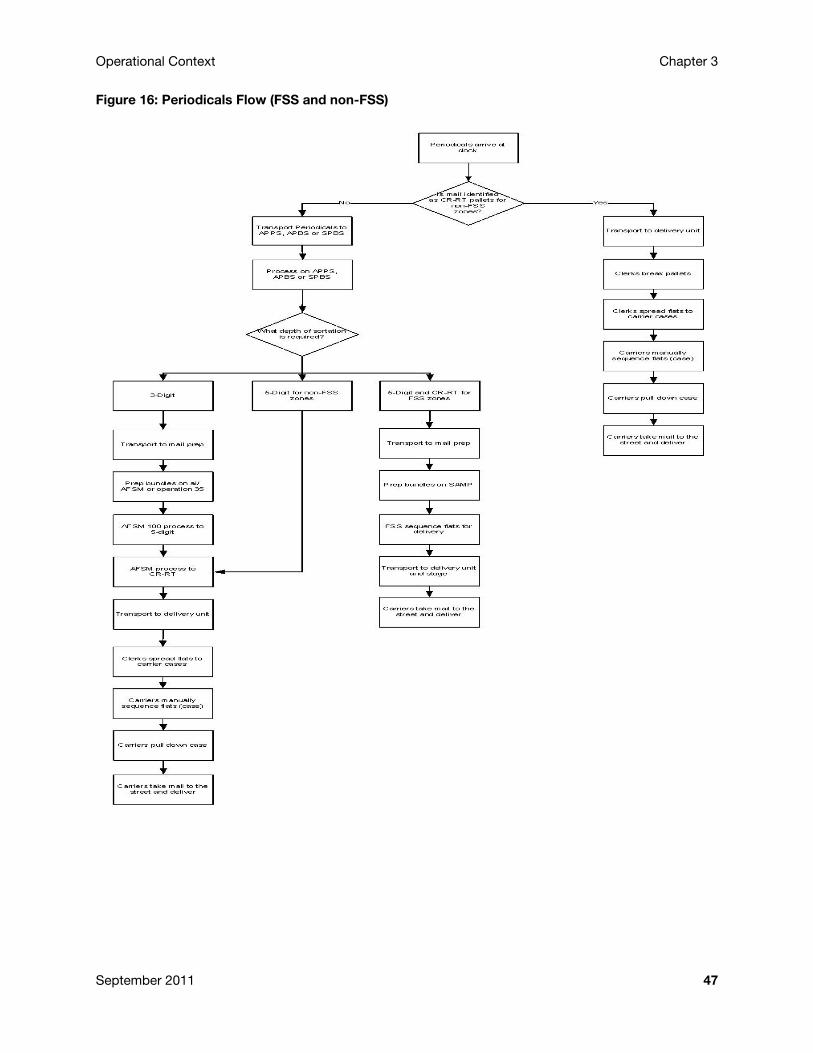
Operational Context Chapter 3
Figure 16: Periodicals Flow (FSS and non-FSS)
September 2011 47
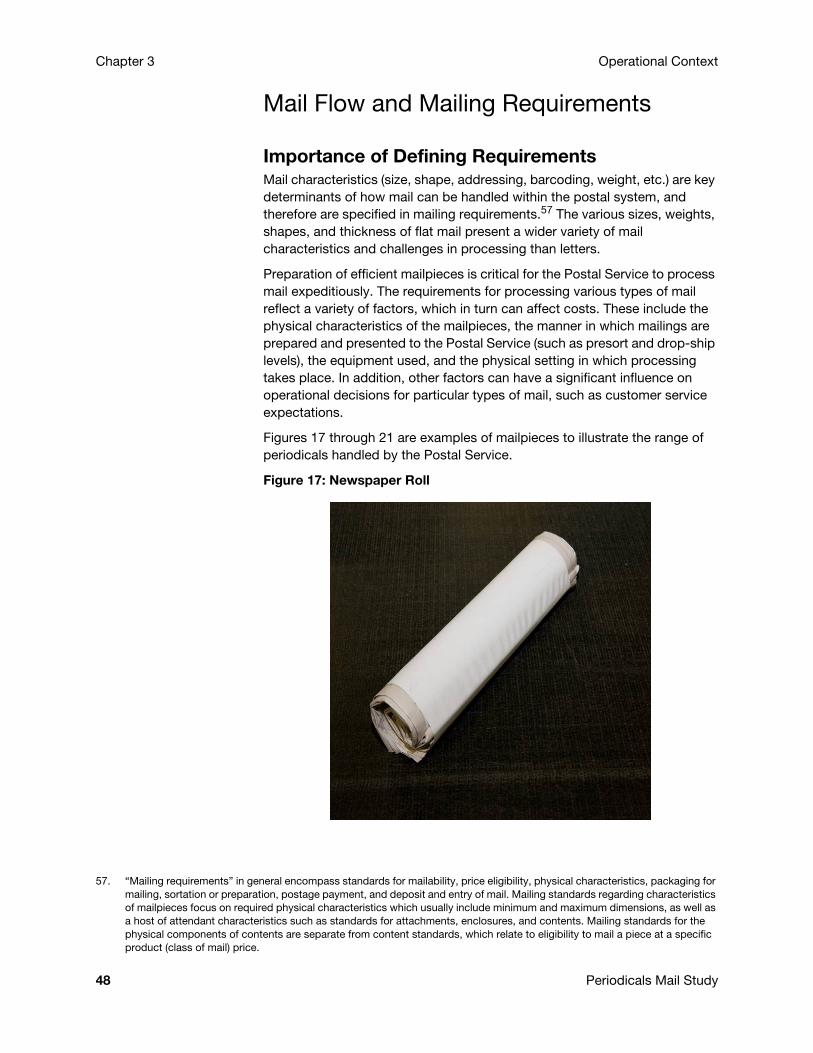
Chapter 3 Operational Context
Mail Flow and Mailing Requirements
Importance of Defining RequirementsMail characteristics (size, shape, addressing, barcoding, weight, etc.) are key determinants of how mail can be handled within the postal system, and therefore are specified in mailing requirements.57 The various sizes, weights, shapes, and thickness of flat mail present a wider variety of mail characteristics and challenges in processing than letters.
Preparation of efficient mailpieces is critical for the Postal Service to process mail expeditiously. The requirements for processing various types of mail reflect a variety of factors, which in turn can affect costs. These include the physical characteristics of the mailpieces, the manner in which mailings are prepared and presented to the Postal Service (such as presort and drop-ship levels), the equipment used, and the physical setting in which processing takes place. In addition, other factors can have a significant influence on operational decisions for particular types of mail, such as customer service expectations.
Figures 17 through 21 are examples of mailpieces to illustrate the range of periodicals handled by the Postal Service.
Figure 17: Newspaper Roll
57. “Mailing requirements” in general encompass standards for mailability, price eligibility, physical characteristics, packaging for mailing, sortation or preparation, postage payment, and deposit and entry of mail. Mailing standards regarding characteristics of mailpieces focus on required physical characteristics which usually include minimum and maximum dimensions, as well as a host of attendant characteristics such as standards for attachments, enclosures, and contents. Mailing standards for the physical components of contents are separate from content standards, which relate to eligibility to mail a piece at a specific product (class of mail) price.
48 Periodicals Mail Study
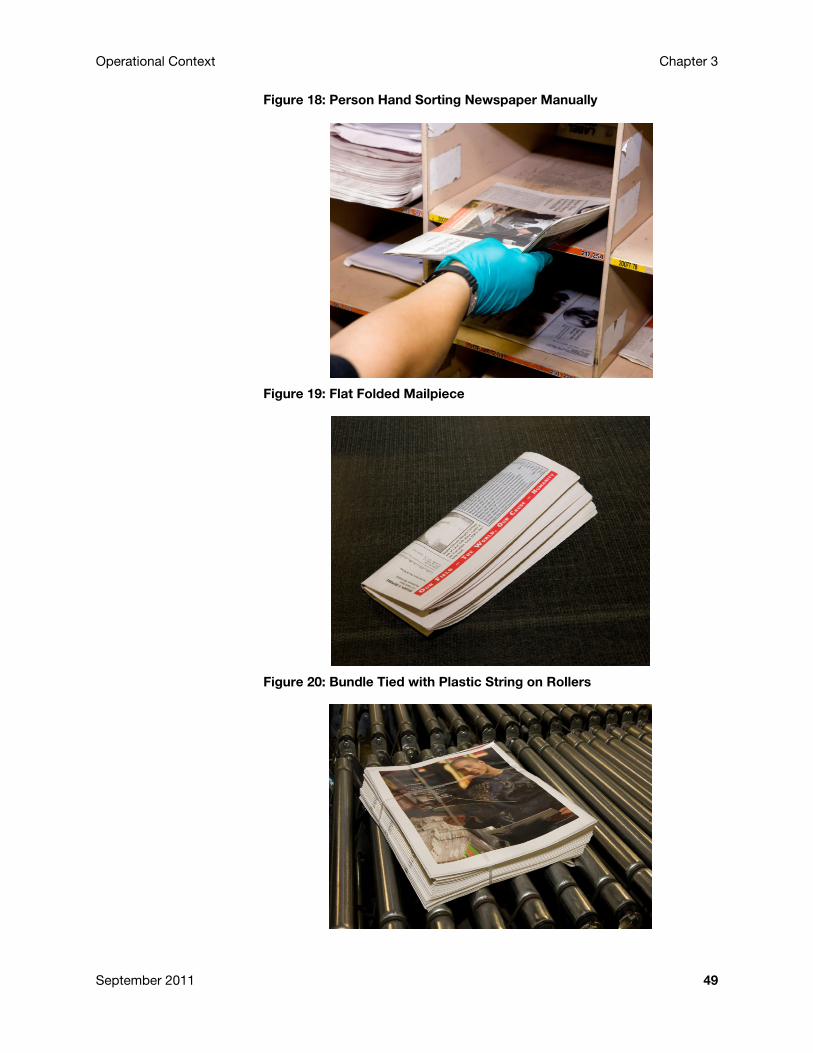
Operational Context Chapter 3
Figure 18: Person Hand Sorting Newspaper Manually
Figure 19: Flat Folded Mailpiece
Figure 20: Bundle Tied with Plastic String on Rollers
September 2011 49
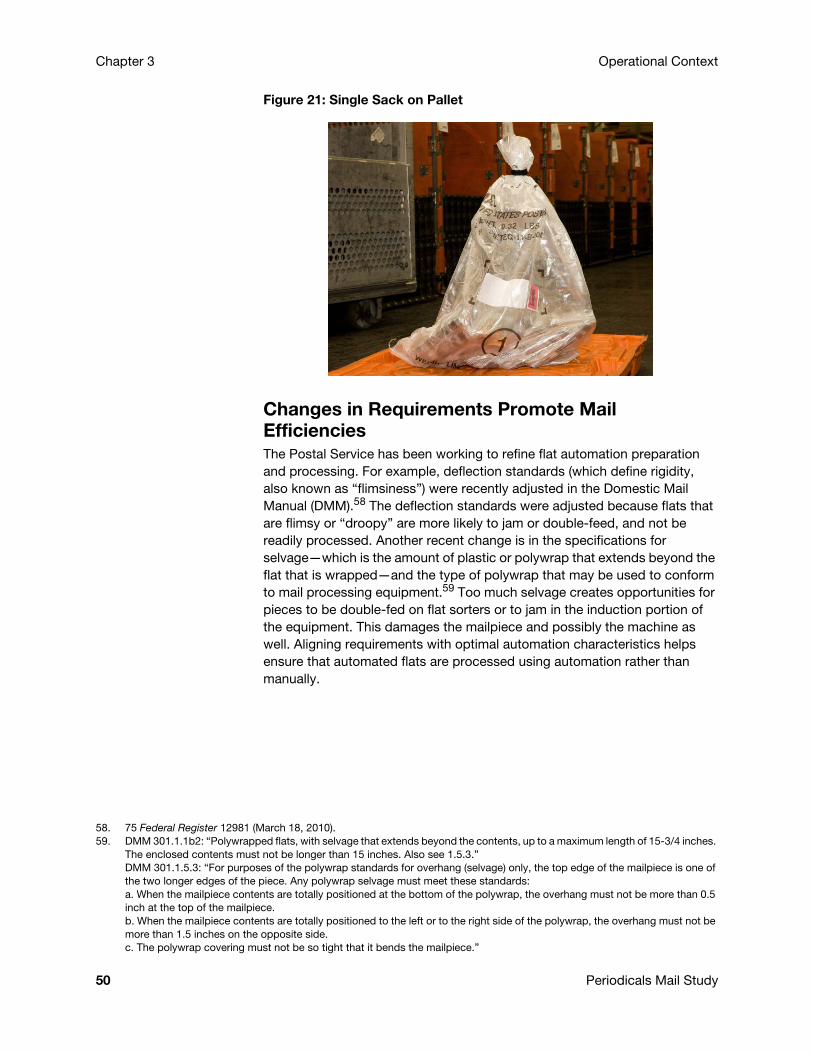
Chapter 3 Operational Context
Figure 21: Single Sack on Pallet
Changes in Requirements Promote Mail EfficienciesThe Postal Service has been working to refine flat automation preparation and processing. For example, deflection standards (which define rigidity, also known as “flimsiness”) were recently adjusted in the Domestic Mail Manual (DMM).58 The deflection standards were adjusted because flats that are flimsy or “droopy” are more likely to jam or double-feed, and not be readily processed. Another recent change is in the specifications for selvage—which is the amount of plastic or polywrap that extends beyond the flat that is wrapped—and the type of polywrap that may be used to conform to mail processing equipment.59 Too much selvage creates opportunities for pieces to be double-fed on flat sorters or to jam in the induction portion of the equipment. This damages the mailpiece and possibly the machine as well. Aligning requirements with optimal automation characteristics helps ensure that automated flats are processed using automation rather than manually.
58. 75 Federal Register 12981 (March 18, 2010).59. DMM 301.1.1b2: “Polywrapped flats, with selvage that extends beyond the contents, up to a maximum length of 15-3/4 inches.
The enclosed contents must not be longer than 15 inches. Also see 1.5.3.” DMM 301.1.5.3: “For purposes of the polywrap standards for overhang (selvage) only, the top edge of the mailpiece is one of the two longer edges of the piece. Any polywrap selvage must meet these standards: a. When the mailpiece contents are totally positioned at the bottom of the polywrap, the overhang must not be more than 0.5 inch at the top of the mailpiece. b. When the mailpiece contents are totally positioned to the left or to the right side of the polywrap, the overhang must not be more than 1.5 inches on the opposite side. c. The polywrap covering must not be so tight that it bends the mailpiece.”
50 Periodicals Mail Study
Chapter 4 Service Performance Standards
Introduction
Service performance for Periodicals is currently measured through combining data from two external, independently operated Periodicals measurement systems. The Red Tag Monitoring Service is operated by the not-for-profit Red Tag News Publications Association to monitor service for association members. The Del-Trak System is operated by Time, Inc., to monitor service for several of its publications. The measurement systems use seeded mailpieces to monitor service. The mailer-reported entry time for the mailing starts the clock, and an external reporter stops the clock.
The transit time for each of the tested publications is compared against the United States Postal Service’s (the Postal Service’s) published service standards for Periodicals. Data from the two external systems is reviewed, combined, and weighted by an independent contractor. Due to the limited number of seeded pieces, data are only statistically valid for the desired precision at a postal administrative area level.
Background
Section 301 of the Postal Accountability and Enhancement Act (PAEA), Public Law 109-435, 120 Stat. 3218, requires the Postal Service, in consultation with the Postal Regulatory Commission (the Commission), to establish a set of modern service standards for market dominant products. By statute, the service standards must be measured by an objective external performance measurement system, unless the Commission approves usage of an internal Postal Service measurement system. [39 U.S.C. § 3691(b)(1)(D) and (b)(2).]
Early in FY 2007, the Postal Service and the Mailers Technical Advisory Committee60 (MTAC) established Workgroup #114 to begin discussions on what mailers wanted with regard to service performance measurement. Workgroup #114 broke into four subgroups, one of which addressed Periodicals. Periodicals mailers felt that the existing service standards were acceptable61 but wanted to be involved in any changes proposed by the Postal Service in both the establishment of new standards and/or the establishment of Critical Entry Times (CETs).
60. The Mailers’ Technical Advisory Committee is a forum for the Postal Service to share technical information with mailers and to receive advice and recommendations from mailers on matters concerning mail-related products and services.
61. While the Postal Service may have identified the number of days it would take a mailpiece to travel between ZIP Code pairs, no formal service performance reporting had been done by the Postal Service.
September 2011 51
Chapter 4 Service Performance Standards
In addition to meeting with MTAC, the Postal Service met with the Commission to keep the Commission informed of the progress being made, as well as any temporary roadblocks encountered. The Commission established Docket No. PI2007-1 to elicit public opinion about service performance and measurement under the PAEA. In response to Commission Order No. 21, June 13, 2007, 34 sets of comments were filed by mailers, postal organizations, and the Public Representative. There was general consensus among the commenters that service standards ranging from 1 to 7 days would be acceptable as long as the standards were consistently met. Under the MTAC concept, service standards for destination-entry Periodicals mail would be either 1 day (overnight) or 2 days. For origin-entered Periodicals, service standards range from 1 to 7 days for 3-digit ZIP Code origin-destination pairs within the continental United States and up to 18 days for mail originating or destinating outside the continental United States.
FY 2008
In October 2007, the Postal Service published and solicited public comment on a proposed rule to establish service standards for market-dominant products. [72 Fed. Reg. 58,946 (Oct. 17, 2007).] In December 2007, the public was given an opportunity to comment on the Postal Service’s measurement system proposal in Docket No. PI2008-1. [Order No. 48, Notice of Request for Comments on Service Performance Measurement Systems for Market Dominant Products, PRC Docket No. PI2008-1 (Dec. 4, 2007), published in 72 Fed. Reg. 72,395 (Dec. 20, 2007).] On December 19, 2007, the Postal Service published the service standards codified at 39 C.F.R. Parts 121 and 122 as a final rule in the Federal Register. [72 Fed. Reg. 72,216.] 62 In the Postal Service’s final rule, service standards for Destination-Entry Periodicals mail within the contiguous United States were set at one day (overnight) for qualifying mail accepted prior to the CET at a Destination Delivery Unit (DDU) or a Destination Sectional Center Facility (DSCF), at two days for qualifying mail accepted at a Destination Area Distribution Center (DADC), and at one to two days for containerized mail accepted at an NDC. [39 CFR § 121.2(b)(1)-(3).] Other Destination-Entry Periodicals have a service standard of two to eight days, depending on the origin-destination pair and the circumstances of acceptance. [Id. at (b)(2), (4)-(5).] For Periodicals mail with end-to-end service within the contiguous United States, the service standards range from one to nine days, depending on acceptance and transportation conditions. [Id. at (a)(1)-(2), (6). For Periodicals mail between the contiguous United States and other 3-digit ZIP Codes, end-to-end service standards vary from one to twenty days.63 [Id. at (a)(7).]
62. Initially, the Postal Service proposed reporting the Periodicals service performance standards by end-to-end and by Destination Entry. See Federal Register, Vol. 72, No. 200. Wednesday, October 17, 2007. Proposed Rules at 58946-7.
63. Mail within Alaska, between Puerto Rico and the U.S. Virgin Islands, and between Hawaii and Guam have different service standards. 39 CFR. § 121.2(a)(3)-(5).
52 Periodicals Mail Study
Service Performance Standards Chapter 4
In June 2008, the Postal Service filed its proposed Service Performance Measurement plan in Docket No. PI2008-1. The Postal Service provided background on Periodicals, stating that the mail entered is either a bulk entry or a drop-shipment.
One issue of importance to mailers was when the time for starting the service performance measurement begins (the start-the-clock event). The Postal Service proposed to start the clock when Periodicals arrived at a postal facility. The end point for measurement (the stop-the-clock event) was proposed to be performed by an external reporter.
Interim Reporting ApproachThe Postal Service proposed an interim service performance measurement approach to be used until the Intelligent Mail system had sufficient Periodicals volume. Under the proposal, the service performance for Periodicals would be measured using two external and independent delivery monitoring systems for publications. The two monitoring systems that were combined for the measurement include (1) the Red Tag Monitoring Service operated by the not-for-profit Red Tag News Publications Association to monitor service for association members, and (2) the Del-Trak System operated by Time, Inc., to monitor service for several of its publications. These Periodicals monitoring systems would include destination-entered mail, entered mainly at DSCFs or DADCs, as well as end-to-end periodicals that have traveled through the network. According to the Postal Service, the data from the two combined delivery monitoring systems represented 38 publications and circulation for the publications presently ranges from 1,600 to nearly 4 million.64
Comments from participants in Docket No. PI2008-1 were received from the Magazine Publishers of America, Research International, National Newspaper Association (NNA), and McGraw-Hill. MPA supported the use of DelTrak and Red Tag as an interim measurement solution until Intelligent Mail Barcode (IMb) was implemented for Periodicals. [Id. at 26.] Research International expressed concern over the representativeness of DelTrak and Red Tag, noting that mailers must pay to participate in Red Tag, and the receiving reporters were volunteers. [Id.]
McGraw-Hill commented that service performance measurement was equally important for large and small mailers. McGraw-Hill questioned the eventual adoption rate of IMb by small mailers and whether measurements from IMb Periodicals would be representative of the class as a whole. [Id. at 26-27.] NNA commented that many hurdles needed to be overcome before IMb barcodes would appear on newspapers and that there were many unique problems to successfully represent smaller publications in the measurement system. However, NNA determined it would be content with leaving Within County unmeasured for the time being. [Id. at 27.] The Commission indicated that the Postal Service was working to assure that Red Tag and DelTrak would provide a representative sample. [Id.]
64. Service performance measurement definitions, 06.04.2010.
September 2011 53

Chapter 4 Service Performance Standards
In Order No. 140, the Commission approved the proposal and noted “that an additional benefit of the Red Tag- and DelTrak-based systems [would] be to serve as a check on the IMb-based system that the Postal Service propose[d] for the future. Both systems should be run in parallel at the start to make appropriate comparisons.” [Order No. 140, Order Concerning Proposals for Internal Service Standards Measurement Systems, PRC Docket No. PI2008-1, Nov. 25, 2008, at 27.]
No service performance reporting occurred in FY 2008. After completion of FY 2009 quarter (Qtr) 1 and each subsequent quarter thereafter, the Postal Service began reporting service performance as measured by DelTrak and Red Tag for each administrative area and the nation.
Under the Commission’s reporting rules, the Postal Service can apply for either temporary or permanent waivers from the reporting requirements. In FY 2009 the Postal Service requested temporary waivers for Outside County Periodicals due to the hybrid measurement system not distinguishing between Within County and Outside County pieces. The Postal Service’s request was denied by the Commission. Instead, the Commission directed the Postal Service to report all Periodicals data regardless of whether the data meets the Postal Service’s self-imposed data sufficiency thresholds. Where appropriate, the Postal Service was directed to include standard statistical calculations describing the validity of the data. In Quarter 4 of FY 2010, the Postal Service provided an overall measure of Periodicals performance at the area and national level, without segregating Destination Entry performance from end-to-end performance. Beginning Quarter 1 of FY 2011, the Postal Service proposed to report on Periodicals service performance in the Destination Entry and end-to-end categories of Periodicals until at least 80 percent of the Full-Service Intelligent Mail Periodicals data has the information necessary to determine whether each piece is Within County or Outside County.
Figure 22 provides the Quarter 4 FY 2010 service performance report. For FY 2010, the Annual Performance Score was 76.7 percent compared to a service performance goal of 90.0 percent.65
Service concerns for Within County Periodicals before the PAEA resulted in implementation of practices that would facilitate local delivery and/or reduce handling costs. “Exceptional dispatch,” which allows publishers to drop newspapers at a Post Office loading dock overnight or in the early morning, is a leading example of how the Postal Service and publishers have worked together to improve local delivery time by avoiding unnecessary handlings. However, representatives of local newspaper publishers expressed concern over delivery to local subscribers in situations where processing decisions have resulted in circuitous and extended trips for newspapers destined for local patrons. They also reported delayed or inconsistent delivery of copies addressed to subscribers located outside the county of publication.
65. http://www.prc.gov/library/USPS, Periodic Reports Quarterly Performance Reports for Quarter 4-FY 2010, filed December 21, 2010.
54 Periodicals Mail Study
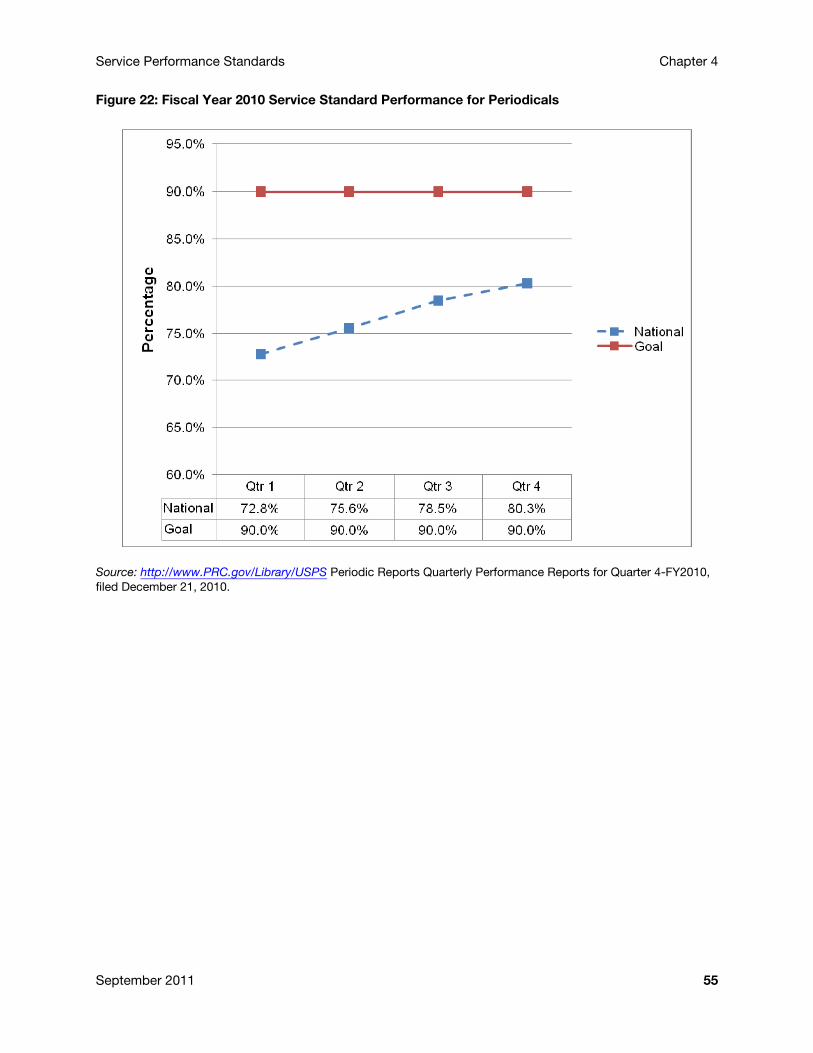
Service Performance Standards Chapter 4
Figure 22: Fiscal Year 2010 Service Standard Performance for Periodicals
Source: http://www.PRC.gov/Library/USPS Periodic Reports Quarterly Performance Reports for Quarter 4-FY2010, filed December 21, 2010.
September 2011 55

Chapter 4
This page intentionally left blank
56 Periodicals Mail Study
Chapter 5 Costs, Trends, and Data Quality
Introduction
Section 708 of the Postal Accountability and Enhancement Act (PAEA) directs the joint Periodicals cost team to review “the quality, accuracy, and completeness” of Postal Service estimates of costs attributable to Periodicals mail.
The overall cost methodology used to apportion Periodicals costs has been developed over the years and tested in litigation before the Commission. The Commission and Postal Service agree that a key conclusion of this chapter is that, on balance, Postal Service estimates of Periodicals costs are reasonably accurate for rate-setting purposes. However, the Commission finds that the data available are not sufficient to accurately assess the savings achievable through improved operational efficiency. The Postal Service believes a reasonable range of savings estimates can be made with available data; while collecting unlimited data could be desirable, doing so would be prohibitively expensive, if even possible.
This chapter provides a summary of the methodology used in developing attributable costs and also discusses the Postal Service’s past and ongoing efforts to improve this methodology to obtain valid and reasonable attributable costs for all classes. In addition, the chapter provides a detailed overview of Periodicals Outside County attributable costs for FY 2010, cost trends over the past decade, and a comparison of Periodicals and Standard Mail flats costs to help provide further understanding of the issues and cost characteristics of Periodicals mail.
This work lays the basis for understanding and addressing some of the challenges associated with Periodicals mail.
Cost Revenue Analysis Methodology
Since 1969, the Postal Service has prepared a Cost and Revenue Analysis (CRA)66 for each fiscal year. The CRA was created to assist the Postal Service in meeting the statutory ratemaking factors under Title 39 of the U.S. Code, including “the requirement that each class of mail or type of mail
66. The report was initially known as the Revenue Cost Analysis.
September 2011 57
Chapter 5 Costs, Trends, and Data Quality
service bear the direct and indirect costs attributable to that class or type….”67 A methodology for attributing costs reflecting the input of many parties with disparate concerns has evolved during proceedings before the Commission.68
Before getting into the specifics of this methodology for determining attributable costs for classes and services, an understanding of two elements of this method is important.
The first important element is that, given the nature of the network required to provide postal services, not all costs are attributable to specific products. For example, many of the activities of carriers delivering mail to homes and businesses (e.g., time spent driving between houses on a route) are not affected by the volume of mail being delivered. Statistical studies have shown there is a 37 percent variability of city carrier street hours with respect to mail volumes.69 Thus, a ten percent mail volume increase (decrease) would cause a 3.7 percent increase (decrease) in carrier street time workhours. Consequently only a portion of total costs, the portion that is variable with respect to volume, is properly attributed to products on a causal basis. The remaining costs are termed institutional.70
Secondly, the large size of the Postal Service and its many varied products71 require that specialized data-sampling systems be employed to develop the information needed to determine attributable costs. Because system-wide tracking of the resources required for each of the numerous postal products is not practical, the Postal Service maintains and relies upon large and highly specialized data sampling systems for cost measurement purposes. These large sampling systems provide information such as labor time by product, carrier delivered volumes by product, and transportation utilization by product.
Figure 23 illustrates the process by which attributable costs by product are developed.
67. 39 U.S.C. § 3622(c)(2). Under the PAEA this is one of 14 factors that the Commission shall take into account in establishing a modern system for regulating rates and classes for market-dominant products. Under the Postal Reorganization Act, this requirement [formerly 39 U.S.C. § 3622(b)(3)] was one of nine factors that should underlie the Commission’s recommended decision on a request for changes in rates or fees.
68. This methodology stemmed from omnibus rate cases and other cases before the Commission as per the Postal Reorganization Act of 1970. See PRC Op., R2006-1 as the most recent and final omnibus litigation.
69. See Testimony of Dr. Michael Bradley, USPS-T-14, in Docket No. R2005-1. 70. See Toward Postal Excellence: The Report of the President’s Commission on Postal Organization (June 1968) (“Kappel
Commission Report”) and National Assoc. of Greeting Card Publishers v US Postal Service, 462 US 810 (1983).71. Over 30 different products are included in the FY 2010 CRA. These items in these products range from one-ounce letters to
50-lb parcels, traveling across town or across the country, receiving expedited or non-expedited service, and receiving carrier or other forms of delivery (e.g., to a Post Office box).
58 Periodicals Mail Study
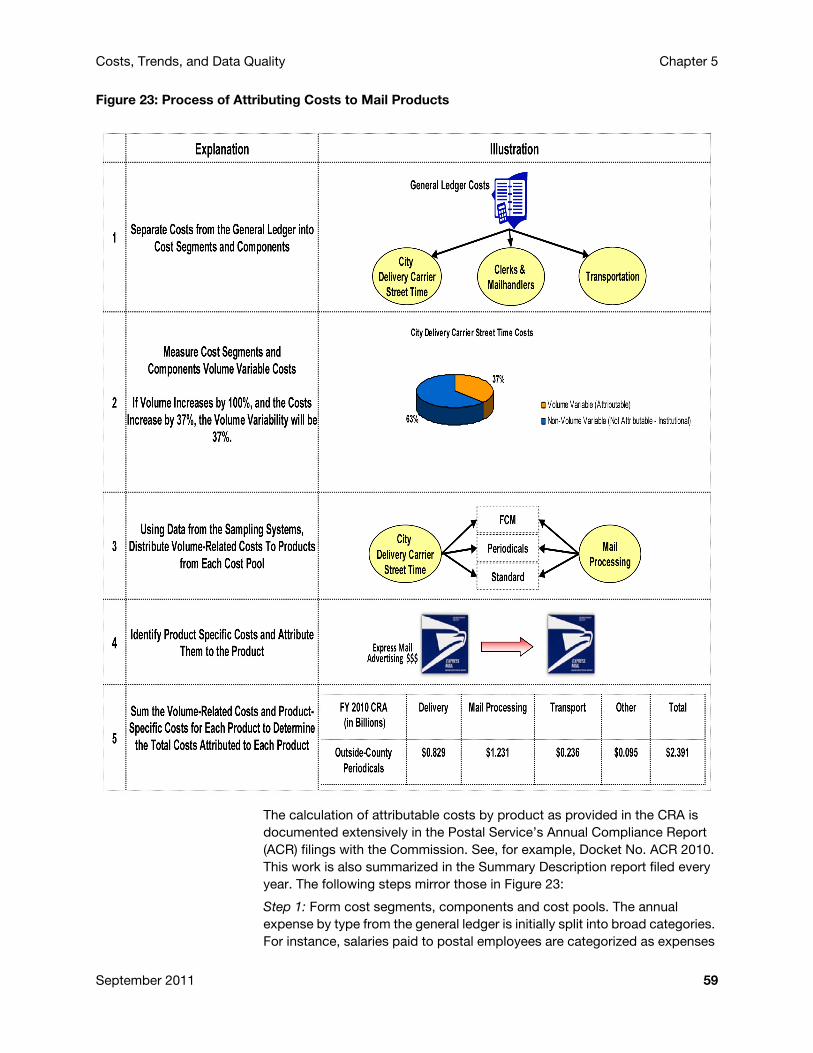
Costs, Trends, and Data Quality Chapter 5
Figure 23: Process of Attributing Costs to Mail Products
The calculation of attributable costs by product as provided in the CRA is documented extensively in the Postal Service’s Annual Compliance Report (ACR) filings with the Commission. See, for example, Docket No. ACR 2010. This work is also summarized in the Summary Description report filed every year. The following steps mirror those in Figure 23:
Step 1: Form cost segments, components and cost pools. The annual expense by type from the general ledger is initially split into broad categories. For instance, salaries paid to postal employees are categorized as expenses
September 2011 59
Chapter 5 Costs, Trends, and Data Quality
for city carrier labor, rural delivery labor, and clerk and mail handler or by so-called Cost Segments. These costs are further divided into detailed components or cost pools. For instance, clerk and mail handler mail processing labor costs are split into expenditures for 60 different operation types (e.g., sortation on particular pieces of postal equipment, manual letter sorting) by the use of operational data and the labor time-sampling systems described below. This detailed breakdown enables the succeeding steps in cost development.
Step 2: Determine volume-variable costs for each cost pool. The volume variability of cost for each cost pool is determined by using econometric studies, by relying on relevant contract terms (or terms of incurrence), or by using the best available information. In total, for all cost components for FY 2010, of the $75.6 billion accrued costs, about 55 percent ($41.6 billion) were volume variable (and therefore assigned to the products in the next step) and 45 percent ($34.0 billion) were institutional costs.72
Step 3: Distribute volume-variable costs for each component to products. The distribution step relies heavily on the Postal Service’s large national sampling systems to reflect the responsibility by product for the volume-variable costs in each activity. For instance, the In-Office Cost System (IOCS)73 is used to distribute the labor costs by major mail processing activity.74 Again, the institutional costs are not attributed to products.
Step 4. Assign product-specific costs. Attributable costs for each product are the sum of volume-variable costs and product-specific costs, such as advertising, which are product-related (and therefore have to be attributed to that product), but do not vary with volume.
Step 5. Sum the volume-variable plus product-specific costs by product.
72. For instance, econometric studies are employed to determine the variabilities of city carrier street costs and highway contract transportation costs. These variabilities are 37 percent and 79 percent respectively. The calculation of volume-variable costs for city carrier street costs for FY 2010 can be summarized as follows: The accrued labor cost of city carrier street work was $11.390 billion, so that volume-variable costs equal $4.227 billion (37 percent of $11.390 billion). Likewise, the calculation of volume-variable costs for highway transportation can be summarized as: $3.191 billion times 79 percent = $2.518 billion. The remaining city carrier street labor costs and highway transportation costs are non-volume variable (or institutional). The institutional costs are $7.164 billion and $0.673 billion for city carrier street and highway transportation costs, respectively.
73. The IOCS is a work time sampling system used to estimate the amount of labor time by class and product for clerk, mailhandler, supervisor, and city carrier in-office work. About 584,000 tests (observations of individual employees at designated points in time) were performed in FY 2010. The more often a product is the subject of one of these observations (or “tallies”), the greater the proportion of cost that is attributed to that product.
74. The largest of the processing activities or cost pools is for sorting of letter mail on equipment called Delivery Barcode Sorters (DBCS). The volume-variable cost for DBCS operations (in FY 2010) is $1.83 billion. IOCS provides the share of labor time for DBCS staff by product. The share of DBCS labor time is 33 percent for First-Class Mail single-piece letters, 30 percent for First-Class Mail presort letters, 31 percent for Standard Mail Letters, and small percentages for other products. Obtaining the DBCS volume-variable costs for First-Class Mail single piece letters is as follows: $1.83 billion times 33 percent = $611 million.
60 Periodicals Mail Study
Costs, Trends, and Data Quality Chapter 5
Data Quality Study and Methodology Changes
The mandate in Section 708 to evaluate the quality of data used to attribute costs echoes the 1997 Congressional request75 to review the quality of data used in ratemaking under the regulatory system established under the Postal Reorganization Act (PRA). That request led to a 1999 Data Quality Study prepared for the Postal Service, the Government Accountability Office, and the Commission by A.T. Kearney (Data Quality Study or Study).
The Commission and the Postal Service agreed that reviewing Postal Service responses to recommendations made to improve cost data would be the best way to respond to the mandate in Section 708.
The Data Quality Study focused on sampling error and included reviews of IOCS; Revenue, Pieces, and Weight System (RPW); the Carrier Cost systems (CCS); and the Transportation Cost System (TRACS), because these systems play a critical role in the ratemaking process. The Study concluded that Postal Service data are sufficiently complete and accurate for ratemaking. At the same time, the study identified 47 recommendations that could improve data quality if implemented. In response, the Postal Service took several important actions to improve data quality.
The Postal Service redesigned the IOCS sampling instrument to more accurately record the subclass/product and mail type being sampled. This was done by collecting pertinent mailpiece information necessary for product identification (instead of relying on subjective judgments by data collectors), streamlining data collector training, standardizing telephone reading scripts and giving data collectors better tools. As discussed below, one of these new tools enabled more accurate identification of Periodicals mail and the labor time associated with it. The redesigned IOCS also more accurately recorded the subclass/product in containers with mixed mail. This was done by directing data collectors to the appropriate mail identification question for the type of container or item being handled, via the questionnaire software.76 In addition, subclass/product information was obtained in cases where the clerk is not handling mail at the time of the reading but the work activity can be associated with specific product(s), such as monitoring the operation of automated sorting equipment. In such cases, a mailpiece is taken from the source of supply for processing equipment and tallied as would a handled piece.
75. See page 1 of Data Quality Study, Summary Report, April 16, 1999, by A.T. Kearney Inc., (Contract No. 102590-97-B-1972).76. The software was designed such that the data collectors could be prompted to look for particular defining characteristics that
would allow for more accurate recording.
September 2011 61
Chapter 5 Costs, Trends, and Data Quality
The IOCS redesign resulted in a significant increase in direct mail processing tallies and a significant decrease in “mixed” mail tallies and “not-handling” tallies, an indication that the IOCS redesign improved the accuracy of IOCS data.77 Of course, improvements can still be made in some areas. For example, due to cost considerations, some of the IOCS data are collected over the telephone. The Office of Inspector General (OIG), United States Postal Service reported in an audit that a significant fraction of telephone readings in certain districts were inaccurate.78 While most of the recording errors did not affect the attribution of costs, the OIG recommended strengthening controls over data collection and taking steps to raise the awareness of field personnel of the importance of supporting IOCS data collection efforts. The Postal Service has taken the actions recommended by the OIG.
The merging of Origin Destination Information System (ODIS) with the Revenue, Pieces, and Weight (RPW) system resulted in an increased sample size that improved precision of mail volume estimates. Other changes to the RPW system, such as computerized analysis of detailed mailpiece characteristics that are observed and recorded by the data collectors, improved the accuracy of RPW data.
The Postal Service developed the City Carrier Street Time Study to replace 1980s carrier data. This allowed an updated and unified estimate of the variability of the city carrier delivery function. The Postal Service also improved the TRACS sample allocation, increasing its sample size by 65 percent to increase precision and improving documentation to enhance its transparency.
The Postal Service adopted a Commission recommendation to distribute mixed mail tallies of allied mail processing costs more broadly to minimize the risk of over-attributing these costs to Periodicals and Presorted mail. All of these changes led to more accurate costing. Changes from previous cost estimates does not necessarily imply that “costs went up”, certainly the measurements increased, but that is in part a function of improved costing methodology.
Testing Data Quality and Ongoing Work
After reviewing the Postal Service responses to the recommendations of the Data Quality Study, the Postal Service and Commission performed independent tests of data quality.
One method of testing data quality is to estimate the coefficients of variation (CV) of Periodicals products. Using these CVs, the Postal Service tested the cost coverage for Periodicals in FY 2009 to determine if it was significantly below 100 percent. The test revealed that cost coverage was significantly
77. The Postal Service did not design IOCS as a mechanism to count or estimate volume. IOCS should not be used to estimate the number of pieces in an operation. For example, just because 40 percent of tallies are manual does not mean that 40 percent of the volume is in manual processing.
78. OIG Report CRR-AR-08-004, Audit Report In-Office Cost System Telephone Readings. The most frequent deficiencies included errors in recording employee pay status, respondent name, city delivery carrier street/office designation, MODS operation codes, and sampling method. Most of these errors did not affect the attribution of costs.
62 Periodicals Mail Study
Costs, Trends, and Data Quality Chapter 5
less than 100 percent for both Within County and Outside County Periodicals. The test also found that the CVs of cost coverage and the unit volume-variable costs of these products were small, indicating that the FY 2009 Periodicals cost coverage is accurate within approximately ±2 percent (at a 95 percent confidence level). This means that the data underlying Periodicals cost attribution are reasonably accurate. A description of the methodology used to estimate the precision of each product’s unit volume-variable cost (uvvc) is provided in Appendix I.
Under procedures established by the Commission after PAEA, the Postal Service has filed with the Commission many proposals designed to further improve costing methodologies. In addition, on November 18, 2010, the Commission established Docket No. RM2011-3, a strategic rulemaking docket that is to “develop an inventory of longer-term data collection and analysis needs, comprehensively evaluate these needs, and devise a plan for meeting these needs, with input from mailers, the interested public, the Postal Service and Commission staff.” [Order No. 589 at 2.] Order No. 589 contains a list of possible candidate areas for improvements in data collection and analysis, including concerns raised previously by mailers.
The second item on this list is particularly relevant to this report: a proposed study of mail processing costs, sought by mailers, including Periodicals mailers. In part, this proposed study might examine the following:
Mail processing is the largest source of volume-variable costs in the postal system. Despite its prominence, its volume variability has never been successfully modeled. The Commission currently uses a general assumption that mail processing costs vary in proportion to volume with the exception of a few minor operations. Mail processing might not vary in proportion to volume in certain processing environments.79
Docket No. RM2011-3 is likely to lead to studies and efforts to improve cost methodology.
Data for Within County Periodicals
There were also data quality, efficiency, and service concerns associated with Within County mail in omnibus rate cases prior to PAEA. The data quality issues stemmed mainly from this product’s extremely low volume and the extensive use of proxies to develop costs and prices. Low volume presented difficulties with tracking costs and volumes. Reliance on proxies created concern about how closely the related estimates match reality. See PRC Op., R97-1 at paras. 5854–55.
The Postal Service’s data systems improved over time, but there were lingering concerns in some rate cases about unexpected fluctuations in reported Within County volume. In these instances, the Commission found it appropriate to employ an averaging technique. See, for example, PRC Op., R97-1 at paras. 5852–53 (also citing concerns about Within County volume in Docket No. R94-1) and PRC Op., R2000-1 at para. 5729. This shielded
79. Order No. 589, Attachment, page 1.
September 2011 63

Chapter 5 Costs, Trends, and Data Quality
Within County mailers, to some extent, from swings in volume estimates, which in turn helped shield swings in the unit cost estimates.
Analysis of FY 2010 Outside County Periodicals Costs
This section looks at the Outside County Periodicals FY 2010 attributable costs to better understand how these costs are calculated and how the costs relate to the characteristics of this mail. It also considers the trends in these costs over the past decade. The Outside County Periodicals product accounts for 90 percent of Periodicals volume, 96 percent of Periodicals revenue, and 96 percent of Periodicals attributable cost (within County Periodicals comprises of the remainder of Periodicals). Also, Outside County’s characteristics make it the most amenable to analysis and comparison with other classes of mail.
FY 2010 Outside County Periodicals Attributable Costs
The FY 2010 CRA identified $2.39 billion in attributable costs for approximately 6.57 billion pieces of Outside County Periodicals, or an average of 36.4 cents cost per piece.
Figure 24 shows the share of the 36.4 cents by four broad functions: processing, delivery, transportation, and other.
The slight majority of the costs, 51.5 percent, are in mail processing. Mail processing costs account for $1.23 billion or 18.7 cents per piece.80 Delivery costs account for 34.7 percent of the Periodicals costs, which were $0.83 billion or 12.6 cents per piece.81 The average transportation cost per Outside County Periodicals piece in FY 2010 was 3.6 cents82 or 9.9 percent of the total Outside Periodicals costs by function. Finally, there were “other costs” per piece of 1.4 cents (or 4 percent) which include various remaining costs.83
80. On a per piece basis, this cost can be further disaggregated into 11.46 cents for clerk and mail handler direct labor costs and 7.27 cents in indirect costs associated with processing. Indirect costs include costs that are not for direct labor but nevertheless are necessary for the provision of that labor, such as supervision, facilities and equipment-related costs, and additional benefits.
81. These costs include city and rural carrier labor costs and delivery indirect costs for supervision, facility, and vehicles. 82. Transportation is Purchased Transportation or cost segment 14. See Docket No. ACR2010, USPS-FY10-2.83. “Other” includes vehicle service driver, postmasters, window, training for clerks and supervisors, data collection, and the
associated indirect costs (e.g. supervision, administrative, equipment & facility-related, and service-wide Benefits). It is simply Total Attributable costs (See Docket No. ACR2010, USPS-FY10-2) minus the processing, delivery, and transportation costs.
64 Periodicals Mail Study

Costs, Trends, and Data Quality Chapter 5
Figure 24: FY 2010 Distribution of Outside County Periodicals Unit Costs by Function
Source: USPS-FY10-24 Non-Operation Specific Piggyback Factors, USPS-FY10-26 - Mail Processing Costs by Shape, USPS-FY10-2 - Public Cost Segments and Components Report.
These unit costs reflect the average Periodicals Outside County cost per piece. Pieces that are more finely presorted and drop-shipped (entered further downstream into the postal system, bypassing some facilities and operations) will have lower than average unit processing and transportation costs. Pieces that are less finely presorted and/or travel further on Postal Service transportation before arriving at the ultimate destination facility will have higher than average unit costs. For example, the average unit cost of 3.6 cents for transportation does not represent a cost of 3.6 cents for each piece transported by the Postal Service, but rather represents the total transportation costs divided by the total number of Periodicals pieces, which includes both pieces transported by the Postal Service as well as pieces that bypassed postal transportation altogether. Therefore, even though the average transportation cost per piece is 3.6 cents, some pieces incur no transportation (and no cost), and others receive greater transportation and higher-than-average cost.
Mail ProcessingTable 4 provides additional detail on the 18.7 cents mail processing cost for an average piece of Outside County Periodicals. As with transportation, the cost per piece is an average cost and does not reflect the cost of each piece that is processed in each operation. However, the available data provide some useful general information.
September 2011 65

Chapter 5 Costs, Trends, and Data Quality
Table 4: Outside County Periodicals Mail Processing Costs by Facility/Operation Type — FY 2010 (cents per piece)
Source: See Docket No. ACR2010, USPS-FY10-26, SHP10PRC.XLS, Total (4) sheet for total processing cost.
The table lists seven main categories of mail processing costs, breaking each into direct costs and indirect costs. Underlying the indirect costs is a finer breakout; for instance, for “Plant/Mechanized Piece Sorting (AFSM 100, Other),” about 0.9 cents of the 1.65 cents of “Indirect Costs” are for the equipment-related costs (e.g., depreciation, maintenance, parts, and supplies) for AFSM 100 and FSM 1000.84 The column “Total Processing Costs” is simply the sum of the previous two columns.
The first row shows costs for piece distribution at the plant, with “Plant/Mechanized Piece Sorting” primarily including sortation on the AFSM 100, FSM 1000, and allied operations for preparing flats for piece distribution. The second row is for “Plant/Manual piece sorting,” and is manual sorting of individual flats. But since there are some non-flats in Periodicals Outside County, this category includes some letter and parcel manual piece sorting operations. The third row, for bundle sorting, includes sorting bundles of mail on the SPBS/APPS machines at plants and NDCs, but also includes costs incurred at opening units and pouching operations at the plant. The fourth row for “Other Allied” at plants and NDCs is primarily the costs incurred in platform, sack sorting, and dispatch operations but also includes other allied and LDC1885 activities as well. “Plant/ CFS, BMEU” is primarily Centralized Forwarding System (CFS), but also includes BMEU costs.86 The sixth
FACILITY TYPE/ OPERATION TYPE
Clerk and Mail Handler
Cost +Indirect Costs* =
Total Processing
Costs
% of Total Mail
Processing Cost
1PLANT/ MECHANIZED PIECE SORTING (AFSM 100, OTHER)
1.83 1.65 3.49 19%
2PLANT/MANUAL PIECE SORTING
0.93 0.28 1.21 6%
3PLANT, NDC/ BUNDLE SORTING: (SPBS/APPS, OTHER MANUAL)
1.66 .96 2.62 14%
4PLANT, NDC/ OTHER ALLIED
2.81 1.57 4.38 23%
5 PLANT/CFS, BMEU 0.84 1.09 1.94 10%
6POST OFFICE, STATION AND BRANCH/MANUAL PIECE SORTING
1.56 0.63 2.19 12%
7POST OFFICE, STATION AND BRANCH/ALL OTH PROCESSING
1.82 1.08 2.90 16%
TOTAL 11.46 7.27 18.73 100%
84. It is these large amounts of equipment-related costs that accounts for the relatively high indirect costs for this category (as compared to its direct clerk and mail handler costs), in comparison to the other five categories.
85. LDC 18 covers (at least as pertinent to Periodicals) operations for empty equipment operations, office work, and miscellaneous.86. This is to handle forwards, return to sender associated with moves, and also incorrect addresses. About two percent of
Periodicals pieces require this.
66 Periodicals Mail Study
Costs, Trends, and Data Quality Chapter 5
category “Post Office, Stations and Branches/Manual Piece Sorting” covers manual piece sorting at these locations. The last category “Post Office, Stations and Branches/All Other Processing” covers other processing at these locations, such as bundle sorting, container moving and putting mail into Post Office boxes.87
Table 4 therefore provides data summarizing Outside County Periodicals “average” unit processing costs and allows for the following observations:
1. Bundle sorting and allied activities, such as moving containers and sack sorting, are the biggest share of costs, totaling about 9.9 cents of the 18.7 cent unit costs. This sum is obtained by adding the third, fourth and seventh rows.88 It seems reasonable that bundle sorting and allied operations, such as platform and sack sorting, would be a large share of the costs, since a significant share of Periodicals consists of carrier route and 5-digit bundles that are containerized in 3-digit and Area Distribution Center (ADC) pallets/sacks. So, even though the pieces in the carrier route and 5-digit bundles will require less individual sorting as pieces, the bundles still need to be sorted. In addition, while about 63 percent of Outside County Periodicals is drop-shipped to the destination SCF, the remainder requires handling to get it to the destination SCF.
2. A second major (but smaller) contributor to the unit mail processing cost is piece distribution. About 6.9 cents of the 18.7 cents for the typical Outside County Periodicals piece is for piece distribution. This is obtained by adding the first two rows and the sixth row. Of the costs, 4.7 cents are for piece distribution at the plant, and the sixth row of the 2.2 cents is incurred at Post Offices. Of this roughly 6.9 cents for piece distribution, 3.5 cents is for mechanized sortation, and the remainder is for manual sortation.
It is the cost for piece distribution that causes concern, since more than half of this mail is carrier route presort (and ostensibly bypasses piece sorting), and much of the remaining mail is 5-digit presort (which requires only one sortation to get the mail to the appropriate letter carrier). The high portion of the costs related to manual sorting has also raised concerns. This is discussed below in the comparison of Periodicals and Standard Mail flats costs.
Delivery CostsTable 5 provides information on the calculation of the 12.6 cents per piece FY 2010 Outside County Periodicals Delivery cost. Carrier labor costs are developed separately for city carriers and rural carriers. First, steps 1 and 2, as described in Section B, provide the Postal Service’s total volume-variable labor costs of city carrier in-office, city carrier street, and rural carriers of $3.7
87. The split of Post Office, Stations, and Branches processing costs into rows 6 and 7 required splitting cost pool costs. IOCS data provide information on activities to allow a rough parsing of the cost pools such as LDC 43 and Non-MODS Manual Flat Sorting. IOCS identified activities such as handling bundles and sorting mail into Post Office boxes. With regard to bundle handling, some portion of such handlings could be part of piece distribution, while much of it would be bundle sorting, especially since Periodicals Outside County is 56 percent Carrier Route Presort. Examination of Standard Mail tallies for these operations for which carrirer route and non-carrier route can be identified confirms this interpretation of the data. As a result all bundle handling costs were included in the “All Other Processing” category.
88. The seventh row contains costs like sorting mail to Post Office boxes and other non-allied activities as well, so isolating bundle sorting and allied work would require further cost pool parsing.
September 2011 67

Chapter 5 Costs, Trends, and Data Quality
billion, $4.2 billion, and $2.3 billion respectively.89 Each of these costs is then spread to the products: of the $3.7 billion volume-variable cost for city carrier in-office labor, $355 million is determined to be for Outside County Periodicals based on information from IOCS regarding in-office labor time for city carriers: the portion of the $4.2 billion volume-variable cost for city carrier street labor that is assigned to Outside County Periodicals is $125 million, based on data from carrier data systems indicating the volume of delivered Outside County Periodicals that are delivered by city carriers. The sum of these City Carrier labor costs for Outside County Periodicals therefore total $480 million, or 7.3 cent per piece; likewise, the portion of rural carrier volume-variable labor costs (of $2.3 billion) that is determined to be for Outside County Periodicals is $157 million, based on carrier data systems volumes by class/product delivered by rural carriers. This is 2.4 cents per piece. (Again, $157 million is divided by total Outside County volume, not just rural-delivered volume.)
Indirect costs associated with city carrier and rural carrier delivery of Outside County Periodicals total $152 million and $40 million respectively, or 2.3 cents and 0.6 cents per piece, as shown in Table 5. Indirect costs include supervision, administrative clerks, facility-related costs for carrier space, their cases, and work area (including rent, depreciation, utilities, custodial labor, and building maintenance labor), carrier vehicle-related costs (including maintenance, fuel, and depreciation), service wide benefits for carriers, and the above indirect labor costs.
As with mail processing costs, these costs are reported on an average per piece basis. Thus, the 9.6 cent City Carrier cost is not necessarily the cost that each piece delivered by a city carrier incurs. Rather, it represents the total city carrier costs divided by the total Outside Country mail volume, even though not all volume will be delivered by a city carrier. In other words, Table 5 does compare the cost of city delivery to rural delivery. One should not interpret the figures as saying that it costs 9.6 cents to deliver a city piece and only 3.0 cents to deliver a rural piece.
Table 5: Outside County Periodicals Delivery Costs FY 2010 (cents per piece)
Source: See Docket No. ACR2010, USPS-FY10-24.
89. Part B discusses obtaining volume-variable city carrier street costs based on statistical studies and also the determination of variable rural carrier costs based on the rural carrier pay formula. In the case of city carrier in-office, the FY 2010 accrued costs were $4.2 billion. The non-volume variable portion of this, $0.5 billion, is determined based on IOCS data on the portion of time associated with city carrier activities considered non-volume variable, leaving $3.7 billion as volume variable.
Carrier Labor
Indirect Costs Total % of Total
City Carrier 7.30 2.32 9.61 76%
Rural Carrier 2.38 0.62 3.00 24%
Total 9.68 2.93 12.61 100%
68 Periodicals Mail Study
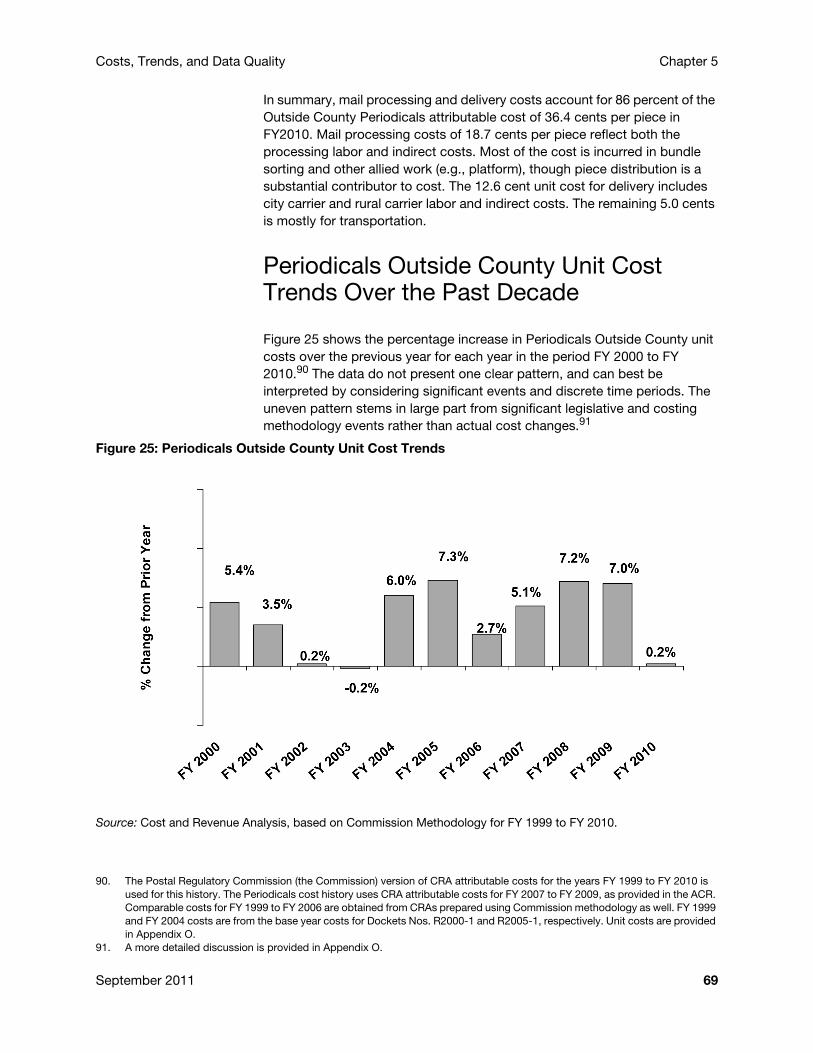
Costs, Trends, and Data Quality Chapter 5
In summary, mail processing and delivery costs account for 86 percent of the Outside County Periodicals attributable cost of 36.4 cents per piece in FY2010. Mail processing costs of 18.7 cents per piece reflect both the processing labor and indirect costs. Most of the cost is incurred in bundle sorting and other allied work (e.g., platform), though piece distribution is a substantial contributor to cost. The 12.6 cent unit cost for delivery includes city carrier and rural carrier labor and indirect costs. The remaining 5.0 cents is mostly for transportation.
Periodicals Outside County Unit Cost Trends Over the Past Decade
Figure 25 shows the percentage increase in Periodicals Outside County unit costs over the previous year for each year in the period FY 2000 to FY 2010.90 The data do not present one clear pattern, and can best be interpreted by considering significant events and discrete time periods. The uneven pattern stems in large part from significant legislative and costing methodology events rather than actual cost changes.91
Figure 25: Periodicals Outside County Unit Cost Trends
Source: Cost and Revenue Analysis, based on Commission Methodology for FY 1999 to FY 2010.
90. The Postal Regulatory Commission (the Commission) version of CRA attributable costs for the years FY 1999 to FY 2010 is used for this history. The Periodicals cost history uses CRA attributable costs for FY 2007 to FY 2009, as provided in the ACR. Comparable costs for FY 1999 to FY 2006 are obtained from CRAs prepared using Commission methodology as well. FY 1999 and FY 2004 costs are from the base year costs for Dockets Nos. R2000-1 and R2005-1, respectively. Unit costs are provided in Appendix O.
91. A more detailed discussion is provided in Appendix O.
September 2011 69
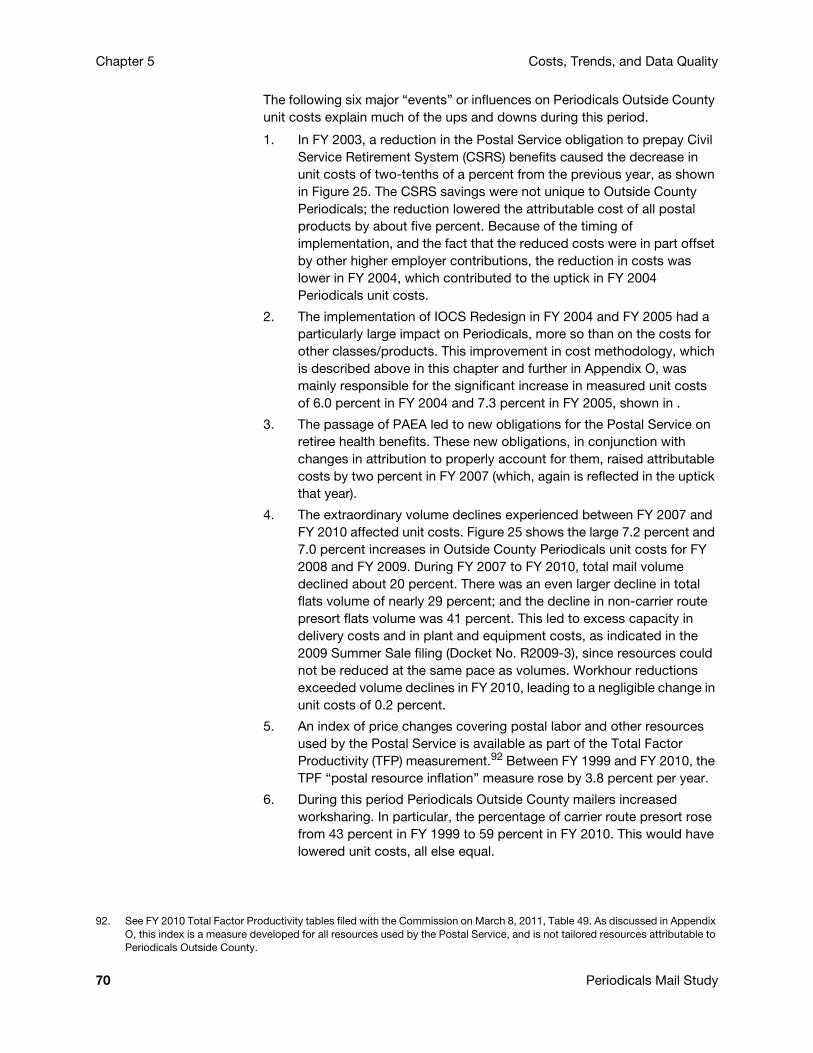
Chapter 5 Costs, Trends, and Data Quality
The following six major “events” or influences on Periodicals Outside County unit costs explain much of the ups and downs during this period.
1. In FY 2003, a reduction in the Postal Service obligation to prepay Civil Service Retirement System (CSRS) benefits caused the decrease in unit costs of two-tenths of a percent from the previous year, as shown in Figure 25. The CSRS savings were not unique to Outside County Periodicals; the reduction lowered the attributable cost of all postal products by about five percent. Because of the timing of implementation, and the fact that the reduced costs were in part offset by other higher employer contributions, the reduction in costs was lower in FY 2004, which contributed to the uptick in FY 2004 Periodicals unit costs.
2. The implementation of IOCS Redesign in FY 2004 and FY 2005 had a particularly large impact on Periodicals, more so than on the costs for other classes/products. This improvement in cost methodology, which is described above in this chapter and further in Appendix O, was mainly responsible for the significant increase in measured unit costs of 6.0 percent in FY 2004 and 7.3 percent in FY 2005, shown in .
3. The passage of PAEA led to new obligations for the Postal Service on retiree health benefits. These new obligations, in conjunction with changes in attribution to properly account for them, raised attributable costs by two percent in FY 2007 (which, again is reflected in the uptick that year).
4. The extraordinary volume declines experienced between FY 2007 and FY 2010 affected unit costs. Figure 25 shows the large 7.2 percent and 7.0 percent increases in Outside County Periodicals unit costs for FY 2008 and FY 2009. During FY 2007 to FY 2010, total mail volume declined about 20 percent. There was an even larger decline in total flats volume of nearly 29 percent; and the decline in non-carrier route presort flats volume was 41 percent. This led to excess capacity in delivery costs and in plant and equipment costs, as indicated in the 2009 Summer Sale filing (Docket No. R2009-3), since resources could not be reduced at the same pace as volumes. Workhour reductions exceeded volume declines in FY 2010, leading to a negligible change in unit costs of 0.2 percent.
5. An index of price changes covering postal labor and other resources used by the Postal Service is available as part of the Total Factor Productivity (TFP) measurement.92 Between FY 1999 and FY 2010, the TPF “postal resource inflation” measure rose by 3.8 percent per year.
6. During this period Periodicals Outside County mailers increased worksharing. In particular, the percentage of carrier route presort rose from 43 percent in FY 1999 to 59 percent in FY 2010. This would have lowered unit costs, all else equal.
92. See FY 2010 Total Factor Productivity tables filed with the Commission on March 8, 2011, Table 49. As discussed in Appendix O, this index is a measure developed for all resources used by the Postal Service, and is not tailored resources attributable to Periodicals Outside County.
70 Periodicals Mail Study

Costs, Trends, and Data Quality Chapter 5
The contribution of these events/factors to the 3.9 percent average annual growth in Periodicals Outside County unit costs is discussed in detail in Appendix O. In summary, a major factor driving this rise was the increase in postal labor costs (i.e., wages, benefits) and other resource costs. However, all postal products had to contend with this as well. The TFP work shows that the average rise in postal product costs for this period was 2.6 percent a year.93 So, what accounts for the faster rate of growth in Periodicals Outside County unit costs, despite the growth in Periodicals mail worksharing? IOCS Redesign is an important factor. It is likely that from FY 1999 to FY 2003 Periodicals Outside County unit costs, which were based on the pre-redesign methodology, were understated by approximately 7 percent, as discussed in Appendix O. Another important reason, perhaps more significant than IOCS redesign, is the possibility that the productivity gains obtained by the Postal Service over this period (as determined in the TFP work) of 1 percent per year94 did not accrue to Periodicals Outside County much or at all.
Comparison of Periodicals Flats Cost Estimates to Standard Mail Flats Cost Estimates
One way to assess the cost behavior of Periodicals is to compare the estimated unit attributable costs of Outside County Periodicals flats to those of Standard Mail flats. The Postal Service believes that this comparison can shed light on whether the unit cost estimates of Periodicals are reasonable. The Commission believes that this comparison can be used to estimate potential opportunities to increase efficiency and save processing costs.
Periodicals Outside County are mostly flat shaped (99 percent). Fifty-nine percent is presorted to carrier route (mostly “Basic” level, which requires at least 6 pieces per carrier route). The combination of Standard Mail Carrier Route, which is 97 percent flat shaped and 100 percent basic carrier route, and Standard Mail Flats, which is 100 percent flat shaped and 100 percent non-carrier route presort, has a very similar profile to that of Periodicals Outside County – with 99 percent flat-shaped pieces and 57 percent of the flat-shaped pieces are carrier route presort (basic). They also have a similar drop-ship profile with 63 percent (by weight) of Periodicals drop-shipped to the destinating SCF versus 66 percent (by weight) for the combined Standard Mail categories. These similar profiles allow for comparison of these two categories in terms of costs by function and a detailed comparison of processing costs by activity.
93. See FY 2010 Total Factor Productivity tables filed with the Commission on March 8, 2011, Table 51.94. USPS FY 2010 Total Factor Productivity tables filed with the Commission on March 8, 2011, Table 52.
September 2011 71
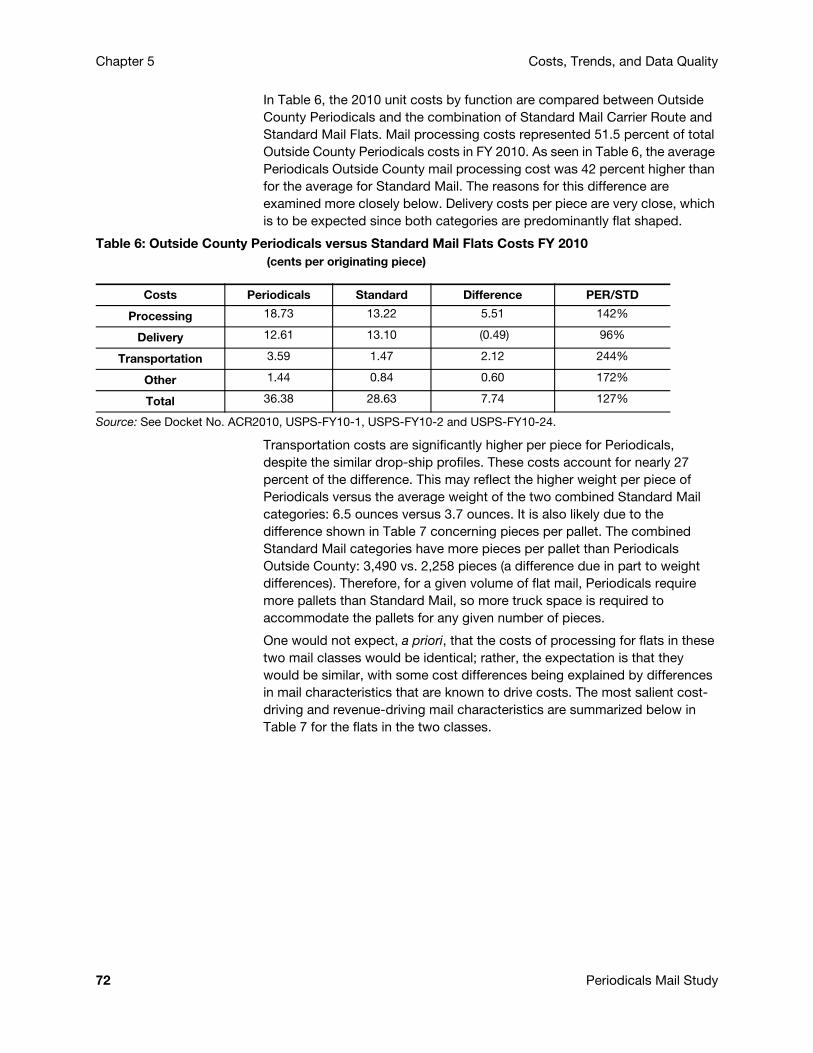
Chapter 5 Costs, Trends, and Data Quality
In Table 6, the 2010 unit costs by function are compared between Outside County Periodicals and the combination of Standard Mail Carrier Route and Standard Mail Flats. Mail processing costs represented 51.5 percent of total Outside County Periodicals costs in FY 2010. As seen in Table 6, the average Periodicals Outside County mail processing cost was 42 percent higher than for the average for Standard Mail. The reasons for this difference are examined more closely below. Delivery costs per piece are very close, which is to be expected since both categories are predominantly flat shaped.
Table 6: Outside County Periodicals versus Standard Mail Flats Costs FY 2010 (cents per originating piece)
Source: See Docket No. ACR2010, USPS-FY10-1, USPS-FY10-2 and USPS-FY10-24.
Transportation costs are significantly higher per piece for Periodicals, despite the similar drop-ship profiles. These costs account for nearly 27 percent of the difference. This may reflect the higher weight per piece of Periodicals versus the average weight of the two combined Standard Mail categories: 6.5 ounces versus 3.7 ounces. It is also likely due to the difference shown in Table 7 concerning pieces per pallet. The combined Standard Mail categories have more pieces per pallet than Periodicals Outside County: 3,490 vs. 2,258 pieces (a difference due in part to weight differences). Therefore, for a given volume of flat mail, Periodicals require more pallets than Standard Mail, so more truck space is required to accommodate the pallets for any given number of pieces.
One would not expect, a priori, that the costs of processing for flats in these two mail classes would be identical; rather, the expectation is that they would be similar, with some cost differences being explained by differences in mail characteristics that are known to drive costs. The most salient cost-driving and revenue-driving mail characteristics are summarized below in Table 7 for the flats in the two classes.
Costs Periodicals Standard Difference PER/STD
Processing 18.73 13.22 5.51 142%
Delivery 12.61 13.10 (0.49) 96%
Transportation 3.59 1.47 2.12 244%
Other 1.44 0.84 0.60 172%
Total 36.38 28.63 7.74 127%
72 Periodicals Mail Study
Costs, Trends, and Data Quality Chapter 5
Table 7: Cost-Driving Characteristics of Outside County Periodicals Flats and Standard Basic Carrier Route and Non-Carrier Route
Source: Docket No. ACR2010, USPS-FY10-14.
A key distinction between the two mail classes is the wide disparity in the number of pieces per sack, pallet, and bundle. Standard Mail has more than twice as many pieces per sack as Periodicals and 55 percent more per pallet. Further, Standard Mail has 74 percent more pieces per bundle.
The Postal Service believes these circumstances alone explain many of the mail processing cost differences described below.
The costs for mail processing activities that are performed on a per container or per bundle basis (unloading and loading containers from trucks, cross-docking containers, dumping containers, sorting bundles, opening bundles), even if identical for the Periodicals and Standard Mail flats containers and bundles, would be higher per piece of mail for Periodicals when divided among the individual mailpieces, simply by virtue of the smaller number of pieces per container and bundle over which to spread those costs.
These distinctions between the two categories help explain the higher cost per piece for bundle sorting and allied operations. The Commission believes the bulk of the difference in unit costs is the cost per piece for manual processing of both pieces and bundles.
Table 8, below, focuses only on flats processing costs, so these estimates differ a small amount from those provided in previous tables. Flats processing costs account for the bulk of the mail processing costs for both the Periodicals and Standard Mail categories, as both categories are predominantly flat shaped. Table 8 provides the same information for Periodicals Outside County as contained in Table 4 (see the column headed “Total Processing Costs”). The unit costs shown are slightly different, because Table 4 includes costs associated with non-flats, while Table 8 has the costs for flat-shaped pieces only. Table 8 breaks down mail processing costs in the same way as Table 4, showing that processing encompasses not only piece handlings, but also container and bundle handlings.
The summary of information based on bundle sorting and allied operations such as platform and sack handling comprise the largest element of Periodicals Outside County costs. So the analysis begins by looking at the third row of Table 8 below for bundle sorting costs at plants and NDCs. The average bundle handling cost for Periodicals is 50 percent higher per mailpiece (not per bundle) than it is for Standard Mail at plants and NDCs. This is consistent with the higher pieces per bundle for Standard Mail. Next, Row 4 in Table 8 compares the average cost per piece for “Other Allied” handlings (aside from bundle sorting) at plants and NDCs, showing the average cost per Periodical is 42 percent higher than for Standard Mail. Much of this cost relates to platform operations, including pallet and sack
Periodicals Standard Mail
Pieces per sack 43 109
Pieces per pallet 2,258 3,490
Pieces per bundle 13.8 24.0
Percentage of pieces on pallets 83.6% 87.5%
September 2011 73
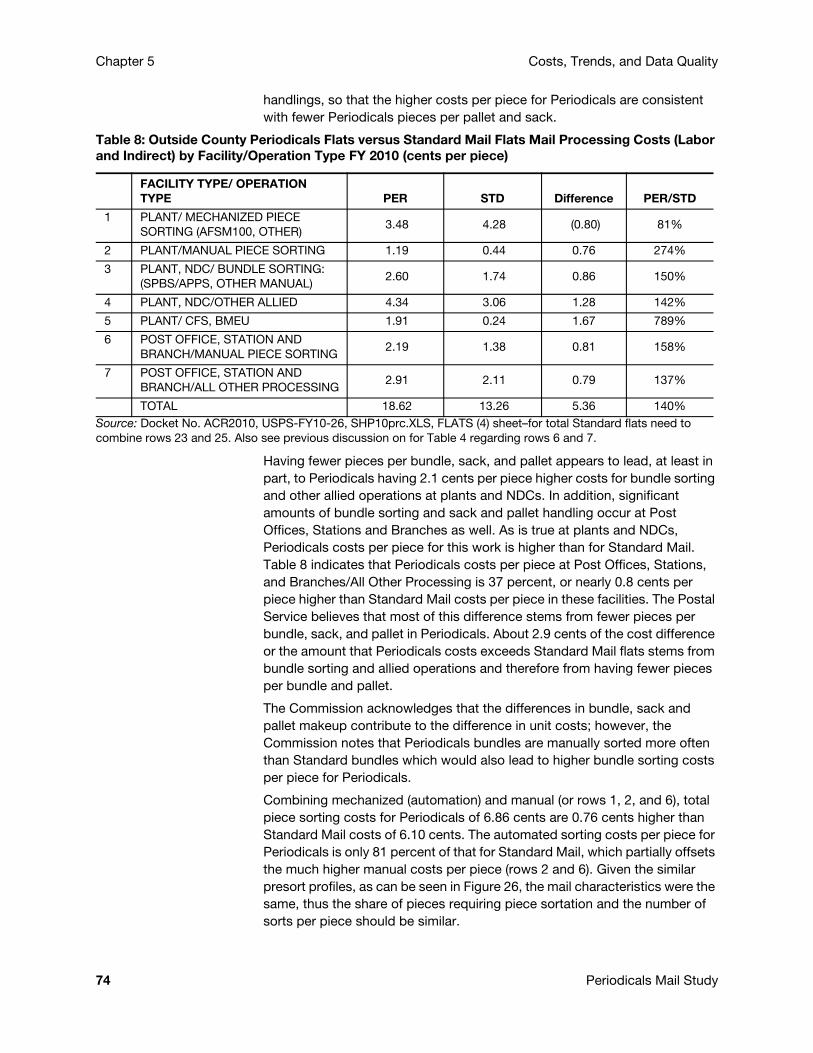
Chapter 5 Costs, Trends, and Data Quality
handlings, so that the higher costs per piece for Periodicals are consistent with fewer Periodicals pieces per pallet and sack.
Table 8: Outside County Periodicals Flats versus Standard Mail Flats Mail Processing Costs (Labor and Indirect) by Facility/Operation Type FY 2010 (cents per piece)
Source: Docket No. ACR2010, USPS-FY10-26, SHP10prc.XLS, FLATS (4) sheet–for total Standard flats need to combine rows 23 and 25. Also see previous discussion on for Table 4 regarding rows 6 and 7.
Having fewer pieces per bundle, sack, and pallet appears to lead, at least in part, to Periodicals having 2.1 cents per piece higher costs for bundle sorting and other allied operations at plants and NDCs. In addition, significant amounts of bundle sorting and sack and pallet handling occur at Post Offices, Stations and Branches as well. As is true at plants and NDCs, Periodicals costs per piece for this work is higher than for Standard Mail. Table 8 indicates that Periodicals costs per piece at Post Offices, Stations, and Branches/All Other Processing is 37 percent, or nearly 0.8 cents per piece higher than Standard Mail costs per piece in these facilities. The Postal Service believes that most of this difference stems from fewer pieces per bundle, sack, and pallet in Periodicals. About 2.9 cents of the cost difference or the amount that Periodicals costs exceeds Standard Mail flats stems from bundle sorting and allied operations and therefore from having fewer pieces per bundle and pallet.
The Commission acknowledges that the differences in bundle, sack and pallet makeup contribute to the difference in unit costs; however, the Commission notes that Periodicals bundles are manually sorted more often than Standard bundles which would also lead to higher bundle sorting costs per piece for Periodicals.
Combining mechanized (automation) and manual (or rows 1, 2, and 6), total piece sorting costs for Periodicals of 6.86 cents are 0.76 cents higher than Standard Mail costs of 6.10 cents. The automated sorting costs per piece for Periodicals is only 81 percent of that for Standard Mail, which partially offsets the much higher manual costs per piece (rows 2 and 6). Given the similar presort profiles, as can be seen in Figure 26, the mail characteristics were the same, thus the share of pieces requiring piece sortation and the number of sorts per piece should be similar.
FACILITY TYPE/ OPERATION TYPE PER STD Difference PER/STD
1 PLANT/ MECHANIZED PIECE SORTING (AFSM100, OTHER)
3.48 4.28 (0.80) 81%
2 PLANT/MANUAL PIECE SORTING 1.19 0.44 0.76 274%
3 PLANT, NDC/ BUNDLE SORTING: (SPBS/APPS, OTHER MANUAL)
2.60 1.74 0.86 150%
4 PLANT, NDC/OTHER ALLIED 4.34 3.06 1.28 142%
5 PLANT/ CFS, BMEU 1.91 0.24 1.67 789%
6 POST OFFICE, STATION AND BRANCH/MANUAL PIECE SORTING
2.19 1.38 0.81 158%
7 POST OFFICE, STATION AND BRANCH/ALL OTHER PROCESSING
2.91 2.11 0.79 137%
TOTAL 18.62 13.26 5.36 140%
74 Periodicals Mail Study
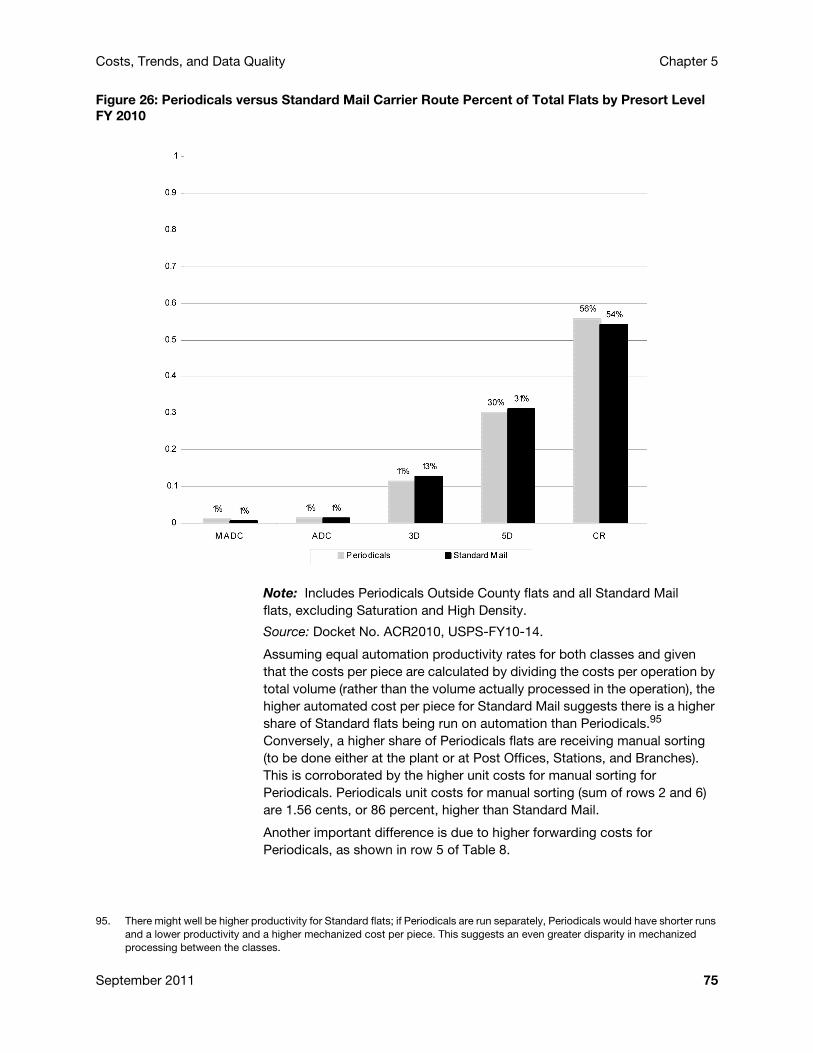
Costs, Trends, and Data Quality Chapter 5
Figure 26: Periodicals versus Standard Mail Carrier Route Percent of Total Flats by Presort Level FY 2010
Note: Includes Periodicals Outside County flats and all Standard Mail flats, excluding Saturation and High Density.
Source: Docket No. ACR2010, USPS-FY10-14.
Assuming equal automation productivity rates for both classes and given that the costs per piece are calculated by dividing the costs per operation by total volume (rather than the volume actually processed in the operation), the higher automated cost per piece for Standard Mail suggests there is a higher share of Standard flats being run on automation than Periodicals.95 Conversely, a higher share of Periodicals flats are receiving manual sorting (to be done either at the plant or at Post Offices, Stations, and Branches). This is corroborated by the higher unit costs for manual sorting for Periodicals. Periodicals unit costs for manual sorting (sum of rows 2 and 6) are 1.56 cents, or 86 percent, higher than Standard Mail.
Another important difference is due to higher forwarding costs for Periodicals, as shown in row 5 of Table 8.
95. There might well be higher productivity for Standard flats; if Periodicals are run separately, Periodicals would have shorter runs and a lower productivity and a higher mechanized cost per piece. This suggests an even greater disparity in mechanized processing between the classes.
September 2011 75
Chapter 5 Costs, Trends, and Data Quality
Manual Sortation Costs
To understand the possible reasons for higher manual sortation costs for Periodicals both at plants and at Post Offices, Stations, and Branches, in FY 2010, field visits were made in South Carolina, the DC metro area, Kansas City, and California by members of the joint task force. Following is a summary of the postal analysts’ staff observations on the causes for relatively more Periodicals versus Standard Mail piece-sorting at the Post Offices, Stations, and Branches. Factors that led to more manual distribution regardless of class, such as carrier route restructurings, are not included in this list. It is important to note that these observations reflect widespread and longstanding local policies on CETs and Hot-2C that the Postal Service has worked to change in its recently implemented policy on national CET times, which is described in detail in Chapter 3.
Machinability Requirements The mail characteristics for flats are more diverse than those for cards/letters, and within “flats,” the mail characteristics for Periodicals appear to be more diverse than those for First-Class Mail or Standard Mail.
Consequently, that diversity causes relatively more Periodicals to be processed in manual operations at postal plants, or sent to downstream offices for finalization using manual processes. Some mailpieces that technically meet machinability requirements are culled during mail prep or feed operations and are processed manually (e.g., mailpieces made of newspaper-like material, thicker journals, etc.). Since these characteristics are more common in Periodicals, it may explain why Periodicals, especially newspapers, appear to be disproportionately processed in manual bundle and manual piece distribution operations. In fact, some plants have established manual bundle and manual piece distribution operations solely for newspaper processing.
In addition, many of these bundles are secured with either rubber bands or string—both of which have historically been linked to bundle breakage. Finally, these mailpieces are also typically entered in sacks, and sacked bundles have historically exhibited higher bundle breakage rates. Compared to Standard Mail flats, Periodicals are more likely to be entered in sacks.
Failure to Meet Critical Entry TimeIn the FY 2010 site visits, most mechanized bundle sorting operations had been observed to close down by 15:30, and late arriving bundles were generally sorted manually. In some instances, even 5-digit bundles were sorted manually to get the mail to the delivery unit, so that next-day delivery would be possible. The 5-digit bundles sorted manually to the delivery unit were then opened at the delivery unit, with the pieces distributed to carriers manually at that location.
Some manual operations at plants represent last-ditch efforts to sort the mail to the delivery unit level, which means that the containers into which the mail is being sorted hold a mixture of sacks, bundles, and individual mailpieces.
76 Periodicals Mail Study

Costs, Trends, and Data Quality Chapter 5
When these containers arrive at the delivery unit, employees typically cull through the mail first to separate it based on the next operation (e.g., bundle sorting or opening, and parcel sorting). In essence, this culling operation at the delivery unit amounts to an additional manual sort.96
Hot-2C Procedures Some plants maintain sort schemes in which 5-digit machinable bundles are intentionally sorted to containers that will be sent to the delivery unit for processing, to bypass additional processing steps at the plant, and increase the chance that the mailpieces will be delivered the next day. When bundles are sent unopened to the delivery unit, they must be opened and the pieces distributed manually.97
AFSM 100 Capacity The AFSM 100 is used to process mail to the 5-digit or carrier route levels. The incoming secondary processing window for flats on AFSM 100s covers much of Tour 1,98 because all the sort plans for different delivery units must be spread over a fairly small number of machines for a longer period of time (compared to letter processing). Consequently, some AFSM 100 incoming secondary sort plans are going to be processed earlier during Tour 1 than other sort plans. If mail for a given delivery unit arrives at the AFSM 100 from upstream operations or from the mailer after that delivery unit’s mail has already been processed in the incoming secondary operation, this mail is likely going to be dispatched to the delivery unit for manual processing; it is unlikely the sort plan will be loaded a second time to process a relatively small volume of mail. 99
Because of the limited availability of machine time and available bins, the Postal Service does not maintain AFSM 100 incoming secondary operations for all delivery units. For small volume delivery units, the small number of pieces may be sorted more efficiently manually than on a machine.
Once a mailpiece has entered manual processing, it is unlikely to move into an automated mailstream. With the growth of automation at the plants, there is now very little need for “scheme” knowledge at plants. Consequently, manual incoming secondary processing is typically performed at the delivery units only.
In addition to the above reasons for greater manual piece sortation, the following section provides another reason why more manual bundle sorting and other manual handling occurs for Periodicals.
96. These manual procedures, which had been implemented by local managers, now fall under the new CET policy, which is discussed in Chapter 3.
97. Ibid.98. One of three scheduled shifts: Tour 1 (usually from 11 p.m. to 7 a.m.) is the night shift (graveyard shift); Tour 2 is the daytime
shift (usually from 7 a.m. to 3 p.m.); and Tour 2 is the evening shift (usually from 3 p.m. to 11 p.m.). 99. When mail for FSS zones is not ready for processing until after the FSS operation has been complete, it may subsequently be
sorted on the AFSM 100. The end result would be fewer pieces per tub coming from the AFSM 100, as many pieces were sorted on the FSS. Consequently, the per piece costs for moving containers will be higher.
September 2011 77
Chapter 5 Costs, Trends, and Data Quality
Small Parcel and Bundle Sorter and Automated Parcel and Bundle Sorter Efficiency/Capacity In FY 2010, analysts observed that plants allocated time to process the various types of mail (e.g., Standard Mail bundles, Periodicals bundles, Priority Mail, First-Class Mail parcels) using the Small Parcel and Bundle Sorter/Automated Parcel and Bundle Sorter (SPBS/APBS) and APPS throughout the day. Prior to implementation of the National standardized CET policy in July 2011, under prior local policies, if the processing window for Periodicals bundles had expired, those bundles were likely to be processed manually since the machine would be dedicated to other types of mail. Given the relatively smaller total volume of Periodicals bundles, it would not have been efficient to have enough sorting equipment to process all mail types regardless of when they showed up in a given staging area. This issue was complicated by the fact that a substantial amount of Periodicals appear to have arrived at processing facilities after the CET, and ad hoc decisions on processing were made on a local level.
Mail Transport Equipment Shortages Due to shortages of containers, containers with a small number of Standard Mail bundles may have continued to be used on either the APPS or SPBS when the sort plan was changed from a Standard Mail bundle sorting sort plan to a Periodicals bundle sorting sort plan. So Periodicals and Standard Mail would be mixed, resulting in higher non-MODS manual costs, to the extent that delivery unit employees culled through this mail to identify Periodicals to ensure service standards are met. (Given the differences in service standards, the bundles of Standard Mail may be deferred from that day’s delivery, but the Periodicals would not be.) This same issue can occur when any types of parcels, including Priority Mail parcels, are sorted into containers that hold Periodicals bundles.
Postal Regulatory Commission CommentsIn FY 2010, the Postal Service expended $349 million dollars on Periodicals processing in excess of what it would have cost to process Periodicals in a manner comparable to Standard Mail. If this difference were captured in its entirety, it would represent a 29 percent reduction in Periodicals processing costs. However, the Commission recognizes that differences in mail characteristics, service windows, and mailer preparation limit the extent to which Periodicals processing can replicate Standard Mail processing.
Ideally, an estimate of cost savings from processing Periodicals mail more efficiently would be calculated by comparing Periodicals pieces that are processed efficiently to Periodicals pieces that are processed less efficiently. However, it is difficult to estimate how much money would be saved if the Postal Service implements best processing practices, such as processing Periodicals that pay discounted automation rates on automation equipment, because there are no data available to definitively determine how much of this mail currently diverges from the automation processing stream. Despite longstanding concern regarding manual processing of both bundles and pieces, the Postal Service does not record comprehensive, systemwide data
78 Periodicals Mail Study
Costs, Trends, and Data Quality Chapter 5
concerning the use of the automation mailstream. There is no report stating how many bundles compatible with automation bundle sorters are entered on a given day and how many of these bundles are actually processed on automation bundle sorters. No data concerning the number of bundles that should be directed to automation piece sorting operations or cross-docked to the DDU are collected. There is no measurement of how many hours the Postal Service spends manually sorting bundles that miss the Critical Entry Time because the machines are otherwise dedicated. In fact, there is no measurement of how many bundles miss the Critical Entry Time. There is no reliable way to measure how many pieces are sorted through manual processing at the facility or the DDU, only rough estimates built on weight/density assumptions.
The Postal Service has expressed concern that there may be limits to the benefits that can be derived from costly new data collection efforts. In the case of Periodicals, the Postal Service believes that efforts to improve processing (and reduce costs) can be made without launching expensive data collection programs, and that in some instances, it may be impossible to gather specific pieces of data. However, that should not stand in the way of doing everything possible to improve processing and reduce costs.
The Commission agrees and believes that the Postal Service may be able to better utilize some of the data it already has to further this analysis.
With the data limitation as a backdrop, the Commission believes that isolating the unit cost differences between Periodicals and Standard Mail is instructive. The FY 2010 mail processing data show that the Postal Service incurred over $221 Million (or 3.41 cents per RPW piece) processing Periodicals in manual piece sorting operations. The percentage of Non-Carrier Route Standard Mail Flats and Periodicals volume that is identified as non-machinable, pays non-machinable rates, and must be handled manually is similar (5 percent for Periodicals and 6 percent for Standard Mail in FY 2010). However, the Postal Service incurred only 1.94 cents per RPW piece manually processing Standard Mail flats in FY 2009, a 1.5 cent per piece difference. The manual processing of pieces is caused, to some extent, by manually processing bundles, rather than sorting them on APPS or SPBS machines. When the unit cost differences are multiplied by the volume of Periodicals the aggregate difference is $349 million.
United States Postal Service Comments The Postal Service relies on the comparison of Periodicals and Standard Mail flats to further demonstrate the reasonableness of the Periodicals attributable costs. The information presented in this chapter shows reasons for the higher processing and transportation costs for Periodicals. Most of the higher mail processing cost for Periodicals is associated with bundle sorting and other allied operations. Periodicals has fewer pieces per bundle and pallet, so mathematically this is the obvious result; when the cost of a bundle sortation is spread over fewer pieces, it will result in higher unit costs. To conclude that processing Periodicals in “a manner comparable” to Standard Mail could generate $349 million in savings, however, misunderstands the cost drivers for Periodicals. That is not to say that
September 2011 79

Chapter 5 Costs, Trends, and Data Quality
improvements cannot be made, and indeed they must be. But those savings cannot be achieved by a hypothetical assumption that Periodicals and Standard Mail flats are alike in every way. They are not.
Another important processing cost difference stems from the higher costs for forwarding and return to sender associated with Periodicals; again, this is due to the nature of Periodicals. Finally, the difference in piece distribution costs, which is 0.76 cents (or about 14 percent of the total processing cost difference of 5.36 cents) is consistent with the observations of a greater propensity of Periodicals mail for manual piece distribution. Likewise, the higher transportation costs of Periodicals are consistent with the heavier piece weight and fewer pieces per pallet for Periodicals.
The Postal Service believes the widely varying characteristics of Periodicals and Standard Mail flats challenge the basis of the Commission’s estimate of $349 million. There has been a significant increase in measured Periodicals costs over the past decade. An important portion of that increase is due to methodological changes affecting Periodicals costs. In addition, Periodicals costs have increased with overall labor costs and have been affected by macroscopic events such as CSRS and Health Benefit payments made by the Postal Service to the federal government. It is worth noting that Outside County Periodicals would not benefit from automation nearly as much as other flats groupings (e.g., First-Class Mail single-piece flats) because so much of its volume is presorted, and hence, requires little processing.
The cost-driving characteristics of Periodical flats vary greatly from Standard Mail flats, with substantially fewer pieces per sack, pieces per pallet, and pieces per bundle. This difference helps to explain the dramatic difference in cost per piece between the products. A part of the difference is also due to higher forwarding costs and higher piece distribution costs, the latter stemming from a higher share of manual sorting for Periodicals. The higher share of manual sorting for Periodicals found in the costs was also verified through observations of operations. While this helps to explain the higher costs, it clearly is not optimal, and the Postal Service is continuing to work toward improving operational efficiencies to lower costs in Periodicals and other mail classes.
80 Periodicals Mail Study
Chapter 6 Operations Strategies for Increasing Efficiency of Periodicals Mail
Introduction
The Postal Service and the Commission agree on the strategy for optimizing equipment and automating Periodicals processing and handling as much as possible. However, there are constraints under which the Postal Service operates. These constraints allow optimization but not perfection, because Postal operations have a variety of plant and route configurations, budget limits for automation-related purchases, space constraints, transportation schedules, and other limiting factors in postal operations. This chapter describes strategies the Postal Service is pursuing to increase the operational efficiency of flats mail in general and Periodicals mail in particular.
Full Deployment and Development of the Flats Sequencing System
By sorting mail in delivery sequence order, Flats Sequencing System (FSS) will reduce the amount of time carriers spend manually sorting mail and increase the time available to deliver mail. Improving delivery efficiencies will enable the Postal Service to reduce flats processing costs.
Under the Postal Service plan, a total of 100 FSS machines have been deployed in 47 locations and will sequence flats for 2,465 zones.100 The machines operate for an average of 17 hours per day, 302 days per year. Deployment of FSS in 2011 is expected to have a significant impact on Periodicals costs.101 Although Periodicals represent 20 percent of all flats, once the non-machineable flats are deducted for all mail classes, 27 percent of the remaining FSS-candidate mail base102 is Periodicals. Comments on FSS from a small group of mailers are included in Appendix H. The Postal Service is exploring sequencing flats beyond Phase I and researching next
100. As of July 2011, all 100 Phase 1 FSS machines are active. The number of zones could fluctuate as conditions require.101. As discussed in Chapter 3 with the use of FSS, carriers no longer have to case flats size mail: large envelopes, magazines and
catalogs will arrive in walk sequence order in the same way that letter mail arrives to carriers today.102. Between 25 percent and 33 percent of all flats are in Phase 1 FSS zones.
September 2011 81
Chapter 6 Operations Strategies for Increasing Efficiency of Periodicals Mail
generation technology that would align with the flats volume predictions of the future. As Phase I FSS provides increased operational efficiency, Phase II FSS deployment should be developed, subject to favorable return or investment threshold, because automation is the single-most important factor in service and productivity improvements.
By introducing and expanding flats sequencing, the Postal Service will be able to standardize and simplify current presort methods. Ensuring that the Postal Service can capture the largest percent of Periodicals mailings in the FSS environment is at the forefront of planning efforts.
Adherence to Critical Entry Times (CETs), described above in Chapter 3, is needed for the full potential of automation to be realized. To ensure automated processing for as much Periodicals mail as possible, mail needs to arrive at the destinating processing center early enough for the Postal Service to complete bundle processing, transport, and prepping for induction into the FSS.
Ensure Packaging Integrity for Bundles and Pallets
Reduce or Eliminate Bundle Breakage IssuesBundle breakage increases processing costs and contributes to damaged mail, which is a concern for both mail owners and mail recipients. Flats within bundles that maintain their integrity throughout processing incur the least handling. When bundles break during bundle distribution on the Automated Package Processing System (APPS) or Small Parcel and Bundle Sorter (SPBS), additional operations are required to reach the carrier route level. Also, bundles entered in sacks have historically exhibited higher bundle breakage rates. Bundle breakage is also often due to a small number of pieces in a bundle.
Difficulties arise when the integrity of the strapping of a bundle is lost, which is most commonly caused by the weakness of the strap’s glue. If there is a weak glue spot on a strap, the strap breaks during dumping operations. When the strap breaks, the individual pieces within that prepared bundle lose their presort (e.g., carrier route, 5-digit, etc). As a result, the mail must be sent to a processing center for piece distribution, which the mail preparation and discount pricing was designed to avoid. Bundle and piece processing may be in separate buildings.
A recent Lean Six Sigma (LSS) project revealed that Periodicals account for a disproportionate percentage of the bundle breakage problem. There are three main reasons for bundle breakage:
Bundle size.
Bundle packaging.
Non-optimal methods associated with dumping pallets/containers.
82 Periodicals Mail Study
Operations Strategies for Increasing Efficiency of Periodicals Mail Chapter 6
Containerization can also have an impact because the bundles have to be removed from the container in which they are presented. In general, the fewer the bundles in a container, the less stress the bundle is subjected to. Bundles tumbling against each other can cause bundle breakage.
Best practices on the APPS include dumping no more than 15 bundles per 5 feet of conveyor and finalizing all bundles so that they do not circulate repeatedly and incur damage. The Postal Service has recently completed nationwide training on these practices and will continue to follow up to ensure that best practices are followed.
In its ongoing efforts with the mailing industry to minimize bundle breakage, the Postal Service is pursuing several other efforts, including an optional mail preparation for FSS, with guidelines outlining minimum and maximum thickness per bundle, rather than pieces per bundle, to help ensure more bundle size uniformity and consistency.103 Bundles of uniform height stack better and can be secured to the container more easily than bundles of varying heights. The clamshell dumper (for FSS) improves dumping, but is not a networkwide solution in itself.
The Postal Service is also looking at new technologies to improve the induction and processing of flats. For example, current research and development efforts are underway into new and improved feeding systems. However, it is too early to determine whether these will be successful, especially with current and ongoing capital constraints. Similarly, capital constraints prevent the Postal Service from integrating automated depalletizing equipment or some other technology that would soften the blow of dumping bundles onto a belt. The Postal Service will continue to explore technology that improves flats induction and processing.
Enhance Pallet IntegrityA lack of pallet integrity is very similar to bundle breakage. Unstable pallets can easily lose their contents during transportation and other handling. Enhanced bundle integrity, as described above, will lead to enhanced pallet integrity because the pallet contents are not as subject to movement.
Expand Comailing and Co-palletization Options
For Outside County Periodicals mailers to qualify more mail for lower prices, the Postal Service allows more than one publication in qualifying bundles. In “co-mail,” pieces for more than one publication title can be placed into a carrier route bundle, 5-digit or 5-digit scheme bundle, 3-digit or 3-digit scheme bundle, etc. Co-mailing allows mailers and consolidators to combine multiple individual Periodicals publications addressed to Outside County destinations into a single mailing for the purposes of finer presort and more efficient Postal Service acceptance. By combining multiple editions/
103. See Chapter 3 for a description of Stand Alone Mail Prep and FSS.
September 2011 83
Chapter 6 Operations Strategies for Increasing Efficiency of Periodicals Mail
publications, mailers are often able to qualify for greater presort discounts. Through this program, the Postal Service realizes benefits from larger bundles and pallets and finer presort levels.
Similar to co-mail, co-palletization (sometimes known as “co-pal”) allows mailers to combine bundles of different Periodicals publication titles on a pallet for the same or finer presort level and destination (mostly Area Distribution Center and, occasionally, Sectional Center Facility). Co-palletization allows mailers to move mail from sacks onto pallets, thereby reducing the expensive handling of sacks and enabling closer to destination drop-shipments. Deeper penetration into the postal network can mean lower prices for smaller mailings, as well as improved service. The co-pal process was piloted as a test program in early 2003 and continued for several years before it was instituted fully in 2007.
A further co-mailing and co-palletization opportunity involves mixing classes of mail. This practice provides a new option for mailers to combine Standard Mail flats and Periodical flats within the same bundle, when placed on pallets, and to combine bundles of Standard Mail flats and bundles of Periodical flats on the same pallet. The Standard Mail service standards apply to all Periodical pieces entered in the combined mailing. Allowing mailers to combine classes of mail enhances operational efficiencies within postal processing because mailpieces are now in bundles on pallets, rather than in sacks.104 (Opening sacks and dumping bundles is a time consuming and non-value added activity. Over the past few years, the Postal Service has implemented numerous process changes to reduce the use of sacks in Periodicals processing.105 For example, virtually all sack-sorter machines have been removed from postal processing plants.)
Lower Transportation Costs The Postal Service transportation network is extremely complex, and transportation costs have continued to increase even while the flats mail environment is being automated. Many of these costs, such as fuel prices, are outside the control of the Postal Service.
Reducing overall transportation costs depends on more efficiencies in mail preparation and processing. The Postal Service continuously monitors and adapts its processing and transportation networks to changing customer mailing patterns and mail volume fluctuations. Operational and facility optimization efforts are currently underway. The realignment permits the consolidation of transportation and creates new work flows to facilitate movement of mail through the network.
104. Mailers combining Standard Mail flats and Periodicals flats on pallets should note that the Postal Service would process these combined mailings as Standard Mail; and that the Periodicals mailpieces included within those combined mailings, may receive deferred handling. Periodicals mailpieces, included within mailings of combined Standard Mail flats and Periodicals flats, will be subject to the USPS service standards applicable to Standard Mail.
105. Because sacks are expensive to handle, mailing requirements were changed on May 11, 2006, to require that Periodicals mailers place more pieces into each sack. Increasing the number of pieces per sack led to a reduction in the number of sacks overall by Periodicals mailers. Additional measures to encourage more efficient preparation resulted when container and bundle charges were also introduced into the Periodicals pricing structure in 2007.
84 Periodicals Mail Study
Operations Strategies for Increasing Efficiency of Periodicals Mail Chapter 6
Build Best Practices and Standardize Where PossibleManaging changes to meet the “best preparation” standards is essential to Postal Service plans to automate flats processing. For example, utilization of Intelligent Mail Barcode (IMb) technology and the standardized addressing characteristics and placement represent large-scale Postal Service efforts to improve flats processing and handling. In addition, training postal personnel in best practices will help to standardize implementation across the country.
The Postal Service is aggressively exploring opportunities to reduce costs and improve efficiencies, using its Continuous Improvement plan and LSS tools to examine operational processes and standardize and remove waste from the system. Through LSS and Value Stream Mapping initiatives, the Postal Service is continuing to evaluate its overall network and mail flows against established mailing requirements to remove redundant and non-value-added preparation practices. Key initiatives going forward are discussed below.
Use Existing Equipment to Move Flat Mail “Up the Ladder”
Mail that is not presorted to a carrier route level by the mailer requires one or more handlings before it can be sent to the individual carrier for manual sequencing and delivery. This sorting is done either automatically on high-speed sorters or manually. Automated sorting is performed primarily on the Automated Flat Sorting Machine 100 (AFSM 100). Flats mail that cannot be handled by the AFSM 100 or the older UFSM 1000 (which is being phased out) must be manually sorted.
In the future, flats mail volume will be moved “up-the-ladder” from the AFSM 100s to the FSS machines. This migration will free run-time hours on the AFSM 100s; to the degree possible, volume that is manually sorted by clerks in the delivery units today will be transferred to the AFSM 100s. This movement of mail from manual sorting to automated sorting will result in clerk workhour reductions at delivery units, which can lower Periodicals costs. Following are more details on plans for the AFSM 100 and the APPS.
AFSM 100To maximize the amount of mail processed on the most efficient equipment, the Postal Service is implementing strategies to ensure full utilization of the AFSM 100. The initial purchase of 534 AFSM 100s was based on 2001 flats volumes. Because there has been a decrease in flats volume system-wide and, where possible, flats are being moved “up-the-ladder” to FSS, there is an opportunity to optimize utilization of AFSM 100 equipment. This “rightsizing” effort will allow some equipment to be removed from service, reducing maintenance costs, and provide for more automated processing of flats mail in the case of relocated equipment, particularly where the UFSM 1000 is still in use. Further, the majority of flats mail processed on
September 2011 85
Chapter 6 Operations Strategies for Increasing Efficiency of Periodicals Mail
UFSM 1000s is AFSM 100-compatible and can be moved into the more efficient AFSM processing environment as the USFM 1000 is phased out. AFSMs and FSSs also include remote coding operations, thereby keeping more flats in an automated mailstream.
APPSAPPS improves downstream mail flows by reducing handlings and improving cycle time.106 Strategies to ensure full utilization of APPS include shifting volume from less productive older equipment or even manual operations (e.g., by taking mail from the SPBS or other non-automation operations). In many instances, facility consolidations allow for more mail to be processed on APPS. Specific targets have been established to help drive optimal performance.
Further Standardize Mail Entry and Mail Flows
The Postal Service has worked with the mailing industry to standardize mail entry and mail flows as much as possible. Following is an overview of recent initiatives and further plans in this area.
Hot-2C Practices Have Been EliminatedAlthough widely used in the field, Hot-2C practices that forced Periodicals mail (bundle or piece distribution) outside of the automated processing stream and into less efficient manual processes were not nationally endorsed procedures and had been initiated locally to improve customer service. Facilities have been instructed to follow nationally endorsed postal policy for Periodicals processing.107
Merge Mail Classes at Destination Sort The overall flats volume decline and the lower volume runs by class makes feasible the mixing of all classes of flats processing on destination sortation operations using AFSM 100s and UFSM 1000 carrier route sort runs as long as the facility is able to maintain the different service performance for each class of mail. Ending segregated runs by class improves overall automation efficiencies by allowing for long uninterrupted runs. (It eliminates the need for machine shut-downs, changeover times, and separate dispatches and set-ups for the next type of mail.)
106. “Cycle time” is a Lean Six Sigma term for the total time required to complete all activities in a work flow process.107. To assure consistent messaging, a continuing series of FAQ documents has been issued by Processing Operations, and
Periodicals training material is available on its website for field offices to use.
86 Periodicals Mail Study
Operations Strategies for Increasing Efficiency of Periodicals Mail Chapter 6
Enhance Tracking of Flats Operations PerformanceTracking of flats operations performance will include these metrics:
Equipment utilization rates.
Percentage of carrier route mail provided to delivery units.
Workhours in manual flats operation.
Percentage of manual flat mail to customer service operation.
Reduce Flats Mail Preparation Costs
Finalize Bundles Requiring Distribution Early in ProcessOver 90 percent of Periodicals bundles require bundle distribution prior to sorting individual pieces. As described in Chapter 3, the Postal Service distributes bundles using APPS, the mechanized SPBS, or a manual process. Bundles are sorted into Mail Transport Equipment such as hampers or cardboard containers on pallets. By maximizing the amount of mail processed on the most efficient equipment, the Postal Service is implementing strategies to ensure the APPS is fully utilized. This may require shifting volume from less productive older equipment or even manual operations, for example by taking mail from SPBS or other non-automation operations.
The Automated Parcel and Bundle Sorters have a higher throughput and are more productive than the SPBS. Performance improvements generated by the new BCR/OCR technology and facing operation is reducing the cost of processing mail on this equipment by at least one-third. See Appendix K for details.
Reduce Handlings and Increase Unit/Container DensityPostal transportation plans are integrated with distribution and overall network strategies. They represent a three-pronged effort to reduce transportation costs for not only Periodicals, but other ground categories of mail as well. Making the most of available space at every point in the process—i.e., increasing density—is efficient and lowers costs. Maximizing use of sortation equipment supports aggregation of mail, which leads to fewer, fuller containers and increases the weight of handling units. It also expands the opportunity to create denser containers.
Change Mailing Requirements to Promote Efficiencies
Revise Mailing Standards to Support Automated ProcessingThe physical characteristics of flats mail are not as conducive to automation as are the characteristics of letter mail. The flats mailstream includes
September 2011 87

Chapter 6 Operations Strategies for Increasing Efficiency of Periodicals Mail
envelopes, flimsies, newspapers, digests, catalogs, and magazines. The variations in the size, weight, shape, and thickness of flats mail makes it inherently more difficult to process.
Several efforts have taken place over the past few years to further guide flats toward being automatable, including addressing standards, and deflection, polywrap, and reduced selvage requirements. Newspapers, however, are still a challenge, and among the most difficult mailpieces to handle, because of their size, shape, thickness and tendency to bend when handled.
Define Optimum Bundle Preparation and Sizes to Reduce Handlings and BreakageWhen bundles break, the individual pieces within that prepared bundle lose their presort arrangement and orientation, and the flats pieces usually move outside of the automated mailstream for the rest of their journey.
Several studies and recommendations have attempted to address bundle breakage and bundle processing. These studies conclude that consistent, denser bundles (i.e., those with uniformity and thickness) reduce bundle distribution and handlings, and minimize breakage. Despite efforts at tightening mail preparation requirements to lower bundle breakage rates, the problem still exists and needs to be addressed further so that bundles can withstand normal transit and handling without breakage.
Flexibility in Mailpiece Design for AutomationThe Postal Service has been working with mailers to identify more precise specifications so that individual mailpieces with new, creative designs can be run on postal equipment.108 The Postal Service, working with the mailing industry, will continue to seek opportunities to better match mailpiece design with marketplace demands and automation requirements, and to develop more automation-compatible mailpieces that meet market needs.
Continue to Collaborate with Mailers on Customer Participation and Worksharing Programs
Align Periodicals Preparation with Processes Although Periodicals are presorted to specific bundle and pallet levels, over 90 percent of Periodical bundles require distribution to 3-digit or 5-digit containers prior to the next handling, flow, or piece distribution process. The Postal Service sorts bundles using automated or mechanized bundle sorting equipment. In some offices where bundle sorting equipment is not present, a labor-intensive manual bundle sorting operation takes place.
108. Specifications currently being addressed are paper weight, paper stock, and attachments. Attachments include peel-off labels on mailpieces. Without appropriate guidelines and requirements, these mailpieces would be subject to damage, machine jams, downtime, and ultimately, higher per piece costs.
88 Periodicals Mail Study
Operations Strategies for Increasing Efficiency of Periodicals Mail Chapter 6
Several efforts are underway that simplify bundle and pallet presort levels and bypass the bundle distribution process. With the activation of the Flats Sequencing program, new optional FSS bundle and pallet preparation standards are being implemented. These options will provide mailers opportunities to create bundles and pallets that are FSS-ready and bypass the bundle sorting process. The results will increase the amount of Periodicals mail that will be sequenced on automation, thereby reducing carrier casing time.
For non-FSS offices, carrier route bundles and 5-digit scheme carrier route pallets are still relevant. FSS pallets for FSS offices and carrier route pallets for non-FSS offices provide the greatest opportunities. Bypassing the bundle sorting process reduces handlings and operational costs, reduces damage and bundle breakage, and improves cycle time.
Increase Customer-Applied Barcoded Flats Volume Flats automation efficiency is dependent upon customer-applied POSTNET barcodes or Intelligent Mail barcodes. Great strides have been made in increasing the volumes of barcoded flats; however, there is a need to expand beyond today’s current requirement for barcodes on flat-size pieces claimed at automation prices. In the FSS environment, other presorted flats—carrier route, high density, and in some cases walk-sequenced flats—are processed on the flats sequencing equipment, depending on their physical characteristics. Additional efforts regarding customer barcoding need to be considered, because barcodes are essential to fully automating flats for delivery.
Entry/Induct Periodicals Where First Process OccursThe Postal Service continuously monitors and adapts its processing and transportation networks to changing customer mailing patterns and mail volume fluctuations. Currently, three integrated elements of operational and facility optimization efforts are underway: closure of airport mail centers, consolidation of redundant mail processing operations, and transformation of the Bulk Mail Center (BMC) network. In May 2009, the Postal Service began transforming the Postal Service distribution network by converting BMCs into Network Distribution Centers. The realignment permitted the consolidation of transportation and created new work flows to facilitate movement of mail through the network.
The Postal Service, working with various segments of the mailing industry, has developed new preparation standards that align with the revised network. Mail will travel more directly through the network before reaching the initial distribution point, improving service and efficiencies in transportation methods and distribution processes. Consolidation of mail processing operations assists by centralizing the originating and destinating piece distribution into fewer locations with the right amount of automation machinery to support the volume being processed. Consolidating in this manner also eliminates the potential for multiple piece handlings.
September 2011 89

Chapter 6
This page intentionally left blank
90 Periodicals Mail Study
Chapter 7 Findings
Introduction
In accordance with section 708 of the Postal Accountability and Enhancement Act (PAEA), the Postal Service and Commission assessed the quality of Periodicals cost data and explored opportunities for increasing operational efficiency. After reviewing Postal Service responses to prior data quality recommendations, the Commission and the Postal Service agree that the cost estimates are reasonably accurate for rate-making purposes.
The Postal Service and Commission also agree that opportunities for increasing operational efficiency exist. Although the Postal Service and the Commission use different methodologies to estimate the cost savings available through operational changes, the difference in cost savings estimates is one of degree. Regardless of approach, there will still be a cost coverage gap; without price changes or legislative changes, Periodicals will not be able to cover its costs.
Key Issues
The fundamental issues underlying the disparity between Periodicals costs and revenues have had the same themes for decades and even centuries. Periodicals are important to the nation, but their value to society may exceed the amount publishers, in general, are willing to pay for mail distribution. This situation is not new and not unique to the United States.109 Further, the PAEA allows for Educational, Cultural, Scientific, and Informational (ECSI) value pricing, but includes a pricing factor that each mail class should cover its attributable costs. Cost savings opportunities exist, but are not likely to be sufficient to bring Periodicals to breakeven.
Business issues must be considered, along with industry expectations and the postal culture surrounding the importance of quickly processing Periodicals mail despite the costs.
Given the remaining financial gap, even after potential cost savings from operational efficiency improvements are realized, the focus must shift to how the revenue side of the cost coverage equation can be improved.
109. Canada offers assistance to publishers through the Canada Periodical Fund, which “provides financial assistance to Canadian magazines, non-daily newspapers and digital periodicals to enable them to overcome market disadvantages and continue to provide Canadian readers with the content they choose to read.” See http://www.pch.gc.ca/cpf.
September 2011 91
Chapter 7 Findings
Under the legislated mandate that applies the Consumer Price Index (CPI)-based price cap at the class level, it is extremely challenging to improve Periodicals cost coverage through pricing meaningfully, especially when the price cap has been as low as it has over the past two years. In its exigent price change request filed on July 6, 2010, the Postal Service did propose an overall 8 percent price increase for Periodicals, since the price cap may be “pierced” due to extraordinary or exceptional circumstances.110 This increase would have significantly improved the cost coverage for Periodicals.111
This proposed price increase did not take place, however, as the Postal Service’s exigent price change request was denied by the Postal Regulatory Commission.112
A legislative change which relaxes strict inflation-based price caps by class and allows for flexible pricing reflecting market dynamics might enable the Postal Service to further remedy the Periodicals cost coverage issue. Absent this legislative change, regulatory action could fix the Periodicals cost coverage problem if the Postal Regulatory Commission intervened as part of its Annual Compliance Determination (ACD) process to raise Periodicals prices to achieve 100 percent cost coverage. In fact, in Docket No. ACR 2009, the Commission’s Public Representative suggested that the Commission has a set of options in its arsenal to ensure that each class of mail achieves at least 100 percent cost coverage.113 However, in its 2010 ACD, the Commission declined to discuss its remedial powers for raising the Periodicals cost coverage, preferring to allow time for efficiency enhancements, network adjustments, and related changes to alter the attributable cost picture for Periodicals. [FY 2010 ACD, at 17.]
The aforementioned legislative change and/or regulatory action, in concert with the operational efficiency opportunities detailed above, would enable substantial progress in closing the financial gap for Periodicals. Absent these changes, however, Congress is left with the stark choice of providing a subsidy or allowing Periodicals to not cover its costs (which would have the effect of cross subsidy from other classes of mail, and/or greater borrowing by the Postal Service).
Clearly, some tough choices will be required to achieve the important balance between the Postal Service’s long-term financial viability and the societal value of Periodicals for the educational, cultural, scientific, and informational content they provide.
110. USPS-R2010-4/3.111. The projected annualized cost coverage after implementing the proposed exigent price increase would have improved to 87.1
percent, as detailed in Attachment 12 of the Statement of Stephen J. Masse on behalf of the United States Postal Service.112. Order No. 547. September 30, 2010. Remanded to Commission by Circuit Court.113. Public Representative Reply Comments on Annual Compliance Report 2009, at February 17, 2011.
92 Periodicals Mail Study
Findings Chapter 7
Streamline Periodicals Pricing
The need for pricing flexibility is especially critical for addressing an entire class of mail which falls well short of covering its costs. In the Postal Service’s action plan for the future, “Envisioning a Viable Postal Service for America,” unveiled on March 2, 2010, then-Postmaster General Jack Potter stated the need to “ensure that prices of Market Dominant products can be based on the demand for each individual product and its costs, rather than capping prices for every class at the rate of inflation.”114 A legislative change which relaxes strict inflation-based price caps by class, substituting an overall Market Dominant cap, would allow the Postal Service to further remedy the Periodicals cost coverage issue.
Without this pricing flexibility, the Postal Service’s options for improving Periodicals cost coverage through pricing are limited, especially in periods of a low price cap authority, such as the current period. The price differential between advertising content and editorial content, however, could be modified or simplified. (There are no differences in processing between editorial and advertising pages.) In the current environment, there is a mismatch between the preferential pricing for editorial content on one hand, and on the other hand the operational reality that editorial content is just as costly to process and deliver as advertising content.
The Postal Service has a longer-term recommendation: to consider simplifying the overall pricing structure for Periodicals and in the process help meet four strategic goals:
1. Maintain and protect Periodicals ECSI value;
2. Achieve higher cost coverages;
3. Assure more predictable and consistent Periodicals service by leveraging processing networks in First-Class Mail and Standard Mail; and
4. Simplify the current complex and bewildering pricing structure, as well as complex mail prep options.
This could be done by changing the Periodicals classification so that its service and prices are based on what is offered for the Standard Mail and First-Class Mail classes, with a price reduction reflecting the special role that Periodicals play in our society and their ECSI value. Under this recommendation, Periodicals would not have a separate and distinct pricing structure, but would be eligible to receive discounts in recognition of their ECSI contribution. Current eligibility requirements would remain; Periodicals that are eligible to mail now using Periodicals rates would be eligible for these discounts, as would new publications, which would be required to go through the qualification process that exists today.
114. Ensuring a Viable Postal Service for America: An Action Plan for the Future, March 2, 2010, see p. 1.
September 2011 93
Chapter 7 Findings
The two class options would reflect the type of service desired by a particular publication. Periodicals that have monthly or quarterly publication frequencies are usually not time sensitive and would likely choose to use Standard Mail. On the other hand, weekly Periodicals would probably want to use First-Class Mail for faster service. A specific Periodicals issue could be mailed using both First-Class Mail and Standard Mail. Once in the processing environment, publications would be treated based on the type of postage they pay, i.e., Standard Mail, First-Class Mail Presort, or First-Class Mail single-piece.
As noted above, in all of these cases, a bottom line discount to recognize the ECSI value of Periodicals would be offered. Essentially, publications would qualify for the Periodicals discount using the same eligibility requirements that are in effect today. The discounts could be two-tiered, such as a five to ten percent discount solely because the mailing qualifies as a periodical under the current rules, and a second discount tied to the editorial content of the publication. Additional discounts for Nonprofit, Classroom, Within County, and Science of Agriculture publications would also be available.
This arrangement would promote simplicity, allowing the Postal Service to move away from separating mail based solely on content. This arrangement implies, as it should, that the many benefits provided to society by the print media are recognized. As a public service organization, the Postal Service is mandated by the U.S. Congress to recognize the ECSI contribution of publications. As discussed in Chapter 2, Periodicals official status as preferred mail goes back to the early days of the Postal Service, and some of the founding fathers even envisioned free delivery for newspapers and magazines. However, since then a lot has changed. The Postal Service is no longer directly controlled by Congress. There are no taxpayer subsidies, and we have moved from a breakeven ratemaking model to a pricing structure that is constrained by a measure of inflation. Further, electronic alternatives to print media and electronic delivery of publications are growing and will continue to cannibalize hard copy delivery.
Generally speaking, a flat-shaped piece that the Postal Service has to accept, process, transport, further process, and then deliver does not incur cost differences based on whether the content is advertising or editorial. Content is not one of the many factors that determine the costs of accepting, processing, transporting, and delivering this piece. Machinability, presence and quality of a barcode, preparation in bundles and containers, and the point of entry are some of the cost causation characteristics of a mailpiece. One purpose of pricing is to provide signals that can lead to the lowest combined cost of processing, transporting, and delivering these pieces, so that the product can cover its cost and provide a contribution to the institutional cost. Ironically, at the moment, combining this pricing goal with other social objectives leads to an overly complex price schedule that does not enhance success for either the pricing or the social objectives.
Mailers that are eligible to mail Periodicals under the new system could exclusively use either Standard Mail or First-Class Mail, or use a combination of these two classes. For example, a large publisher that drop-ships 70 percent of its addressed pieces at the destination Sectional Center Facility
94 Periodicals Mail Study

Findings Chapter 7
(SCF) may choose Standard Mail for that 70 percent of its volume. For volume entered at the destination SCF, service goals could be met even for a weekly publication. The residual 30 percent could be sent with First-Class Mail. Some small publications may not want to deal with preparation issues entirely and could choose to use only single-piece First-Class Mail. As noted above, discounts to recognize ECSI value would apply.
Although the above discussion is limited to First-Class Mail and Standard Mail, the proposed change could and should allow access to other classes of mail, such as Bound Printed Matter, or even a mail class from the competitive arena such as Priority Mail. Discount structures and levels could vary based on the class of mail used by a particular publication.
To the extent individual Periodicals choose the First-Class mail option or the Standard mail option, there would no longer be a “Periodicals” cost coverage.
Postal Service Findings
The Postal Service has assessed each of the ongoing and future operational changes described in Chapter 6 and made reasonable assumptions on cost savings potential. The first-year savings would start to be realized is FY 2012. A range of $120 million to $146 million is given, based on the following quantification in combination with likely, but difficult to quantify, savings from other programs discussed in the recommendations. A summary of maximum estimated savings is shown in Table 9.
Table 9: Projected Upper-Bound Savings From Operational Changes
Estimates shown above in Table 9 are upper-bound estimates of savings; a lower bound of $120 million is estimated. Savings estimated for Up the Ladder and FSS strategies are based on favorable assumptions, discussed below, that may be unrealistic.
Flats Sequencing System – Complete Phase IIt is estimated that once Flats Sequencing System (FSS) Phase 1 is complete and fully operational, the annual savings for Periodicals could be as high as $83 million. A critical assumption underlying this is that Periodicals flats would have the same availability for FSS processing (during the 17-hour FSS sorting window) as Standard Mail, despite the differences in service provided. Most likely, however, given service constraints and Periodicals arrival profiles, Periodicals will be less available than Standard Mail flats for FSS processing. Hence, the $83 million savings is very much an upper bound.
Projected Savings
FSS — Complete Phase 1 $83M
Shift Flats Up the Ladder (F4 manual to F1 automation) $49M
Automated Package & Bundle Sorter $14M
Maximum Upper Bound $146M
September 2011 95
Chapter 7 Findings
Shift Flats Up the Ladder As discussed, efforts are underway to take advantage of newly available Automated Flat Sorting Machine 100 (AFSM 100) capacity due to flats volumes declines, and to substitute automated flats processing for manual processing as much as feasible. A rough, simplified quantification of these savings can be obtained from a comparison of FY 2010 processing costs of 18.6 cents for Periodicals Outside County flats versus 13.3 cents for a comparable mix of Standard Mail flats (non-carrier route plus basic carrier route), a 5.4 cent difference. But much of this difference stems from processing other than piece distribution.115
Instead, as can be seen in Table 8, the piece distribution costs for Periodicals Outside County flats is 6.9 cents as compared to 6.1 cents for Standard Mail flats—an 0.8 cent difference. If Periodicals piece distribution costs were the same as those for Standard Mail flats, despite the limitations posed by service and machinability differences, a 0.8 cent per piece savings would lead to savings of $49.5 million for Outside County Periodicals. Please note that there was no attempt to avoid possibly double counting savings of FSS and Up the Ladder.
Automated Parcel and Bundle SorterThe Automated Parcel and Bundle Sorter (APBS) program is estimated to provide annual savings for Periodicals of about $14 million. APBS involves the conversion of most of the remaining Small Parcel and Bundle Sorter (SPBS) fleet to APBS. The savings due to conversion to APBS is estimated to be 34 percent of labor on SPBS. The $14 million annual savings is based on the 34 percent reduction in FY 2010 SPBS labor associated with Periodicals, offset by the additional APBS maintenance and depreciation costs.
115. Most of the 5.4 cent difference is due to higher Periodicals allied and bundle handling costs which are due to fewer pieces per bundle and pieces per pallet for Periodicals. The costs for mail processing activities that are performed on a per-container or per-bundle basis (unloading and loading containers from trucks, cross-docking containers, dumping containers, sorting bundles, opening bundles), even if identical for the Periodicals and Standard Mail flats containers and bundles, would be higher per piece of mail for Periodicals when divided among the individual mailpieces, simply by virtue of the smaller number of pieces per container and bundle over which to spread those costs. As indicated in Table 7 of Chapter 5, the average pieces per bundle for Periodicals flats is 13.8 pieces, as compared to 24.0 pieces per bundle for Standard Mail flats. This table also shows a great disparity in pieces per pallet with Periodicals averaging 2,258 and Standard Mail having 3,490. Another reason for higher Periodicals processing costs is due to more forwarding and returns to sender for Periodicals.
96 Periodicals Mail Study
Findings Chapter 7
Postal Regulatory Commission Findings
The Postal Accountability and Enhancement Act provides incentives for reducing Postal Service costs and increasing efficiency of postal operations. Although it provides substantial intra-class pricing flexibility, it was designed to provide for predictable rate increases for mailers. In general, these rate increases are limited to inflation.
Over the past decade, the unit cost of Periodicals has increased faster than the cost of inflation. This is due, in part, to the Postal Service’s inability to capture efficiencies in flat mail processing similar to those it has captured for letter mail. The costs of flats processing, transportation, and delivery for all classes of mail is much higher than the costs of letter processing. Substantial opportunities for increasing the efficiency of flat mail processing and transportation exist. Over the past decades the Postal Service has introduced many programs designed to capture some of these efficiencies. However, it is unclear how successful these programs have been. Operational efficiencies that can be achieved for all flat-shaped mail, such as merging classes at destination sorts, will benefit Periodicals as well. However, the unit cost of Periodicals remains substantially higher than the unit cost of Standard Mail flats.
At the time of this review, the Postal Service was not processing Periodicals in an environment that maximizes use of inexpensive automation options. Periodicals pieces could arrive at any time in the day, and when they arrived too late in the daily mail processing schedule to receive AFSM 100 incoming secondary sorts, they were processed manually rather than held until the next automation window. This was generally done for service-related reasons. Some plants had a propensity to direct Hot-2C Periodicals to delivery units for manual incoming secondary, bypassing AFSM 100 sorting to assure a particular level of service. The Postal Service has implemented business rules designed to eliminate Hot-2C processing, effective July 1, 2011. It has also recently standardized critical entry times in an effort to reduce manual processing.
Significant opportunities exist to improve efficiency and reduce costs for Periodicals, most notably with respect to mail processing. The Postal Service has introduced a series of automation mail processing methods over the past 20 years. However, although 97.8 percent of Periodicals mailpieces receive discounts for automation eligibility, up to 40 percent of Periodicals in the incoming secondary operation are manually processed.116 The most
116. The Commission’s rationale for this 40 percent manual processing estimate, with which the Postal Service disagrees, is as follows. There are several data methods that can be used to estimate the frequency of manual handling with current data. One method, which uses In-Office Cost System (IOCS) tallies to estimate the frequency of manual piece sorting, produces an estimate of 40 percent manual incoming secondary processing. The Commission recognizes that the IOCS calculation shows 40 percent of costs are in manual processing, and is weak evidence that 40 percent of volume is in manual processing. Nevertheless, it is likely that it indicates a high percentage of manual processing. Another method to estimate the percentage of flats that receive manual processing was presented in Docket No. R2010-4. That method, which uses FLASH data, also produces an estimate of 40 percent manual processing. Another method, presented by the Postal Service uses Management Operating Data System piece counts compared to Revenue, Pieces and Weight flats volume to estimate the frequency of manual processing. That method estimates that 5 percent of flats that can be processed mechanically are processed manually. Neither of these methods is Periodicals-specific.
September 2011 97
Chapter 7 Findings
appropriate estimate of potential savings from increased operational efficiency would be calculated by comparing processing within Periodicals Outside County. However, the data necessary to estimate these costs are not available. Absent these data, comparing the costs for Periodicals Outside County to the combination of Standard Mail Carrier Route (which is basic carrier route presort) and Standard Mail Flats (which is non-carrier route presort) is instructive. There are many similarities in mail characteristics between the two categories. Both are predominantly flat shaped, and have nearly the same presort profile, including shares of Carrier Route mail and drop-ship volumes.
Despite the similarities, Periodicals Outside County attributable cost per piece is nearly 27 percent higher (or 7.6 cents per piece higher) than the attributable cost per piece of Standard Mail. The differences in unit cost are highest in mail processing and transportation. Although some of the higher costs are due to mail characteristics outside of the direct control of the Postal Service, other cost differences are driven by current Postal Service practices. When aggregated the difference between the cost of processing Periodicals and the cost of processing the same volume of Standard Mail flats is $349 million.
A more accurate estimate of the savings that may be generated by the Postal Service’s efforts to implement best processing practices will require data on the percent of Periodicals pieces processed on automated equipment versus pieces processed manually; the percent of Periodicals bundles processed on automated equipment versus manually; and the percent of Periodicals volume that fails to meet critical entry time but receives overnight service.
The operational context provided by the Postal Service highlights the flexibility in both design and execution of the current mail processing environment. While flexibility is valuable in day-to-day decision making, there is a clear historical pattern of manually processing Periodicals mail that is prepared by the mailer to be processed on automation equipment, and there is little transparency into where or why this occurs. The operational strategies discussed by the Postal Service focus on methods that can be used to keep mail in the automation mailstream from end to end.
The Commission recommends that the Postal Service develop a comprehensive plan to reduce manual handling of automation-compatible Periodicals mail. This plan should be designed to hold managers accountable. The plan should include set targets and timelines for achieving savings. Under this plan, mail that misses its critical entry time should wait for the next automated processing window. Alternatively, mailers could opt to pay more for expedited service.
98 Periodicals Mail Study

Findings Chapter 7
The Commission also recommends that the Postal Service develop ways to use existing data to isolate and monitor problem areas such as the number of automation-compatible bundles that are processed manually, the number of automation-compatible pieces that are processed manually, and the number of pieces that miss the critical entry time but receive overnight service.
The Commission finds the Postal Service’s above proposal for simplification interesting and would, of course, review such a proposal in the proper context.
September 2011 99

Chapter 7
This page intentionally left blank
100 Periodicals Mail Study
Chapter 8 Conclusion
As demonstrated throughout this report, the Postal Service and Postal Regulatory Commission have evaluated extensive issues through this joint Periodicals study. The Postal Service and the Commission will continue to work together to identify and address challenges relating to Periodicals. Both the Postal Service and the Commission are committed to making progress in resolving these issues.
September 2011 101

Chapter 8
This page intentionally left blank
102 Periodicals Mail Study

Appendix A Periodicals Pricing Structure
The Periodicals Class consists of magazines, newspapers, and other publications whose primary function is the transmission of information to an established list of subscribers or requesters. Publications that are eligible to be periodicals must meet qualifying criteria established by law and specified in the Mailing Standards of the United States Postal Service, Domestic Mail Manual (DMM). There are approximately 26,000 magazine and newspaper titles with frequencies that range from daily to quarterly. The mailing sizes range from a dozen to millions per mailing.
Authorized Nonprofit and Classroom publications and those mailed within their county of publication (primarily local newspapers) pay reduced prices. Publications that meet the standards for Limited Circulation publications and Limited Circulation Science-of-Agriculture publications receive 5 percent off the total Outside County postage excluding the postage for advertising pounds.1
Postage for Periodicals mail includes a pound price charge, a piece price charge, bundle and container (per pallet, tray or sack) price charges for Outside County mail, and any discounts for which the mail qualifies under the corresponding standards. The per-piece charge applies to each copy and each firm bundle in the mailing. Outside County piece prices are based on several factors:
Shape of the mailpiece — whether the mailpiece is a letter, flat or parcel;
Characteristics of the mailpiece — whether the mailpiece is machinable or nonmachinable;
Application of a barcode; and
Bundle presort level — Mixed ADC, ADC, 3 Digit, and 5 Digit.
Firm bundles and carrier route pieces pay separate piece prices that do not vary based on these criteria. For pieces properly prepared loose in trays, the price is based on the tray presort level.
1. Notice 123 Price List, lists all current Periodicals prices.
September 2011 A-1

Appendix A
This page intentionally left blank
A-2 Periodicals Mail Study
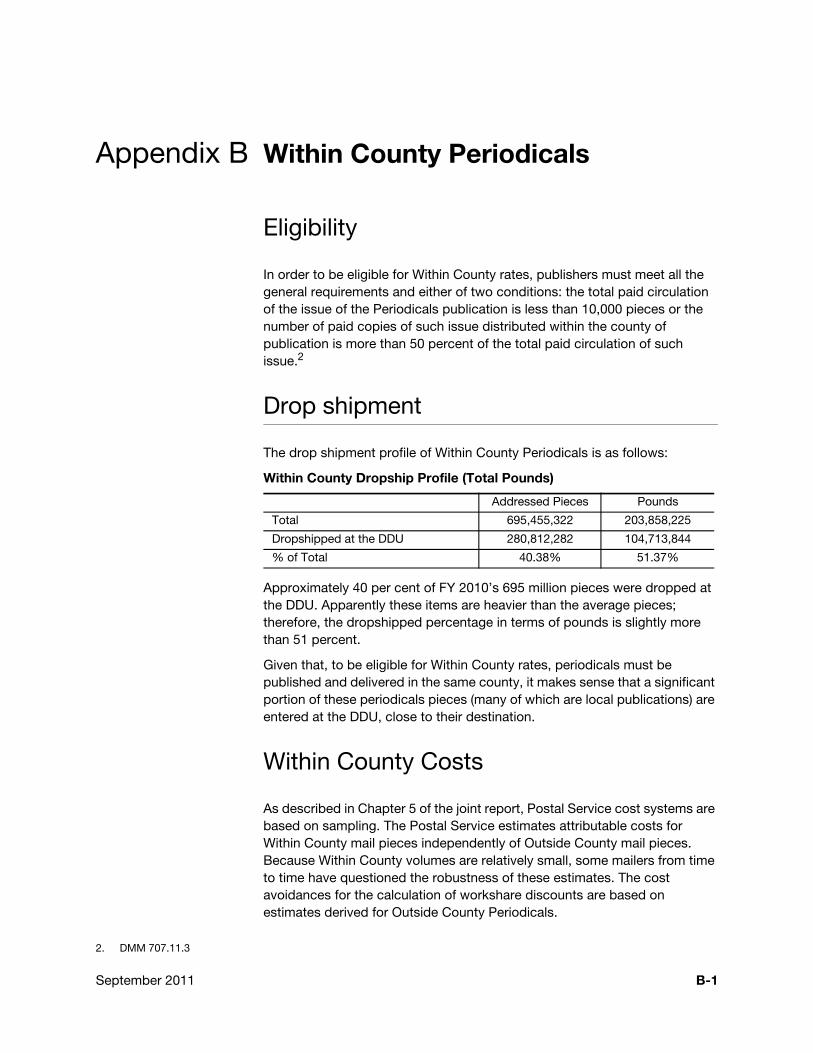
Appendix B Within County Periodicals
Eligibility
In order to be eligible for Within County rates, publishers must meet all the general requirements and either of two conditions: the total paid circulation of the issue of the Periodicals publication is less than 10,000 pieces or the number of paid copies of such issue distributed within the county of publication is more than 50 percent of the total paid circulation of such issue.2
Drop shipment
The drop shipment profile of Within County Periodicals is as follows:
Within County Dropship Profile (Total Pounds)
Approximately 40 per cent of FY 2010’s 695 million pieces were dropped at the DDU. Apparently these items are heavier than the average pieces; therefore, the dropshipped percentage in terms of pounds is slightly more than 51 percent.
Given that, to be eligible for Within County rates, periodicals must be published and delivered in the same county, it makes sense that a significant portion of these periodicals pieces (many of which are local publications) are entered at the DDU, close to their destination.
Within County Costs
As described in Chapter 5 of the joint report, Postal Service cost systems are based on sampling. The Postal Service estimates attributable costs for Within County mail pieces independently of Outside County mail pieces. Because Within County volumes are relatively small, some mailers from time to time have questioned the robustness of these estimates. The cost avoidances for the calculation of workshare discounts are based on estimates derived for Outside County Periodicals.
2. DMM 707.11.3
Addressed Pieces Pounds
Total 695,455,322 203,858,225
Dropshipped at the DDU 280,812,282 104,713,844
% of Total 40.38% 51.37%
September 2011 B-1

Appendix B
This page intentionally left blank
B-2 Periodicals Mail Study
Appendix C History of the Periodicals Mail Class
Legislative History
Periodicals, formerly known as second-class mail,3 has been a preferred mail class since its inception. The history of Periodicals pricing and classification is critical to understanding the current cost challenges of the Periodicals class and why the many efforts to reform it have not yet yielded permanent solutions.
Throughout the colonial period, newspapers served as a vehicle for information dissemination; and at the birth of the nation, newspapers were critical to the development of the American Republic. From the enactment of the first postal laws in the 1790s until the Postal Reorganization Act of 1970, Congress legislated low postage rates for newspapers and magazines, rates that fell far short of covering the actual costs of handling and transporting such mail.4 Congress subsidized postage on periodicals by charging more for letters and, when necessary, appropriating funds from the U.S. Treasury.5
Early Legislative HistoryBecause of Congress’ strong interest in binding the nation together, the Post Office Act of 1792 established postage for newspapers significantly below the postage charged for letters.6 In 1794, Congress expanded this rate preference to magazines.7 Successive generations of elected officials continued to recognize the value of newspapers and, accordingly, kept their postage rates low.
In 1863, mail was divided into classes. Periodicals constituted the second class, which was defined as “all mailable matter exclusively in print, and regularly issued at stated periods, without addition by writing, mark, or sign [and qualifying for second-class rates if issued] from a known office of publication, and sent to regular subscribers.”8 Further, for the first time, distance was not a factor in determining postage rates. The net effect was a per-issue delivery cost of less than half a cent, unless the periodical was published less frequently than weekly, in which case postage was 1 cent.
3. The term “second-class mail” dates from 1863, when mail was divided into classes. Act of March 3, 1863 (12 Stat. 701, 705). The second-class mail class was renamed “Periodicals” in Docket No. MC95-1. See Opinion and Recommended Decision, Docket No. MC95-1, Appendix Two, page 43.
4. In 1970, Congress largely removed itself from the rate-setting process. 5. For historical data on postal income vs. expenses, see Appendix E. 6. Act of Feb. 20, 1792, 1 Stat. 238.7. Act of May 8, 1794, 1 Stat. 362.8. 12 Stat. 705-707.
September 2011 C-1
Appendix C History of the Periodicals Mail Class
To prevent mailers from submitting too wide a variety of mail for the lower Periodicals rates, Congress defined a set of criteria publications had to meet, to qualify for those rates.9 These limits, enacted from 1869–1879, generally have been retained through the present day:
The publication must be regularly issued at stated intervals at least four times a year, bear a date of issue, and be numbered consecutively.
The publication must maintain a known office of publication serviced by the original entry Post Office.10
The publication must be formed of printed sheets.
The publication must meet applicable editorial content, circulation, advertising, and other requirements of one of the following qualification categories established by law and as set forth by the Postal Service: general publications, requester publications, publications of institutions and societies, publications of state departments of agriculture, and foreign publications.
In 1872 Congress set uniform rates for magazines, regardless of where they were printed or where they were sent.11 The per-pound rate for regular second-class mail was lowered to a penny in 1885.
Within County Periodicals
The first mention of special privileges for Within County publications was in 1851. That act allowed free circulation for newspapers within the county where published.12 In subsequent rate legislation, Within County publications continued to be treated differently than publications destinating to addresses outside the county in which they were mailed.
Early Twentieth CenturyWhile the Post Office Department continued to charge a penny per pound through the turn of the twentieth century, second-class matter cost an estimated five to eight cents a pound to deliver, leading to estimated losses of from $17 million in 1894 to $27 million in 1905.13 Congress appointed special commissions in 1906 and 1911 to study the growing problem. Both commissions recommended rate increases, as well as better cost studies to inform rate-making. In 1912, the Hughes Commission stated further that:
All classes of mail are carried for the common convenience of the public, and in determining the apportionment of cost, each should be charged with its proper share of the total expense.14
9. See Act of March 3, 1869, 12 Stat. 705, 707; Act of June 23, 1874, 18 Stat. 233; Act of March 3, 1879, 20 Stat. 359.10. First enacted in Act of June 8. 1872; 17 Stat. 300.11. Act of June 8, 1872, 17 Stat. 303.12. Act of March 3, 1851, 9 Stat. 588.13. Message of the President Transmitting the Annual Report of the Postmaster General for the Fiscal Year Ended June 30, 1911
and the Report of the Commission on Second-Class Mail Matter, February 22, 1912 (Washington, D.C., 1912), 65.14. Ibid., 131.
C-2 Periodicals Mail Study
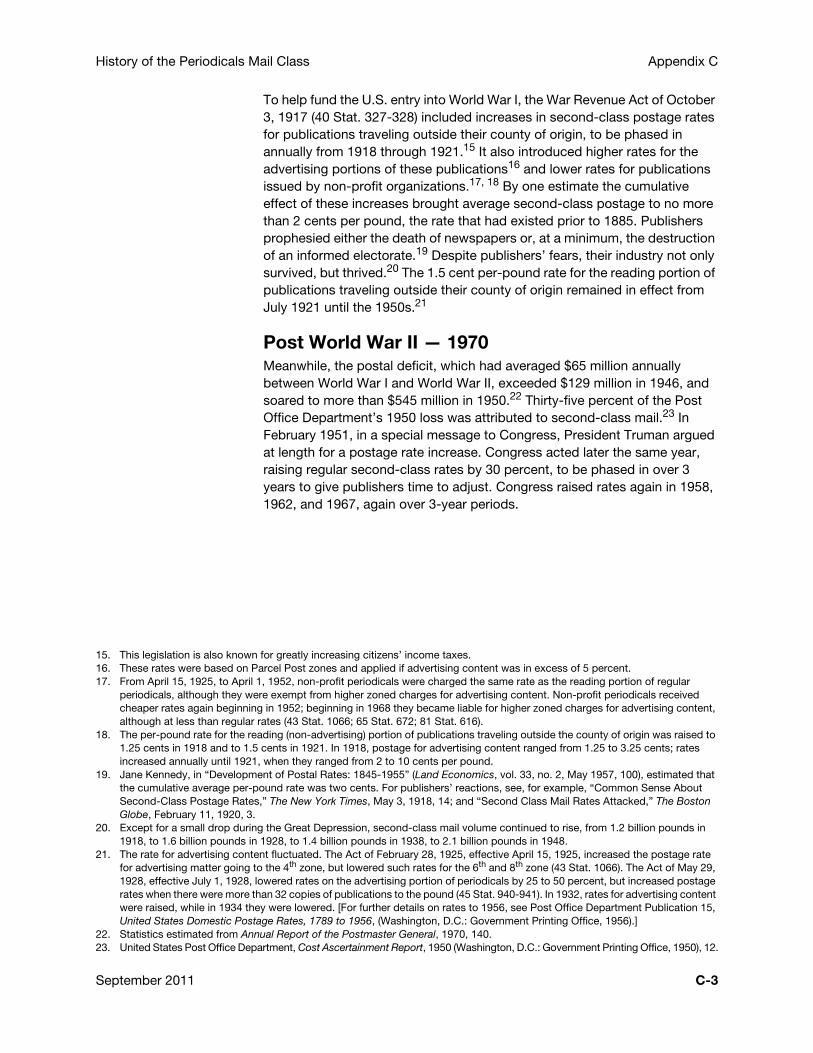
History of the Periodicals Mail Class Appendix C
To help fund the U.S. entry into World War I, the War Revenue Act of October 3, 1917 (40 Stat. 327-328) included increases in second-class postage rates for publications traveling outside their county of origin, to be phased in annually from 1918 through 1921.15 It also introduced higher rates for the advertising portions of these publications16 and lower rates for publications issued by non-profit organizations.17, 18 By one estimate the cumulative effect of these increases brought average second-class postage to no more than 2 cents per pound, the rate that had existed prior to 1885. Publishers prophesied either the death of newspapers or, at a minimum, the destruction of an informed electorate.19 Despite publishers’ fears, their industry not only survived, but thrived.20 The 1.5 cent per-pound rate for the reading portion of publications traveling outside their county of origin remained in effect from July 1921 until the 1950s.21
Post World War II — 1970Meanwhile, the postal deficit, which had averaged $65 million annually between World War I and World War II, exceeded $129 million in 1946, and soared to more than $545 million in 1950.22 Thirty-five percent of the Post Office Department’s 1950 loss was attributed to second-class mail.23 In February 1951, in a special message to Congress, President Truman argued at length for a postage rate increase. Congress acted later the same year, raising regular second-class rates by 30 percent, to be phased in over 3 years to give publishers time to adjust. Congress raised rates again in 1958, 1962, and 1967, again over 3-year periods.
15. This legislation is also known for greatly increasing citizens’ income taxes.16. These rates were based on Parcel Post zones and applied if advertising content was in excess of 5 percent.17. From April 15, 1925, to April 1, 1952, non-profit periodicals were charged the same rate as the reading portion of regular
periodicals, although they were exempt from higher zoned charges for advertising content. Non-profit periodicals received cheaper rates again beginning in 1952; beginning in 1968 they became liable for higher zoned charges for advertising content, although at less than regular rates (43 Stat. 1066; 65 Stat. 672; 81 Stat. 616).
18. The per-pound rate for the reading (non-advertising) portion of publications traveling outside the county of origin was raised to 1.25 cents in 1918 and to 1.5 cents in 1921. In 1918, postage for advertising content ranged from 1.25 to 3.25 cents; rates increased annually until 1921, when they ranged from 2 to 10 cents per pound.
19. Jane Kennedy, in “Development of Postal Rates: 1845-1955” (Land Economics, vol. 33, no. 2, May 1957, 100), estimated that the cumulative average per-pound rate was two cents. For publishers’ reactions, see, for example, “Common Sense About Second-Class Postage Rates,” The New York Times, May 3, 1918, 14; and “Second Class Mail Rates Attacked,” The Boston Globe, February 11, 1920, 3.
20. Except for a small drop during the Great Depression, second-class mail volume continued to rise, from 1.2 billion pounds in 1918, to 1.6 billion pounds in 1928, to 1.4 billion pounds in 1938, to 2.1 billion pounds in 1948.
21. The rate for advertising content fluctuated. The Act of February 28, 1925, effective April 15, 1925, increased the postage rate for advertising matter going to the 4th zone, but lowered such rates for the 6th and 8th zone (43 Stat. 1066). The Act of May 29, 1928, effective July 1, 1928, lowered rates on the advertising portion of periodicals by 25 to 50 percent, but increased postage rates when there were more than 32 copies of publications to the pound (45 Stat. 940-941). In 1932, rates for advertising content were raised, while in 1934 they were lowered. [For further details on rates to 1956, see Post Office Department Publication 15, United States Domestic Postage Rates, 1789 to 1956, (Washington, D.C.: Government Printing Office, 1956).]
22. Statistics estimated from Annual Report of the Postmaster General, 1970, 140. 23. United States Post Office Department, Cost Ascertainment Report, 1950 (Washington, D.C.: Government Printing Office, 1950), 12.
September 2011 C-3
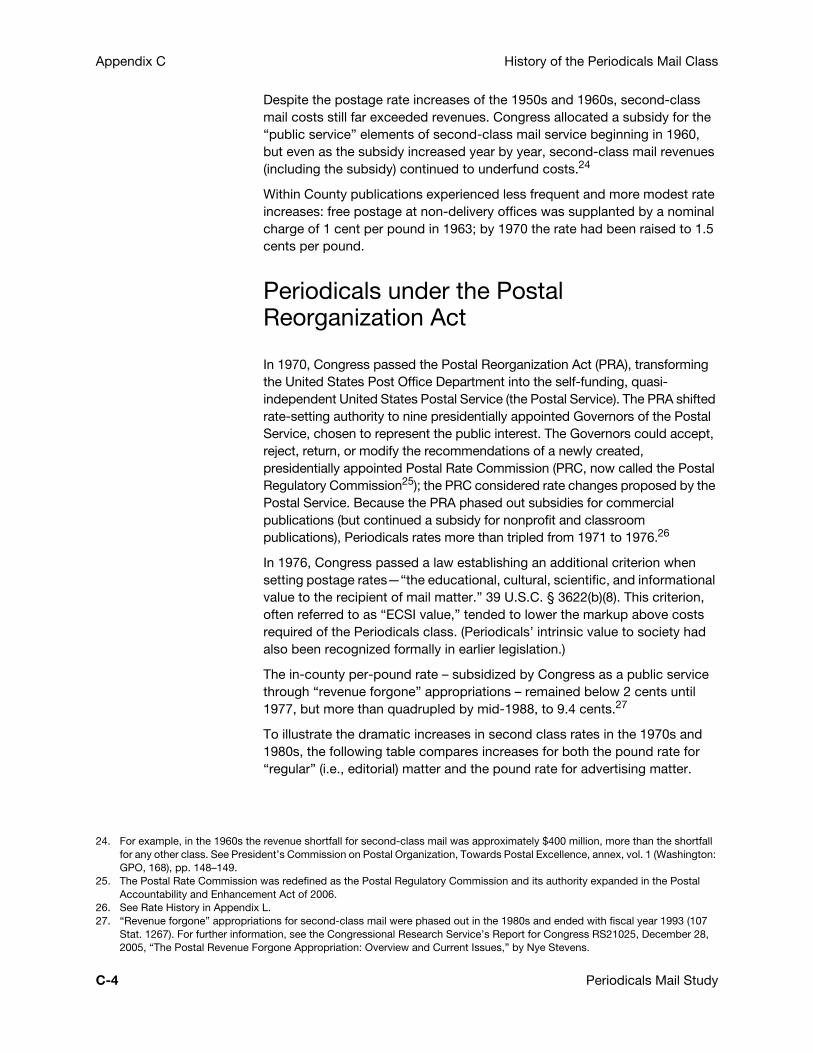
Appendix C History of the Periodicals Mail Class
Despite the postage rate increases of the 1950s and 1960s, second-class mail costs still far exceeded revenues. Congress allocated a subsidy for the “public service” elements of second-class mail service beginning in 1960, but even as the subsidy increased year by year, second-class mail revenues (including the subsidy) continued to underfund costs.24
Within County publications experienced less frequent and more modest rate increases: free postage at non-delivery offices was supplanted by a nominal charge of 1 cent per pound in 1963; by 1970 the rate had been raised to 1.5 cents per pound.
Periodicals under the Postal Reorganization Act
In 1970, Congress passed the Postal Reorganization Act (PRA), transforming the United States Post Office Department into the self-funding, quasi-independent United States Postal Service (the Postal Service). The PRA shifted rate-setting authority to nine presidentially appointed Governors of the Postal Service, chosen to represent the public interest. The Governors could accept, reject, return, or modify the recommendations of a newly created, presidentially appointed Postal Rate Commission (PRC, now called the Postal Regulatory Commission25); the PRC considered rate changes proposed by the Postal Service. Because the PRA phased out subsidies for commercial publications (but continued a subsidy for nonprofit and classroom publications), Periodicals rates more than tripled from 1971 to 1976.26
In 1976, Congress passed a law establishing an additional criterion when setting postage rates—“the educational, cultural, scientific, and informational value to the recipient of mail matter.” 39 U.S.C. § 3622(b)(8). This criterion, often referred to as “ECSI value,” tended to lower the markup above costs required of the Periodicals class. (Periodicals’ intrinsic value to society had also been recognized formally in earlier legislation.)
The in-county per-pound rate – subsidized by Congress as a public service through “revenue forgone” appropriations – remained below 2 cents until 1977, but more than quadrupled by mid-1988, to 9.4 cents.27
To illustrate the dramatic increases in second class rates in the 1970s and 1980s, the following table compares increases for both the pound rate for “regular” (i.e., editorial) matter and the pound rate for advertising matter.
24. For example, in the 1960s the revenue shortfall for second-class mail was approximately $400 million, more than the shortfall for any other class. See President’s Commission on Postal Organization, Towards Postal Excellence, annex, vol. 1 (Washington: GPO, 168), pp. 148–149.
25. The Postal Rate Commission was redefined as the Postal Regulatory Commission and its authority expanded in the Postal Accountability and Enhancement Act of 2006.
26. See Rate History in Appendix L. 27. “Revenue forgone” appropriations for second-class mail were phased out in the 1980s and ended with fiscal year 1993 (107
Stat. 1267). For further information, see the Congressional Research Service’s Report for Congress RS21025, December 28, 2005, “The Postal Revenue Forgone Appropriation: Overview and Current Issues,” by Nye Stevens.
C-4 Periodicals Mail Study
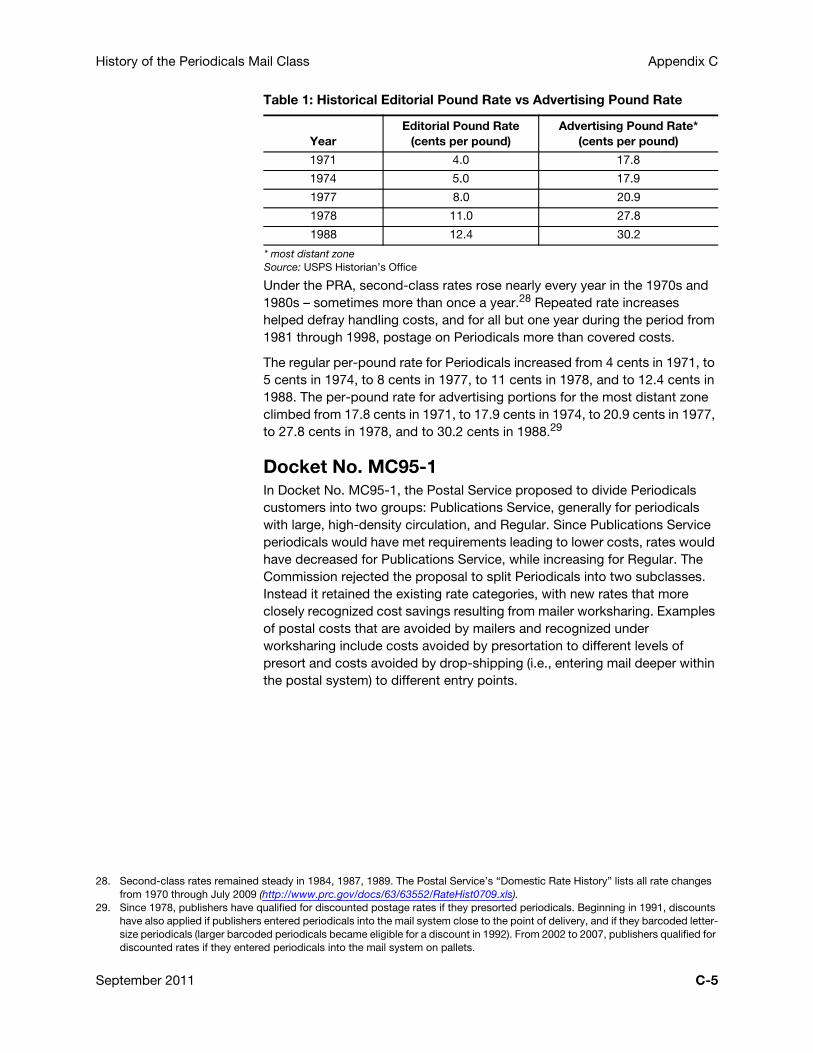
History of the Periodicals Mail Class Appendix C
Table 1: Historical Editorial Pound Rate vs Advertising Pound Rate
* most distant zoneSource: USPS Historian’s Office
Under the PRA, second-class rates rose nearly every year in the 1970s and 1980s – sometimes more than once a year.28 Repeated rate increases helped defray handling costs, and for all but one year during the period from 1981 through 1998, postage on Periodicals more than covered costs.
The regular per-pound rate for Periodicals increased from 4 cents in 1971, to 5 cents in 1974, to 8 cents in 1977, to 11 cents in 1978, and to 12.4 cents in 1988. The per-pound rate for advertising portions for the most distant zone climbed from 17.8 cents in 1971, to 17.9 cents in 1974, to 20.9 cents in 1977, to 27.8 cents in 1978, and to 30.2 cents in 1988.29
Docket No. MC95-1In Docket No. MC95-1, the Postal Service proposed to divide Periodicals customers into two groups: Publications Service, generally for periodicals with large, high-density circulation, and Regular. Since Publications Service periodicals would have met requirements leading to lower costs, rates would have decreased for Publications Service, while increasing for Regular. The Commission rejected the proposal to split Periodicals into two subclasses. Instead it retained the existing rate categories, with new rates that more closely recognized cost savings resulting from mailer worksharing. Examples of postal costs that are avoided by mailers and recognized under worksharing include costs avoided by presortation to different levels of presort and costs avoided by drop-shipping (i.e., entering mail deeper within the postal system) to different entry points.
YearEditorial Pound Rate
(cents per pound)Advertising Pound Rate*
(cents per pound)
1971 4.0 17.8
1974 5.0 17.9
1977 8.0 20.9
1978 11.0 27.8
1988 12.4 30.2
28. Second-class rates remained steady in 1984, 1987, 1989. The Postal Service’s “Domestic Rate History” lists all rate changes from 1970 through July 2009 (http://www.prc.gov/docs/63/63552/RateHist0709.xls).
29. Since 1978, publishers have qualified for discounted postage rates if they presorted periodicals. Beginning in 1991, discounts have also applied if publishers entered periodicals into the mail system close to the point of delivery, and if they barcoded letter-size periodicals (larger barcoded periodicals became eligible for a discount in 1992). From 2002 to 2007, publishers qualified for discounted rates if they entered periodicals into the mail system on pallets.
September 2011 C-5
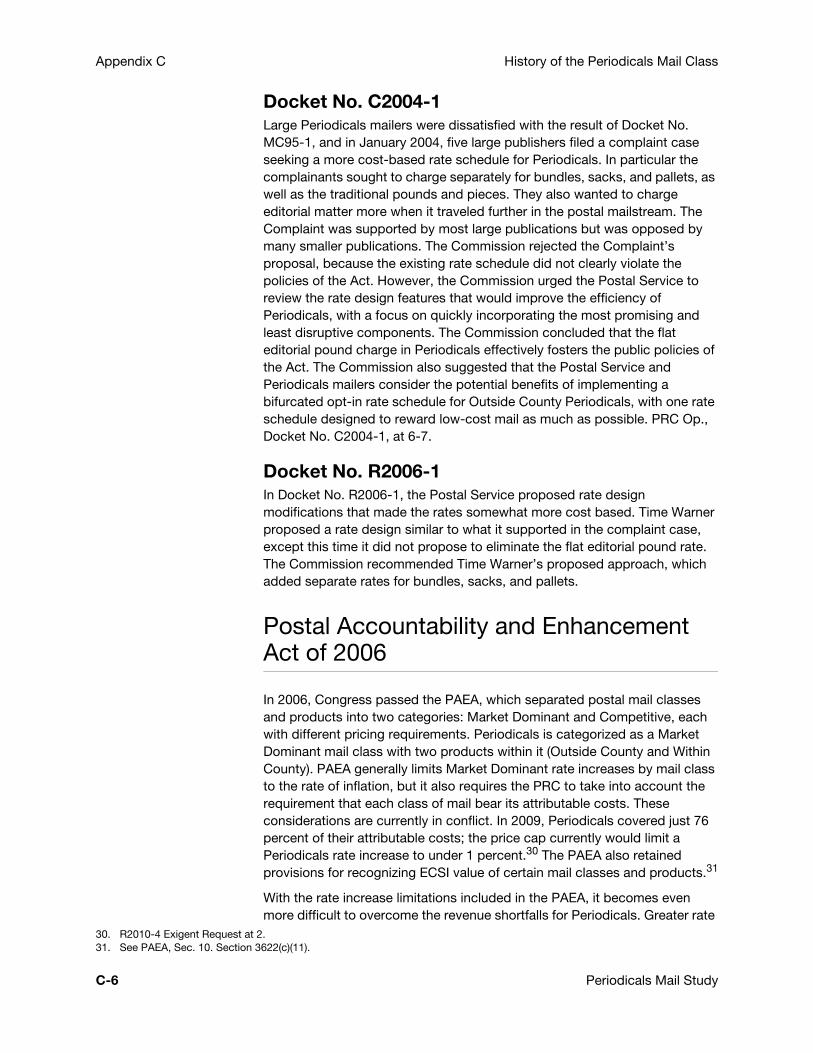
Appendix C History of the Periodicals Mail Class
Docket No. C2004-1Large Periodicals mailers were dissatisfied with the result of Docket No. MC95-1, and in January 2004, five large publishers filed a complaint case seeking a more cost-based rate schedule for Periodicals. In particular the complainants sought to charge separately for bundles, sacks, and pallets, as well as the traditional pounds and pieces. They also wanted to charge editorial matter more when it traveled further in the postal mailstream. The Complaint was supported by most large publications but was opposed by many smaller publications. The Commission rejected the Complaint’s proposal, because the existing rate schedule did not clearly violate the policies of the Act. However, the Commission urged the Postal Service to review the rate design features that would improve the efficiency of Periodicals, with a focus on quickly incorporating the most promising and least disruptive components. The Commission concluded that the flat editorial pound charge in Periodicals effectively fosters the public policies of the Act. The Commission also suggested that the Postal Service and Periodicals mailers consider the potential benefits of implementing a bifurcated opt-in rate schedule for Outside County Periodicals, with one rate schedule designed to reward low-cost mail as much as possible. PRC Op., Docket No. C2004-1, at 6-7.
Docket No. R2006-1In Docket No. R2006-1, the Postal Service proposed rate design modifications that made the rates somewhat more cost based. Time Warner proposed a rate design similar to what it supported in the complaint case, except this time it did not propose to eliminate the flat editorial pound rate. The Commission recommended Time Warner’s proposed approach, which added separate rates for bundles, sacks, and pallets.
Postal Accountability and Enhancement Act of 2006
In 2006, Congress passed the PAEA, which separated postal mail classes and products into two categories: Market Dominant and Competitive, each with different pricing requirements. Periodicals is categorized as a Market Dominant mail class with two products within it (Outside County and Within County). PAEA generally limits Market Dominant rate increases by mail class to the rate of inflation, but it also requires the PRC to take into account the requirement that each class of mail bear its attributable costs. These considerations are currently in conflict. In 2009, Periodicals covered just 76 percent of their attributable costs; the price cap currently would limit a Periodicals rate increase to under 1 percent.30 The PAEA also retained provisions for recognizing ECSI value of certain mail classes and products.31
With the rate increase limitations included in the PAEA, it becomes even more difficult to overcome the revenue shortfalls for Periodicals. Greater rate
30. R2010-4 Exigent Request at 2.31. See PAEA, Sec. 10. Section 3622(c)(11).
C-6 Periodicals Mail Study
History of the Periodicals Mail Class Appendix C
increases would be needed to cover costs, and even with greater increases costs might still not be covered if too much volume loss resulted. Periodicals have cost more than the postage charged for them for most of U.S. history.
September 2011 C-7

Appendix C
This page intentionally left blank
C-8 Periodicals Mail Study

Appendix D Periodicals Industry Overview
Print has always been the dominate medium for periodicals, and while it continues to be, digital editions are becoming increasingly popular. Customers’ desire for digital editions will affect how publishers market, distribute, and position their publications. The Magazine and Periodical Publishing Industry revenue is estimated by IBIS World Report to have decreased at an average annualized real rate of 3.5 pecent from 2006–2011 to a total industry size of $42.6 billion.32 The report predicts revenue growth of 1.3 percent over the next 5 years, including digital publishing. Increasing consolidation is predicted as economies of scale become more important and profit margins fall.
The number of print magazines grew from 17,694 in 2001 to 20,707 in 2010 according to the National Directory of Magazines, 2011. Trends by category highlight the volume shift toward specialized titles and away from general interest publications. The Magazine Publishers of America (MPA) data show 53 more consumer magazines were launched in the North America in 2010, compared to 2009.33
Publishers predominately receive revenues from advertising and paid subscriptions but also from single copy sales. Periodicals offer a well-defined (and in many cases, audited) readership in terms of interests, demographics, and psychographics, which makes them very attractive vehicles for targeted advertising dollars. Trade magazines generally receive revenue from advertisers only, and can be more susceptible to advertising spend contraction than other types of Periodicals. Advertising is very sensitive to economic conditions. As print circulation has declined due in large part to decreased disposable income and/or cheaper or more efficient delivery methods, both consumer and trade periodicals publishers have been forced to reduce what they can charge for print advertising. Declines in advertising revenue directly hurt profitability of the industry, giving rise to consolidations, closings, and employee lay-offs.
32. IBIS World Industry Report, Magazine and Periodical Publishing in the U.S., May 2011, NAICS 51112, pg. 1.33. MPA Magazine Media Factbook, 2011/2012.
September 2011 D-1
Appendix D Periodicals Industry Overview
Competition for Periodicals Delivery
While the majority of print magazines and many newspapers are delivered via mail, others are sold through traditional retail channels (newsstands, grocery stores, etc.). More than half of current subscribers that renewed did so with a digital product.34 Some publications have suspended their print subscriptions and are now web-only publications.35
The number of magazines with websites has increased 30 percent to 7,031 from 2006 to 2011.36 Many or most of these websites complement specific print periodicals, but some periodicals are available only via electronic delivery. Anecdotal evidence suggests that most scientific and technical journal titles are no longer available in printed form because of the high expense in producing a relatively small number of copies per issue. Once the investment in a digital platform has been made, costs for digital delivery are very low. eReaders such as Apple’s iPad, Amazon’s Kindle, Sony’s Reader and Barnes and Noble’s Nook are changing the way individuals and businesses communicate with each other. From April 2010 through April 2011 magazine-related iPad apps increased from 36 to 485. 37
Overall, the increasing trends toward development of more specialized publications and the decline of general interest magazines appears to be accelerating, as does interest in electronic technology, especially given the adoption of new delivery methods by younger consumers and target audiences.
Industry trends and digital competition suggest that publishers are looking for low-cost delivery methods and new ways of reaching target groups. These general trends do not suggest an increased use of the mail for delivery; rather they highlight sensitivity to delivery costs and postage prices.
34. Next Issue Media, 2010.35. These include U.S. Business Review, Playgirl, and Christian Science Monitor. 36. MPA Magazine Media Factbook, 2011/2012.37. McPheters & Co. iMonitor, 2011.
D-2 Periodicals Mail Study
Appendix E Pieces of Mail Handled, Number of Post Offices, Income, and Expenses 1789 to 2010
September 2011 E-1

Appendix E
This page intentionally left blank
E-2 Periodicals Mail Study
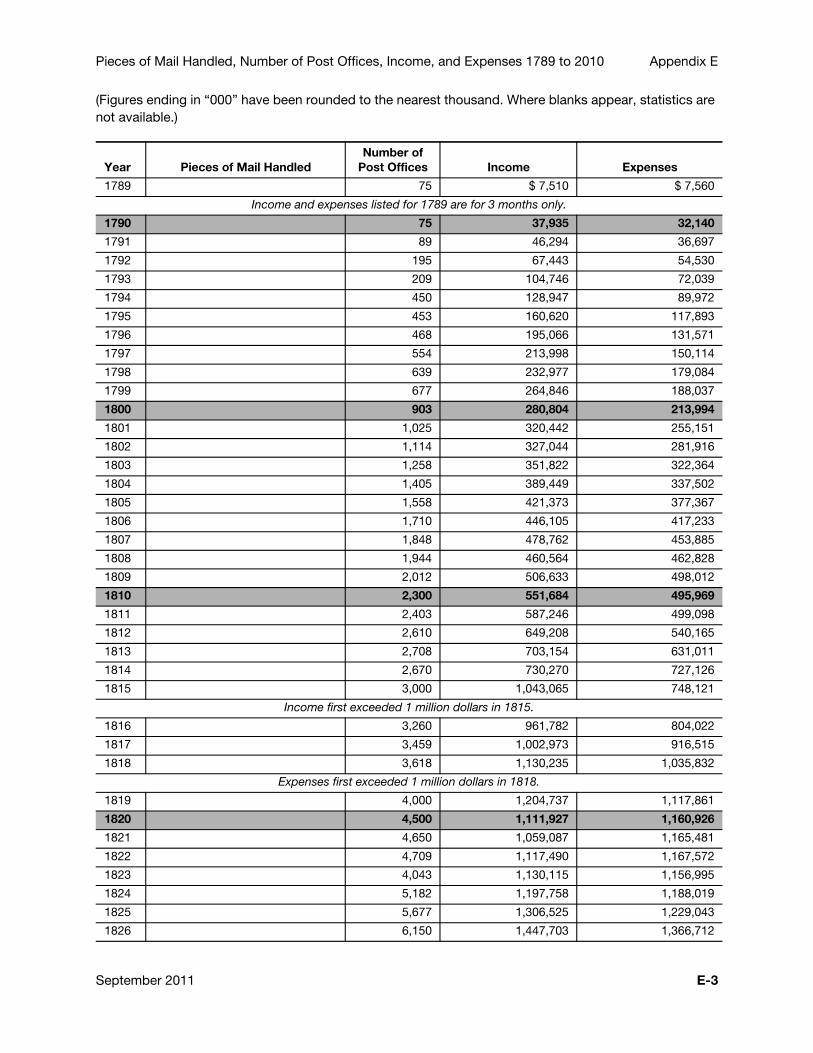
Pieces of Mail Handled, Number of Post Offices, Income, and Expenses 1789 to 2010 Appendix E
(Figures ending in “000” have been rounded to the nearest thousand. Where blanks appear, statistics are not available.)
Year Pieces of Mail HandledNumber of
Post Offices Income Expenses
1789 75 $ 7,510 $ 7,560
Income and expenses listed for 1789 are for 3 months only.
1790 75 37,935 32,140
1791 89 46,294 36,697
1792 195 67,443 54,530
1793 209 104,746 72,039
1794 450 128,947 89,972
1795 453 160,620 117,893
1796 468 195,066 131,571
1797 554 213,998 150,114
1798 639 232,977 179,084
1799 677 264,846 188,037
1800 903 280,804 213,994
1801 1,025 320,442 255,151
1802 1,114 327,044 281,916
1803 1,258 351,822 322,364
1804 1,405 389,449 337,502
1805 1,558 421,373 377,367
1806 1,710 446,105 417,233
1807 1,848 478,762 453,885
1808 1,944 460,564 462,828
1809 2,012 506,633 498,012
1810 2,300 551,684 495,969
1811 2,403 587,246 499,098
1812 2,610 649,208 540,165
1813 2,708 703,154 631,011
1814 2,670 730,270 727,126
1815 3,000 1,043,065 748,121
Income first exceeded 1 million dollars in 1815.
1816 3,260 961,782 804,022
1817 3,459 1,002,973 916,515
1818 3,618 1,130,235 1,035,832
Expenses first exceeded 1 million dollars in 1818.
1819 4,000 1,204,737 1,117,861
1820 4,500 1,111,927 1,160,926
1821 4,650 1,059,087 1,165,481
1822 4,709 1,117,490 1,167,572
1823 4,043 1,130,115 1,156,995
1824 5,182 1,197,758 1,188,019
1825 5,677 1,306,525 1,229,043
1826 6,150 1,447,703 1,366,712
September 2011 E-3

Appendix E Pieces of Mail Handled, Number of Post Offices, Income, and Expenses 1789 to 2010
1827 7,300 1,524,633 1,469,959
1828 7,530 1,659,915 1,689,945
1829 8,004 1,707,418 1,782,132
1830 8,450 1,850,583 1,932,708
1831 8,686 1,997,811 1,936,122
1832 9,205 2,258,570 2,266,171
1833 10,127 2,617,011 2,930,414
1834 10,693 2,823,749 2,910,605
1835 10,770 2,993,556 2,757,350
1836 11,091 3,408,323 2,841,766
1837 11,767 4,101,703 3,288,319
1838 12,519 4,238,733 4,430,662
1839 12,780 4,484,657 4,636,536
1840 13,468 4,543,522 4,718,236
1841 13,778 4,407,726 4,499,687
1842 13,733 4,546,850 4,627,717
1843 13,814 4,296,225 4,374,754
1844 14,103 4,237,288 4,298,513
1845 14,183 4,289,842 4,320,732
1846 14,601 3,487,199 4,076,037
1847 124,173,000 15,146 3,880,309 3,979,542
1848 16,159 4,555,211 4,326,850
1849 16,749 4,705,176 4,479,049
1850 18,417 5,499,985 5,212,953
1851 19,796 6,410,601 6,278,402
1852 20,901 5,184,526 7,108,459
1853 22,320 5,240,725 7,982,757
1854 23,548 6,255,586 8,577,424
1855 24,410 6,642,136 9,968,342
1856 25,565 6,920,822 10,405,286
1857 26,586 7,353,952 11,508,058
1858 27,977 7,486,793 12,722,470
1859 28,539 7,968,484 15,754,093
1860 28,498 8,518,067 14,874,601
1861 28,586 8,349,296 13,606,759
1862 28,875 8,299,821 11,125,364
1863 29,047 11,163,790 11,314,207
1864 28,878 12,438,254 12,644,786
1865 28,882 14,556,159 13,694,728
1866 29,389 14,386,986 15,352,079
1867 25,163 15,237,027 19,235,483
1868 26,481 16,292,001 22,730,793
1869 27,106 17,314,176 23,698,132
1870 28,492 18,879,537 23,998,838
1871 30,045 20,037,045 24,390,104
1872 31,863 21,915,426 26,658,192
E-4 Periodicals Mail Study
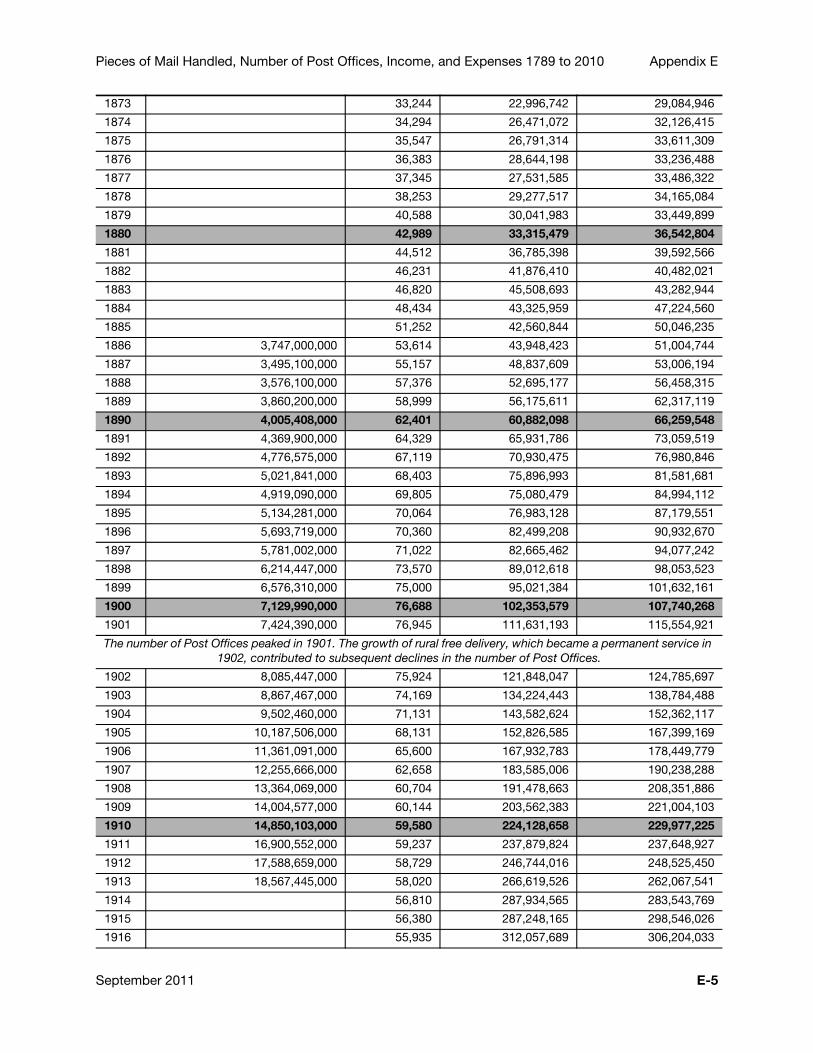
Pieces of Mail Handled, Number of Post Offices, Income, and Expenses 1789 to 2010 Appendix E
1873 33,244 22,996,742 29,084,946
1874 34,294 26,471,072 32,126,415
1875 35,547 26,791,314 33,611,309
1876 36,383 28,644,198 33,236,488
1877 37,345 27,531,585 33,486,322
1878 38,253 29,277,517 34,165,084
1879 40,588 30,041,983 33,449,899
1880 42,989 33,315,479 36,542,804
1881 44,512 36,785,398 39,592,566
1882 46,231 41,876,410 40,482,021
1883 46,820 45,508,693 43,282,944
1884 48,434 43,325,959 47,224,560
1885 51,252 42,560,844 50,046,235
1886 3,747,000,000 53,614 43,948,423 51,004,744
1887 3,495,100,000 55,157 48,837,609 53,006,194
1888 3,576,100,000 57,376 52,695,177 56,458,315
1889 3,860,200,000 58,999 56,175,611 62,317,119
1890 4,005,408,000 62,401 60,882,098 66,259,548
1891 4,369,900,000 64,329 65,931,786 73,059,519
1892 4,776,575,000 67,119 70,930,475 76,980,846
1893 5,021,841,000 68,403 75,896,993 81,581,681
1894 4,919,090,000 69,805 75,080,479 84,994,112
1895 5,134,281,000 70,064 76,983,128 87,179,551
1896 5,693,719,000 70,360 82,499,208 90,932,670
1897 5,781,002,000 71,022 82,665,462 94,077,242
1898 6,214,447,000 73,570 89,012,618 98,053,523
1899 6,576,310,000 75,000 95,021,384 101,632,161
1900 7,129,990,000 76,688 102,353,579 107,740,268
1901 7,424,390,000 76,945 111,631,193 115,554,921
The number of Post Offices peaked in 1901. The growth of rural free delivery, which became a permanent service in 1902, contributed to subsequent declines in the number of Post Offices.
1902 8,085,447,000 75,924 121,848,047 124,785,697
1903 8,867,467,000 74,169 134,224,443 138,784,488
1904 9,502,460,000 71,131 143,582,624 152,362,117
1905 10,187,506,000 68,131 152,826,585 167,399,169
1906 11,361,091,000 65,600 167,932,783 178,449,779
1907 12,255,666,000 62,658 183,585,006 190,238,288
1908 13,364,069,000 60,704 191,478,663 208,351,886
1909 14,004,577,000 60,144 203,562,383 221,004,103
1910 14,850,103,000 59,580 224,128,658 229,977,225
1911 16,900,552,000 59,237 237,879,824 237,648,927
1912 17,588,659,000 58,729 246,744,016 248,525,450
1913 18,567,445,000 58,020 266,619,526 262,067,541
1914 56,810 287,934,565 283,543,769
1915 56,380 287,248,165 298,546,026
1916 55,935 312,057,689 306,204,033
September 2011 E-5
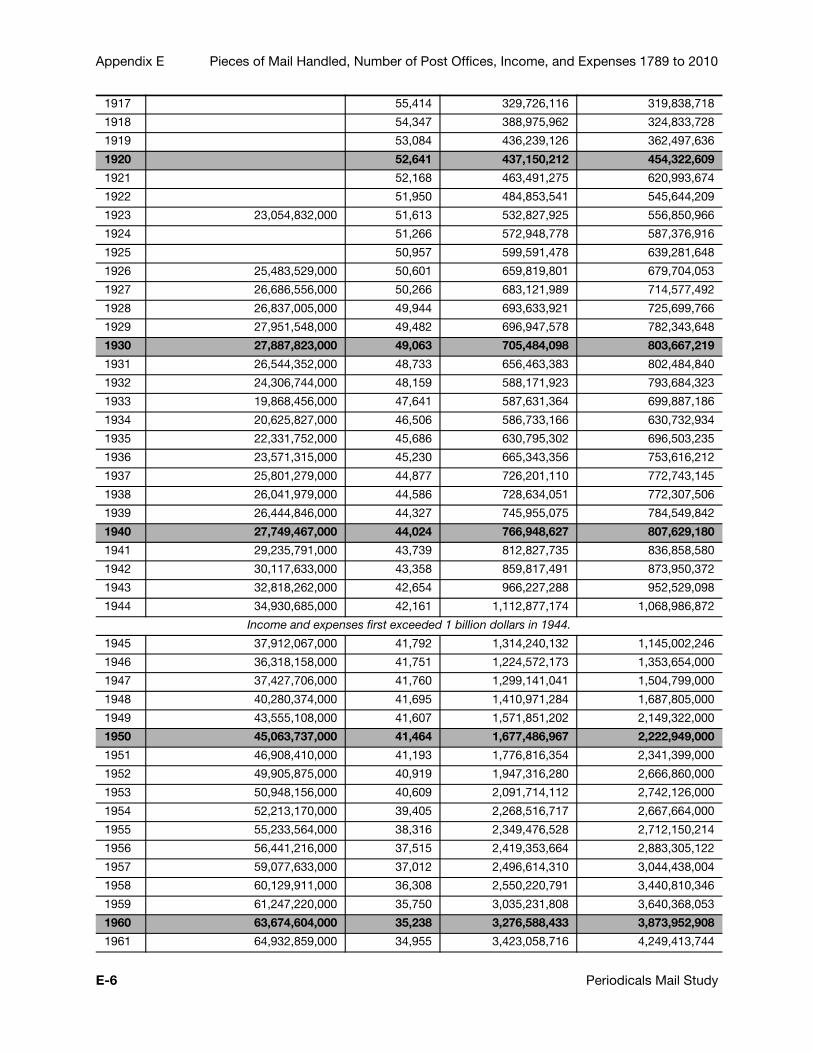
Appendix E Pieces of Mail Handled, Number of Post Offices, Income, and Expenses 1789 to 2010
1917 55,414 329,726,116 319,838,718
1918 54,347 388,975,962 324,833,728
1919 53,084 436,239,126 362,497,636
1920 52,641 437,150,212 454,322,609
1921 52,168 463,491,275 620,993,674
1922 51,950 484,853,541 545,644,209
1923 23,054,832,000 51,613 532,827,925 556,850,966
1924 51,266 572,948,778 587,376,916
1925 50,957 599,591,478 639,281,648
1926 25,483,529,000 50,601 659,819,801 679,704,053
1927 26,686,556,000 50,266 683,121,989 714,577,492
1928 26,837,005,000 49,944 693,633,921 725,699,766
1929 27,951,548,000 49,482 696,947,578 782,343,648
1930 27,887,823,000 49,063 705,484,098 803,667,219
1931 26,544,352,000 48,733 656,463,383 802,484,840
1932 24,306,744,000 48,159 588,171,923 793,684,323
1933 19,868,456,000 47,641 587,631,364 699,887,186
1934 20,625,827,000 46,506 586,733,166 630,732,934
1935 22,331,752,000 45,686 630,795,302 696,503,235
1936 23,571,315,000 45,230 665,343,356 753,616,212
1937 25,801,279,000 44,877 726,201,110 772,743,145
1938 26,041,979,000 44,586 728,634,051 772,307,506
1939 26,444,846,000 44,327 745,955,075 784,549,842
1940 27,749,467,000 44,024 766,948,627 807,629,180
1941 29,235,791,000 43,739 812,827,735 836,858,580
1942 30,117,633,000 43,358 859,817,491 873,950,372
1943 32,818,262,000 42,654 966,227,288 952,529,098
1944 34,930,685,000 42,161 1,112,877,174 1,068,986,872
Income and expenses first exceeded 1 billion dollars in 1944.
1945 37,912,067,000 41,792 1,314,240,132 1,145,002,246
1946 36,318,158,000 41,751 1,224,572,173 1,353,654,000
1947 37,427,706,000 41,760 1,299,141,041 1,504,799,000
1948 40,280,374,000 41,695 1,410,971,284 1,687,805,000
1949 43,555,108,000 41,607 1,571,851,202 2,149,322,000
1950 45,063,737,000 41,464 1,677,486,967 2,222,949,000
1951 46,908,410,000 41,193 1,776,816,354 2,341,399,000
1952 49,905,875,000 40,919 1,947,316,280 2,666,860,000
1953 50,948,156,000 40,609 2,091,714,112 2,742,126,000
1954 52,213,170,000 39,405 2,268,516,717 2,667,664,000
1955 55,233,564,000 38,316 2,349,476,528 2,712,150,214
1956 56,441,216,000 37,515 2,419,353,664 2,883,305,122
1957 59,077,633,000 37,012 2,496,614,310 3,044,438,004
1958 60,129,911,000 36,308 2,550,220,791 3,440,810,346
1959 61,247,220,000 35,750 3,035,231,808 3,640,368,053
1960 63,674,604,000 35,238 3,276,588,433 3,873,952,908
1961 64,932,859,000 34,955 3,423,058,716 4,249,413,744
E-6 Periodicals Mail Study
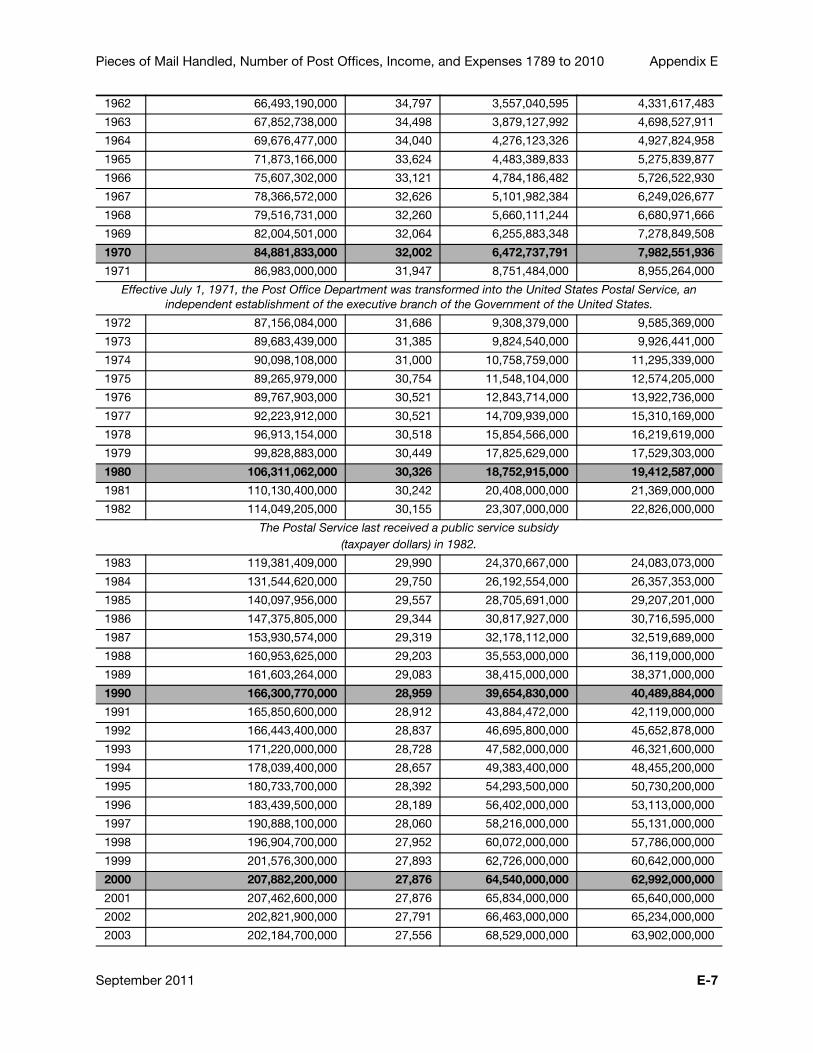
Pieces of Mail Handled, Number of Post Offices, Income, and Expenses 1789 to 2010 Appendix E
1962 66,493,190,000 34,797 3,557,040,595 4,331,617,483
1963 67,852,738,000 34,498 3,879,127,992 4,698,527,911
1964 69,676,477,000 34,040 4,276,123,326 4,927,824,958
1965 71,873,166,000 33,624 4,483,389,833 5,275,839,877
1966 75,607,302,000 33,121 4,784,186,482 5,726,522,930
1967 78,366,572,000 32,626 5,101,982,384 6,249,026,677
1968 79,516,731,000 32,260 5,660,111,244 6,680,971,666
1969 82,004,501,000 32,064 6,255,883,348 7,278,849,508
1970 84,881,833,000 32,002 6,472,737,791 7,982,551,936
1971 86,983,000,000 31,947 8,751,484,000 8,955,264,000
Effective July 1, 1971, the Post Office Department was transformed into the United States Postal Service, an independent establishment of the executive branch of the Government of the United States.
1972 87,156,084,000 31,686 9,308,379,000 9,585,369,000
1973 89,683,439,000 31,385 9,824,540,000 9,926,441,000
1974 90,098,108,000 31,000 10,758,759,000 11,295,339,000
1975 89,265,979,000 30,754 11,548,104,000 12,574,205,000
1976 89,767,903,000 30,521 12,843,714,000 13,922,736,000
1977 92,223,912,000 30,521 14,709,939,000 15,310,169,000
1978 96,913,154,000 30,518 15,854,566,000 16,219,619,000
1979 99,828,883,000 30,449 17,825,629,000 17,529,303,000
1980 106,311,062,000 30,326 18,752,915,000 19,412,587,000
1981 110,130,400,000 30,242 20,408,000,000 21,369,000,000
1982 114,049,205,000 30,155 23,307,000,000 22,826,000,000
The Postal Service last received a public service subsidy (taxpayer dollars) in 1982.
1983 119,381,409,000 29,990 24,370,667,000 24,083,073,000
1984 131,544,620,000 29,750 26,192,554,000 26,357,353,000
1985 140,097,956,000 29,557 28,705,691,000 29,207,201,000
1986 147,375,805,000 29,344 30,817,927,000 30,716,595,000
1987 153,930,574,000 29,319 32,178,112,000 32,519,689,000
1988 160,953,625,000 29,203 35,553,000,000 36,119,000,000
1989 161,603,264,000 29,083 38,415,000,000 38,371,000,000
1990 166,300,770,000 28,959 39,654,830,000 40,489,884,000
1991 165,850,600,000 28,912 43,884,472,000 42,119,000,000
1992 166,443,400,000 28,837 46,695,800,000 45,652,878,000
1993 171,220,000,000 28,728 47,582,000,000 46,321,600,000
1994 178,039,400,000 28,657 49,383,400,000 48,455,200,000
1995 180,733,700,000 28,392 54,293,500,000 50,730,200,000
1996 183,439,500,000 28,189 56,402,000,000 53,113,000,000
1997 190,888,100,000 28,060 58,216,000,000 55,131,000,000
1998 196,904,700,000 27,952 60,072,000,000 57,786,000,000
1999 201,576,300,000 27,893 62,726,000,000 60,642,000,000
2000 207,882,200,000 27,876 64,540,000,000 62,992,000,000
2001 207,462,600,000 27,876 65,834,000,000 65,640,000,000
2002 202,821,900,000 27,791 66,463,000,000 65,234,000,000
2003 202,184,700,000 27,556 68,529,000,000 63,902,000,000
September 2011 E-7
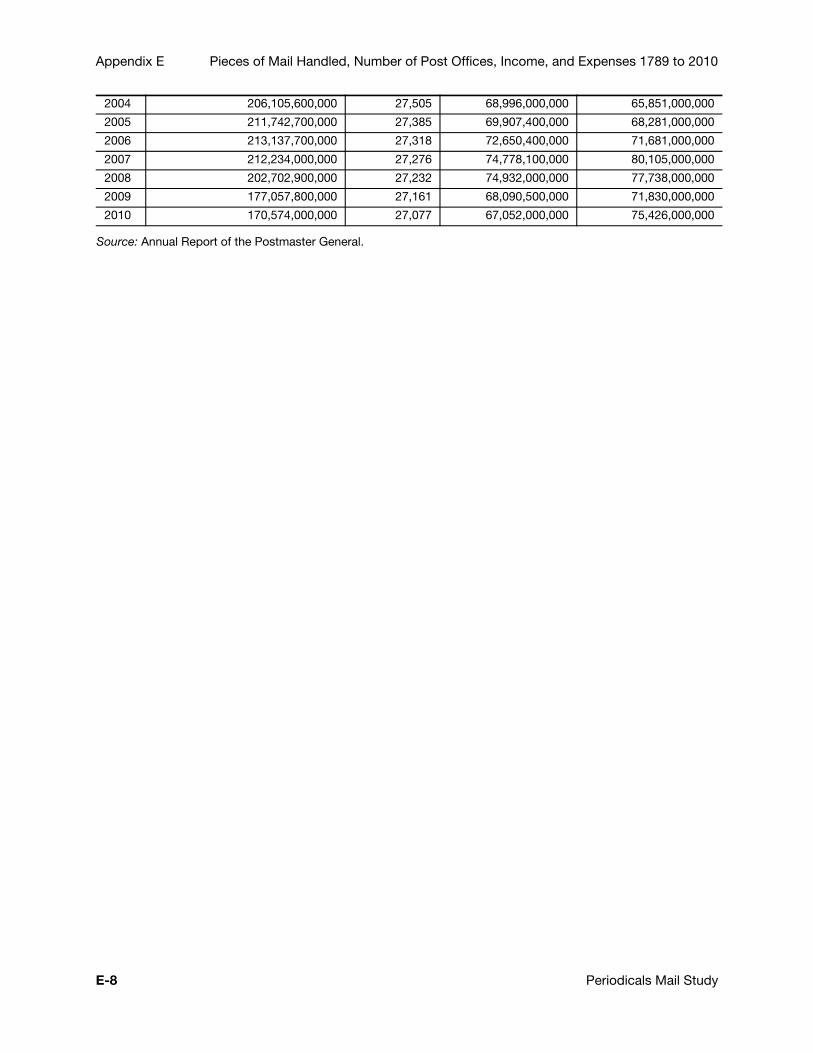
Appendix E Pieces of Mail Handled, Number of Post Offices, Income, and Expenses 1789 to 2010
Source: Annual Report of the Postmaster General.
2004 206,105,600,000 27,505 68,996,000,000 65,851,000,000
2005 211,742,700,000 27,385 69,907,400,000 68,281,000,000
2006 213,137,700,000 27,318 72,650,400,000 71,681,000,000
2007 212,234,000,000 27,276 74,778,100,000 80,105,000,000
2008 202,702,900,000 27,232 74,932,000,000 77,738,000,000
2009 177,057,800,000 27,161 68,090,500,000 71,830,000,000
2010 170,574,000,000 27,077 67,052,000,000 75,426,000,000
E-8 Periodicals Mail Study
Appendix F Total Periodicals Historical Volume And Revenue
September 2011 F-1

Appendix F
This page intentionally left blank
F-2 Periodicals Mail Study
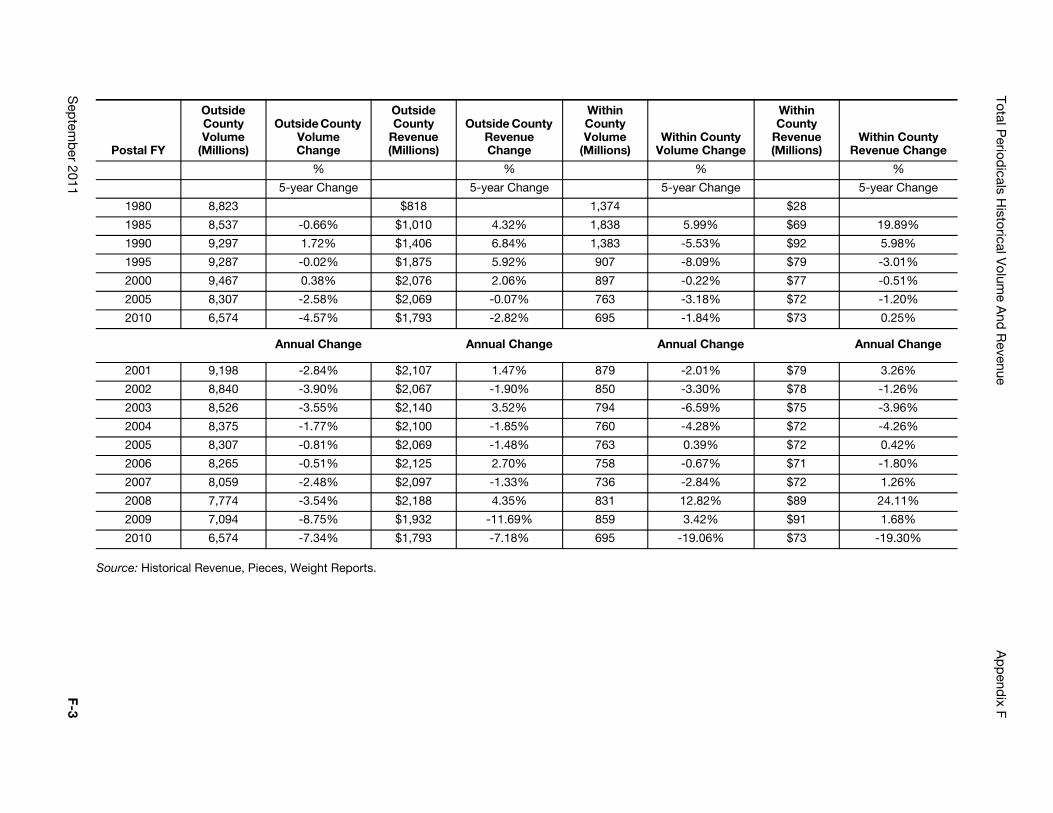
Total Period
icals Historical V
olume A
nd R
evenueA
pp
endix F
Sep
temb
er 2011F-3
ty ge
Within County
Revenue (Millions)
Within County Revenue Change
%
e 5-year Change
$28
$69 19.89%
$92 5.98%
$79 -3.01%
$77 -0.51%
$72 -1.20%
$73 0.25%
e Annual Change
$79 3.26%
$78 -1.26%
$75 -3.96%
$72 -4.26%
$72 0.42%
$71 -1.80%
$72 1.26%
$89 24.11%
$91 1.68%
$73 -19.30%
Source: Historical Revenue, Pieces, Weight Reports.
Postal FY
Outside County Volume
(Millions)
Outside County Volume Change
Outside County
Revenue (Millions)
Outside County Revenue Change
Within County Volume
(Millions)Within Coun
Volume Chan
% % %
5-year Change 5-year Change 5-year Chang
1980 8,823 $818 1,374
1985 8,537 -0.66% $1,010 4.32% 1,838 5.99%
1990 9,297 1.72% $1,406 6.84% 1,383 -5.53%
1995 9,287 -0.02% $1,875 5.92% 907 -8.09%
2000 9,467 0.38% $2,076 2.06% 897 -0.22%
2005 8,307 -2.58% $2,069 -0.07% 763 -3.18%
2010 6,574 -4.57% $1,793 -2.82% 695 -1.84%
Annual Change Annual Change Annual Chang
2001 9,198 -2.84% $2,107 1.47% 879 -2.01%
2002 8,840 -3.90% $2,067 -1.90% 850 -3.30%
2003 8,526 -3.55% $2,140 3.52% 794 -6.59%
2004 8,375 -1.77% $2,100 -1.85% 760 -4.28%
2005 8,307 -0.81% $2,069 -1.48% 763 0.39%
2006 8,265 -0.51% $2,125 2.70% 758 -0.67%
2007 8,059 -2.48% $2,097 -1.33% 736 -2.84%
2008 7,774 -3.54% $2,188 4.35% 831 12.82%
2009 7,094 -8.75% $1,932 -11.69% 859 3.42%
2010 6,574 -7.34% $1,793 -7.18% 695 -19.06%

Appendix F
This page intentionally left blank
F-4 Periodicals Mail Study
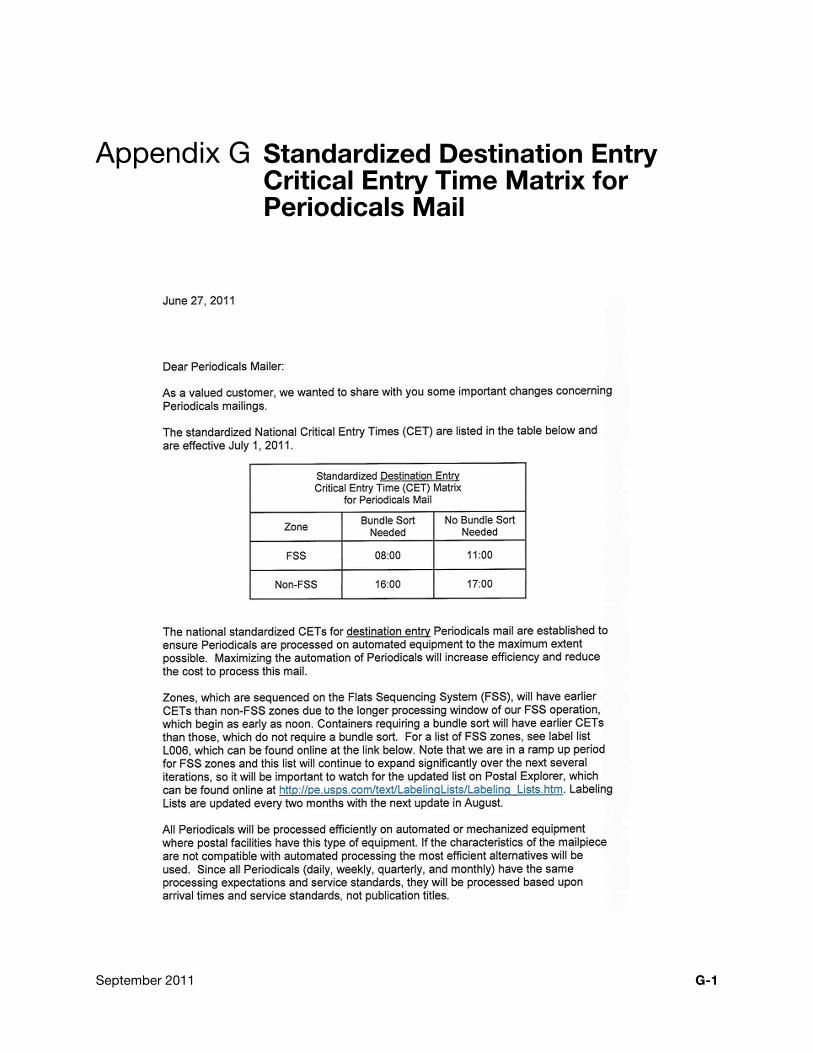
Appendix G Standardized Destination Entry Critical Entry Time Matrix for Periodicals Mail
September 2011 G-1
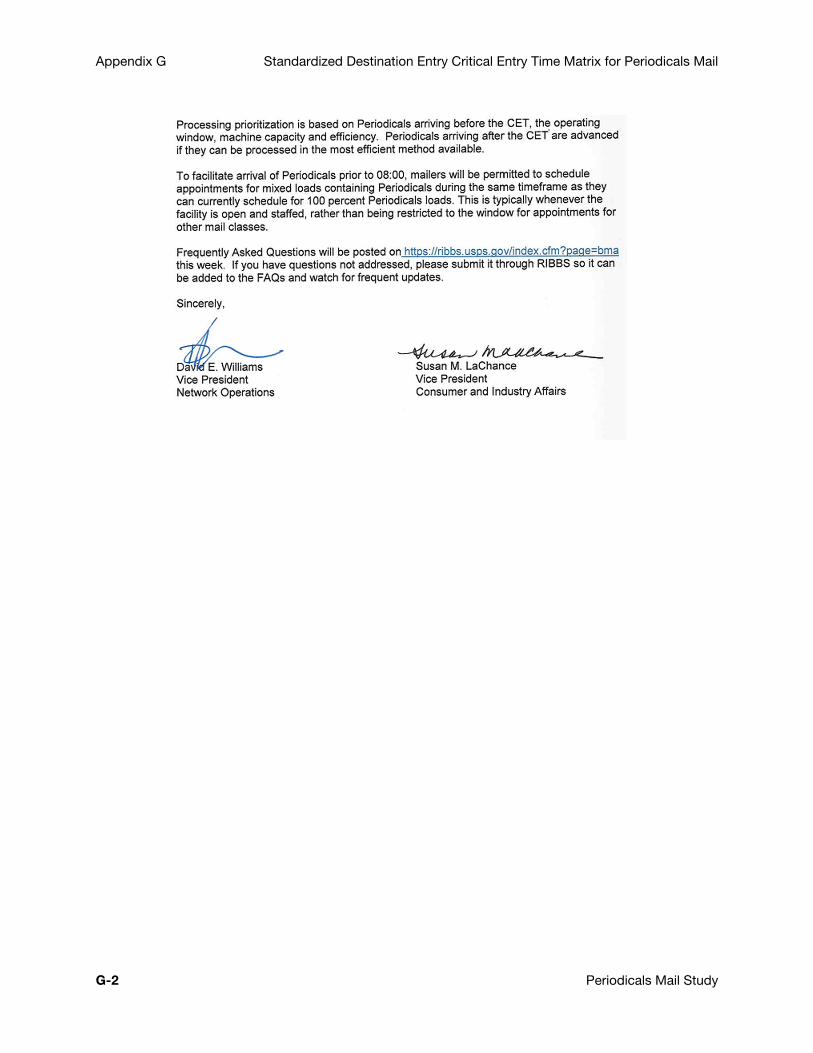
Appendix G Standardized Destination Entry Critical Entry Time Matrix for Periodicals Mail
G-2 Periodicals Mail Study
Appendix H Select Mailer Interviews and Feedback
Comments on Pricing
Several suggestions related to pricing were made during discussions with a small number of mailers. It should be noted that many or most of these suggestions have been discussed with the Postal Service and the Commission in the past, and some have been litigated.
Pallet RateSome mailers said that theoretically, 100 percent of Periodicals could be entered on pallets but the rate structure makes it cheaper to present some mail in sacks. The requirement to make a pallet when weight exceeds 500 pounds is inflexible and the money saved by forming a pallet could be less than that saved by reducing bundles. Since they believe that bundle costs are more accurate than pallet costs, they recommend that the Postal Service drop the 500-lb. requirement.
Pound RateIn meetings it was stated that in 1970, virtually all of Periodicals revenue came from the pound rates, although there was a minimum-per-piece rate of 1.3 cents. Piece rates were instituted in 1974. Since then, the importance of piece rates in pricing has increased. Thus, lightweight pieces take a hit, while heavy pieces (which include many with large quantities of advertising) get a relatively low increase.
Others said that the role of pound rates is complicated because of the flat editorial rate, and comparisons to Standard Mail rates are difficult for this reason and others. The pound rates in Standard are 2 or 3 times those in Periodicals. They recommended that before the Postal Service reduces the role of pound rates any further, it should provide a study showing that such a reduction is an appropriate step. It should also provide a discussion of associated policy issues. Another issue raised was that it is not clear whether the new model of bundles, sacks, containers, and tray points, fully captures pounds, and whether it is possible to separate pound costs from allied labor costs.
Piece Rates for Atypical PiecesSome mailers state that it would be worthwhile to examine closely the costs and rates for non-standard pieces. Some steps have already been taken but
September 2011 H-1

Appendix H Select Mailer Interviews and Feedback
more may be needed. The industry cannot afford to continue to support high-cost pieces at unduly low rates.
Dropship RatesSome mailers state that the dropship discounts need review. These are particularly important to weekly mailers. In order to get the service needed, dropshipping is essential. Destination-entry rates are important to local publications, including churches and other nonprofits. These mailers are paying unnecessarily high rates.
The dropship rates have a longer-term aspect to them. Prior to R2006-1, there was a 1.5 cents/piece dropship discount for pieces on pallets. This was not cost-based across lightweight and heavyweight publications and needed serious attention. It was dropped in R2006-1 in order to make way for the pallet charges. Specifically, the difference in the pallet rates across entry points was to provide much of the dropship discounts. However, the pallet charges are still well below cost and the dropship rates are suffering. It does not seem reasonable that a step to improve things should result in degraded dropship incentives. More progress on this is needed and was anticipated in R2006-1.
In some conversations, it was felt that the dropship discounts in Periodicals do not provide the correct incentives. Higher editorial content and pallet weight decrease the value of dropship to the point where many times it is cheaper to enter at origin. Some mailers do not think the discounts reflect the actual transportation savings to the Postal Service. They also suggest that the fixed editorial pound rate be eliminated and that weight-based discounts would help. Another idea included having full zone value be reflected in the discount (i.e., the new rate structure eliminated the dropship discount, and so mailers now do almost no dropshipping, which is costing them a lot more).
Ride Along RatesSome mailers suggested that Ride Along pieces should be free (at least for a trial period) to see if mailers could increase their advertising pounds. They state that this would benefit mailers and the Postal Service and suggest that the Postal Service should become more flexible about what it charges for inserts and for the content criteria for Ride-Along.
Comments on FSS
Several mailers stated that they had little hope that FSS would benefit them, either through improved service or reduced prices. There is some fear among mailers that FSS will increase rather than decrease costs. The mailers pointed out that they need to know what the FSS rates, requirements, and incentives will be before being able to assess the actual impacts. It should be noted that these comments were made prior to or early in FY 2010.
Over 50 percent of Periodicals are at the carrier-route rate, some due to co-mailing (a big investment to mailers). FSS affects bundle requirements and
H-2 Periodicals Mail Study
Select Mailer Interviews and Feedback Appendix H
may decrease the value of co-mailing. If the value of carrier route sort goes away there will be no reason to co-mail. Most SCFs with FSS machines will have some ZIP codes that are supported by the FSS and some that are not. This will result in separate mail preparation requirements for the same SCF. For ZIP codes supported by FSS, mail that is now entered as carrier route bundles will likely have to be prepared in larger non-carrier route bundles. If the bundles are too large (over 4 inches), bundle stability becomes an issue. Mailers expressed concerns that:
FSS prep trays are very expensive, and the Postal Service will not be lending them to mailers.
In some cases, FSS machines are not located in the SCF, requiring mailers to make two different stops.
FSS will lead to inconsistent critical entry times by entry unit, which would make planning difficult.
There will be more manual sorting at plant and by carrier.
Volume loss in flats may mean more backhauling to fewer FSS sites.
Transportation costs could offset sorting savings.
September 2011 H-3

Appendix H
This page intentionally left blank
H-4 Periodicals Mail Study

Appendix I Calculation of Amount of Applicable Change in CPI-U and Price
September 2011 I-1

Appendix I
This page intentionally left blank
I-2 Periodicals Mail Study
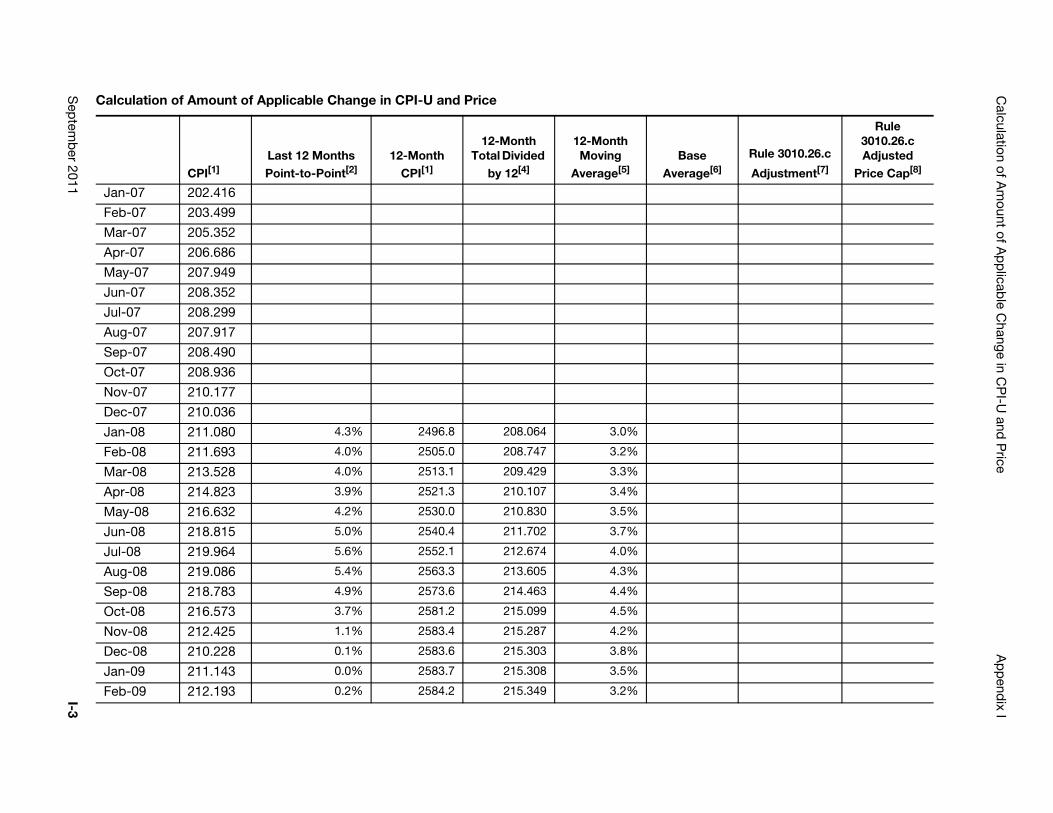
Calculation of A
mount of A
pp
licable C
hange in CP
I-U and
Price
Ap
pend
ix I
Sep
temb
er 2011I-3
Rule 3010.26.c
Adjustment[7]
Rule 3010.26.c Adjusted
Price Cap[8]
Calculation of Amount of Applicable Change in CPI-U and Price
CPI[1]Last 12 Months Point-to-Point[2]
12-Month CPI[1]
12-Month Total Divided
by 12[4]
12-Month Moving
Average[5]Base
Average[6]
Jan-07 202.416
Feb-07 203.499
Mar-07 205.352
Apr-07 206.686
May-07 207.949
Jun-07 208.352
Jul-07 208.299
Aug-07 207.917
Sep-07 208.490
Oct-07 208.936
Nov-07 210.177
Dec-07 210.036
Jan-08 211.080 4.3% 2496.8 208.064 3.0%
Feb-08 211.693 4.0% 2505.0 208.747 3.2%
Mar-08 213.528 4.0% 2513.1 209.429 3.3%
Apr-08 214.823 3.9% 2521.3 210.107 3.4%
May-08 216.632 4.2% 2530.0 210.830 3.5%
Jun-08 218.815 5.0% 2540.4 211.702 3.7%
Jul-08 219.964 5.6% 2552.1 212.674 4.0%
Aug-08 219.086 5.4% 2563.3 213.605 4.3%
Sep-08 218.783 4.9% 2573.6 214.463 4.4%
Oct-08 216.573 3.7% 2581.2 215.099 4.5%
Nov-08 212.425 1.1% 2583.4 215.287 4.2%
Dec-08 210.228 0.1% 2583.6 215.303 3.8%
Jan-09 211.143 0.0% 2583.7 215.308 3.5%
Feb-09 212.193 0.2% 2584.2 215.349 3.2%
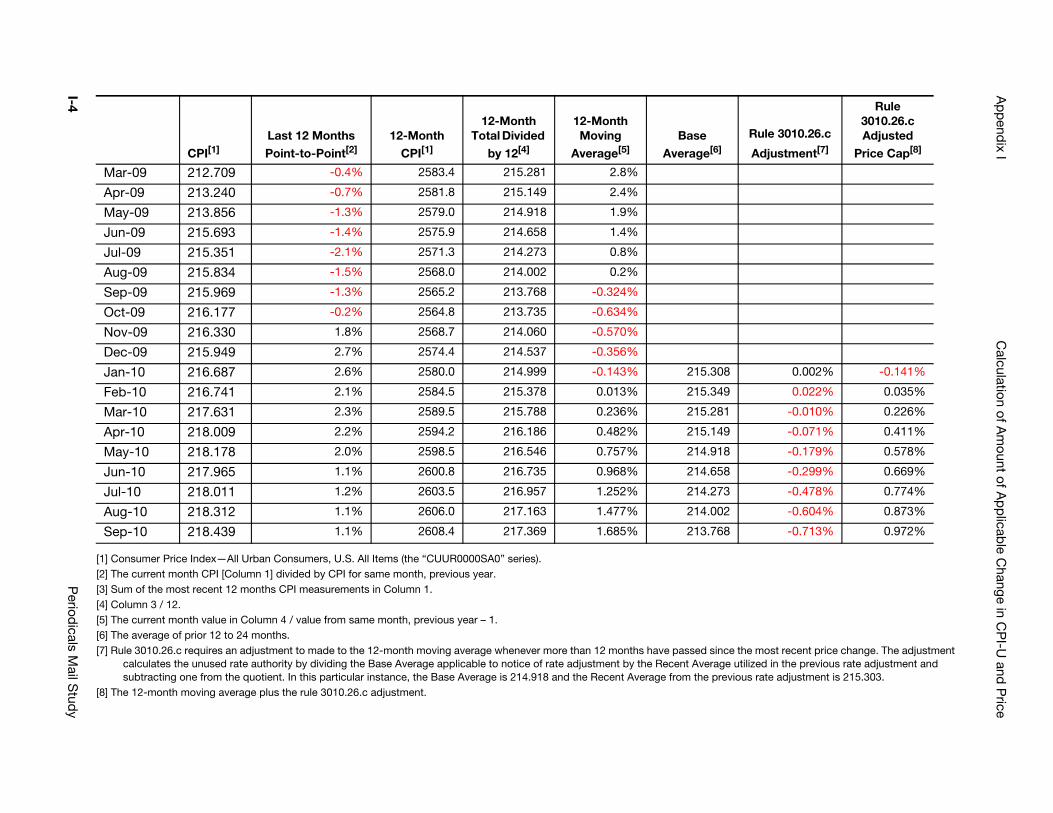
Ap
pend
ix IC
alculation of Am
ount of Ap
plicab
le Change in C
PI-U
and P
rice
I-4P
eriodicals M
ail Stud
y
the most recent price change. The adjustment utilized in the previous rate adjustment and ious rate adjustment is 215.303.
0.002% -0.141%
0.022% 0.035%
-0.010% 0.226%
-0.071% 0.411%
-0.179% 0.578%
-0.299% 0.669%
-0.478% 0.774%
-0.604% 0.873%
-0.713% 0.972%
Rule 3010.26.c
Adjustment[7]
Rule 3010.26.c Adjusted
Price Cap[8]
[1] Consumer Price Index—All Urban Consumers, U.S. All Items (the “CUUR0000SA0” series).[2] The current month CPI [Column 1] divided by CPI for same month, previous year.[3] Sum of the most recent 12 months CPI measurements in Column 1.[4] Column 3 / 12. [5] The current month value in Column 4 / value from same month, previous year – 1.[6] The average of prior 12 to 24 months.[7] Rule 3010.26.c requires an adjustment to made to the 12-month moving average whenever more than 12 months have passed since
calculates the unused rate authority by dividing the Base Average applicable to notice of rate adjustment by the Recent Averagesubtracting one from the quotient. In this particular instance, the Base Average is 214.918 and the Recent Average from the prev
[8] The 12-month moving average plus the rule 3010.26.c adjustment.
Mar-09 212.709 -0.4% 2583.4 215.281 2.8%
Apr-09 213.240 -0.7% 2581.8 215.149 2.4%
May-09 213.856 -1.3% 2579.0 214.918 1.9%
Jun-09 215.693 -1.4% 2575.9 214.658 1.4%
Jul-09 215.351 -2.1% 2571.3 214.273 0.8%
Aug-09 215.834 -1.5% 2568.0 214.002 0.2%
Sep-09 215.969 -1.3% 2565.2 213.768 -0.324%
Oct-09 216.177 -0.2% 2564.8 213.735 -0.634%
Nov-09 216.330 1.8% 2568.7 214.060 -0.570%
Dec-09 215.949 2.7% 2574.4 214.537 -0.356%
Jan-10 216.687 2.6% 2580.0 214.999 -0.143% 215.308
Feb-10 216.741 2.1% 2584.5 215.378 0.013% 215.349
Mar-10 217.631 2.3% 2589.5 215.788 0.236% 215.281
Apr-10 218.009 2.2% 2594.2 216.186 0.482% 215.149
May-10 218.178 2.0% 2598.5 216.546 0.757% 214.918
Jun-10 217.965 1.1% 2600.8 216.735 0.968% 214.658
Jul-10 218.011 1.2% 2603.5 216.957 1.252% 214.273
Aug-10 218.312 1.1% 2606.0 217.163 1.477% 214.002
Sep-10 218.439 1.1% 2608.4 217.369 1.685% 213.768
CPI[1]Last 12 Months Point-to-Point[2]
12-Month CPI[1]
12-Month Total Divided
by 12[4]
12-Month Moving
Average[5]Base
Average[6]
Appendix J Derivation of CVs of Unit Volume Variable Costs of Postal Products
The Cost and Revenue Analysis (CRA) Report provides annual revenue, volume, and volume variable cost for products and special services. The volume variable costs were developed based on statistical estimates using the major databases of costs that are used for rate-making purposes under the Postal Reform Act of 1970, and the PAEA, namely the In-Office Cost System (IOCS), Transportation Cost System (TRACS), City Carrier Cost System (CCCS), and the Rural Carrier Cost System (RCCS).
The coefficients of variation (CVs) of each product in these cost systems can be found in the corresponding ACD document folders,38 and the CVs for Revenue and Volume for them were developed using the method introduced in R2006-1 in USPS-LR-L-14.
Although the Postal Service routinely produces CVs for product estimates from each sampling system, the CVs for CRA unit cost estimates are difficult to generate because of the complexity of the CRA model. Many cost components are developed by combining the estimates from multiple sampling systems in various ways. Other cost components (dependent components) are calculated by borrowing information from components that are measured by sampling systems (independent components). Development of simple analytical formulas for CVs of CRA estimates is difficult without making some simplifying assumptions on the interactions and dependencies of the different components.
This Appendix takes a simplified approach in developing CVs for the CRA cost estimates. All components are separated into groups based on the source of the sampling system, for example, window operations (CS3.2 plus its piggybacked cost), mail processing (CS3.1 plus its piggybacked cost), contract transportation (CS14.1), city carrier delivery (CS7 plus its piggybacked cost), rural carrier (CS10 plus its piggybacked cost), etc. The CRA CVs of unit costs can be derived based on the CVs of these independent groups, as shown in Formula 4.
In general, the variance of the sum of two correlated random variables, X and Y, is:39
38. See Docket No. ACR 2010, USPS-FY10-34 (CCCS),USPS-FY10-35 (RCCS), USPS-FY10-36 (TRACS), USPS-FY10-37 (IOCS). These folders are referred to as Library References and may be reviewed at the following link: http://www.prc.gov/prc-pages/library/dockets.aspx?activeview=summaryview&docketpart=LibraryReferences&docketid=ACR2010&partyid=117&attrID=0&attrName= .
39. Mood, A.M., Graybill, F.A. and Boes, D.C., Introduction to the Theory of Statistics, 3rd ed., McGraw-Hill, 1963, p. 178.
September 2011 J-1
Appendix J Derivation of CVs of Unit Volume Variable Costs of Postal Products
where s is the standard deviation. If the variables X and Y are independent, then they are uncorrelated and the variance of the sum is:
The coefficient of variation (CV) of X is CV (X) = where μx (or μ(X)) is the mean. So, assuming the estimated mean is equal to the true mean, the CV of the sum of two independent variables X and Y is:
Similarly, for the sum of K independent cost estimates,
the CV(C) is:
Where μ(Ck)are the cost estimates of independent cost components and CV(Ck) are the CVs for the independent costs components.
Furthermore, we can show that the CVs of the dependent components kth are the same as the CVs of the corresponding independent non-piggybacked cost component, which are provided by the corresponding sampling system that underlies the costs of each component. Let C = cost of the independent component and pC = piggybacked cost where p is a fixed factor representing the dependant cost components. Then
σ X( )μx-------------
J-2 Periodicals Mail Study
Derivation of CVs of Unit Volume Variable Costs of Postal Products Appendix J
Finally, CVs for unit volume variable cost and cost coverage are ratios and are calculated by the formula for the variance of the quotient of two random variables, which is derived in equation (6).40
Note that the variance of the quotient of two random variables is given by:41
or for independent variables:
If X and Y are positively correlated, the variance of the quotient is less than what it would be if they were independent. Consequently, a calculation assuming independence between the two variables (in this case either Revenue and Cost or Cost and Volume) will overstate the magnitude of the variance.
Assuming independence, the CV of a quotient can be expressed very simply,
CVs for Periodicals
The Table 1 summarizes the CVs for the unit volume variable costs and cost coverage using the simplifying assumptions described above. Given the cost coverages for the Periodicals products (74 percent for In-County, 75 percent for Outside County), the CVs are small enough, below 5 percent, that we can reliably determine whether these products meet their cost coverage requirements. In the present case, Periodicals do not meet their cost coverage requirements, since the upper confidence interval value of the
40. Cost Coverage is equal to Revenue minus Cost divided by Volume, and UVVC is the cost attributed to a product divided by its volume.
41. Mood, Graybill, and Boes, Op. cit., p. 181.
September 2011 J-3
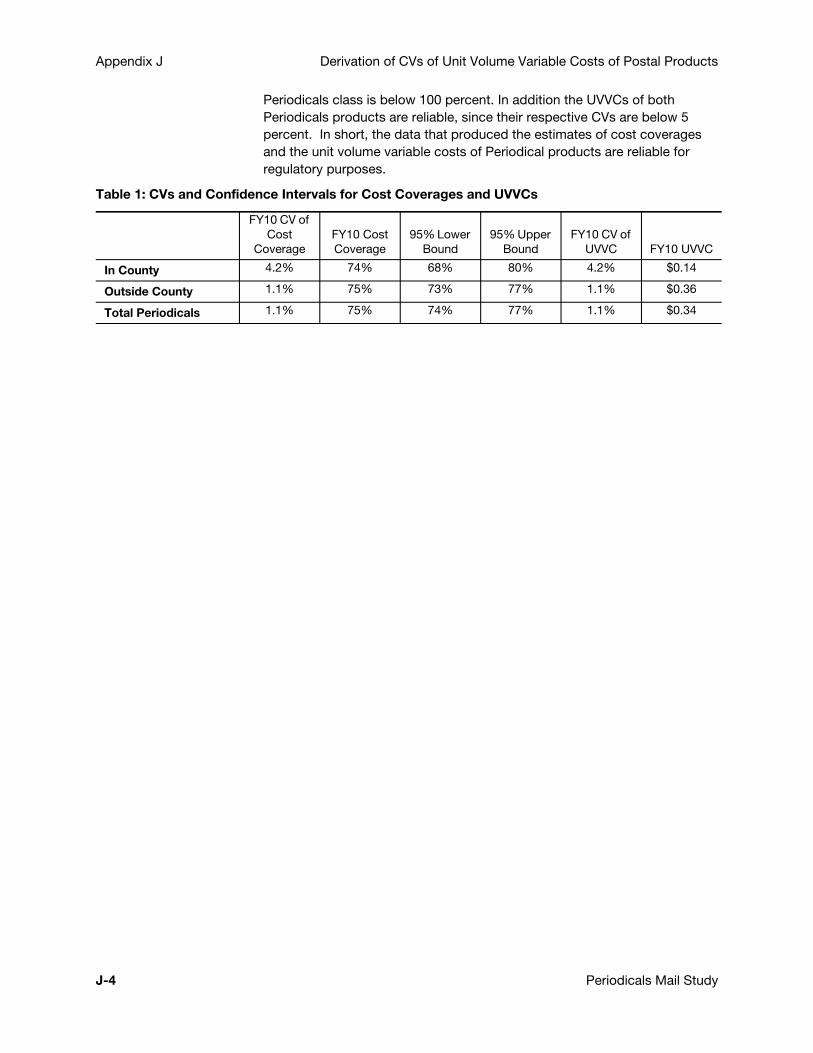
Appendix J Derivation of CVs of Unit Volume Variable Costs of Postal Products
Periodicals class is below 100 percent. In addition the UVVCs of both Periodicals products are reliable, since their respective CVs are below 5 percent. In short, the data that produced the estimates of cost coverages and the unit volume variable costs of Periodical products are reliable for regulatory purposes.
Table 1: CVs and Confidence Intervals for Cost Coverages and UVVCs
FY10 CV of Cost
CoverageFY10 Cost Coverage
95% Lower Bound
95% Upper Bound
FY10 CV of UVVC FY10 UVVC
In County 4.2% 74% 68% 80% 4.2% $0.14
Outside County 1.1% 75% 73% 77% 1.1% $0.36
Total Periodicals 1.1% 75% 74% 77% 1.1% $0.34
J-4 Periodicals Mail Study
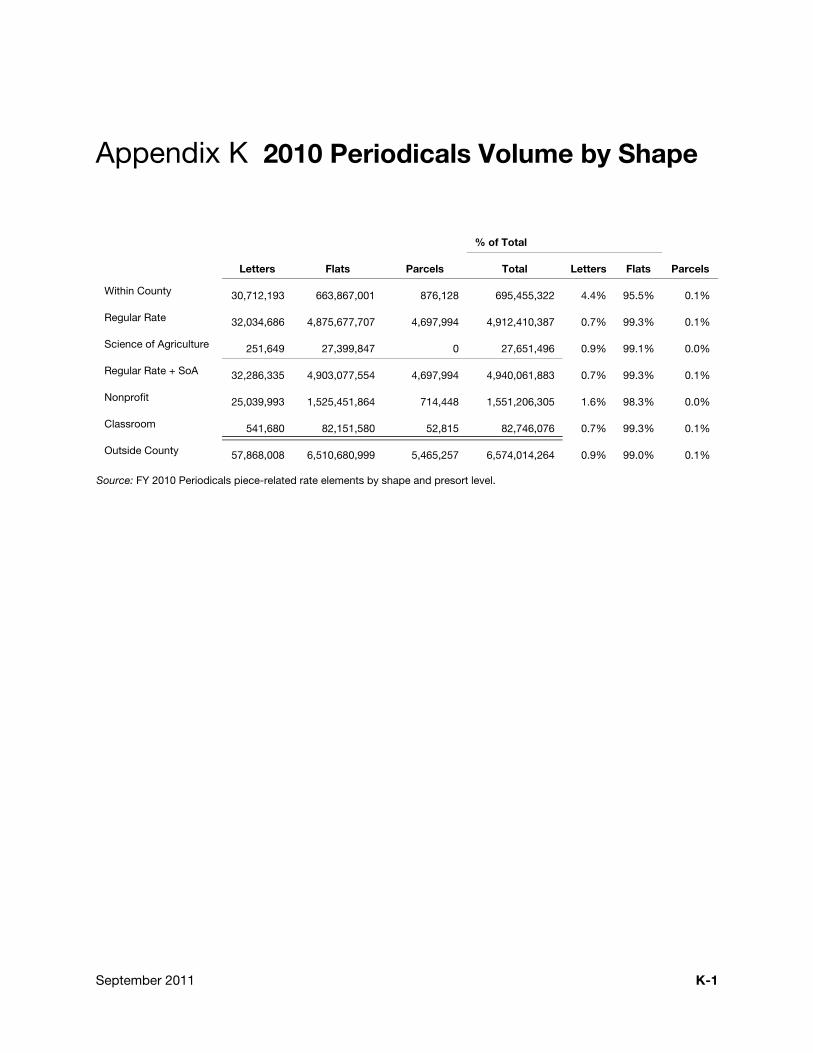
Appendix K 2010 Periodicals Volume by Shape
Source: FY 2010 Periodicals piece-related rate elements by shape and presort level.
Letters Flats Parcels
% of Total
ParcelsTotal Letters Flats
Within County 30,712,193 663,867,001 876,128 695,455,322 4.4% 95.5% 0.1%
Regular Rate 32,034,686 4,875,677,707 4,697,994 4,912,410,387 0.7% 99.3% 0.1%
Science of Agriculture 251,649 27,399,847 0 27,651,496 0.9% 99.1% 0.0%
Regular Rate + SoA 32,286,335 4,903,077,554 4,697,994 4,940,061,883 0.7% 99.3% 0.1%
Nonprofit 25,039,993 1,525,451,864 714,448 1,551,206,305 1.6% 98.3% 0.0%
Classroom 541,680 82,151,580 52,815 82,746,076 0.7% 99.3% 0.1%
Outside County 57,868,008 6,510,680,999 5,465,257 6,574,014,264 0.9% 99.0% 0.1%
September 2011 K-1

Appendix K
This page intentionally left blank
K-2 Periodicals Mail Study
Appendix L Additional Operations Information
The Labeling Lists data product assists mailers with presorting mail. It provides active, originating 3- and 5-digit ZIP Code data along with their destination locations [including city/state/ZIP Code] for labeling purposes. It is important to note that the Labeling Lists data product files do not supersede DMM procedure or information; they simply provide labeling information in an electronic format.
L001 allows multiple 5-digit ZIP Codes to be combined on a pallet or in a sack when the ZIP Codes are served from the same delivery unit. L001 promotes direct transfer to the delivery unit operations, bypassing all unit handling. L001 creates more cross-docks pallets at the plants in lieu of working pallets. L001 allows a mailer to palletize mailings when previous volumes had not been practical.
L007 allows flats for multiple 5-digit ZIP Codes to be combined in a single bundle. This allows more mail to qualify for prices associated with more finely presorted mail or discounted postage prices. This preparation can also improve service since the individual mailpieces are sorted closer to destination and receive fewer handlings, thereby further reducing processing costs.
L008 is similar to L007 except flats from more than one 3-digit ZIP Code can be combined into the same bundle. Essentially, it takes pieces, which may have been presorted into mixed bundles and allows pieces to qualify for a 3-digit presort rate. This preparation also improves service since the individual mailpieces are sorted closer to destination and receive fewer handlings in total.
L009 and L201 are used in combination to minimize the transportation costs associated with Periodicals. They may have a minor impact on the number of handlings, reducing Periodicals processing costs. After all required containers/pallets are created, the mixed Area Distribution Center (MXD ADC) bundles of the Periodicals mail are separated based on the entry location. Mixed bundles containing pieces for destinations, which can be reached via surface transportation, are piece sorted and sent on the same network with First Class Mail (FCM). Any remaining mail for more distant destinations is dispatched to a consolidation center where the pieces are merged with other mail for the same destinations, aggregating the volume into fuller containers for transport through the postal network.
September 2011 L-1
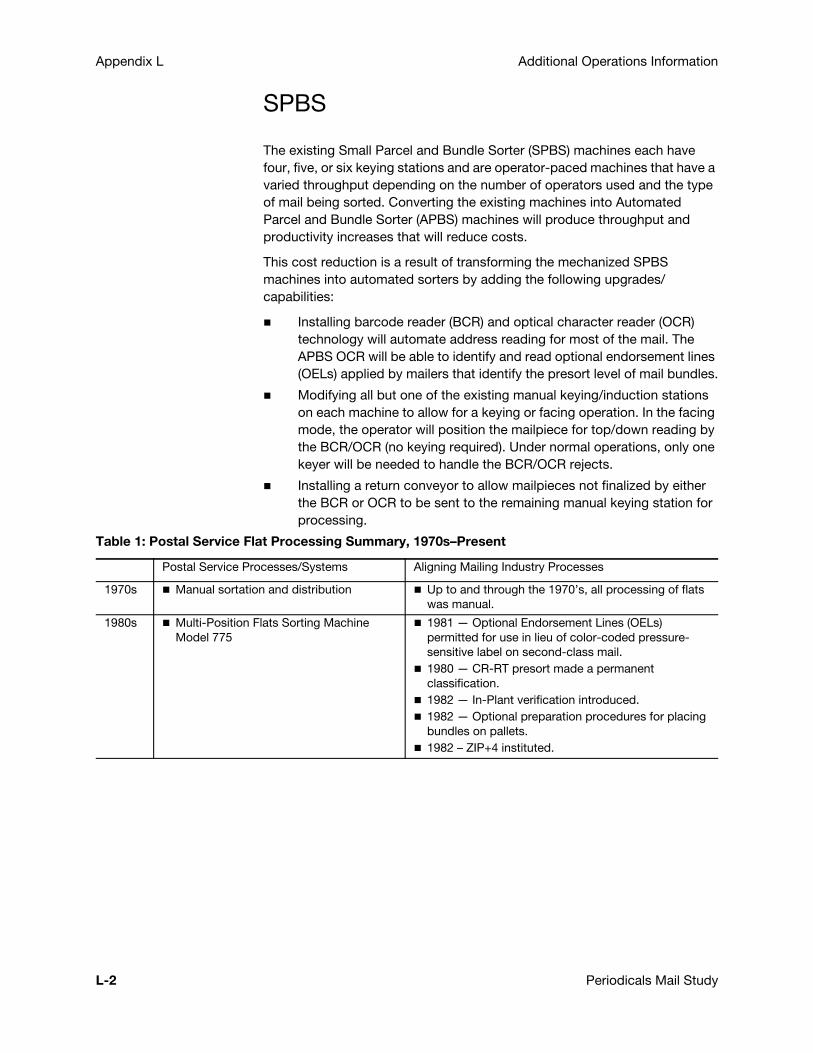
Appendix L Additional Operations Information
SPBS
The existing Small Parcel and Bundle Sorter (SPBS) machines each have four, five, or six keying stations and are operator-paced machines that have a varied throughput depending on the number of operators used and the type of mail being sorted. Converting the existing machines into Automated Parcel and Bundle Sorter (APBS) machines will produce throughput and productivity increases that will reduce costs.
This cost reduction is a result of transforming the mechanized SPBS machines into automated sorters by adding the following upgrades/capabilities:
Installing barcode reader (BCR) and optical character reader (OCR) technology will automate address reading for most of the mail. The APBS OCR will be able to identify and read optional endorsement lines (OELs) applied by mailers that identify the presort level of mail bundles.
Modifying all but one of the existing manual keying/induction stations on each machine to allow for a keying or facing operation. In the facing mode, the operator will position the mailpiece for top/down reading by the BCR/OCR (no keying required). Under normal operations, only one keyer will be needed to handle the BCR/OCR rejects.
Installing a return conveyor to allow mailpieces not finalized by either the BCR or OCR to be sent to the remaining manual keying station for processing.
Table 1: Postal Service Flat Processing Summary, 1970s–Present
Postal Service Processes/Systems Aligning Mailing Industry Processes
1970s Manual sortation and distribution Up to and through the 1970’s, all processing of flats was manual.
1980s Multi-Position Flats Sorting Machine Model 775
1981 — Optional Endorsement Lines (OELs) permitted for use in lieu of color-coded pressure- sensitive label on second-class mail.1980 — CR-RT presort made a permanent classification.1982 — In-Plant verification introduced.1982 — Optional preparation procedures for placing bundles on pallets.1982 – ZIP+4 instituted.
L-2 Periodicals Mail Study
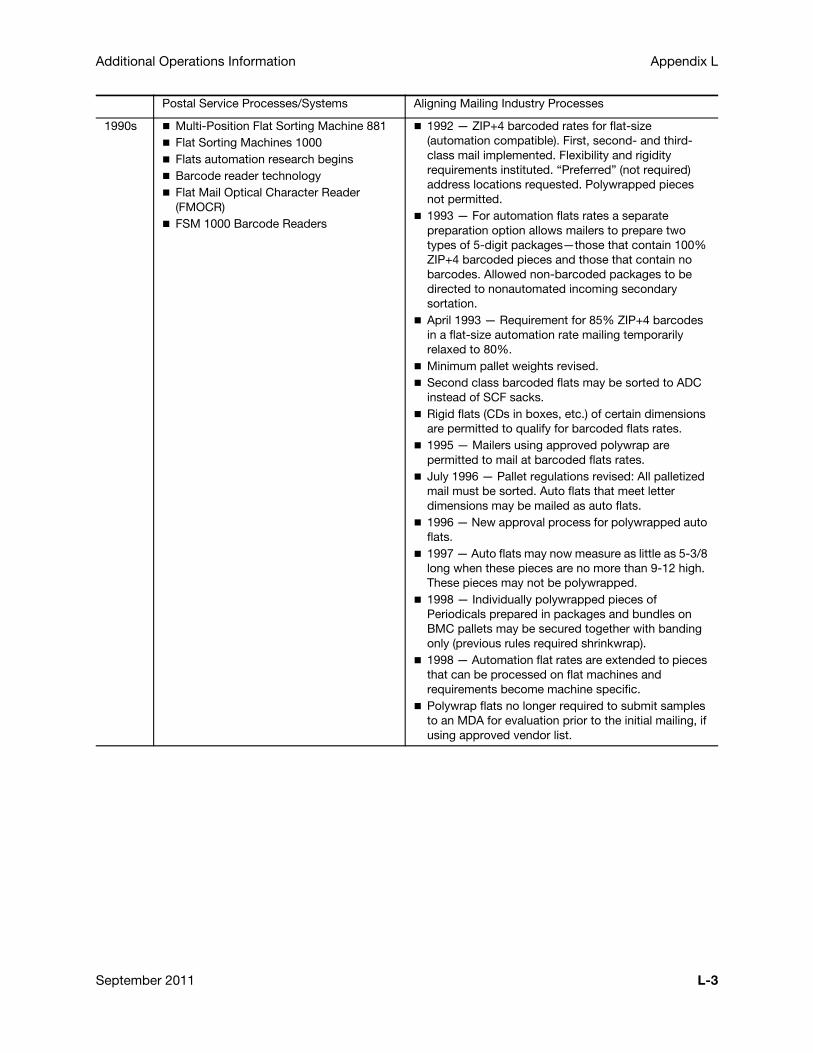
Additional Operations Information Appendix L
1990s Multi-Position Flat Sorting Machine 881Flat Sorting Machines 1000Flats automation research beginsBarcode reader technologyFlat Mail Optical Character Reader (FMOCR)FSM 1000 Barcode Readers
1992 — ZIP+4 barcoded rates for flat-size (automation compatible). First, second- and third-class mail implemented. Flexibility and rigidity requirements instituted. “Preferred” (not required) address locations requested. Polywrapped pieces not permitted.1993 — For automation flats rates a separate preparation option allows mailers to prepare two types of 5-digit packages—those that contain 100% ZIP+4 barcoded pieces and those that contain no barcodes. Allowed non-barcoded packages to be directed to nonautomated incoming secondary sortation. April 1993 — Requirement for 85% ZIP+4 barcodes in a flat-size automation rate mailing temporarily relaxed to 80%.Minimum pallet weights revised.Second class barcoded flats may be sorted to ADC instead of SCF sacks.Rigid flats (CDs in boxes, etc.) of certain dimensions are permitted to qualify for barcoded flats rates.1995 — Mailers using approved polywrap are permitted to mail at barcoded flats rates.July 1996 — Pallet regulations revised: All palletized mail must be sorted. Auto flats that meet letter dimensions may be mailed as auto flats.1996 — New approval process for polywrapped auto flats.1997 — Auto flats may now measure as little as 5-3/8 long when these pieces are no more than 9-12 high. These pieces may not be polywrapped. 1998 — Individually polywrapped pieces of Periodicals prepared in packages and bundles on BMC pallets may be secured together with banding only (previous rules required shrinkwrap). 1998 — Automation flat rates are extended to pieces that can be processed on flat machines and requirements become machine specific. Polywrap flats no longer required to submit samples to an MDA for evaluation prior to the initial mailing, if using approved vendor list.
Postal Service Processes/Systems Aligning Mailing Industry Processes
September 2011 L-3
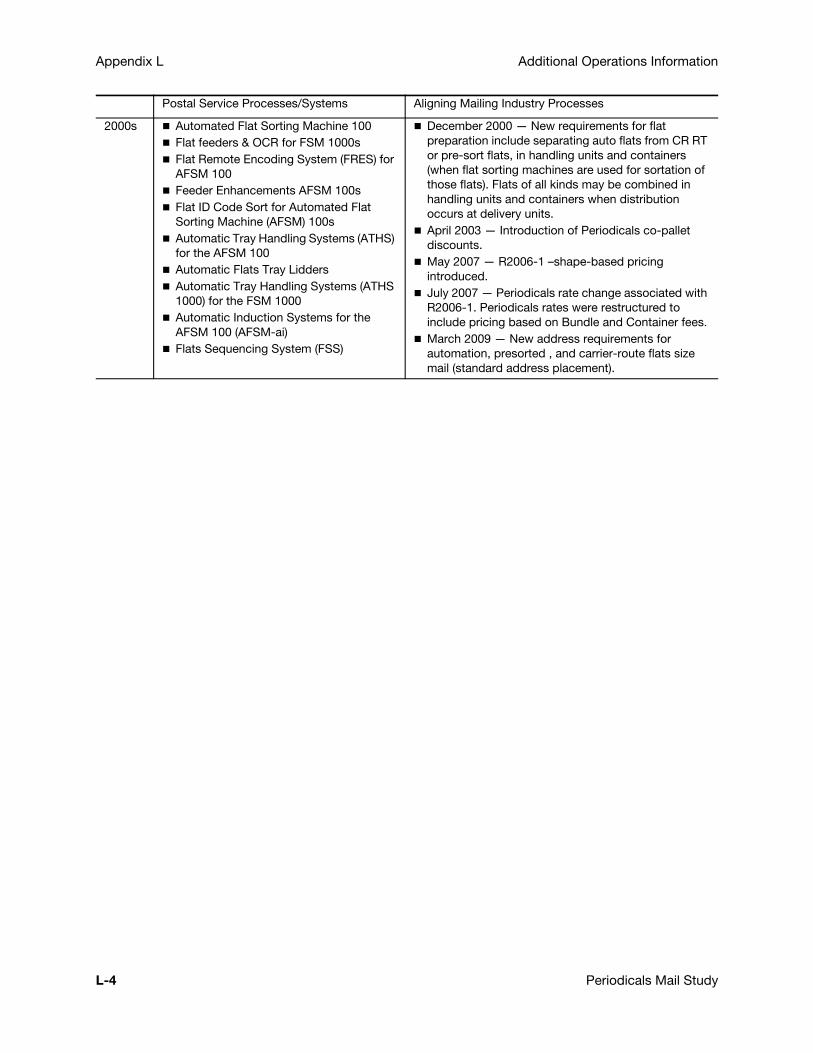
Appendix L Additional Operations Information
2000s Automated Flat Sorting Machine 100Flat feeders & OCR for FSM 1000sFlat Remote Encoding System (FRES) for AFSM 100Feeder Enhancements AFSM 100sFlat ID Code Sort for Automated Flat Sorting Machine (AFSM) 100sAutomatic Tray Handling Systems (ATHS) for the AFSM 100Automatic Flats Tray LiddersAutomatic Tray Handling Systems (ATHS 1000) for the FSM 1000Automatic Induction Systems for the AFSM 100 (AFSM-ai)Flats Sequencing System (FSS)
December 2000 — New requirements for flat preparation include separating auto flats from CR RT or pre-sort flats, in handling units and containers (when flat sorting machines are used for sortation of those flats). Flats of all kinds may be combined in handling units and containers when distribution occurs at delivery units. April 2003 — Introduction of Periodicals co-pallet discounts.May 2007 — R2006-1 –shape-based pricing introduced.July 2007 — Periodicals rate change associated with R2006-1. Periodicals rates were restructured to include pricing based on Bundle and Container fees.March 2009 — New address requirements for automation, presorted , and carrier-route flats size mail (standard address placement).
Postal Service Processes/Systems Aligning Mailing Industry Processes
L-4 Periodicals Mail Study

Appendix M Second-Class Mail Within-County Rates History January 1, 1970 – February 2, 1991
September 2011 M-1
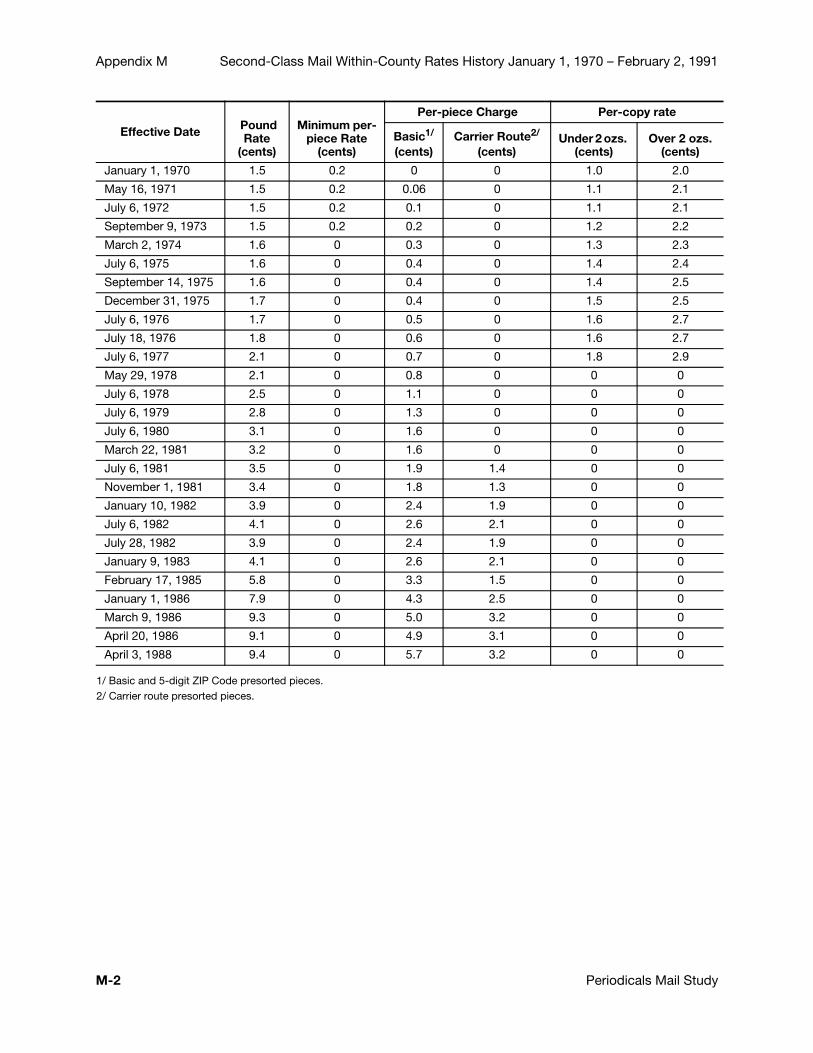
Appendix M Second-Class Mail Within-County Rates History January 1, 1970 – February 2, 1991
1/ Basic and 5-digit ZIP Code presorted pieces.2/ Carrier route presorted pieces.
Effective Date Pound Rate
(cents)
Minimum per-piece Rate
(cents)
Per-piece Charge Per-copy rate
Basic1/
(cents)Carrier Route2/
(cents)Under 2 ozs.
(cents)Over 2 ozs.
(cents)
January 1, 1970 1.5 0.2 0 0 1.0 2.0
May 16, 1971 1.5 0.2 0.06 0 1.1 2.1
July 6, 1972 1.5 0.2 0.1 0 1.1 2.1
September 9, 1973 1.5 0.2 0.2 0 1.2 2.2
March 2, 1974 1.6 0 0.3 0 1.3 2.3
July 6, 1975 1.6 0 0.4 0 1.4 2.4
September 14, 1975 1.6 0 0.4 0 1.4 2.5
December 31, 1975 1.7 0 0.4 0 1.5 2.5
July 6, 1976 1.7 0 0.5 0 1.6 2.7
July 18, 1976 1.8 0 0.6 0 1.6 2.7
July 6, 1977 2.1 0 0.7 0 1.8 2.9
May 29, 1978 2.1 0 0.8 0 0 0
July 6, 1978 2.5 0 1.1 0 0 0
July 6, 1979 2.8 0 1.3 0 0 0
July 6, 1980 3.1 0 1.6 0 0 0
March 22, 1981 3.2 0 1.6 0 0 0
July 6, 1981 3.5 0 1.9 1.4 0 0
November 1, 1981 3.4 0 1.8 1.3 0 0
January 10, 1982 3.9 0 2.4 1.9 0 0
July 6, 1982 4.1 0 2.6 2.1 0 0
July 28, 1982 3.9 0 2.4 1.9 0 0
January 9, 1983 4.1 0 2.6 2.1 0 0
February 17, 1985 5.8 0 3.3 1.5 0 0
January 1, 1986 7.9 0 4.3 2.5 0 0
March 9, 1986 9.3 0 5.0 3.2 0 0
April 20, 1986 9.1 0 4.9 3.1 0 0
April 3, 1988 9.4 0 5.7 3.2 0 0
M-2 Periodicals Mail Study
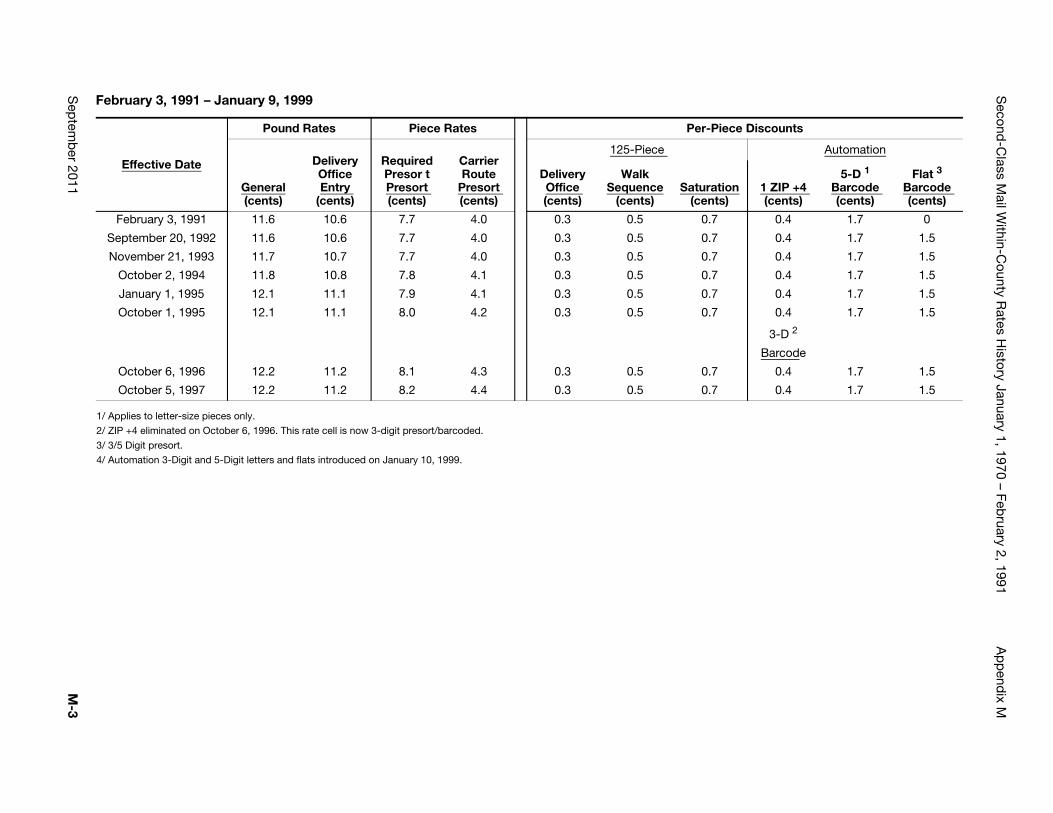
Second
-Class M
ail Within-C
ounty Rates H
istory January 1, 1970 – February 2, 1991
Ap
pend
ix M
Sep
temb
er 2011M
-3
e Discounts
Automation
n 1 ZIP +4 (cents)
5-D 1
Barcode (cents)
Flat 3
Barcode (cents)
0.4 1.7 0
0.4 1.7 1.5
0.4 1.7 1.5
0.4 1.7 1.5
0.4 1.7 1.5
0.4 1.7 1.5
3-D 2
Barcode
0.4 1.7 1.5
0.4 1.7 1.5
February 3, 1991 – January 9, 1999
1/ Applies to letter-size pieces only.
2/ ZIP +4 eliminated on October 6, 1996. This rate cell is now 3-digit presort/barcoded.
3/ 3/5 Digit presort.
4/ Automation 3-Digit and 5-Digit letters and flats introduced on January 10, 1999.
Effective Date
Pound Rates Piece Rates Per-Piec
General (cents)
Delivery Office Entry
(cents)
Required Presor t Presort (cents)
Carrier Route
Presort (cents)
125-Piece
Delivery Office (cents)
Walk Sequence
(cents)Saturatio
(cents)
February 3, 1991 11.6 10.6 7.7 4.0 0.3 0.5 0.7
September 20, 1992 11.6 10.6 7.7 4.0 0.3 0.5 0.7
November 21, 1993 11.7 10.7 7.7 4.0 0.3 0.5 0.7
October 2, 1994 11.8 10.8 7.8 4.1 0.3 0.5 0.7
January 1, 1995 12.1 11.1 7.9 4.1 0.3 0.5 0.7
October 1, 1995 12.1 11.1 8.0 4.2 0.3 0.5 0.7
October 6, 1996 12.2 11.2 8.1 4.3 0.3 0.5 0.7
October 5, 1997 12.2 11.2 8.2 4.4 0.3 0.5 0.7
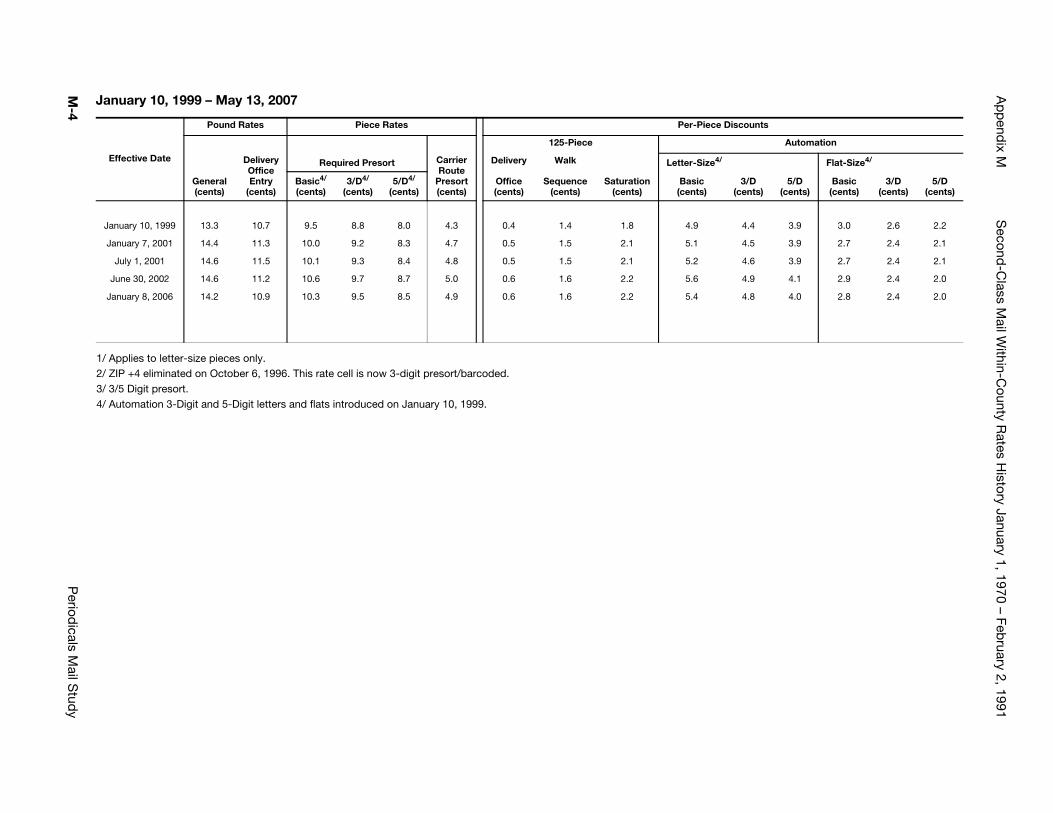
Ap
pend
ix MS
econd-C
lass Mail W
ithin-County R
ates History January 1, 1970 – Feb
ruary 2, 1991
M-4
Period
icals Mail S
tudy
iscounts
Automation
Flat-Size4/
3/D (cents)
5/D (cents)
Basic (cents)
3/D (cents)
5/D (cents)
4.4 3.9 3.0 2.6 2.2
4.5 3.9 2.7 2.4 2.1
4.6 3.9 2.7 2.4 2.1
4.9 4.1 2.9 2.4 2.0
4.8 4.0 2.8 2.4 2.0
January 10, 1999 – May 13, 2007
1/ Applies to letter-size pieces only.2/ ZIP +4 eliminated on October 6, 1996. This rate cell is now 3-digit presort/barcoded.3/ 3/5 Digit presort.4/ Automation 3-Digit and 5-Digit letters and flats introduced on January 10, 1999.
Effective Date
Pound Rates Piece Rates Per-Piece D
General (cents)
Delivery Office Entry
(cents)
Required Presort Carrier Route
Presort (cents)
125-Piece
Delivery Walk Letter-Size4/
Basic4/
(cents)3/D4/
(cents)5/D4/
(cents)Office (cents)
Sequence (cents)
Saturation (cents)
Basic (cents)
January 10, 1999 13.3 10.7 9.5 8.8 8.0 4.3 0.4 1.4 1.8 4.9
January 7, 2001 14.4 11.3 10.0 9.2 8.3 4.7 0.5 1.5 2.1 5.1
July 1, 2001 14.6 11.5 10.1 9.3 8.4 4.8 0.5 1.5 2.1 5.2
June 30, 2002 14.6 11.2 10.6 9.7 8.7 5.0 0.6 1.6 2.2 5.6
January 8, 2006 14.2 10.9 10.3 9.5 8.5 4.9 0.6 1.6 2.2 5.4
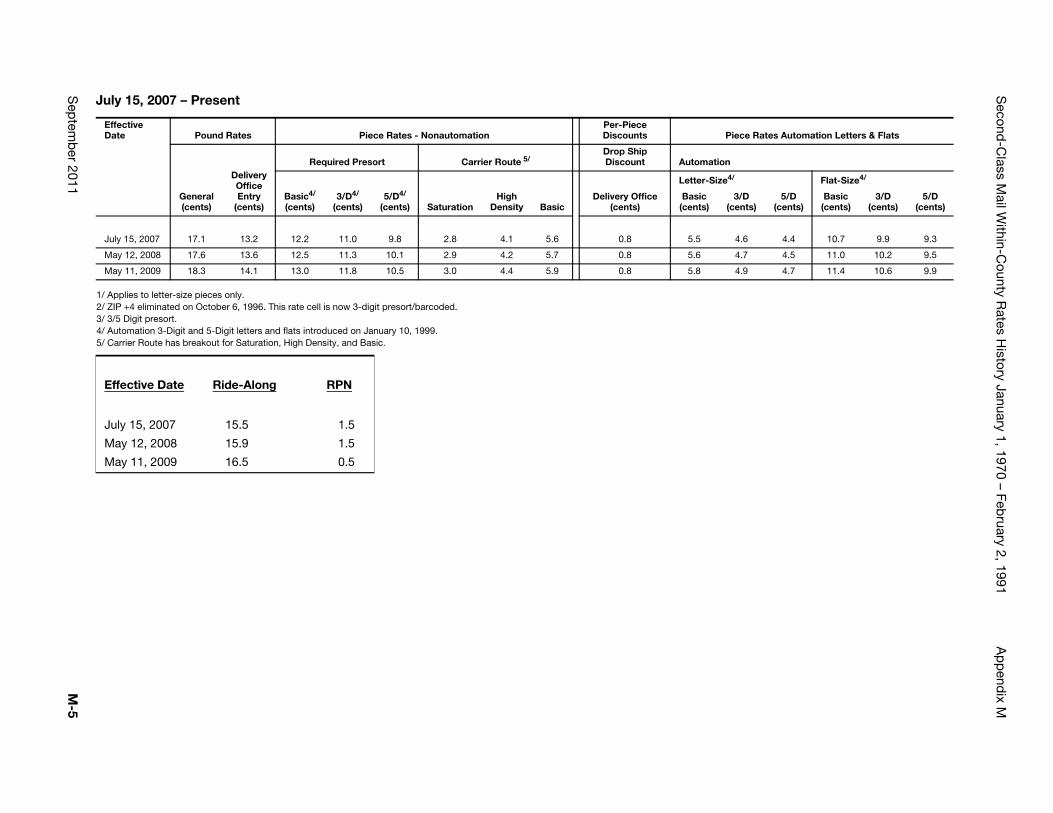
Second
-Class M
ail Within-C
ounty Rates H
istory January 1, 1970 – February 2, 1991
Ap
pend
ix M
Sep
temb
er 2011M
-5
iece Rates Automation Letters & Flats
/ Flat-Size4/
3/D ents)
5/D (cents)
Basic (cents)
3/D (cents)
5/D (cents)
4.6 4.4 10.7 9.9 9.3
4.7 4.5 11.0 10.2 9.5
4.9 4.7 11.4 10.6 9.9
July 15, 2007 – Present
1/ Applies to letter-size pieces only.2/ ZIP +4 eliminated on October 6, 1996. This rate cell is now 3-digit presort/barcoded.3/ 3/5 Digit presort.4/ Automation 3-Digit and 5-Digit letters and flats introduced on January 10, 1999.5/ Carrier Route has breakout for Saturation, High Density, and Basic.
Effective Date Pound Rates Piece Rates - Nonautomation
Per-Piece Discounts P
General (cents)
Delivery Office Entry
(cents)
Required Presort Carrier Route 5/Drop Ship Discount Automation
Basic4/
(cents) 3/D4/
(cents)5/D4/
(cents) SaturationHigh
Density BasicDelivery Office
(cents)
Letter-Size4
Basic (cents) (c
July 15, 2007 17.1 13.2 12.2 11.0 9.8 2.8 4.1 5.6 0.8 5.5
May 12, 2008 17.6 13.6 12.5 11.3 10.1 2.9 4.2 5.7 0.8 5.6
May 11, 2009 18.3 14.1 13.0 11.8 10.5 3.0 4.4 5.9 0.8 5.8
Effective Date Ride-Along RPN
July 15, 2007 15.5 1.5
May 12, 2008 15.9 1.5
May 11, 2009 16.5 0.5

Appendix M
This page intentionally left blank
M-6 Periodicals Mail Study

Appendix N Second Class Mail Regular Rate and Publisher’s Commingled Rate History
September 2011 N-1

Appendix N
This page intentionally left blank
N-2 Periodicals Mail Study
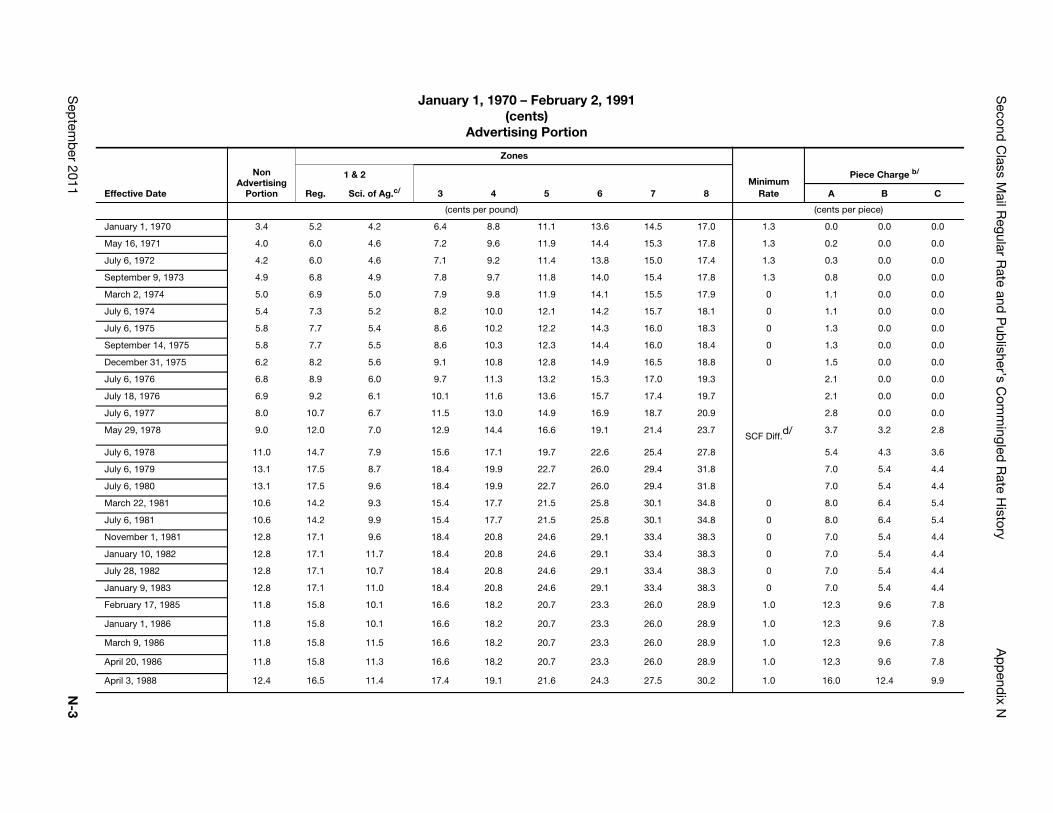
Second
Class M
ail Regular R
ate and P
ublisher’s C
omm
ingled R
ate History
Ap
pend
ix N
Sep
temb
er 2011N
-3
MinimumRate
Piece Charge b/
A B C
(cents per piece)
1.3 0.0 0.0 0.0
1.3 0.2 0.0 0.0
1.3 0.3 0.0 0.0
1.3 0.8 0.0 0.0
0 1.1 0.0 0.0
0 1.1 0.0 0.0
0 1.3 0.0 0.0
0 1.3 0.0 0.0
0 1.5 0.0 0.0
2.1 0.0 0.0
2.1 0.0 0.0
2.8 0.0 0.0
SCF Diff.d/ 3.7 3.2 2.8
5.4 4.3 3.6
7.0 5.4 4.4
7.0 5.4 4.4
0 8.0 6.4 5.4
0 8.0 6.4 5.4
0 7.0 5.4 4.4
0 7.0 5.4 4.4
0 7.0 5.4 4.4
0 7.0 5.4 4.4
1.0 12.3 9.6 7.8
1.0 12.3 9.6 7.8
1.0 12.3 9.6 7.8
1.0 12.3 9.6 7.8
1.0 16.0 12.4 9.9
January 1, 1970 – February 2, 1991(cents)
Advertising Portion
Effective Date
Non Advertising
Portion
Zones
1 & 2
3 4 5 6 7 8Reg. Sci. of Ag.c/
(cents per pound)
January 1, 1970 3.4 5.2 4.2 6.4 8.8 11.1 13.6 14.5 17.0
May 16, 1971 4.0 6.0 4.6 7.2 9.6 11.9 14.4 15.3 17.8
July 6, 1972 4.2 6.0 4.6 7.1 9.2 11.4 13.8 15.0 17.4
September 9, 1973 4.9 6.8 4.9 7.8 9.7 11.8 14.0 15.4 17.8
March 2, 1974 5.0 6.9 5.0 7.9 9.8 11.9 14.1 15.5 17.9
July 6, 1974 5.4 7.3 5.2 8.2 10.0 12.1 14.2 15.7 18.1
July 6, 1975 5.8 7.7 5.4 8.6 10.2 12.2 14.3 16.0 18.3
September 14, 1975 5.8 7.7 5.5 8.6 10.3 12.3 14.4 16.0 18.4
December 31, 1975 6.2 8.2 5.6 9.1 10.8 12.8 14.9 16.5 18.8
July 6, 1976 6.8 8.9 6.0 9.7 11.3 13.2 15.3 17.0 19.3
July 18, 1976 6.9 9.2 6.1 10.1 11.6 13.6 15.7 17.4 19.7
July 6, 1977 8.0 10.7 6.7 11.5 13.0 14.9 16.9 18.7 20.9
May 29, 1978 9.0 12.0 7.0 12.9 14.4 16.6 19.1 21.4 23.7
July 6, 1978 11.0 14.7 7.9 15.6 17.1 19.7 22.6 25.4 27.8
July 6, 1979 13.1 17.5 8.7 18.4 19.9 22.7 26.0 29.4 31.8
July 6, 1980 13.1 17.5 9.6 18.4 19.9 22.7 26.0 29.4 31.8
March 22, 1981 10.6 14.2 9.3 15.4 17.7 21.5 25.8 30.1 34.8
July 6, 1981 10.6 14.2 9.9 15.4 17.7 21.5 25.8 30.1 34.8
November 1, 1981 12.8 17.1 9.6 18.4 20.8 24.6 29.1 33.4 38.3
January 10, 1982 12.8 17.1 11.7 18.4 20.8 24.6 29.1 33.4 38.3
July 28, 1982 12.8 17.1 10.7 18.4 20.8 24.6 29.1 33.4 38.3
January 9, 1983 12.8 17.1 11.0 18.4 20.8 24.6 29.1 33.4 38.3
February 17, 1985 11.8 15.8 10.1 16.6 18.2 20.7 23.3 26.0 28.9
January 1, 1986 11.8 15.8 10.1 16.6 18.2 20.7 23.3 26.0 28.9
March 9, 1986 11.8 15.8 11.5 16.6 18.2 20.7 23.3 26.0 28.9
April 20, 1986 11.8 15.8 11.3 16.6 18.2 20.7 23.3 26.0 28.9
April 3, 1988 12.4 16.5 11.4 17.4 19.1 21.6 24.3 27.5 30.2
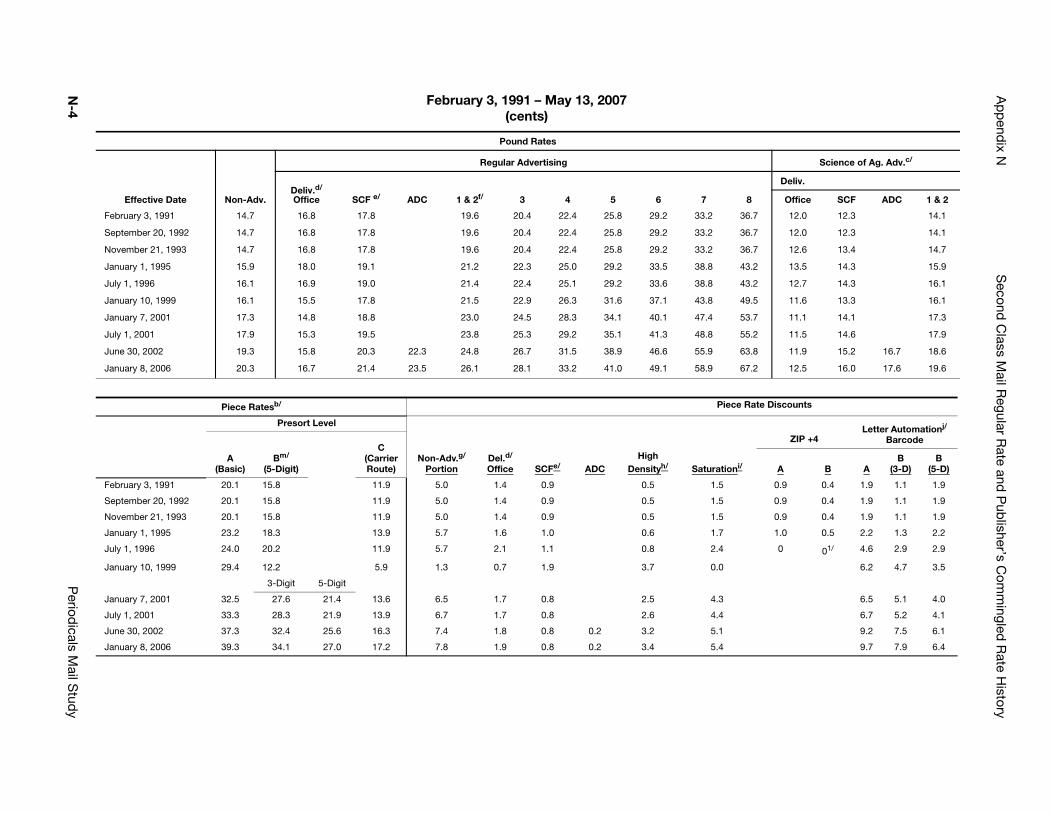
Ap
pend
ix NS
econd C
lass Mail R
egular Rate and
Pub
lisher’s Com
mingled
Rate H
istory
N-4
Period
icals Mail S
tudy
Science of Ag. Adv.c/
8
Deliv.
Office SCF ADC 1 & 2
36.7 12.0 12.3 14.1
36.7 12.0 12.3 14.1
36.7 12.6 13.4 14.7
43.2 13.5 14.3 15.9
43.2 12.7 14.3 16.1
49.5 11.6 13.3 16.1
53.7 11.1 14.1 17.3
55.2 11.5 14.6 17.9
63.8 11.9 15.2 16.7 18.6
67.2 12.5 16.0 17.6 19.6
ce Rate Discounts
Letter Automationj/
BarcodeZIP +4
ni/ A B AB
(3-D)B
(5-D)
0.9 0.4 1.9 1.1 1.9
0.9 0.4 1.9 1.1 1.9
0.9 0.4 1.9 1.1 1.9
1.0 0.5 2.2 1.3 2.2
0 01/ 4.6 2.9 2.9
6.2 4.7 3.5
6.5 5.1 4.0
6.7 5.2 4.1
9.2 7.5 6.1
9.7 7.9 6.4
February 3, 1991 – May 13, 2007 (cents)
Pound Rates
Effective Date Non-Adv.
Regular Advertising
Deliv.d/
Office SCF e/ ADC 1 & 2f/ 3 4 5 6 7
February 3, 1991 14.7 16.8 17.8 19.6 20.4 22.4 25.8 29.2 33.2
September 20, 1992 14.7 16.8 17.8 19.6 20.4 22.4 25.8 29.2 33.2
November 21, 1993 14.7 16.8 17.8 19.6 20.4 22.4 25.8 29.2 33.2
January 1, 1995 15.9 18.0 19.1 21.2 22.3 25.0 29.2 33.5 38.8
July 1, 1996 16.1 16.9 19.0 21.4 22.4 25.1 29.2 33.6 38.8
January 10, 1999 16.1 15.5 17.8 21.5 22.9 26.3 31.6 37.1 43.8
January 7, 2001 17.3 14.8 18.8 23.0 24.5 28.3 34.1 40.1 47.4
July 1, 2001 17.9 15.3 19.5 23.8 25.3 29.2 35.1 41.3 48.8
June 30, 2002 19.3 15.8 20.3 22.3 24.8 26.7 31.5 38.9 46.6 55.9
January 8, 2006 20.3 16.7 21.4 23.5 26.1 28.1 33.2 41.0 49.1 58.9
Piece Ratesb/ Pie
Presort Level
A (Basic)
Bm/
(5-Digit)
C (Carrier Route)
Non-Adv.g/ Portion
Del.d/
Office SCFe/ ADCHigh
Densityh/ Saturatio
February 3, 1991 20.1 15.8 11.9 5.0 1.4 0.9 0.5 1.5
September 20, 1992 20.1 15.8 11.9 5.0 1.4 0.9 0.5 1.5
November 21, 1993 20.1 15.8 11.9 5.0 1.4 0.9 0.5 1.5
January 1, 1995 23.2 18.3 13.9 5.7 1.6 1.0 0.6 1.7
July 1, 1996 24.0 20.2 11.9 5.7 2.1 1.1 0.8 2.4
January 10, 1999 29.4 12.2 5.9 1.3 0.7 1.9 3.7 0.0
3-Digit 5-Digit
January 7, 2001 32.5 27.6 21.4 13.6 6.5 1.7 0.8 2.5 4.3
July 1, 2001 33.3 28.3 21.9 13.9 6.7 1.7 0.8 2.6 4.4
June 30, 2002 37.3 32.4 25.6 16.3 7.4 1.8 0.8 0.2 3.2 5.1
January 8, 2006 39.3 34.1 27.0 17.2 7.8 1.9 0.8 0.2 3.4 5.4
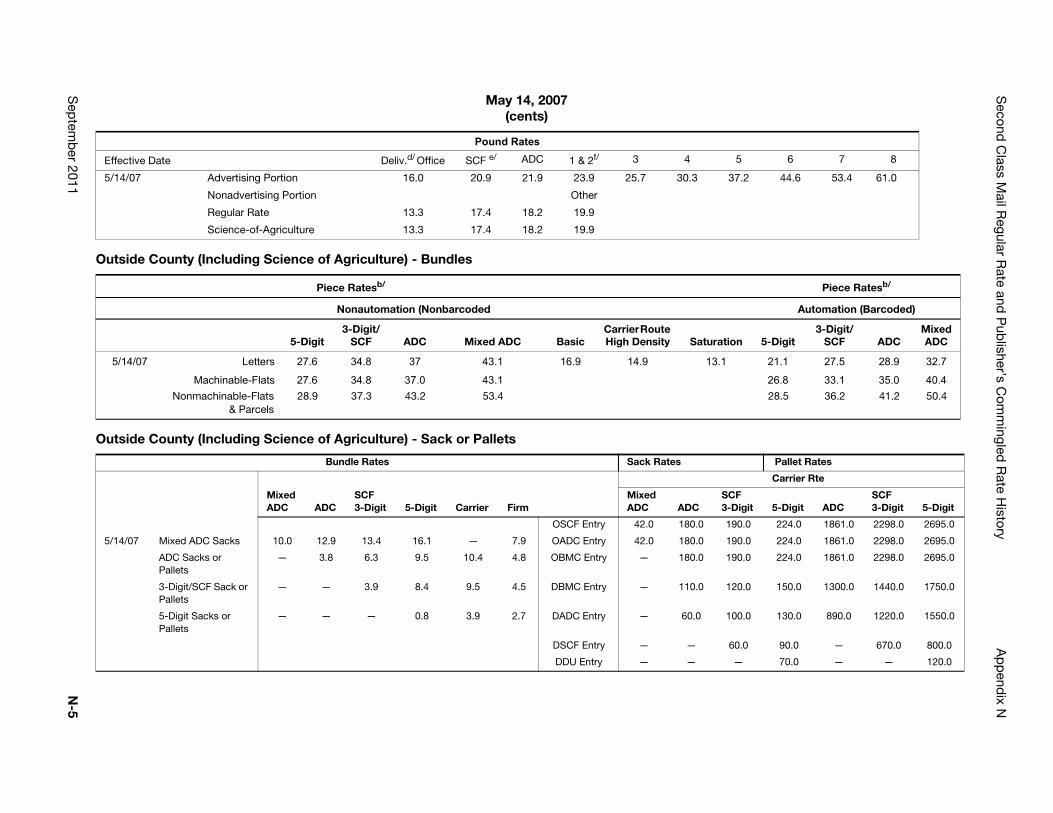
Second
Class M
ail Regular R
ate and P
ublisher’s C
omm
ingled R
ate History
Ap
pend
ix N
Sep
temb
er 2011N
-5
5 6 7 8
7.2 44.6 53.4 61.0
Piece Ratesb/
Automation (Barcoded)
n 5-Digit3-Digit/
SCF ADCMixed ADC
21.1 27.5 28.9 32.7
26.8 33.1 35.0 40.428.5 36.2 41.2 50.4
Pallet Rates
Carrier Rte
F Digit 5-Digit ADC
SCF 3-Digit 5-Digit
90.0 224.0 1861.0 2298.0 2695.0
90.0 224.0 1861.0 2298.0 2695.0
90.0 224.0 1861.0 2298.0 2695.0
20.0 150.0 1300.0 1440.0 1750.0
00.0 130.0 890.0 1220.0 1550.0
0.0 90.0 — 670.0 800.0
— 70.0 — — 120.0
May 14, 2007(cents)
Outside County (Including Science of Agriculture) - Bundles
Outside County (Including Science of Agriculture) - Sack or Pallets
Pound Rates
Effective Date Deliv.d/ Office SCF e/ ADC 1 & 2f/ 3 4
5/14/07 Advertising Portion 16.0 20.9 21.9 23.9 25.7 30.3 3
Nonadvertising Portion Other
Regular Rate 13.3 17.4 18.2 19.9
Science-of-Agriculture 13.3 17.4 18.2 19.9
Piece Ratesb/
Nonautomation (Nonbarcoded
5-Digit3-Digit/
SCF ADC Mixed ADC BasicCarrier Route High Density Saturatio
5/14/07 Letters 27.6 34.8 37 43.1 16.9 14.9 13.1
Machinable-Flats 27.6 34.8 37.0 43.1Nonmachinable-Flats
& Parcels28.9 37.3 43.2 53.4
Bundle Rates Sack Rates
Mixed ADC ADC
SCF 3-Digit 5-Digit Carrier Firm
Mixed ADC ADC
SC3-
OSCF Entry 42.0 180.0 1
5/14/07 Mixed ADC Sacks 10.0 12.9 13.4 16.1 — 7.9 OADC Entry 42.0 180.0 1
ADC Sacks or Pallets
— 3.8 6.3 9.5 10.4 4.8 OBMC Entry — 180.0 1
3-Digit/SCF Sack or Pallets
— — 3.9 8.4 9.5 4.5 DBMC Entry — 110.0 1
5-Digit Sacks or Pallets
— — — 0.8 3.9 2.7 DADC Entry — 60.0 1
DSCF Entry — — 6
DDU Entry — —
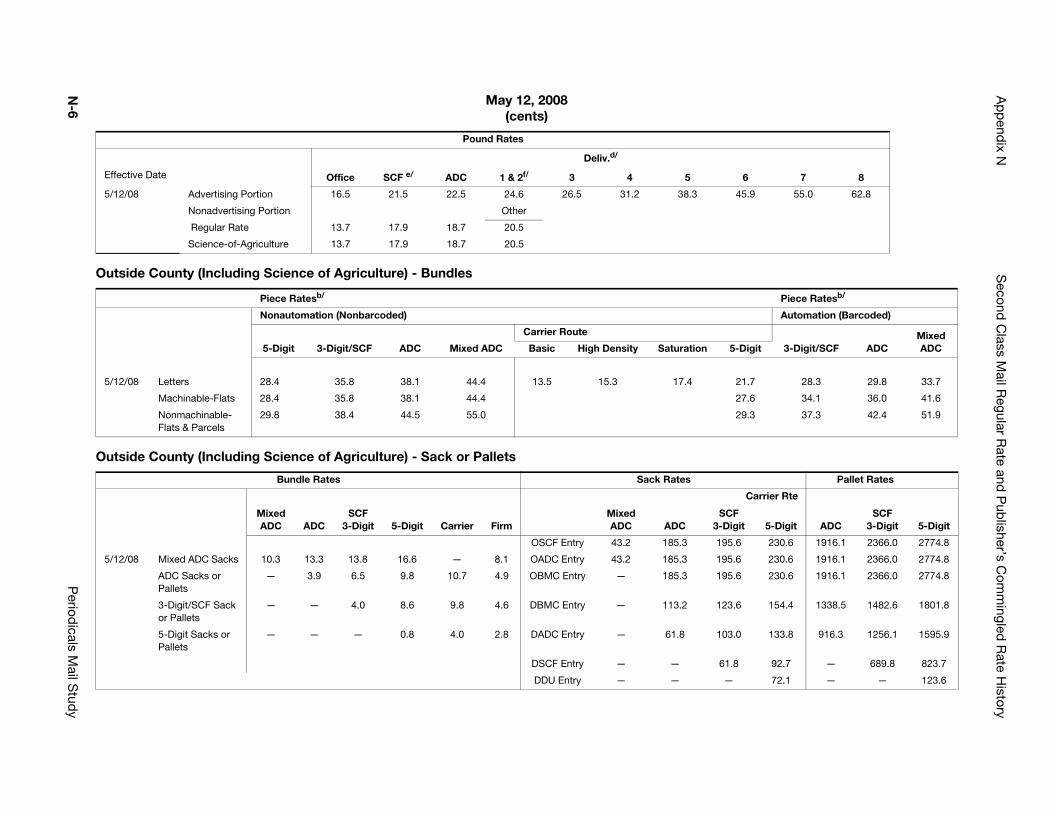
Ap
pend
ix NS
econd C
lass Mail R
egular Rate and
Pub
lisher’s Com
mingled
Rate H
istory
N-6
Period
icals Mail S
tudy
6 7 8
45.9 55.0 62.8
Piece Ratesb/
Automation (Barcoded)
3-Digit/SCF ADCMixed ADC-Digit
21.7 28.3 29.8 33.7
27.6 34.1 36.0 41.6
29.3 37.3 42.4 51.9
Pallet Rates
Carrier Rte
ADCSCF
3-Digit 5-DigitF git 5-Digit
.6 230.6 1916.1 2366.0 2774.8
.6 230.6 1916.1 2366.0 2774.8
.6 230.6 1916.1 2366.0 2774.8
.6 154.4 1338.5 1482.6 1801.8
.0 133.8 916.3 1256.1 1595.9
.8 92.7 — 689.8 823.7
72.1 — — 123.6
May 12, 2008 (cents)
Outside County (Including Science of Agriculture) - Bundles
Outside County (Including Science of Agriculture) - Sack or Pallets
Pound Rates
Deliv.d/
Effective Date Office SCF e/ ADC 1 & 2f/ 3 4 5
5/12/08 Advertising Portion 16.5 21.5 22.5 24.6 26.5 31.2 38.3
Nonadvertising Portion Other
Regular Rate 13.7 17.9 18.7 20.5
Science-of-Agriculture 13.7 17.9 18.7 20.5
Piece Ratesb/
Nonautomation (Nonbarcoded)
5-Digit 3-Digit/SCF ADC
Carrier Route
Mixed ADC Basic High Density Saturation 5
5/12/08 Letters 28.4 35.8 38.1 44.4 13.5 15.3 17.4
Machinable-Flats 28.4 35.8 38.1 44.4
Nonmachinable-Flats & Parcels
29.8 38.4 44.5 55.0
Bundle Rates Sack Rates
Mixed ADC ADC
SCF 3-Digit 5-Digit Carrier Firm
Mixed ADC ADC
SC3-Di
OSCF Entry 43.2 185.3 195
5/12/08 Mixed ADC Sacks 10.3 13.3 13.8 16.6 — 8.1 OADC Entry 43.2 185.3 195
ADC Sacks or Pallets
— 3.9 6.5 9.8 10.7 4.9 OBMC Entry — 185.3 195
3-Digit/SCF Sack or Pallets
— — 4.0 8.6 9.8 4.6 DBMC Entry — 113.2 123
5-Digit Sacks or Pallets
— — — 0.8 4.0 2.8 DADC Entry — 61.8 103
DSCF Entry — — 61
DDU Entry — — —
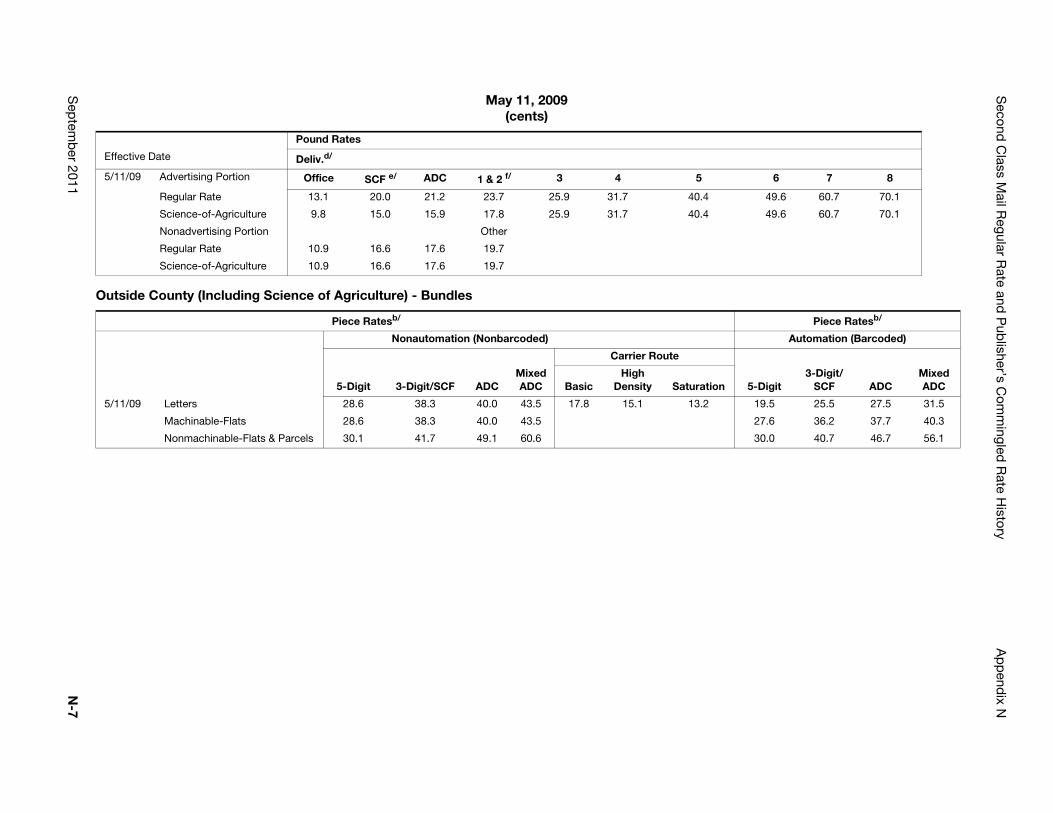
Second
Class M
ail Regular R
ate and P
ublisher’s C
omm
ingled R
ate History
Ap
pend
ix N
Sep
temb
er 2011N
-7
6 7 8
49.6 60.7 70.1
49.6 60.7 70.1
Piece Ratesb/
Automation (Barcoded)
5-Digit3-Digit/
SCF ADCMixed ADC
19.5 25.5 27.5 31.5
27.6 36.2 37.7 40.3
30.0 40.7 46.7 56.1
May 11, 2009 (cents)
Outside County (Including Science of Agriculture) - Bundles
Pound Rates
Effective Date Deliv.d/
5/11/09 Advertising Portion Office SCF e/ ADC 1 & 2 f/ 3 4 5
Regular Rate 13.1 20.0 21.2 23.7 25.9 31.7 40.4
Science-of-Agriculture 9.8 15.0 15.9 17.8 25.9 31.7 40.4
Nonadvertising Portion Other
Regular Rate 10.9 16.6 17.6 19.7
Science-of-Agriculture 10.9 16.6 17.6 19.7
Piece Ratesb/
Nonautomation (Nonbarcoded)
Carrier Route
5-Digit 3-Digit/SCF ADCMixed ADC Basic
High Density Saturation
5/11/09 Letters 28.6 38.3 40.0 43.5 17.8 15.1 13.2
Machinable-Flats 28.6 38.3 40.0 43.5
Nonmachinable-Flats & Parcels 30.1 41.7 49.1 60.6
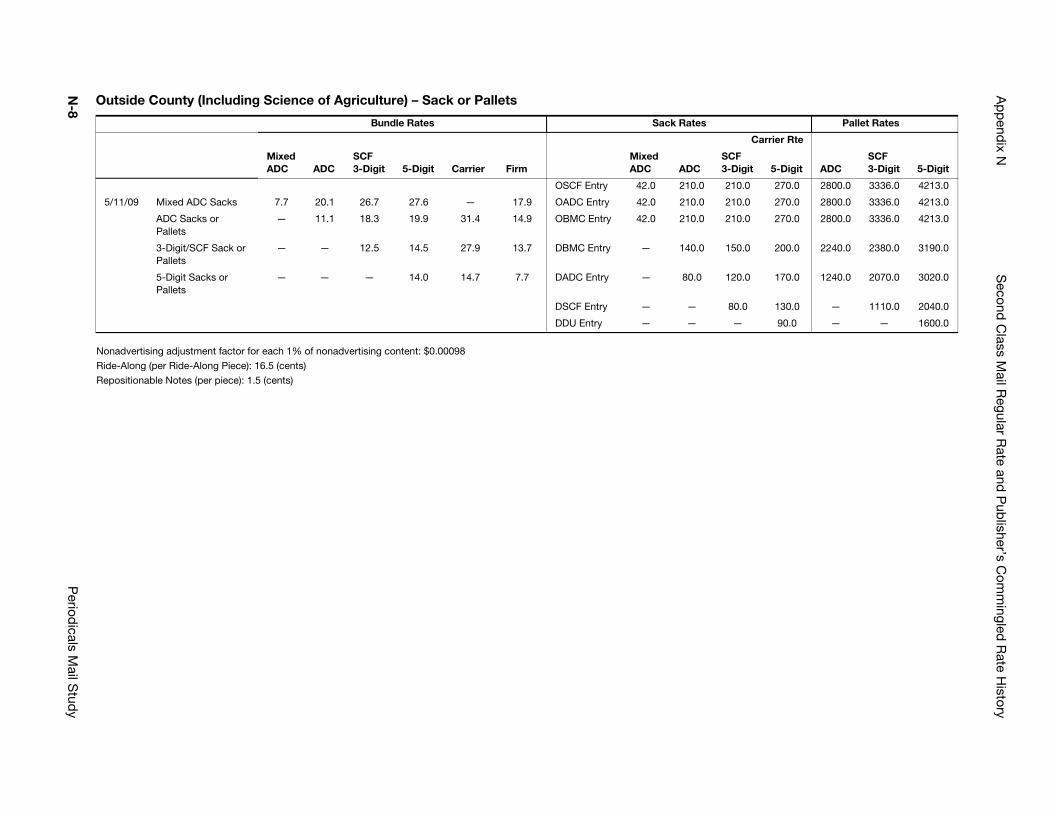
Ap
pend
ix NS
econd C
lass Mail R
egular Rate and
Pub
lisher’s Com
mingled
Rate H
istory
N-8
Period
icals Mail S
tudy
Pallet Rates
Carrier Rte
F Digit 5-Digit ADC
SCF 3-Digit 5-Digit
10.0 270.0 2800.0 3336.0 4213.0
10.0 270.0 2800.0 3336.0 4213.0
10.0 270.0 2800.0 3336.0 4213.0
50.0 200.0 2240.0 2380.0 3190.0
20.0 170.0 1240.0 2070.0 3020.0
0.0 130.0 — 1110.0 2040.0
— 90.0 — — 1600.0
Outside County (Including Science of Agriculture) – Sack or Pallets
Nonadvertising adjustment factor for each 1% of nonadvertising content: $0.00098
Ride-Along (per Ride-Along Piece): 16.5 (cents)
Repositionable Notes (per piece): 1.5 (cents)
Bundle Rates Sack Rates
Mixed ADC ADC
SCF 3-Digit 5-Digit Carrier Firm
Mixed ADC ADC
SC3-
OSCF Entry 42.0 210.0 2
5/11/09 Mixed ADC Sacks 7.7 20.1 26.7 27.6 — 17.9 OADC Entry 42.0 210.0 2
ADC Sacks or Pallets
— 11.1 18.3 19.9 31.4 14.9 OBMC Entry 42.0 210.0 2
3-Digit/SCF Sack or Pallets
— — 12.5 14.5 27.9 13.7 DBMC Entry — 140.0 1
5-Digit Sacks or Pallets
— — — 14.0 14.7 7.7 DADC Entry — 80.0 1
DSCF Entry — — 8
DDU Entry — —
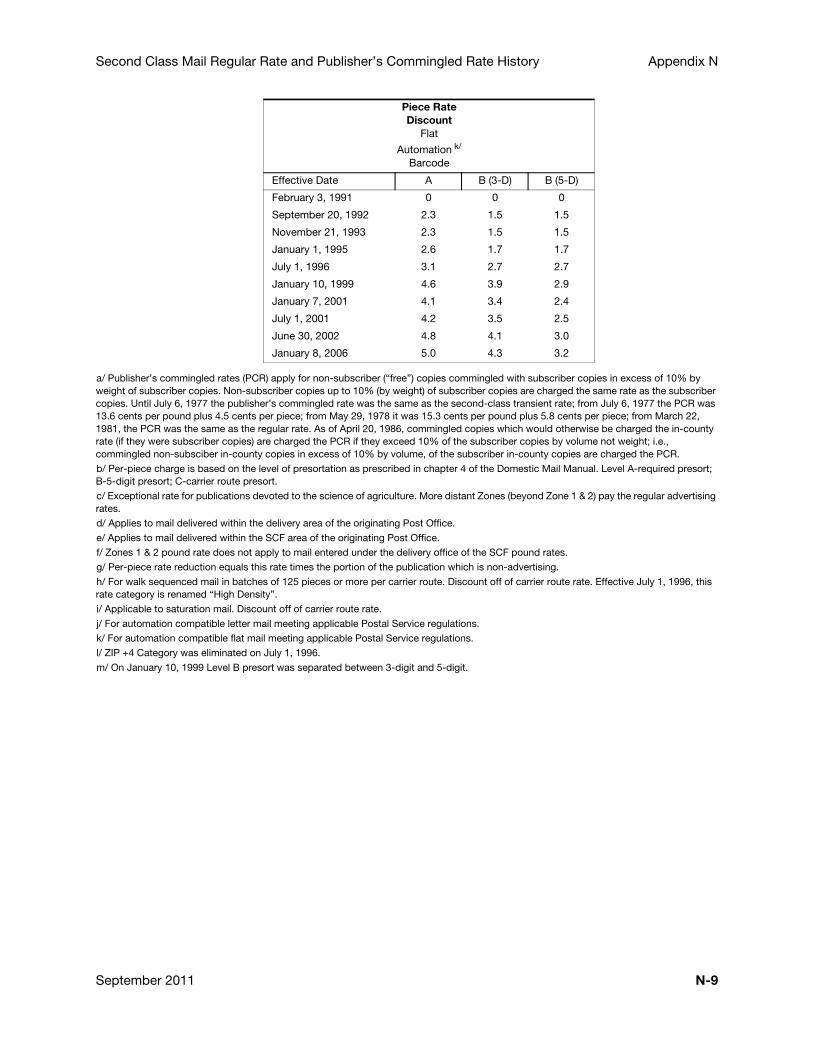
Second Class Mail Regular Rate and Publisher’s Commingled Rate History Appendix N
a/ Publisher’s commingled rates (PCR) apply for non-subscriber (“free”) copies commingled with subscriber copies in excess of 10% by weight of subscriber copies. Non-subscriber copies up to 10% (by weight) of subscriber copies are charged the same rate as the subscriber copies. Until July 6, 1977 the publisher’s commingled rate was the same as the second-class transient rate; from July 6, 1977 the PCR was 13.6 cents per pound plus 4.5 cents per piece; from May 29, 1978 it was 15.3 cents per pound plus 5.8 cents per piece; from March 22, 1981, the PCR was the same as the regular rate. As of April 20, 1986, commingled copies which would otherwise be charged the in-county rate (if they were subscriber copies) are charged the PCR if they exceed 10% of the subscriber copies by volume not weight; i.e., commingled non-subsciber in-county copies in excess of 10% by volume, of the subscriber in-county copies are charged the PCR.
b/ Per-piece charge is based on the level of presortation as prescribed in chapter 4 of the Domestic Mail Manual. Level A-required presort; B-5-digit presort; C-carrier route presort.
c/ Exceptional rate for publications devoted to the science of agriculture. More distant Zones (beyond Zone 1 & 2) pay the regular advertising rates.
d/ Applies to mail delivered within the delivery area of the originating Post Office.
e/ Applies to mail delivered within the SCF area of the originating Post Office.
f/ Zones 1 & 2 pound rate does not apply to mail entered under the delivery office of the SCF pound rates.
g/ Per-piece rate reduction equals this rate times the portion of the publication which is non-advertising.
h/ For walk sequenced mail in batches of 125 pieces or more per carrier route. Discount off of carrier route rate. Effective July 1, 1996, this rate category is renamed “High Density”.
i/ Applicable to saturation mail. Discount off of carrier route rate.
j/ For automation compatible letter mail meeting applicable Postal Service regulations.
k/ For automation compatible flat mail meeting applicable Postal Service regulations.
l/ ZIP +4 Category was eliminated on July 1, 1996.
m/ On January 10, 1999 Level B presort was separated between 3-digit and 5-digit.
Piece Rate Discount
Flat
Automation k/
Barcode
Effective Date A B (3-D) B (5-D)
February 3, 1991 0 0 0
September 20, 1992 2.3 1.5 1.5
November 21, 1993 2.3 1.5 1.5
January 1, 1995 2.6 1.7 1.7
July 1, 1996 3.1 2.7 2.7
January 10, 1999 4.6 3.9 2.9
January 7, 2001 4.1 3.4 2.4
July 1, 2001 4.2 3.5 2.5
June 30, 2002 4.8 4.1 3.0
January 8, 2006 5.0 4.3 3.2
September 2011 N-9
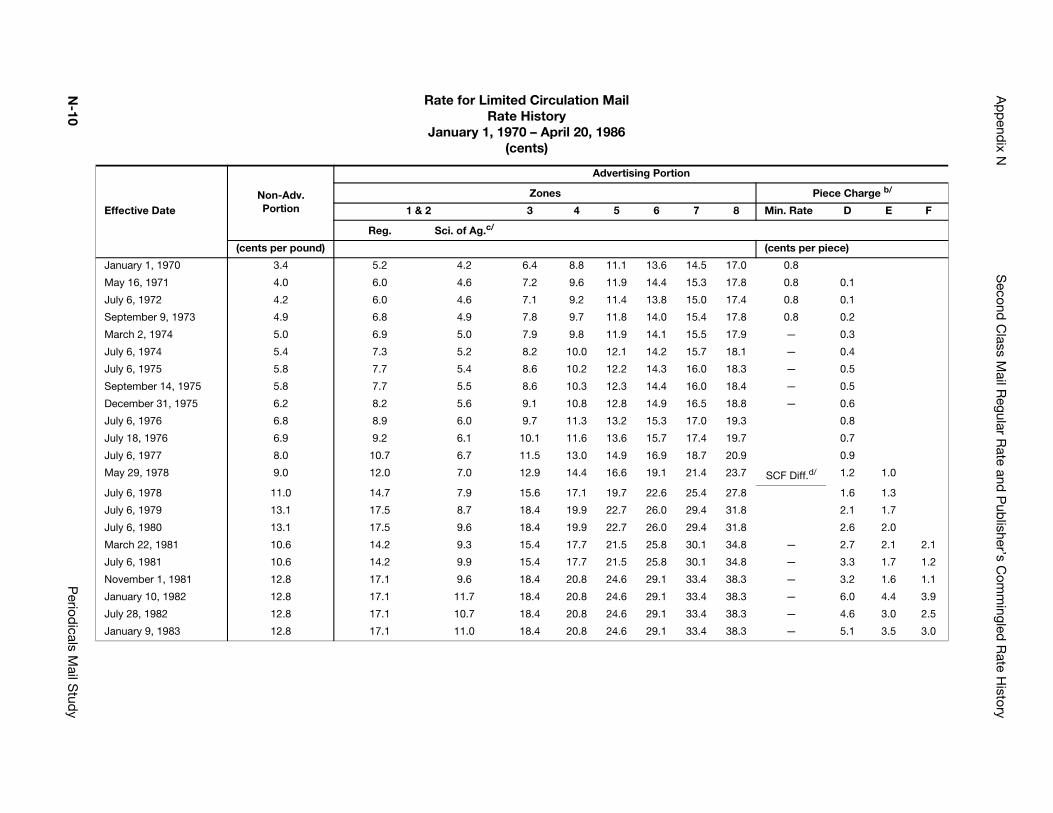
Ap
pend
ix NS
econd C
lass Mail R
egular Rate and
Pub
lisher’s Com
mingled
Rate H
istory
N-10
Period
icals Mail S
tudy
Piece Charge b/
8 Min. Rate D E F
(cents per piece)
7.0 0.8
7.8 0.8 0.1
7.4 0.8 0.1
7.8 0.8 0.2
7.9 — 0.3
8.1 — 0.4
8.3 — 0.5
8.4 — 0.5
8.8 — 0.6
9.3 0.8
9.7 0.7
0.9 0.9
3.7 SCF Diff.d/ 1.2 1.0
7.8 1.6 1.3
1.8 2.1 1.7
1.8 2.6 2.0
4.8 — 2.7 2.1 2.1
4.8 — 3.3 1.7 1.2
8.3 — 3.2 1.6 1.1
8.3 — 6.0 4.4 3.9
8.3 — 4.6 3.0 2.5
8.3 — 5.1 3.5 3.0
Rate for Limited Circulation MailRate History
January 1, 1970 – April 20, 1986(cents)
Effective DateNon-Adv. Portion
Advertising Portion
Zones
1 & 2 3 4 5 6 7
Reg. Sci. of Ag.c/
(cents per pound)
January 1, 1970 3.4 5.2 4.2 6.4 8.8 11.1 13.6 14.5 1
May 16, 1971 4.0 6.0 4.6 7.2 9.6 11.9 14.4 15.3 1
July 6, 1972 4.2 6.0 4.6 7.1 9.2 11.4 13.8 15.0 1
September 9, 1973 4.9 6.8 4.9 7.8 9.7 11.8 14.0 15.4 1
March 2, 1974 5.0 6.9 5.0 7.9 9.8 11.9 14.1 15.5 1
July 6, 1974 5.4 7.3 5.2 8.2 10.0 12.1 14.2 15.7 1
July 6, 1975 5.8 7.7 5.4 8.6 10.2 12.2 14.3 16.0 1
September 14, 1975 5.8 7.7 5.5 8.6 10.3 12.3 14.4 16.0 1
December 31, 1975 6.2 8.2 5.6 9.1 10.8 12.8 14.9 16.5 1
July 6, 1976 6.8 8.9 6.0 9.7 11.3 13.2 15.3 17.0 1
July 18, 1976 6.9 9.2 6.1 10.1 11.6 13.6 15.7 17.4 1
July 6, 1977 8.0 10.7 6.7 11.5 13.0 14.9 16.9 18.7 2
May 29, 1978 9.0 12.0 7.0 12.9 14.4 16.6 19.1 21.4 2
July 6, 1978 11.0 14.7 7.9 15.6 17.1 19.7 22.6 25.4 2
July 6, 1979 13.1 17.5 8.7 18.4 19.9 22.7 26.0 29.4 3
July 6, 1980 13.1 17.5 9.6 18.4 19.9 22.7 26.0 29.4 3
March 22, 1981 10.6 14.2 9.3 15.4 17.7 21.5 25.8 30.1 3
July 6, 1981 10.6 14.2 9.9 15.4 17.7 21.5 25.8 30.1 3
November 1, 1981 12.8 17.1 9.6 18.4 20.8 24.6 29.1 33.4 3
January 10, 1982 12.8 17.1 11.7 18.4 20.8 24.6 29.1 33.4 3
July 28, 1982 12.8 17.1 10.7 18.4 20.8 24.6 29.1 33.4 3
January 9, 1983 12.8 17.1 11.0 18.4 20.8 24.6 29.1 33.4 3

Second
Class M
ail Regular R
ate and P
ublisher’s C
omm
ingled R
ate History
Ap
pend
ix N
Sep
temb
er 2011N
-11
5-digit presort; F- carrier route presort.
ate.
publications.
8.9 1.0 6.3 3.7 1.8
8.9 1.0 8.4 5.8 3.9
8.9 1.0 9.0 6.4 4.5
a/ Applicable to publications mailing fewer than 5,000 copies per issue outside the county of publication.
b/ Per-piece charge is based on the level of presortation as prescribed in Chapter 4 of the Domestic Mail Manual. Level D- required presort; E-
c/ Exceptional rate for publications devoted to the science of agriculture.
d/ An SCF difference of 1.0 cent applies to mail destinating in the originating SCF area. The difference is subtracted from the applicable piece r
e/ Limited circulation rates were eliminated on April 20, 1986. Former limited circulation rate payers are charged the applicable rates for regular
February 17, 1985d/ 11.8 15.8 10.1 16.6 18.2 20.7 23.3 26.0 2
January 1, 1986d/ 11.8 15.8 10.1 16.6 18.2 20.7 23.3 26.0 2
March 9, 1986d/ 11.8 15.8 11.5 16.6 18.2 20.7 23.3 26.0 2
April 20, 1986e/

Appendix N
This page intentionally left blank
N-12 Periodicals Mail Study
Appendix O Periodicals Outside County Unit Cost Trends Over the Past Decade—Additional Analysis
This appendix further examines the six major “events” or influences on Periodicals Outside County unit costs which explain a lot of the trend and ups and downs of this period. It provides more detail on the comparison of growth in the Periodicals Outside County unit attributable costs to CPI and Postal Inflation Indices between FY 1999 and FY 2010. Table 1 provides this comparison. The indices in this table are discussed and defined, and the implications of the comparisons are described.
Table 1 shows the unit cost trend for Periodicals Outside County over the period FY 1999 to FY 2010 (see the highlighted section of the table). It also summarizes the annual average increases for the time period FY 2000 to FY 2010 and the two portions of this time period FY 2000 to FY 2007 and FY 2008 to FY 2010. Dividing the FY 2000 to FY 2010 period into two portions allows us to take a closer look at the six factors discussed in 5-7 and further consider what has driven the growth in Periodicals Outside County unit costs.
The Postal Service’s annual TFP filing provides two useful price indices, which can best be referred to as Postal Resource Inflation (PRI) and Postal Inflation (PI), which were both briefly discussed in 5-7 and shown in Table 1. PRI is an aggregate price index, reflecting the prices of all resources used by the Postal Service (labor, capital and materials).42 A parallel input price index for the economy as a whole might be a similar weighted average of the Employment Cost Index (ECI) for labor prices, perhaps the Producers Price Index (PPI) for input materials, and an index of annual rental prices for land, buildings, and durable equipment for capital.
PI is an aggregate “price” index of Postal Service products.43 This index essentially shows the increase in unit costs for Postal Service products or output in the aggregate. So PI is the aggregate index for the costs of Postal Service output, while PRI is the aggregate index of prices of inputs used by the Postal Service. The two are related in the TFP calculations in that PI is the difference between Postal Service productivity gains (or TFP)44 and PRI. PI represents the resource price increases not offset or mitigated by Postal Service productivity gains.
42. This price index is contained in the Total Factor Productivity (TFP) materials filed March 8, 2011 at the Commission, in the spreadsheet “Table Annual 2010.xls,” sheet “Tfp-49.” It is the aggregation of the Aggregate Labor Input Price index (sheet Lab-14), Aggregate Capital Input Price (sheet Cap-22) and the Aggregate Materials Input Price (sheet Mat-24).
43. This is sheet Tfp-51 in the TFP materials filed March 8, 2011.44. Postal Service productivity gains (or TFP) is contained in sheet Tfp-52 of the TFP materials filed March 8, 2011.
September 2011 O-1
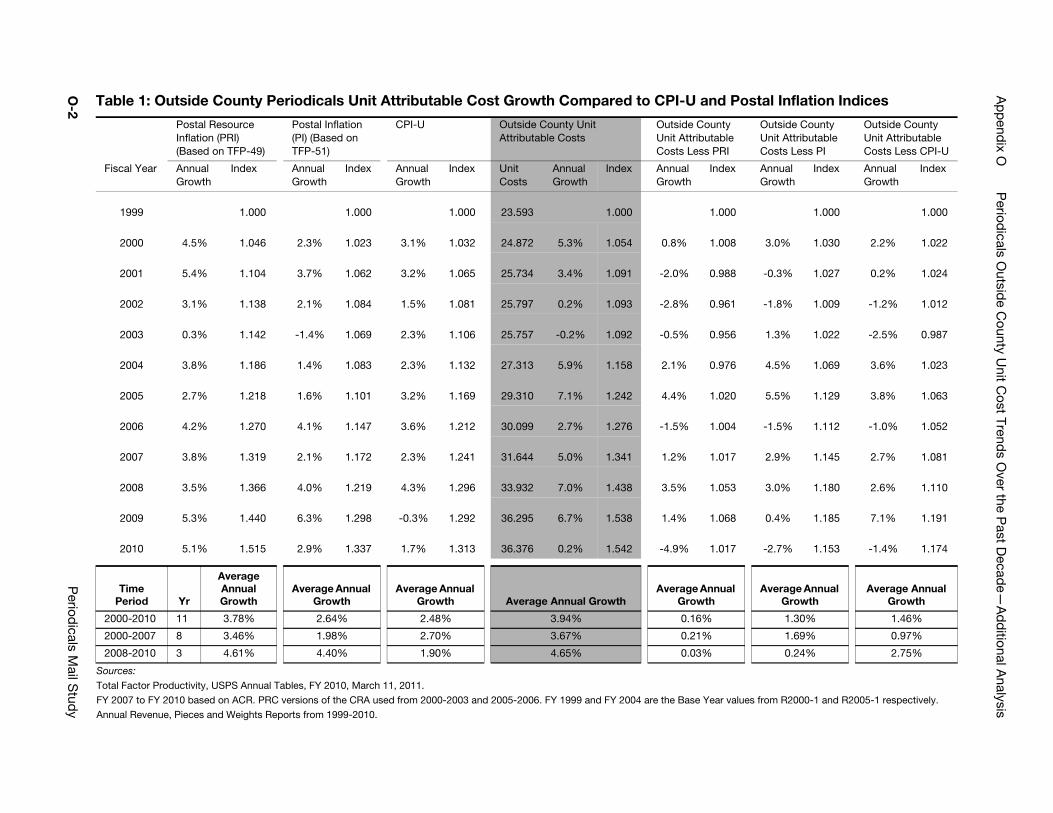
Ap
pend
ix OP
eriodicals O
utside C
ounty Unit C
ost Trends O
ver the Past D
ecade—
Ad
ditional A
nalysis
O-2
Period
icals Mail S
tudy
tal Inflation Indices
from R2000-1 and R2005-1 respectively.
Outside County Unit Attributable Costs Less PI
Outside County Unit Attributable Costs Less CPI-U
Annual Growth
Index Annual Growth
Index
1.000
1.000
3.0%
1.030 2.2%
1.022
-0.3%
1.027 0.2%
1.024
-1.8%
1.009 -1.2%
1.012
1.3%
1.022 -2.5%
0.987
4.5%
1.069 3.6%
1.023
5.5%
1.129 3.8%
1.063
-1.5%
1.112 -1.0%
1.052
2.9%
1.145 2.7%
1.081
3.0%
1.180 2.6%
1.110
0.4%
1.185 7.1%
1.191
-2.7%
1.153 -1.4%
1.174
Average Annual Growth
Average Annual Growth
1.30% 1.46%
1.69% 0.97%
0.24% 2.75%
Table 1: Outside County Periodicals Unit Attributable Cost Growth Compared to CPI-U and Pos
Sources:
Total Factor Productivity, USPS Annual Tables, FY 2010, March 11, 2011.
FY 2007 to FY 2010 based on ACR. PRC versions of the CRA used from 2000-2003 and 2005-2006. FY 1999 and FY 2004 are the Base Year values
Annual Revenue, Pieces and Weights Reports from 1999-2010.
Postal Resource Inflation (PRI) (Based on TFP-49)
Postal Inflation (PI) (Based on TFP-51)
CPI-U Outside County Unit Attributable Costs
Outside County Unit Attributable Costs Less PRI
Fiscal Year Annual Growth
Index Annual Growth
Index Annual Growth
Index Unit Costs
Annual Growth
Index Annual Growth
Index
1999 1.000
1.000
1.000
23.593
1.000
1.000
2000 4.5% 1.046 2.3%
1.023 3.1%
1.032
24.872 5.3%
1.054 0.8%
1.008
2001 5.4% 1.104 3.7%
1.062 3.2%
1.065
25.734 3.4%
1.091 -2.0%
0.988
2002 3.1% 1.138 2.1%
1.084 1.5%
1.081
25.797 0.2%
1.093 -2.8%
0.961
2003 0.3% 1.142 -1.4%
1.069 2.3%
1.106
25.757 -0.2%
1.092 -0.5%
0.956
2004 3.8% 1.186 1.4%
1.083 2.3%
1.132
27.313 5.9%
1.158 2.1%
0.976
2005 2.7% 1.218 1.6%
1.101 3.2%
1.169
29.310 7.1%
1.242 4.4%
1.020
2006 4.2% 1.270 4.1%
1.147 3.6%
1.212
30.099 2.7%
1.276 -1.5%
1.004
2007 3.8% 1.319 2.1%
1.172 2.3%
1.241
31.644 5.0%
1.341 1.2%
1.017
2008 3.5% 1.366 4.0%
1.219 4.3%
1.296
33.932 7.0%
1.438 3.5%
1.053
2009 5.3% 1.440 6.3%
1.298 -0.3%
1.292
36.295 6.7%
1.538 1.4%
1.068
2010 5.1% 1.515 2.9%
1.337 1.7%
1.313
36.376 0.2%
1.542 -4.9%
1.017
Time Period Yr
Average Annual Growth
Average Annual Growth
Average Annual Growth Average Annual Growth
Average Annual Growth
2000-2010 11 3.78% 2.64% 2.48% 3.94% 0.16%
2000-2007 8 3.46% 1.98% 2.70% 3.67% 0.21%
2008-2010 3 4.61% 4.40% 1.90% 4.65% 0.03%
Periodicals Outside County Unit Cost Trends Over the Past Decade—Additional Analysis Appendix O
CPI-U or CPI is an aggregate price index for consumer products. CPI-U is a measure of consumer price inflation (i.e., increases in the price level for consumer expenditures including housing, personal transportation, and consumer goods and services) and is also shown in Table 1.
We will use these indices, all shown in Table 1, in comparisons of growth in Periodicals Outside County unit costs in both time periods to better understand the six factors discussed in Chapter 5 and their role as drivers of its cost trends.
FY 2000 – FY 2007
During this period, Periodicals Outside County unit costs rose 3.7 percent per year on average, a slower rise than the overall period annual average growth of 3.9 percent for FY 2000 to FY 2010. Of the six events/factors discussed in 5-7 all but the fourth (large volume declines between FY 2007 and FY 2010) played an important role.
Perhaps most significant of these factors is the fifth factor, the rise in PRI, which rose an annual average 3.5 percent during this period. Reduction in the Postal Service obligation to prepay Civil Service Retirement System (CSRS) benefits and the offsetting new obligations for the Postal Service on retiree health benefits had a net effect of approximately a two percent decline in attributable costs. These changes are reflected in the PRI, so there is no need to consider them separately.
Furthermore, CPI grew by 2.7 percent per year, while PI only rose 2.0 percent a year. Therefore, aggregate Postal Service product costs grew at a slower pace than prices for consumer products. This was made possible by the growth in overall Postal Service productivity or TFP, which grew at 1.5 percent per year (the difference between PRI and PI) during this period.
Table 1 shows that the average annual difference in the growth of the unit costs of Outside County Periodicals and the PRI is 0.21 percent. A cursory analysis would conclude that the PRI or postal resource inflation drove the rise, and that Periodicals Outside County did not benefit from the general Postal Service 1.5 percent annual average gain in productivity in this period.
However, this conclusion does not consider three important events that especially pertained to Outside County Periodicals. First, the results of IOCS Redesign suggest that it is likely that in the years FY 1999 to FY 2003 Periodicals Outside County unit costs, which were based on the pre-redesign methodology, were understated by about 6 to 7 percent. Between FY 2003 and FY 2005, Periodicals Outside County mail processing unit costs (including indirect costs) rose by a little over 23 percent. Clerk and Mail handler cost per work hour rose by nearly 9 percent in this period, so that leaves IOCS redesign with a cumulative potential impact of 13 percent. Taking into account analysis done in Dockets R2005-1 and R2006-1, it is likely that IOCS redesign raised mail processing unit costs by 11 to 13 percent, which amounted to an average annual increase in total unit costs of approximately 5 to 6 percent. Adding the increase which the change in the
September 2011 O-3
Appendix O Periodicals Outside County Unit Cost Trends Over the Past Decade—Additional Analysis
IOCS brought to city carrier in-office costs, leads to the result that there was about a 7 percent increase in Periodical Outside County unit costs due to IOCS redesign.45
Second, during this period there was significant growth in worksharing by Periodicals Outside County mailers. For instance the share of carrier route presort mail grew from 43 percent to 51 percent. This would likely lead to significant reductions in mail processing costs and in delivery costs as well.
A full consideration of this IOCS redesign and the rise in worksharing require adjusting Periodicals unit costs to remove the understatement of costs prior to FY 2004 and an offsetting adjustment to raise Periodicals unit costs during this period, so as to remove the effect of the growth in worksharing. We could then compute the actual rise in Periodicals Outside County unit costs—removing the effects of IOCS redesign and growth in worksharing. To the extent the overstatement in actual growth in unit costs associated with IOCS redesign was larger than the reductions in unit cost growth due to growth in worksharing, the actual growth in unit costs (or growth in unit costs holding all else equal) is smaller than the reported 3.7 percent annual rate. Alternatively, if the benefits of worksharing exceeded the impact of IOCS Redesign, then the actual growth would be larger than the reported 3.7 percent annual rate.
Third, the 3.5 percent growth rate in Postal Service resource input prices, PRI, is a measure developed for all resources used by the Postal Service. It is not tailored to Periodicals Outside County attributable costs. To the extent that the aggregate resource mix used by the Postal Service differs from that included in Periodicals Outside County attributable costs, the PRI value pertinent to Periodicals Outside County would diverge from the aggregate PRI of 3.5 percent.
While it is clear that an important driver of the “reported” annual average rise in Periodicals Outside County unit costs of 3.7 percent is the increase in PRI prices, it is hard to say how the “actual” annual average growth in the unit cost compares with “actual” Periodicals Outside County resource input prices. As a result, we cannot determine whether or not Periodicals Outside County was able to share in the overall Postal Service productivity gains for this period. While Table 1 shows that the average annual difference in the growth of the unit costs of Outside County Periodicals and the PRI is 0.21 percent for this period, and one might conclude that Periodicals Outside County was not able to benefit from the overall productivity gains obtained
45. Of the many improvements stemming from IOCS Redesign, the most significant was an expansion of entries in the look-up table, starting in FY2004. In-Office Cost System (IOCS) data collectors use a look-up table, consisting of a list of Periodicals titles, to validate their identification of sampled mailpieces as Outside County Periodicals instead of some other class of mail. The expanded look-up table reduced the number of instances in which a Periodicals flat was mistakenly identified as a Standard Mail flat. Such misidentification of a Periodicals piece as a Standard Mail piece would have resulted in costs erroneously being assigned to Standard Mail, and would have understated costs assigned to Periodicals. IOCS Redesign was documented extensively in Docket No. R2006-1, Testimony of A. Thomas Bozzo, USPS-T-46. Also see Docket No. R2005-1, Postal Service Response to POIR No. 4, question 7 and Docket No. R2006-1, Postal Service Response to POIR No. 9, question 6 (revised Sept. 8, 2006).
O-4 Periodicals Mail Study

Periodicals Outside County Unit Cost Trends Over the Past Decade—Additional Analysis Appendix O
by the Postal Service and for most Postal Service products,46 this conclusion is much less likely after considering the probable impact of the IOCS Redesign.
FY 2008 - FY 2010
Large volume declines between FY 2007 and FY 2010 leading to significant productivity declines is a major factor affecting unit costs for this period. During FY 2007 to FY 2010, total mail volume declined about 20 percent. There was an even larger decline in total flats volume of nearly 29 percent; and the decline in non-carrier route presort flats volume was 41 percent. This led to excess capacity in delivery costs and in plant and equipment costs, as indicated in the Summer Sale 2009 filing (Docket No. R2009-3), since resources could not be reduced at the same pace as volumes. Workhour reductions did exceed volume declines in FY2010, thus reflecting some catching up with the volume declines in previous years.
The average annual increase in Periodicals Outside County unit costs between 2008 and 2010 was 4.6 percent, the average Postal Service product costs (PI), rose 4.4 percent, the average annual increase in the cost of postal inputs(PRI) was 4.6 percent, and TFP increased only approximately 0.23 percent per year. The large growth in PRI and the small gain in productivity account led to the 4.4 percent annual growth in PI, well above the annual average growth in the CPI of 1.9 percent. The larger rise in Periodicals Outside County unit costs as compared with PI, suggest that Periodicals Outside County was disproportionately affected by the absence of significant productivity gains. The growth in the share of carrier route presort from 51 percent to 59 percent imply even more productivity decline. This larger productivity decline may be the result of flats volume declines exceeding the overall volume declines.
Shifts in the composition of key Outside County Periodicals costs by function from FY 2007 to FY 2010 are evident in Table 2. This shows that the most significant contributors to the rise in Periodicals Outside County costs were mail processing and delivery. The largest contributor was the rise in delivery costs, as workhour reductions did not keep pace with the large volume declines. The rapid volume declines outstripped the Postal Service’s ability to adjust workhours even after reducing overtime and part-time workers.
Unit processing costs rose an average of 1.5 percent annually, which is well below the average annual 4.6 percent postal resource inflation rate, thus reflecting some gains in productivity in spite of the volume decline. This occurred due to significant processing (direct) labor work hour reductions in response to the volume decline; even though many plant and equipment indirect costs were not able to be reduced in this period. (It takes time to
46. While it is true that during the period FY 1999 to FY 2010 the Postal Service was working to automate flat sorting, Outside County Periodicals requires relatively little sortation. This is especially true in relation to First-Class Mail flats. The important difference between the two classes/products is that Outside County Periodicals are highly presorted. Over half is Carrier Route presort, and most of the remaining volume is 5-digit presort, which gets only one sort. So this likely explains why the processing unit costs for First-Class Mail flats over this period have risen a lot less than than the rise in postal labor costs in contrast to the processing costs for Periodicals.
September 2011 O-5
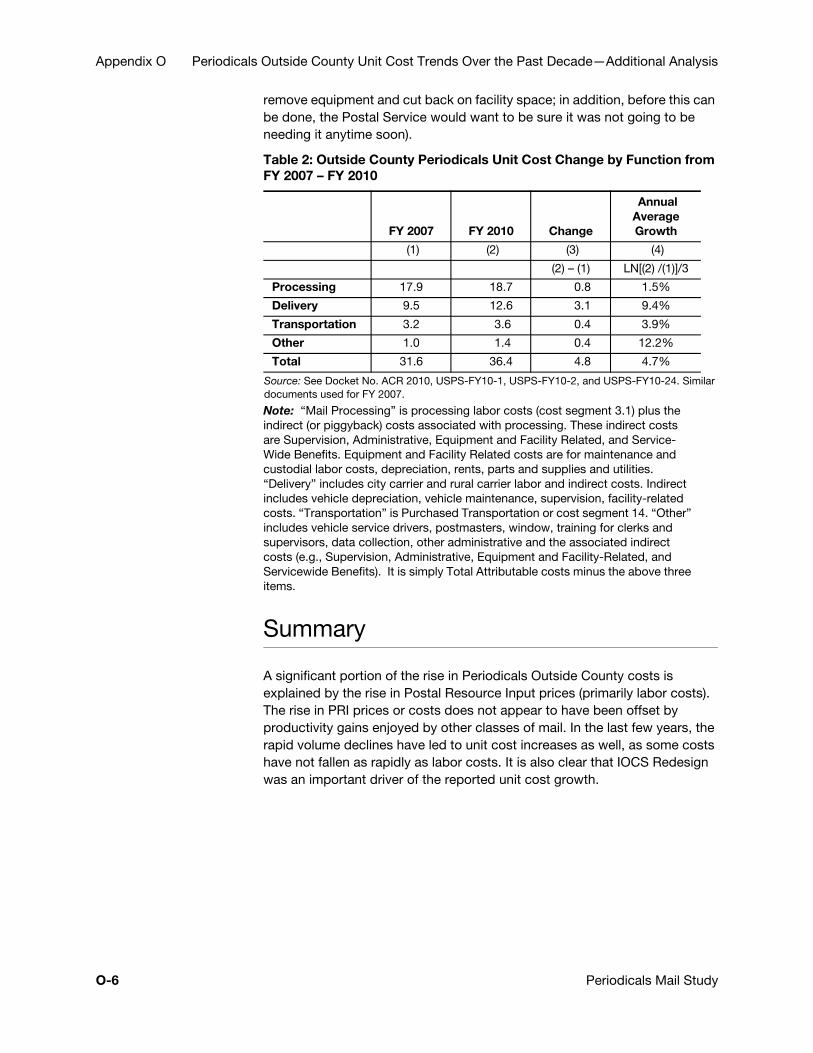
Appendix O Periodicals Outside County Unit Cost Trends Over the Past Decade—Additional Analysis
remove equipment and cut back on facility space; in addition, before this can be done, the Postal Service would want to be sure it was not going to be needing it anytime soon).
Table 2: Outside County Periodicals Unit Cost Change by Function from FY 2007 – FY 2010
Source: See Docket No. ACR 2010, USPS-FY10-1, USPS-FY10-2, and USPS-FY10-24. Similar documents used for FY 2007.
Note: “Mail Processing” is processing labor costs (cost segment 3.1) plus the indirect (or piggyback) costs associated with processing. These indirect costs are Supervision, Administrative, Equipment and Facility Related, and Service-Wide Benefits. Equipment and Facility Related costs are for maintenance and custodial labor costs, depreciation, rents, parts and supplies and utilities. “Delivery” includes city carrier and rural carrier labor and indirect costs. Indirect includes vehicle depreciation, vehicle maintenance, supervision, facility-related costs. “Transportation” is Purchased Transportation or cost segment 14. “Other” includes vehicle service drivers, postmasters, window, training for clerks and supervisors, data collection, other administrative and the associated indirect costs (e.g., Supervision, Administrative, Equipment and Facility-Related, and Servicewide Benefits). It is simply Total Attributable costs minus the above three items.
Summary
A significant portion of the rise in Periodicals Outside County costs is explained by the rise in Postal Resource Input prices (primarily labor costs). The rise in PRI prices or costs does not appear to have been offset by productivity gains enjoyed by other classes of mail. In the last few years, the rapid volume declines have led to unit cost increases as well, as some costs have not fallen as rapidly as labor costs. It is also clear that IOCS Redesign was an important driver of the reported unit cost growth.
FY 2007 FY 2010 Change
Annual Average Growth
(1) (2) (3) (4)
(2) – (1) LN[(2) /(1)]/3
Processing 17.9 18.7 0.8 1.5%
Delivery 9.5 12.6 3.1 9.4%
Transportation 3.2 3.6 0.4 3.9%
Other 1.0 1.4 0.4 12.2%
Total 31.6 36.4 4.8 4.7%
O-6 Periodicals Mail Study
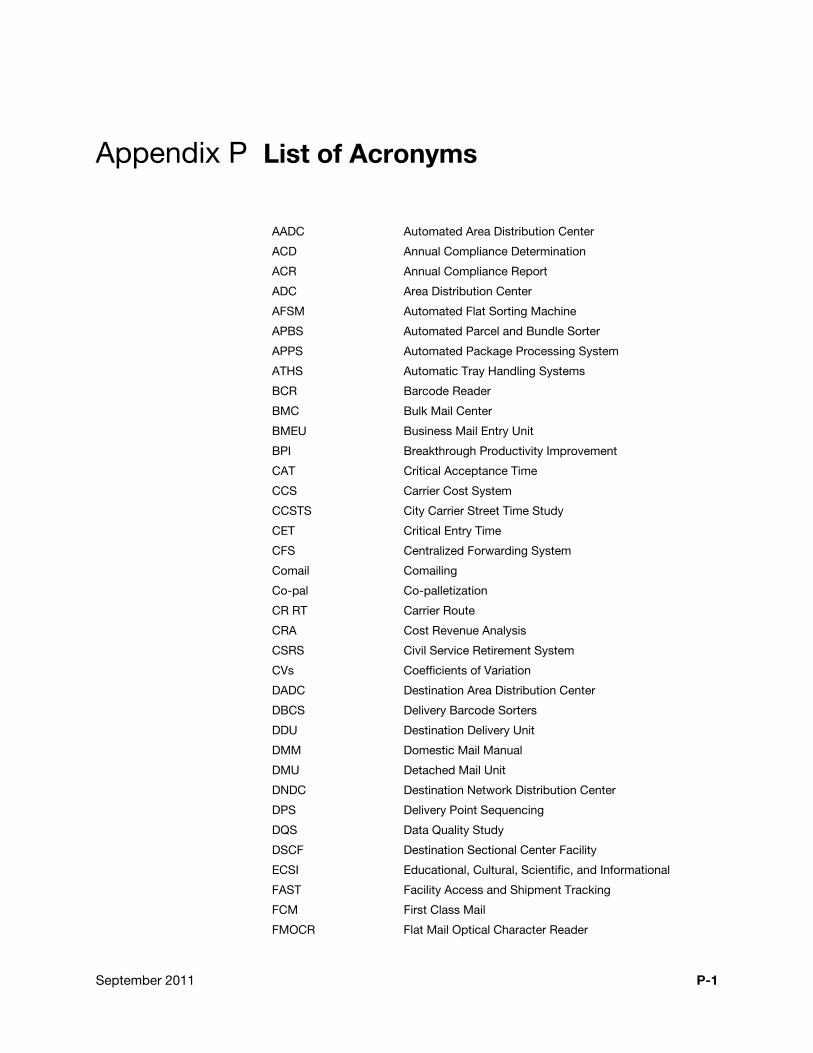
Appendix P List of Acronyms
AADC Automated Area Distribution Center
ACD Annual Compliance Determination
ACR Annual Compliance Report
ADC Area Distribution Center
AFSM Automated Flat Sorting Machine
APBS Automated Parcel and Bundle Sorter
APPS Automated Package Processing System
ATHS Automatic Tray Handling Systems
BCR Barcode Reader
BMC Bulk Mail Center
BMEU Business Mail Entry Unit
BPI Breakthrough Productivity Improvement
CAT Critical Acceptance Time
CCS Carrier Cost System
CCSTS City Carrier Street Time Study
CET Critical Entry Time
CFS Centralized Forwarding System
Comail Comailing
Co-pal Co-palletization
CR RT Carrier Route
CRA Cost Revenue Analysis
CSRS Civil Service Retirement System
CVs Coefficients of Variation
DADC Destination Area Distribution Center
DBCS Delivery Barcode Sorters
DDU Destination Delivery Unit
DMM Domestic Mail Manual
DMU Detached Mail Unit
DNDC Destination Network Distribution Center
DPS Delivery Point Sequencing
DQS Data Quality Study
DSCF Destination Sectional Center Facility
ECSI Educational, Cultural, Scientific, and Informational
FAST Facility Access and Shipment Tracking
FCM First Class Mail
FMOCR Flat Mail Optical Character Reader
September 2011 P-1
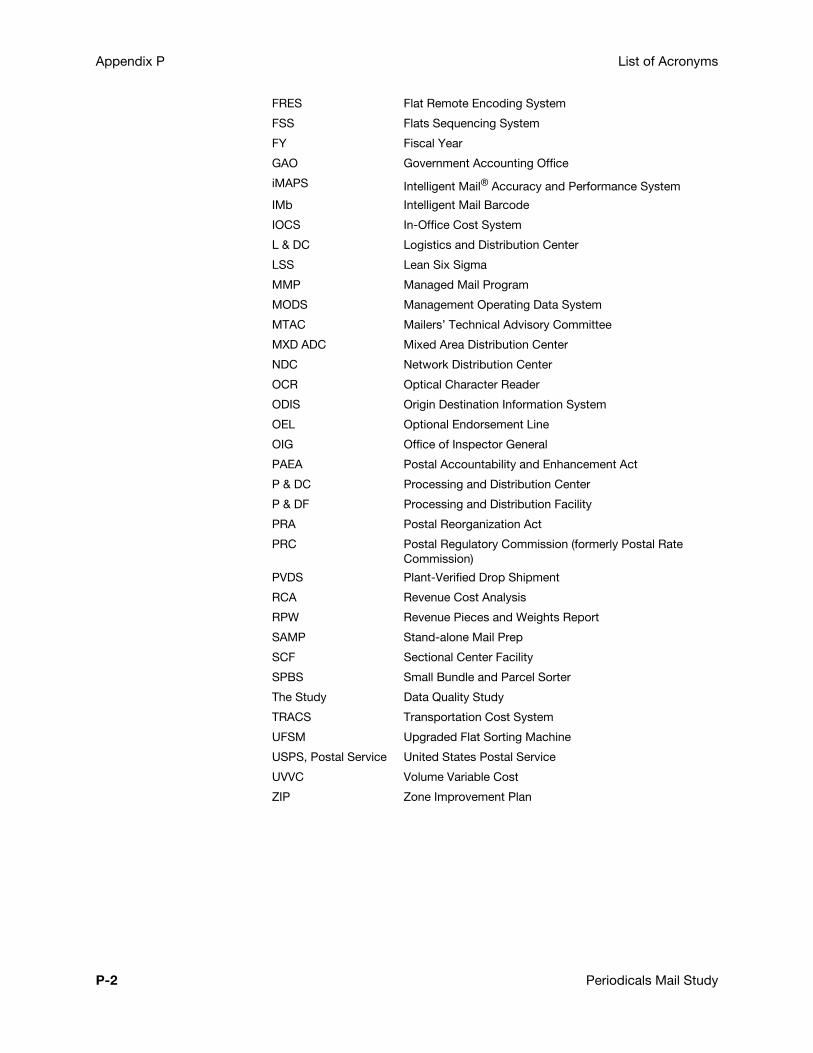
Appendix P List of Acronyms
FRES Flat Remote Encoding System
FSS Flats Sequencing System
FY Fiscal Year
GAO Government Accounting Office
iMAPS Intelligent Mail® Accuracy and Performance System
IMb Intelligent Mail Barcode
IOCS In-Office Cost System
L & DC Logistics and Distribution Center
LSS Lean Six Sigma
MMP Managed Mail Program
MODS Management Operating Data System
MTAC Mailers’ Technical Advisory Committee
MXD ADC Mixed Area Distribution Center
NDC Network Distribution Center
OCR Optical Character Reader
ODIS Origin Destination Information System
OEL Optional Endorsement Line
OIG Office of Inspector General
PAEA Postal Accountability and Enhancement Act
P & DC Processing and Distribution Center
P & DF Processing and Distribution Facility
PRA Postal Reorganization Act
PRC Postal Regulatory Commission (formerly Postal Rate Commission)
PVDS Plant-Verified Drop Shipment
RCA Revenue Cost Analysis
RPW Revenue Pieces and Weights Report
SAMP Stand-alone Mail Prep
SCF Sectional Center Facility
SPBS Small Bundle and Parcel Sorter
The Study Data Quality Study
TRACS Transportation Cost System
UFSM Upgraded Flat Sorting Machine
USPS, Postal Service United States Postal Service
UVVC Volume Variable Cost
ZIP Zone Improvement Plan
P-2 Periodicals Mail Study