permeability of bacterial spores results were plotted as a
TRANSCRIPT
PERMEABILITY OF BACTERIAL SPORES
II. MOLECULAR VARIABLES AFFECTING SOLUTE PERMEATION
PHILIPP GERHARDT AND S. H. BLACK
Department of Bacteriology, The University of Michigan Medical School, Ann Arbor, Michigan
Received for publication May 15, 1961
ABSTRACT
GERHARDT, PHILIPP (University of Michigan,Ann Arbor) AND S. H. BLACK. Permeability ofbacterial spores. II. Molecular variables affectingsolute permeation. J. Bacteriol. 82:750-760.1961.-More than 100 compounds were testedfor their uptake by dormant spores of a bacillus.The extent of penetration was found to bedependent on at least three molecular properties:(i) The dissociation of electrolytes usuallyresulted in high or low uptake predictable fromtheir charge. (ii) Lipid insolubility restrictedpermeation of small molecules. (iii) The molecularweight of unsubstituted glycol and sugarpolymers exponentially limited penetration toeventual exclusion at mol wt above 160,000. Theresults were plotted as a generalized curve,calculations from which permitted an inter-pretation that the effective spore surface containspores varying in diameter from 10 to 200 A.
Dismissal of the hypothesis that dormantspores are completely impermeable has beenafforded by a demonstration of glucose penetra-tion occurring as passive diffusion (Black andGerhardt, 1961). It follows that spores should bepermeable also to other molecules similar toglucose; moreover, an examination of unlikematerials might reveal the molecular variablesgoverning the penetration of solutes into dormantspores. Accordingly, a survey was made ofrepresentative compounds, including sugars andsugar alcohols and polymers, glycols and poly-glycols, amino acids and polypeptides, organicacids, dyes, inorganic salts, other selected solutes,and water.
MATERIALS AND METHODS
Details of the experimental procedures havebeen published before (Black and Gerhardt,1961). Clean dormant spores of the same testorganism, Bacillus cereus strain terminalis, were
used. The extent of uptake of exogenous solutesagain was assessed by the space technique: theresulting uncorrected space value (SW) indicatesthe extent of penetration into the spore pack(centrifuged for 30 min at 17,000 X g), whereasthe corrected space value (RW) allows for inter-stitial space (SjJw) and shows the extent towhich the spore itself is penetrated. Theseindices of total uptake were calculated on aspore weight basis, as indicated by the super-script w. Unless otherwise indicated, the permea-bility determinations were made at neutral pHwith freshly prepared solutions.The dilution of added solute by pack or cell
water, which is the basis of the space method,was assayed (at least in duplicate) gravimetri-cally, isotopically, by carbon combustion, or bythe anthrone reaction for carbohydrates (Blackand Gerhardt, 1961). When specific analyseswere made, polyethylene glycols of high molecularweight were analyzed by the silicotungstic acidprecipitation method of Shaffer and Critchfield(1947), inorganic phosphate by the method ofFiske and SubbaRow (1925), and tritium-labeled water by liquid scintillation spectrometry.The method of analysis for a given compound isnot specified below, because the measurement ofuptake was found to be independent of the assaytechnique.
RESULTS
The spore permeability determinations with113 representative compounds are compiled inTable 1. The experimental conditions werecomparable for different compounds, althoughsome variations were employed; for example,materials of low molecular weight that might bemetabolized were used at 4 C instead of 25 C,and large molecules that required a longerequilibration period were allowed to react for atleast 60 min to insure complete and reproducibleuptake (see below). The number of determina-tions and the range in values for SW, the solute
750
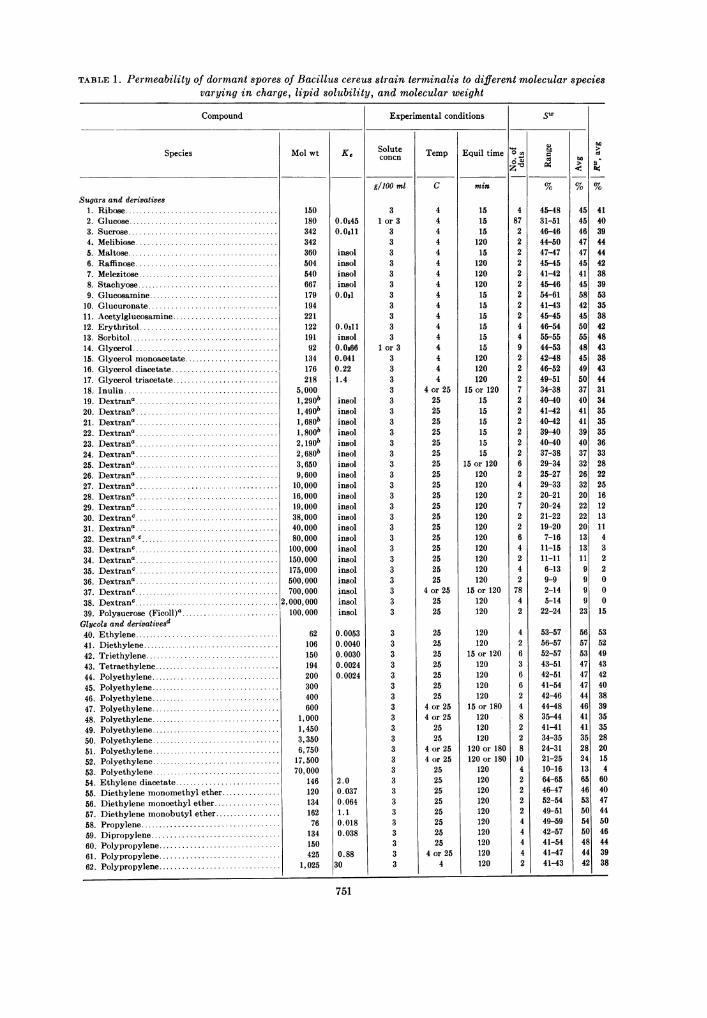
TABLE 1. Permeability of dormant spores of Bacillus cereus strain terminalis to different molecular speciesvarying in charge, lipid solubility, and molecular weight
Compound
Species
Sugars and derivatives1. Ribseo.2. Glucose.3. Sucrose.4. Melibiose.5. Maltose.6. Raffinose.7. Melezitose.8. Stachyose.9. Glucosamine.
10. Glucuronate.11. Acetylglucosamine.12. Erythritol.13. Sorbitol.14. Glycerol.15. Glycerol monoacetate.16. Glycerol diacetate.17. Glycerol triacetate.18. Inulin.19. Dextran..20. Dextrana.21. Dextran..22. Dextrana.23. Dextrana.24. Dextran..25. Dextrana.26. Dextrana.27. Dextrana.28. Dextrana.29. Dextrana.30. Dextran..31. Dextrana.32. Dextranac.33. Dextranc.34. Dextran..35. Dextranc.36. Dextrana.37. Dextranc.38. Dextranc......................................39. Polysucrose (Ficoll)a.Glycols and derivativesd40. Ethylene.41. Diethylene.42. Triethylene.43. Tetraethylene.44. Polyethylene.45. Polyethylene.46. Polyethylene.47. Polyethylene.48. Polyethylene.49. Polyethylene.50. Polyethylene.51. Polyethylene.52. Polyethylene.53. Polyethylene.54. Ethylene diacetate.55. Diethylene monomethyl ether.56. Diethylene monoethyl ether.57. Diethylene monobutyl ether.58. Propylene.59. Dipropylene.60. Polypropylene.61. Polypropylene.62. Polypropylene.
Molwt K,
150180 0.045342 0.0611342360 insol504 insol540 insol667 insol179 0.031194221122 0.0311191 insol92 0.0&66134 0.041176 0.22218 1.4
5,0001,290b insol1, 490b insol1,680b insol1, 800b insol2, gob insol2, 680b insol3,650 insol9,600 insol10,000 insol16,000 insol19,000 insol38,000 insol40,000 insol80,000 insol100,000 insol150,000 insol175,000 insol500,000 insol700,000 insol
2,000,000 insol100,000 insol
62 0.0053106 0.0040150 0.0030194 0.0024200 0.0024300400600
1,0001,4503,3506,75017,50070,000
146 2.0120 0.037134 0.064162 1.176 0.018134 0.038150425 0.88
1,025 30
Experimental conditions SW
Soluteconcn
g/100 ml
31 or 3
33333333333
1 or 33333333333333333333333333
33333333333333333333333
Temp E
C
44444444444444444
4 or 2525252525252525 12525252525252525252525
4 or 252525
25252525252525
4 or 254 or 25
2525
4 or 254 or 25
2525252525252525
4 or 254
Equil time 13.6W4
min
151515
12015
120120120151515151515
120120120
15 or 120151515151515
15 or 120120120120120120120120120120120120
15 or 120120120
120120
15 or 120120120120120
15 or 180120120120
120 or 180120 or 180
120120120120120120120120120120
751
ko
I
4140394444423839533538424843384344313435353536332822251612131143220
0
0
15
535249434240383935352820154604047445046443938
45-48 4531-51 4546-46 4644-50 4747-47 4745-45 4541-42 4145-46 4554-61 5841-43 4245-45 4546-54 5055-55 5544-53 4842-48 4546-52 4949-51 5034-38 3740-40 4041-42 4140-42 4139-40 3940-40 4037-38 3729-34 3225-27 2629-33 3220-21 2020-24 2221-22 2219-20 207-16 1311-15 1311-11 116-13 99-9 92-14 95-14 9
22-24 23
53-57 5656-57 5752-57 5343-51 4742-51 4741-54 4742-46 4444-48 4635-44 4141-41 4134-35 3524-31 2821-25 2410-16 1364-65 6546-47 4652-54 5349-51 5049-59 5442-57 5041-54 4841-47 4441-43 42
48722222222244922272222226242722642427842
426366248228104222244442
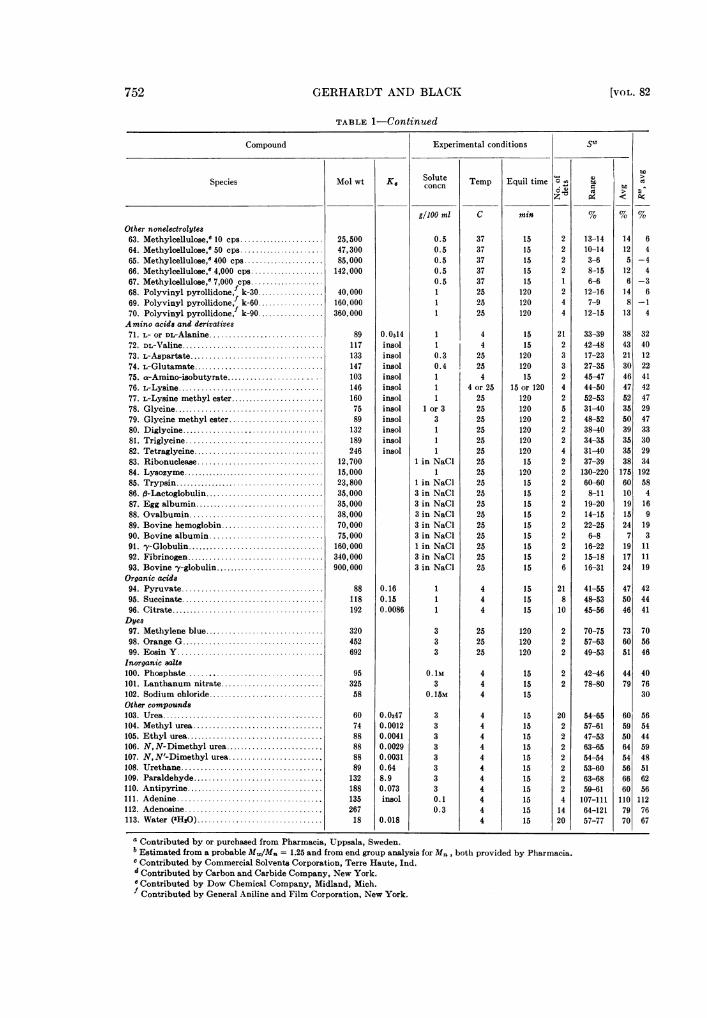
752 GERHARDT AND BLACK [VOL. 82
TABLE 1-Continued
Compound Experimental conditions SW
ts
Species Mol wt K, TepqSolute'O Aconcn TepEui ie to6w7~~m > B
gIlOO ml C min % % %Other nonelectrolytes63. Methylcellulose,e 10 cps ......... ............. 25,500 0.5 37 15 2 13-14 14 664. Methylcellulose,e50 cps...................... 47,300 0.5 37 15 2 10-14 12 465. Methylcellulose,c400 cps..................... 85,000 0.5 37 15 2 3-6 5 -466. Methylcellulose,e4,000 cps................... 142,000 0.5 37 15 2 8-15 12 467. Methylcellulose, 7,000 cps0....................5 37 15 1 6-6 6 -368. Polyvinyl pyrollidone,1 k-30................. 40,000 1 25 120 2 12-16 14 669. Polyvinyl pyrollidone, k-60................. 160,000 1 25 120 4 7-9 8 -170. Polyvinyl pyrollidone,f k-90 ........ ......... 360,000 1 25 120 4 12-15 13 4Amino acids and derivatives71. L- or DL-Alanine ................ ............. 89 0.0514 1 4 15 21 33-39 38 3272. DL-Valine.................................... 117 insol 1 4 15 2 42-48 43 4073. L-Aspartate.................................. 133 insol 0.3 25 120 3 17-23 21 1274. L-Glutamate................................. 147 insol 0.4 25 120 3 27-35 30 2275. as-Amino-isobutyrate.................... 103 insol 1 4 15 2 45-47 46 4176. L-Lysine..................................... 146 insol 1 4 or 25 15 or 120 4 44-50 47 4277. L-Lysine methyl ester........................ 160 insol 1 25 120 2 52-53 52 4778. Glycine...................................... 75 insol 1 or 3 25 120 5 31-40 35 2979. Glycine methyl ester......... ............... 89 insol 3 25 120 2 48-52 50 4780. Diglycine.................................... 132 insol 1 25 120 2 38-40 39 3381. Triglycine................................... 189 insol 1 25 120 2 34-35 35 3082. Tetraglycine................................. 246 insol 1 25 120 4 31-40 35 2983. Ribonuclease................................ 12,700 1 in NaCl 25 15 2 37-39 38 3484. Lysozyme..................................... 15,000 1 25 120 2 130-220 175 19285. Trypsin...................................... 23,800 1 in NaCI 25 15 2 60-60 60 5886. ft-Lactoglobulin.............................. 35,000 3 in NaCl 25 15 2 8-11 10 487. Egg albumin ................................. 35,000 3 in NaCl 25 15 2 19-20 19 1688. Ovalbumin.................................. 38,000 3 in NaCl 25 15 2 14-15 15 989. Bovine hemoglobin ........... ............... 70,000 3 in NaCl 25 15 2 22-25 24 1990. Bovine albumin............................. 75,000 3 in NaCl 25 15 2 6-8 7 391. y-Globulin................................... 160,000 1 in NaCl 25 15 2 16-22 19 1192. Fibrinogen................................... 340,000 3 in NaCl 25 15 2 15-18 17 1193. Bovine -y-globulin............................ 900,000 3 in NaCl 25 15 6 16-31 24 19Organic acids94. Pyruvate.................................... 88 0.16 1 4 15 21 41-55 47 4295. Succinate.................................... 118 0.15 1 4 15 8 48-53 50 4496. Citrate...................................... 192 0.0086 1 4 15 10 45-56 46 41Dyes97. Methylene blue.............................. 320 3 25 120 2 70-75 73 7098. Orange G.................................... 452 3 25 120 2 57-63 60 5699. Eosin Y..................................... 692 3 25 120 2 49-53 51 46Inorganic salts100. Phosphate . .............................. 95 O.1M 4 15 2 42-46 44 40101. Lanthanum nitrate.......................... 325 3 4 15 2 78-80 79 76102. Sodium chloride............................. 58 0.15M 4 15 30Other compounds103. Urea...................................... 60 0.0347 3 4 15 20 54-65 60 56104. Methyl urea ................................. 74 0.0012 3 4 15 2 57-61 59 54105. Ethyl urea................................... 88 0.0041 3 4 15 2 47-53 50 44106. N, N-Dimethyl urea........ ................. 88 0.0029 3 4 15 2 63-65 64 59107. N, N'-Dimethyl urea...... .................. 88 0.0031 3 4 15 2 54-54 54 48108. Urethane.................................... 89 0.64 3 4 15 2 53-60 56 51109. Paraldehyde................................. 132 8.9 3 4 15 2 63-68 66 62110. Antipyrine................................... 188 0.073 3 4 15 2 59-61 60 56111. Adenine....... 135 insol 0.1 4 15 4 107-111 110 112112. Adenosine.267 0.3 4 15 14 64-121 79 76113. Water (HsO).18 0.018 4 15 20 57-77 70 67
Contributed by or purchased from Pharmacia, Uppsala, Sweden.b Estimated from a probable Mw/Mn = 1.25 and from end group analysis for Mn, both provided by Pharmacia.c Contributed by Commercial Solvents Corporation, Terre Haute,Ind.d Contributed by Carbon and Carbide Company, New York." Contributed by Dow Chemical Company, Midland, Mich.Contributed by General Aniline and Film Corporation, New York.
VARIABLES IN SPORE PERMEABILITY
space of the spore pack, allow judgment ofreliability and variability. The values for RW, thesolute space of the spore itself, were derived byaveraging individual S801w values and correctingfor an Si.- value determined in each group ofexperiments.
Molecular species. The results shown in Table1 reveal that all of the small molecules penetrateddormant spores. The Rw value found for glucose(Black and Gerhardt, 1961) was approximatedby other sugars and also by many dissimilarcompounds. It appears, therefore, that smallmolecules typically permeate these spores to an
extent of about 40% of the spore weight.The molecular species in itself did not seem to
influence the uptake by spores, as would beexpected for an inactive, diffusional process. Norwas specificity observed for physiologicallysignificant compounds, for example those metab-olizable or required for germination. Contraryto common notion, several dyes were found topenetrate spores, a fact which also was observedmicroscopically in spores stained but left un-
washed. The uniform distribution and intensityof staining provided evidence that permeabilitywas equal for all the spores in the population.As the solvent for other permeating molecules,
water is pivotal in a study of spore permeability.Tritium-labeled water had a mean RW value of67% in 20 replicate determinations, and is beingemployed further to determine spore watercontent and distribution.
Molecular dissociation and charge. The survey
of permeability determinations revealed a
general difference in uptake between electrolytesand nonelectrolytes, the former often showingunusually high (in comparison to glucose uptake)or low space values attributable to the electro-static charge of ionized radicals, with resultantattraction or repulsion depending on the prev-
alence of charges in the molecule and on thespore surface. Douglas' (1959) electrophoresisstudies led him to suggest that both carboxyl andamino groups are present on the surface of a
dormant spore and that they are isoelectric atpH 7; at low pH, the surface amino groups tendto ionize, producing a net positive charge. Ifthis is the case with spores of B. cereus strainterminalis, acidic molecules should be taken upless than their neutral counterparts at the usualneutral pH of permeability determinations.Examples were found among the substituted
TABLE 2. Effect of pH on uptakeof citrate and succinate
Recovery inSolute pH Rw 2 water
washes
Citrate 7.0 44 912.3 175 47
Succinate 7.0 46 952.3 107 42
sugars (e.g., glucuronate) and the amino acids(e.g., glutamate and aspartate), although un-explained exceptions occurred (e.g., glyceroltriacetate and organic acids); similarly, esterifica-tion of carboxyl groups was observed to cause anincrease in the uptake of amino acids (e.g.,glycine and lysine methyl esters). On the otherhand, if the pH is lowered, acidic molecules shouldbe taken up to a greater extent and be held morefirmly. A confirmation of this prediction isillustrated in Table 2. With a pH change from 7to 2.3, the Rw values for citric and succinic acidrose and the extent of recovery from water-washes fell.An opposite effect should cccur when basic
substances are used. At neutrality, unusually highuptake values were thus expected and frequentlydid happen with such compounds (e.g., glu-cosamine, methylene blue, adenine, but notlysine). Furthermore, when the pH was changedfrom 7 to 2, the Rw value for methylene blue, forexample, fell from 70 to 54, and an increasedamount of dye was recovered by washing.
Lipid solubility. Quantitative assessment ofthis molecular variable in spore permeability hasprecedence in animal, plant, and bacterialstudies, notably in the extensive work ofCollander (1957) with algae. In view of reports(Yoshida et al., 1957; Salton and Marshall, 1959)that the coat of spores is rich in fatty materials,homologous compounds with a range in lipidsolubility were included among the test materialsin Table 1. Partition coefficients (Ke) in a diethylether-water system (Collander, 1949, 1950,1954, 1960) were arbitrarily chosen as an index oflipid solubility because the composition of sporelipids is not known. Analysis of this factor wasnecessarily restricted to nonelectrolytes.
Unsubstituted sugars below mol wt 700 werefound to penetrate spores to a limited and con-
7531961]
GERHARDT AND BLACK
stant degree (RW about 40%). These substancesare virtually insoluble in lipid, with Ke valuesless than 0.00001. Unless influenced by charge,other like materials (e.g., amino acids) usuallybehaved similarly. The suggestion is thus madethat lipid insolubility generally restricts solutepermeation into spores.Beyond this generalization, however, a clear
relationship could not be established betweenlipid solubility of small molecules and sporepermeability. That is, small lipid-soluble mole-cules penetrated spores more than lipid-insolubleones, but the degree of further penetration wasnot correlated with increasing Ke values. Thiswas exemplified by the glycerol derivatives:although increased acetate esterification impartsa greatly increased solubility in ether, it did notresult in significant changes in uptake. Anotherexample was seen in the series of nonpolar poly-propylene glycols, in which a 1,000-fold increasein lipid solubility was accompanied by a de-creasing trend in penetrability. This trend will beshown below to be directly related to molecularweight.The validity of the results with lipid-soluble
materials might be questioned because of thesmall residuum of sporangial poly-,B-hydroxy-butyrate granules which contaminated thespore suspensions. This material already wasknown to affect determinations of intereellularspace (Black and Gerhardt, 1961). After com-pletion of most of the experiments, a poly-propylene glycol extraction method for separationof these granules became available from A. G.Marr (personal communication). Spores so cleanedexhibited unchanged permeability propertieswhen tested with glucose, ethylene glycol, andadenine.
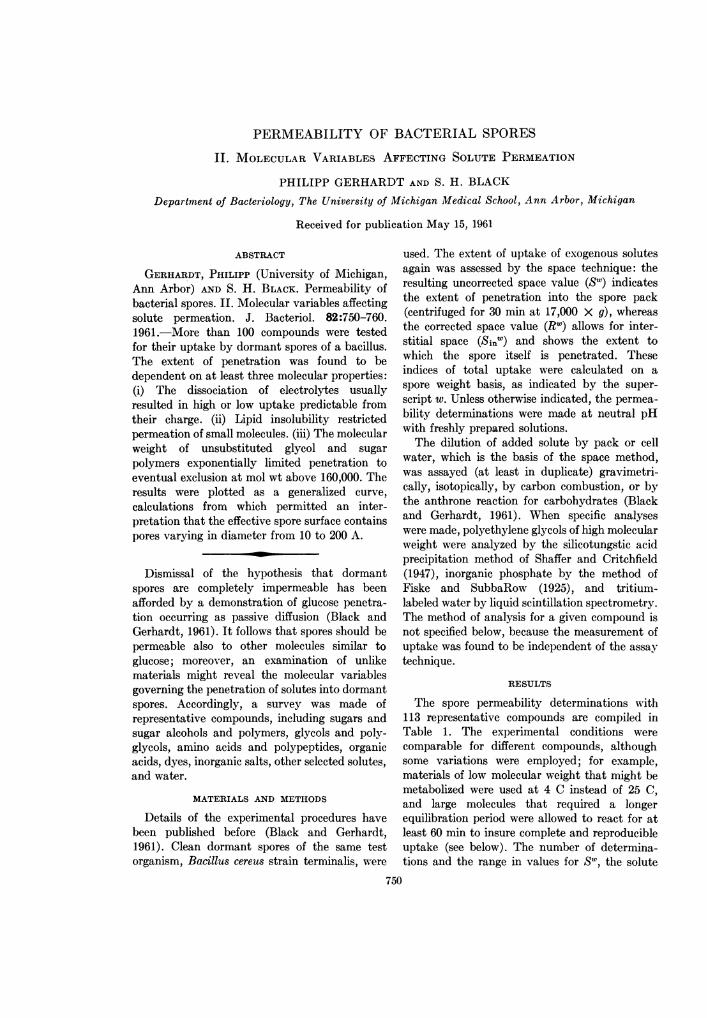
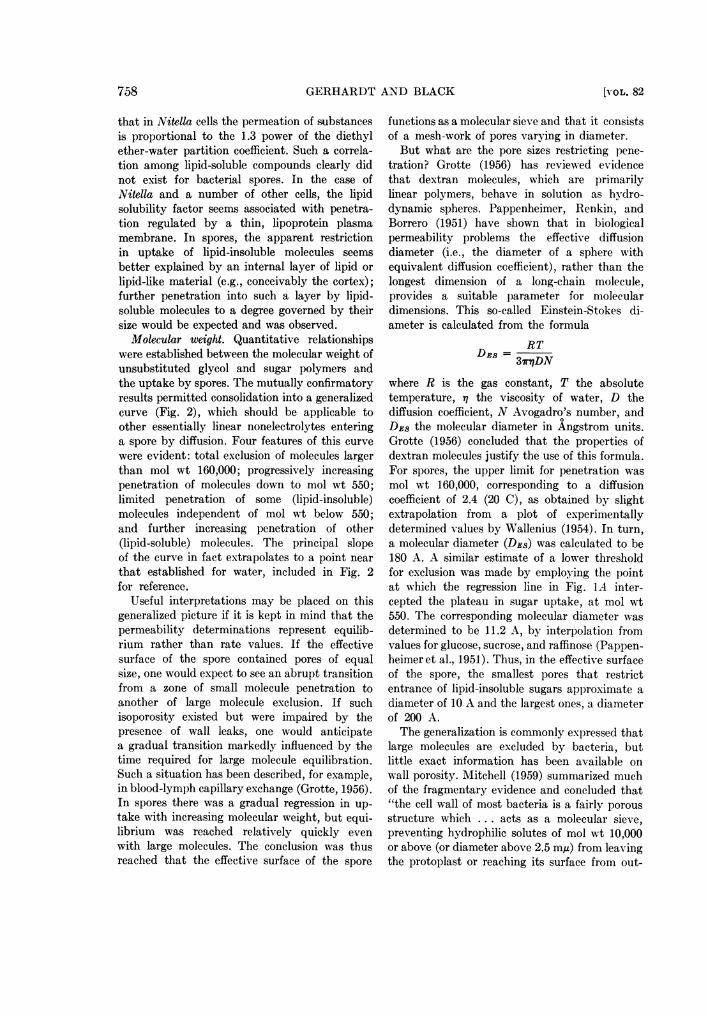
Molecular weight. To facilitate analysis of thisvariable, permeability determinations wereplotted against the logarithm of the correspond-ing molecular weight values for two groups of
generally homologous compounds (listed inTable 1). The unsubstituted monosaccharides,oligosaccharides, and dextrans are shown in Fig.1A and the unsubstituted glycols and theirpolymers in Fig. lB. Each group afforded agraded series extending over a wide range inmolecular weight. Although the polymer molec-ular weight values are averages, the hetero-geneity, which in some instances was known,extended over a narrow range, so that the resultswere not affected appreciably. Both groups ofcompounds are water-soluble, nonelectrolytic,and nontoxic; neither induces spore germination.All the sugars are insoluble in lipid, but the lowmolecular weight glycols are soluble, some veryhighly so.
Consideration first of small molecules (molwt less than about 700) revealed two generalpatterns: (i) The lipid-insoluble sugars (Fig.1A) displayed a relatively constant ability topenetrate spores. This independence in uptakefrom molecular weight also prevailed with othergroups of lipid-insoluble materials (e.g., sub-stituted glycerols, glycine peptides) althoughnot always at the same level of uptake. (ii) Thelipid-soluble glycols (Fig. 1B) showed a decreasein ability to penetrate spores in linear relationto an increase in the logarithm of molecularweight. Points for both the ethylene and pro-pylene glycols fitted the regression line, despitethe fact that the latter compounds become ex-tremely lipid-soluble as they increase in molecu-lar weight. Points for some other small lipid-soluble molecules (e.g., urea, methyl urea,urethane) also followed the trend, whereas others(e.g., ethyl urea, paraldehyde) unexplainablydid not. Similarly peculiar results with ureaderivatives have been observed in plant cells(Collander, 1957).Uptake of the macromolecules followed the
same regression observed for small lipid-com-patible molecules, the relationship thus extending
FIG. 1. Correlation between solute molecular weight and the uptake by dormant spores. The numberedpoints correspond to the compounds listed in Table 1. The lines were plotted by the method of least squares,with the points weighted according to the number of determinations. A, unsubstituted monosaccharides,oligosaccharides, and dextrans. The positions of the upper and lower plateaus were set principally by themany determinations with glucose and 700,000 mol wt dextran, respectively. Broken lines indicate extrap-olations. B, unsubstituted glycols and polyglycols. A straight line was assumed although there possibly wasan inflection at about mol wt 1,000, Rw = 40. Below this coordinate, the slope was -15.9 and above, -17.2.
754 [VO L. 82
104 105MOLECULAR WEIGHT
103 104MOLECULAR WEIGHT
FIG. 1. A and B.
755
RW
50H
40H
30HRW
20k-
B
©
Slope = -/5. 3
I 1 111111
I0
0
10I 106
GERHARDT ANI) BLACK
from mol wt 62 to 175,000. Least-squares linesfor the polyglycols and the dextrans closelymatched each other in slope and position andhad a common intercept on the x-axis. Spacevalues for other polymers with similar properties(e.g., inulin and polyvinyl pyrollidones) alsoapproximated the curve, but a series of methyl-celluloses gave inconsistent results, probablybecause of their high viscosity in solution. Aseries of polypeptides and proteins also gave tooscattered a picture to permit reliable conclusions,probably because of their charge.The factor of molecular weight in uptake of
macromolecules is, of course, only an indirectgauge of size and shape. Interpretations ofmolecular size are made below (see Discussion).The influence of shape was assessed in a singlecomparison between a dextran, a primarilylinear polymer of glucose, and a Ficoll, an almostspherical polymer of sucrose, both compoundsapproximating mol wt 100,000. The SW value(23%) recorded in Table 1 for Ficoll was signifi-cantly higher than that for the comparabledextran (11% in the same experiment). Bothmolecules act as spheres in solution, but Ficollapparently is more compact.The dextran regression line shown in Fig.
1A intercepted the abscissa at mol wt 160,000,and permeability measurements with dextransof mol wt 500,000, 700,000, and 2,000,000 gave aconstant Rw value of 0. The corresponding Swdeterminations (Table 1) established the inter-stitial space of the spore pack as 9%. This valuerepresented the average both of the determina-tions with the three large dextrans and of 78replications with a single lot of 700,000 mol wtdextran. Proteins of high molecular weight,however, did not provide confirming or evenconsistent results, and although sometimes used,should not be relied on for measuring interstitium.Inulin also is commonly used but, at least forspores and a coccus (Britt and Gerhardt, 1958),is much too small a molecule. It also should beclear that intercellular space is not a constantvalue; it varies with the tightness of packingand the presence of extraneous particles (Blackand Gerhardt, 1961).An effort was made to characterize the uptake
of dextrans and polyethylene glycols in a mannersimilar to but more limited than that accom-plished for glucose uptake (Black and Gerhardt,1961). The results were considered increasingly
TABLE 3. Determination of polyglycol and dextranuptake by different analytical methods
sw
Analytical method Polyethylene glycol Dextran
Mol wt Mol wt Mol wt1,000 20,000 700,000
Gravimetric 39 22 13Carbon combustion 40 24 14Silicotungstate ppt of 44polyglycol
Anthrone reaction with 14carbohydrate
less reliable as materials of increasing molecularweight were studied, principally because thespace values diminished while the variabilityof the space technique remained relatively con-stant. Nonetheless, several conclusions weredrawn: (i) The apparent space value for a givenglycol or dextran was independent of the methodof analysis, as shown in Table 3. (ii) Negationof metabolic removal, adsorption, and exchangewas presumed from the finding that the sub-stances could be recovered with three waterwashes. (iii) The time factor became measurablewith larger molecules. Equilibration was com-plete in the minimal observable period of 15min for glucose, triethylene glycol, and mol wt3,650 dextran. With a polyethylene glycol ofintermediate size (mol wt 6,750), however, alonger period was necessary. (In a typical experi-ment at 4 C, Sw values of 16, 27, and 28% wereobserved at equilibration intervals of 15, 60,and 180 min, respectively.) Consequently, wherethere was question of complete equilibration,120 min was routinely employed. WVith largemolecules that were completely excluded byspores, the time factor was disregarded. If smalldifferences did exist with time (or temiperature)in the pack uptake of a molecule as large asdextran mol wt 700,000, they fell within thevariability of the determinations. (iv) The vari-able of solute concentration, found to be in-fluential with glucose in dilute solution only,was also examined with two intermediate-sizedextrans (mol wt 10,000 and 19,000). There wasa significant (7 to 12%) but unexplained decreasein Sw values when the concentration was reducedfrom the usual 3 to 0.1I %. (v) Two other variables,
756 [VO L. 82
VARIABLES IN SPORE PERMEABILITY
aging of solutions and agitation during equili-bration, seemed to affect the extent of uptakeof large polymers, but the differences observedwere too small to identify with certainty and,from a practical standpoint, were obviated bystandardization.
DISCUSSION
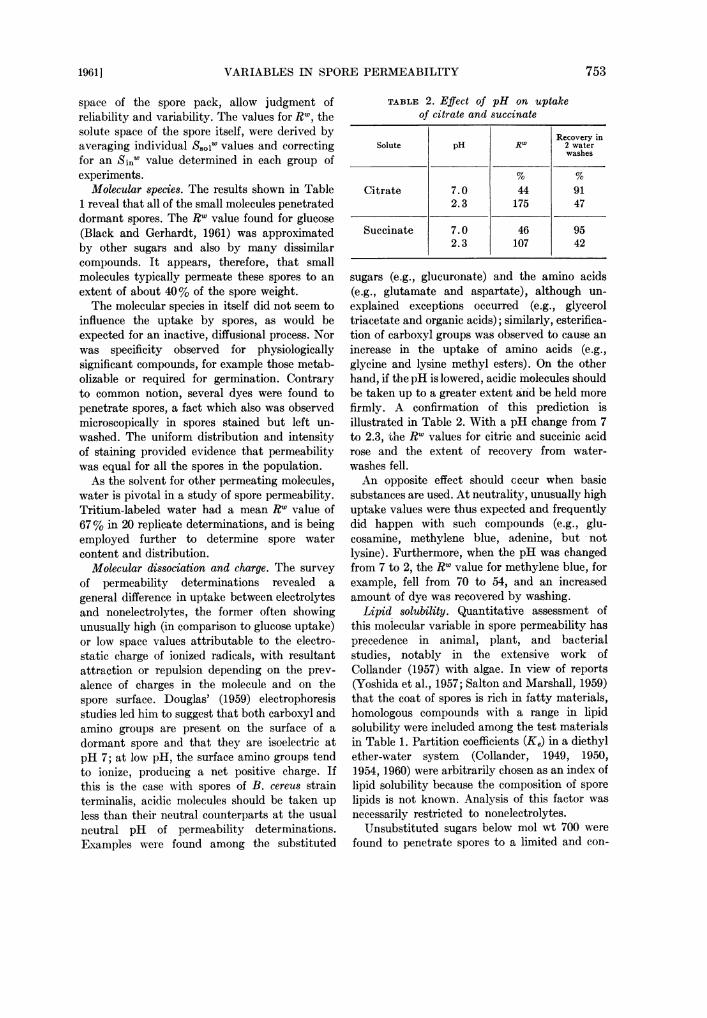
The experimental results demonstrated thatdormant bacterial spores were permeable to alltypes of small molecules. The extent of uptakevaried and seemed to reflect more the chemicalnature of the molecule than active selectivityof the cell. As in glucose uptake by spores (Blackand Gerhardt, 1961), the substances apparentlyentered by a process of passive diffusion. Ingeneral, the permeability resembled that usuallyattributed to a cell "surface" or "outer region"rather than to a plasma membrane. The con-clusion seems inescapable that the effective spore
70 T0
60_
50 -
40 -
RW Q
surface is porous. Its penetration was found to begoverned by at least three molecular variables:molecular charge, lipid solubility, and molecularweight.
Molecular charge. Attraction of basic andrepulsion of acidic molecules, whether small orlarge, usually occurred. Adsorption of cations isa widespread occurrence in cells, and Sussman,von Boventer-Heidenhain, and Lowry (1957)have extensively studied the phenomenon inascospores of Neurospora. Employing bacteria,McCalla (1940) and Harris (1951) have shownthat the cell surface behaves like a base exchangesystem, and Britt and Gerhardt (1958) havespecifically identified the cell wall of Micrococcuslysodeikticus with adsorptive uptake of lysine.
Lipid solubility. This factor became limitingonly for sugars and other small molecules thatare virtually insoluble in lipid or lipid-compatiblesolvents. Collander (1954) was able to establish
103 104MOLECULAR WEIGHT
FIG. 2. Generalized curve for the relationship between molecular weight of linear nonelectrolytes and theuptake by dormant spores. The uppermost point represents water, included for reference.
1961] 757
GERHARDT AND BLACK
that in Nitella cells the permeation of substancesis proportional to the 1.3 power of the diethylether-water partition coefficient. Such a correla-tion among lipid-soluble compounds clearly didnot exist for bacterial spores. In the case ofNitella and a number of other cells, the lipidsolubility factor seems associated with penetra-tion regulated by a thin, lipoprotein plasmamembrane. In spores, the apparent restrictionin uptake of lipid-insoluble molecules seems
better explained by an internal layer of lipid or
lipid-like material (e.g., conceivably the cortex);further penetration into such a layer by lipid-soluble molecules to a degree governed by theirsize would be expected and was observed.
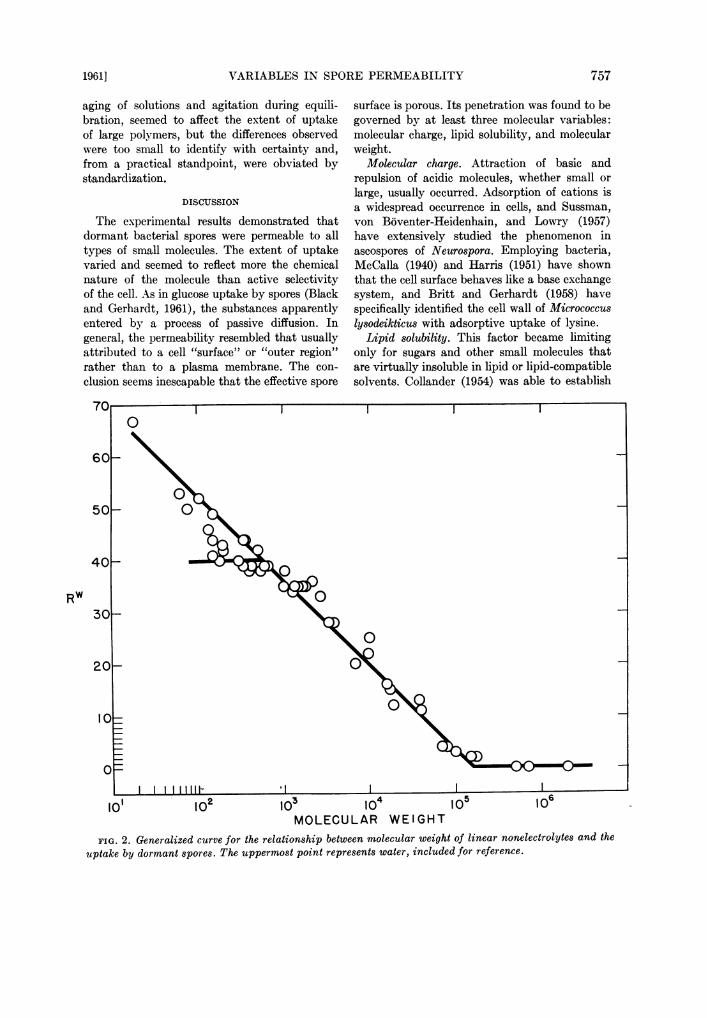
Molecular weight. Quantitative relationshipswere established between the molecular weight ofunsubstituted glycol and sugar polymers andthe uptake by spores. The mutually confirmatoryresults permitted consolidation into a generalizedcurve (Fig. 2), which should be applicable toother essentially linear nonelectrolytes enteringa spore by diffusion. Four features of this curve
were evident: total exclusion of molecules largerthan mol wt 160,000; progressively increasingpenetration of molecules down to mol wt 550;limited penetration of some (lipid-insoluble)molecules independent of mol wt below 550;and further increasing penetration of other(lipid-soluble) molecules. The principal slopeof the curve in fact extrapolates to a point near
that established for water, included in Fig. 2for reference.
Useful interpretations may be placed on thisgeneralized picture if it is kept in mind that thepermeability determinations represent equilib-rium rather than rate values. If the effectivesurface of the spore contained pores of equalsize, one would expect to see an abrupt transitionfrom a zone of small molecule penetration toanother of large molecule exclusion. If suchisoporosity existed but were impaired by thepresence of wall leaks, one would anticipatea gradual transition markedly influenced by thetime required for large molecule equilibration.Such a situation has been described, for example,in blood-lymph capillary exchange (Grotte, 1956).In spores there was a gradual regression in up-
take with increasing molecular weight, but equi-librium was reached relatively quickly even
with large molecules. The conclusion was thusreached that the effective surface of the spore
functions as a molecular sieve and that it consistsof a mesh-work of pores varying in diameter.But what are the pore sizes restricting pene-
tration? Grotte (1956) has reviewed evidencethat dextran molecules, which are primarilylinear polymers, behave in solution as hydro-dynamic spheres. Pappenheimer, Renkin, andBorrero (1951) have shown that in biologicalpermeability problems the effective diffusiondiameter (i.e., the diameter of a sphere withequivalent diffusion ecefficient), rather than thelongest dimension of a long-chain molecule,provides a suitable parameter for moleculardimensions. This so-called Einstein-Stokes di-ameter is calculated from the formula
RTDES = 3irDN
where R is the gas constant, T the absolutetemperature, q the viscosity of water, D thediffusion coefficient, N Avogadro's number, andDES the molecular diameter in Angstrom units.Grotte (1956) concluded that the properties ofdextran molecules justify the use of this formula.For spores, the upper limit for penetration wasmol wt 160,000, corresponding to a diffusioncoefficient of 2.4 (20 C), as obtained by slightextrapolation from a plot of experimentallydetermined values by Wallenius (1954). In turn,a molecular diameter (DES) was calculated to be180 A. A similar estimate of a lower thresholdfor exclusion was made by employing the pointat which the regression line in Fig. 1A inter-cepted the plateau in sugar uptake, at mol wt550. The corresponding molecular diameter wasdetermined to be 11.2 A, by interpolation fromvalues for glucose, sucrose, and raffinose (Pappen-heimer et al., 1951). Thus, in the effective surfaceof the spore, the smallest pores that restrictentrance of lipid-insoluble sugars approximate adiameter of 10 A and the largest ones, a diameterof 200 A.The generalization is commonly expressed that
large molecules are excluded by bacteria, butlittle exact information has been available onwall porosity. Mitchell (1959) summarized muchof the fragmentary evidence and concluded that"the cell wall of most bacteria is a fairly porousstructure which ... acts as a molecular sieve,preventing hydrophilic solutes of mol wt 10,000or above (or diameter above 2.5 m,u) from leavingthe protoplast or reaching its surface from out-
758 [VOL. 82
VARIABLES IN SPORE PERMEABILITY
side the cell wall." Clearly, the pores in theeffective surface of spores are much larger thanthose in vegetative bacteria, although not greatlydifferent from those in human red cells duringhemolysis (Marsden and Ostling, 1959). Theavailability of suitable methods and materialsinvites a needed study comparing wall porosityamong different bacterial cells.
Heretofore we referred to the "effective sur-face" of the spore without attempting to defineits location in the spore structure. Logically,the outermost envelope, or exosporium, wouldbe suspect. Yet, inspection of electron micro-graphs of intact or isolated exosporium failed toreveal pores of the predicted size (up to 200 A).Moreover, there is evidence for crystalline regu-larity in the exosporium ultrastructure (Gerhardt,Bannan, and Ribi, 1961), which would result inisoporosity rather than the heteroporosity in-dicated by the permeability determinations.Physiological evidence against the exosporiumfunctioning as the "effective surface" was sug-gested by the failure to demonstrate that theexosporium acted as an osmometer. Instead itseems plausible that breaks or rents occur inthe exosporium, allowing even macromoleculesto pass. Unfortunately, such leaks would noteasily be found (and in fact were not found) byexamination of electron micrographs, and thepermeability determinations were not sufficientlysensitive to distinguish uptake into this layer,estimated to be about 30 m,u in thickness. If theexosporium actually is leaky, it would seem thatthe heteroporous "effective surface" is repre-sented by the second layer of the spore wall,the so-called outer coat. It remains to be seenwhich is nearer the truth-a hole in the exo-sporium or a hole in the theory.
ACKNOWLEDGMENTS
The competent technical assistance of SaraS. DeLong and L. Jo-Ann Cherry is apprecia-tively acknowledged. The investigation was
supported by research grants from the U. S.Public Health Service (E-619-C5 and -C6) andthe Michigan Mlemorial Phoenix Project of TheUniversity of MIichigan.
LITERATURE CITED
BLACK, S. H., AND P. GERHARDT. 1961. Permeabil-ity of bacterial spores. I. Characterization ofglucose uptake. J. Bacteriol. 82:743-749.
BRlrr, E. M., AND P. GERHARDT. 1958. Bacterialpermeability. Total uptake of lysine by intactcells, protoplasts, and cell walls of Micro-coccus lysodeikticus. J. Bacteriol. 76:288-293.
COLLANDER, R. 1949. Die Verteilung organischerVerbindungen zwischen Ather und Wasser.Acta Chem. Scand. 3: 717-747.
COLLANDER, R. 1950. The distribution of organiccompounds between iso-butanol and water.Acta Chem. Scand. 4:1085-1098.
COLLANDER, R. 1954. The permeability of Nitellacells to nonelectrolytes. Physiol. Plantarum7:420-445.
COLLANDER, R. 1957. Permeability of plant cells.Ann. Rev. Plant Physiol. 8:335-348.
COLLANDER, R. 1960. The permeation of polypro-pylene glycols. Physiol. Plantarum 13:179-185.
DOUGLAS, H. W. 1959. Electrophoretic studies onbacteria. Part 5. Interpretation of the effectsof pH and ionic strength on the surface chargeborne by B. subtilis spores, with some ob-servations on other organisms. Trans. Fara-day Soc. 56:850-856.
FISKE, C. H., AND Y. SUBBAROW. 1925. The colori-metric determination of phosphorus. J. Biol.Chem. 66:375-400.
GERHARDT, P., E. A. BANNAN, AND E. RIBI. 1961.Selective disruption of spores and isolation ofexosporium. Bacteriol. Proc., p. 77.
GROTTE, G. 1956. Passage of dextran moleculesacross the blood-lymph barrier. Acta Chir.Scand., Suppl. 211:1-84.
HARRIS, J. 0. 1951. A study of the relationshipbetween the surface charge and the adsorptionof acid dyes by bacterial cells. J. Bacteriol.61 :649-652.
MARSDEN, N. V. B., AND S. G. OSTLING. 1959.Accumulation of dextran in human red cellsafter hemolysis. Nature 184:723-724.
MCCALLA, T. M. 1940. Cation adsorption by bac-teria. J. Bacteriol. 40:23-32.
MITCHELL, P. 1959. Biochemical cytology of mi-croorganisms. Ann. Rev. Microbiol. 13:407-440.
PAPPENHEIMER, J. R., E. M. RENKIN, AND L. M.BORRERO. 1951. Filtration, diffusion and mol-ecular sieving through peripheral capillarymembranes. A contribution to the pore theoryof capillary permeability. Am. J. Physiol.167:13-46.
SALTON, M. R. J., AND B. MARSHALL. 1959. Thecomposition of the spore wall and the wall ofvegetative cells of Bacillus subtilis. J. Gen.Microbiol. 21:415-420.
SHAFFER, C. B., AND F. H. CRITCHFIELD. 1947.Solid polyethylene glycols (carbowax com-
19D61] 759
GERHARDT AND BLACK
pounds). Quantitative determination in bio-logical materials. Anal. Chem. 19:32-34.
SUSSMAN, A. S., B. VON B6VENTER-HEIDENHAIN,AND R. J. LOWRY. 1957. Physiology of the cellsurface of Neurospora ascospores. IV. Thefunctions of surface binding sites. PlantPhysiol. 32:586-590.
WALLENIUS, G. 1954. Renal clearance of dextran
as a measure of glomerular permeability.Acta Soc. Med. Upsal., Suppl. 4:1-91.
YOSHIDA, N., Y. IZUMI, I. TANI, S. TANAKA, K.TAKAISHI, T. HASHIMOTO, AND K. FUKUI.
1957. Studies on the bacterial cell wall. XIII.Studies on the chemical composition of bac-terial cell walls and spore membranes. J.Bacteriol. 74:94-100.
760 [VOL. 82