perseus mining limited
TRANSCRIPT

Details of Hydrogeological Model
Perseus Mining Limited
Job No: ADV-PE-60406
Date: 11 December 2017

2
Document Control Sheet
Client
Perseus Mining Limited
Report Name Date
Details of Hydrogeological Model 11 December 2017
Job No. Revision No.
ADV-PE-60406
Is this QAQC requriements1 File Name:
Document1
Authorisations
Name Position Signature Date
Prepared By: RPS Aquaterra for
RPM
11 December
2017
Reviewed By
Approved By
Distribution
Organisation Recipient No. Of Hard Copies
No. Of Electronic Copies
Comment

3
Our Client
This report has been produced by or on behalf of RungePincockMinarco Limited (“RPM”) solely for Perseus Mining Limited (the “Client”).
6. Client Use
The Client’s use and disclosure of this report is subject to the terms and conditions under which RPM prepared the report.
7. Notice to Third Parties
RPM prepared this report for the Client only. If you are not the Client:
RPM has prepared this report having regard to the particular needs and interests of the Client, and in accordance with the Client’s instructions. It did not draft this report having regard to any other person’s particular needs or interests. Your needs and interests may be distinctly different to the Client’s needs and interests, and the report may not be sufficient, fit or appropriate for your purposes.
RPM does not make and expressly disclaims from making any representation or warranty to you – express or implied – regarding this report or the conclusions or opinions set out in this report (including without limitation any representation or warranty regarding the standard of care used in preparing this report, or that any forward-looking statements, forecasts, opinions or projections contained in the report will be achieved, will prove to be correct or are based on reasonable assumptions).
RPM expressly disclaims any liability to you and any duty of care to you.
RPM does not authorise you to rely on this report. If you choose to use or rely on all or part of this report, then any loss or damage you may suffer in so doing is at your sole and exclusive risk.
8. Inputs, subsequent changes and no duty to update
RPM has created this report using data and information provided by or on behalf of the Client [and Client’s agents and contractors]. Unless specifically stated otherwise, RPM has not independently verified that data and information. RPM accepts no liability for the accuracy or completeness of that data and information, even if that data and information has been incorporated into or relied upon in creating this report (or parts of it).
The conclusions and opinions contained in this report apply as at the date of the report. Events (including changes to any of the data and information that RPM used in preparing the report) may have occurred since that date which may impact on those conclusions and opinions and make them unreliable. RPM is under no duty to update the report upon the occurrence of any such event, though it reserves the right to do so.
9. Mining Unknown Factors
The ability of any person to achieve forward-looking production and economic targets is dependent on numerous factors that are beyond RPM’s control and that RPM cannot anticipate. These factors include, but are not limited to, site-specific mining and geological conditions, management and personnel capabilities, availability of funding to properly operate and capitalize the operation, variations in cost elements and market conditions, developing and operating the mine in an efficient manner, unforeseen changes in legislation and new industry developments. Any of these factors may substantially alter the performance of any mining operation.

4
Table of Contents
6. WATER MANAGEMENT ................................................................................................................................... 5
6.1 Overview ............................................................................................................................................................ 5
6.2 Introduction ........................................................................................................................................................ 5
6.3 Hydrological and Hydrogeological Investigation Programme ............................................................................. 6
6.4 Hydrology ........................................................................................................................................................... 8
6.5 Hydrogeology ................................................................................................................................................... 12
6.6 Conceptual Hydrological and Hydrogeological Model...................................................................................... 14
6.7 Numerical Groundwater Modelling ................................................................................................................... 16
6.8 Surface Water Management ............................................................................................................................ 19
6.9 Pit Dewatering Strategy ................................................................................................................................... 23
6.10 Water Monitoring Programme .......................................................................................................................... 26
6.11 Water Management Risks &Opportunities ....................................................................................................... 28
6.12 Conclusions ..................................................................................................................................................... 30
6.13 Recommendations & Additional Scope of Work .............................................................................................. 31
List of Tables
Table 6-1 Pit Area: Pumping Test Summary ............................................................................................. 7 Table 6-2 Intensity-Frequency-Duration Table .......................................................................................... 8 Table 6-3 Groundwater Model Stress Periods ........................................................................................ 16 Table 6-4 Predicted Final Pit Inflow Volumes for 24 Hour 100 Year Return Event................................. 24 Table 6-5 Pit Dewatering Pumping & Sedimentation Basin Requirements (3-5 Days)........................... 24 Table 6-6 Pit Dewatering Pumping & Sedimentation Basin Requirements (7 Days) .............................. 25 Table 6-7 Pit Dewatering Pump Examples and Costs ............................................................................ 25 Table 6-8 Average Annual Pit Inflows (m3) ............................................................................................. 26
List of Figures
Figure 6-1 Surface Water Monitoring Locations ....................................................................................... 33 Figure 6-2 Groundwater Monitoring Locations ......................................................................................... 33 Figure 6-3Groundwater Level Hydrographs ................................................................................................ 35 Figure 6-4 Conceptual Model Section ...................................................................................................... 36 Figure 6-5 Pit Development - Stress Periods .......................................................................................... 37 Figure 6-6Predicted Groundwater Level Drawdown .................................................................................. 38 Figure 6-7 Final Pit Water Level Cross Section........................................................................................ 39 Figure 6-9Pit Dewatering Plan .......................................................................................................... 41
Error! Reference source not found.

5
6. WATER MANAGEMENT
6.1 Overview
The hydrological and hydrogeological aspects of the Yaouré project appear to be relatively straight forward and, with the adoption of appropriate site water management, are not expected to pose any major issues for the project.
Significant storm events occur in the Yaouré project area and will lead to occasional short term high peak runoff flow rates within the various site catchments and will result in rainfall runoff induced pit inflows. Surface water runoff peak flow rates are estimated to be up to approximately 26m3/s for the 100 Year Return Period critical duration rainfall events for the largest catchment areas within the mine footprint. Flows of this magnitude will require appropriate management, including the construction of appropriately sized diversion drainage around key site infrastructure.
Surface water runoff from disturbed catchments on the site (intrastructure, waste dump etc.) will require management to reduce suspended sediment in the runoff prior to discharge from the site. Disurbed catchment runoff will discharge from the site via sedimentation basins, however additional mitigation can be implemented in the upstream catchment drainage such as in-channel check dams and catchpits, as required.
A specifically focussed hydrogeological drilling and hydraulic testing field programme has advanced the hydrogeological understanding of the Yaouré project area. The hydraulic testing completed suggests that the permeability of the strata in the Yaouré project area is generally low, although there are isolated areas of moderate permeability. Total pit groundwater inflows are estimated up to a maximum of 55L/s (during the most intensive mining period, assuming active dewatering of all the pits).
Pit dewatering should be achieved primarily through in-pit sump pumping, although ex-pit dewatering bores targeting permeable structures (e.g. the northern part of the CMA structure) are an option if deemed advantageous.
The key potential project risks associated with water management include mine dewatering impact on nearby village water supply wells; local groundwater/surface water contamination as a result of either seepage or overflow from the TSF; inadequate site water management leading to discharge of contaminated water to the natural environment and/or flooding of the mine site and pits; inundation of the pits during and/or after large storm events or associated with interception of highly transmissivity zones; and pit wall instability due to elevated pore water pressures in the pit walls.
6.2 Introduction
A water management (hydrology and hydrogeology) study was completed as part of the Yaouré Project DFS. The results of the water management study are presented in this section of the report.
The approach to the assessment was as follows:
▪ Review and analyse all hydrological/hydrogeological work completed to date;
▪ Develop a conceptual hydrological/hydrogeological model for the Yaouré project area based on the current level of understanding;
▪ Identify any key gaps in the hydrological/hydrogeological data available, which could lead to uncertainty or risk with respect to water management aspects of the project;
▪ Scope any additional hydrological/hydrogeological work required in order to address any of the water management related data gaps, uncertainty and/or risks identified to DFS level;
▪ Develop rainfall runoff estimates for the site catchments based on current pit plans, site infrastructure plans, Lidar topographic data and catchment characteristics;
▪ Develop surface water management plans to accommodate the predicted rainfall runoff estimates.

6
▪ Develop groundwater pit inflow rate estimates based on current mine plans and the available hydrogeological data;
▪ Develop a mine dewatering system and strategy based on predicted rainfall runoff and groundwater inflows to the pits based on the current mine plan;
▪ Identify project risks and opportunities from a water management perspective.
6.3 Hydrological and Hydrogeological Investigation Programme
Data Review
A review of all available background hydrological and hydrogeological data for the Yaouré project area was completed as part of the DFS. The following key documents were reviewed in combination with all available additional hydrological and hydrogeological data:
▪ Preliminary Feasibility Study (PFS) completed by Amara in July 2015 (principally Appendix J: AMEC Hydrology Report and Appendix K: AMEC Geochemistry Report).
▪ Environmental Social Impact Assessment (ESIA) completed in June 2015 (principally Appendix 23: AMEC Water Management & Monitoring Plan and Appendix 7: ESS Baseline of Soils & Land Capacity).
▪ Risk Assessment completed by Perseus Mining Limited (PML) in April 2016.
Hydrogeological Field Investigation
A specific hydrogeological field investigation, including additional targeted water bore drilling, installation and hydraulic testing, was completed as part of the Yaouré DFS study between May and July 2017. The aims of the field investigation were to determine appropriate permeability values to be adopted for the further hydrogeological assessments (including the groundwater modelling), to examine the hydraulic properties of the main geological structures present and to evaluate the potential hydraulic connection between the mine site and nearby surface water bodies.
Pit Area – Drilling, Installation and Test Pumping
Six hydrogeological exploration holes were drilled in May 2017 within the vicinity of the pit, with locations being selected outside the current pit footprint, wherever possible. The new holes targeted key geological structures and contacts zones which were identified as potential preferential groundwater flow paths. The six new holes were as follows:
▪ Hole 1 – YRC1155 (220995mE 776960mN; 80m depth) targeted the S1 structure between the Yaouré and CMA pits;
▪ Hole 2 – YRC 1156 (221385mE 776535mN; 120m depth) targeted the southern portion of the CMA lode;
▪ Hole 3 – YRC 1157 (221755mE 777035mN; 120m depth) targeted the eastern end of the S6 structure. ;
▪ Hole 4 – YRC1159 (220915mE 777635mN; 130m depth) and Hole 5 - YRC1160 (220875mE 777685mE; 130m depth) targeted the north-dipping faulted contact between the volcanoclastics and basalt. These holes also targeted the northwest extension of CMA mineralisation;
▪ Hole 6 – YRC1158 (221385mE 777819mN) targeted the volcanoclastics/basalt contact on the interpreted northeast striking basin margin fault.
Of the six holes drilled only Hole 4 (YRC1159) which intercepted the CMA and Hole 6 (YRC1158) which intercepted the volcanoclastic/basalt contact returned any significant water flows, with airlift yields of 1.84L/s and 1L/s being recorded at final depth in Holes 4 and 6, respectively.
The conclusions drawn from the drilling programme were as follows:
▪ Structures S1 and S6 and the southern portion of the CMA structure do not appear to be preferential groundwater flow paths;

7
▪ The northern portion of the CMA structure and the vocanoclastic/basalt contact appear to exhibit a degree of enhanced groundwater flow.
Based on the water potential identified at Hole 4 (YRC1159), a production bore and observation bore were installed at this location. YRC1171 (220910mE 777634mN; 130m depth) was drilled approximately 4m away from the initial hole (Hole 4), and yield approximately 0.5L/s flow at final depth. Bore YRC1171WO was completed to 130m depth.
Based on the airlift result at Hole 6 (YRC1158), another water exploration hole, YRC1172 (221364mE 777839mN; 120m depth), was drilled approximately 50m to the north of Hole 6, and did not yield any significant flow at final depth. Bore YRC1172WO was completed to 112m depth.
Pumping tests were subsequently completed using a Grundfos MP1 pump on the completed YRC1171WO and YRC1172WO bores. A summary of the pumping tests completed on YRC1171WO and YRC1172WO is provided in Table 6-1. Results of the pumping test analyses are presented in Section 6.5.3
Table 6-1 Pit Area: Pumping Test Summary
Bore ID Date of Test Static Water Level (mbgl)
Pumping Rate (L/min)
Pumping Duration (mins)
Water Level Drawdown (m)
YRC1171WO 29/06/17 33.34 13.5 120 2.70
YRC1172WO 29/06/17 19.23 13.5 135 3.98
Hydraulic testing was also completed on existing bore ESIA/G2. This bore is screened across the lower saprolite and upper saprock. A pumping test was initially completed on 1st July 2017, although at this time the bore seemed to be blocked at 33.5m depth. The bore was subsequently cleaned out by airlifting on the 8th July 2017 and an airlift recovery test completed. Then a second pumping test was completed on 12th July 2017. A summary of the pumping tests results are presented in Section 6.5.3.
TSF Area – Drilling, Installation and Test Pumping
Two new hydrogeological holes were drilled immediately downgradient of the Tailings Storage Facility (TSF) embankment wall. One was installed as a large diameter bore (YRC1174WP 222680mE 775272mN) and one was installed as an associated smaller diameter observation bore (YRC1173WO 222670mE 775275mN). Both of these bores were drilled to 80m depth and yielded water flows of approximately 1.5L/s at final depth.
Pumping tests were to be completed on YRC1173WO and YRC1174WP as part of the DFS but the pump broke and it was therefore not possible to perform pumping tests on these holes.
Four holes were drilled for geotechnical purposes within the footprint of the proposed TSF (particularly associated with positions beneath proposed embankment walls). In order to acquire additional hydrogeological data 50mm ID PVC casing and gravel pack was installed in three of these holes (YDD505, YDD506 and YDD508). Airlift recovery tests were conducted on these three bores. This will provide additional hydrogeological insight across the project area and specifically in the vicinity of the TSF. The results of the airlift testing are presented in Section 6.5.3.
Perseus Camp Bore
An existing production bore is located beside the old Banlaw camp (referred to as the Perseus Camp Bore). This bore was cleaned out by airlifting on the 30th June 2017, with a considerable amount of debris, leaves and black cable ties being removed from the bore. A pumping test was subsequently undertaken on the bore on 1st July 2017. A summary of the pumping tests results are presented in Section 6.5.3

8
6.4 Hydrology
Meteorological Data
Datasets for four weather stations near the Yaouré project site were assessed as part of the DFS. The weather stations are all located within the same rainfall region of Côte d’Ivoire as the project site. The meteorological datasets available in the vicinity of the Yaouré project site are as follows:
▪ Rainfall
− Béoumi (1939 - 1997);
− Bouaflé (1939 - 2014);
− Tiébissou (1953 - 1996);
− Yamoussoukro (1975 - 1997);
− Yaouré Mine Site Weather Station (Jan 2013 - September 2017)
− Kossou (1980 - 2014).
▪ Evaporation
− Monthly Yamoussoukra Airport (1990 – 2014);
− Monthly Kossou (1998 – 2014).
▪ Humidity
− Monthly Yamoussoukra Airport (1990 – 2014);
− Monthly Mean Yaouré Mine Site Weather Station (Jan 2016 - Jul 2016).
▪ Temperature
− Monthly Mean Yaouré Mine Site Weather Station (2009 - 2013);
− Monthly Mean Yaouré Mine Site Weather Station (Jan 2016 - Jul 2016).
The Yaouré mine site weather station rainfall data from March 2017 to May 2017 indicates that the majority of the rainfall during this period occurs in large rainfall events, with approximately 55% of the 148mm rainfall total in the three month period occurring on just three days. By comparison during the June 2017 to September 2017 period, the three largest daily rainfall totals accounted for approximately 25% of the 120mm rainfall total in the subsequent four month period.
The Bouaflé weather station was chosen in the DFS to represent the Yaouré site due to its proximity and as it provided the most extensive dataset. Minimum, mean and maximum monthly rainfall values for three consecutive years were extracted from the Bouaflé weather station dataset for use in a water balance model.
Extreme value analysis was undertaken to generate 24 hour rainfall depths for various return periods. Intensity-Frequency-Duration (IFD) curves were synthesised from the Bouaflé data to generate rainfall intensities for various durations and return period events. The probable maximum precipitation was also generated from the Bouaflé data as part of the DFS assessments. The IFD curves derived for the previous PFS (rather than the DFS IFDs) were adopted as the design rainfall events for the design of surface water management infrastructure and for in-pit dewatering systems, in order to maintain a conservative element, as the PFS IFDs are generally higher than those developed as part of the DFS. The IFD used in the DFS assessment is presented in Table 6-2 which is reproduced from Appendix J of the Prefeasibility Study (Amara, 2015).
Table 6-2 Intensity-Frequency-Duration Table
IDF (mm/hr) Duration (mins)
Return Period (Years) 5 10 20 30 60 120 180 720 1440
1 37.9 34.2 31.2 24.7 17.6 11.4 8.5 2.8 1.5

9
2 85.4 77 70.2 55.7 39.7 25.7 19.2 6.2 3.4
5 113.9 102.6 93.5 74.2 52.9 34.2 25.5 8.3 4.5
10 132.7 119.6 109 86.4 61.7 39.8 29.7 9.6 5.3
20 156.4 141 128.5 101.9 72.7 47 35.1 11.4 6.2
50 174 156.9 143 113.4 80.9 52.3 39 12.6 6.9
100 191.5 172.7 157.4 124.8 89.1 57.5 42.9 13.9 7.6
1,000 249.4 224.8 204.9 162.5 116 74.9 55.9 18.1 9.9
10,000 307.1 276.9 252.3 200.1 142.8 92.2 68.8 22.3 12.2
An average annual rainfall total of 1,273mm was derived from the Bouaflé dataset by Knight Piesold and was used in this assessment.
River Flows
Runoff from the Yaouré site primarily drains to Lake Kossou, with the southern extents of the site draining towards a tributary of the Bandama (Blanc) River south of Kossou Dam. Daily flow data for the period 1962 to 1997 is available from a river gauging station located on the Bandama River at Marabadiassa, just north of the northern extent of Lake Kossou. The Kossou Dam was constructed and Lake Kossou formed in 1972, which is during the period for which river gauge data is available. The Bandama River flow data is summarised in the PFS report and provides a regional context to rainfall runoff but it does not provide data for the various Yaouré site catchments.
The majority of water courses in the vicinity of the Yaouré site are ephemeral, with the exception of the Bandama River to the south and east of the site.
Flow monitoring in the vicinity of the Yaouré site commenced at five locations (S1, S5, S8, S12 and SW4) in December 2014 and at S13 in September 2016. Flow rates are currently monitored monthly during the dry season and more regularly during the wet season. The monitoring locations are illustrated in Figure 6-4 and are described below:
▪ S1 – measured flow rates of 0 to 536 L/s (November 2014 to October 2017); located to the south west of the Yaouré site, measuring flow rates in a water course which passes through a location previously identified as an option for the TSF (Tailings Storage Facility). The TSF option developed for the DFS is located upstream of S5 monitoring point;
▪ S5 – 0 to 183 L/s (December 2014 to October 2017); located to the south of the site on a tributary of the Bandama River. Runoff flow rates from the currently proposed TSF catchment are monitored at this location;
▪ S8 – 0 to 1,136 L/s (December 2014 to October 2017); located to the north of the site on a water course draining to Lake Kossou. Runoff flow rates from the pit catchment and the Western Waste Dump catchment are monitored at this location;
▪ S12 – 0 to 934 L/s (November 2014 to October 2017); located at Patizia, approximately 3km south of the TSF on a tributary of the Bandama River. This flow monitoring location is not measuring any flow rates from the Yaouré site catchments;
▪ SW4 – 0 to 87 L/s (November 2014 to January 2016); located to the south east of the site on the same tributary of the Bandama River as S5. SW4 is approximately 1.6km downstream of S5;
▪ S13 – 0 to 252 L/s (September 2016 to October 2017); located approximately 1km north of the process plant area and 300m south of Lake Kossou. Runoff flow rates from the mine site catchment are monitored at this location.
In addition to the site flow monitoring data, the following data sets have been made available:
▪ Monthly Discharge Volumes from Kossou Dam (1980-2014);
▪ Monthly Average Flow from Kossou Dam (1980-2014).

10
The discharge data from the Kossou Dam will help inform the assessment of abstraction capacity of the Bandama River south of the Kossou Dam for use as a water supply.
Surface Water Quality
Historical Data (pre-PFS)
Twenty two surface water quality samples were collected from nine monitoring locations prior to the issuing of the PFS. Location S12 appears to be sampling a water course which will not capture site catchment runoff, however, it does provide useful background water quality data.
Surface water quality issues as reported in the PFS are as follows:
▪ 1 sample exceeds the WHO guideline value for dissolved arsenic concentrations;
▪ 1 sample exceeds the WHO guideline value for dissolved chromium concentrations;
▪ 3 samples exceed the WHO guideline value for drinking water for dissolved lead concentrations;
▪ 4 samples exceed the WHO guideline value for drinking water for nitrate concentrations.
Additional sampling points have subsequently been included in the surface water quality monitoring network and are detailed in the section below.
Recent Monitoring Data (December 2014 onwards)
Surface water samples have been collected at monitoring locations around and in the vicinity of the Yaouré site, with 62 samples taken since December 2014.
▪ S1 – Twelve water quality samples were taken on a monthly basis between December 2014 and November 2015. The sample taken in November 2015 exceeded the World Bank Effluent guidelines values for Total Suspended Solids (50mg/L) and Total Iron (2mg/L;
▪ SW3 – Two water quality samples were taken at SW3 in 2017, one in January 2017 and one in July 2017. There were no exceedances of the World Bank Effluent guidelines values for these two samples;
▪ SW4 – Three water quality samples were taken at SW4 in December 2014, June 2015 and July 2015. There were no exceedances of the World Bank Effluent guidelines values for these three samples;
▪ S5 – Ten water quality samples were taken on an almost monthly basis between December 2014 and November 2015. There were no exceedances of the World Bank Effluent guidelines values for these samples;
▪ SW6 – Twelve water quality samples were taken at SW6. Ten samples were taken on an almost monthly basis between December 2014 and November 2015. Two samples were taken in January and July 2017. Two samples taken at SW6 exceed the World Bank Effluent guidelines values for Total Suspended Solids (50mg/L) in December 2014 (167mg/L) and March 2015 (85mg/L). Four samples taken at SW6 exceed the World Bank Effluent guidelines values for Total Iron (2mg/L) in December 2014 (8.1mg/L), January 2015 (2.4mg/L), March 2015 (10.8mg/L) and April 2015 (3.3mg/L);
▪ S8 – Five water quality samples were taken at S8, the first in December 2014, and the remaining four on a monthly basis from May to July 2015. There were no exceedances of the World Bank Effluent guidelines values for these samples;
▪ S12 – Thirteen water quality samples were taken at SW12 on a monthly basis between December 2014 and November 2015, with another sample taken in January 2017. Three samples taken at S12 exceed the World Bank Effluent guidelines values for Total Suspended Solids (50mg/L) in May 2015 (73mg/L), November 2015 (66mg/L) and January 2017 (75mg/L). Eight of the samples taken exceed the World Bank Effluent guidelines values for Total Iron guideline (2mg/L) in February 2015 (2.1mg/L), March 2015 (2.5mg/L), May 2015 (3.1mg/L), June 2015 (2.8mg/L), August 2015 (2.1mg/L), September 2015 (2.2mg/L), October 2015 (2.5mg/L) and November 2015 (3.1mg/L);
▪ Four samples were taken at other monitoring locations in January 2017 which include SWBP (Barren Pond), SWDP (Detox Pond), SWEP (Excess Pond) and SWWS which is on a stream to the east of Angovia, and downstream of the previously listed ponds. There was only one exceedance of the World Bank Effluent guideline values for Total Suspended Solids (50mg/L) at SWEP (185mg/L).

11
In addition, water quality data has been made available for three locations in the pit area (YSP, YCP and YNP) for two monitoring rounds, the first in 2015 and the second in 2016 using two different laboratories, SGS Lab and Vagny Lab respectively. The results were provided with the Ivorian Guidelines Effluent Discharge (IGED) and SFI Guidelines for Effluent Water (SFI).
Exceedances of the guidelines were recorded for BOD5 and Selenium (Total) as follows:
▪ BOD5 results at YNP (70mg/L) and YCP (89mg/L) exceeded the SFI guideline value (50mg/L). Both were recorded in the 2016 monitoring round and analysed at Vagny Labs;
▪ The Selenium result at YCP (0.02mg/L) exceeded SFI guideline value of 0.01mg/L while the Selenium result at YSP (0.027mg/L) exceed both the IGED (0.02mg/L) and SFI (0.01mg/L) guideline values. Both were recorded in the 2016 monitoring round and analysed at Vagny Labs.
Monitoring Downgradient of TSF
Surface water quality results from the two surface water monitoring locations (SW4 and S5) down-gradient of the proposed TSF were reviewed and compared with water quality data from across the surface water monitoring network, in order to define the baseline water quality in this area. The review focussed on metals concentrations as these are the potential contaminants of concern from any possible future seepage from the proposed TSF.
The water quality results for the samples collected downgradient of the TSF in 2014/2015 (three samples at SW4 and ten samples at S5) are within the range of water quality results from elsewhere across the surface water quality monitoring network, with the except of chromium. The maximum chromium concentrations detected in samples from SW4 (0.021mg/L) and S5 (0.019mg/L) are slightly greater than the maximum recorded across the rest of the network (0.015 mg/L), however, these chromium concentrations are still below the WHO and World Bank Effluent guideline values (0.05mg/L and 0.1mg/L respectively). The mercury and cadmium concentrations in the samples from SW4 and S5 are all below the laboratory detection limit of 0.001mg/L. Arsenic concentrations detected in the samples from SW4 and S5 are in the range <0.0005mg/L to 0.001mg/L and <0.0005mg/L to 0.002mg/L, respectively, which are below the WHO and World Bank Effluent guideline values of 0.01 mg/L and 0.01mg/L, respectively. Cyanide concentrations in the samples collected from SW4 and S5 are all below the laboratory detection limit of 0.005mg/L, which is well below the World Bank Effluent guideline limit of 1mg/L.
Catchment Definition and Characteristics
Catchment characteristics were developed for the PFS by examination of aerial photography of the site and Landsat data. Walkover surveys completed in July 2014 and January 2015 provided supplementary information on watercourses, infiltration rates and land use and included the following observations:
▪ Many of the water courses were poorly defined and barely discernible during the dry season.
▪ Infiltration during the dry season was observed to be rapid.
▪ There is no primary rainforest in the area.
Appendix 7 of the ESIA Report further describes soil types on site, and classifies them under four different soil groups and presents a dominant soils map for the site. This was produced after the PFS report and was not considered when estimating runoff coefficients from catchment characteristics as part of the PFS.
The soils mapped range from shallow sub-outcrop and outcrop of hard plinthite and parent materials (sediments and intrusive dolerite) to deep sandy loams and sandy clay loams on deeply weathering saprolite, with variations of moderately deep to shallow sandy loams and sandy clay loams that show variable structure.
As part of the DFS the majority of the soil on site was categorised into the following US Soil Conservation Service categories for the purposes of rainfall runoff coefficients for the rational method for estimating peak flow rates:
▪ Group B: Shallow loess; sandy loam;
− Runoff Coefficients 0.23 – 0.45;

12
▪ Group C: Clay loams; shallow sandy loam; soils low in organic content; soils usually high in clay
− Runoff Coefficients 0.37 – 0.62
LIDAR data for the site has been made available which confirms the undulating to steep topography, particularly adjacent to the catchment divide at the southern extremities of the site, between the Lake Kossou draining catchment and the Bandama River draining catchment to the south.
The steeper topography along the catchment divide is adjacent to and intercepted by the southern extents of the proposed pit development. High intensity rainfall events in this area will result in a high proportion of rainfall runoff and rapid rainfall runoff response, with a high potential for erosion due to the steep slope of the catchment in this area.
Rainfall Runoff Assessment
The Rational Method was used in the PFS assessment to derive peak flow rates for pre-development catchment runoff based on the rainfall estimates generated in the rainfall analysis completed and on estimated catchment characteristics. The PFS results indicated that significant peak flows could occur from any of the catchments at the Yaouré site. Peak runoff estimates were generated for sub-catchments in the TSF and mine catchments as part of the PFS in order to provide the likely magnitude of flows for assessing diversion drain feasibility.
The Rational Method was similarly utilised as part of this DFS assessment in order to estimate design flows for the design of appropriate surface water management infrastructure (see Section 6.8) in line with the updated catchment characteristics and topography.
Climate change was not considered in the generation of peak flow estimates for the Yaouré site as rainfall is predicted to remain the same or decrease slightly by mid-21st century.
6.5 Hydrogeology
Groundwater Levels
The distribution of groundwater monitoring points is presented in Figure 6-5. This figure illustrates that some of the monitoring points are located within the footprint of the proposed mine development, including the proposed pit, waste dumps and TSF locations. Thus some of the monitoring points will be lost during the mine development. Groundwater level monitoring points are also present at many of the local villages and towns. Groundwater monitoring points exist between the pit and Lake Kossou, and these monitoring points will allow any potential water level drawdown between the pit and the lake to be monitored.
Monthly groundwater level monitoring has been completed at 21 locations across the Yaouré site since December 2014. Groundwater level hydrographs from the various monitoring points are presented in Figure 6-6. The available data indicates that the depth to groundwater across the Yaouré site ranges from approximately 2 metres below ground level (mbgl) up to approximately 80mbgl. Fluctuation in the groundwater levels between July 2015 and September 2017 ranges from 0.06m (SBH2) to 7.08m (YRC757 ESIA/G2), the average fluctuation is 3.3m.
Five of the groundwater monitoring points (bores with YDD prefix) were originally angled exploration holes (80 degree declination) drilled at inclined depths ranging from 300 to 440m. The other groundwater monitoring points are all vertical holes drilled to depths ranging from 21mbgl to 270mbgl. The shallow bores intersect the regolith strata (weathered rock), whereas the deeper bores intersect the fresh bedrock.
The existing groundwater level monitoring network provides good coverage across the Yaouré project site, including the local towns and villages. Although the inclusion of the newly drilled bores, as part of the DFS hydrogeological assessment, would provide additional valuable insight.
Groundwater Quality
Groundwater quality data is available from 15 locations which were sampled on a monthly basis between December 2014 and November 2015 and a once off sampling round completed in January 2017. The

13
distribution of these locations closely matches the locations of the groundwater level monitoring network with some minor differences (Figure 6-5).
Groundwater samples were also collected between 2006 and 2012 at 18 locations with up to seven monitoring rounds completed over this period at some of the locations but with an average of approximately four monitoring rounds completed at each of the points during this period.
The existing groundwater quality monitoring network provides good coverage across the Yaouré project site The distribution of the groundwater quality monitoring points presents similar issues to the groundwater level monitoring network in that the location of some of the groundwater quality monitoring points coincides with proposed mine developments, such as the pit or the TSF, and will therefore be lost during mine development. The groundwater quality monitoring network provides data from within the main towns and villages within the Yaouré project area and also between the mine and Lake Kossou and the Bandama River.
The water quality analytical suite for the water samples collected includes a good range of major ions, nutrients and total and dissolved metals. The water quality results show the majority of the groundwater samples are Ca-Mg-HC03 water type with some locations having significantly higher sulphate, chloride, potassium and sodium. The results for GW9, a hand-held pump at Kouakougnanou, show significantly elevated conductivity, nitrate, sulphate and chloride.
Hydraulic Parameter Data
Historical Data
A range of hydraulic parameter testing has previously been completed at the Yaouré project site including the following:
▪ Packer testing was completed on the eight YDD holes (G1-G8) as part of the PFS study. A total of 25 packer tests were completed with single and double packers, which showed varied responses, including no flow in some holes. Where injection flow was achieved the resulting permeability values derived ranged between 1x10⁻⁷m/s and 7x10⁻⁶m/s;
▪ A total of 20 falling head tests were carried out for the PFS although only four provided useful data due to either water level recovery being too slow or too fast to measure a response. The resulting derived permeability values range from 2x10⁻⁷m/s to 1x10⁻⁶m/s;
▪ Pumping tests were completed at three locations close to the planned pit area (G2, G5 and G7) and also at two of the village wells (GW7 and GW8). The tests completed in the village wells only monitored response in the pumping well, whereas the tests in the pit bores also recorded water level drawdown in adjacent holes. The pumping rates used for the tests were quite low, ranging from 0.6L/min to 20L/min. The duration of the pumping tests are not provided. The resulting transmissivity values range from 0.02m2/d to 27m2/d.
The hydrogeological testing completed previously indicated that the permeabilities of the strata in the Yaouré project area are generally low with isolated areas of moderate permeability. The derived permeability values ranged from 1x10⁻⁷m/s to 7x10⁻⁶m/s. There was insufficient detail within the PFS to establish unit specific permeability values for the weathered or fresh rock strata.
As part of the DFS the raw falling head test data available from the PFS was reviewed and re-analysed. Thirteen of the twenty falling head tests were re-analysed in order to provide additional insight into the hydraulic properties of the saprolite, saprock and fresh bedrock at the Yaouré site. Re-analysis of the historical data providing the following permeability results:
▪ Saprolite/Saprock: 1x10⁻⁸ m/s to 1x10⁻⁶m/s;
▪ Bedrock: 5x10⁻⁸m/s to 5x10⁻⁷m/s
This re-analysis confirmed the range of variability evident with regards to the permeability of both the weathered and fresh rock.
2017 Hydrogeological Field Investigation Data AnalysisPit Area

14
Analysis of the pumping test data for the two bores (YRC1171WO and YRC1172WO) completed in the pit area provided the following results:
▪ YRC1171WO (Volcanoclastic/Basalt Contact, Basalt & CMA) - Transmissivity = 3.5m/d;
▪ YRC1172WO (Volcanoclastic/Basalt Contact & Basalt) - Transmissivity = 3.0m/d.
Conversion of the estimated transmissivity values into unit specific permeability values is quite subjective as it is dependent on interpretation of zone of contribution. Based on the drilling results it appears that water inflows increase intermittently throughout the basalt, but also at the specific volcanoclastic/basalt contact and CMA mineralised zones. Based on the depth of saturated thickness, this would suggest bulk permeability values of approximately 0.03m/d (3.5x10⁻⁷m/s) in this more permeable part of the pit area. However, assigning this transmissivity to discrete specific enhanced permeability zones suggests that individual zones of elevated permeability may be of the order of 0.3m/d (4x10⁻⁶m/s).
Various pumping tests and airlift recovery tests were also completed on YRC11757 (ESIA/G2) on the eastern side of the proposed pits. This is a shallow bore (installed to 40m but currently blocked at just over 30m depth) and is screened through the base of the saprolite and upper part of the saprock. The low yield and high sediment load in this bore made it difficult to test and raises some uncertainty with regards the subsequent analysis, however, analysis of the data returned permeability values in the order of 0.01 to 0.02m/d (approximately 1x10⁻⁷m/s).
TSF Area
Pumping tests were to be completed on YRC1173WO and YRC1174WP as part of the DFS but the pump broke and it was therefore not possible to perform pumping tests on these two holes. However, airlift recovery tests were completed on three holes (YDD505, YDD506 and YDD508) drilled primarily for geotechnical purposes within the footprint of the TSF. Analysis of the data suggests that permeability values range from 1x10⁻⁸m/s to 5x10⁻⁷m/s in the TSF areas tested.
Perseus Camp Bore
Analysis of the pumping test data for the Perseus Camp Bore returned a transmissivity of approximately 0.65m/d and a permeability of approximately 1x10⁻⁷m/s (approximately 0.01m/d). The bore was pumped at a rate of approximately 7.5 litres per minute for 50 minutes and then increased to approximately 10 litres per minute for a further 30 minutes, after 80 minutes of pumping the water level was drawn down approximately 7.5m (from 30.05 to 37.53 metres below the top of the casing).
6.6 Conceptual Hydrological and Hydrogeological Model
The following section presents the conceptual models developed as part of the Yaouré DFS.
Conceptual Hydrological Model
The majority of water courses in the vicinity of the Yaouré site are ephemeral, with the exception of the Bandama River to the south and east of the site.
During the dry season there is likely to be higher initial infiltration from rainfall events and lower runoff rates. During the wet season it is likely that infiltration rates would be lower, with a higher likelihood of rainfall occurring in the days preceding any rainfall event (meaning the soil is already fully saturated) and higher runoff rates. The primary design rainfall events utilised for surface water management and dewatering infrastructure are the 5 Year and 100 Year Return Period events, with all durations being assessed in order to determine the critical duration event which was used in the DFS. An average annual rainfall total of 1,273mm was adopted for this assessment.
The majority of the proposed site infrastructure is sited in the upper elevations of the catchments in which they are located, which tend to have steeper slopes than at lower elevations in the same catchments. The waste dumps are proposed to be located in the shallower slopes of the catchment downstream of the rest of the mine infrastructure. Steep slopes combined with little primary rainforest being present in the site area would result in a relatively quick rainfall runoff response, requiring diversion around infrastructure. However,

15
with the infrastructure located in the upper catchment elevations this will result in reduced upstream catchment areas generating rainfall runoff requiring diversion.
The expected alterations of the local hydrological regime, as a result of the mine development, include:
▪ The pit will remove area from the catchment, resulting in reduced direct rainfall runoff from the catchment.
▪ Waste rock dumps will elongate flow paths for runoff, draining along benches incorporated into the waste rock dump design, prior to draining to a perimeter drain and discharging via the sediment treatment facilities. This would result in longer time to peak flow, and a lower magnitude peak runoff flow rate;
▪ Any hard standing constructed, compacted earthworks and similar works would decrease infiltration and result in increased runoff rates from these areas;
▪ Site clearance would similarly result in lower evapotranspiration rates and increased catchment runoff rates.
Conceptual Hydrogeological Model
The hydrogeology of the area is characterised as comprising two broad aquifer types; including the shallow weathered rock aquifer and the deeper fresh rock aquifer. The hydrogeological testing completed indicates that the permeability of the strata in the Yaouré project area is generally low although there are isolated areas of moderate permeability, derived permeability values ranged from 1x10⁻⁷m/s to 7x10⁻⁶m/s.
Specific zones of elevated permability are likely to exist at the base of the weathered rock profile (the transition zone between the weathered and fresh rock), at the volcanoclastic/basalt contact and brittle structures (e.g. northern portion of the CMA).
A conceptual model cross section through the pit extending from Lake Kossou to Bandama River is illustrated in
Figure 6-7.
The shallow weathered rock zone includes the laterite, saprolite and saprock/transition zone located above the fresh bedrock. The permeability and porosity is highly variable throughout these weathered strata; the transition zone (directly above the fresh bedrock) is likely to have the highest permeability, while the shallower more decomposed layers (with less discrete fractures, which are commonly infilled with sediment containing high clay content) will have a lower permeability. Most of the village wells in the area are likely to draw groundwater from the shallow weathered rock aquifer. However, vertical and lateral lithological variations in these strata mean that these strata can only supply low yield wells and are typically an unreliable water supply option.
Groundwater flow through the fresh rock aquifer is primarily associated with geological fractures and fissures within the rock mass. The porosity is very low and permeability is only elevated in areas where fissuring and fracturing is dense and with limited infilling.
Groundwater levels are typically within the saprolite or in the upper part of the fresh rock. The thickness of the weathered rock layer is highly variable and therefore limits the potential for extensive groundwater flow. Core logs suggest limited occurrences of groundwater flow within the bedrock below 150 metres above datum. Evidence from aquifer testing suggests that connection with the fracture/fissure system is relatively limited, resulting in a generally low overall transmissivity for the bedrock. It is considered, however, where zones of enhanced permeability are more extensive (eg. CMA and volcanoclastic/basalt contact zone) and where there is potentially more hydraulic connectivity, there is potential for the existence of higher groundwater flow zones. While these flows may initially be high they may reduce rapidly depending on aquifer storage and links to recharge sources.
The average annual rainfall is 1,273mm/yr, although only a relatively small proportion of this rainfall (possibly as little as only 5%) is likely to be converted to groundwater recharge in the Yaouré area. The ephemeral nature of the local streams suggests that there is limited groundwater connection with the local surface water features. Most rainfall which percolates to ground is subsequently lost via evapotranspiration from the root zone. The groundwater hydrographs (Figure 6-6) show limited and gradual annual water level

16
fluctuations (an average of approximately 3m) which suggests the thick unsaturated zone mutes the aquifer response to rainfall events and that there is a significant lag time between rainfall infiltration and recharge reaching the water table. Ferricrete crusts, which are developed on a number of hill top interfluves west of the proposed mine, will also impede recharge locally and lead to higher runoff rates in these areas. In addition, there will be significantly reduced recharge over the footprint of the TSF.
6.7 Numerical Groundwater Modelling
A 3D numerical groundwater flow model has been specifically developed as part of the Yaouré DFS. The groundwater model was used to predict pit dewatering rates, to develop an appropriate pit dewatering strategy and to estimate the potential impact of dewatering on nearby village water supply wells.
The groundwater model has been developed using the Groundwater Vistas software with the Modflow-Surfact numerical code. A detailed description of the groundwater modelling approach, model set-up, model parameters, model calibration and model results are all provided in the RPS Water Management DFS Report provided in Appendix 6.
Pit Groundwater Inflows
The groundwater model was run using seven stress periods, which extend from the proposed start of mining in 2018 to the mine completion in 2026. The model stress periods were established based on key mining phases and were set-up based on the commencement of mining in new areas and significant pit expansions. The stress periods are of variable duration and are summarised in Table 6-3 and illustrated in Figure 6-8. It should be noted that the final mining sequence and final pit designs may vary from those modelled as part of this assessment; however, overall pit inflows are not expected to differ substantially from those predicted.
Two base case dewatering scenarios were evaluated using the groundwater model, as follows:
− Pit dewatering using in-pit sumps, located at the lowest point of the various pits. In this scenario groundwater inflows to the pit were modelled using drain cells at the elevation of the base of the pits. There was no ex-pit or advanced dewatering in this scenario;
− Pit dewatering with in-pit sumps and ex-pit bore dewatering along the CMA structure. In this scenario the drain cells were set up as per Scenario 1, but a dewatering bore was included directly east of the pit intersecting the CMA. The abstraction rate from this borehole was optimised for dewatering of the CMA structure.
Table 6-3 Groundwater Model Stress Periods
Duration
(Days) 454 366 91 275 182 365 1,369
Stress Period SP1 SP2 SP3 SP4 SP5 SP6 SP7
Stress Period End Date
31/03/19 31/03/20 30/06/20 01/04/21 30/09/21 30/09/22 30/06/26
CMA1 x
CMA2 x x
CMA3 x x
CMA4 x x
North x x
South x x
The predicted groundwater inflow rates for the two base case scenarios are presented for the life of mine in Figure 6-1 and Figure 6-2. The charts show the predicted groundwater inflow into each of the individual sub-pits and also a combined total predicted groundwater inflow. It is important to note that these predictions assume on-going dewatering in all various sub-pits across the mine, should pits be mined out and then no

17
longer dewatered then this would lead to reduced groundwater inflows. The sub-pit labelling system adopted is illustrated in Figure 6-8.
Figure 6-1 Scenario 1: Pit Groundwater Inflows (In-Pit Sumps Only)
Figure 6-1 shows the predicted groundwater inflows, from in-pit sumps only, to the various pits. The total combined groundwater inflows are predicted to increase up to a maximum of approximately 55L/s over the life of mine. The biggest inflows occur at CMA Stage 4 (up to 43L/s), followed by Yaouré North 2 (up to 14L/s), followed by Yaouré North 1 (up to 10L/s), with relatively minor inflows to the other pits (<5L/s in total).
Figure 6-2 Scenario 2: Pit Groundwater Inflows (In-Pit Sumps) and Dewatering Bore

18
Figure 6-2 shows the predicted groundwater inflows and the dewatering bore abstraction rate for the combined in-pit sumps and dewatering bore scenario. Based on the current model set-up, the model suggests that a rate of 750m3/d (8.6L/s) may be sustainable for a dewatering bore intersecting the CMA (or a similar permeable structure in this area of the pit). The model results show that the total pit groundwater inflows for this scenario are 16% lower (approximately 9L/s less at 46L/s) than in Scenario 1 which does not include a dewatering bore. The total predicted dewatering rate, including both the in-pit sumps and the bore, is approximately the same (55L/s) as in Scenario. Therefore there is no reduction in the total volume of groundwater dewatering required by targeting the CMA with a dewatering bore. However, there are advantages associated with bore dewatering of the CMA (or a similar more permeable zones); such as providing advanced dewatering opportunities (dropping water levels in advance of mining these levels), enhanced and earlier depressurisation of the saprolite in the eastern hanging wall, pumping less “dirty” water from the pit, and the bore would provide an additional “clean” water supply option.
For the modelling exercise the dewatering bore was positioned on the eastern perimeter of the final pit (outside of the pit for the life of mine). However, this location is at least 500m east of the CMA outcrop and therefore with the CMA dip range of 30o-40o the bore would need to be approximately 300m deep to intercept the CMA feature. The modelling completed has provided insight into the effectiveness and impact of installing a dewatering bore, however, there is some uncertainty regarding the feasibility of installing a dewatering bore at this exact location.
The CMA structure could be targeted further west, where it is shallower, earlier in the mine life. A dewatering bore located at the eastern perimeter of the starter pit would effectively dewater the CMA feature and depressurise the shallow weathered sediments early in the mine life, exactly when it is most required. The only constraint would be that as the pit expands the bore would then be within the expanding pit footprint and could be lost. However, at that stage the bore would have largely fulfilled its purpose, intercepting the more significant early mine life inflows from the CMA and assisting with depressurising the clay rich upper sediments which could cause upper pit wall instability. Thus while the modelling completed provides insight into the potential benefits and impact of incorporating dewatering bore(s) into the pit dewatering strategy, the location of dewatering bores will need further consideration of the final mine plan and CMA depth in order to derive an optimal location (in order to minimise depth of drilling, while maximising dewatering effectiveness and longevity). If dewatering bores are to be incorporated into the dewatering strategy then it will also be necessary to undertake further investigations of the CMA in order to confirm its hydrogeological properties (particular to confirm permeability, storage and degree of hydraulic connectivity within the structure itself and the surrounding rocks).
Pit Dewatering Impact on Village Wells
The model predicted a drop in groundwater level (cone of depression) related to the pit dewatering at the end of the mine life (assuming all pits mined are still being actively dewatered), for Scenario 1 and is illustrated in Figure 6-9. This figure illustrates that overall there is significantly greater drawdown predicted to the east of the mine in comparison to the west of the mine. As a result there is relatively minor drawdown predicted in the vicinity of the adjacent village of Angovia. The more significant drawdown predicted to the east of the mine is related primarily to the fact that the eastern pit is deepest part of the mine and also the influence of the higher permeability CMA zone in the model which dips to the east. Figure 6-10 shows an east-west cross-section of the model through the CMA structure and the existing pits for both Scenario 1 and 2 at the maximum pit extent. This illustrates the influence of the CMA in Scenario 1 and the influence of the dewatering bore in Scenario 2.
The 1m drawdown line is predicted to be approximately 1km from the Lake Kossou and 1.2km from the Bandama River, thus no significant impact is predicted as a result of pit dewatering on either Lake Kossou or the Bandama River.
Figure 6-3 presents the predicted drawdown at the various village water supply wells in the towns adjacent to the mine; to the west Angovia (GW1, GW2 & GW3), to the south-west Akakro (GW4) and to the south east Kouakou Gnanou (GW9). The model predicts a water level drawdown at Angovia of up to approximately 2.5 metres below the current water level (mbcwl) in both the weathered rock and the bedrock. There is no discernible drawdown predicted in any of the other village wells.

19
Figure 6-3 Water-table Drawdown at Village Wells
As dewatering occurs from the pit centre via pumping from a sump the deepest point of the cone of depression is further away from the adjacent village wells.
Prediction Uncertainty
The groundwater model parameters were adjusted within likely ranges of variability, based on heterogeneity in the hydrogeological parameters, in order to determine the influence of parameter uncertainty on model predictions.
In summary, the predictions of groundwater pit inflows are most sensitive to changes in the permeability of the fresh rock and CMA, and the regional drawdown is most sensitive to changes in the fresh rock and transition zone permeability.
The predicted village well drawdown is most sensitive to changes in the fresh rock and the transition zone permeability. Increasing the bedrock permeability by a factor of two approximately doubles the drawdown predictions at the Angovia wells.
6.8 Surface Water Management
Base Case Information
The base case is derived from the following information:
▪ Meteorolology
− Annual Average Rainfall (1,273mm, Knight Piesold);
− Rainfall Intensity Frequency Duration (PFS).
▪ Site Infrastructure
− Pit Designs:
Yaouré North;
Yaouré South;
CMA Stage 1, CMA Stage 2, CMA Stage 3 & CMA Stage 1;
− Site Infrastructure Outlines (1960-110-GEDLA-003_B.dxf).

20
▪ Topography
− Site Contours (Yaouré_Perseus_Contours.dwg).
▪ Catchment Characteristics
− Site Contours (Yaouré_Perseus_Contours.dwg);
− ESIA Report – Appendix 7.
Surface Water Management Aproach
The ESIA (Appendix 23) presents the water management plan for the Yaouré site with the following stated broad objectives:
▪ Maintain a low risk of uncontrolled discharge occurring over the project life;
▪ Operate the TSF as close as possible to a zero discharge facility;
▪ Minimise the requirement for external water sources;
▪ Maximise the reuse of collected water;
▪ Minimise the disruption to mining operations by efficient water management;
▪ Ensure reliable and secure water supply;
▪ Comply with cyanide management guidance and discharge standards of Côte d’Ivoire.
A surface water management approach has been developed as part of the DFS for the Yaouré site based on the following stated principles:
▪ Runoff from disturbed areas to be managed separately from undisturbed areas, and only discharged provided it meets site effluent water quality criteria;
▪ Runoff from undisturbed areas to be diverted around project works to minimise the water volumes requiring management;
▪ Diversion ditches to be grass lined, with check dams incorporated on steeper sections.
The guiding principles underpinning the surface water management design developed as part of the DFS consist of:
▪ Runoff from undisturbed areas surrounding the site infrastructure and pit development will be diverted around the disturbed areas to natural water course channels downstream:
− Diversion channels reduce the erosion potential along the perimeter of site infrastructure, such as the bunds at the toe of the waste dump;
− Diversion channels prevent undisturbed catchment runoff combining with disturbed catchment runoff, allowing it to discharge to a downstream watercourse without requiring sediment settlement treatment prior to discharge.
▪ Runoff from disturbed catchment areas such as the waste dumps and process plant site will be captured by a downstream diversion channel and diverted to a sedimentation basin prior to discharge to a downstream watercourse or diversion drain for undisturbed catchment runoff:
− Diversion channels minimise untreated disturbed catchment runoff combining with disturbed catchment runoff, which would require much larger sedimentation basin sizes to settle sediment in the combined runoff due to increase runoff volumes.
▪ Where diversion drains are not possible due to local topography, water ponding and subsequent pumping options would be considered.
Figure 6-11 provides an overview of the surface water management plan developed as part of the Yaouré DFS. The surface water management catchments have been delineated based on the currently available LIDAR data, site infrastructure layouts and pit outlines.
The majority of the site surface water management is relatively straight forward and closely adheres to the guiding principles detailed above. A surface water management system has been designed such that no
21
pond and pumping arrangements are required and all water can drain under gravity with no major earthworks excavations required.
There are, however, two key areas which will need further consideration as part of subsequent project phases in order to optimise surface water management and how it relates to the scheduled development of infrastructure. The two areas for subsequent further consideration include:
1. North eastern extent of the waste dump:
▪ The undisturbed catchment area (CW02a) of approximately 60 hectares located between the Yaouré North and Yaouré South Pits and the waste dump drains to the natural watercourse which is intercepted by the north eastern toe of the waste dump;
▪ This undisturbed catchment area is estimated to generate rainfall runoff peak flow rates in excess of 13m3/s for the 100 Year Return Period critical duration storm event;
▪ A significant portion of the disturbed waste dump catchment (DW06) also drains to this area (via a sedimentation basin) and is estimated to generate rainfall runoff peak flow rates of approximately 12.5m3/s for the 100 Year Return Period critical duration storm event;
It is recommended that the natural drainage alignment is retained in this area and amendments made to the waste dump design (as illustrated in
▪ Figure 6-7), in order to avoid the necessity for pond and pumping arrangements for peak storm flow at this location and as significant ponding in the vicinity of the pit could potentially lead to slope stability issues as well as increased pit inflows.
2. To the north east of the CMA pit, there does not currently appear to be sufficient space to provide the width required for a sufficiently sized drainage channel to convey rainfall runoff downstream based on the CMA Stage 4 footprint, the haul road alignment and the adjacent infrastructure.
▪ The undisturbed catchment area (CW02) of approximately 60 hectares to the east of the CMA Pit and to the south of the process plant naturally drains to an area between the CMA Pit and adjacent infrastructure, in which the haul road is proposed to be located;
▪ There is very limited space in this area to provide for a suitably sized drainage channel to convey the peak flow rates in excess of 13m3/s for the 100 Year Return Period critical duration storm event;
▪ It is understood that the adjacent infrastructure consisting of the existing heap leach pads will no longer be in place when the final footprint of the CMA pit is achieved, and hence, the areal restriction for the construction of the drainage channel may not occur due to the staging of development on the mine site;
▪ During the detailed design stage, the staged progression of the removal of the heap leap pads should be examined, to provide for alterations required to the drainage alignment in the area as the CMA pit development approaches its final footprint, in conjunction with any re-alignment of the haul road which may be required in the vicinity.
Surface Water Modelling, Design Flows & Flood Risk
Undisturbed Catchment Runoff Management
The two largest undisturbed surface water catchments requiring diversion around mine site infrastructure are approximately 60 hectares (Ha) each. The first catchment (CW02a) drains between the waste dump and the Yaouré North Pit and receives rainfall runoff discharge from the second largest disturbed catchment area on the waste dump (DW06 – 63Ha) via a sedimentation basin. The second catchment (CW02) drains to the north east of the CMA Pit and alongside the existing heap leach pads. Due to the steep slope of the upper reaches of both catchments, the time of runoff concentration for the catchments is quite short at only approximately 20 minutes. The peak flow rates estimated for the 100 year return period 20 minute duration event is approximately 26m3/s for CW02a, which includes the DW06 catchment runoff, and 13m3/s for CW02.
The lower reaches of the catchments near infrastructure and the pit developments have a much shallower slope. In addition to conveying runoff from a larger upstream catchment than the steeper upstream diversion

22
channels, the shallower slope necessitates larger channel cross sectional areas. Trapezoidal channel designs have been developed for CW02a and CW02 and comprise a 1.2 m depth x 3.0m base width channel and a 1.2m depth x 2.0m base width channel, respectively, with 1(V):2(H) side slopes. The channels combine downstream of the CMA pit development, prior to discharge to the environment, and a channel 1.7m depth x 6.0m base width with 1(V):2(H) side slopes will be required to convey flow downstream of the proposed adjacent haul road and subsequent discharge to the environment.
The remaining undisturbed surface water catchments range in size from less than 1 Ha to 57 Ha, with typically shorter times of concentration due to the smaller catchments. The designed channels are vee-shaped for smaller flow rates and trapezoidal for larger flow rates, all with 1(V):2(H) side slopes and depths of 1.2m or less.
The channel design details for all undisturbed catchments are provided in the RPS Water Management DFS Report provided in Appendix 6, including estimated earthwork cut volume requirements. All diversion channel designs were based on the Rational Method for estimating peak flow rate, and the following:
▪ 100 year return period critical duration storm event;
▪ Manning’s n value of 0.029 (gravel lined);
▪ Channel side slopes of 1(V):2(H);
▪ Minimum channel slope along the selected diversion alignment.
In the steeper sections of the channel alignments, velocity control measures will be required which can include drop structures, in-channel check dams and meandering channels to reduce the slopes of the channel. Catchpits can also be considered along the channels, which will reduce and delay peak flow rates in the channel in addition to aiding sediment settlement prior to discharge to downstream water courses.
Disturbed Catchment Runoff Management
The disturbed catchment areas consist of the plant site and adjacent infrastructure, the accommodation camp and the waste dump. The largest disturbed catchment areas are the eastern side of the waste dump (DW06 – 63Ha), the infrastructure around the existing heap leach pads (DW07 - 68Ha) and the Process Plant and Rompad Area (DW08 - 56Ha). Diversion channels along the perimeter of the disturbed catchments were sized on the same basis as the undisturbed catchment diversion channels.
Disturbed catchment runoff pathways were devised based on the estimated footprint of the site infrastructure disturbed catchments in order to allow preliminary sizing of the sedimentation basins required. Preliminary minimum sizing of sedimentation basins for runoff from the disturbed catchment areas on site was based on the 5 year return period peak flow rate.
Particle size analysis was undertaken on two samples collected from rainfall runoff from the Yaouré site. The distribution indicates that the large majority of particles are smaller than 100 microns but larger than 1 micron. Information on the breakdown of particles between these two sizes was not available, however, a target particle size for removal of 50 Micron was selected, as the areal requirements for targeting smaller particles would have resulted in unfeasibly large sedimentation basins. Additional mitigation in the upstream water management such as in-channel check dams and catchpits can be implemented. Sedimentation basins will typically have a minimum settling depth of 0.6m with additional depth required to provide storage capacity for settled materials. The sedimentation basin sizing requirements ranged from 5m x 15m to 42m x 126m (length x width) across the various disturbed catchments.
The channel design details and sedimentation sizing details for all disturbed catchments are provided in the RPS Water Management DFS Report provided in Appendix 6, including estimated earthwork cut volume requirements.
The surface water management plan should be updated in line with any future site infrastructure layout modifications.

23
Surface Water Management Capital & Operating Costs
The surface water management plan developed does not require any pond and pumping arrangements and as a result there are no capital expenditure costs (CAPEX) associated with pumps, pipelines, etc. and no operating expenditure cost (OPEX) associated with power requirements for pumping.
The only water management related CAPEX/OPEX are those associated with the earthworks required for the construction of diversions and sedimentation basins. The estimated earthworks cut volumes are detailed in the RPS Water Management DFS Report provided in Appendix 6, but can be summarised as follows:
▪ Diversion drains – total earthwork cut volume 80,000m3;
▪ Sedimentation basin – total earthworks cut volume 35,000m3;
▪ Total earthworks cut volume = approximately 115,000m3.
The proposed earthworks are all possible using standard earth moving machinery which will already be on-site for other construction activities. Applying a project specific earthworks rate to these derived earthwork cut volumes will allow the actual surface water management costs to be estimated.
6.9 Pit Dewatering Strategy
Dewatering Strategy
A pit dewatering strategy has been developed as part of the Yaouré DFS, based on the currently proposed pit development and model predicted pit inflows. Pit inflows will comprise both groundwater and surface water (rainfall runoff) inflows, as follows:
▪ Groundwater inflows – from the surrounding rock mass and geological structures once the pits progress below the groundwater table;
▪ Surface water inflows – from rainfall runoff falling within the pit footprint itself and also from the immediately adjacent surface catchments which drain towards the pit.
Inflows from both these sources have been predicted using standard hydrological and hydrogeological models and using the currently provided pit areas, pit depths and pit development schedule.
The rock mass surrounding the pits is generally low permeability material which provides limited opportunity to manage groundwater inflows via advanced dewatering bores external to the open pit. However, there is the opportunity for localised groundwater abstraction via dewatering bores where more permeable fracture zones exist. It is proposed that the bulk of the groundwater and rainwater runoff derived inflows to the pit will be removed by pumping from in-pit sumps.
Pit inflows have been estimated for each individual pit catchment, each one comprising a local low elevation point to which the surrounding pit sub-catchment area drains. It is proposed that in-pit sumps will be excavated at each of the low points and that in-pit dewatering pumps will be located at each of these locations. Both rainfall runoff and groundwater inflows will drain to these low point sumps and will then be subsequently pumped out of the pit via dewatering discharge pipelines. The dewatering pipelines will discharge to lined sedimentation basins, positioned not far from the pit perimeter, in order to provide sediment settlement treatment prior to discharge to the environment or subsequent on-site usage. An overview of the proposed pit dewatering system is provided in Figure 6-12.
In addition to the main low point sumps, small temporary sumps will be installed at various locations around the pit to locally control water in working areas or at localised enhanced groundwater inflows zones. These small sumps will subsequently discharge to the main pit sump or will be pumped directly out of the pit from these locations. Booster or transition pump stations will likely to be required in order to pump water from the CMA pit sump, as the pit develops toward the CMA Stage 4 pit design.
The transition zone (directly above the fresh rock) often forms a localised highly transmissive zone which has the potential to rapidly transmit large volumes of infiltrating rainwater to the pit during large storm events. It is recommended that a specific bench dewatering system be installed within the pit at this location in order

24
to manage any enhanced inflows from this horizon. This system could include the incorporation of a slightly larger berm and toe drain at this level so that these inflows can be intercepted and managed accordingly.
Where permeable structures exist and where there is the potential for localised enhanced pit groundwater inflows, ex-pit or in-pit dewatering bores will be considered in order to intercept this water prior to it flowing into the pit. Dewatering bores, if installed, should target permeable structures such as the CMA zone or the volanoclastic/basalt contact. The use of dewatering bores is not likely to significantly reduce overall groundwater pumping requirements, but it would have the benefit of minimising pit floor pumping, provide a cleaner water supply, draw groundwater levels down in advance of mining and improve pit wall stability in the upper clay rich sediments.
Dewatering System Design
When pits are excavated in relatively low permeability rocks the pit dewatering system design is generally focussed primarily on managing the rainfall runoff component of large storm events and minimising the time that the pit floor may be inaccessible due to water inundation following large rainfall events.
In order to design an appropriate pit dewatering pumping systems the potential combined groundwater and rainfall runoff (surface water) derived pit inflows were assessed over a 24 hour period. The predicted average groundwater inflows to each of the individual final pits (detailed in Section 6.7) over a 24 hour period (based on the in-pit sump pumping only scenario which maximises pit groundwater inflows) are presented inTable 6-4.
Surface water inflows to the pit sub catchments for the final pit design have been estimated using the 100 year return period 24 hour rainfall event, individual pit sub-catchment areas and a volumetric runoff coefficient of 0.63, and are also presented inTable 6-4.
Table 6-4 Predicted Final Pit Inflow Volumes for 24 Hour 100 Year Return Event
Sub Area (Ha) SW Inflow (m3) GW Inflow (m3) Total Inflow (m3)
CMA Stage 4 65 74,631 3,724 78,355
Yaouré North 1 15 16,763 307 17,070
Yaouré North 2 15 16,834 604 17,438
Yaouré South 1 33 38,495 20 38,514
Yaouré South 2 7 8,299 57 8,356
The required pumping capacity to remove the predicted total pit inflows (groundwater and surface water) from the 24 hour 100 year return period event, from each sump, in 3 to 5 days is presented in Table 6-5 also provides details of the sedimentation basin area requirements to manage the water pumped from each pit.
Table 6-5 Pit Dewatering Pumping & Sedimentation Basin Requirements (3-5 Days)
Pit Pumping Rate
(L/s)
Head Requirement
(m)
Time to Dewater
(Days)
Basin Area
(m2)
CMA Stage 4 200 200 4-5 147
Yaouré North 1 50 120 4 48
Yaouré North 2 50 130 4 48
Yaouré South 1 100 70 4 75
Yaouré South 2 35 90 3 27

25
An additional assessment adopting a time to dewater the pit of up to 7 days, on the basis that mining could continue on the upper benches while the pit base was dewatered, was undertaken and the required pumping capacity is presented in Table 6-6 (along with the sedimentation basin area requirements).
Table 6-6 Pit Dewatering Pumping & Sedimentation Basin Requirements (7 Days)
Pit Pumping Rate
(L/s)
Head Requirement
(m)
Time to Dewater
(Days)
Basin Area
(m2)
CMA Stage 4 130 200 7 108
Yaouré North 1 30 120 7 27
Yaouré North 2 30 130 7 27
Yaouré South 1 65 70 7 48
Yaouré South 2 15 90 7 12
In addition, indicative pump specifications (using Allight/Sykkes pumps as standard examples) and approximate pump costs are presented inTable 6-7. No other capital or operating costs have been derived for the dewatering plan, as part of the DFS, as we understand that these costs will be captured within the mining contractor costs.
Table 6-7 Pit Dewatering Pump Examples and Costs
Sub Pump Pump Unit Cost
(USD) No. of Lifts
Total No. Pumps
Total Pump Cost
(USD)
CMA Stage 4 XH150 x 2
HH130i x 2
$130,000
$110,000 2 4 $480,000
Yaouré North 1 HH130i x 1 $110,000 1 1 $110,000
Yaouré North 2 HH130i x 1 $110,000 1 1 $110,000
Yaouré South 1 HH130i x 2 $110,000 1 2 $220,000
Yaouré South 2 HH130i x 1 $110,000 1 1 $110,000
Annual Pit Dewatering Volumes
Estimates for annual average pit dewatering volumes (for each individual pit) have been derived, based on groundwater inflows from the seven stress periods assessed in the groundwater model and the associated surface water inflows based on the pit footprints represented in each stress period. Average annual surface water inflows were based on the sub-catchment areas, a volumetric rainfall runoff coefficient of 0.42 and an average annual rainfall of 1,273mm. Table 6-8 provides the estimates for total pit dewatering volumes for a one year period, based on the predicted annual average rainfall and groundwater inflows for each pit and for each stress period.

26
Table 6-8 Average Annual Pit Inflows (m3)
Pit
SP1 01/01/18
to 31/03/19
SP2 31/03/19
to 31/03/20
SP3 31/3/20
to 30/06/20
SP4 30/06/20
to 01/04/21
SP5 01/04/21
to 30/09/21
SP6 30/09/21
to 30/09/22
SP7 30/09/22
to 30/06/26
CMA Stage 1 706,000 499,000 487,000 - - - -
CMA Stage 2 - 216,000 207,000 - - - -
CMA Stage 3
North - - - 492,000 694,000 - -
CMA Stage 3
South - - - 132,000 186,000 - -
CMA Stage 4 - - - - - 1,706,000 1,208,000
Yaouré North 1 393,000 259,000 252,000 252,000 220,000 190,000 158,000
Yaouré North 2 528,000 366,000 359,000 359,000 328,000 298,000 266,000
Existing Pit 204,000 213,000 213,000 188,000 - - -
Yaouré South 1 - - - - 217,000 186,000 179,000
Yaouré South 2 - - - - 112,000 60,000 46,000
Total Average
Annual 1,831,000 1,553,000 1,518,000 1,423,000 1,757,000 2,440,000 1,857,000
6.10 Water Monitoring Programme
A comprehensive water monitoring network has been established at the Yaouré mine site and water monitoring has been completed for the purposes of the PFS and DFS. On-going water monitoring will be required in order to continue to establish baseline conditions prior to the commencement of mining. The water monitoring programme should be reviewed and refined as the project moves into construction phase and then subsequently operation and closure to ensure that the water monitoring programme meets the specific requirements of each project phase.
Meteorological Monitoring
Meteorological monitoring is carried out at the Yaouré Mine Site Weather Station. An automatic weather station currently monitors temperature, humidity, rainfall, wind speed and wind direction. It is recommended that the meteorological monitoring is continued to be monitored on a daily basis.
Surface Water Monitoring
Surface Water Flows
There are currently six surface water flow monitoring locations in the vicinity of the Yaouré site. Flow monitoring commenced at five locations (S1, S5, S8, S12 and SW4) in December 2014 and at S13 in September 2016. Flow rates are currently monitored monthly during the dry season and more regularly during the wet season. It is recommended that the surface water flow monitoring is continued on the same basis, with event based flow monitoring undertaken during the wet season.
Surface Water Quality
There are currently fourteen surface water quality monitoring locations in the vicinity of the Yaouré site. Seven monitoring locations are located on surface water courses (S1, SW3, SW4, S5, SW6 S8, S12 and SWWS) across the project area. Location S12 appears to be sampling a water course which will not capture site catchment runoff, however, it does provide useful background water quality data. Three monitoring

27
locations are located on surface water ponds (SWBP, SWDP and SWEP) and three locations (YSP, YCP and YNP) are located within the pit area.
Once pit development commences it will not be possible to continue the water quality monitoring previously undertaken in the pit area. However, when pit dewatering commences it is recommended that water quality monitoring of the water removed by dewatering be completed and dewatering rates should also be monitored.
It is recommended that surface water quality monitoring be completed on a quarterly basis.
Groundwater Monitoring
Groundwater Levels
The existing groundwater level monitoring network provides good coverage across the Yaouré project site, including the local towns and villages. The newly drilled hydrogeological bores should be included in the monitoring network. Groundwater monitoring points exist between the pit and Lake Kossou, and these monitoring points will allow any potential water level drawdown between the pit and the lake to be monitored.
Some of the monitoring points are located within the footprint of the proposed mine development, including the proposed pit, waste dumps and TSF locations. Thus some of the monitoring points will be lost during the mine development. Additional groundwater level monitoring points will also be required around the periphery of the pit in order to monitor the drawdown of the water table during pit development (and associated pit dewatering) and also to monitor pore-pressure distributions. The location, number and type of monitoring points will need to be discussed with the geotechnical engineering team to ensure the requirements of both the geotechnical and hydrogeological programmes are addressed. It is recommended that at least six pit perimeter groundwater level/pore pressure monitoring locations are defined. It is also recommended that alternate groundwater monitoring locations be defined to replace groundwater level monitoring points lost during the development.
It is recommended that groundwater levels are monitored across the entire groundwater monitoring network on a monthly basis.
Groundwater Quality
The existing groundwater quality monitoring network provides good coverage across the Yaouré project site. The distribution of the groundwater quality monitoring points presents similar issues to the groundwater level monitoring network in that the location of some of the groundwater quality monitoring points coincides with proposed mine developments, such as the pit or the TSF, and will therefore be lost during mine development. The groundwater quality monitoring network provides data from within the main towns and villages within the Yaouré project area and also between the mine and Lake Kossou and the Bandama River. It is recommended that alternate groundwater monitoring locations be defined to replace groundwater quality monitoring points lost during the development.
It is recommended that groundwater quality monitoring is completed across the entire groundwater monitoring network on a quarterly basis.
Water Monitoring Downgradient of TSF
On-going water monitoring downstream of the TSF will be critical in terms of establishing baseline surface water and groundwater quality data, and monitoring water quality subsequent to the TSF development.
Surface Water Flows & Quality
Currently surface water quality and flow is monitored at two locations down-gradient of the proposed TSF (SW4 and S5). Flows at S5 have been monitored from December 2014 to October 2017 and at SW4 from
28
November 2014 to January 2016. Water quality results are only available from 2014 and 2015 (three samples at SW4 and ten samples at S5).
The following recommendations are provided with regards to surface water flow and quality monitoring downstream of the TSF:
▪ An additional surface water monitoring site (ESIA/S15) should be included in the monitoring network. The new site should be less than 50m (and on the main drainage channel) downgradient of the proposed south easterly TSF embankment;
▪ Flow rates at SW4, S5 and the new location should be monitored monthly during the dry season and more regularly during the wet season; with event based flow monitoring undertaken during the wet season;
▪ Surface water quality monitoring should be undertaken on a monthly basis in order to develop a robust data set, as currently there is no data post 2015.
Groundwater Levels & Quality
Currently groundwater monitoring is undertaken at three bores ESIA/G4, ESIA/G5 and GW9 in the vicinity and down-gradient of the TSF. Groundwater levels are monitored on a somewhat sporadic basis at ESIA/G4 and ESIA/G5. Groundwater quality results are available from ESIA/G4, ESIA/G5 and GW9 from December 2014 and November 2015; and for January 2017 at GW9.
The following recommendations are provided with regards to groundwater level and quality monitoring downstream of the TSF:
▪ Two additional bores were installed downgradient of the TSF (YRC1173WO and YRC1174WP). These two new bores should be incorporated into the groundwater monitoring network;
▪ Groundwater levels should be monitored at ESIA/G4, ESIA/G5, GW9, YRC1173WO and YRC1174WP on a monthly basis;
▪ Groundwater quality monitoring should be undertaken on a monthly basis at ESIA/G4, ESIA/G5, GW9 and YRC1173WO (or YRC1174WP instead of YRC1173WO if it is fitted with a pump) in order to develop a robust data set, as currently there is very limited groundwater quality data post 2015.
6.11 Water Management Risks &Opportunities
Risks
The project risks were previously assessed by PML in the Yaouré Feasibility Study Risk Assessment (PML April 2016). The risks previously identified in the PML risk assessment and subsequent comments following completion of the DFS area as follows:
▪ Potential impact of pit dewatering drying out the Angovia village groundwater supply wells.
− The hydrogeological field investigations completed and the subsequent groundwater modelling completed as part of the DFS predicts that pit dewatering may reduce groundwater levels in the Angovia village area by up to 2.5m in both the upper weathered rock and underlying fresh bedrock, by the end of the mine life. The extent of impact of this predicted drop in water levels, on village water supply wells, will depend on the current depth of water in these wells and the depth of these wells (i.e. even if the water level drops in the well, as long as the well is deep enough then the only consequence may be having to pump water from a greater depth). However, should the village wells start to become less reliable as a result of mine dewatering then the nearby SHB1 bore (illustrated in Figure 6-3) is a viable alternative water supply for the Angovia village. On completion of the DFS there is a low residual risk;
▪ Potential impact on groundwater and surface water quality as a result of a release of water from the heap leach ponds or TSF as a result of seepage as a result of liner wear or damage and/or overflow from the heap leach ponds/TSF due to failure of discharge mechanisms:
29
− The TSF has moved location for the DFS and is now directly upstream of the Kouakougnanou village. Excessive seepage of poor quality water from the base of the TSF or an overtopping of the TSF has the potential to significantly impact groundwater and surface water quality in the vicinity of the Kouakougnanou village and further downstream. Appropriate management of the heap leach ponds/TSF, on-going water monitoring and emergency response plans associated with these facilities will help to mitigate the risk but the major consequences associated with potential contamination associated with seepage/overtopping from the TSF means that a high residual risk remains.
▪ Inadequate site water management could lead to forced discharge of water to the natural environment (potentially leading to downstream impacts on water quality and flooding) and the potential flooding of the mine site and pit:
− The hydrological/hydrogeological field investigations completed, groundwater modelling, surface water modelling and robust surface water management designs (using 1 in 100 year critical events) completed as part of the DFS have mitigated the risks associated with inadequate site water management. However, the major consequences associated with this risk (including contamination of the downstream environment, flooding/damage of key mine infrastructure, pit flooding, increased risk of pit wall failure and increased risk of TSF failure) means that a medium residual risk remains.
▪ If not properly managed, groundwater contamination could occur through accidental spillage to the soil zone of hazardous or toxic materials either through use (i.e., movement, maintenance, refuelling of site vehicles and plant) or from storage (i.e. oils, fuels, solvents, lixiviates and curing compounds). The PML risk assessment concluded that this risk can be mitigated through standard measures in relation to the use, storage and transport of hazardous substances:
− The DFS confirms that this remains a low residual risk.
▪ Potential flooding of the pits may occur where structures of high transmissivity are intersected and are hydraulically linked to large water storages (e.g. Lake Kossou) which could lead to interruptions in mining activities and/or extra pumping costs. Given, the dewatering system design (including a mobile pump with a capacity of 370m3/hr), the PML risk assessment considered that the residual risk was low:
− The hydrological/hydrogeological field investigations completed, groundwater modelling, surface water modelling, robust surface water management designs (using 1 in 100 year critical events) and robust pit dewatering designs completed as part of the DFS have mitigated the risks associated with flooding of the pits. On completion of the DFS there is a low residual risk.
Additional risks identified by RPS as part of the DFS include the following:
▪ Potential flooding of the pits may occur where the transition zone (directly above the fresh rock) is highly transmissive and rapidly transmits large volumes of infiltrating rainwater to the pit during large storm events, as has occurred at other mines in the region. The potential impacts on mine operation can be mitigated by incorporating an appropriate dewatering strategy to manage any predicted inflows from this horizon, which may include a specific bench dewatering system at this level or specifically targeted dewatering bores. If managed appropriately the residual risk is estimated to be low;
▪ Potential pit wall failure if pore water pressures within the pit walls are not managed effectively. The majority of the rock mass intersected by the pit appears to have a low permeability and therefore may not readily drain and could result in a build-up of pore water pressures in the pit wall which could lead to pit wall instability. Completion of appropriate geotechnical assessments and if deemed necessary implementation of an appropriate pit wall depressurisation strategy (including appropriately spaced/length horizontal drain holes, advanced dewatering of permeable structures, etc.) should allow effective management of pit wall pore water pressures and pit wall stability. If managed appropriately the residual risk is estimated to be low;
▪ The north eastern end of the proposed waste dump intersects an existing stream channel with a significant upstream catchment. Surface water management at this location will be critical in order to ensure the integrity of the waste dumps and that disturbed runoff from the waste dump is managed appropriately. While this is an area requiring specific consideration, if managed in accordance with the proposed surface water management designs completed as part of the DFS the residual risk is estimated to be low.

30
Opportunities
The assessment completed suggests that the installation of dewatering bores would not necessarily reduce overall dewatering requirements, however, dewatering bores do provide a number of benefits. Installing a dewatering bore(s) would provide the following opportunities:
▪ Advanced dewatering - allowing groundwater levels in the pit area to be lowered in advance of mining rather than simultaneous with mining, which can lead to a drier pit floor creating better mining conditions, less vehicle tyre wear and better blasting conditions;
▪ Geotechnical - enhanced and earlier depressurisation of the clay-rich saprolite (particularly in the north-eastern hanging wall where oxide extends down to over 40m depth);
▪ Water management - pumping less “dirty” sediment laden water from the pit floor, resulting in less pumping costs (reduced head) and less water treatment requirements;
▪ Water supply – a dewatering bore(s) would provide an additional “clean” water supply option.
6.12 Conclusions
The key conclusions of the Yaouré DFS are as follows:
▪ Extensive rainfall records exist for various weather stations within the Yaouré project area and four years of rainfall data exists for the Yaouré mine site;
▪ The existing surface water and groundwater monitoring network provides good coverage across the Yaouré project area and in the vicinity of the local towns and villages;
▪ Hydrogeological testing completed suggests that the permeability of the strata in the Yaouré project area is generally low, although there are isolated areas of moderate permeability, derived permeability values ranged from 1x10⁻⁷m/s to 7x10⁻⁶m/s;
▪ The Rational Method was used to derive peak flow estimations, for the specific mine site catchments, for the 100 year return critical duration events. Design flows range up to a maximum of 26m3/s. There is the potential for significant peak flows during heavy rainfall events but these should be relatively straight forward to manage with appropriate storm water management strategy and design;
▪ A surface water management plan has been developed for the currently mine plan and current infrastructure layout. Diversion channels have been sized to manage peak flow rates with an additional freeboard of 300mm. In-channel flow velocity reduction measures such as drop structures, catch-pits and in-channel check dams will be required. Diversion channel sizing ranges from 0.5m v-shaped to 1.5m deep, 5m base width trapezoidal channels both with 2H:1V side slopes;
▪ The surface water management plan developed does not require any pumping, therefore there is no capital costs associated with pumps, pipelines, etc. and no operating costs associated with power for pumping. The only water management related capital and/or operating costs are those associated with the earthworks required for diversions and sedimentation basin construction. The total earthworks cut volumes were estimated at approximately 115,000m3. The proposed earthworks require standard earth moving machinery which will already be on-site for other construction activities;
▪ A 3D numerical groundwater flow model was developed for the Yaouré project area and was used to predict pit groundwater inflow rates and the potential impact of mine dewatering on local village water supplies over the proposed mine life (2018 to 2026);
▪ The CMA structure has a significant influence on pit groundwater inflow rates and the cone of depression. Drawdown in both the weathered and fresh rock at Angovia is predicted to be up to approximately 2.5m over the life of mine. The water level drawdown predicted in the other adjacent towns (Akakro and Kouakou) is predicted to be less than one metre. No significant impact is predicted as a result of pit dewatering on either Lake Kossou or the Bandama River;
▪ Installation of an ex-pit dewatering bore targeting the CMA structure would result in similar combined (bore and pit) dewatering rates as those without the inclusion of an ex-pit dewatering bore. However, advantages associated with bore dewatering of the CMA (or a similar more permeable zones) include providing advanced dewatering opportunities, enhanced and earlier depressurisation of the saprolite, pumping less “dirty” water from the pit, and an additional “clean” water supply option. The

31
hydrogeological characteristics of the CMA would need further assessment to confirm its hydraulic parameters, if it is to be adpted as a dewatering bore target;
▪ Annual pit dewatering volumes were estimated for the individual pits for seven representative stages of the pit development. Combined groundwater inflows into all the various pits range up to 55L/s over the life of mine (base case), assuming simultaneous dewatering of all pits. Groundwater inflows into individual pits range from 43L/s (CMA Stage 4), 14L/s (Yaouré North 2), 10L/s (Yaouré North 1) to less than 5L/s for all the other remaining pits combined. It should be noted that the final mining sequence and final pit designs may vary from those modelled as part of this assessment, however, overall pit inflows are not expected to differ substantially from those predicted;
▪ A pit dewatering strategy and system design was produced based on the final pit development, with pump specifications provided based on the removal of the 100 year return period 24 hour rainfall event (plus groundwater inflows during this period) within both 3 to 5 days and 7 days of occurrence of the event.
The key potential project risks associated with water management include:
▪ Pit dewatering impacting water levels in nearby village wells such that they become less reliable or dry out completely;
▪ Local groundwater and surface water contamination as a result of either seepage or overflow from the TSF;
▪ Inadequate site water management could lead to forced discharge of water to the natural environment (potentially leading to downstream impacts on water quality and flooding) and the potential flooding of the mine site and pits;
▪ Inundation of the pits during and after large storm events or associated with interception of highly transmissivity zones such as structures or the transition zone;
▪ Pit wall instability as a result of elevated pore water pressures in the pit walls;
▪ Inadequate surface water management at the north eastern corner of the proposed waste dump could compromise the integrity of the waste dump in this area and lead to the off-site discharge of poor quality water.
Adoption of appropriate management measures (and mitigation, if required) means that all these are low risk, with the exception of TSF seepage/overflow and inadequate site water management which remain as high and medium risks respectively, due to the fact that both of these items have potentially major consequences.
6.13 Recommendations & Additional Scope of Work
Recommendations for subsequent stages of project development include:
▪ The surface water management plan should be updated in accordance with any:
− newly available rainfall data;
− updated site infrastructure layout plans, or
− updated mine plans.
▪ The surface water management plan needs further considered in two key areas (northeast of CMA pit and the northeastern extent of the waste dump) in order to optimise surface water management and minimise design requirements in-line with the infrastructure development schedule;
▪ The surface water and groundwater monitoring programme should continue in-line with the recommendations proposed in Section 6.10;
▪ Additional groundwater level or pressure monitoring points should be installed around the periphery of the proposed pits;
▪ Additional hydraulic testing should be completed on the CMA and volcanoclastic/basalt contact zone (in order to confirm hydraulic parameters), should it be decided to include dewatering bores as part of the dewatering strategy;

32
▪ The groundwater modelling should be updated in accordance with any updated mine sequencing or pit designs and the groundwater inflow and drawdown predictions revised;
▪ The dewatering plan should be updated in accordance with any new mine sequencing or pit designs and inflows predictions;
▪ Evaluate the potential impact of water storage in the Yaouré pits, should it be required, on local groundwater levels and groundwater inflows into adjacent pits.
The following actions are recommended in order to provide reliable monitoring of any impacts on groundwater levels and to allow for ongoing validation of the groundwater model predictions:
▪ Water levels should be monitored on a monthly basis (depth to water and RL) in selected bores surrounding the pit, at other key areas of the mine and locations between the mine and the adjacent villages;
▪ Pumping rates should be recorded from all wells and bores in the area;
▪ Dewatering pumping and mine water levels should be recorded on a monthly basis;
▪ Following the first year of dewatering, the groundwater model should be validated against the above monitoring data and re-calibrated if necessary. This may require the inclusion of other features into the model to simulate other influences on groundwater levels including minor seepage from any water storage ponds and/or the TSF;
▪ The validated/calibrated model should be used to confirm predicted longer term dewatering rates and groundwater table drawdowns (particularly at the Angovia village wells).

33
Figure 6-4 Surface Water Monitoring Locations
Figure 6-5 Groundwater Monitoring Locations

34
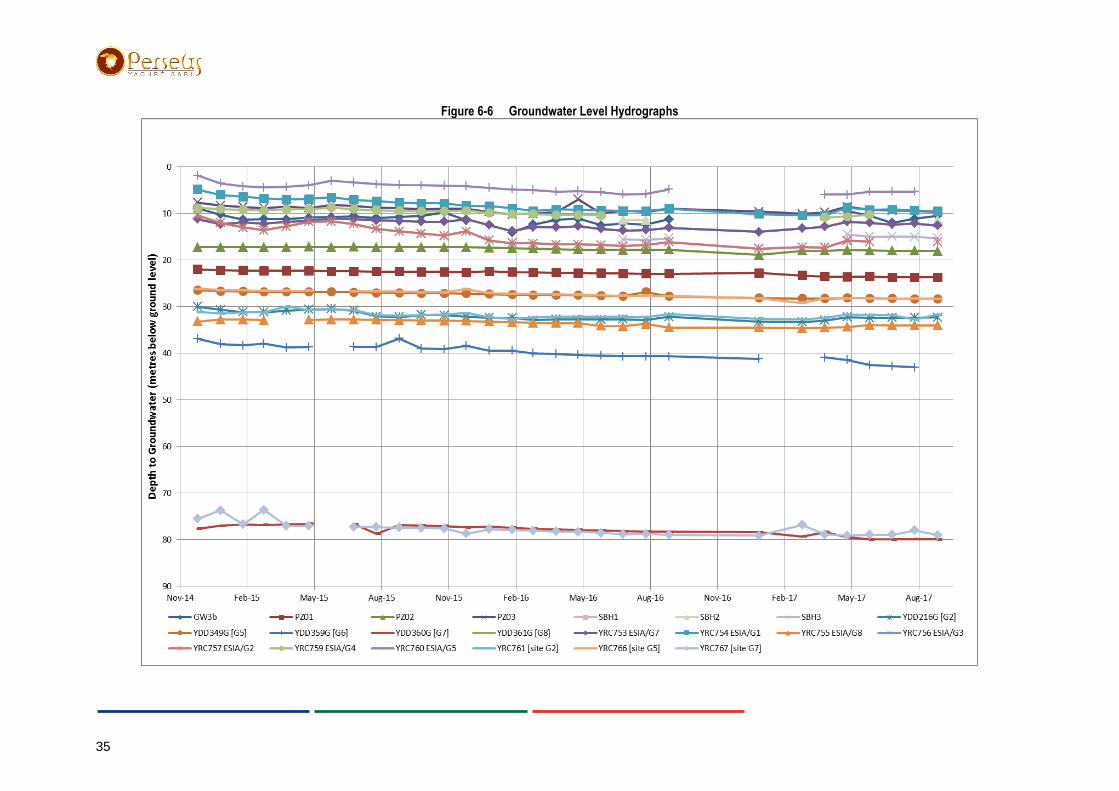
35
Figure 6-6 Groundwater Level Hydrographs
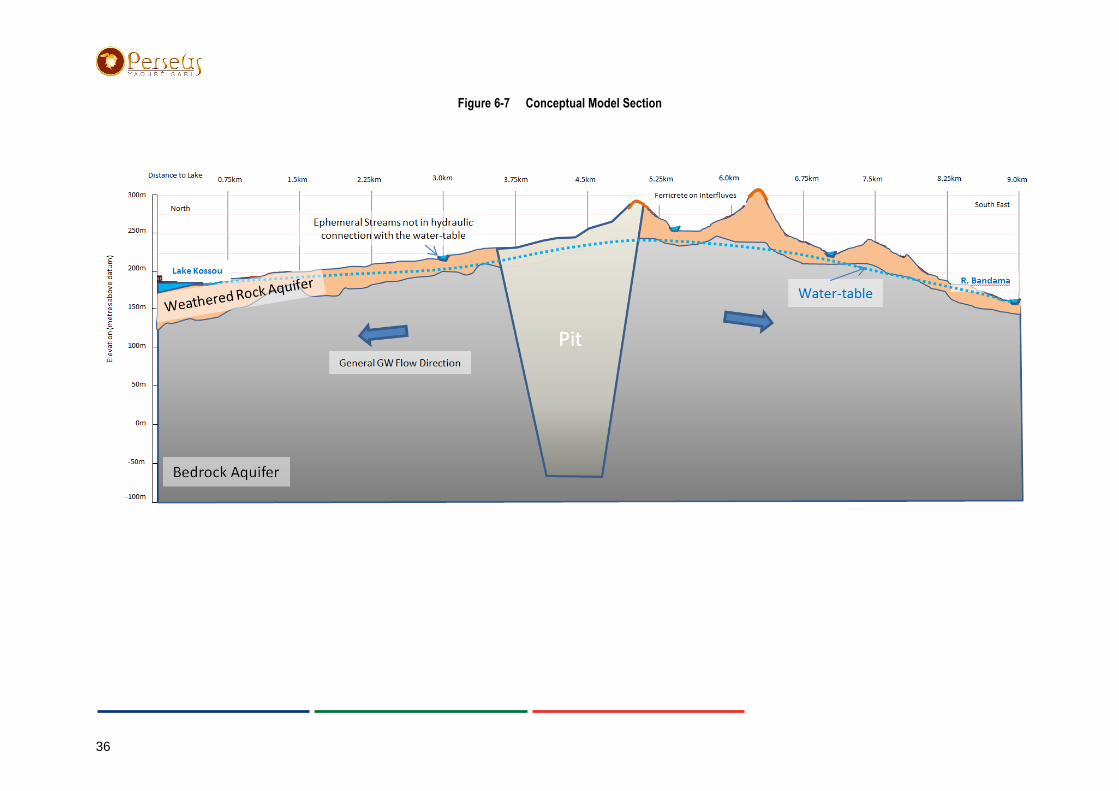
36
Figure 6-7 Conceptual Model Section

37
Figure 6-8 Pit Development - Stress Periods

38
Figure 6-9 Predicted Groundwater Level Drawdown

39
Figure 6-10 Final Pit Water Level Cross Section

40
Figure 6-11 Site Surface Water Management Plan

41
Figure 6-12 Pit Dewatering Plan