personal beliefs and cultural stereotypes about racial...
TRANSCRIPT

Journal of Personality and Social Psychology1996, Vol. 71, No. 3, 536-548
Copyright 1996 by the American Psychological Association, Inc.0022-3514/96/S3.00
Personal Beliefs and Cultural Stereotypes About Racial Characteristics
Joachim KruegerBrown University
Social stereotypes may be expressed as personal beliefs about the characteristics of a group or asbeliefs about the predominant cultural view of a group. In a study with a full intergroup design.Black and White participants rated Black and White racial groups. Results supported 3 sets of pre-dictions derived from a projection model of stereotyping. First, participants' personal beliefs pre-dicted their ratings of cultural stereotypes even when the group averages of personal beliefs andcultural stereotypes were statistically controlled. Second, interrater agreement in stereotype ratingswas substantial for both rating tasks. Third, members of both groups underestimated how favorablytheir own group was rated by members of their respective out-group. Implications of the findings forthe mental organizations of stereotypes, their measurement, and their consequences for social be-havior are discussed.
According to most definitions, social stereotypes are beliefsabout the characteristics of human groups (Ashmore & DelBoca, 1981; Judd & Park, 1993; Tajfel, 1981). Early authorsconsidered stereotypes to be social in the sense that respondentsagreed on the typical characteristics of salient social groups. So-cial learning theories and adjective checklist methods reflectedthe view of social stereotypes as "public attitudes" (Katz &Braly, 1933), "collective representations" (Katz & Schanck,1938), or "shared understandings of social reality" (Tajfel,1981). Changes in the content and the favorability of stereo-types across generations of college students (Karlins, Coffman,& Walters, 1969) highlighted the need for individualized assess-ment and theory (Brigham, 1971). Stereotypes were recast as"an individual's set of beliefs about characteristics or attributesofa group" (Judd & Park, 1993,p. 110). Rather than aggregat-ing responses across participants to display social agreement,researchers turned to graded answer formats and within-sub-jects correlations between various sets of item ratings (e.g., typ-icality ratings and percentage estimates) or between item rat-ings and objective criteria of group characteristics (Judd &Park, 1993).
The idiographic approach presents new opportunities to ex-amine the social dimension of stereotypes. Researchers now dis-tinguish participants' personal beliefs about group characteris-tics from what participants think the social stereotypes aboutthese characteristics are (Ashmore & Del Boca, 1981). Hort,Fagot, and Leinbach (1990) asked participants to rate men andwomen (a) "as they personally see them" and (b) "as societysees them" (p. 202). Esses, Haddock, and Zanna (1994) askedparticipants to (a) list and rate attributes "that they (emphasisadded) would use to describe typical members of each group"
I am indebted to Landon Reid for recruiting the participants andconducting the assessment sessions. Russ Clement, Oliver John, JillKrueger, Neil Macrae, and Rashmi Sinha gave many helpful commentson an earlier version of this article.
Correspondence concerning this article should be addressed to Joa-chim Krueger, Department of Psychology, Box 1853, Brown University,Providence, Rhode Island 02912. Electronic mail may be sent via theInternet to joachim [email protected].
(p. 83), and (b) provide "consensual stereotypes" by listingcharacteristics "that people often attribute to members of thegroups" (p. 87). Devine (1989) used the term cultural stereo-type for the social or consensual dimension of intergroup beliefsand argued that cultural stereotypes are dissociated from per-sonal beliefs, at least among low-prejudice people. To assess per-sonal beliefs, Devine asked White participants "to list all oftheir thoughts in response to the social group Black Americans"(p. 13). To assess cultural stereotypes, she asked a differentgroup of participants "to help researchers to better understandsocial stereotypes and that interest centered on the cultural ste-reotype of Blacks" (p. 7). Similarly, Augoustinos and Ahrens(1994) asked participants to "please write down what you thinkis the cultural stereotype of Australian Aborigines. We are notinterested in what your own personal beliefs may be, but rather,how you think most Australians view them" (p. 127, originalemphasis omitted). In these studies, cultural stereotypes werenot assessed directly, but they were inferred from the averagesof participants' perceptions of what these stereotypes were. In-deed, it may be impossible to assess cultural stereotypes inde-pendent of what people think they are.
What is the relationship between personal intergroup beliefsand cultural stereotypes? Can a person's intergroup beliefs pre-dict his or her view of a cultural stereotype? Do people agreeon cultural stereotypes more than they agree in their personalbeliefs? What is the relation between the two types of ratingsand judgments of stereotype favorability? In the present re-search I examined these questions in a biracial design in whichBlack and White Americans rated both Black and WhiteAmericans. A model of social projection provided the theoreti-cal framework (Krueger & Clement, 1994, 1996; Krueger &Zeiger, 1993). Where appropriate, hypotheses were comparedwith predictions derived from dissociation theory (Devine,1989). Note, however, that in contrast to the general applicabil-ity of the projection model, the intended scope of dissociationtheory is limited to the responses of low-prejudice Whites to theBlack target group.
ProjectionPeople tend to believe that others feel, think, and act as they
themselves do. Supporters ofa certain policy (e.g., to legalize
536
PERSONAL BELIEFS 537
marijuana) tend to believe that support is more common in thepopulation than opponents do (for a review see Marks & Miller,1987). In stereotyping, projection may result in a positive cor-relation between a person's beliefs about the characteristics of asocial group and the person's ratings of the cultural stereotype.Projection has long been considered irrational. In a between-rater design, where consensus estimates covary with the raters'own responses, "not everybody can be right" (Ross, Greene, &House, 1977). The sources of projection were sought in biasedinformation processing or ego-protective motives. Recently,projection has been reinterpreted as a special case of inductivereasoning. It is not necessarily irrational to generalize fromone's own responses to the prevalent responses in the popula-tion(Dawes, 1989, 1990; Hoch, 1987;Krueger&Zeiger, 1993).By definition, a person's attitudes are more likely to be commonthan uncommon. If most people hold Attitude A, the probabil-ity that a randomly selected person P holds Attitude A is greaterthan .5. For people who are uncertain about the actual re-sponses of others, the optimal strategy is to assume that one isin the majority. If P indeed belongs to the majority, a high esti-mate will likely be accurate. If P belongs to the minority thatrejects Attitude A but believes he or she is in the majority, P willassume that most people reject A. In this case, the low estimatefor endorsement of Attitude A will be inaccurate. In the longrun, however, the assumption of being in the majority is theoptimal strategy. It accepts but minimizes error (Dawes, 1990;Einhorn, 1986). Consistent with this view, Krueger and Clem-ent (1994) found a small positive correlation between projec-tion and accuracy across participants (r = . 17).'
Because projection is a form of induction, social perceiversshould base their estimates about prevalent cultural stereotypeson their personal beliefs. If one assumes that one's beliefs aremore likely to be common than rare, one's perceptions of cul-tural stereotypes will be correlated with one's personal beliefsabout group characteristics. The question of projective bias isnot simply whether there are positive within-person corre-lations between personal beliefs and ratings of cultural stereo-types but whether these correlations are too high. In otherwords, do people project more than the actual representative-ness of their own beliefs suggests?
When actual consensus data are available, one can test pro-jective bias by correlating a person's item endorsements withthe estimation errors (estimated minus actual consensus)across items. When responding to Minnesota Multiphasic Per-sonality Inventory statements, most participants have shownprojective bias (i.e., "truly false consensus effects" [TFCE],Krueger & Clement, 1994; Krueger & Zeiger, 1993). They havetended to overestimate the percentage of endorsers for itemsthey themselves endorsed and have tended to underestimateconsensus for items they did not endorse. How can projectivebias be tested in racial stereotyping? Because there are no actualpopulation data about cultural stereotypes, a different measureis needed.
The social nature of stereotyping may provide a criterion forthe measurement of projective bias. Both personal beliefs andcultural stereotypes are—to a degree—shared among partici-pants (see section below entitled Agreement). Because partici-pants' ratings are intercorrelated across items, most partici-pants' ratings are correlated with the average personal stereo-types and the average cultural stereotypes. These averages
represent the social (i.e., group) norms of stereotypic beliefs.Projective bias can be construed as any systematic within-sub-ject pattern linking deviations from the social norm of personalbeliefs to deviations from the social norm of cultural stereo-types. Within-subjects correlations controlling the two sets ofgroup averages will capture such patterns. If the partial corre-lations are positive, the unique residuals of participants' per-sonal beliefs predict the unique residuals of their perceptions ofcultural stereotypes.2
In formal induction, sample data are used to infer the char-acteristics of the category from which the sample was drawn(Dawes, 1989). Sample data are not necessarily informativeabout other categories. Social projection reflects this rule in thatpeople project more strongly to in-groups than to out-groups(Allen & Wilder, 1979; Krueger & Zeiger, 1993; Mullen, Dovi-dio, Johnson, & Copper, 1992; Spears & Manstead, 1990). Inracial stereotyping, raters may not feel that their personal beliefsare informative about what members of the out-group perceiveas the cultural stereotype.
Ironically, people know that others project from their (theothers') own responses. They correctly infer, for example, thatsomeone who thinks many favor the legalization of marijuanais more likely to favor legalization him- or herself than someonewho thinks that only a few people favor legalization (Krueger &Zeiger, 1993). In stereotyping, raters may think the personalbeliefs held by out-group members predict the cultural stereo-types held by out-group members.
Agreement
The projection model assumes that the social dimension ofstereotypes is reflected in high degrees of interrater agreementfor both personal beliefs and cultural stereotypes. If agreementwere perfect, however, there could be no projective bias. Thedegree of agreement has indeed been a theoretical and empiricalquestion of long-standing interest. I briefly review two commonassessment tools, and then I propose two alternatives. Devine's(1989) work exemplifies the first method. She computed
1 The correlation between projection and accuracy was computedfrom Krueger and Clement's (1994) data. It was not reported in theirarticle. It was reported, however, that the mean within-subjects correla-tion between estimated and actual consensus (i.e., accuracy) shrankfrom r = .07 to r - .01 when participants' endorsements were statisti-cally controlled. That is, participants would have been less accurate hadthey not projected.
2 A rater's personal beliefs and cultural stereotypes can be regressedon the group averages of the personal beliefs and the group averages ofthe cultural stereotypes. The correlation between the two sets of residu-als is the second-order partial correlation proposed for the present testof projective bias. This measure of bias is conceptually distinct from thedifference score measure of TFCE (Krueger & Zeiger, 1993). TheTFCE correlation, r(own response with estimated - actual consensus),captures whether the rater's estimation error is correlated with his orher own position on the item. In contrast, the partial correlation, /-(ownresponse with estimated group response by average group response byaverage estimate), captures whether the deviations of the rater's re-sponses from the average responses in the group are correlated withthe deviations of the rater's responses from the average estimates in thegroup. When the group averages are highly accurate estimates of theactual consensus, the two measures yield identical results.

538 KRUEGER
within-item and between-groups tests for ratings of personal be-liefs and cultural stereotypes. Devine compared the responsesof White high- and low-prejudice participants and founddifferences in the personal beliefs but not in the cultural stereo-type about Blacks. Unfortunately, this measure is insensitive tointragroup individual differences. If, for example, people do notagree on the stereotype content at all, ratings by both high- andlow-prejudice participants have large variances and identicalmeans. Nonreliable tests of differences in means would yield afalse impression of stereotype agreement.3
Katz and Braly's (1933) checklist exemplifies the secondmethod. On the checklist, participants nominate adjectives theyconsider characteristic of the target group. The higher the per-centage of participants is who nominate an item, the greater theagreement is thought to be. Each participant then selects five ofthe nominated traits for each group, and "the least number oftraits which have to be included to find 50% of the 500 possiblevotes cast by the 100 students in every racial and nationalgroup" indexes stereotype "definiteness" (Katz & Braly, 1933,p. 287). The fewer the traits necessary to meet that criterion,the more definite is the stereotype. Note that categorical re-sponse formats (trait is characteristic or uncharacteristic) donot imply categorical thinking (Brigham, 1971; Jackman &Senter, 1980). Suppose a person rates the trait elegant with re-spect to the French people. Rather than merely asking whetherthe trait applies, the person may ask to what extent it applies, orto what percentage of the French people it applies. That is, theperson may invoke a graded multistep scale. The person thenneeds to convert this scale rating into a categorical response. Todo this, he or she may choose a criterion or threshold abovewhich to check the "yes" response rather than the "no" re-sponse. The probability of giving a "yes" response increasesmonotonically with the rating on the continuous scale(Goldberg, 1963). The crucial limitation of the checklistmethod is that inasmuch as people think dimensionally ratherthan categorically, the percentage measure confounds interrateragreement with stereotype strength (Rothbart & John, 1993).
To assess interrater agreement across items and within items,two alternative measures hold promise. First, consistent withthe psychometric approach of the projection model, measure-ment focuses on correlations across items. The mean interratercorrelation reveals the average similarity of rating profiles. So-cial psychologically speaking, this index expresses the strengthof the social norm of describing a target group (Krueger, inpress). Psychometrically speaking, this index expresses the reli-ability of raters as measurement instruments (Goldberg, 1981).Second, for individual items, the standard deviation of ratingson a graded scale indicates the degree of agreement. The lowerthe standard deviation, the higher is the within-item agreement.This index needs to be interpreted with caution, however, be-cause ceiling and floor effects limit the variance around extrememeans (Paunonen & Jackson, 1985).
Favorability
Differences in the favorability of intergroup beliefs lie at theheart of stereotyping. Anthropological observation (Freud,1959/1921; Sumner, 1906) and laboratory experimentation(Rabbie & Horwitz, 1969; Tajfel, Billig, Bundy, & Flament,1971) have demonstrated the power of in-group favoritism.
People belonging to a group view its members more positivelythan do outsiders. In contemporary race relations, however,overt in-group bias may not be symmetrical. In-group favorit-ism among Blacks has been interpreted as a response to recentnorms of in-group assertion (Donnerstein & Donnerstein,1973; Wilson & Rogers, 1975). Whites too, often rate Blacksmore favorably than they rate Whites. This "reverse discrimi-nation" may result from egalitarian self-concepts coexistingwith the perceived threat of appearing prejudiced (Wilson &Rogers, 1975). To avert this threat, Whites may enhance theirratings of Blacks (Dutton, 1976; Rogers & Prentice-Dunn,1981). Thus, personal beliefs, as held by Blacks and by Whites,may be more positive about Blacks than about Whites, whereascultural stereotypes reveal the older pattern of more favorableviews about Whites (Devine, 1989; Katz & Braly, 1933).
The contribution of the projection model to the study of in-group favoritism is twofold. First, whereas overt in-group favor-itism may vary across target and participant groups, projectivemeasures may reveal a general and robust form of bias. Holmes(1968) speculated that people project characteristics they donot know they possess (i.e., "similarity projection," p. 249).Ichheiser (1947) detailed how it might work. He suggested a"mote-beam" mechanism, a
distortion of social perception [that] consists of perceiving certaincharacteristics in others which we do not perceive in ourselves andthus perceiving those characteristics as if they were peculiar traitson the others.. .we all tend to perceive(and to denounce)in otherscertain characteristics, e.g., blind spots or ideologies or ethnocen-Irism [emphasis added], which, strangely enough, we ignore inourselves. (p. 131)
The mote-beam mechanism suggests that members of bothraces project in-group favoritism to the other race. Blacks andWhites may assume their own group is rated less favorably bythe out-group than is actually the case. This projection may oc-cur on the level of personal beliefs and cultural stereotypes.
Recent research supports Ichheiser's (1947) hypothesis.Members in interacting laboratory groups evaluated the prod-ucts of their own group more favorably than the products ofother groups, and they expected that members of the othergroups in turn preferred their own products (Vivian & Berko-witz, 1992). Most important, participants seemed unaware oftheir own in-group bias because each group expected impartialobservers to consider their products better than their competi-tors' products. The projection of in-group bias to the out-groupoccurred only among participants who were themselves catego-rized as group members. Uncategorized participants expectedmembers of both groups to treat their respective out-groupsfairly (St. Claire & Turner, 1982).
Second, the projection model asserts that social projectionis independent of the social desirability of the judgment items.
3 Devine (1989) did not report which statistic she used to test differ-ences in the proportions of thoughts related to a category (e.g., "poor")listed by 21 high- and 19 low-prejudice participants. Chi-square testsare sensitive to sample size. With a sample of 100 participants, 4 of the15 comparisons would have been significant assuming p = .05. Withouta power analysis, attempts to confirm a hypothesis by nonsignificantcomparisons of group differences are futile at best and misleading atworst.

PERSONAL BELIEFS 539
Within-subjects projection correlations are only slightly re-duced when social desirability ratings are statistically controlled(Krueger & Clement, 1994), and differences in projection toin-groups (high) and out-groups (low) remain unaffected. Thatis, differences in projection to in-groups and out-groups are nota byproduct of in-group favoritism (Krueger & Clement,1996). Thus, projection from personal beliefs to culturalstereotypes can be expected to be independent of socialdesirability.
Hypotheses
Three sets of hypotheses were tested in a study with a fullstereotype design (two groups of participants [ Blacks, Whites],two target groups [Blacks, Whites], and two types of ratings[personal beliefs, cultural stereotypes]).
Three specific predictions followed from the projection hy-pothesis. First, people (over)project from their own personalbeliefs about group characteristics to what they believe to be thecultural stereotype about that group. Within-subjects corre-lations between personal beliefs and cultural stereotype ratingswill be reliable and remain so when the two sets of group aver-ages are partialed out. Second, people project less (or not at all)when estimating how out-group members respond. For partici-pants of both race groups, personal beliefs will not be correlatedwith what they believe the other group's ratings of cultural ste-reotypes are. Third, people expect others to project. Attribu-tions about the out-group's personal beliefs will be correlatedwith attributions about the out-group's cultural stereotypes.
The agreement hypothesis was that there would be consider-able degrees of interrater agreement for both kinds of ratings.According to dissociation theory, there should be higheragreement for cultural stereotypes than for personal beliefs be-cause cultural stereotypes "are part of the social heritage of asociety and no one (emphasis added) can escape learning theprevailing attitudes and stereotypes assigned to the major ethnicgroups" (Devine, 1989, p. 5).
The projected-favoritism hypothesis was that participants inboth groups would underestimate the favorability of the othergroup's personal beliefs and cultural stereotypes about theirown (the participants') group. In line with dissociation theory,I expected that neither group would show direct in-group biasbut that cultural stereotypes about Whites would be more fa-vorable than cultural stereotypes about Blacks.
Black and White participants rated both racial groups oneach of 20 person-descriptive trait adjectives. They rated per-sonal beliefs, cultural stereotypes, and social desirability, andthey predicted the ratings made by the other group. Finally, theycompleted Katz and Braly's (1933) checklist.
Method
Participants
Eighty-five undergraduate students (66% female) participated in ex-change for $5. Of these, 48 were Black and 37 were White. Age rangedfrom 18 to 39, with a median of 20. Academic concentrations wereevenly divided among the natural sciences, social sciences, and the hu-manities. A 21-year old Black male experimenter recruited participantsat various locations on the Brown University campus.
Procedures and Design
Twenty person-descriptive adjectives were taken from studies on ra-cial stereotyping (Devine, 1989; Dovidio, Evans, & Tyler, 1986; Katz &Braly, 1933; Stangor, Sullivan, & Ford, 1991). In alphabetical order,these traits were: aggressive, ambitious, arrogant, athletic, copying, fam-ily-oriented, friendly, hard-working, intelligent, lazy, materialistic, mor-ally loose, musical, practical, prone to violence, self-confident, selfish,tolerant, immolivated, and unreliable. A Black and a White rater agreedthat these traits included positive and negative characteristics, some ste-reotypic of Blacks and some stereotypic of Whites.
The race of the participant (Black or White) was a between-subjectsvariable, and the race of the target group (Black or White) was a within-subjects variable. Each participant completed a two-stage questionnairethat presented the 20 trait adjectives under different instructional sets.The first dependent variable at Stage 1 was the personal stereotype. In-structions read
We would like you to think about a number of attributes, and howthey pertain to Blacks (African-Americans) [Whites (Euro-Americans)]. Rate the extent to which each adjective is actuallydescriptive of Blacks (African-Americans) [actually descriptive ofWhites (Euro-Americans)]. Make your ratings by circling a num-ber on the scale from -4 to +4. A +4 means that the attribute isvery characteristic of the group. A —4 means that the opposite ofthe attribute is very characteristic. A rating of 0 indicates that nei-ther the attribute nor its opposite are characteristic (emphasis inthe original instructions).
The second dependent variable consisted of the ratings of the culturalstereotype. Instructions were similar to the instructions given in previ-ous studies on cultural stereotypes (Augoustinos & Ahrens, 1994; Hortet al., 1990). Specifically, participants were asked to "think about thecultural stereotype of Blacks (African-Americans) [Whites (Euro-Americans ) ]. According to the cultural stereotype of Blacks [ Whites ],how characteristic is each of the following attributes?" Participants wereinformed that their ratings of the cultural stereotypes may or may notconform with their personal beliefs, that all responses were strictlyanonymous, and that there were no objectively correct answers. Withineach race group, the order of the four questionnaires (cultural Blacks,cultural Whites, personal Blacks, personal Whites) was varied ran-domly. After completing the four forms, participants took a short break(about 5 min).
Participants began Stage 2 by predicting the typical responses of theopposite racial group. Instructions for this third dependent variableread that participants would
again rate the cultural stereotypes and the descriptive characteris-tics of your own groups. Now, however, instead of giving yourthoughts and beliefs, you will be asked to estimate the responsesthat were given by members of the opposite group. Specifically, wewould like you to guess the average of the ratings made by membersof the other racial group that participated in this study. For exam-ple, African-Americans would estimate the average of the ratingsabout African-Americans they believe were given by Euro-Ameri-can participants. Euro-Americans, by contrast, would do the op-posite, estimating the average of the ratings about Euro-Americansthey believe were given by African-American participants. In otherwords, when completing this section, do your best to "think" as ifyou were a representative member of the opposite group.
At the top of each page, the original instructions given to the otherracial group were repeated, and participants were reminded to guesshow the average member of that group would respond. The order ofratings about cultural stereotypes and personal beliefs varied across par-ticipants. The fourth dependent variable again addressed personal be-
540 KRUEGER
liefs. A forced-choice format of the kind typically used in adjectivechecklist studies allowed only "yes" (the attribute is characteristic) or"no" (the attribute is not characteristic) responses (e.g., Karlins et al.,1969; Katz & Braly, 1933). The order of ratings of Blacks and Whitesvaried across participants. Finally, participants rated the social desir-ability of each trait on a 9-point scale that ranged from -4 (veryundesirable) to +4 (very desirable).
Results
Preliminary Analyses
The 2 (race of target group) X 2 (race of participant) X 2(type of rating: personal or cultural) design yielded eight sets of20 averages, displayed in Table 1 (the table also contains theaverage social desirability ratings for each trait). These aggre-gated data present first evidence for projection from personal tocultural ratings, agreement between groups of raters, anddifferentiation between groups of targets. A correlation matrixwas computed for the eight sets of average stereotype ratings.Four of these correlations were relevant for projection (personalbeliefs about Blacks [Whites] with cultural stereotypes aboutBlacks [Whites], computed for Black and White participantsseparately). As expected, the mean correlation was positive(mean r = .40, after r-Z-r transformations, McNemar, 1962).Four correlations were relevant for intergroup agreement(personal [cultural] ratings by Blacks with personal [cultural]ratings by Whites separately for both target groups). The meanwas expectedly high (mean r = .88). Four correlations were rel-evant for differentiation between target groups (personal[cultural] ratings about Blacks with personal [cultural] ratingsabout Whites separately for Black and White participants). Asexpected, the two racial target groups were rated as possessingdifferent attributes (mean r = -.27). The data in Table 1 alsoshow that participants differentiated between racial groupsmore on the level of personal beliefs (mean absolute differencebetween average ratings = 1.49 and 0.66 for Black and Whiteparticipants, respectively) than on the level of cultural stereo-types (Ms = 2.39 and 1.90). The direction of the differenceswas consistent with the findings of earlier studies from whichthe items had been selected.
Projection
Most of the following analyses involved within-subjects cor-relations or interrater correlations. Average Z scores were com-pared between conditions or against 0 (chosen p = .01, two-tailed, for all tests).
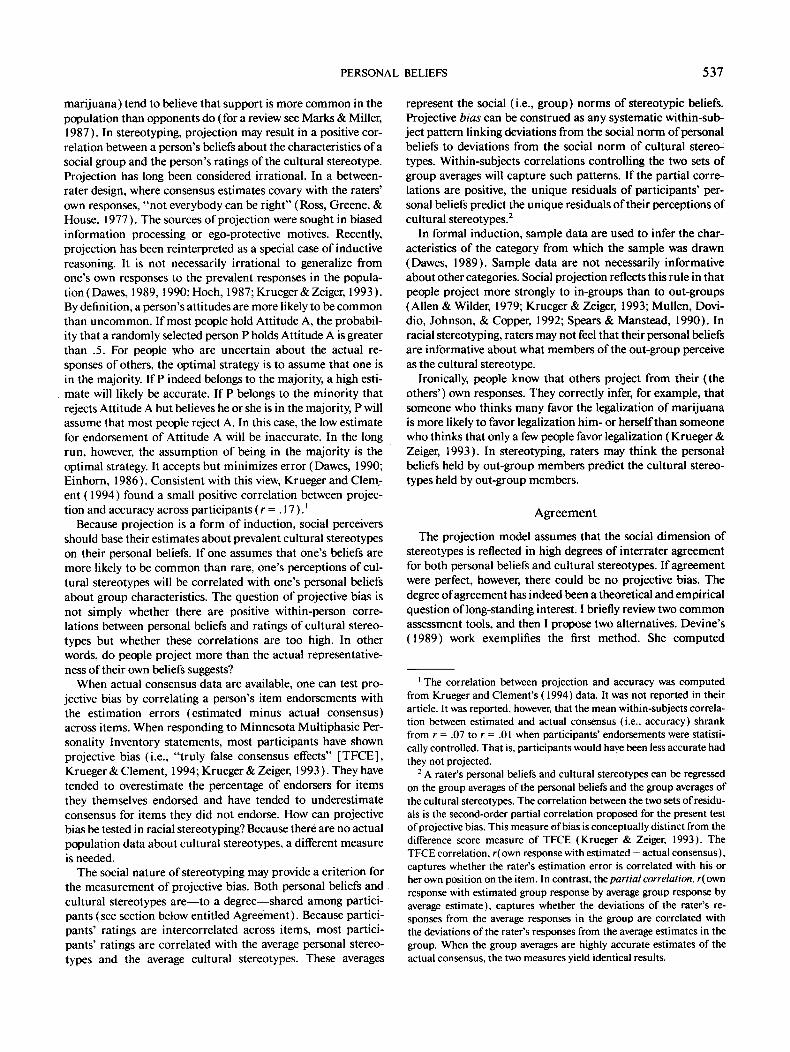
Figure 1 shows the mean correlations between the personalbeliefs, cultural stereotypes, the group averages of the personalbeliefs, and the group averages of the cultural ratings. In all fourconditions, personal beliefs correlated reliably with cultural ste-reotypes, supporting the projection hypothesis. Recall, however,that the zero-order correlations do not necessarily reflect pro-jective bias. To test bias, the within-subjects correlations wererecomputed while statistically controlling for the average rat-ings of personal beliefs and the average ratings of cultural ste-reotypes. As expected, there was projective bias regardless oftarget group or participant group (Black participants: top panelof Figure 1; White participants: bottom panel). When cor-rected for the variance accounted for by the group averages, the
variance in participants' unique personal beliefs predicted thevariance in their unique ratings of the cultural stereotypes.There were no reliable effects revealed by a 2 (race ofparticipant) X 2 (race of target group) mixed-design analysisof variance (ANOVA, all ps > .01), supporting the expectedgenerality of the projection hypothesis. To ensure that tests ofprojection were uncontaminated by differences in favorability,all correlations were computed again with social desirabilityalso partialed out. The results were nearly identical to the datapresented in Figure 1 (grand mean partial r = .29).
Projection from personal beliefs to cultural stereotypes wasconstrued as a form of in-group projection. Inasmuch as peopleperceive themselves as more or less typical members of a society,projection provides a mechanism to infer prevalent cultural at-titudes. If, however, people are to predict the responses of a spe-cific out-group, projection may disappear even when that out-group is part of the same overall society. Recall that Blacks pre-dicted Whites' ratings about Blacks, and Whites predictedBlacks' ratings about Whites. As expected, the correlations be-tween personal beliefs and ratings of cultural stereotypes as at-tributed to the out-group were near zero among Blacks (mean r= —.05). Among Whites, however, these correlations werelarger (mean r = .43), /(83) = 7.2, p < .001. That is, Whites,but not Blacks, seemed to feel that their own personal beliefswere related to how members of the out-group rated culturalstereotypes.
The idea that people are intuitively aware of social projectionled to the prediction that participants of both races would ex-pect members of their out-groups to project their personal be-liefs to cultural stereotypes. For both participant groups, thezero-order correlations between predicted personal beliefs andpredicted cultural stereotypes were highly reliable (Blacks:mean r = .76, Whites: r= .56). Blacks more than Whites (p <.001) seemed to expect their respective out-group to discrimi-nate less between personal beliefs and cultural stereotypes thanthey themselves did (i.e., their own projection correlations weresmaller [mean rfor ratings of the out-group = .42]).
Agreement
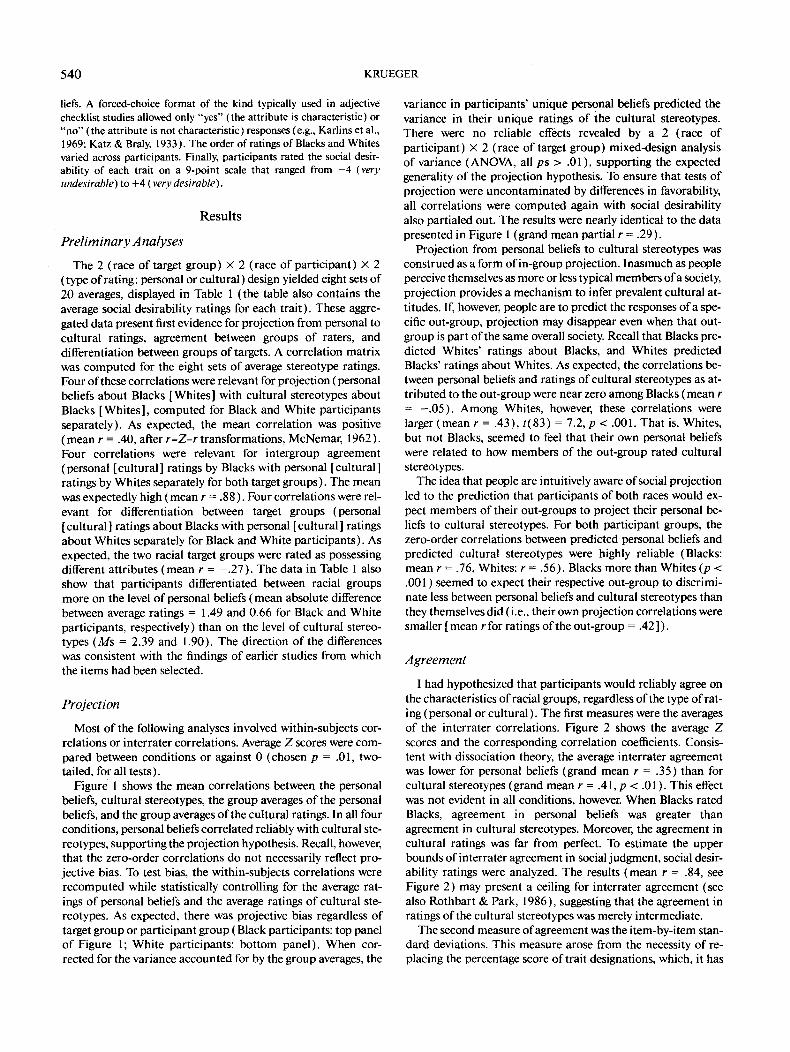
I had hypothesized that participants would reliably agree onthe characteristics of racial groups, regardless of the type of rat-ing (personal or cultural). The first measures were the averagesof the interrater correlations. Figure 2 shows the average Zscores and the corresponding correlation coefficients. Consis-tent with dissociation theory, the average interrater agreementwas lower for personal beliefs (grand mean r = .35) than forcultural stereotypes (grand mean r = .41, p < .01). This effectwas not evident in all conditions, however. When Blacks ratedBlacks, agreement in personal beliefs was greater thanagreement in cultural stereotypes. Moreover, the agreement incultural ratings was far from perfect. To estimate the upperbounds of interrater agreement in social judgment, social desir-ability ratings were analyzed. The results (mean r = .84, seeFigure 2) may present a ceiling for interrater agreement (seealso Rothbart & Park, 1986), suggesting that the agreement inratings of the cultural stereotypes was merely intermediate.
The second measure of agreement was the item-by-item stan-dard deviations. This measure arose from the necessity of re-placing the percentage score of trait designations, which, it has

PERSONAL BELIEFS 541
Table 1Mean Ratings of Cultural and Personal Stereotypes Made by Black and White ParticipantsAbout Black and White Race Groups
Trait
AggressiveAmbitiousArrogantAthleticCopyingFamily-orientedFriendlyHard-workingIntelligentLazyMaterialisticMorally looseMusicalPracticalProne to violenceSelf-confidentSelfishTolerantUnmotivatedUnreliable
AggressiveAmbitiousArrogantAthleticCopyingFamily-orientedFriendlyHard-workingIntelligentLazyMaterialisticMorally looseMusicalPracticalProne to violenceSelf-confidentSelfishTolerantUnmotivatedUnreliable
Personalbeliefs
2.002.170.833.19
-0.752.272.152.773.02
-0.402.65
-0.343.271.441.400.290.421.23
-0.16-0.98
1.331.150.691.95
-0.231.361.151.421.15
-0.360.44
-0.181.510.820.740.870.050.08
-0.62-0.98
Target
Blacks
Culturalstereotypes
Blacks
1.70-0.88
1.233.630.28
-0.04-0.35-0.56-0.21
1.812.711.583.50
-0.272.38
-1.060.67
-0.042.001.67
Whites
2.89-0.92
1.493.260.26
-0.45-0.16-1.34-0.92
1.630.791.630.791.632.760.790.79
-0.391.551.68
Personalbeliefs
2.272.773.08
-0.251.751.290.001.151.810.402.462.04
-0.271.131.302.521.63
-0.96-0.88
0.19
1.131.331.720.770.691.050.581.081.080.492.270.360.560.900.671.321.63
-1.00-0.33-0.26
Whites
Culturalstereotypes
2.043.252.52
-1.540.042.231.582.653.061.810.021.63
-1.292.15
-1.023.191.250.04
-2.50-1.44
0.902.592.08
-0.130.152.231.312.182.26
-0.672.46
-0.23-0.21
1.460.051.951.58
-0.56-1.15-1.26
Socialdesirability
2.123.65
-1.192.853.333.463.88
-1.923.85
-3.33-0.81-2.74
2.542.94
-3.023.52
-1.872.87
-3.54-3.65
1.082.87
-2.452.622.973.333.44
-2.263.36
-3.28-3.28-1.67-2.51
2.59-3.51
2.79-2.36
3.08-3.10-3.26
been argued, confounds stereotype strength with agreement. Asexpected, there were high within-subjects correlations betweenrating options (—4-+4), and the probability of choosing a"yes" response in the categorical answering format was high(mean r = .76). These findings support Goldberg's (1963)threshold model of categorical responding.
Theoretically, standard deviations are independent of aver-ages and of percentage scores, but it is possible that ceiling andfloor effects limit the dispersions of ratings as they approach theends of the scale. Indeed, standard deviations were smaller forlarge mean ratings (r = —.49) and high percentage scores (r =
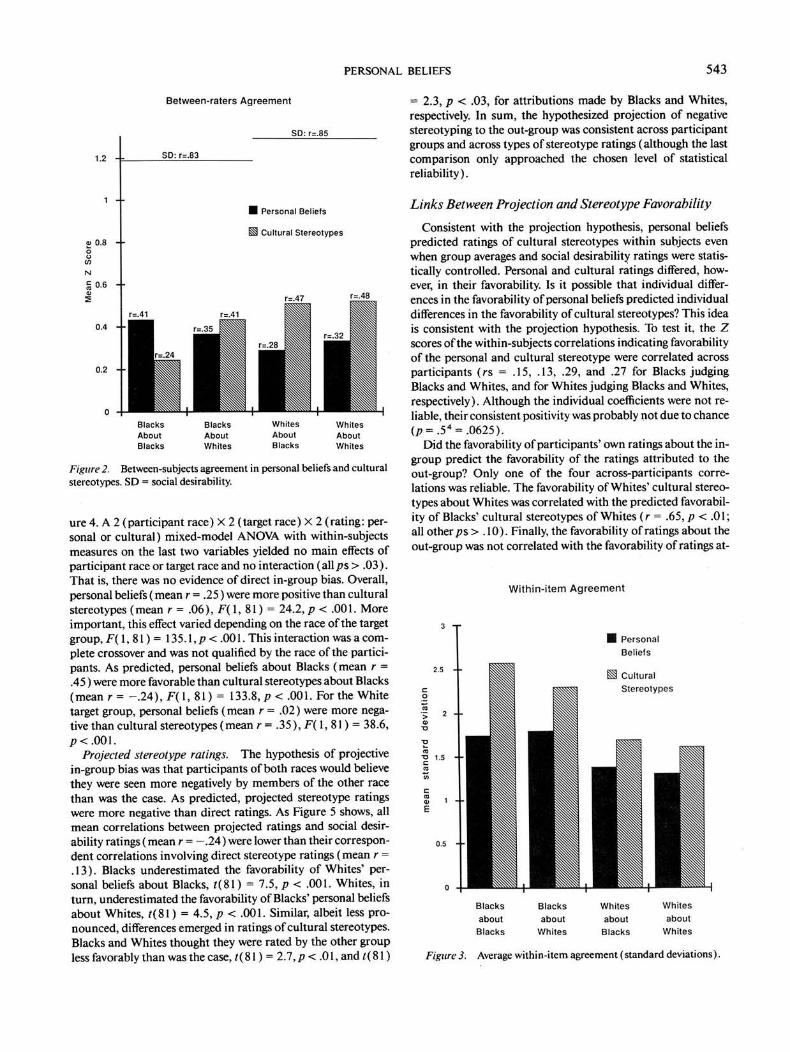
—.33). The results obtained with the standard deviation mea-sure showed some overlap with the mean-level measure. WhenWhites rated the cultural stereotype of Blacks, for example,agreement was highest (i.e., the standard deviation was lowest)for the traits aggressive, arrogant, and friendly. According tothe mean-level analysis, however, they saw the traits aggressive,athletic, and musical as most descriptive. Figure 3 displays themeans of the standard deviations, broken down by conditions.Higher bars indicate larger mean standard deviations, that is,less agreement.
A 2 (race of participant) X 2 (race of target group) X 2

542 KRUEGER
Blacks about Blacks Blacks about Whites
averagepersonalbeliefs
r=.O8 averageculturalstereotype
r=.68 r=.53
personalbeliefs I _,_ 01 1 stereotype
averagepersonalbeliefs
r=.6O
r=.89 averageculturalstereotype
r=.66
partr=.28 partr=.29
Whites about Blacks Whites about Whites
averagepersonalbeliefs
r=.55
averageculturalstereotype
average *personalbeliefs
r=.92
personal 1 f culturalb d i e f e ' r = . 2 9 I stereotype
r=.59
r=.82 averageculturalstereotype
r=.87
partr=.34 part r=.15
Figure 1. Projective bias assessed within subjects: Zero-order and partial correlations between personaland cultural stereotype ratings.
(ratings: personal or cultural) mixed-model ANOVA, in whichthe last two variables were within subjects, was performed withitems, rather than participants, as cases. Agreement was loweramong Black participants (M = 2.10) than among White par-ticipants (M = 1.50), F(l , 19)= 103.6, p<. 001. Contrary todissociation theory, agreement was lower for cultural stereo-types (M = 2.04) than for personal beliefs (M = 1.56), F( 1,19) = 140.9, p < .001. This effect was qualified by an interac-tion with participant race, F( 1, 19) = 20.1, p < .001. Simpleeffects analyses revealed that even among White participants,for whom the effect of type of rating was weaker, it was reliable,F( 1, 19) = 31.8, p < .001. No other effects were reliable.
Ratings of 0 were more frequent in ratings of personal beliefs(23%) than in cultural stereotypes (13%). Goldberg (1981) ar-gued that ratings at the midpoint of the scale are confoundedwith the "I don't know" response if there is no separate responseoption indicating no judgment. In the present data, the greaternumber of 0s in ratings of personal beliefs may therefore haveartifactually reduced the standard deviations. To test differencesin agreement more rigorously, all 0s were treated as missing val-
ues, and analyses were repeated. With the 0 ratings removed,the average standard deviation was not larger (M = 1.88) thanit was when the 0 ratings were included (M = 1.80). The differ-ence in agreement was the same in both analyses (A/[cultural]- M[ personal ] = .48). Thus, the conclusion holds that culturalstereotypes do not enjoy greater agreement across participantsthan do personal beliefs. Whereas in the interrater analysisagreement on social desirability was much higher thanagreement on stereotype ratings, the standard deviation analysisshowed no difference between agreement on personal beliefsand social desirability (M = 1.43).
Favorability
To examine the favorability of direct ratings of personal be-liefs, cultural stereotypes, and predictions of out-group ratings,the three sets of stereotype ratings were correlated with socialdesirability ratings.
Direct stereotype ratings. The results for the direct ratingsof personal beliefs and cultural stereotypes are displayed in Fig-
PERSONAL BELIEFS 543
Between-raters Agreement
1.2 - •-
1 - •
cu 0 . 8 - •
: 0 . 6
0.4 - •
0.2 - •
SD: r=.85
SD: r=.83
I Personal Beliefs
I Cultural Stereotypes
r=.47 r=.48
r=.41
BlacksAboutBlacks
BlacksAboutWhites
WhitesAboutBlacks
WhitesAboutWhites
Figure 2. Between-subjects agreement in personal beliefs and culturalstereotypes. SD = social desirability.
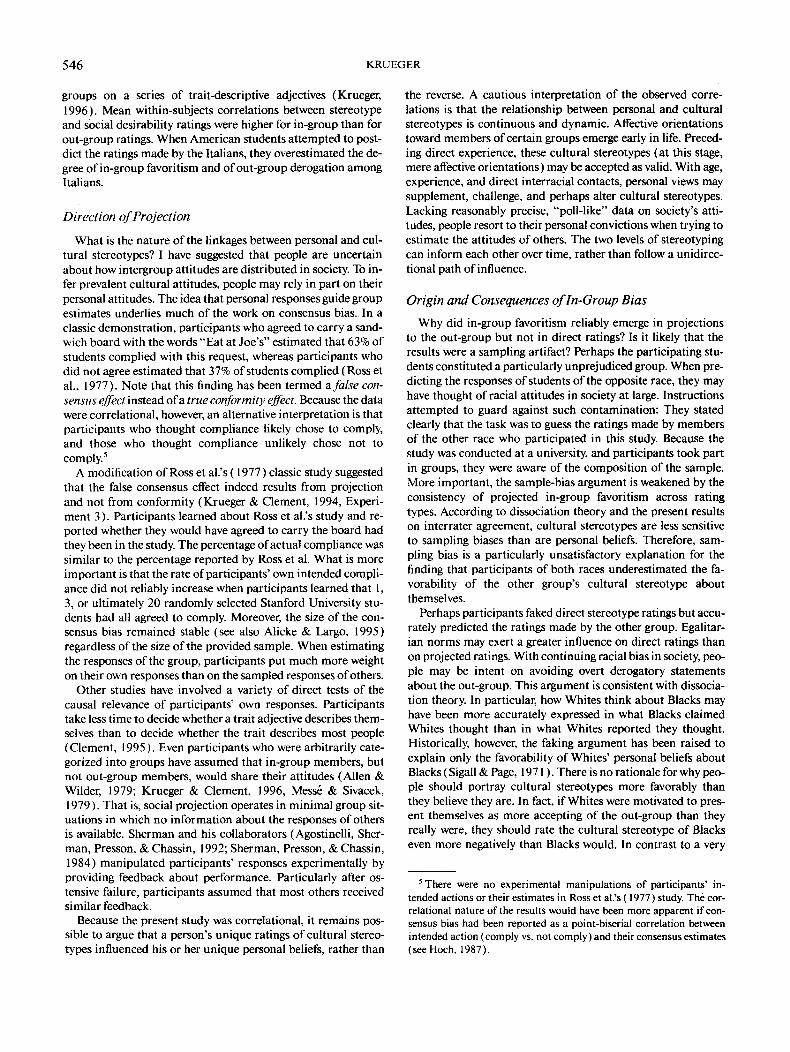
ure 4. A 2 (participant race) X 2 (target race) X 2 (rating: per-sonal or cultural) mixed-model ANOVA with within-subjectsmeasures on the last two variables yielded no main effects ofparticipant race or target race and no interaction (all ps > .03).That is, there was no evidence of direct in-group bias. Overall,personal beliefs (mean r = .25) were more positive than culturalstereotypes (mean r = .06), F( 1, 81) = 24.2, p < .001. Moreimportant, this effect varied depending on the race of the targetgroup, F( 1, 81) = 135.1,/? < .001. This interaction was a com-plete crossover and was not qualified by the race of the partici-pants. As predicted, personal beliefs about Blacks (mean r =.45) were more favorable than cultural stereotypes about Blacks(mean/-= -.24), F(l, 81) = 133.8, p < .001. For the Whitetarget group, personal beliefs (mean r = .02) were more nega-tive than cultural stereotypes (mean r = .35), F{ 1, 81) = 38.6,p<.001.
Projected stereotype ratings. The hypothesis of projectivein-group bias was that participants of both races would believethey were seen more negatively by members of the other racethan was the case. As predicted, projected stereotype ratingswere more negative than direct ratings. As Figure 5 shows, allmean correlations between projected ratings and social desir-ability ratings (mean r = -.24) were lower than their correspon-dent correlations involving direct stereotype ratings (mean r =.13). Blacks underestimated the favorability of Whites' per-sonal beliefs about Blacks, f(81) = 7.5, p < .001. Whites, inturn, underestimated the favorability of Blacks' personal beliefsabout Whites, ?(81) = 4.5, p < .001. Similar, albeit less pro-nounced, differences emerged in ratings of cultural stereotypes.Blacks and Whites thought they were rated by the other groupless favorably than was the case, t( 81) = 2.7, p < .01, and t( 81)
= 2.3, p < .03, for attributions made by Blacks and Whites,respectively. In sum, the hypothesized projection of negativestereotyping to the out-group was consistent across participantgroups and across types of stereotype ratings (although the lastcomparison only approached the chosen level of statisticalreliability).
Links Between Projection and Stereotype Favorability
Consistent with the projection hypothesis, personal beliefspredicted ratings of cultural stereotypes within subjects evenwhen group averages and social desirability ratings were statis-tically controlled. Personal and cultural ratings differed, how-ever, in their favorability. Is it possible that individual differ-ences in the favorability of personal beliefs predicted individualdifferences in the favorability of cultural stereotypes? This ideais consistent with the projection hypothesis. To test it, the Zscores of the within-subjects correlations indicating favorabilityof the personal and cultural stereotype were correlated acrossparticipants (rs = .15, .13, .29, and .27 for Blacks judgingBlacks and Whites, and for Whites judging Blacks and Whites,respectively). Although the individual coefficients were not re-liable, their consistent positivity was probably not due to chance(p = .54 = .O625).
Did the favorability of participants' own ratings about the in-group predict the favorability of the ratings attributed to theout-group? Only one of the four across-participants corre-lations was reliable. The favorability of Whites' cultural stereo-types about Whites was correlated with the predicted favorabil-ity of Blacks' cultural stereotypes of Whites (r = .65, p < .01;all other ps > . 10). Finally, the favorability of ratings about theout-group was not correlated with the favorability of ratings at-
Within-item Agreement
PersonalBeliefs
CulturalStereotypes
BlacksaboutBlacks
Blacksabout
Whites
WhitesaboutBlacks
Whitesabout
Whites
Figure 3. Average within-item agreement (standard deviations).

544 KRUEGER
Black Raters
0.6 •
0.4 •
a, 0.2 •ou(AN 0 •ca>
S -0.2
-0.4 • •
-0.6 •
Personal
Cultural
Blacks WhitesTarget Race
White Raters
0.6 T
0.4 •
a 0.2 •oo(AN 0 +CCO0)
S - 0 . 2 • •
-0.4 • •
-0.6 •*• Blacks WhitesTarget Race
Figure 4. Direct stereotype favorability as expressed by average within-subjects correlations between rat-ings of groups and ratings of social desirability (left panel: Black participants; right panel: Whiteparticipants).
Z S
core
Mea
n
0.6 -I
0.4 •
0.2 -
0 •
-0.2 •
-0.4 •
-0.6 •
Personal Beliefs
Attributed
L Blacks WhitesTarget Race
0.6 -I
0.4 •
£ 0.2 •
ou(AN 0 •c(0
5 -0.2 •
-0.4 •
-0.6 •
Cultural Stereotypes
/
Direct / // /
i i/ *
/ §
U i Attributedr
§
f1
M
ABlacks Whites
Target Race
Figure 5. Stereotype favorability as attributed to out-group members (left panel: personal beliefs; rightpanel: cultural stereotypes).

PERSONAL BELIEFS 545
Table 2Hypothetical Data and Intercorrelationsfor Three Variables
Item
1234
Social desirabilityPersonal beliefsCultural stereotypes
Socialdesirability
Personalbeliefs
Hypothetical data
4 22 4
-2 - 4- 4 -2
Intercorrelations
— .8
Culturalstereotypes
- 44
-22
-.3.3
tributed to the out-group (allps > .10). That is, on the level ofindividual differences, it was not the case that the participantswith the most negative out-group stereotypes also had the mostnegative expectations regarding out-group attitudes.
Discussion
The present study used a full design required for stereotypeassessment (Judd & Park, 1993). Members of two racial groupsmade a series of judgments about both groups. The findingssupported the projection model of stereotyping. Personal beliefspredicted ratings of cultural stereotypes and, more important,these within-subjects correlations could not be reduced to sim-ilarities between personal beliefs and cultural stereotypes exist-ing on the group level. In other words, participants showed pro-jective bias by overestimating the degree to which their personalintergroup beliefs were shared by others. Also consistent withthe model, social projection could not be explained by socialdesirability effects.
As expected, the average favorability of personal beliefs andcultural stereotypes varied drastically with the target group.Seventy-two percent of the White participants reported favor-able personal beliefs about Blacks, and 84% rated the culturalstereotype of Blacks negatively. Still, projective bias was evidentin 92% of Whites. The positive correlation between personalbeliefs and cultural stereotypes is counterintuitive when one ofthe variables is positively correlated and the other is negativelycorrelated with a third variable (i.e., social desirability). Thehypothetical data in Table 2 illustrate that this pattern is statis-tically unproblematic. In this example, one of the two favorableattributes is rated less characteristic, whereas the two unfavor-able attributes are rated more characteristic in the cultural thanin the personal condition. Ratings of one attribute are identical.This pattern is a simplified representation of Whites' ratingsabout Blacks. Personal intergroup beliefs predicted cultural ste-reotypes, and there was an additive negative component. Sim-ilarly, projection held for ratings about Whites, but the addi-tional evaluative component was positive. This analysis suggeststhat the projection model captures the correlational linkagesbetween the favorability of personal beliefs and cultural stereo-types, whereas dissociation theory captures the mean-leveldifferences between the two.4
The prediction that participants would not project their per-
sonal beliefs to cultural stereotypes held by the out-group wassupported for Black participants but not for White participants.The salience of social categorization was a likely moderatingfactor. Minority members tend to be more acutely aware of in-tergroup distinctions and their own position in the social fabric(Brewer, 1993). In laboratory groups, where the salience of so-cial categorization was manipulated experimentally, projectionto the out-group decreased with increases in salience (Krueger& Clement, 1996). In this study, social categorization may havebeen salient only for Blacks, the minority. Although Blacks pro-jected their personal beliefs to society at large (i.e., culturalstereotypes), they did not use these beliefs to predict how theWhite out-group would rate the cultural stereotypes. The pre-diction that participants are aware of projection among out-group members was supported for both race groups. Blacks andWhites felt that the personal beliefs held by out-group membersare closely related to ratings of the cultural stereotype made by •that out-group.
Consistent with the agreement hypothesis, there were consid-erable levels of interrater agreement for both personal beliefsand cultural stereotypes. Stereotypes are not entirely idiosyn-cratic. They are social in the sense that people—to a degree—share them (Katz & Schanck, 1938). The two indexes ofagreement yielded opposite results as to which type of ratingwas more socially shared. According to the interrater corre-lations, agreement on cultural stereotypes was greater thanagreement on personal beliefs. Although this finding is consis-tent with dissociation theory, it should be borne in mind thatagreement on cultural stereotypes was markedly smaller thanagreement on the social desirability of traits. According to thestandard deviations of the ratings, agreement on personal beliefswas greater than agreement on cultural stereotypes. This find-ing is inconsistent with dissociation theory.
Consistent with the projected-favoritism hypothesis, a mote-beam phenomenon appeared in stereotype ratings attributed tothe out-group. Whereas in-group favoritism did not emerge forall types of direct ratings, participants of both races underesti-mated how favorably their own race was rated by members ofthe other race. Support for the projected-bias hypothesis wasremarkably consistent across groups of participants and typesof ratings. It is particularly noteworthy that participants of bothraces underestimated the favorability of the cultural stereotypesheld by members of the other race. If cultural stereotypes weretruly collective representations, as suggested by dissociationtheory, in-group members would have accurately postdictedhow favorably or unfavorably they were rated by the out-group.
The mote-beam mechanism of projected in-group bias hasbeen replicated in the area of national stereotypes. Italian andAmerican students showed in-group bias when rating the two
4 Dissociation theory makes no attempt to address the predictabilityof individual differences within a group of participants. The purpose ofthe theory is to explain the overall mean-level difference between posi-tive personal beliefs and negative cultural stereotypes as shown in theratings that low-prejudice Whites make about Blacks. To use a termby Dawes and Smith (1985), dissociation theory is concerned with a"structural inconsistency" between personal beliefs and cultural stereo-types. The projection model suggests, and this study has shown, thatwithin a group of participants there are correlational consistencies thatexplain individual differences.
546 KRUEGER
groups on a series of trait-descriptive adjectives (Krueger,1996). Mean within-subjects correlations between stereotypeand social desirability ratings were higher for in-group than forout-group ratings. When American students attempted to post-diet the ratings made by the Italians, they overestimated the de-gree of in-group favoritism and of out-group derogation amongItalians.
Direction of Projection
What is the nature of the linkages between personal and cul-tural stereotypes? I have suggested that people are uncertainabout how intergroup attitudes are distributed in society. To in-fer prevalent cultural attitudes, people may rely in part on theirpersonal attitudes. The idea that personal responses guide groupestimates underlies much of the work on consensus bias. In aclassic demonstration, participants who agreed to carry a sand-wich board with the words "Eat at Joe's" estimated that 63% ofstudents complied with this request, whereas participants whodid not agree estimated that 37% of students complied (Ross etal., 1977). Note that this finding has been termed a false con-sensus effect instead of a true conformity effect. Because the datawere correlational, however, an alternative interpretation is thatparticipants who thought compliance likely chose to comply,and those who thought compliance unlikely chose not tocomply.5
A modification of Ross et al.'s (1977) classic study suggestedthat the false consensus effect indeed results from projectionand not from conformity (Krueger & Clement, 1994, Experi-ment 3). Participants learned about Ross et al.'s study and re-ported whether they would have agreed to carry the board hadthey been in the study. The percentage of actual compliance wassimilar to the percentage reported by Ross et al. What is moreimportant is that the rate of participants' own intended compli-ance did not reliably increase when participants learned that 1,3, or ultimately 20 randomly selected Stanford University stu-dents had all agreed to comply. Moreover, the size of the con-sensus bias remained stable (see also Alicke & Largo, 1995)regardless of the size of the provided sample. When estimatingthe responses of the group, participants put much more weighton their own responses than on the sampled responses of others.
Other studies have involved a variety of direct tests of thecausal relevance of participants' own responses. Participantstake less time to decide whether a trait adjective describes them-selves than to decide whether the trait describes most people(Clement, 1995). Even participants who were arbitrarily cate-gorized into groups have assumed that in-group members, butnot out-group members, would share their attitudes (Allen &Wilder, 1979; Krueger & Clement, 1996, Messe & Sivacek,1979). That is, social projection operates in minimal group sit-uations in which no information about the responses of othersis available. Sherman and his collaborators (Agostinelli, Sher-man, Presson, & Chassin, 1992; Sherman, Presson, & Chassin,1984) manipulated participants' responses experimentally byproviding feedback about performance. Particularly after os-tensive failure, participants assumed that most others receivedsimilar feedback.
Because the present study was correlational, it remains pos-sible to argue that a person's unique ratings of cultural stereo-types influenced his or her unique personal beliefs, rather than
the reverse. A cautious interpretation of the observed corre-lations is that the relationship between personal and culturalstereotypes is continuous and dynamic. Affective orientationstoward members of certain groups emerge early in life. Preced-ing direct experience, these cultural stereotypes (at this stage,mere affective orientations) may be accepted as valid. With age,experience, and direct interracial contacts, personal views maysupplement, challenge, and perhaps alter cultural stereotypes.Lacking reasonably precise, "poll-like" data on society's atti-tudes, people resort to their personal convictions when trying toestimate the attitudes of others. The two levels of stereotypingcan inform each other over time, rather than follow a unidirec-tional path of influence.
Origin and Consequences ofln-Group Bias
Why did in-group favoritism reliably emerge in projectionsto the out-group but not in direct ratings? Is it likely that theresults were a sampling artifact? Perhaps the participating stu-dents constituted a particularly unprejudiced group. When pre-dicting the responses of students of the opposite race, they mayhave thought of racial attitudes in society at large. Instructionsattempted to guard against such contamination: They statedclearly that the task was to guess the ratings made by membersof the other race who participated in this study. Because thestudy was conducted at a university, and participants took partin groups, they were aware of the composition of the sample.More important, the sample-bias argument is weakened by theconsistency of projected in-group favoritism across ratingtypes. According to dissociation theory and the present resultson interrater agreement, cultural stereotypes are less sensitiveto sampling biases than are personal beliefs. Therefore, sam-pling bias is a particularly unsatisfactory explanation for thefinding that participants of both races underestimated the fa-vorability of the other group's cultural stereotype aboutthemselves.
Perhaps participants faked direct stereotype ratings but accu-rately predicted the ratings made by the other group. Egalitar-ian norms may exert a greater influence on direct ratings thanon projected ratings. With continuing racial bias in society, peo-ple may be intent on avoiding overt derogatory statementsabout the out-group. This argument is consistent with dissocia-tion theory. In particular, how Whites think about Blacks mayhave been more accurately expressed in what Blacks claimedWhites thought than in what Whites reported they thought.Historically, however, the faking argument has been raised toexplain only the favorability of Whites' personal beliefs aboutBlacks (Sigall & Page, 1971). There is no rationale for why peo-ple should portray cultural stereotypes more favorably thanthey believe they are. In fact, if Whites were motivated to pres-ent themselves as more accepting of the out-group than theyreally were, they should rate the cultural stereotype of Blackseven more negatively than Blacks would. In contrast to a very
5 There were no experimental manipulations of participants' in-tended actions or their estimates in Ross et al.'s (1977) study. The cor-relational nature of the results would have been more apparent if con-sensus bias had been reported as a point-biserial correlation betweenintended action (comply vs. not comply) and their consensus estimates(seeHoch, 1987).

PERSONAL BELIEFS 547
negative cultural stereotype, one's personal beliefs would lookmore positive. Hence, exaggerated expectations of in-group biasamong out-groups appears to be a real projective phenomenonrather than an artifact. Its consequences are more likely to benegative than positive, ranging from distrust to self-fulfillingprophecies and conflict escalation.
Conclusions
Writing in Public Opinion, journalist Walter Lippmann(1922) gave social psychology the term stereotype. Using theplatonic idea that no one can perceive reality directly, he sug-gested that people construct "pseudo-environments." Just asancient troglodytes gazed at the dancing shadows projected tothe wall of the Socratic cave, contemporaries respond to stereo-typic "pictures in their heads" rather than directly to social re-ality. According to the present analysis, some of these picturesare unrealistically negative projections. These projections pres-ent a problem for intergroup relations because "differentgroups construct different pseudo-environments" (Rothbart &Lewis, 1993). Or, in Lippmann's words:
[We] . . . have to account for such facts as two nations attackingone another, each convinced that it is acting in self-defense; or twoclasses at war, each certain that it speaks for the common interest.They live, we are likely to say, in different worlds. More accurately,they live in the same world, but they think and feel in different ones,(p. 20)
There is substantial experimental evidence for the idea thatpeople (a) accentuate real intergroup differences and (b) inter-pret these differences in ways that derogate the out-group (seeKrueger, 1992, for a review). During the Vietnam war, Dawes,Singer, and Lemons (1972) found that self-professed "Hawks"and "Doves" expected their respective out-groups to endorseattitude statements that were more extreme than the ones thatHawks and Doves were actually willing to endorse. Robinson,Keltner, Ward, and Ross (1995) found that partisan groupmembers (liberals and conservatives) not only construedcontentious issues (e.g., abortion, racial violence) differentlybut also overestimated the degree of these differences when in-ferring the attitudes of others. When groups are in conflict, theleaders of the out-group seem particularly power hungry(Winter, 1987) and the media hostile to the in-group (Vallone,Ross, & Lepper, 1985). Sadly, people expect coercion (e.g., tothreaten punitive strikes) to be more effective in influencing thebehavior of the out-group, whereas they consider conciliation(e.g., appeasement) the appropriate strategy to induce cooper-ation by the in-group (Rothbart & Hallmark, 1988). Suchasymmetrical assumptions about "our" and "their" motiva-tional systems facilitate the escalation of conflicts and hindertheir reduction. Assuming that "they" hold more extreme viewsthan they actually do or say they do, or assuming that "they"need to be treated more harshly than they think they should betreated, may create the same conflict that the intergroup behav-ior was meant to prevent. The attitude that "we like them, butwe know that they do not like us" implies an attribution of un-fairness to the out-group. This projective attribution facilitatesthe interpretation of ambiguous behavior as hostile and ratio-nalizes harsh responses or even preemptive aggression.
References
Agostinelli, G., Sherman, S. J., Presson, C. C , & Chassin, L. (1992).Self-protection and self-enhancement: Biases in estimates of popula-tion prevalence. Personality and Social Psychology Bulletin, 18, 631-642.
Alicke, M. D., & Largo, E. (1995). The role of the self in the false con-sensus effect. Journal of Experimental Social Psychology, 31, 28-47.
Allen, V. L., & Wilder, D. A. (1979). Group categorization and attribu-tion of belief similarity. Small Group Behavior, 10, 73-80.
Ashmore, R. D., & Del Boca, F. K. (1981). Conceptual approachesto stereotypes and stereotyping. In D. L. Hamilton (Ed.), Cognitiveprocesses in stereotyping and intergroup behavior (pp. 1-35). Hills-dale, NJ: Erlbaum.
Augoustinos, M., & Ahrens, C. (1994). Stereotypes and prejudice: TheAustralian experience. British Journal of Social Psychology, 33, 125-141.
Brewer, M. B. (1993). Social identity, distinctiveness, and in-group ho-mogeneity. Social Cognition, 11, 150-164.
Brigham, J. C. (1971). Ethnic stereotypes. Psychological Bulletin, 76,15-38.
Clement, R. W. (1995, March). Towards an egocentric explanation ofsocial projection. Paper presented at the 66th Annual Meeting of theEastern Psychological Association, Boston.
Dawes, R. M. (1989). Statistical criteria for a truly false consensuseffect. Journal of Experimental Social Psychology, 25, 1-17.
Dawes, R. M. (1990). The potential nonfalsity of the false consensuseffect. In R. M. Hogarth (Ed.), Insights in decision making: A tributeto HillelJ. Einhorn (pp. 179-199). Chicago: University of ChicagoPress.
Dawes, R. M., Singer, D., & Lemons, F. (1972). An experimental anal-ysis of the contrast effect and its implications for intergroup commu-nication and the indirect assessment of attitude. Journal of Personal-ity and Social Psychology, 21, 281-295.
Dawes, R. M., & Smith, T. L. (1985). Attitude and opinion measure-ment. In G. Lindzey & E. Aronson (Eds.), Handbook of social psy-chology (Vol. 1, pp. 509-566). New York: Random House.
Devine, P. G. (1989). Stereotypes and prejudice: Their automatic andcontrolled components. Journal of Personality and Social Psychol-ogy, 56, 5-18.
Donnerstein, E., & Donnerstein, M. (1973). Variables in interracialaggression: Potential ingroup censure. Journal of Personality and So-cial Psychology, 27, 143-150.
Dovidio, J. F., Evans, N., & Tyler, R. B. (1986). Racial stereotypes: Thecontents of their cognitive representations. Journal of ExperimentalSocial Psychology, 22, 22-37.
Dutton, D. G. (1976). Tokenism, reverse discrimination, and egalitari-anism in interracial behavior. Journal of Social Issues, 32, 93-108.
Einhorn, H. J. (1986). Accepting error to make less error. Journal ofPersonality Assessment, 50. 387-395.
Esses, V. M., Haddock, G., & Zanna, M. P. (1994). The role of moodin the expression of intergroup stereotypes. In M. P. Zanna & J. M.Olson (Eds.), The psychology of prejudice: The Ontario symposium(Vol. 7, pp. 77-101). Hillsdale, NJ: Erlbaum.
Freud, S. (1959). Group psychology and the analysis of the ego. NewYork: Norton. (Original work published 1921)
Goldberg, L. R. (1963). A model of item ambiguity in personality as-sessment. Educational and Psychological Measurement, 23, Aiil-492.
Goldberg, L. R. (1981). Unconfounding situational attributions fromuncertain, neutral, and ambiguous ones: A psychometric analysis ofdescriptions of oneself and various types of others. Journal of Person-ality and Social Psychology, 41, 517-552.
Hoch, S. J. (1987). Perceived consensus and predictive accuracy.Journal of Personality and Social Psychology, 53, 221-234.

548 KRUEGER
Holmes, D. S. (1968). Dimensions of projection. Psychological Bulle-tin, 69, 248-268.
Hort, B. E., Fagot, B. I., & Leinbach, M. D. (1990). Are people's no-tions of maleness more stereotypically framed than their notions offemaleness? Sex Roles, 23, 197-212.
Ichheiser, G. (1947). Projection and the mote-beam-mechanism.Journal of Abnormal and Social Psychology, 42, 131-133.
Jackman, M. R-, & Senter, M. S. (1980). Images of social groups: Cate-gorical or qualified? Public Opinion Quarterly, 44, 341 -361.
Judd, C. M., & Park, B. (1993). Definition and assessment of accuracyin social stereotypes. Psycholagical Review, 100, 109-128.
Karlins, M., Coffman, T. L., & Walters, G. (1969). On the fading ofsocial stereotypes: Studies in three generations of college students.Journal of Personality and Social Psychology, 13, 1-16.
Katz, D., & Braly, K. (1933). Racial stereotypes in one hundred collegestudents. Journal of Abnormal and Social Psychology, 28, 280-290.
Katz, D., & Schanck, R. L. (1938). Social psychology. New York: Wiley.Krueger, J. (1992). On the overestimation of between-group differ-
ences. European Review of Social Psychology, 3, 31-56.Krueger, J. (1996). Accuracy and bias in stereotypes about nations.
Manuscript in preparation.Krueger, J. (in press). Probabilistic national stereotypes. European
Journal of Social Psychology.Krueger, J., & Clement, R. W. (1994). The truly false consensus effect:
An ineradicable and egocentric bias in social perception. Journal ofPersonality and Social Psychology, 67, 596-610.
Krueger, J., & Clement, R. W. (1996). Inferring category characteris-tics from sample characteristics: Inductive reasoning and social pro-jection. Journal of Experimental Psychology: General, 125, 52-68.
Krueger, J., & Zeiger, J. S. (1993). Social categorization and the trulyfalse consensus effect. Journal of Personality and Social Psychology,65, 670-680.
Lippmann, W. (1922). Public opinion. New York: MacMillan.Marks, G., & Miller, N. (1987). Ten years of research on the false con-
sensus effect: An empirical and theoretical review. Psychological Bul-letin. 102, 72-90.
McNemar, Q. (1962). Psychological statistics (3rd ed.). New York:Wiley.
Messe, L. A.. & Sivacek, J. M. (1979). Prediction of others' responses ina mixed-motive game: Self-justification or false consensus? Journal ofPersonality and Social Psychology, 37, 602-607.
Mullen, B., Dovidio, J. F.Johnson, C , & Copper, C. (1992). In-group-out-group differences in social projection. Journal of ExperimentalSocial Psychology, 28, 422-440.
Paunonen, S. V., & Jackson, D. N. (1985). Idiographic measurementstrategies for personality and prediction: Some unredeemed promis-sory notes. Psychological Review, 92, 486-511.
Rabbie, J. M., & Horwitz, M. (1969). Arousal of ingroup-outgroupbias by a chance win or loss. Journal of Personality and Social Psy-chology, 13, 269-277.
Robinson, R. J., Keltner, D., Ward, A., & Ross, L. (1995). Actual versusassumed differences in construal: "Naive realism" in intergroup per-ception and conflict. Journal of Personality and Social Psychology,68, 404-417.
Rogers, R. W, & Prentice-Dunn, S. (1981). Deindividuation and anger-
mediated interracial aggression: Unmasking regressive racism.Journal of Personality and Social Psychology, 41, 63-75.
Ross, L., Greene, D., & House, P. (1977). The "false consensus effect":An egocentric bias in social perception and attribution processes.Journal of Experimental Social Psychology, 13, 279-301.
Rothbart, M., & Hallmark, W. (1988). In-group-out-groupdifferencesin the perceived efficacy of coercion and conciliation in resolving so-cial conflict. Journal of Personality and Social Psychology, 55, 248-257.
Rothbart, M., & John, O. P. (1993). Intergroup relations and stereotypechange: A social-cognitive analysis and some longitudinal findings. InP. M. Sniderman, P. E. Tetlock, & E. G. Carmines (Eds.), Prejudice,politics and the American dilemma (pp. 32-59). Stanford, CA: Stan-ford University Press.
Rothbart, M., & Lewis, S. B. (1993). Cognitive processes and in-tergroup relations: A historical perspective. In P. Devine, D. Hamil-ton, & T. Ostrom (Eds.), Social cognition: Contributions to classicissues in social psychology (pp. 347-382). San Diego, CA: AcademicPress.
Rothbart M., & Park, B. (1986). On the confirmability and discon-firmability of trait concepts. Journal of Personality and Social Psy-chology. 50, 131-142.
St. Claire, L.,& Turner, J.C.( 1982). The role of demand characteristicsin the social categorization paradigm. European Journal of SocialPsychology, 72, 307-314.
Sherman, S. J., Presson, C. C , & Chassin, L. (1984). Mechanisms un-derlying the false consensus effect: The special role of threats to theself. Personality and Social Psychology Bulletin, 10, 127-138.
Sigall, H., & Page, R. (1971). Current stereotypes: A little fading, a littlefaking. Journal of Personality and Social Psychology, 18, 247-255.
Spears, R., & Manstead, S. R. (1990). Consensus estimation in socialcontext. European Review of Social Psychology, 1, 81-109.
Stangor.C, Sullivan, L. A., & Ford, T. E. (1991). Affective and cognitivedeterminants of prejudice. Social Cognition, 9, 359-380.
Sumner, W. G. (1906). Folkways. Boston: Ginn.Tajfel, H. (1981). Human groups and social categorization. Cam-
bridge, England: Cambridge University Press.Tajfel. H., Billig, M., Bundy. R. P., & Flament, C. (1971). Social cate-
gorization and intergroup behaviour. European Journal of Social Psy-chology, 1. 149-177.
Vallone, R. P., Ross, L., & Lepper, M. R. (1985). The hostile mediaphenomenon: Biased perception and perceptions of media bias incoverage of the Beirut massacre. Journal of Personality and SocialPsychology, 49. 577-585.
Vivian, J. E., & Berkowitz, N. H. (1992). Anticipated bias from anoutgroup: An attributional analysis. European Journal of 'Social Psy-chology. 2Z 415-424.
Wilson, L., & Rogers, R. W. (1975). The fire this time: Effects of raceof target, insult, and potential retaliation on Black aggression.Journal of Personality and Social Psychology, 32, 857-864.
Winter, D. G. (1987). Enhancement of an enemy's power motivationas a dynamic of conflict escalation. Journal of Personality and SocialPsychology, 52, 41-46.
Received September 24, 1995Revision received March 21,1996
Accepted March 21, 1996 •