personal data ecosystem: privacy, utility, and …iot traffic fig. 1. an overview of the home iot...
TRANSCRIPT

Personal Data Ecosystem: Privacy, Utility, and Efficiency Challenges
Hamed Haddadi
Oxford Internet Institute
June 2018

The Data EcosystemData about us:
Data generated by us:
Data around us:

Data About Us• We found thousands of trackers across the world who follow our clicks
and trade our data.
• Our digital footprint
• we are not even aware of.
• Provenance is a major issue.
• TMA 2014, PAM 2016, and “Anatomy of the Third-Party Web Tracking Ecosystem” on MIT TR 2014.
• Ad Blocking is not the long-term solution, see: “Ad-Blocking and Counter Blocking: A Slice of the Arms Race”, USENIX 2016.
Switch
33AcrossA3CloudAdExtentadlooxtracking
Advertising.com
AlephD
AppNexus
BlueCava
bnmlaBt
rll
Burstnet
Conversantmedia
CapitalPowerCriteoDa
taJeteng
age:BD
RFast
Click
flx1
Blueshift
HiMediaDs
Iponweb
Krux
SovrnMicrosoft
Mindplottermmtro
myThings
navdmp Ne
ustar
OVH
RubiconProject
Simpli.fi
Sokrati
StickyA
dstv
Tapad
MediaInovat
ion
AOL
Wayfair
Fig. 5: The biggest organisational ID-sharing group in the logged-outmode. Link thickness represents the frequency of collaboration between twoorganisations. A Darker colored organisations are involved in higher numberof cross-organisational ID-sharing.
acquisitions of tracking companies from 2005 for a period of three years. In [9],they examined the access of web trackers to personal information based on thecategory of the first-party website in which they are embedded. They found thatwebsites providing health and travel-related services disclose more informationto trackers than other types of websites. Gill et al. [10] studied the amountof inferred information about users through tracking their visited websites byad networks. Liu et al. [11] have looked at tracking personal data on the webusing ISP travel from 2011, however the big shift away from using clear text inthe web introduces a much more complicated user ID sharing ecosystem in theweb today. They observed that ad networks are able to estimate users’ interestwith 50% accuracy. These studies showed the possible access of trackers to theuser personal information whereas we study the scale and nature of trackingecosystem.
Roesner et al. [12] proposed a framework for classifying the behaviour of webtrackers based on the scope of the browsing profile they produce. They showthe spread of the identified classes amongst the top 500 websites in the world.Zarras et al. [13] studied the ecosystem of ad networks that serve maliciousadvertisement. Interestingly, they observed some ad networks which more thana third of their traffic belongs to malicious advertisement. Gomer et al. [14]focused on the network aspects of third-party trackers which appeared in the

Data Generated by Us
• Online Social media (Tweets, Instagram images, FB posts..)
• Wearable devices
• Signals indicative of physical & mental health (Current Biology, CHI’2018, UbiComp2016 MentalHealth)
health. Knowledge about the user’s current affective andemotional state and identification of critical states such asdepression or stress can build the basis for new interven-tions, targeted therapies and prevention through early de-tection. Technology, and especially ubiquitous mobile andwearable devices, can support these strategies to targetmental health and well-being.
Figure 1: The Apple Watch UI: theDigital Crown wheel is used forscrolling through answer options;the touch display is used forswiping gestures and clicking thesubmit button.
Mobile and Wearable Sensing Advances
Technological advances and miniaturised technology en-abled current trends towards connected, smart, and highlysensor-equipped mobile and wearable devices, like smart-phones and smartwatches. Especially, personal fitnesstrackers and bio-signal sensing smartwatches are pop-ular amongst consumers and this trend is prognosed tocontinue [2]. This growing interest of consumers in theirown health data and trends like the Quantified Self and Per-sonal Informatics movement are drivers for new technologyadvances and products. Platform for personal health datastorage, like Apple’s HealthKit or Google’s Health, not justallow eased data availability for consumers, but also pro-vide new opportunities for health studies in the wild. Thereare already frameworks targeting these areas, like Apple’sResearchKit1 or ResearchStack2 for Android. These frame-work ease the process of developing user-friendly, unifiedand scientific mobile phone apps for large scale user stud-ies.
Opposing to mere mobile devices, wearables offer the ad-vantage of the closeness to the body. Biosignals like heartrate, skin conductance and blood pressure can be usedto predict current emotional states and mood [4, 6]; butmost of these studies have been conducted using expen-sive medical devices for targeted for experimental settings
1http://researchkit.org/2http://researchstack.org/
or especially designed devices, just available to a few. Theutilisation of widely available consumer wearable devices,like the Apple Watch, allow for a broader user base andlarge-scale, in-the-wild data collection and interventions.But problems arise in terms of data reliability and with theseuncertified and untested devices, which makes prior evalua-tion crutial.
The basis for technology-driven preventions and interven-tions are robust algorithms for analysing the gathered sens-ing data. We will present a wearable application, based onthe widely-used Apple Watch smartwatch, which eases thecollection of emotional experience samples and sensingdata, such as heart rate, location, ambient noise, and phys-ical activity. This application builds the basis for data-driveninterventions and therapies.
Related WorkThe computational power and sensor richness of mobilephones allows researchers to leverage these for detect-ing emotional and well-being states of the users. Mobilephone data, such as call/SMS/app usage, location andemotion self-assessments have been utilised in researchto find correlations [3]. While mobile usage, weather andpersonality traits have been found to be a accurate predic-tor of stress [1], other researchers have used the mobilephone usage data to determine states of boredom [5]. TheStudentLife project, for example, used mobile phone dataof students and correlated it with their academic perfor-mance and depression levels [11]. The Affective Diary usedmobile phone usage data, photos and bluetooth to detectnearby people [9]; they used this data to detect the stressedstate of the user and presented the data in a diary formatto support reflection. EmotionSense is an Andorid app forsocial psychology experiments [7]. It collects various mo-bile sensor data, audio for speech recognition and emotion
(a) Activity breakdown (b) Leaderboard view (c) Notifications and interventions
Fig. 2. The QatarSense app interface for feedback and interaction with young children.
the healthcare domain. The current range of implantable orwearable medical devices also face security challenges fromadversaries(see [39] for a detailed discussion). These devicesare often optimized for functionality and efficiency, rather thansecurity, hence their vulnerabilities can subject them to datamanipulation attacks.
C. Ethics and Privacy
The highly sensitive and private nature of health datapose a number of ethical challenges for ubiquitous monitoringusing wearable devices and social media [40], [41]. Sharing ofthese data between different providers, and even the medicalprofessionals, introduces a new level of challenges with theincreased level of cross-inferences possible across disjointdatasets. A number of solutions, such as use of anonymizationtechniques [42] and user-controlled aggregation points suchas the Databox [43] have been proposed in order to addresssome of these challenges by providing privacy-preservingmethods of accessing and analyzing otherwise scattered piecesof information.
V. OPPORTUNITIES
In this paper we have presented some potential scenarios inwhich the aggregation of of disparate sources of information,mainly wearable devices, EHRs, and social media content,can improve and potentially transform the current trendsin personal and public health and wellness. Availability of
such large-scale data form a variety of source, if collectedand dealt with responsibility and carefully, presents a greatopportunities for unprecedented advances in healthcare andwellness research. We have presented some recent of the recentresearch in this space and our ongoing efforts in data fusionform different sources in order to improve our understandingof the individuals’ overall wellbeing.
One can envision new opportunities in personal health andunderstanding correlation and causations between physical andmental health (e.g., using data from an individuals’ EHR,prescribed medication, and post-hoc sentiment analysis oftheir social media content), or public health (understandingrelationship between mental health or moods, and naturalconditions [44] or financial situations). Privacy challengesremain a major obstacle to wide-scale use of personal data forpublic health inference, though advances in large-scale privacy-preserving analysis techniques such as distributed DifferentialPrivacy [45] and secure personal data storage facilities canpotentially mitigate the privacy issues.
One of the main objectives of the Quantified Self and e-health technologies is the provision of effective behaviouralinterventions for promoting better health [46]. Similarly, themore holistic healthcare systems will not solely rely on single-sourced data points such as blood pressure and heart rate. Tothis end, we believe the aggregation of various form of Small(personal) data [47] under the 360� Quantified Self architecturecan provide a wealth of additional benefits when compared to
Sensingkit.org(ACM MobiSys 2017 demos)

Sensing costs energy too!
ACM MobiSys 2017 Demo, IE 2016, ACM SIGCOMM IMC 2013

Data around us• IoT devices
• Cyber Physical Systems
www.connectedseeds.org/about/sensors

IoT Traffic
Fig. 1. An Overview of the Home IoT Testbed
7 Samsung SmartThings Hub with a presence sensor8 Neato Botvac vacuum cleaner9 2x TP-Link smart plugs
10 Philips Hue Bridge11 Apple TV12 Ubiquiti Access Point13 DLink Switch14 TP Link MR6400
These include a variety of general-purpose home hubs ( 3 ,7 ), as well as device-specific hubs ( 10 , 11 ) that are one step
away from the devices they actually control, such as severalHue LED bulbs.
We also have a number of consumer electronics connected( 4 , 5 , 6 ), while our two smart plugs ( 9 ) can accommodateany additional offline devices. Finally, we have IoT devicesthat connect directly to the router ( 1 , 8 , 2 ).
B. Set-up
This section describes how we set up our home IoT testbed.Our measurements and analysis is conducted on network trafficwhile all devices are idle. We connect an L2 switch to a 4Grouter running NAT, DHCP, and DNS forwarding to Google’sDNS. An access point is connected to this switch to which allbut two of the IoT devices are connected. These two have awired connections directly to the from two of our IoT devices.
We capture all traffic by mirroring all ports to one connectedto a Linux box with two NICs. Traffic is captured via one NIC
with TCP/UDP disabled through tcpdump and stored on disk.Traces are then retrieved separately through SSH via a secondNIC connected to the internet. All data must pass through theswitch (both internal and external) and thus all packets aremirrored on the switch port to the Linux box and therefore allpackets are captured.
C. Data and Analysis
We continuously captured packets for 22 days before per-forming our first analysis of this data. We wrote a set ofscripts to perform our analysis, and are making these scriptspublicly available [5]. To analyze network behavior on a per-device basis, we split the combined trace by MAC address. Wealso used DNS and DHCP logs to help find hostnames thatcorrespond to MAC addresses by looking at mappings of IPto MAC address and IP to hostname over time. This is usefulespecially for devices that randomize their MAC addresses,such as the iPad.
For all other statistics, we fed the traces through the BroNetwork Security Monitor [6] and ran custom as well asexisting scripts on Bro logs.
III. OBSERVATIONS
A. Device Setup and Interaction
The devices were set up using the manufacturers apps andset up with Apple HomeKit where possible. If a device couldFig. 2. Bytes transmitted per device split by protocol and service
0 M
200 M
400 M
600 M
800 M
2x T
P Li
nk H
S110
Amaz
on E
cho
Appl
e TV
Broa
dcas
tD
Link
Sw
itch
Foob
otH
ue B
ridge
iPho
ne 5
sJa
mes
' iPad
Mul
ticas
tN
eato
Rob
ot V
acSm
artT
hing
s H
ubU
biqu
iti A
cces
s Po
int
WIN
C−7
0−21
Device
Traf
fic (b
ytes
)
typeexternalinternal
Fig. 3. Internal vs external traffic; internal traffic separated for visibility
Amar et al., , “An Analysis of Home IoT Network Traffic and Behaviour”, Available on ArXiv, March 2018.

An Underlying Structural Problem
The Internet is fragmented, distributed systems are difficult• Centralising simplifies things• With the cloud, we can, so we do!
Ease of cloud computing has led to two suboptimal defaults:1. Move the data … (by copying)2. … to a centralised location

Applications and ChallengesOpportunities
• Infrastructure monitoring
• Understanding individuals’ wellbeing & public health
• Enabling personalised services
Challenges
• Real-time control & adaptation, scalability
• Accountability & liability
• Algorithmic bias, privacy, security,...
Can we do detailed, user-centric, contextual analytics without some of the inefficiencies, privacy disasters, and legal challenges?

Efforts in this space
• NyMote
• OpenPDS
• dowse.eu
• Hub of All Things
• Name your favorite data silo…
• ….. Databox

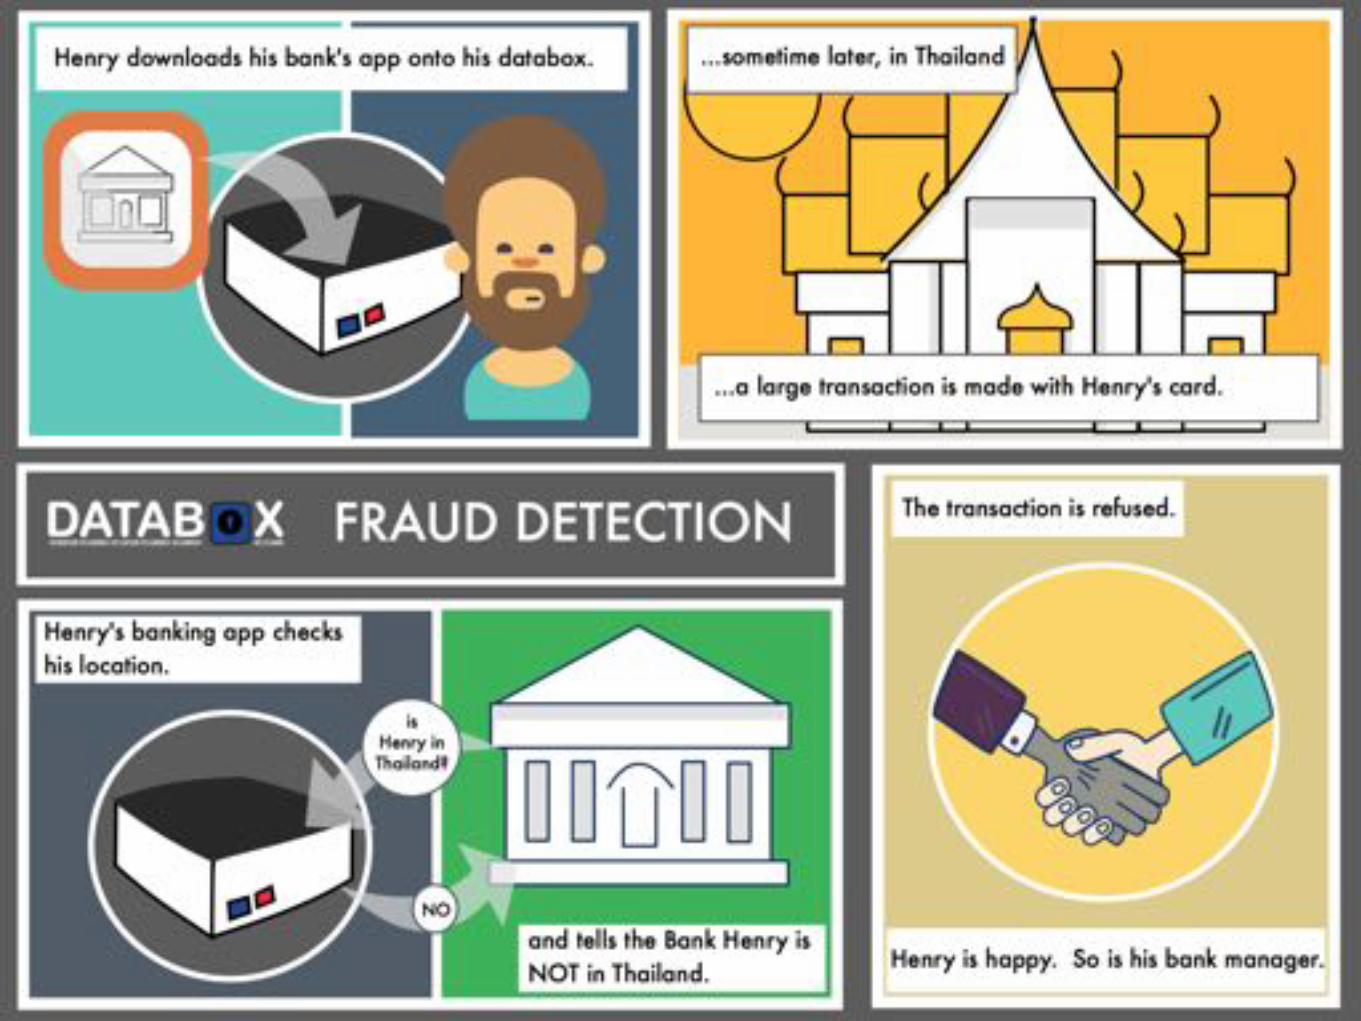
Databox
• Mediates access to data, stored locally as appropriate• Computations (apps) move to data, not data to
compute• Maintain control over internal comms and export• All operations logged for users to inspect, control
11

Databox Platform
EPSRC Databox: Privacy-Aware Infrastructure for Managing Personal Data www.databoxproject.uk

Databox and apps ecosystem
Databox - Home
Databox - Cloud
DriverStore
DriverStore
DriverStore
Hue Light
Netatmo Thermostat
HAPIfork
Home IoT Devices
Driver Store
Driver Store
APP Store
Public Data Hub
ArbiterArbiter
Enterprise Databox
SLA Negotiation
Local APP
Local APP
Inquire Available Data Store
3rd Party APP
APP Search & Installation
Control via managing interface
Internet
Data Exchange
Code available on https://github.com/me-box/
14

15
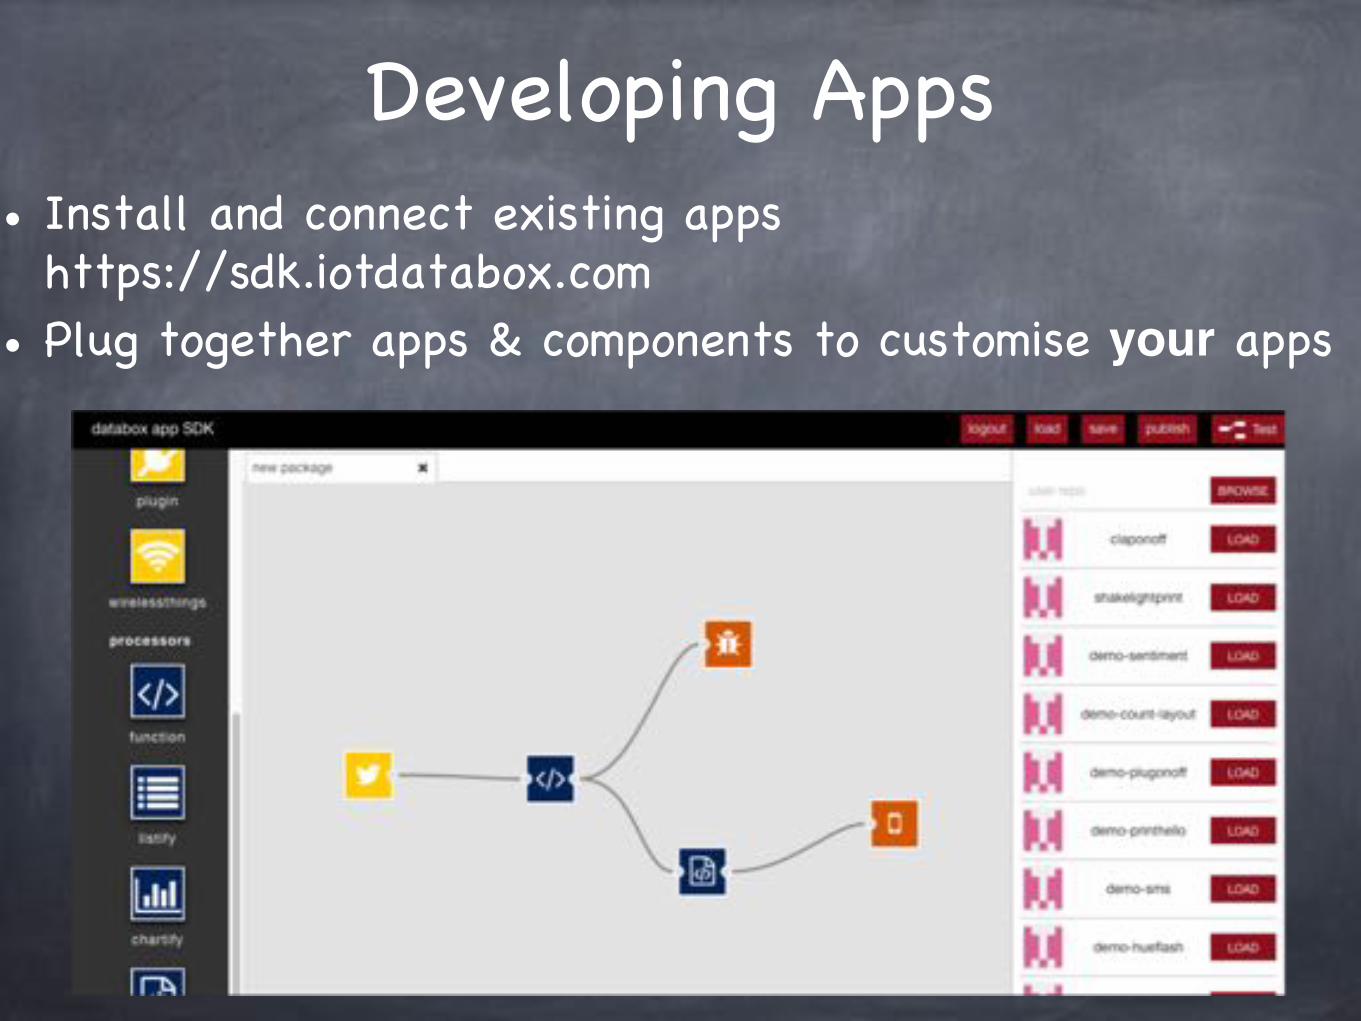
Developing Apps• Install and connect existing apps
https://sdk.iotdatabox.com• Plug together apps & components to customise your apps

Open Source Community Engagement
https://forum.databoxproject.uk/ https://github.com/me-box/

Related efforts

OPAL: Bringing the code to the data
n Developed by:
n With support from:
n Secured question-and-answer system (API)
n To be installed in Senegal and Colombia by the end of 2018
n All open-source software & published research

Privacy
Utility Cost

Distributed AnalyticsHow to handle scale, heterogeneity, dynamics?
• Cohort vs individual processing• Distributed model building• Personalised local analytics

Online LearningCan we use personal data to improve public, pre-trained ML models?
Sandra Servia-Rodriguez, Liang Wang, Jianxin R. Zhao, Richard Mortier, Hamed Haddadi, “Privacy-Preserving Personal Model Training”, The 3rd ACM/IEEE International Conference on Internet-of-Things Design and Implementation, April 2018, Orlando, Florida.
●●●●●●●●●●●●●●●●●●●●●●●●●●●●●●●●●●●●
●
●●
●
●
●
●
●●●
●
●
●
●●
●
●
●
●
●●
●
●
●
●
●●
●
●
●
●
●●
●
●
●
●
●
●●
●
●
●
●●
●
●
●●
●
●●
●
●
●
●●
●
●●
●
●●
●●
●
●
●●
●
●●
●●
●
●
●
●
●
●
●
●●●
●
●
●●
●
●
●●
●●
●
●
●
●●
●
●
●
●
●●
●
●●
●
●
●●
●
●
●
●
●
●
●
●
●
●●
●
●
●
●●
●
●
●
●
●
●
●
●
●
●
●
●●
●
●
●
●●
●
●
●●
●
●
●
●
●
●●
●
●
●
●
●●
●●
●●●
●
●
●
●●
●●
●
●
●
●
●
●
●●
●
●
●
●
●
●●●
●
●
●
●
●●
●●●
●●
●
●
●
●
●
●
●
●
●
●
●
●
●
●
●
●
●
●
●●
●●
●
●
●
●●
●
●
●●
●
●
●
●
●
●
●●
●●
●
●
●
●
●
●
●●
●
●
●
●
●
●
●●
●
●
●
●●
●
●●
●
●
●●
●
●●
●
●
●
●
●
●
●
●
●
●
●
●●
●
●
●
●
●
●
●
●
●
●
●
●
●
●
●
●
●
●●
●
●
●●
●
●
●
●●
●
●
●
●
●
●●
●
●
●
●
●
●
●
●
●
●
●
●
●●
●
●
●
●
●●
●●
●
●
●
●
●
●
●
●
●
●
●
●
●
●
●
●●
● ●●
●
● ●
●
●
●
●
●
●●
●
●
●
●
●
●
●
●
●
●
●●
●
●●
●
●
●
●●
●
●
●
●
●
●
●
●
●●
●
●
●
●●
●
●●
●
●
●
●
●
●
●
●●●
●
●
●
●
●
●●
●
●
●
●
●
●
●
●
●
●
●
●
●
●
●
●
●●
●
●●
●
●●
●
●
●
●
●
●
●
●
●
●
●
●
●
●
●
●●
●
●
●
●
●
●●
●
●
●
●●
●
● ●
●
●●
●
●
●●
●
●●
●
●
●●
●
●
●
●
●
●
●
●
●
●
●
●
●
●
●
●
●●
●●
●
●
●
●
●
●
●
●
●
●
●
●
●●
●
●
●
●
●
●
●
●
●
●
●
●
●
●
●
●
●
●
●
●
●
●
●
●
●
●
●
●
●
●
●
●
●
●
●
●
●
●
●
●
●
●
●
●
●
●●
●
●
●
●
●
●
●
●
●
●●●
●
●
●●
●
●
●
●
●
●
●
●
●●
●
●●
●
●
●
●
●
●
●
●
●
●
●●●
●
●
●
●
●
●
●●
●
●
●
●
●
●
●
●●
●
●
●●
●
●
●
●
●●
●
●
●
●
●●●
●
●
●
●
●
●●
●
●
●
●
●
●
●
● ●
●
●
●
●
●
●
●
●●
●
●●●
●
●
●
●
●
●
●
●●
●
●
●
●
●●●
●
●
●
●
●
●
●
●
●
● ●
●
●
●
●
●●
●
●
●
●
●
●
●
●●
●
●●●
●
●
●
●
●
●
●
●●
●
●
●
●
●●
●
●
●
●
●
●
●
●
●
●
●
●
●●
●
●
●
●
●
●
●
●
●
●
●
●●
●
●●
●
●
●
●
●
●
●
●
●●
●
●
●
●
●
●
●
●
●
●
●
●
●
●
●
●
●●
●
●
●
●
●●
● ●
●
●
●
●
●
●●
●
●
●
●
●
●
●
●
●
●
●
●●
●
●
●
●
●
●
●
●
●
●●
●
●
●
●
●
●
●
●
●●
●
●
●●
●
●
●
●
●
●
●
●
●
●
●
●
●
●
●
●●
●
●
●
●
●
●
●
●
●
●
●
●
●
●
●
●●
●
●
●
●
●
●●
●
●
●
●●
●
●
●
●
●
●●
●●
●
●
●
●
●
●
●
●
●
●●
●
●
●
●
●
●●
●●
●
●
●
●●
●
●
●
●
●
●
●
●
●
●
●
●
●
●
●
●●
●
●
●
●
●
●
●
●●
●
●
●
●
●
●
●
●
●
●
●
●
●
●
●
●
●
●
●
●
●
●
●
●
●
●
●
●
●
●
●
●
●
●
●
●
●
●
●
●
●
●
● ●
●
●
●
●
●
●
●
●●
●
●
●
●
● ●
●
●
●
●
●
●
●
●
●
●
●
●
●
●
●
●●
●
●
●
●
●●
●
●
●
●
●
●
●
●
● ●●●
●
●
●
●
●
●●
●
●
●
●
●
●
●
●
●●
● ●
●
●
●
●
●
●
●
●
●
●
●
●
●
●●
●
●
●
●●
●
●
● ●
●
●
●
●
●
●
●
●●
●
●
●
●
●
●
●
●
●
●●
●
●
●
●●
●●●
●●
●
●
●
●
●
●●
●
●
●
●
●●
●
●
●
●
●
●
●●●
●
●
●●
●
●●
●●
●
●
●
●●
●
●
●
●
●
●
●
●
●
●
●
●
●
●
●
●
●
●
●
●
●
●
●
●
●
●
●
●
●
●
●
●
●
●
●
●
●●
●
●
●
●●
●
●
●
●●
●
●●
●●
●
●
●
●
●
●
●
●
●
●
●●
●
●
●
● ●
●●
●●
●
●
●●
●
●
●●
●
●
●●
●
●
●
●●●●
●●●
●●●●●●●●●●●●●●●●●●●●●●●●●●●●●●●●●●●●
●
●●
●
●
●
●
●●
●
●
●
●
●●
●
●
●
●
●●
●
●
●
●
●●
●
●
●
●
●●
●
●
●
●
●
●●
●
●
●
●●
●
●
●●
●
●●
●
●
●
●●
●
●●
●
●●
●●
●
●
●●
●
●●
●●
●
●
●
●
●
●
●
●●●
●
●
●●
●
●
●●
●●
●
●
●
●●
●
●
●
●
●●
●●●
●
●
●●
●
●
●
●
●
●
●
●
●
●●
●
●
●
●●
●
●
●
●
●
●
●
●
●
●
●
●●
●
●
●
●●
●
●
●●
●
●
●
●
●
●●
●
●
●
●
●●
●●
●●●
●
●
●
●●
●●
●
●
●
●
●
●
●●
●
●
●
●
●
●●●
●
●
●
●
●●
●●●
●●
●
●
●
●
●
●
●
●
●
●
●
●
●
●
●
●
●
●
●●
●●
●
●
●
●●
●
●
●●
●
●
●
●
●
●
●●
●●
●
●
●
●
●
●
●●
●
●
●
●
●
●
●●
●
●
●
●●
●
●●
●
●
●●
●
●●
●
●
●
●
●
●
●
●
●
●
●
●●
●
●
●
●
●
●
●
●
●
●
●
●
●
●
●
●
●
●●
●
●
●●
●
●
●
●●
●
●
●●
●
●●
●
●
●
●
●
●
●
●
●
●
●
●
●●
●
●
●
●
●●
●●
●
●
●●
●
●
●
●
●
●
●
●
●
●
●
●
●
● ●●
●
● ●
●
●
●
●
●
●●
●
●
●
●
●
●
●
●
●
●
●●
●
●
●
●
●
●
●●
●
●
●
●
●
●
●
●
●●
●
●
●
●●
●
●●
●
●
●
●
●
●
●
●●●
●
●
●
●
●
●●
●
●
●
●
●
●
●
●
●
●
●
●
●
●
●
●
●●
●
●●
●
●●
●
●
●
●
●●
●
●
●
●
●
●
●
●
●
●●
●
●
●
●
●
●●
●
●
●
●●
●
● ●
●
●●
●
●
●
●
●
●●
●
●●
●
●
●
●
●
●
●
●
●
●
●
●
●
●
●
●
●
●●
●●
●
●
●
●
●
●
●
●
●
●
●
●
●●
●
●
●
●
●
●
●
●
●
●
●
●
●
●
●
●
●
●
●
●
●
●
●
●
●
●
●
●
●
●
●
●
●
●
●
●
●
●
●
●
●
●
●
●
●
●●
●
●
●
●
●
●
●
●
●
●●●
●
●
●
●
●
●
●
●
●
●
●
●
●●
●
●●
●
●
●
●
●
●
●
●
●
●
●●●●
●
●
●
●
●
●
●
●
●
●
●
●
●
●
●●
●
●
●●
●
●
●
●
●●
●
●
●
●
●●●
●
●
●
●
●
●
●
●
●
●
●
●
●
●
●●
●
●
●
●
●
●
●
●●
●
●●●
●
●
●
●
●
●
●
●●
●
●
●
●
●●●
●
●
●
●
●
●
●
●
●
●●
●
●
●
●
●●
●
●
●
●
●
●
●
●●
●
●●●
●
●
●
●
●
●
●
●●
●
●
●
●
●●
●
●
●
●
●
●
●
●
●
●
●
●
●●
●
●
●
●
●
●
●
●
●
●
●
●●
●
●●
●
●
●
●
●
●
●
●
●●
●
●
●
●
●
●
●
●
●
●
●
●
●
●
●
●
●●
●
●
●
●
●●
● ●
●
●
●
●
●
●●
●
●
●
●
●●
●
●
●
●
●
●●
●
●
●
●
●
●
●
●
●
●●
●
●
●
●
●
●
●
●
●●
●
●
●●
●
●
●
●
●
●
●
●
●
●
●
●
●
●
●
●●
●
●
●
●
●
●
●
●
●
●
●
●
●
●
●
●●
●
●
●
●
●
●
●
●
●
●
●●
●
●
●
●
●
●●
●●
●
●
●
●
●
●
●
●
●
●●
●
●
●
●
●
●●
●●
●
●
●
●●
●
●
●
●
●
●
●
●
●
●
●
●●
●
●
●●
●
●
●
●
●
●
●
●
●
●
●
●
●
●
●
●
●
●
●
●
●
●
●
●
●
●
●
●
●
●
●
●
●
●
●
●
●
●
●
●
●
●
●
●
●
●
●
●
●
●
●
● ●
●
●
●
●
●
●
●
● ●
●
●
●
●
●●
●
●
●
●
●
●
●
●
●
●
●
●
●
●
●
●●
●
●
●
●
● ●
●
●
●
●
●
●
●
●
● ●●
●
●
●
●
●
●
●● ●
●
●
●
●
●
●
●●
●
● ●
●
●
●●
●
●
●
●
●
●
●
●
●
●●●
●
●
●●
●
●
●●
●
●
●
●
●
●
●
●●
●
●
●
●
●
●
●
●
●
●●
●
●
●
●●
●●●
●
●
●
●
●
●
●
●●
●
●
●
●
●●●
●
●
●
●
●
●●
●
●
●
●●
●
●●
●●
●
●
●
●●
●
●
●
●
●
●
●
●
●
●
●
●
●
●
●
●
●
●
●
●
●
●
●
●
●
●
●
●
●
●
●
●
●
●
●
●
●●
●
●
●
●
●
●
●
●
●●
●
●
●
●●
●
●
●
●
●
●
●
●
●
●
●●
●
●
●
●
●
●●
●
●
●
●
●●
●
●
●●
●
●
●●
●
●
●
●●●●●
●●
0.0
2.5
5.0
7.5
10.0
12.5
0 40 80 120 160# of samples
Tim
e (s
)
●
●
local modelpersonal model
Fig. 7. Time for training with each model, varying the number of localsamples per user.
personal devices which lack the capabilities of cloud-basedservers. These environments are of increasing interest fordeployment of such techniques as availability of computa-tion resources outside datacenters continues to increase withcreation of “fog computing” environments using cheap andenergy-efficient platforms such as those based on ARM pro-cessors [36].
To verify the deployment feasibility of our approach onresource-constrained personal devices we evaluate, for bothtasks, the second phase of our approach, testing the refinementand inference aspects on a Raspberry Pi 3 Model B [7] asrepresentative of these sorts of environments.
Figure 7 shows the time taken for training a personal model(refining the initial shared model), and for the alternative ap-proach of learning a local model using only a single user’s dataavailable locally, for the setup in §III. In both cases trainingtakes seconds to complete, with time increasing linearly withthe number of samples considered due to the online nature ofthe training process (only one sample is considered at everyupdate of the model). The time for making the inference isinsignificant compared with the time for training, being onthe order of milliseconds.
Figure 8 reproduces results from §IV on the same resource-constrained device using the NIPS dataset. Figures 8(a-b)show the time spent per iteration while building the model,respectively varying the number of training documents whilekeeping the vocabulary size fixed, and the vocabulary sizewhile keeping the number of training documents fixed. Eachtest is repeated for 20 iterations. In both cases, we observe theexpected linear growth in model training time.
Figures 8(c-d) show the time it takes to reach a certainlevel of likelihood (we use -10.230 as the threshold, as inthe previous experiments) given different shared models. Allmodels are trained with 200 documents. The results align withwhat we have found out in Figure 5: including more datadecreases both the time and number of iterations required toreach the desired precision threshold. This decrease is most
obvious when the model moves from not using any data toincluding a small amount (10%). As further data is included,the benefits quickly diminish.
VI. RELATED WORK
Data-driven solutions are now pervasive in areas such asadvertising, smart cities and eHealth [37], [38]. Almost ev-erything we do in our daily lives is tracked by some meansor another. Although the careful analysis of these data can behighly beneficial for us as individuals and for the society ingeneral, this approach usually entails invasion of privacy, ahigh price that progressively more people are not willing topay [39].
Several privacy-preserving analytical solutions have beenproposed to guarantee the confidentiality of personal datawhile extracting useful information [40], [41], [42], [43].Prominent among them are those that build on Dwork’sdifferential privacy framework [44], [45], [46], [34], [47],which formalises the idea that a query over a sensitive databaseshould not reveal whether any one person is included in thedataset [48]. In the case of machine learning, the idea is thata differentially-private model should not reveal whether datafrom any one person were used to train the model. Most ofthese techniques for differentially-private machine learning areusually based on adding noise during the training, which leadsto a challenging trade-off between accuracy and privacy.
Distributed machine learning (DML) arised as a solution towell utilize large computer clusters and highly parallel com-putational architectures to speed up the training of big modelsover the large amounts of data available nowadays [49].Systems dealing with very large datasets have already hadto handle the case where no single node can contain andprocess the entire dataset, but the dataset and/or the modelto learn are paralellised among different machines, modelsare sequentially trained on each single machine, and somesort of synchronisation mechanism is applied to aggregate theparameters of the model to learn [50], [51], [52], [53]. DMLmay also be a potential solution when the volume of the datais not the main issue, but the distribution occurs when differententities own different datasets which, if aggregated, wouldprovide useful knowledge. However, the sensitivity of suchdata often prevents these entities from sharing their datasets,restricting access to only a small set of selected people asin the case of patients’ medical records [43]. Several solu-tions have been proposed for privacy-preserving distributedlearning, where information is learnt from data owned bydifferent entities without disclosing either the data or theentities in the data. Shokri and Shmatikov [13] and McMahanet al. [14] propose solutions where multiple parties jointlylearn a neural-network model for a given objective by sharingtheir learning parameters, but without sharing their inputdatasets. A different approach is proposed by Hamm et al. [15]and Papernot et al. [16], where privacy-preserving models arelearned locally from disjoint datasets, and then combined on aprivacy-preserving fashion. However, the privacy guarantees
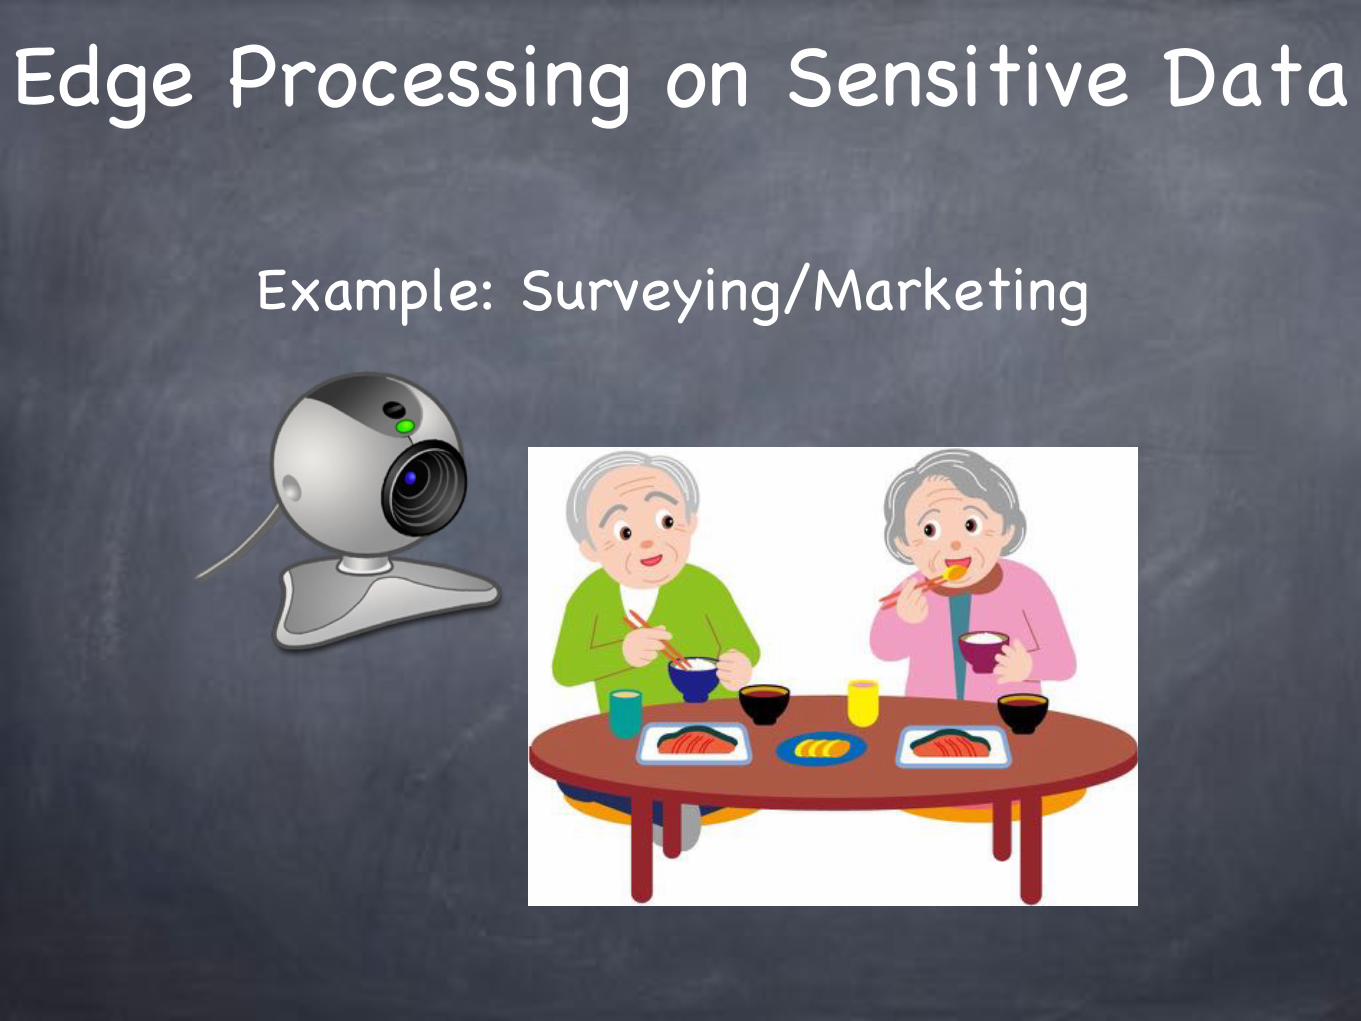
Edge Processing on Sensitive Data
Example: Surveying/Marketing

Privacy-Preserving Analytics
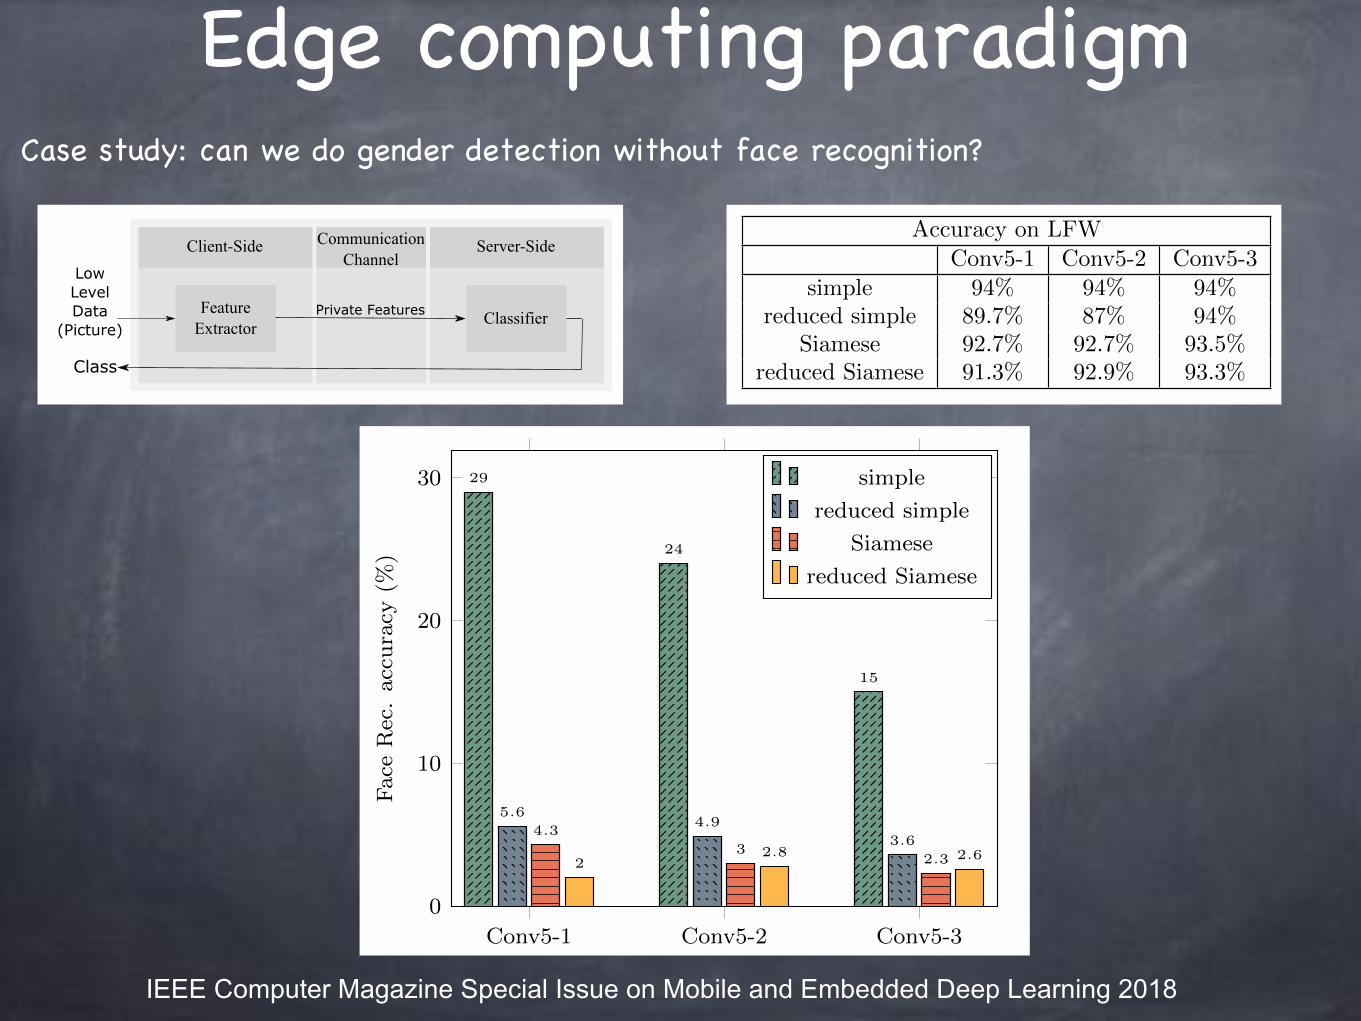
Edge computing paradigmCase study: can we do gender detection without face recognition?
Figure 1: Privacy preserving machine learning frame-work
the framework. We can break down the analytics pro-cess into feature extraction and classification modules:
• Feature Extractor : This module gets the inputdata, operates an algorithm on input data andoutputs a new feature vector. This intermediatefeature needs to keep the necessary informationabout the first classification task (CT1), while pro-tecting against the second classification task (CT2)as much as possible. Usually, these two objec-tives are contradictory, i.e., decreasing the infor-mation available to CT2 causes a decrease in theinformation available to CT1 too. An ideal featureextractor module would keep enough informationabout CT1 despite hiding information available toCT2 as much as possible. The first objective couldbe quantified by evaluating the CT1 classifier ac-curacy. The measure for the privacy-preservationwill be explored in section 3.3.
• Classifier : This module gets the intermediate fea-tures, generated by the feature extractor, as its in-put for the CT1 classifier. In practice, this modulecan be any ordinary classifier and privacy of inter-mediate data will be ensured by the first module(feature extractor).
As most cloud providers do not set the user privacyas their primary concern, a validation method is neededfor the user to ensure that their privacy is warranted.This validation method could be tailored based the ondesign of each module, so every instance of this frame-work needs a specific validation method. In order touse this framework in a specific problem we should de-termine the followings:
• Choosing an appropriate CT1 classifier.
• Designing a feature extractor and evaluate its pri-vacy.
• Designing a privacy validation method for client
In Section 3, we explain our proposed system archi-tecture based on this framework.
(a) Training simple embedding
(b) Using simple embedding. Intermediate layer is passed throughcommunication channel.
Figure 2: Simple embedding of a deep network
3. DEEP PRIV-EMBEDDINGDue to the increasing popularity of DL models in an-
alytics applications, in this section we address how toembed an existing DL model in our proposed frame-work. Complex deep networks consist of many layersand we use them in our framework using a layer separa-tion mechanism. At the first step, we must choose theoptimal intermediate layer from a deep network. Thenwe can store the layers before the intermediate layer onthe mobile as a feature extractor, and the layers afterthat in the cloud server as the classifier (see Figure 1).
Choosing the intermediate layer from higher layersof the network intrinsically comes with privacy compro-mises. In [30], the authors reconstruct an original imagefrom each layer and the accuracy of reconstruction de-creases by using higher layers. As we go up through thedeep network layers, the features get more specific to theclassification task [44] and irrelevant information to thespecific classification will be gradually lost. Hence, byusing the layer separation mechanism, we achieve twoimportant objectives simultaneously: (i) we end up withthe feature extractor easily, and (ii) we benefit from theintrinsic characteristics of DL models for classificationtasks. This approach satisfies the initial criteria we setfor our proposed framework. In this paper, we refer tothis embedding as the simple embedding. You can seetrain and test phase of this embedding in Figure 2. Insection 6 we will evaluate the e�ciency of this approach.
Moreover, experiments show that the accuracy of CT1
does not decrease, when we reduce the dimension of theintermediate feature with Principle Component Analy-sis (PCA). Having done this, we can highly reduce thecommunication overhead between the client and server.We call this embedding (with PCA applied) as the re-duced simple embedding.
3
Conv5-1 Conv5-2 Conv5-3
0
10
20
30 29
24
15
5.64.9
3.64.3
32.32
2.8 2.6
Face
Rec.accuracy
(%)
simple
reduced simple
Siamese
reduced Siamese
Figure 9: Gender Classification. Comparison of simple,reduced simple, Siamese and reduced Siamese embed-ding on di↵erent intermediate layers, while doing trans-fer learning. Accuracy of the original face recognitionis 75%.
spectively.The result of transfer learning for di↵erent embed-
dings on di↵erent intermediate layers is presented inFigure 9. Overall, what stands out from this figure isthat applying (reduced) simple or Siamese embeddingresults in a considerable decrease in the accuracy of facerecognition from Conv5 1 to Conv5 3. The reason ofthis trend is that as we go up through the layers, thefeatures of each layer will be more specific to the gen-der classification (CT1). That is to say, the features ofeach layer don’t have information related to face recog-nition (CT2) as much as even its previous layer. Inaddition, for all of the layers, face recognition accuracyof Siamese embedding is by far less than the accuracy ofsimple embedding. This result has route in training ofSiamese embedding with Siamese network which causesa dramatic drop in the accuracy. As it is shown in Fig-ure 9, when Conv5 3 is chosen as the intermediate layerin Siamese embedding, the accuracy of face recognitionis 2.3%, just ahead of random accuracy. Another inter-esting point of this figure is the e↵ect of dimensionalityreduction on the accuracy of face recognition. The re-duced simple and Siamese embeddings has lower facerecognition accuracy than simple and Siamese embed-ding, respectively.
To see how much these changes adversely a↵ect ac-curacy of desired task which is gender classification,we report di↵erent embeddings accuracies in table 1.The result of table 1 conveys two important messages.First, as the gender classification accuracy of Siameseand simple embedding are approximately the same, ap-plying Siamese idea does not decrease accuracy of de-sired task. Other important result is that Siamese em-
Table 1: Accuracy of Gender Classification on Di↵erentEmbeddings. (PCA Dimension for reduced embeddingswith Conv5-1, Conv5-2, and Conv5-3 as IntermediateLayer Is 8, 6, and 4 Respectively.)
Accuracy on LFWConv5-1 Conv5-2 Conv5-3
simple 94% 94% 94%reduced simple 89.7% 87% 94%
Siamese 92.7% 92.7% 93.5%reduced Siamese 91.3% 92.9% 93.3%
0 5 10 15 20 25 30 3584
86
88
90
92
94
96
Face Rec. Privacy %
Gen
der
Class.Accuracy
%
noisy reduced simple
advanced
Figure 10: Accuracy vs. privacy for gender classifica-tion using VGG-16 structure in advanced embedding(conv5 3 is the intermediate layer)
bedding is more robust to PCA than simple embed-ding. In other words, gender classification accuracy ofreduced Siamese embedding is close to Siamese embed-ding, whereas dimensionality reduction damage the ac-curacy of simple embedding. Figure 9 and table 1 showthat applying Siamese network and dimensionality re-duction results in preserving privacy while gender clas-sification accuracy does not decrease dramatically.
In order to validate the feature extractor, we use therank measure proposed in Section 4.2. By increasingthe noise variance, we get more privacy and less accu-racy. The service provider should gives us an accuracy-privacy curve (like Figure 10) and we can build exactlythe same result with this kind of privacy measurement(which is independent of face recognition model).
In fact privacy and accuracy can be considered as twoadversaries and increasing privacy of face recognitioncomes with decreasing of accuracy of gender classifica-tion. We show this dependency in Figure 10, where onecan see the superiority of theadvance embedding (noisyreduced Siamese) over noisy reduced simple embedding.From this figure, it is obvious that by increasing privacy,gender classification accuracy decreases more slowly in
9
Conv5-1 Conv5-2 Conv5-3
0
10
20
30 29
24
15
5.64.9
3.64.3
32.32
2.8 2.6
Fac
eRec.ac
curacy
(%)
simple
reduced simple
Siamese
reduced Siamese
Figure 9: Gender Classification. Comparison of simple,reduced simple, Siamese and reduced Siamese embed-ding on di↵erent intermediate layers, while doing trans-fer learning. Accuracy of the original face recognitionis 75%.
spectively.The result of transfer learning for di↵erent embed-
dings on di↵erent intermediate layers is presented inFigure 9. Overall, what stands out from this figure isthat applying (reduced) simple or Siamese embeddingresults in a considerable decrease in the accuracy of facerecognition from Conv5 1 to Conv5 3. The reason ofthis trend is that as we go up through the layers, thefeatures of each layer will be more specific to the gen-der classification (CT1). That is to say, the features ofeach layer don’t have information related to face recog-nition (CT2) as much as even its previous layer. Inaddition, for all of the layers, face recognition accuracyof Siamese embedding is by far less than the accuracy ofsimple embedding. This result has route in training ofSiamese embedding with Siamese network which causesa dramatic drop in the accuracy. As it is shown in Fig-ure 9, when Conv5 3 is chosen as the intermediate layerin Siamese embedding, the accuracy of face recognitionis 2.3%, just ahead of random accuracy. Another inter-esting point of this figure is the e↵ect of dimensionalityreduction on the accuracy of face recognition. The re-duced simple and Siamese embeddings has lower facerecognition accuracy than simple and Siamese embed-ding, respectively.
To see how much these changes adversely a↵ect ac-curacy of desired task which is gender classification,we report di↵erent embeddings accuracies in table 1.The result of table 1 conveys two important messages.First, as the gender classification accuracy of Siameseand simple embedding are approximately the same, ap-plying Siamese idea does not decrease accuracy of de-sired task. Other important result is that Siamese em-
Table 1: Accuracy of Gender Classification on Di↵erentEmbeddings. (PCA Dimension for reduced embeddingswith Conv5-1, Conv5-2, and Conv5-3 as IntermediateLayer Is 8, 6, and 4 Respectively.)
Accuracy on LFWConv5-1 Conv5-2 Conv5-3
simple 94% 94% 94%reduced simple 89.7% 87% 94%
Siamese 92.7% 92.7% 93.5%reduced Siamese 91.3% 92.9% 93.3%
0 5 10 15 20 25 30 3584
86
88
90
92
94
96
Face Rec. Privacy %
Gen
der
Class.Accuracy
%
noisy reduced simple
advanced
Figure 10: Accuracy vs. privacy for gender classifica-tion using VGG-16 structure in advanced embedding(conv5 3 is the intermediate layer)
bedding is more robust to PCA than simple embed-ding. In other words, gender classification accuracy ofreduced Siamese embedding is close to Siamese embed-ding, whereas dimensionality reduction damage the ac-curacy of simple embedding. Figure 9 and table 1 showthat applying Siamese network and dimensionality re-duction results in preserving privacy while gender clas-sification accuracy does not decrease dramatically.
In order to validate the feature extractor, we use therank measure proposed in Section 4.2. By increasingthe noise variance, we get more privacy and less accu-racy. The service provider should gives us an accuracy-privacy curve (like Figure 10) and we can build exactlythe same result with this kind of privacy measurement(which is independent of face recognition model).
In fact privacy and accuracy can be considered as twoadversaries and increasing privacy of face recognitioncomes with decreasing of accuracy of gender classifica-tion. We show this dependency in Figure 10, where onecan see the superiority of theadvance embedding (noisyreduced Siamese) over noisy reduced simple embedding.From this figure, it is obvious that by increasing privacy,gender classification accuracy decreases more slowly in
9
IEEE Computer Magazine Special Issue on Mobile and Embedded Deep Learning 2018

Replacement auto-encoder
I2
I3
I4
I l
I1S1
S2
S3
Sk
User sensitive
(black)
non-sensitive (gray)
desired (white)
CloudServices
ReplacementAutoencoder
featuretransformationusingRAE
Sensors
Inferences
Fig. 5. Replacement Platform: we assume each user knows their list of sensitive inferences and each cloud-based services announces their list of desiredinferences. Based on defined inferences lists, RAE learns how to transform time-windows that correspond to sensitive inferences before sending them out.
19 3D accelerometers on both arms and perform a set ofexperiments using sensors placed on the two arms of a tester(10 sensors on the right arm and 9 sensor on the left arm).The original sample rate of this dataset was 98 Hz, but itwas decimated to 30 Hz for comparison purposes with theother two datasets. The Skoda dataset has been employedto evaluate deep learning techniques in sensor networks [7],which makes it a proper dataset to evaluate our proposedframework.
3) Hand-Gesture: In this dataset, sensory data aboutrecognizing hand gestures from body-worn accelerometers andgyroscopes is recorded4. There are two subjects perform handmovements with 8 gestures in regular daily activity and with3 gestures in playing tennis, so in total, there are 12 classes(Table I). Every subject repeated all activities about 26 times.Similar to the other datasets, the null class refers to the periodsof no specific activity. The sampling rate of dataset is 32 Hzand each record has 15 real valued sensor readings in total.
For all datasets, we fill up the missing values usinglinear interpolation and normalize each sensor’s data tohave zero mean and unit standard deviation. For Skodaand Hand-Gesture datasets, we randomly select 80% oftime-windows for training phase and the remaining 20% isused for the tests.
B. Experimental SettingsWe consider Human Activity Recognition problem (HAR)
and a setting in which there are a list of |c| different inferenceclasses: I = {I1, ..., Ii, ..., Ij , ..., Ic}. We divide inferencesinto three distinct categories:
1) desired activities: Iw = {I1, I2, ..., Ii}2) sensitive activities: Ib = {Ii+1, Ii+2, ..., Ij}3) non-sensitive activities: Ig = {Ij+1, Ii+2, ..., Ic}
where i < j. We assume when a service is requested fromthird parties, they announce the list of required inferencesto be drawn to make the service works properly. We putthese inferences (activities) in the list of desired inferencesIw. Moreover, we assume users know what kind of inferencesare non-sensitive for them. Therefore, users announce a list ofnon-sensitive inferences Ig (e.g. null classes in datasets). In
4https://github.com/andreas-bulling/ActRecTut
our experiments, we put the remaining inferences into sensitiveinferences Ib. Thus, in our experiments we utilize datasets totrain RAE in this way:(a) Following [6], we consider a sliding window with size d
and step size w to segment the time-series of k sensorsinto a set of sections. Specifically, a two-dimensionalmatrix containing k rows of time-series of which eachrow consists of d data points. For all datasets we setd = 30 and w = 3. Moreover, the activity label ofeach sliding window is assigned by the most-frequentlyappeared label in all d records. In this way, we have atraining dataset contains labeled sections of time-series.We divide training dataset into three disjoint sets, byconsidering Ib, Iw, and Ig in each experiment.
(b) We train the RAE for performing the feature-basedreplacement. As we said in section IV, autoencoderstry to learn an approximation to the identity function,so as to output z that is similar to input x. Thus, forimplementing the idea of Replacement AutoEncoder, weset X = W [ G [ B and Z = W [ G [ G, whereX = {x(1), x(2), . . . , x(n)} is input data in the trainingphase of RAE, and Z = {z(1), z(2), . . . , z(n)} is thecorresponding output. W , G, and B are respectively datainstances corresponding to white-listed, gray-listed, andblack-listed inferences. G is a randomly selected subsetof G sections with the same size with the B. By replacingB with G, RAE learns how to replace sections of atime-series that contain sensitive data with non-sensitivedata (implementation of equation 3 ).
(c) We implemented RAE using Keras5 framework. Theactivation function for input and output layers is linearand for all of the hidden layer is Scaled ExponentialLinear Unit (selu) [30]. Since we normalize data to havea zero mean and unity standard deviation, selu does notfilter out negative numbers, thus it is a better choicethan Rectified Linear Unit (relu). The loss function intraining phase is chosen to be Mean Squared Error (mse).Our experiments on various functions show that the mseworks better for this purpose. The dimension of RAEinput is inp = [ k ⇥ d, 1] , and it has five hidden
5https://keras.io/
sliding window ( ! )
sele
cted
sen
sors
( "
)
stepsize(# )
$%& → )%&* → )%&+ → )%&,- → )%&+ → )%&
* → ./0
Deep CNN [state-of-the-art]
Cla
ssifi
catio
n ( 1
)
Third Party Model Replacement Autoencoder User’s Time-Series
d
Fig. 6. A stacked autoencoder as a mediator : in all experiments in this paper, w = 3 and d = 30 , and k depends on the number of sensors in each dataset.
TABLE IIF1 SCORES FOR SKODA DATASET (IN ALL THE TABLES, OF1 STANDS FOR
ORIGINAL DATA AND TF1 STANDS FOR TRANSFORMED ONE)
Hand List of Inferences (Table I) OF1 TF1
LeftIw = {4, 8, 9, 10} 97.92 96.32Ib = {1, 5, 6, 7} 96.24 0.00Ig = {0, 2, 3} 94.34 93.42
LeftIw = {2, 3, 5, 6, 7, 9} 96.52 93.23Ib = {4, 8, 10} 97.88 0.00Ig = {0, 1} 93.86 94.85
RightIw = {1, 4, 10} 97.56 94.9Ib = {2, 3, 8, 9} 97.97 0.00Ig = {0, 5, 6, 7} 92.33 88.23
RightIw = {2, 3, 5, 6, 7, 9} 95.76 91.06Ib = {4, 8, 10} 97.39 0.00Ig = {0, 1} 94.31 92.39
TABLE IIIF1 SCORES FOR HAND-GESTURE DATASET
Subject List of Inferences (Table I) OF1 TF1
#1Iw = {1, 2, 3, 4, 9, 10, 11} 94.11 90.15Ib = {5, 6, 7, 8} 95.75 0.26Ig = {0} 95.04 96.54
#1Iw = {1, 3, 4, 5, 6, 7} 95.23 90.45Ib = {2, 8, 9, 10, 11} 94.53 0.62Ig = {0} 95.04 97.46
#2Iw = {1, 3, 4, 5, 6, 7, 8} 97.21 93.30Ib = {2, 9, 10, 11} 92.54 0.71Ig = {0} 95.89 97.53
#2Iw = {2, 3, 5, 6, 7, 9} 96.10 92.13Ib = {4, 8, 10} 96.96 0.52Ig = {0, 1} 95.70 97.56
layers with size inp/2, inp/8, inp/16, inp/8, inp/2respectively (except for Hand-Gesture dataset, whichis inp/2, inp/3, inp/4, inp/3, inp/2, because of lowdimensionality of data). All the experiments have beenperformed on 30 epochs with batch size 128. (seeFigure 6)
To evaluate the performance of time-series transformationby RAE, we implemented one of the best methods forHAR that have been proposed recently [6] as a thirdparty model. They build a Convolutional Neural Network toinvestigate the multichannel time-series data. We compare theperformance of third party model on transformed time-serieswith original ones and show that utility will retain for allof the activities included in white-listed inferences, whilerecognizing an activity correspond to black-listed inferences is
TABLE IVF1 SCORES FOR OPPORTUNITY DATASET
Subject List of Inferences (Table I) OF1 TF1
#1Iw={9,10,11,12,13,14,15,16,17} 71.75 64.32Ib={1,2,3,4,5,6,7,8} 79.15 0.21Ig={0} 88.93 89.70
#1Iw={1,2,3,4,5,6,7,8,15,17} 76.87 75.93Ib={9,10,11,12,13,14} 71.49 1.32Ig={0,16} 84.44 82.08
#3Iw={9,10,11,12,13,14,16} 74.92 77.07Ib={1,2,3,4,15,17} 76.16 0.92Ig ={0,5,6,7,8} 84.98 81.58
#3Iw={1,2,3,4,5,6,7,8,15,17} 70.32 65.05Ib={9,10,11,12,13,14,16} 74.92 6.31Ig={0,1} 93.72 92.95
near impossible. Both the original and transformed time-seriesare given to the third party model for classification task andF1 scores are calculated in Table II, Table III, and Table IV.The results show that utility will retain for desired activities,while recognizing sensitive activities is near impossible. Themost valuable result is that third party’s model misclassifies alltransformed sections correspond to black-listed inferences (B)into the gray-listed inferences (G). Therefore, the false-positiverate on white-listed inferences is very low (see Figure 7).
C. VisualizationIt is a very challenging task to visualize multi-channel
time-series, especially in our high-dimensional setting. Inthis section, in order to better understand the idea ofReplacement AutoEncoder, we present and discuss someperceptible examples.
The MNIST database of handwritten digits [31], is themost famous dataset for evaluating learning techniques andpattern recognition methods. It contains 60, 000 trainingimages and 10, 000 testing images. As an explicit example,in our setting, we consider 0 as a kind of non-sensitiveinference (gray-listed), other even numbers (2, 4, 6, 8) as aset of sensitive inferences (black-listed), and all of the oddnumbers (1, 3, 5, 7, 9) as desired information we want to keepunchanged. Figure 8 shows the output of the RAE when itreceives some samples from test set as input. RAE transformedall of the images categorized as sensitive information intoimages that are undoubtedly recognized as 0 by humansand also image recognition algorithms. This is just a simpleexample to build an intuitive sense of how our method
Fig. 7. Confusion Matrix: (Left) Original time-series . (Right) Transformedtime-series. It shows that, after transformation, almost all of the black-listedactivities (B) are recognized as gray-listed ones (G). (Top) Results relate toSkoda dataset (left hand) for these lists: IW = {2, 3, 5, 6, 7, 9}, IB ={4, 8, 10}, IG = {0, 1}. (Middle) Results relate to Hand-Gesture dataset(subject 1) for these lists: IW = {1, 2, 3, 4, 9, 10, 11}, IB = {5, 6, 7, 8},IG = {0}. (Bottom) Results relate to Opportunity dataset (subject 1) for theselists: IW = {1, 2, 3, 4, 5, 6, 7, 8, 15, 17}, IB = {9, 10, 11, 12, 13, 14},IG = {0, 16}
Fig. 8. Outputs of replacement autoencoder in MNIST handwrittendigits [31]: (Top) Considering 0 as non-sensitive (gray-listed) and informationother even numbers as sensitive (black-listed) ones. (Bottom) Considering allthe odd numbers as desired information.
can learn the piecewise function described in equation 2 toselectively censor sensitive information in personal data.
For visualizing time-series data which are used in theexperiments, we implement t-Distributed Stochastic Neighbor
BWG
GWB
Fig. 9. The effect of applying feature-based transformation using replacementautoencoder on time-series: feature space relationships among different classesof activities for Skoda dataset (first row of table II ). (Top) t-SNE on originaltime-series. (Bottom) t-SNE on transformed time-series.
Embedding (t-SNE) [32]. At the moment, it is one of the mostcommon algorithm for 2D visualization of high-dimensionaldatasets. t-SNE is a technique for dimensionality reduction anda well known strategy for visualizing similarity relationships,between different classes in the dataset, in high-dimensionaldata. It uses PCA to compress high-dimensional data (e.g.1800 for Skoda dataset [27]) into a low-dimensional space(e.g. 100 dimensional), then maps the compressed data to a2D plane that can be plotted easily. Since t-SNE cares aboutpreserving the local structure of the high-dimensional data,we use it to describe how the RAE would push sensitive datapoints, in the original data space, into areas that correspondto non-sensitive inferences, and at the same time preserve theseparability and structures of desired data points 6.
Figure 9 shows the feature space relationships amongdifferent classes of activities for Skoda dataset. Regarding thescatter plots depicted in Figure 9, black-listed data points inoriginal time-series (top plot) have their own structures andclearly separable from other classes. But, in the transformedversion of time-series (bottom plot) all of the black-listed datapoints have been moved into another area of feature-spacewhich is more closely related to gray-listed data points. Theyalso lose their recognizable patterns and all of them mappedto almost the same area of the feature space. On the otherhand, it maintains particular patterns of white-listed data
6 Using codes implemented in https://lvdmaaten.github.io/tsne
Mohammad Malekzadeh, Richard G. Clegg, Hamed Haddadi, “Replacement AutoEncoder: A Privacy-Preserving Algorithm for Sensory Data Analysis”, The 3rd ACM/IEEE International Conference on Internet-of-Things Design and Implementation, April 2018, Orlando, Florida.

Conclusions• Personal Data analytics face complex challenges and we
need new approaches for data utilisation.
• Databox, edge-computing, and user-centric processing methods are timely enablers in this direction
• Interesting new approaches for personal data, ambient sensing, actuation, and HDI
For more information, software, and papers:haddadi.github.io

threatsCollusion, Generative adversarial Networks, …
Security, Privacy, Analytics, scalability dichotomy
Scare stories: Mirai IoT Botnet, Smart TVs transmitting conversations & profiling, CIA Hacks, Webcam viewing websites, spamming fridge, Amazon echo ordering dolls, eavesdropping toys…
• IoT device and Network Isolation to limit coordinated attacks
• Crowdsourced or semi-supervised policing & anomaly detection
• Can not rely on constant connectivity
• Is the “cloud” or your DSL connection always on?
• Remember Amazon AWS outages?

Human-Data Interaction
Legibility, Agency, Negotiability 30

Conclusions• Personal Data analytics face complex challenges and we
need new approaches for data utilisation.
• Databox, edge-computing, and user-centric processing methods are timely enablers in this direction
• Interesting new approaches for personal data, ambient sensing, actuation, and HDI
For more information, software, and papers:haddadi.github.io