personalised nutrition: a biomarker based approach to optimal health
TRANSCRIPT

Personalised Nutrition
Nina BaileyBSc (hons) MSc PhD ANutr

It is well established that low omega-3 status is linked to poor health and a number of disease states
Omega-3 fatty acids are known to exert beneficial health effects and can be used for both the prevention and the treatment of chronic disease
Understanding that we are metabolically unique!
Explore why some studies produce inconsistent findings
Using biomarkers to identify personal requirements for omega-3 and optimise their clinical outcomes
Omega-3 index AA to EPA ratio
Identifying ways to improve clinical outcomes from fatty acid intervention

Importance of cell membrane integrity
Membrane phospholipid and cholesterol content regulate the activity of individual membrane proteins within the lipid membrane
Changes in lipid composition have functional consequences
In particular, the fatty acid composition of membrane lipids greatly influences membrane function
(Abbot et al. 2012; Hulbert et al. 2005)

Membranes remain relatively constant in their saturated and monounsaturated fatty acid levels over a wide range of dietary variation for these fatty acids (Abbot et al. 2012)
Membrane composition is found to be more responsive to omega-6 and omega-3 polyunsaturated fatty acid levels in the diet and most sensitive to the ratio of omega-6 to omega-3
Why?
(Abbot et al. 2012; Hulbert et al. 2005)

Although consumed in relatively large quantities in the diet, the saturated and monounsaturated fatty acids are also synthesised de novo, which may explain why both plasma and red blood cell membrane content of these fatty acids do not correlate strongly with intake (Arab et al. 2003)
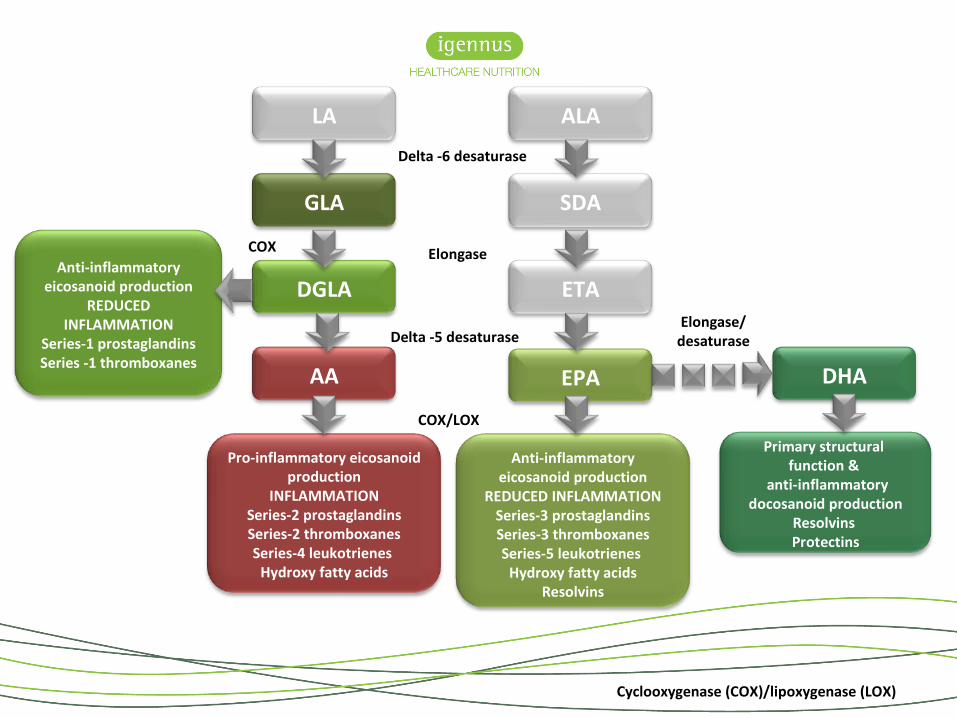
In contrast, humans lack the enzymes required for the de novo synthesis of polyunsaturated fats
polyunsaturated fats must be consumed in the diet in the form of the essential fatty acids linoleic acid and alpha-linolenic acid
Long-chain polyunsaturated fats are then synthesised via a chain of desaturase and elongase enzyme-mediated steps from these essential fatty acids

DHA
DGLA
GLA
Omega-6LA
EPA
ETA
SDA
Omega-3 ALA
Delta -6 desaturase
Elongase/desaturase
Delta -5 desaturase
Elongase
AA
Marine sources
Plants & plant oils
Animal products
Echium oil
Animal products Marine sources
Plants & plant oils
Evening primrose oil
Marine sources
Individual variations in the in vivo conversion of alpha linolenic acid to EPA and DHA as well as other dietary variables can influence tissue EPA + DHA levels

DHA
DGLA
GLA
Omega-6LA
EPA
ETA
SDA
Omega-3 ALA
Delta -6 desaturase
Elongase/desaturase
Delta -5 desaturase
Elongase
AA
The significance of the membrane content of omega fatty acids becomes apparent when we look at the antagonistic properties of the omega-6 and omega-3 families
Primary structural function &
anti-inflammatory docosanoid production
Resolvins Protectins
Anti-inflammatory eicosanoid production
REDUCED INFLAMMATIONSeries-3 prostaglandinsSeries-3 thromboxanesSeries-5 leukotrienes Hydroxy fatty acids
Resolvins
DHA
Anti-inflammatory eicosanoid production
REDUCED INFLAMMATION
Series-1 prostaglandinsSeries -1 thromboxanes
DGLA
GLA
LA
EPA
ETA
SDA
ALA
Delta -6 desaturase
Elongase/desaturaseDelta -5 desaturase
Cyclooxygenase (COX)/lipoxygenase (LOX)
Elongase
Pro-inflammatory eicosanoid production
INFLAMMATIONSeries-2 prostaglandinsSeries-2 thromboxanesSeries-4 leukotrienes Hydroxy fatty acids
AA
COX/LOX
COX

DGLA
GLA
LA
ETA
SDA
ALA
Delta -6 desaturase
Delta -5 desaturase
Cyclooxygenase (COX)/lipoxygenase (LOX)
Elongase
Pro-inflammatory eicosanoid production
INFLAMMATIONSeries-2 prostaglandinsSeries-2 thromboxanesSeries-4 leukotrienes Hydroxy fatty acids
AA
COX/LOX
Typical Western style diet favours the accumulation of AA

Primary structural function &
anti-inflammatory docosanoid production
Resolvins Protectins
Anti-inflammatory eicosanoid production
REDUCED INFLAMMATIONSeries-3 prostaglandinsSeries-3 thromboxanesSeries-5 leukotrienes Hydroxy fatty acids
Resolvins
DHA
Anti-inflammatory eicosanoid production
REDUCED INFLAMMATION
Series-1 prostaglandinsSeries -1 thromboxanes
DGLA
GLA
LA
EPA
ETA
SDA
ALA
Delta -6 desaturase
Elongase/desaturaseDelta -5 desaturase
Cyclooxygenase (COX)/lipoxygenase (LOX)
Elongase
COX/LOX
COX
DHA doesn’t have the sameantagonistic relationship with the omega-6 pathway as EPA

Anti-inflammatory eicosanoid production
REDUCED INFLAMMATIONSeries-3 prostaglandinsSeries-3 thromboxanesSeries-5 leukotrienes Hydroxy fatty acids
Resolvins
Anti-inflammatory eicosanoid production
REDUCED INFLAMMATION
Series-1 prostaglandinsSeries -1 thromboxanes
DGLA
GLA
LA
EPA
ETA
SDA
ALA
Delta -6 desaturase
Delta -5 desaturase
Cyclooxygenase (COX)/lipoxygenase (LOX)
Elongase
COX/LOX
COX
By determining the AA to EPA ratio we can assess the inflammatory status of an individual
Restore a healthy inflammatory profile with pure EPA

Primary structural function &
anti-inflammatory docosanoid production
Anti-inflammatory eicosanoid production
REDUCED INFLAMMATION
DHAEPA
Pro-inflammatory eicosanoid production
INFLAMMATION
AA
AA to EPA ratio
Omega-3 index
Using fatty acids as biomarkers

The AA to EPA ratio – a biomarker of inflammatory status
Greenland Inuit
Japanese Western populations Disease biomarker
The importance of these compounds in health and disease is evident from the range of pharmaceutical products that target eicosanoid biosynthesis or action
Indeed, AA metabolism is the direct target of nonsteroidal anti-inflammatory drugs (e.g. acetylsalicylic acid, ibuprofen), cyclooxygenase-2 (COX-2) inhibitors (e.g. rofecoxib, celecoxib) and leukotriene antagonists (e.g. montelukast, zafirlukast )

Phospholipid
Phospholipase A2
Arachidonic acid
PGH2
COX-1 (constitutive)
Pro-inflammatory products
COX-2 (induced)

Phospholipid
Phospholipase A2
Arachidonic acid
PGH2
COX-1 (constitutive)
Pro-inflammatory products
COX-2 (induced) Eicosapentaenoic acid


EPA administration results in a decrease in cell membrane AA reducing the production of TXA2 and PGI2 and increases EPA and thus PGI3 levels resulting in reduced inflammatory end products, and inhibition of platelet aggregation and vascular constriction
The improvement of (PGI2+PGI3)/TXA2
ratio is therefore significant when pure EPA is administered
Pure EPA therapeutics
The effects of EPA or DHA administration on the (PGI2+PGI3)/TXA2 ratio

In contrast, DHA administration decreases AA membrane levels but this decrease is smaller than that triggered by EPA administration and consequently, the % decrease in TXA2 and PGI2 are insignificant compared to that of EPA administration
In addition, PGI3 (as a product of EPA not DHA) does not change
The improvement of (PGI2+PGI3)/TXA2
ratio is therefore negligible with DHA administration as compared to that of EPA
Pure EPA therapeutics
The effects of EPA or DHA administration on the (PGI2+PGI3)/TXA2 ratio

The JELIS study is one of the largest cardiovascular studies recruiting than 18,000 subjects with elevated cholesterol levels for intervention using pure EPA
Administration of EPA and statins in hypercholesterolemia patients resulted in a significant reduction in the risk of coronary events when the AA to EPA ratio was <1.4
This reduction in the AA to EPA ratio was associated with an additional 19% reduction in cardiovascular events during the next four and half years
Yokoyama et al., 2007
Pure EPA therapeutics
The effects of EPA or DHA administration on the (PGI2+PGI3)/TXA2 ratio

Arachidonic acid and eicosapentaenoic acid metabolism contribute to cancer risk and progression through pro-and anti-inflammatory lipid metabolites that stimulate cell proliferation, angiogenesis, and migration
Azrad et al., 2013

As a biomarker, the AA to EPA ratio gives an indication of the inflammatory status
Because diet has the capacity to influence the amount of polyunsaturated fats within our cell membranes we need also need a structural biomarker of omega-3 status
The omega-3 index has many features that qualify it as not only a biomarker of intake, but also as risk marker and most importantly, a risk factor and target for therapy
Combining the AA to EPA ratio with the omega-3 index gives us a comprehensive overview of health status
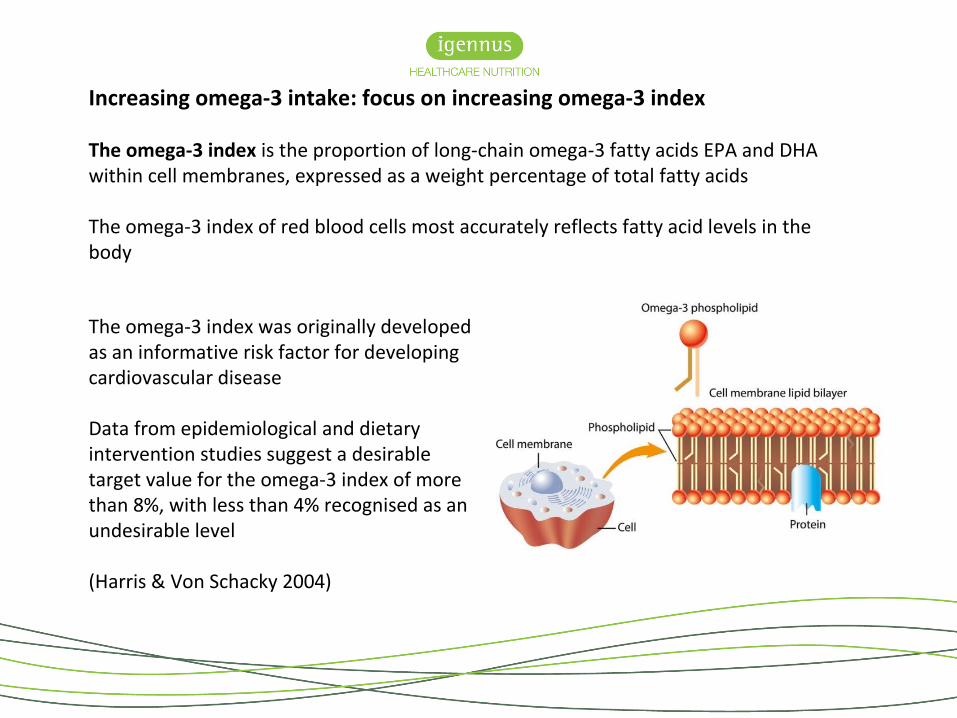
Increasing omega-3 intake: focus on increasing omega-3 index
The omega-3 index is the proportion of long-chain omega-3 fatty acids EPA and DHA within cell membranes, expressed as a weight percentage of total fatty acids
The omega-3 index of red blood cells most accurately reflects fatty acid levels in the body
The omega-3 index was originally developed as an informative risk factor for developing cardiovascular disease
Data from epidemiological and dietary intervention studies suggest a desirable target value for the omega-3 index of more than 8%, with less than 4% recognised as an undesirable level
(Harris & Von Schacky 2004)

The Seattle study, the Physicians' Health Study (PHS), the Cardiovascular Health Study (CHS), the Diet and Reinfarction Trial (DART), the study on the prevention of coronary atherosclerosis by intervention with marine omega-3 fatty acids (SCIMO), and the GISSI-Prevenzione study. Taken together, these data suggest a desirable target value for the Omega-3 Index of ≥8% and an undesirable level of ≤4%. Harris WS, Von Schacky C: The Omega-3 Index: a new risk factor for death from coronary heart disease? Prev Med 2004, 39:212-220.
4% 6% 8% 10%
GISSI-P & DART: 9.5%
CHS 8.9%
PHS 3.9%
SCIMO: 3.4%Seattle: 3.3%
SCIMO: 8.3%
PHS: 7.3%Seattle: 6.5%
LEAST PROTECTION GREATEST PROTECTION
Summary of evidence for the proposed cut points for the Omega-3 Index

Do fish oils ‘work’?
• Epidemiological studies show us that high omega-3 intake (fish/marine products/fish oil) decreases the risk of disease
• Raising the omega-3 index as a therapeutic intervention for cardiovascular issue has been the focus of many large intervention studies
• In contrast to the evidence provided by epidemiological studies, meta-analysis and reviews of intervention trials using omega-3 fatty acids have reported neutral findings on both total mortality and major adverse cardiac events

Why fish oils sometimes fail
Use of low bioavailable forms of omega-3
Capsule ingestion was poorly timed consumption of capsules can further reduce the bioavailability of EPA+DHA
Study participants are often recruited irrespective of their baseline levels in EPA+DHA, and treated with fixed doses, ignoring the large inter-individual variability in uptake of EPA+DHA
It is often the case that individuals with the lowest omega-3 levels are the best ‘responders’ to fish oil supplementation
Such factors may explain a tendency towards neutral results in many intervention trials
(Von Schacky 2015)
Baseline levels of fatty acids differ between healthy and non-healthy populations
Silva and colleagues analysed red blood cell fatty acid composition in healthy individuals (n = 22) and different diseased populations [psoriasis (n = 13); cancer (n = 81); geriatric (n = 49); social phobia (n = 27) and ICU-trauma (n = 40)] at baseline to show how this affects the incorporation of omega-3 fatty acids via supplementation
Significant differences in the red blood cell profile between populations were found
Baseline red blood cell fatty acid profile (EPA, DHA, AA) proved to be different and dependent on the nature of the study population, with the healthy population showing the best omega-3 levels and most favourable omega-6 to omega-3 status
Treatment associated changes are dependent on the initial omega-3 fatty acid status
(Silva et al. 2014)

• It is suggested that whilst dietary intervention with fish oil results in the incorporating of EPA and DHA into cell membranes, the omega-3 index must reach the level suggested to be optimal (≥8% in the case of cardiovascular patients) to obtain clinical efficacy (Kagan et al. 2015)
• From a therapeutic stance, dietary intervention for clinical outcomes must therefore focus on ensuring that an ‘ideal’ omega-3 index is achieved
• If blood cell omega-3 content is to be used as a risk factor and a dietary target for intervention, then the factors that influence this marker need to be elucidated, thus highlighting the increasing importance of personalised nutrition

•Consequently, knowledge of baseline levels will guide the practitioner recommendations—not surprisingly,low baseline values may require a larger dose than a highbaseline value!
•Therefore, the omega-3 index may be useful for assessing both baseline risk and a change in risk as function of intake
•Dose response studies show us that high doses of omega-3 are generally required to achieve omega-3 index ≥8%, especially where the baseline levels are suboptimal ≤4%

Distribution of the percentage of red blood cell (RBC) EPA+DHA values (omega-3 index) in the study population at baseline. Lines at 8% and 4% indicate proposed low- and high-risk horizons, respectively, and the dotted line at 4.3% is the population average (Flock et al. 2013)
7%
2%
4.3%
Dose of omega-3 (mg/day)
0 (n=23)
300 (n=23)
600 (n=21)
900(n=24)
1800 (n=24) p value
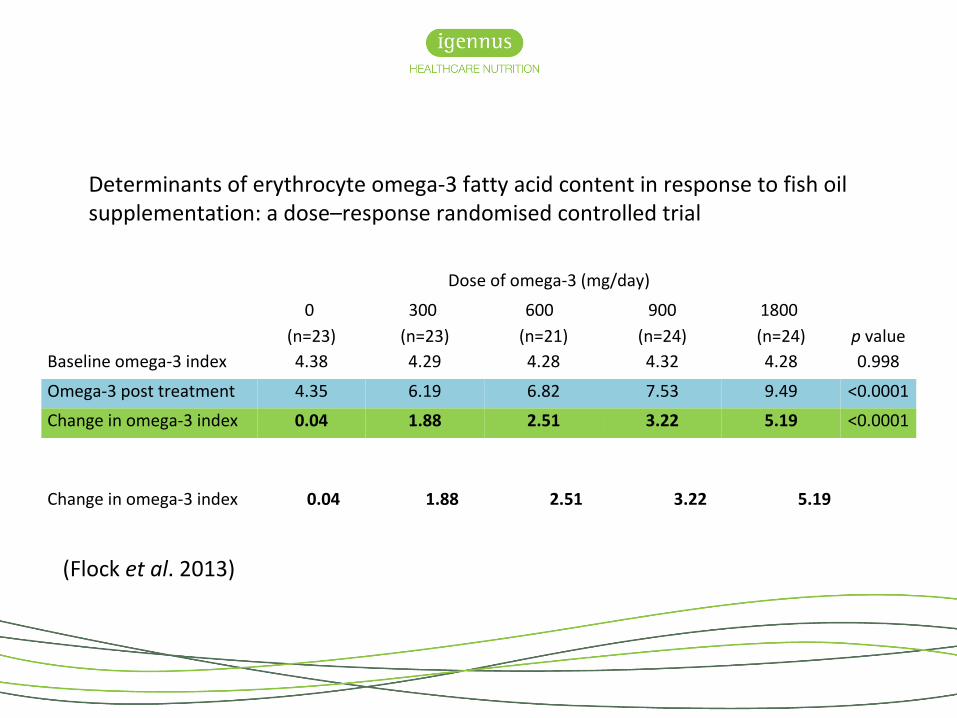
Baseline omega-3 index 4.38 4.29 4.28 4.32 4.28 0.998
Omega-3 post treatment 4.35 6.19 6.82 7.53 9.49 <0.0001
Change in omega-3 index 0.04 1.88 2.51 3.22 5.19 <0.0001
Determinants of erythrocyte omega-3 fatty acid content in response to fish oilsupplementation: a dose–response randomised controlled trial
(Flock et al. 2013)
Change in omega-3 index 0.04 1.88 2.51 3.22 5.19

Individual variability in omega-3 index – a dose response
(Flock et al. 2013)
2.51
5.19
3.22
0.04
1.88

Variability was influenced by baseline omega-3 index, age, sex and physical activity
Lower omega-3 index status and older age each predicted greater increases in omega-3 index
Increased physical activity level was associated with a higher omega-3 index
Female subjects had a non-significant increase in omega-3 compared to males
However, body weight was the greatest influencer
(Flock et al., 2013)

40 individuals with a baseline omega-3 index <5% (black bar) and post treatment (white bar) after an 6-week intervention with 0·5 g/d
The mean omega-3 index increased from 4·37% to 6·80% and inter-individual variability in response was high
Kohler et al. 2010
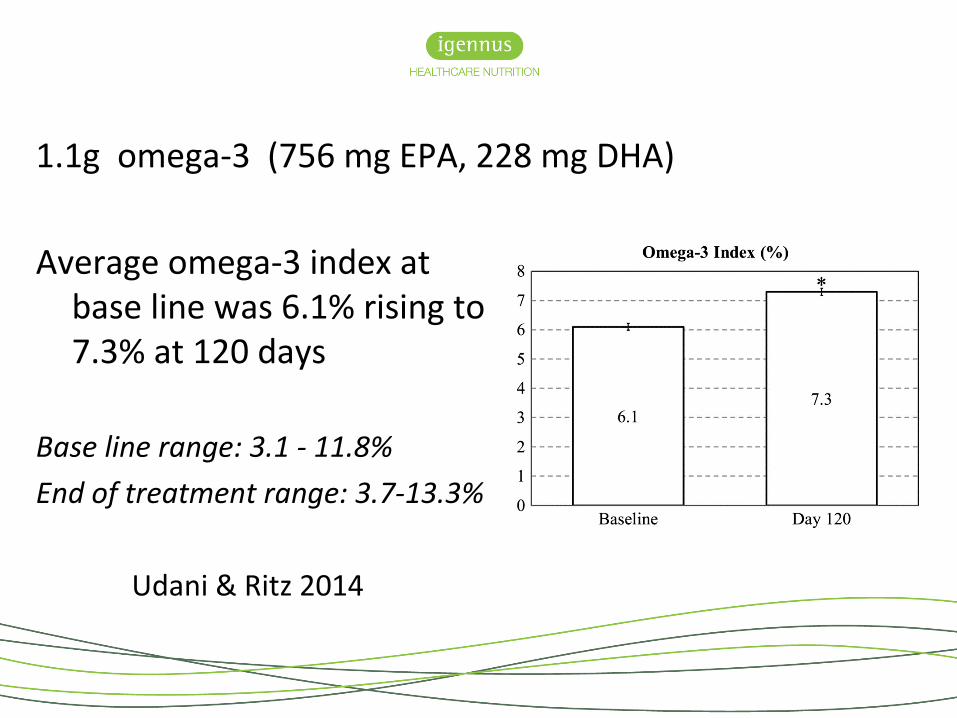
Average omega-3 index at base line was 6.1% rising to 7.3% at 120 days
Base line range: 3.1 - 11.8%
End of treatment range: 3.7-13.3%
Udani & Ritz 2014
1.1g omega-3 (756 mg EPA, 228 mg DHA)

For an omega-3 supplement to have clinical effect, it must be able to increase the omega-3 index to a level that is deemed effective
Pharmaceutical products are highly concentrated:
OmacorVascepa
Non pharmaceutical products vary considerably in their omega-3 content and form of delivery
Fish oil - triglycerideKrill oil - phospholipidOmega-3 isolates - triglyceride, reesterified triglyceride, ethyl-ester
Not all omega-3 supplement will deliver therapeutic doses
Practitioners must choose wisely!

Fatty acid
Fatty acid 2
Phosphate
Glycerol
Ethyl-este rFatty acid 2
Fatty acid 2
Fatty acid 2
Fatty acid 2
Glycerol
Fatty acid 2
Fatty acid 3
Glycerol
Triglyceride Phospholipid Ethyl-ester Re-esterified triglyceride
Fatty acid
CholineSerineInositolEthanolamine

Open-label, randomised, cross-over study involving thirty-five healthy subjects
Subjects were randomly assigned to consume one of four products, in random order, for a 28-day period, followed by a 4-week washout period
Subsequent testing of the remaining three products, followed by 4-week washout periods, continued until each subject had consumed each of the products
Blood samples before and after supplementation were quantified for fatty acid analysis using gas chromatography, and statistically analysed using
Laidlaw et al. 2014
A randomised clinical trial to determine the efficacy of manufacturers’ recommended doses of omega-3 fatty acids from different sources in facilitating cardiovascular disease risk reduction

Om
ega-
3 d
ose
(mg/
day)
EPA DHA Total omega-3
Concentrated fish oil (rTG) 650 450 1100
Concentrated fish oil (EE) 756 228 984
Salmon oil (TG) 180 220 400
Krill oil (PL) 150 90 240
Laidlaw et al., 2014

Om
ega-
3 in
dex
rTG = reesterified triglyceride; EE=ethyl-ester; TG=triglyceride; PL=phospholipid
Day 0 Day 28 ∆ ChangeConcentrated fish oil (rTG)
4.17 6.82 2.65
Concentrated fish oil (EE)
4.13 5.77 1.64
Salmon oil (TG) 4.13 4.93 0.80
Krill oil (PL) 4.27 4.76 0.49
Laidlaw et al., 2014

AA
to E
PA ra
tio
Day 0 Day 28 ∆ Change
Concentrated fish oil (rTG)
11.886 4.738 -7.148
Concentrated fish oil (EE)
12.164 5.058 -7.107
Salmon oil (TG) 11.576 8.836 -2.740
Krill oil (PL) 11.568 8.963 -2.606
rTG = reesterified triglyceride; EE=ethyl-ester; TG=triglyceride; PL=phospholipid
Laidlaw et al., 2014

It is likely, however, that if subjects were advised to take the EE supplement with a fatty meal then the incorporation into red blood cells would be similar if not equal to that of rTG
Whilst a dose of 1.1g rTG oil for 28 days raised the omega-3 index from 4.1% (high risk) to 6.8% (lower risk), it failed to reach the desirable target value for the omega-3 index set at ≥8%
Krill oil and standard triglyceride oil used as the manufactures’ recommendations failed to have a significant impact on either the omega-3 index or the AA to EPA ratio
The form and dose of fish oil is significant when addressing the efficacy of that oil in its ability to impact on biomarkers related to cardiovascular and inflammatory health, such as the omega-3 index and the AA to EPA ratio
Laidlaw et al. 2014
A randomised clinical trial to determine the efficacy of manufacturers’ recommended doses of omega-3 fatty acids from different sources in facilitating cardiovascular disease risk reduction

Based on the model by Flock et al. 2013
Flock highlights the importance of body weight!
For a 77kg individual to raise their omega-3 index from 4.2% to 8% they would need a daily dose of 16mg/kg omega-3 (equivalent to 1.25g)
Total omega-3
mg/kg (based on 77kg individual)
Concentrated fish oil (rTG) 1100 14
Concentrated fish oil (EE 984 13
Salmon oil (TG) 400 5
Krill oil (PL) 240 3
Pharmepa RESTORE (rTG) 1000 13

Biomarkers for personalising omega-3 fatty acid dosing
Omega-3 index an early cardiovascular risk indicatorOmega-6 to omega-3 ratio an established marker of long-term health and chronic illnessAA to EPA ratio a measure of ’silent’ or chronic inflammation
A personalised plan aims to achieve:An omega-3 index of more than 8% An omega-6 to omega-3 ratio of between 3 and 4An AA to EPA ratio of between 1.5 and 3
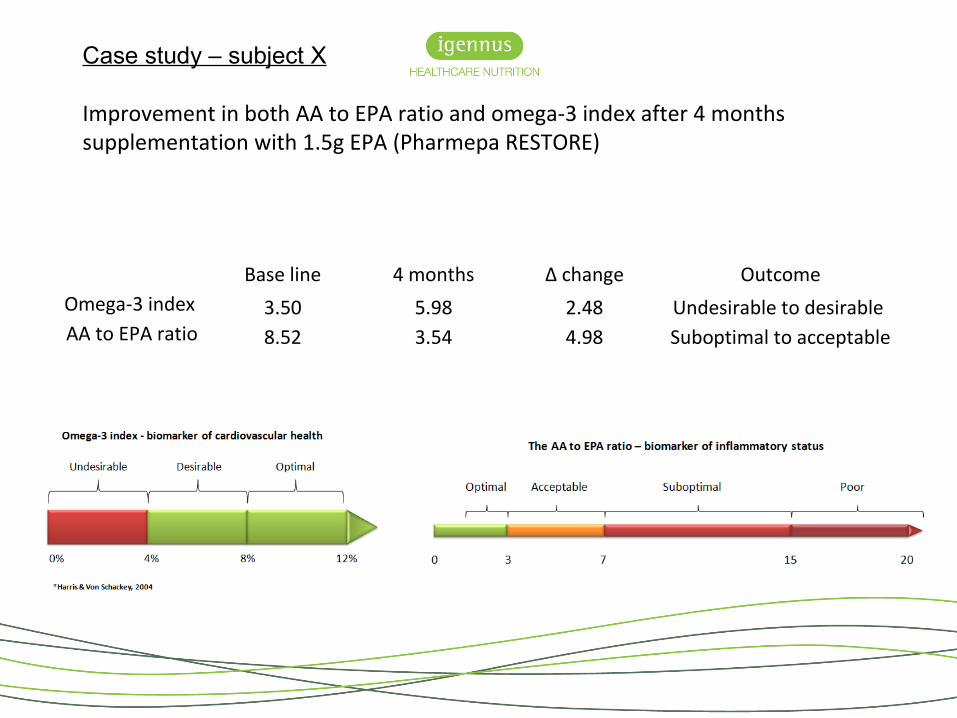
Base line 4 months ∆ change OutcomeOmega-3 index 3.50 5.98 2.48 Undesirable to desirable AA to EPA ratio 8.52 3.54 4.98 Suboptimal to acceptable
Case study – subject X
Improvement in both AA to EPA ratio and omega-3 index after 4 months supplementation with 1.5g EPA (Pharmepa RESTORE)

Dose omega-3 (g/day) AA to EPA ratio
Om
ega-
3 in
dex
(%)
High consumption of fatty fish is associated with a reduced risk for breast cancer, and intake of omega-3 fatty acids from fish is inversely associated with breast cancer risk
Omega-3 Fatty acid supplements in women at high risk of breast cancer have dose-dependent effects on breast adipose tissue fatty acid composition
Lee et al., 2010

The seAFOod Polyp Prevention Trial
The standard treatment to identify and remove bowel polyps is via colonoscopy. The removal of bowel polyps reduces future bowel cancer risk but it is not 100% effective at preventing bowel cancer.
The primary aim of the study is to determine if 2g EPA daily (as rTG), prevents the development of colorectal adenomas, either alone or in combination with aspirin
Is EPA an effective way to reduce bowel polyps and so reduce future bowel cancer risk?

The seAFOod Polyp Prevention Trial
Participants are 55–73 year-old patients, who have been identified as ‘high risk’ (detection of ≥5 small adenomas or ≥3 adenomas with at least one being ≥10 mm in diameter) at screening colonoscopy in the English Bowel Cancer Screening Programme (BCSP)
Improving interventions
rTG = highly bioavailable
2g EPA = high dose
12 month intervention
Omega-3 index and AA to EPA ratio levels taken at base line and at the end of the intervention period

Summary
Human intervention studies show inconsistent findings which may in some cases be explained by poor bioavailability of fish oils used, coupled with variation in subject baseline levels, as well as other factors associated with inter-individual variability
Dose response studies show us that high doses of omega-3 are generally required to achieve omega-3 index ≥8%, especially where the baseline levels are suboptimal ≤4%
It is clear that inter-individual variability in response to supplementation exists
Researchers are addressing factors that influence treatment-associated changes that are derived from intervention

Summary
Not all ‘fish oils’ are the same – acknowledge the significance of bioavailability on reaching an omega-3 index ≥8% and reducing the AA to EPA ratio ≤3
Knowledge of baseline levels will guide the practitioner recommendations—not surprisingly, low baseline values may require a larger dose than a high baseline value!
Monitor levels routinely to identify compliance/progress/absorption
Emphasis should focus more on the need for personalising omega-3 fatty acid dosing for clinical outcomes


ReferencesAbbott SK, Else PL, Atkins TA, Hulbert AJ: Fatty acid composition of membrane bilayers: importance of diet polyunsaturated fat balance. Biochimica et biophysica acta 2012, 1818:1309-1317.
Arab L: Biomarkers of fat and fatty acid intake. The Journal of nutrition 2003, 133 Suppl 3:925S-932S.
Azrad, M., C. Turgeon, et al. (2013). "Current Evidence Linking Polyunsaturated Fatty Acids with Cancer Risk and Progression." Frontiers in oncology 3: 224.
Block RC, Harris WS, Pottala JV: Determinants of Blood Cell Omega-3 Fatty Acid Content. The open biomarkers journal 2008, 1:1-6.
Davidson MH, Johnson J, Rooney MW, Kyle ML, Kling DF: A novel omega-3 free fatty acid formulation has dramatically improved bioavailability during a low-fat diet compared with omega-3-acid ethyl esters: the ECLIPSE (Epanova((R)) compared to Lovaza((R)) in a pharmacokinetic single-dose evaluation) study. Journal of clinical lipidology 2012, 6:573-584.
Flock MR, Skulas-Ray AC, Harris WS, Etherton TD, Fleming JA, Kris-Etherton PM: Determinants of erythrocyte omega-3 fatty acid content in response to fish oil supplementation: a dose-response randomized controlled trial. J Am Heart Assoc 2013, 2:e000513.
Flock MR, Skulas-Ray AC, Harris WS, Gaugler TL, Fleming JA, Kris-Etherton PM: Effects of supplemental long-chain omega-3 fatty acids and erythrocyte membrane fatty acid content on circulating inflammatory markers in a randomized controlled trial of healthy adults. Prostaglandins Leukot Essent Fatty Acids 2014, 91:161-168.
Harris WS, Pottala JV, Varvel SA, Borowski JJ, Ward JN, McConnell JP: Erythrocyte omega-3 fatty acids increase and linoleic acid decreases with age: observations from 160,000 patients. Prostaglandins, leukotrienes, and essential fatty acids 2013, 88:257-263.
Harris WS, Von Schacky C: The Omega-3 Index: a new risk factor for death from coronary heart disease? Prev Med 2004, 39:212-220.

ReferencesHulbert AJ, Turner N, Storlien LH, Else PL: Dietary fats and membrane function: implications for metabolism and disease. Biological reviews of the Cambridge Philosophical Society 2005, 80:155-169.
Kagan I, Cohen J, Stein M, Bendavid I, Pinsker D, Silva V, Theilla M, Anbar R, Lev S, Grinev M, Singer P: Preemptive enteral nutrition enriched with eicosapentaenoic acid, gamma-linolenic acid and antioxidants in severe multiple trauma: a prospective, randomized, double-blind study. Intensive care medicine 2015.
Kohler A, Bittner D, Low A, von Schacky C: Effects of a convenience drink fortified with n-3 fatty acids on the n-3 index. The British journal of nutrition 2010, 104:729-736.
Roke K, Mutch DM: The role of FADS1/2 polymorphisms on cardiometabolic markers and fatty acid profiles in young adults consuming fish oil supplements. Nutrients 2014, 6:2290-2304.
Sands SA, Reid KJ, Windsor SL, Harris WS: The impact of age, body mass index, and fish intake on the EPA and DHA content of human erythrocytes. Lipids 2005, 40:343-347.
Silva V, Green P, Singer P: Membrane fatty acid composition of different target populations: importance of baseline on supplementation. Clinical Nutrition 2014 33:206
Udani JK, Ritz BW: High potency fish oil supplement improves omega-3 fatty acid status in healthy adults: an open-label study using a web-based, virtual platform. Nutrition journal 2013, 12:112.
von Schacky C: Omega-3 fatty Acids in cardiovascular disease - An uphill battle. Prostaglandins, leukotrienes, and essential fatty acids 2015, 92:41-47.
Yee LD, Lester JL, Cole RM, Richardson JR, Hsu JC, Li Y, Lehman A, Belury MA, Clinton SK: Omega-3 fatty acid supplements in women at high risk of breast cancer have dose-dependent effects on breast adipose tissue fatty acid composition. The American journal of clinical nutrition 2010, 91:1185-1194.

If blood cell omega-3 content is to be used as a risk factor, then the factors that influence this marker need to be elucidated
Consequently, knowledge of baseline levels will guide the practitioner recommendations—not surprisingly, low baseline values may require a larger dose than a high baseline value
Therefore, the omega-3 index and the AA to EPA ratio may be useful for assessing both baseline risk and a change in risk as a function of intake
Treatment-associated changes that are derived from intervention are dependent on the initial omega-3 and omega-6 fatty acid status
Harris & von Schacky 2004