personality, iq, and lifetime earningsweb.econ.ku.dk/gensowski/research/terman/terman.pdf · with...
TRANSCRIPT

Personality, IQ, and Lifetime Earnings
Miriam Gensowski
University of Copenhagen, Dep. of Economics, and CEBI, Center for Economic Behavior and Inequality,1 and IZA
Øster Farimagsgade 5, 1353 Copenhagen K, Denmark. Tel +45 35 32 30 36
Abstract
This paper estimates the effects of personality traits and IQ on lifetime earnings of the men andwomen of the Terman study, a high-IQ U.S. sample. Age-by-age earnings profiles allow a study ofwhen personality traits affect earnings most, and for whom the effects are strongest. I document aconcave life-cycle pattern in the payoffs to personality traits, with the largest effects between theages of 40 and 60. An interaction of traits with education reveals that personality matters mostfor highly educated men. The largest effects are found for Conscientiousness, Extraversion, andAgreeableness (negative), where Conscientiousness operates partly through education, which alsohas significant returns.
Keywords: personality traits, socio-emotional skills, cognitive skills, returns to education,lifetime earnings, Big Five, human capital, factor analysisJEL: J24, I24, J16
1The activities of CEBI are financed by a grant from the Danish National Research Foundation. This paper andother versions of it have benefited immensely from discussions with numerous seminar participants. I am very gratefulto everyone who provided helpful feedback, especially James J. Heckman, Steven N. Durlauf, and Gary S. Becker,Remi Piatek, Mathilde Almlund, Katarına Borovickova, Deborah Cobb-Clark, Pia Pinger, Stefanie Schurer, JeffreySmith, Lucas Threinen and Philipp Eisenhauer. I am also indebted to Peter Savelyev, who generously shared hisknowledge of the Terman data, and to Min Ju Lee and Molly Schnell who provided outstanding research assistancein the project’s earlier stages.
Preprint submitted to Labour Economics January 8, 2018

A growing economics literature documents effects of socio-emotional skills, often called non-cognitive skills, on life outcomes ranging from wages to health—see summaries in Borghans et al.(2008) or Almlund et al. (2011). Labor market outcomes, in particular, have been shown tobe influenced by skills such as self-control (Moffitt et al., 2011), Conscientiousness (Uysal andPohlmeier, 2011; Prevoo and ter Weel, 2015), Self-esteem, or Locus of Control (Heckman et al.,2006b; Caliendo et al., 2015). This paper contributes to the body of work that studies how earningsare affected by personality traits. Personality trait measures, such as the Big Five (McCrae andJohn, 1992), are a popular way of proxying socio-emotional skills. This paper provides evidenceon when in the life cycle personality traits are most important and for whom they have the largesteffects.
The data that make this analysis possible come from the seminal Terman study (Terman, 1992).This survey was initiated in 1922 in California and followed a group of high-IQ men and womenfrom childhood to old age. While it has been widely used for research in psychology, this paper isthe first to have generated earnings profiles for ages 18 to 75 from the different waves. It combinesmeasures on IQ and personality traits in early waves with a very long follow-up. The Terman studyalso contains rich background information on each participant.
The question of when personality traits matter can be addressed with the detailed age-by-ageearnings measures. For most traits, the earnings effects have a hump-shaped pattern: early inthese men’s careers, the effects of personality traits are barely visible, but become large in theirprime working years. Insofar as this life-cycle pattern is due to general mechanisms that are notspecific to high-IQ individuals, these analyses could, for example, inform the forecasting of lifetimeeffects of skill-building interventions that target socio-emotional skills related to the personalitytraits observed here.
To test for heterogeneous effects of traits on earnings, I interact personality traits with educa-tion. I find statistically and economically meaningful interactions. The payoffs to two importanttraits, Conscientiousness and Extraversion, are more than twice as large for men with a graduatedegree than for men with a bachelor’s or less. Another interpretation of this interaction is that theearnings gain from higher education is larger for men who possess stronger socio-emotional skills.Most of the existing studies do not allow for a trait-education interaction, and may therefore over-or under-estimate these effects of personality traits conditional on education.
With the Terman survey, the relationship between personality traits and earnings can be studiedin a more detailed way than is possible elsewhere, and it fills out our understanding of the age-pattern and the interaction with education. Yet the Terman sample is not representative of thegeneral population, and was never intended to. Therefore, this study also adds to our knowledgeabout what determines lifetime earnings of individuals with top IQs—usually, sample sizes are toosmall to identify the intellectual elite. For example, it is not clear whether high-IQ children wouldbenefit from improving socio-emotional skills. Many socio-emotional-skill building interventionsare targeted at disadvantaged, and sometimes low-IQ, populations (s.a. Heckman et al., 2010,2013; Grossman and Tierney, 1998; University of Chicago Crime Lab, 2012). This paper showsthat high-IQ children also significantly benefit from positive personality traits later in life, and thatthey can expect positive returns to education.
The study of the high-IQ women in the Terman data is of interest as well, albeit of a ratherhistorical nature, as they can be less easily compared to current cohorts. Only about half ofthe women of the Terman sample were securely attached to the labor force, and many relied onhusbands as bread-winners. I therefore study women’s family earnings, and demonstrate how
2

women’s own and husband’s earnings reacted differently to women’s personality traits.Methodologically, this paper addresses a common problem to research on personality traits:
whenever personality scores are used as regressors, measurement error bias is introduced becausetrue personality is always unobserved. Instead, predicted scores of personality traits are used, andthe prediction will contain some noise. An adjustment has been suggested (Bolck et al., 2004;Croon, 2002), which I develop further to apply it to a setting where the variable measured witherror is interacted with an indicator for education.
1. The Terman Survey
The Terman survey was initiated by the prominent psychologist Lewis Terman to study the lifeoutcomes of high IQ children. His team canvassed all schools in California, grades 1-8, in 1921-1922, to enrol children who scored in the top 0.5% of the IQ distribution. The sample consists of856 boys and 672 girls, born around 1910, and who were followed until 1991, with surveys every5–10 years.2 It is the longest prospective cohort study that also has data on earnings.
The Terman data have been used extensively by psychologists to study health and longevity, inrelation to Conscientiousness and parental divorce or marriage.3 Only few economists have workedwith the data, focusing on family outcomes (marriage, divorce, fertility - see Michael, 1976; Beckeret al., 1977; Tomes, 1981), retirement behavior (Hamermesh, 1984), and health (Savelyev, 2014;Savelyev and Tan, 2015). Earnings outcomes were studied by Leibowitz (1974), but she did notexploit the longitudinal data.
Drawing on the different waves of the survey, I construct earnings histories from age 18 to 75,as well as education and marriage profiles, for each participant. The age-by-age information stemsfrom the feature that for many of the waves, respondents were asked about earnings in each of the4 previous years separately. Earnings are imputed through linear interpolation for years withoutinformation. The earnings measures for all estimations are annual earnings after tuition in 2010U.S. Dollars (CPI adjusted), truncated at the 97th percentile, before tax.4 For inactive workers,as well as for the deceased, earnings are zero. For female participants, the Terman survey askedabout their spouse’s earned income. Family earnings can thus be constructed as the sum of ownearnings and the husband’s earnings, which are zero if the woman was not married.
The personality information in the Terman data stems from teachers and parents, who ratedthe participants on certain traits and behaviors in 1922, and from participants, who providedself-ratings on other items in 1940 (at around age 30). An exploratory factor analysis on allavailable items5 reveals a structure that is remarkably similar to traits in the well-known BigFive taxonomy: Openness to Experience, Conscientiousness, Extraversion, Agreeableness, andNeuroticism (OCEAN). Even though the Terman measures were taken about 70 years before the
2Attrition is below 10%, and it is unrelated to income, education, demographic factors (Sears, 1984), or psycho-logical measures (Friedman et al., 1993).
3Cf Friedman et al. (1993); Tucker et al. (1996); Friedman (2008); Martin et al. (2005).4A Web Appendix to this paper, hosted at http://www.econ.ku.dk/gensowski/research/Terman/TermanApp.pdf,
contains more detailed information on the data construction, estimation, and supplementary figures and tables. Sec-tion A describes the construction of the earnings profiles and tuition costs, and Section A.7 shows their distributions.
5The teacher and parent ratings are averaged within each item. In exploratory factor analysis, the researcherobserves the covariance structure of the items, and determines the number of factors that capture most of theobserved variation, as well as which items are associated with which factor. For the full list of items of all traits, seeSection B.2 in the Web Appendix.
3

Big Five were codified (Goldberg, 1993), the factors correspond closely to these traits, measuredfor example by the NEO PI-R (Martin and Friedman, 2000).
Openness to Experience, the “tendency to be open to new aesthetic, cultural, or intellectualexperiences” (American Psychological Association, 2007), was measured in 1922 by ratings fromteachers and parents on descriptors such as “desire to know” or “originality.” Extraversion wasindicated by the subject’s “fondness for large groups,” “leadership,” and “popularity with otherchildren,” also in 1922. The remaining traits are based on self-ratings in 1940. Conscientiousnessdescribes an individuals’ persistence, order, and need for achievement. In Terman, it is measuredwith “How persistent are you in the accomplishment of your ends?” or “In your work do you usuallydrive yourself steadily?”. Agreeableness describes cooperation and a preference for harmoniousrelationships over antagonistic behavior. An example measure is “In general, how easy are youto get on with?”. Neuroticism, the opposite of emotional stability, is based on questions suchas “Are you moody?”. These personality traits are summarized by factor scores (Joreskog andSorbom, 1979; Mulaik, 2010), and predicted with the Bartlett method (Bartlett, 1937). Each itemis allowed to load on exactly one factor, and this dedicated factor structure guarantees identificationof possibly correlated factors. In a few cases where not all personality items are observed, they areimputed with a multiple imputation routine exploiting the covariance with the other factors.
IQ was measured at study entry in 1922.6 Scoring at 140 or higher, which corresponds to beingin the top 1 of 200 children, was the criterion for being included in the study. Even though theTerman survey is selective in terms of IQ, it is not so for personality, as Martin and Friedman(2000) show. Generally, personality traits correlate only weakly with IQ (cf Dauber and Benbow,1990). Only Openness is moderately positively correlated with IQ, at 0.2 in the Terman sample.
In this paper, earnings throughout the life cycle are associated with traits that were onlyassessed at a single point in time. This can be an informative exercise if these measures are goodproxies for personality traits at other points in the Terman participants’ lives, if they are highlycorrelated across time. Empirically, there is extensive evidence on such stability of traits: the rankorder correlation of traits within one person over very long time spans is remarkably high (Leonet al., 1979; Costa and McCrae, 1994; Roberts and DelVecchio, 2000; Robins et al., 2001; Robertset al., 2006), and even from adolescence to adulthood there is “more stability than change” (Robertset al., 2001). That means that someone who scores in the top decile of the distribution in one traitis quite likely to score in the top again when surveyed years later. Personality type consistency is
6The standard test was the Stanford-Binet IQ test that Terman himself had recently developed (Terman, 1916).Some of the participants took the closely related “Terman Group Test”, specifically designed for screening thesehigh achieving children (see Chapter I in Terman and Sears, 2002). Its scale was such that scores are comparable.In the subsequent analyses, I always allow for the possibility that there were differences between the two measuresof IQ, by including an interaction with test type. The coefficients of the two tests are never statistically differentfrom each other. The well-known Stanford-Binet IQ test has naturally undergone updates throughout its life time,notably to make it less verbally loaded, to measure domain-specific ability (such as verbal vs. quantitative), andto extend the age ranges to children younger than six and adults (overview in Becker, 2003). The latter is notof concern to the sample here, as the students were in the appropriate age range the test was designed for. Theworry about a strong verbal content in an IQ test is that it puts children from non-native English households orfrom different cultural backgrounds at a disadvantage. In the selected sample at hand, this would imply that theseusually disadvantaged children would have a higher IQ than their score lets us believe. In all analyses, this papercontrols for parental immigrant status, and excludes non-Caucasian participants to address this potential bias. Theoriginal Stanford-Binet was only concerned with assessing general ability, which is conceptualized as the aggregateof domain-specific abilities. It is therefore the ultimate summary measure. Given that the current analysis mostlyviews IQ, within a rather restricted range, as a control variable, controlling for the general version seems appropriate,making the loss of specificity a small one.
4

quite high (Specht et al., 2014).7 The question of the rank order stability of traits remains activelydebated in personality psychology, and there is more nuanced evidence: Some events decrease therank stability, and stability generally follows an inverted U-shape for most traits, with the moststability between age 40-60 (Specht et al., 2011; Lucas and Donnellan, 2011). This implies thatin Terman, where traits were measured around age 12 and age 30, these early measures of traitswould be relatively noisy proxies for ages both before and after they were measured. It does notimply that they can not be used as proxies, however, since the range of rank stability remains high,between .55 at its lowest to .75 at its highest (Specht et al., 2011). Thus, this paper assumes thatmeasures at one point in time can proxy personality before and after this measurement. Whilethere are some voices in the personality psychology debate who argue that most of personality issituational—that there is very little stable information content—the evidence for important long-run associations of traits with later life outcomes is overwhelming, based on both observational andexperimental data (Heckman et al., 2013; Moffitt et al., 2011; Spengler et al., 2015) and controllingfor common family factors (Fletcher, 2013).
The Terman survey’s control variables include father’s and mother’s background information(education, occupation group indicators, social status, region of origin, age at birth of subject),family environment (family’s finances when growing up, number of siblings, birth order), and earlychildhood health (birth weight, breastfeeding, sleep quality in 1922). They are summarized inTable 1. The estimation sample consists of 595 men and 422 women of the standard sample. Forthese individuals, personality items are given and all covariates are measured. Only Caucasianparticipants without hereditary diseases are included to ensure a homogenous sample. The fullselection procedure is described in the Web Appendix, Section A.6.
2. The Overall Association of Personality Traits and IQ with Lifetime Earnings
The first order of business must be to establish the overall association of personality traits withlifetime earnings in Terman, conditioning on baseline covariates. This overall association would becomprised of both direct effects of these traits on wages, as well as any intermediate outcomes oftraits that also drive earnings. Examples of such intermediate outcomes are working hours, health,retirement age, and education. Education plays a particular role in the literature, therefore it willbe discussed explicitly in Section 3.
2.1. Total Lifetime Earnings
Begin with the most aggregated form of earnings, the sum of earnings over the life span betweenage 18 and 75. Regress this sum, Y , on personality traits and IQ (in vector θ), and all covariatesfrom Table 1 in X.
Y = θδ +Xβ + ρ (1)
The parameters of interest are in δ, where β are the coefficients on covariates, and ρ is the remainingerror term. In this linear OLS specification,8 a specific type of bias can be corrected: it arises
7At the same time, there is consensus in the literature that personality itself changes across the life span, inspecific mean-level maturation patterns (Soto et al., 2011).
8The results here are robust to other estimator types, as shown in Web Appendix Section C.8, but OLS is lessdata hungry than nonparametric estimators and therefore more suited to the relatively small Terman sample.
5
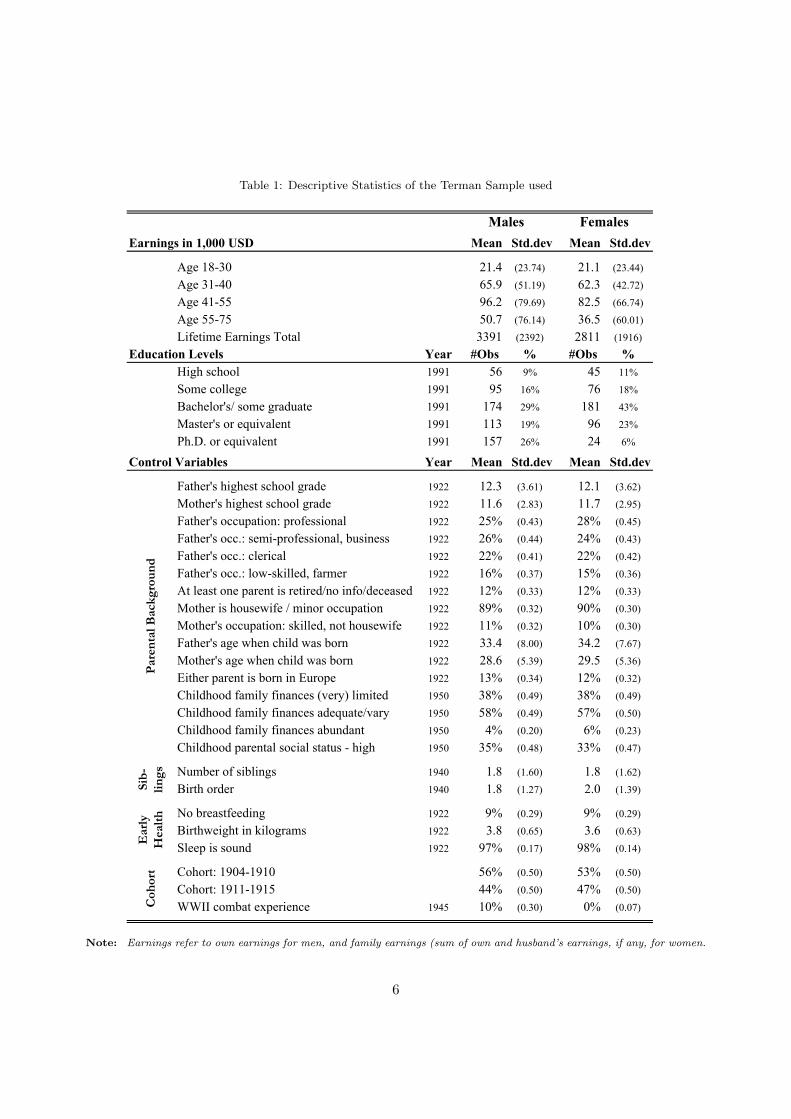
Table 1: Descriptive Statistics of the Terman Sample used
Earnings in 1,000 USD Mean Std.dev Mean Std.dev
Age 18-30 21.4 (23.74) 21.1 (23.44)
Age 31-40 65.9 (51.19) 62.3 (42.72)
Age 41-55 96.2 (79.69) 82.5 (66.74)
Age 55-75 50.7 (76.14) 36.5 (60.01)
Lifetime Earnings Total 3391 (2392) 2811 (1916)
Education Levels Year #Obs % #Obs %High school 1991 56 9% 45 11%
Some college 1991 95 16% 76 18%
Bachelor's/ some graduate 1991 174 29% 181 43%
Master's or equivalent 1991 113 19% 96 23%
Ph.D. or equivalent 1991 157 26% 24 6%
Control Variables Year Mean Std.dev Mean Std.dev
Father's highest school grade 1922 12.3 (3.61) 12.1 (3.62)
Mother's highest school grade 1922 11.6 (2.83) 11.7 (2.95)
Father's occupation: professional 1922 25% (0.43) 28% (0.45)
Father's occ.: semi-professional, business 1922 26% (0.44) 24% (0.43)
Father's occ.: clerical 1922 22% (0.41) 22% (0.42)
Father's occ.: low-skilled, farmer 1922 16% (0.37) 15% (0.36)
At least one parent is retired/no info/deceased 1922 12% (0.33) 12% (0.33)
Mother is housewife / minor occupation 1922 89% (0.32) 90% (0.30)
Mother's occupation: skilled, not housewife 1922 11% (0.32) 10% (0.30)
Father's age when child was born 1922 33.4 (8.00) 34.2 (7.67)
Mother's age when child was born 1922 28.6 (5.39) 29.5 (5.36)
Either parent is born in Europe 1922 13% (0.34) 12% (0.32)
Childhood family finances (very) limited 1950 38% (0.49) 38% (0.49)
Childhood family finances adequate/vary 1950 58% (0.49) 57% (0.50)
Childhood family finances abundant 1950 4% (0.20) 6% (0.23)
Childhood parental social status - high 1950 35% (0.48) 33% (0.47)
Number of siblings 1940 1.8 (1.60) 1.8 (1.62)
Birth order 1940 1.8 (1.27) 2.0 (1.39)
No breastfeeding 1922 9% (0.29) 9% (0.29)
Birthweight in kilograms 1922 3.8 (0.65) 3.6 (0.63)
Sleep is sound 1922 97% (0.17) 98% (0.14)
Cohort: 1904-1910 56% (0.50) 53% (0.50)
Cohort: 1911-1915 44% (0.50) 47% (0.50)
WWII combat experience 1945 10% (0.30) 0% (0.07)
Males Females
Sib
-lin
gsE
arly
H
ealt
h
Coh
ort
Par
enta
l Bac
kgro
un
d
Note: Earnings refer to own earnings for men, and family earnings (sum of own and husband’s earnings, if any, for women.
6

Table 2: The Total Association of Traits with Lifetime Earnings
Men Women
Own Earnings Family EarningsUSD % [CI] USD % [CI] USD % [CI]
Openness −102.2 −3.0 [-338.0; 93.2∗ 13.3 [-7.9; −141.2 −5.0 [-490.6;114.7] 220.2] 117.3]
Conscientiousness 567.0∗∗∗ 16.7 [328.0; 155.3∗∗∗ 22.2 [62.4; 212.7∗ 7.6 [-37.8;832.5] 284.2] 505.4]
Extraversion 490.1∗∗∗ 14.5 [260.0; −56.9 −8.1 [-183.2; 284.6∗∗ 10.1 [13.4;773.8] 40.1] 664.7]
Agreeableness −267.6∗∗ −7.9 [-570.5; −63.2 −9.0 [-203.3; 72.1 2.6 [-234.2;-6.4] 46.3] 403.0]
Neuroticism −12.4 −0.4 [-186.3; −76.0∗ −10.9 [-164.1; 13.4 0.5 [-193.1;185.6] 2.8] 219.9]
IQ 184.1∗∗ 5.4 [22.5; 2.5 0.4 [-66.4; −44.1 −1.6 [-231.2;367.7] 64.3] 172.6]
Mean Life Earn. 3390.5 700.0 2811.1
Note: Standardized coefficients of traits from regressing total lifetime earnings in thousand USD (2010), ages 18 to 75, on the
full set of control variables in Table 1, not educational attainment (cf. Eq. (1)). The “%”-columns express the effect as a share
of mean lifetime earnings, and “CI” are the observed 5th and 95th percentiles of the corresponding bootstrap distribution to
allow for asymmetric confidence bands, from 1000 paired replications. Asterisks indicate p-values, the probability of observing
an absolutely larger value of the test statistic under a Null hypothesis of no effect on average, with ∗(p < .10),∗∗ (p <
.05),∗∗∗ (p < .01). Number of observations: 595 men, 422 women.
because factor scores for personality traits are predicted on the basis of estimates of a factormodel, so their values contain prediction uncertainty and have higher sample variance than thetrue factors. This attenuation bias is often ignored by economists using predicted factor scores,which might explain insignificant effects of these factor scores (see the discussion in Thiel andThomsen, 2013). I correct for this estimation error with the method suggested by Croon (2002).It consists of characterizing the bias precisely and pre-multiplying the point estimates with theinverse of an estimate of the bias term, which uses the covariance of the true factors from the factorestimation. All regression results in this paper are corrected for this bias, and all standard errors arebootstrapped non-parametrically, following standard practice (Bolck et al., 2004), because regularstandard errors do not take account of the prediction variance and the fact that the measurementsystem is estimated. A bootstrap distribution obtained from 1000 draws is used to report standardbootstrap p-values and bootstrap percentile confidence bands. These are preferred to symmetricconfidence bands using standard errors because the bootstrap distribution is not gaussian, andwith asymmetric distributions and slightly heavy tails, application of standard hypothesis testsusing standard errors is inappropriate.
The results of this regression, in Table 2, demonstrate that, conditional on IQ and familybackground characteristics, there are statistically and economically significant associations be-
7

tween personality traits and lifetime earnings. Men who score one standard deviation higher onConscientiousness have over half a million USD higher lifetime earnings, a sum of $567,000 thatcorresponds to 16.7% of average lifetime earnings. The association of Extraversion with men’searnings is almost as large, at $490,100. For women’s family earnings, the two traits of Consci-entiousness and Extraversion also have the largest associations, even if their magnitude is smallerthan for men, at $212,700 and $284,600, respectively.9 Generally, the positive effects of the twotraits of Extraversion and Conscientiousness are expected: Conscientiousness is directly linked toproductivity (Cubel et al., 2016), and it is consistently associated with increased wages (Judgeet al., 1999) and better job performance (see Salgado, 1997 and the meta-analyses of Barrick andMount, 1991 and Mount et al., 1998). Extraversion also has been found to increase job perfor-mance, particularly in management and sales occupations (Barrick and Mount, 1991), and it ispositively correlated with leadership ability (meta-analysis in Judge et al., 2002).
More agreeable men earn significantly less. Agreeableness increasing by one standard deviationis associated with a reduction of about 8% of lifetime earnings, or $267,600. This might be sur-prising when thinking about which personality traits are likely to be valued by employers. Moreagreeable employees are less antagonistic and more likely to act towards others’ interests insteadof their own, therefore they are more likely to cooperate with the employer (Bowles et al., 2001).They also perform better in teamwork situations (Mount et al., 1998). However, these workersmight not be rewarded for their agreeableness because they could be less aggressive in wage bar-gaining. It is also possible that agreeable individuals select into lower-paying occupations, or thatthey have lower manipulative power, or ‘Machiavellian intelligence’ (Turner and Martinez, 1977,pointed out by Nyhus and Pons, 2005). Neuroticism is expected to decrease earnings. More secureand less anxious workers have better job performance (Barrick and Mount, 1991; Salgado, 1997;Mount et al., 1998). Self-esteem, which has been linked to emotional stability (Judge et al., 1998),has been shown to have positive effects on wages (Murnane et al., 2001; Goldsmith et al., 1997).In the Terman sample, however, there is no evidence of this negative association for men, onlywomen’s own earnings. Subsequent sections will provide suggestive evidence that the men’s nullfinding hides heterogeneity by education.
IQ has a positive association with earnings for men of this sample—a possibly surprising resultgiven the range of IQ in Terman, which compares very-high-IQ individuals to even-higher-IQindividuals. The positive significant coefficient of $184,100, a 5% increase in lifetime earnings,clearly contradicts statements made in Gladwell (2008) that for the Terman men, IQ does notmatter empirically once family background and other observable personal characteristics are takeninto account. The popularized view that “past a certain threshold, having even higher IQ does notmatter” has already been contradicted before (Lubinski, 2016).
For a causal interpretation of these global associations in Table 2, several assumptions arenecessary that will be discussed in turn. Generally, one would have to assume that no unobservedvariables remain that are correlated with both personality traits and earnings. Typical candidatesfor this worry are family background or other skills. This paper relies on a “selection on observables”or matching assumption. This approach exploits the unique strengths of the Terman data: allregressions include control variables for family background, respondent information, IQ, and allpersonality traits simultaneously.
Education could be highlighted as one possible omitted variable: One would worry that higher
9There are remarkable differences between the association of traits with women’s own and their family earnings.They are better understood in the context of education and marriage—a discussion postponed to Section 4.
8

education fosters Conscientiousness, and that the association of Conscientiousness with earningsreflects actually only a return to education—because Conscientiousness is measured when manyhave completed their education. While this is a worry that cannot be addressed directly withthe data at hand, there is no evidence that Conscientiousness is fostered in higher education(Kassenboehmer et al., forthcoming; Schurer, 2017), and on the contrary there is something inherentin Conscientiousness that directly improves productivity (Cubel et al., 2016). The only trait thatseems to be increased through schooling is Extraversion (Dahmann and Anger, 2014), which ismeasured at around age 12 in Terman, when all participants are still in compulsory schooling.
Another specific concern to the current setting is reverse causality and timing. Adult traitscould be influenced by prior labor market success. If personality traits are measured before theoutcome, this concern is alleviated (cf Piatek and Pinger, 2016). In Terman, three skills aremeasured at around age 12, clearly before labor market entry (IQ, Openness to Experience, andExtraversion). Three traits are measured in 1940, when participants are around 30 years old:Conscientiousness, Agreeableness, and Neuroticism. It is indeed possible that the associations inTable 2 partially reflect effects of early earnings on these three traits. Theoretically, it can benoted that for the reverse causality to be dominant, the following would need to hold: The traitsprior to 1940 would have to be relatively unrelated to the 1940 measurement (low rank stability),or the early earnings would have to be relatively unrelated to the early traits, and at the sametime there would have to be a strong effect of a random early wage shock on subsequent traits in1940. Empirically, there is little evidence for such a strong relationship of previous earnings ontraits. Cobb-Clark and Schurer (2013) show that Locus of Control, another socio-emotional skill,does not change systematically with labor market or health events. In Judge et al. (1999), thecorrelations of Big Five traits with adult income and occupational status are practically identicalbetween childhood personality measures and measures taken in adulthood. Furthermore, I testwhether conditioning the 1940 traits on early labor market success alters the results, but it doesnot (see Section C.7 in the Appendix).
2.2. Life-Cycle Pattern of the Overall Effect by Age
With these caveats in mind, we can proceed to study when in a working life personality traitsmatter most. Equation (1) can be estimated for each age separately, as in
Yt = θδt +Xβt + ρt for t = 1, . . . , T. (2)
Figure 1 shows the corresponding estimates for men (for women, the patterns are very similar butnoisier, see Web Appendix Section C.2). The age-specific effects of Conscientiousness, Extraversion,and IQ only begin to materialize when workers are in their early thirties. Then, the effects continueto increase throughout their forties, up to $10,000-$20,000 annually, for an increase by one standarddeviation. At younger ages, the effects of traits are small and insignificant. Similar patterns havebeen found for cognitive ability by Hause (1972), Farber and Gibbons (1996), and Altonji andPierret (2001).10 Socio-emotional skills have also been found to have effects on earnings thatincrease with age in Kuhn and Weinberger (2005), as leadership skills’ effects only begin to emerge“some 7 to 8 years after high school.”
10These authors approximate cognitive ability with performance on achievement tests that are not only driven bycognitive ability. See Almlund et al. (2011) for a discussion of the non-cognitive component of achievement tests.
9

Figure 1: The Overall Effect of Personality and IQ on Earnings, Men
Openness Agreeableness
Extraversion Neuroticism
IQ Conscientiousness
20 30 40 50 60 70 20 30 40 50 60 70
−20
−10
0
10
20
30
−20
−10
0
10
20
30
−20
−10
0
10
20
30
Participant's Age
1,00
0 U
SD
(20
10)
Note: Standardized coefficients δt from Eq. (2) on earnings after tuition, holding background factors constant. The shaded
areas are standard bootstrap 95%-confidence bands from 1000 draws.
10
Two mechanisms could explain the pattern of insignificant findings early in the career and strongeffects from age 40 to 60, both related to wage returns to skills. The first is employer learning.Increasing returns to skills could reflect the sequential revelation of a worker’s true ability (Altonjiand Pierret, 2001; Jovanovic, 1979; Miller, 1984; Farber and Gibbons, 1996). Initially, as employersdo not yet observe a person’s character traits or socio-emotional skills, they cannot price these skillsinto wages. The empirical evidence for this hypothesis is rather weak, however. The coefficientson interactions of skills with actual tenure are insignificant in Heineck and Anger (2010), Heineck(2011), and Nyhus and Pons (2005).
The second hypothesis is related to occupational sorting and hierarchies. Socio-emotional skillsmay matter meaningfully only once the worker has climbed the rungs of the ladder and is in aleadership position himself. While being extraverted and conscientious could be appreciated by hissuperiors at all levels, these traits have a reasonably larger impact on other team members and,therefore, overall productivity, once he supervises others. This explanation is more directly relatedto the nature of these socio-emotional skills.
Another explanation of the strong earnings effects later in life could be given by the link betweenpersonality and health or work effort. Both hours worked and length of working life enter the sumof annual earnings measures in Terman, as they are not log hourly wages (retired workers remainin the panel with zero earnings). Conscientiousness plays an important role for health and toincrease longevity (Friedman et al., 1993; Savelyev, 2012). More conscientious individuals are lesslikely to experience the chronic illnesses that are main predictors of mortality (Mokdad et al., 2004;Goodwin and Friedman, 2006), at least partly because they display better health-related behaviors,such as fewer activities that endanger health (Lodi-Smith et al., 2010). Consequently, they are lesslikely to retire early for health reasons (extensive margin), and may have more energy to continueworking regular hours (intensive margin).
Note that none of the suggested mechanisms, or the empirical evidence they are based on, arespecific to high-IQ individuals. Also, the concave life-cycle pattern can be found for several traitsand IQ, and has been detected in other (more representative) samples. This could suggest that themechanisms would also work in samples without Terman’s selectivity in terms of IQ, and that theycould generate the same shape of lifetime effects. To the extent that this pattern can be attributedto general mechanisms that are not specific to high-IQ individuals, the results from the Termansample could be used to extrapolate out, for example, treatment effects after early skill-buildinginterventions that do not have a long follow-up. Having access to data with both measures ofpersonality traits and IQ with long follow-up is essential to pick up on this shape of effects by age.The Terman results are also more informative of lifetime-effects than simple wage regressions atone point in time because here the intensive and extensive margins of labor supply are accountedfor in the long run.
3. Conditional Effects of Personality Traits and IQ, Men
So far, I have presented the overall association of traits with earnings, comprising numerouspotential channels. As mentioned, one channel stands out in importance: education. There ispervasive evidence that more conscientious individuals have higher educational attainment (Noftleand Robins, 2007; O’Connor and Paunonen, 2007). Piatek and Pinger (2016) argue that for Locusof Control, another facet of personality, the largest wage effects are indeed due to its effect oneducational attainment.
11

Education has a causal effect on earnings. Since personality traits influence educational attain-ment, they generate an indirect return through education. Thus, one would want to condition oneducation to establish which effect of personality traits remains as a “direct effect,” irrespectiveof education. To decompose these direct and indirect effects, consider an earnings regression forlifetime earnings Y that, in addition to traits, IQ, and observable characteristics (θ and X), con-ditions on educational attainment j, indicated by the binary variable Dj . Schooling attainment isa function of traits and characteristics in Dj (θ,X), and the total number of education levels is J :
Y = θδ +J∑j=1
κjDj (θ,X) +Xβ + ρ (3)
This formulation is a frequent specification. Most economists, in their analyses of the effects ofpersonality traits on earnings, condition on education (see Nyhus and Pons, 2005; Mueller andPlug, 2006; Heineck and Anger, 2010; Heineck, 2011; Duckworth and Weir, 2010; Fletcher, 2013).I will do the same in order to be able to compare results in this Terman cohort with the existingliterature. The typical interpretation would be that the “direct,” or conditional, effects of traitsθ are given by vector δ. The “indirect” effect would be a combination of the influence of θ onschooling Dj , and the treatment effect of schooling, κj . The indirect effect will be studied below,in Section 3.3. Despite the advantage of Eq. (3) as a comparison tool, it has to be pointed outthat is not as econometrically innocuous as it looks. When personality influences education, thecomposition of the sample within an education level is not random. Conditional on education, thedistribution of traits and unobservables may be different. This implies that a type of selection biascould be present in Eq. (3). This is related to a variant of the omitted variable problem: If someonewith low Conscientiousness, for example, obtains high education despite his low Conscientiousness,does he have a strong unobserved skill that also has a positive effect on earnings? In this case,the coefficients of Eq. (3) would underestimate the true effect of θ, because individuals with highConscientiousness would be compared to individuals with low Conscientiousness but who havestrong other skills and therefore above-average earnings. This would depress the coefficient onConscientiousness.11 Therefore, these regressions which are frequently performed can only providedescriptive evidence. The conditional coefficients can suggest relationships and point to potentialpathways through education.
3.1. Lifetime Effects, Conditional on Education
The leftmost column of Table 3 reports the standardized δ of Eq. (3), to examine the “direct”effects of personality traits on lifetime earnings for Terman men. They look very similar to Table 2,with large effects of Conscientiousness, Extraversion, and Agreeableness, and a positive effectof IQ. The coefficients on Conscientiousness and IQ are reduced relative to the unconditionalregression (f. ex. $427,900 instead of $567,000 for Conscientiousness). This is to be expected witha positive association of these traits with education, and a positive return to education. The othercoefficients remain almost unchanged—also not surprising given the low association of these traitswith education.
11The econometric challenge of accounting for both education and traits can only be properly addressed with astructural analysis (such as Heckman et al., 2006b), which would be too data-demanding for the Terman sample. Itwill therefore be left for other samples.
12

Table 3: Direct Effects of Traits on Men’s Lifetime Earnings, Conditional and Interacted with Education
Direct Effect, Eq. (3) Interacted Effect, Eq. (4) Diff. MA - BA
Openness
Conscientious.
Extraversion
Agreeableness
Neuroticism
IQ
USD % CI
−162.0 −4.8 [-415.3;
66.6]
427.9∗∗∗ 12.6 [193.3;
682.2]
485.4∗∗∗ 14.3 [265.5;
773.0]
−300.1∗∗ −8.8 [-600.5;
-39.5]
−27.6 −0.8 [-204.2;
165.7]
151.6∗ 4.5 [-17.6;
332.0]
USD % CI
≤ BA −101.6 −3.5 [-363.2;
146.9]
≥ MA −187.3 −4.7 [-576.2;
200.0]
≤ BA 247.0∗∗ 8.4 [1.0;
501.0]
≥ MA 557.5∗∗∗ 14.1 [238.2;
898.0]
≤ BA 252.6∗∗ 8.6 [1.1;
521.8]
≥ MA 667.4∗∗∗ 16.9 [335.4;
1089.6]
≤ BA −157.7 −5.4 [-445.5;
93.8]
≥ MA −408.2∗∗ −10.4 [-766.3;
-46.9]
≤ BA −160.0∗ −5.5 [-354.5;
21.7]
≥ MA 128.2 3.3 [-130.6;
429.4]
≤ BA 158.1 5.4 [-91.8;
423.3]
≥ MA 153.3 3.9 [-73.9;
409.7]
USD p
−85.7 (0.38)
310.5 (0.11)
414.8∗∗ (0.05)
−250.5 (0.17)
288.2∗ (0.06)
−4.8 (0.50)
Note: The dependent variable is total lifetime earnings in thousand USD, ages 18 to 75. The “Direct Effect” is the standardized
coefficient δ from Eq. (3), which conditions earnings on education. The “Interacted Effects” are standardized education-specific
δj from Eq. (4). “CI” are the observed 5th and 95th percentiles of the corresponding bootstrap distribution to allow for
asymmetric confidence bands, from 1000 paired replications. Columns “%” express the effects in USD as percentages of mean
lifetime earnings (education-specific for Eq. (4)). “Diff. MA-BA” lists the premium of “MA or more” (≥MA) over “BA or
less” (≤BA) from Eq. (4), and tests equality in column “p” with p-values reflecting the probability of observing an absolutely
larger value of the test statistic under a Null hypothesis of no effect on average. These p-values are also the basis for the
asterisks in the main effect columns, with ∗(p < .10),∗∗ (p < .05),∗∗∗ (p < .01). Number of observations: 595.
13
Since the Terman sample is admittedly particular—in terms of cognitive ability and cohort—itis conceivable that these effects of traits are unique to this sample. Yet they are generally in linewith other research on samples that are not selective in terms of IQ, and which are more recent: Ashere, Conscientiousness is consistently found to have a positive effect; this is shown by O’Connelland Sheikh (2011) on the basis of the NCDS, a representative panel of a 1958 birth cohort in theUK, Heineck (2011) with the UK’s BHPS, Prevoo and ter Weel (2015) with the 1970 British CohortStudy, Heineck and Anger (2010) with the representative German panel SOEP (years 1991-2006),Duckworth and Weir (2010) with the U.S. Health and Retirement Study, and many more. Theeffect of Agreeableness is also in agreement with these samples, and in addition with Mueller andPlug (2006), who use the Wisconsin Longitudinal Study (which can be considered representativefor white high school students). One of the strongest effects in the Terman sample is given byExtraversion, which also does not seem to be unique to the cohort studied here, or to high-IQmen: Most of the existing research confirms this positive association (Judge et al., 1999; Heineckand Anger, 2010; O’Connell and Sheikh, 2011; Fletcher, 2013). The null finding on Openness toExperience is unsurprising, as previous studies show mixed results: It increases earnings in Muellerand Plug (2006) and O’Connell and Sheikh (2011), but has a negative effect in Heineck and Anger(2010). Because of its positive correlation with IQ, the effect of Openness may be biased upwardin analyses that do not control for IQ (such as Heineck, 2011). The only real point of disagreementbetween the results here and the literature is about Neuroticism: It has a consistently negativeassociation with wages in Nyhus and Pons (2005); Heineck (2011); O’Connell and Sheikh (2011);Judge et al. (1999); Mueller and Plug (2006).
3.2. Lifetime Effects, Interaction with Education
Let us continue the analysis of conditional earnings effects of personality traits, but test forheterogeneous effects by educational attainment. This addresses the question of for whom traitsmatter the most. Consider the following modification of Eq. (3), where the magnitude of the“direct” effects δj may vary by educational attainment j.
Y = θ
J∑j=1
δjDj (θ,X) +
J∑j=1
κjDj (θ,X) +Xβ + ρ. (4)
Note that to correct the prediction error bias, Croon’s method needs to be expanded because of theinteraction of traits θ with education Dj . I derive the correction that accounts for this interactionin Section B.3 of the Web Appendix.
The rightmost columns of Table 3 list the δj of Eq. (4); the direct effects of traits on total lifetimeearnings interacted with two levels of education j, “Bachelor’s or less” (≤BA) and “Master’s ormore” (≥MA). A finer distinction would be desirable, but is not feasible with the relatively smallsample. The two largest positive effects, of Conscientiousness and Extraversion, reveal a patternof heterogeneity: The reward to being more conscientious or extraverted is much greater for morehighly educated men. At the graduate level (≥MA), an increase in those traits would lead to anearnings gain of $557,500 or $667,400, more than twice as much as the increase for men with abachelor’s or less ($247,000 and $252,600).12 The difference between the reward of these traits by
12In percentage terms, the difference looks smaller because they are expressed as percent of average earnings byeducation level.
14
educational level is statistically significant for Extraversion, as tested in the column “Differences.”The interaction between traits and education has previously only been tested by Nyhus and Pons(2005), who also report a positive differential, for Extraversion only.
In magnitude, the gains from an increase in one of these traits by one standard deviation iscomparable to half the value of a college degree. As Section 3.3.2 will show, the net present value ofa bachelor’s over a high school degree is $1,072,400 for Terman men. Thus, the combined value ofan increase in both Conscientiousness and Extraversion by one standard deviation would be evenlarger than the value of that degree.
With respect to Agreeableness, it seems that the negative effect is also larger for more educatedmen ($408,200 vs $157,700). The difference, however, is not statistically significant. The interac-tion also sheds light on the surprising non-negative effect of Neuroticism in the overall associationin the Terman sample. Highly educated men of this sample are indeed not punished for high Neu-roticism scores (insignificant positive coefficient), but the standard negative effect is confirmed inless educated men (significant -$160,000). The difference between the two is statistically significant.
What could explain the finding that traits have stronger effects on earnings for more educatedmen? First, it could reflect true human capital differences. Existing skills enter the productionfunction of human capital. Self-productivity of skills arises if individuals who enter school witha higher stock of human capital produce more human capital for each unit of schooling (Cunhaand Heckman, 2007), similar to the complementarity between schooling and IQ found in Hause(1972). Little will be learned at school without dedication and preparation, participation in class,interactions with teachers and peers. Thus, more conscientious and extraverted men acquire morehuman capital in school, and have a higher stock of human capital at the end than the lessconscientious and extraverted with the same educational degree. This difference in human capitalmight be reflected in the additional positive effect of these traits on wages.
The second reason why some traits would be rewarded more highly for more educated men isrelated to occupational differences by schooling. Choice sets from which individuals choose theiroccupations will differ by education. It is thus possible that more highly educated men are betterable to choose occupations that reward their traits than less educated men. For example, executivepositions are much more prevalent in the higher education group. Conscientiousness, Extraversion,and Emotional Stability are significantly associated with “executive strengths” (Holland et al.,1993), and they are positively correlated with leader emergence and leader effectiveness (Judgeet al., 2002). Thus, if education opens access to these occupations that would reward the conscien-tious and extraverted more, there is a higher reward to traits in high education groups. Evidencefrom other studies indicates that effects of socio-emotional skills on earnings persist even whenoccupation dummies are included, such as in Heineck (2011). In Kuhn and Weinberger (2005),leadership skills have positive wage effects even within very narrowly-defined occupational groups.
3.3. Indirect Effects of Traits through Education
I continue the conditional setup to briefly sketch the indirect effect of traits that works throughtheir influence on educational attainment. First, I establish the effects of personality on educationin Dj (Section 3.3.1). Then, in Section 3.3.2, I estimate κj , the return to education in the Termansample, to finally combine the two to the indirect effect that can be compared to the “direct” effect.
15

Table 4: The Impact of Psychological Traits on Educational Attainment, Men
HS Some Coll. BA MA Dr
IQ −0.035∗∗∗ −0.008 0.020 0.013 0.010
(0.012) (0.020) (0.024) (0.020) (0.021)
Openness 0.004 −0.047∗∗
0.014 −0.011 0.041(0.009) (0.020) (0.029) (0.025) (0.026)
Conscientiousness −0.017∗∗ −0.055
∗∗∗ −0.052∗
0.032 0.092∗∗∗
(0.008) (0.017) (0.027) (0.027) (0.026)
Extraversion −0.020∗
0.020 −0.014 0.004 0.010(0.011) (0.022) (0.032) (0.026) (0.029)
Agreeableness −0.007 0.021 −0.018 −0.021 0.025(0.011) (0.023) (0.032) (0.030) (0.030)
Neuroticism 0.008 −0.058∗∗
0.010 0.052 −0.013(0.011) (0.025) (0.037) (0.036) (0.035)
Note: Marginal effects of increasing personality traits by one standard deviation, from a generalized ordered logit model,
evaluated at means of all covariates (asymptotic standard errors in parentheses). Estimated using Williams (2006) with
standard controls, of which a number are constrained to equal coefficients without rejecting H0 of proportional odds. P-values
based on a two-sided asymptotic test, with ∗(p < .10),∗∗ (p < .05),∗∗∗ (p < .01).
3.3.1. Educational Attainment as a Function of Traits
Personality traits in Terman influence education mostly as expected. Table 4 displays marginaleffects of a generalized ordered logit model of education choice for men.13
Conscientiousness, which is generally the strongest predictor of academic achievement (Noftleand Robins, 2007; Poropat, 2009, 2014), also has a positive effect here. A one standard devia-tion increase raises the probability of a doctorate degree by 9 percentage points, and lowers theprobability of a bachelor’s or less by 5.2 percentage points. Conscientiousness likely enhances ed-ucation through lowering the psychic costs of education, or lowering the discount rate. The “hardworking” elements of Conscientiousness, effortful control and attention regulation (MacCann et al.,2009; Duckworth et al., 2012), imply that a conscientious person perceives the effort required inschooling as less costly. The “future planning” element can be associated with lower discount ratesfor deferred gains.
Openness also raises schooling of the Terman males slightly—it decreases the probability ofthem remaining at below a bachelor’s degree, even conditioning on IQ. Individuals high in Opennesswould enjoy learning and intellectual endeavors more, reducing their psychic cost or increasing theirconsumption value of schooling.
IQ significantly decreases the chances of remaining in high school, the lowest education category(-3.5 percentage points).
Neuroticism decreases the probability of the “Some College” option by 5.8 percentage points.
13Since the correction method applied in other results of this paper is limited to least squares regressions, inferencehere ignores the prediction error introduced by using predicted personality factors.
16

This finding diverges from previous studies, where Emotional Stability is positively associated witheducational attainment.
3.3.2. The Return to Education at Average Traits
Having established that psychological traits determine educational choice, how does educationtranslate into lifetime earnings? I can provide observed ex-post returns on individual earningshistories that do not require the standard assumptions for using cross-sectional data in Mincerequations14 (Becker and Chiswick, 1966; Mincer, 1974). Other assumptions are necessary, however,to identify the return to education, κj,t. In Terman, it requires a “selection on observables” ormatching assumption, on the basis of a standard Roy model (see Web Appendix), because there iscurrently no appropriate exogenous variation in education available. It would have to be a) at themargin to college and graduate school, b) for a sample of high-IQ men and women, and c) aroundthe year 1930.15 While a source of exogenous variation in schooling would be desirable at least fora comparison, the rich background information available in the Terman data allow to control forthe selection into schooling at a much greater level of detail than usually possible: ability both inthe cognitive and in the socio-emotional domain is observed, as is parental background, and thesample is relatively homogenous in terms of location and environment. If the existing research thatuses exogenous variation can be any guide to the high-IQ sample of Terman men and women, onewould expect the matching estimates to be conservative in the sense that they would typically belower than those from instrumental variables (Card, 1999).
Based on the matching assumption, the average treatment effect of education level j vs. k ateach age t corresponds to κj,t − κk,t from Eq. (4) by age. At the mean, factor scores are zero,therefore in these average effects, the interaction with psychological traits drops out. The righthalf of Table 5 provides, for each pairwise comparison of educational attainment, the sum of all age-wise earnings differences. These are the net present values, undiscounted so as to be comparableto the effects of traits. The left half lists the internal rate of return (IRR) that summarizes theage-by-age effects, to compare to rates of return known in the literature. The returns are generallylarge. In comparison to having a high school diploma, obtaining a bachelor’s degree increases theTerman males’ earnings by a total of $1,072,400 over a lifetime. The corresponding IRR is 12.2%.This estimate implies that even for the highly talented Terman men with IQs above 140, goingto school substantially contributed to increasing their lifetime earnings, and the rate of returnto this investment exceeds that of the return on equity.16 The average returns to graduate and
14Results from a Mincer equation estimated with Terman data is in Appendix Section C.10.15The usual candidates for instrumental variables are not useful in the Terman context. For example, changes
in compulsory schooling laws (Angrist and Krueger, 1991, or Lleras-Muney, 2005) would not alter the attainmentof a group that does not have a single high school dropout, and of which a quarter obtained doctoral degrees. Forthe college margin, changes in public student aid (Dynarski, 2003) or changes in tuition levels (Kane and Rouse,1993) are bound to be weak instruments, as this group of high-IQ individuals could easily obtain tuition waversor scholarships from private sources. Distance to nearest college (Card, 1993) may have been appropriate, but theTerman data lack information on original residence within California. Local labor market conditions have sometimesbeen used as exclusion restrictions, but precise information would be difficult to obtain for this period, and it is notclear whether it is a valid instrument given what is known about the effects of graduating in a recession, and howthe effects vary by student quality (Oreopoulos et al., 2012).
16The 12.2% return to a bachelor’s is comparable in magnitude to an estimate from the census. Earnings differencesbetween college and high school in the 1950 census yield a rate of return estimate of 10.7%, using the nonparametricprocedure described in Heckman et al. (2006a). Using the same procedure on the Terman data (and ignoring the richcovariates) produces a rate of return to a bachelor’s degree of 11.4%. The reason that these returns are comparable
17

Table 5: Pairwise Average Treatment Effects on Earnings, Males
Some Coll. Bachelor Master Doctorate Some Coll. Bachelor Master Doctorate
High School 11.1 12.2 8.3 9.2 344.4 1072.4 1002.3 1689.5[-14.0, 28.3] [5.3, 18.3] [3.9, 13.1] [6.1, 12.6] [-315, 1009] [420, 1715] [283, 1702] [1022, 2400]
Some College 13.0 7.3 8.8 732.8 662.6 1349.8[1.5, 21.3] [2.7, 13.1] [5.3, 12.3] [184, 1271] [78, 1224] [740, 1970]
Bachelor -2.0 6.0 -65.4 621.8[-13.8, 50.4] [1.5, 11.5] [-582, 482] [58, 1194]
Master 13.5 690.9[-0.6, 25.0] [152, 1273]
Internal Rate of Return Net Present Value, undiscounted
Note: The effects of education on earnings are evaluated for males with average personality traits, as in Eq. (4), and brackets
show 95% confidence bands are from 1000 bootstrap draws. Earnings are annual earnings after tuition in 1,000 U.S. Dollars
(of the year 2010), with the top 3% of values truncated. Covariates are IQ, factor scores for personality traits, parental
background, family environment, childhood health, and cohort controls. The Internal Rate of Return is the discount rate that
would make an individual indifferent between obtaining more education or remaining at a baseline level (j vs. k), the ρ such
that∑75t=18
(κj,t−κk,t)(1+ρ)t−17 = 0.
18
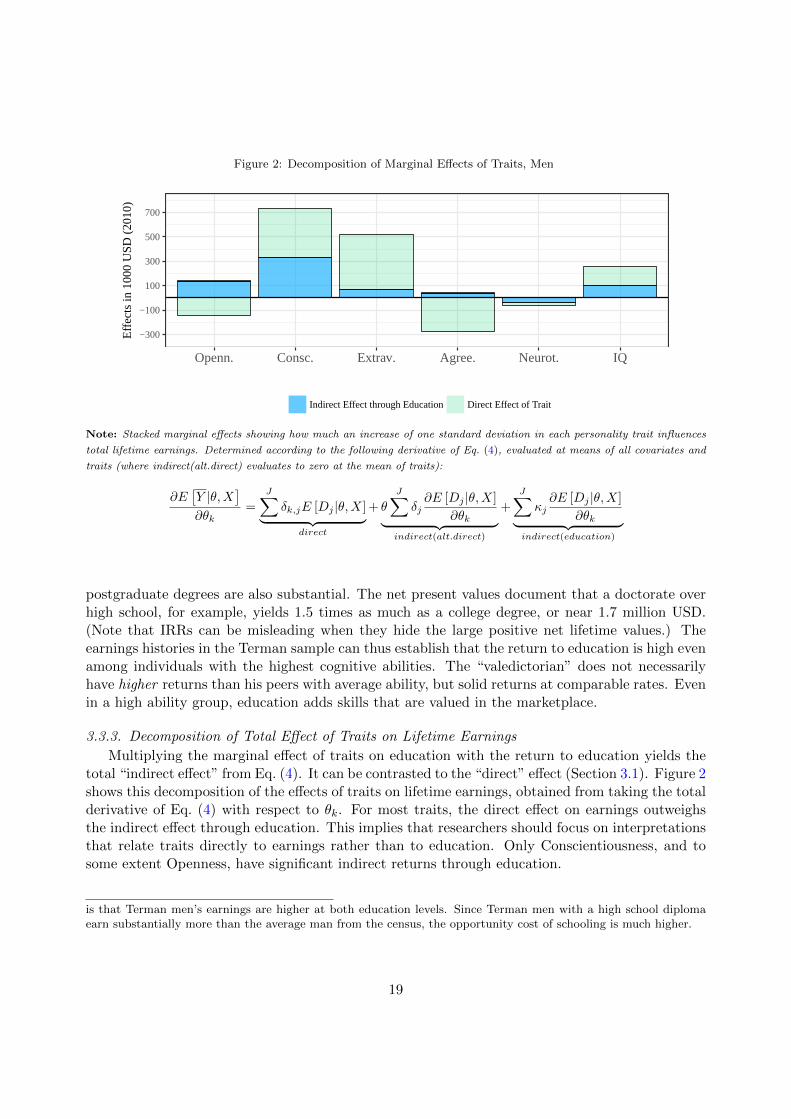
Figure 2: Decomposition of Marginal Effects of Traits, Men
−300
−100
100
300
500
700
Openn. Consc. Extrav. Agree. Neurot. IQ
Effe
cts
in 1
000
US
D (
2010
)
Indirect Effect through Education Direct Effect of Trait
Note: Stacked marginal effects showing how much an increase of one standard deviation in each personality trait influences
total lifetime earnings. Determined according to the following derivative of Eq. (4), evaluated at means of all covariates and
traits (where indirect(alt.direct) evaluates to zero at the mean of traits):
∂E[Y |θ,X
]∂θk
=
J∑δk,jE [Dj |θ,X]︸ ︷︷ ︸
direct
+ θ
J∑δj∂E [Dj |θ,X]
∂θk︸ ︷︷ ︸indirect(alt.direct)
+
J∑κj∂E [Dj |θ,X]
∂θk︸ ︷︷ ︸indirect(education)
postgraduate degrees are also substantial. The net present values document that a doctorate overhigh school, for example, yields 1.5 times as much as a college degree, or near 1.7 million USD.(Note that IRRs can be misleading when they hide the large positive net lifetime values.) Theearnings histories in the Terman sample can thus establish that the return to education is high evenamong individuals with the highest cognitive abilities. The “valedictorian” does not necessarilyhave higher returns than his peers with average ability, but solid returns at comparable rates. Evenin a high ability group, education adds skills that are valued in the marketplace.
3.3.3. Decomposition of Total Effect of Traits on Lifetime Earnings
Multiplying the marginal effect of traits on education with the return to education yields thetotal “indirect effect” from Eq. (4). It can be contrasted to the “direct” effect (Section 3.1). Figure 2shows this decomposition of the effects of traits on lifetime earnings, obtained from taking the totalderivative of Eq. (4) with respect to θk. For most traits, the direct effect on earnings outweighsthe indirect effect through education. This implies that researchers should focus on interpretationsthat relate traits directly to earnings rather than to education. Only Conscientiousness, and tosome extent Openness, have significant indirect returns through education.
is that Terman men’s earnings are higher at both education levels. Since Terman men with a high school diplomaearn substantially more than the average man from the census, the opportunity cost of schooling is much higher.
19

4. Conditional Effects of Personality Traits and IQ, Women
After studying when and for whom personality traits matter most in terms of lifetime earningsfor men, this section briefly completes the analysis for women. The direct analogy is challengedby the historical nature of the Terman sample, which is more visible for women than for men ofthis cohort. The women belonged to a generation in which their role was still mainly that of ahomemaker, mother, and wife. A woman’s freedom to choose a career or define her lifestyle was notwhat it is today. About half of the Terman women were housewives, despite their extraordinaryabilities. While most of the housewives did not earn a market wage, they could still increase theirpotential family earnings through socio-emotional skills and education by matching with a husbandwith higher educational achievement and earnings.
4.1. Lifetime Effects, Conditional and Interacted with Education
In terms of own earnings, women of this cohort generally did not benefit from their socio-emotional skills - see the left column of Table 6. The point estimates are much smaller than thecorresponding estimates for men, and are not significantly different from zero. The only exceptionto this finding is Conscientiousness. This positive association (overall $129,200 for a 1-standard-deviation increase) is purely driven by highly educated women (effect of $343,600). In this sense,only women with a post-graduate education benefited from their human capital as the men of thissample did. They still did not reach the men’s level, however, since the magnitude of their rewardis about 60% of that of men with equal education (cf Table 3). Note that in generations followingthe Terman women, Conscientiousness is associated with higher earnings, as Mueller and Plug(2006) demonstrate already for women born around 1940.
The effects of personality traits on women’s family earnings reveal important heterogeneitiesby education: Analyses that ignore the interaction between personality and education may over-or under-state the effects of personality traits in average impacts. For example, while the highlyeducated women in Terman could expect a return to Conscientiousness from own earnings, they didnot benefit in terms of family earnings (insignificant coefficient). Less educated women, instead,saw higher family earnings from this trait (positive significant coefficient of $299,300. The key liesin the effect of Conscientiousness on husbands’ earnings: it decreased husbands’ earnings of highlyeducated women, but increased them for less educated women. This could mean that less educatedconscientious women married more frequently, or higher earning husbands, or both. While thisquestion cannot be answered definitively with the Terman sample, a supplementary analysis (WebAppendix Section C.6) suggests that, at the bachelor level or less, more conscientious womenmarried higher earning husbands. For women with graduate education, Conscientiousness had anegative effect on the probability of being married. It also made them more likely to be in ahigh-wage job for an extended time. The negative effect on husband’s earnings completely offsetthe positive effect of own earnings in δj .
In the effects of Openness, Extraversion, and IQ, strong differential effects by education are alsopresent. Women with a college degree who scored higher on Openness had lower spousal and familyearnings (-$400,900), but their highly educated counterparts had significant gains from this trait($511,500). This gain through the marriage market stands in contrast to men, where Opennessdid not have a significant direct effect on lifetime earnings. More extraverted women with at mosta college education benefited greatly in terms of family earnings ($524,500). This seems to be theresult of two positive effects: they were more likely to marry than introverts, and if they did, theymarried husbands with higher earnings. Women with a master’s degree or more, however, had
20

Table 6: The Direct Effects of Traits on Women’s Lifetime Earnings
Own Earnings Family Earnings
Openness
Conscientiousn.
Extraversion
Agreeableness
Neuroticism
IQ
Mean Life Earn.
Direct
25.2
[-77,142]
129.9∗∗
[39,250]
-31.9
[-152,65]
-37.6
[-167,71]
-59.9∗
[-142,12]
20.3
[-43,82]
700.0
Interact.
≤ BA 23.7
[-103,148]
≥ MA 47.9
[-293,548]
≤ BA 60.5
[-37,172]
≥ MA 343.6∗∗
[75,810]
≤ BA -0.4
[-135,132]
≥ MA -122.0
[-480,107]
≤ BA -51.1
[-184,67]
≥ MA 28.4
[-378,462]
≤ BA -28.2
[-127,60]
≥ MA -141.3
[-412,96]
≤ BA 6.3
[-64,78]
≥ MA 9.3
[-242,219]
Diff.
24.3
(0.42)
283.1∗∗
(0.05)
-121.6
(0.18)
79.5
(0.32)
-113.1
(0.22)
147.7
(0.15)
Direct
-187.0
[-562,56]
207.7∗
[-46,507]
316.5∗∗
[50,722]
107.9
[-197,463]
30.7
[-184,246]
-32.6
[-219,184]
2811.1
Interact.
-400.9∗∗
[-958,-106]
511.5∗
[-126,1558]
299.3∗∗
[14,701]
-28.9
[-843,659]
524.5∗∗∗
[188,1144]
-314.2
[-1066,139]
207.4
[-135,678]
-200.2
[-1282,567]
-0.6
[-316,279]
-52.1
[-608,340]
79.6
[-129,385]
-477.3∗∗
[-1062,-102]
Diff.
912.4∗∗
(0.01)
-328.2
(0.18)
-838.7∗∗
(0.01)
-407.6
(0.17)
-51.5
(0.42)
131.7
(0.26)
Note: Standardized coefficient estimates from Eq. (3) in column “Direct,” and Eq. (4) in “Interact.”, with differences MA-BA
in “Diff.”. Square brackets show observed 5th and 95th percentiles of the corresponding bootstrap distribution, and p-values
in round parentheses are the probability of observing an absolutely larger value of the test statistic under a Null hypothesis of
no effect on average, with ∗(p < .10),∗∗ (p < .05),∗∗∗ (p < .01). See further notes to Table 3. Number of observations: 422.
21

Table 7: The Impact of Personality Traits and IQ on Educational Attainment, Women
HS Some Coll. BA MA Dr
IQ −0.007 −0.031 0.048 0.004 −0.014(0.007) (0.024) (0.035) (0.095) (0.091)
Openness 0.000 −0.009 −0.048 0.032 0.025(0.011) (0.033) (0.041) (0.172) (0.169)
Conscientiousness −0.003 −0.057∗ −0.026 0.079 0.007
(0.011) (0.033) (0.043) (0.058) (0.047)
Extraversion 0.024∗∗
0.021 −0.045 0.020 −0.020(0.010) (0.030) (0.036) (0.138) (0.135)
Agreeableness 0.040∗∗ −0.014 −0.008 −0.006 −0.012
(0.016) (0.040) (0.048) (0.089) (0.081)
Neuroticism 0.050∗∗∗ −0.026 −0.010 0.003 −0.017
(0.018) (0.043) (0.050) (0.120) (0.113)
Note: Marginal effects from a generalized ordered logit model, evaluated at means of all covariates (standard errors in
parentheses). P-values based on a two-sided asymptotic test, with ∗(p < .10),∗∗ (p < .05),∗∗∗ (p < .01). See notes to Table 4.
statistically insignificant effects of extraversion. IQ had a strong negative impact for women witha master’s or doctorate degree (-$477,300), because their probability of being married was lower.In contrast to Conscientiousness, however, IQ was unrelated to labor supply in this range—thushusband’s earnings were reduced without an increased probability of work.
4.2. Indirect Effects of Traits through Education, Women
For women of the Terman study, the influence of personality traits on educational attainmentwas weaker than for men. Nevertheless, the associations between education and Extraversionand Neuroticism are similar to findings from representative samples. These traits increased theprobability of women to remain in the lowest schooling category (although they are not significantlyaffecting higher schooling levels). In terms of returns to education, I focus on family earnings.For women with a bachelor’s degree, the returns to education were positive. They did not haveany payoff from their studies in terms of own earnings, but they benefited from the marriagemarket: they were just as likely to marry as women without a college education, but they marriedmore educated and higher-earning husbands.17 This led to a net value of $152,000. For womenwith graduate education, the odds of being married declined strongly. This translated to negativereturns to education on the marriage market for women with a master’s degree, as they did not,on average, compensate their lower propensity to marry with higher husband’s earnings. The fewwomen who obtained a doctorate degree saw large returns to education in terms of own earnings,but they had to accept penalties in the marriage market, as they were less likely to be married.Conditional on being married, their husbands had above-average earnings. Overall, there was
17Again, these supplemental analyses are presented in Section C.6 of the Appendix.
22

Table 8: Female Internal Rates of Return and Net Present Values, Family Earnings
Bachelor Master Doctorate Bachelor Master Doctorate
High School 18.7 . 13.3 152 -21 573[6.6, 37.0] [. - .] [0.9, 43.3] [-418, 719] [-595, 600] [-510, 2151]
Bachelor . 10.3 -172 422[. - .] [-37.8, 49.6] [-746, 470] [-630, 2097]
Master 21.0 595[-18.6, 71.9] [-421, 2197]
Internal Rate of Return Net Present Value, undiscounted
Note: Internal rates of return and net present values are based on the age-by-age treatment effects of education from Eq. (4).
The results on own and husband’s earnings separately are in Section C.1 of the Web Appendix. See Table 5 for more notes.
a positive return to family earnings as the return to own work outweighed the lower husband’searnings (net values of $422,000-$595,000, noisily estimated).
The decomposition of the direct and indirect effects on family earnings in Fig. 3 demonstratesthat indirect effects through education did not matter much for women of the Terman sample—because education only changed earnings for the very highly educated, and traits did not influencethe decision to obtain a doctorate degree sufficiently to generate strong indirect effects.
5. Summary and Conclusion
This paper estimates the effects of personality traits and IQ on lifetime earnings of the menand women of the Terman study. The traits of Conscientiousness and Extraversion have strong,positive associations with men’s lifetime earnings, and Agreeableness a negative association. Whilethe Terman sample is selective in terms of IQ, these results mirror prior findings that are basedon representative samples. They show that even men with exceptional cognitive skills benefit fromsocio-emotional skills.
Personality traits and IQ do not affect the levels of earnings equally at all ages: the questionof when they matter can be answered with “especially in the prime working years.” A hump-shape life-cycle pattern is distinctly present in several traits, where the earnings effect of traitsis initially insignificant, rises to be the largest around ages 40-60, and drops off afterwards. Ifthe life-cycle pattern that is observed for this high-IQ group is driven by mechanisms that arealso at work in the general population, one could expect the same hump-shape to be presentgenerally. Some of the potential mechanisms that are discussed—health and behaviors, employerlearning or work hierarchies—are not unique to high-IQ individuals, as empirical evidence suggests.Naturally, there could still be a difference in magnitudes because the Terman participants combinetheir socio-emotional skills with high cognitive ability. Nevertheless, a concave life-cycle patternwould suggest implications for research that relies on cross-sectional data with young workers—for these, the current association of traits with earnings could underestimate the association with
23
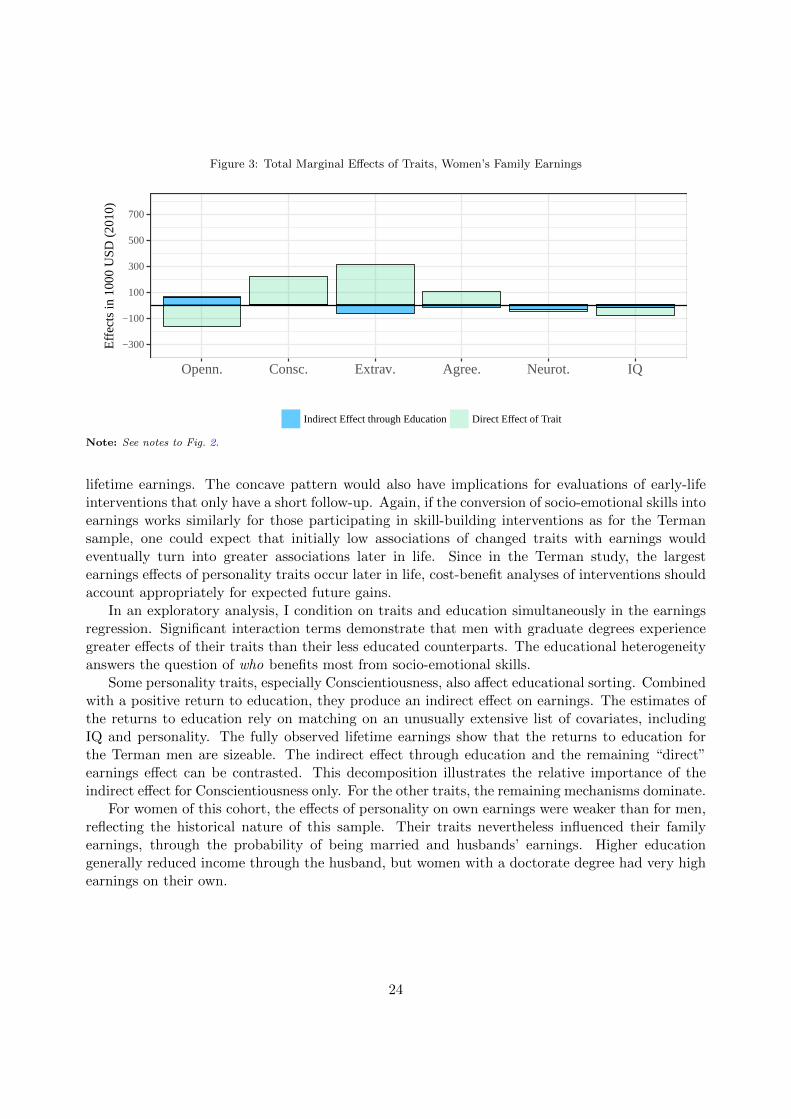
Figure 3: Total Marginal Effects of Traits, Women’s Family Earnings
−300
−100
100
300
500
700
Openn. Consc. Extrav. Agree. Neurot. IQ
Effe
cts
in 1
000
US
D (
2010
)
Indirect Effect through Education Direct Effect of Trait
Note: See notes to Fig. 2.
lifetime earnings. The concave pattern would also have implications for evaluations of early-lifeinterventions that only have a short follow-up. Again, if the conversion of socio-emotional skills intoearnings works similarly for those participating in skill-building interventions as for the Termansample, one could expect that initially low associations of changed traits with earnings wouldeventually turn into greater associations later in life. Since in the Terman study, the largestearnings effects of personality traits occur later in life, cost-benefit analyses of interventions shouldaccount appropriately for expected future gains.
In an exploratory analysis, I condition on traits and education simultaneously in the earningsregression. Significant interaction terms demonstrate that men with graduate degrees experiencegreater effects of their traits than their less educated counterparts. The educational heterogeneityanswers the question of who benefits most from socio-emotional skills.
Some personality traits, especially Conscientiousness, also affect educational sorting. Combinedwith a positive return to education, they produce an indirect effect on earnings. The estimates ofthe returns to education rely on matching on an unusually extensive list of covariates, includingIQ and personality. The fully observed lifetime earnings show that the returns to education forthe Terman men are sizeable. The indirect effect through education and the remaining “direct”earnings effect can be contrasted. This decomposition illustrates the relative importance of theindirect effect for Conscientiousness only. For the other traits, the remaining mechanisms dominate.
For women of this cohort, the effects of personality on own earnings were weaker than for men,reflecting the historical nature of this sample. Their traits nevertheless influenced their familyearnings, through the probability of being married and husbands’ earnings. Higher educationgenerally reduced income through the husband, but women with a doctorate degree had very highearnings on their own.
24

Almlund, M., Duckworth, A. L., Heckman, J. J., Kautz, T., 2011. Personality Psychology and Economics. In:Hanushek, E. A., Machin, S., Woessmann, L. (Eds.), Handbook of the Economics of Education, Vol. 4. Vol. 4.Elsevier B.V., Ch. 1, pp. 1–181.URL http://dx.doi.org/10.1016/B978-0-444-53444-6.00001-8
Altonji, J. G., Pierret, C. R., 2001. Employer Learning and Statistical Discrimination. The Quarterly Journal ofEconomics 116 (1), 313–350.
American Psychological Association, 2007. APA Dictionary of Psychology. American Psychological Association,Washington, DC.
Angrist, J. D., Krueger, A. B., 1991. Does Compulsory School Attendance Affect Schooling and Earnings? TheQuarterly Journal of Economics 106 (4), 979–1014.
Barrick, M. R., Mount, M. K., 1991. The Big Five Personality Dimensions and Job Performance: A Meta-Analysis.Personnel Psychology 44 (1), 1–26.URL http://doi.wiley.com/10.1111/j.1744-6570.1991.tb00688.x
Bartlett, M., 1937. The Statistical Conception of Mental Factors. British Journal of Psychology 1 (28), 97–104.Becker, G. S., Chiswick, B. R., 1966. Education and the Distribution of Earnings. The American Economic Review
56 (1/2), 358–369.Becker, G. S., Landes, E. M., Michael, R. T., 1977. An Economic Analysis of Marital Instability. Journal of Political
Economy 85 (6), 1141–1187.Becker, K. A., 2003. History of the Stanford-Binet Intelligence Scales: Content and Psychometrics. In: Stanford-Binet
Intelligence Scales , Assessment Service Bulletin Number 1. Rivserside Publishing, Itasca, IL.Bolck, A., Croon, M., Hagenaars, J., 2004. Estimating Latent Structure Models with Categorical Variables: 1-Step
Versus 3-Step Estimators. Political Analysis 12 (1), 3–27.URL http://pan.oupjournals.org/cgi/doi/10.1093/pan/mph001
Borghans, L., Duckworth, A. L., Heckman, J. J., ter Weel, B., 2008. The Economics and Psychology of PersonalityTraits. Journal of Human Resources 43 (4), 972–1059.
Bowles, S., Gintis, H., Osborne, M., 2001. Incentive-Enhancing Preferences: Personality, Behavior, and Earnings.The American Economic Review 91 (2), 155–158.
Caliendo, M., Cobb-Clark, D. A., Uhlendorff, A., 2015. Locus of Control and Job Search Strategies. The Review ofEconomics and Statistics 97 (1), 88–103.
Card, D., 1993. Using Geographic Variation in College Proximity to Estimate the Return to Schooling. NBERWorking Paper Series (4483).URL http://www.nber.org/papers/w4483.pdf?new_window=1
Card, D., 1999. The Causal Effect of Education on Earnings. In: Ashenfelter, O., Card, D. (Eds.), Handbook ofLabor Economics, Vol. 3. Vol. 3. Elsevier Science B.V., Ch. 30, pp. 1801–1863.
Cobb-Clark, D. A., Schurer, S., 2013. Two Economists’ Musings on the Stability of Locus of Control. The EconomicJournal 123 (570), F358–F400.URL http://doi.wiley.com/10.1111/ecoj.12069
Costa, P. T. J., McCrae, R. R., 1994. Set like Plaster? Evidence for the Stability of Adult Personality. In: Heatherton,T. F., Weinberger, J. L. (Eds.), Can personality change? American Psychological Association, Washington, D.C.,U.S.A., pp. 21–40.
Croon, M., 2002. Using Predicted Latent Scores in General Latent Structure Models. In: Marcoulides, G. A.,Moustaki, I. (Eds.), Latent Variable and Latent Structure Models. Lawrence Erlbaum Associates, Inc., Ch. 10,pp. 195–223.
Cubel, M., Nuevo-Chiquero, A., Sanchez-Pages, S., Vidal-Fernandez, M., 2016. Do Personality Traits Affect Produc-tivity? Evidence from the Lab. The Economic Journal 126 (May), 654–681.URL http://papers.ssrn.com/abstract=2471066
Cunha, F., Heckman, J. J., 2007. The Technology of Skill Formation. The American Economic Review: Papers andProceedings 97 (2), 31–47.
Dahmann, S., Anger, S., 2014. The Impact of Education on Personality: Evidence from a German High SchoolReform. IZA Discussion Paper (8139).
Dauber, S. L., Benbow, C. P., 1990. Aspects of Personality and Peer Relations of Extremely Talented Adolescents.Gifted Child Quarterly 34 (1), 10–14.URL http://gcq.sagepub.com/cgi/doi/10.1177/001698629003400103
Duckworth, A. L., Quinn, P. D., Tsukayama, E., 2012. What No Child Left Behind leaves behind: The roles of IQand self-control in predicting standardized achievement test scores and report card grades. Journal of EducationalPsychology 104 (2), 439–451.
25

Duckworth, A. L., Weir, D., 2010. Personality, Lifetime Earnings, and Retirement Wealth. Research Brief, Universityof Michigan Retirement Research Center (235).URL http://www.ssrn.com/abstract=1710166
Dynarski, S. M., 2003. Does Aid Matter? Measuring the Effect of Student Aid on College Attendance and Completion.The American Economic Review 93 (1), 279–288.
Farber, H. S., Gibbons, R., 1996. Learning and Wage Dynamics. Quarterly Journal of Economics 111 (4), 1007–1047.Fletcher, J. M., 2013. The effects of personality traits on adult labor market outcomes: Evidence from siblings.
Journal of Economic Behavior & Organization 89, 122–135.URL http://dx.doi.org/10.1016/j.jebo.2013.02.004
Friedman, H. S., 2008. The multiple linkages of personality and disease. Brain, Behavior, and Immunity 22 (5),668–675.
Friedman, H. S., Tucker, J. S., Tomlinson-Keasey, C., Schwartz, J. E., Wingard, D. L., Criqui, M. H., 1993. DoesChildhood Personality Predict Longevity? Journal of Personality and Social Psychology 65 (1), 176–85.URL http://www.ncbi.nlm.nih.gov/pubmed/8355139
Gladwell, M., 2008. Outliers: The Story of Success. ittle, Brown and Company, New York, NY.Goldberg, L. R., 1993. The Structure of Phenotypic Personality Traits. The American Psychologist 48 (1), 26–34.Goldsmith, A. H., Veum, J. R., Darity, W. J., 1997. The Impact of Psychological and Human Capital on Wages.
Economic Inquiry XXXV (October), 815–829.Goodwin, R. D., Friedman, H. S., 2006. Health Status and the Five-factor Personality Traits in a Nationally Repre-
sentative Sample. Journal of Health Psychology 11 (5), 643–54.URL http://www.ncbi.nlm.nih.gov/pubmed/16908463
Grossman, J. B., Tierney, J. P., 1998. Does Mentoring Work? An Impact Study of the Big Brothers Big SistersProgram. Evaluation Review 22 (3), 403–426.URL http://erx.sagepub.com/cgi/doi/10.1177/0193841X9802200304
Hamermesh, D. S., 1984. Life-Cycle Effects on Consumption and Retirement. Journal of Labor Economics 2 (3),353–370.
Hause, J. C., 1972. Earnings Profile: Ability and Schooling. Journal of Political Economy 80 (3, Part 2), S108–S138.Heckman, J. J., Lochner, L. J., Todd, P. E., 2006a. Earnings Functions, Rates of Return and Treatment Effects: The
Mincer Equation and Beyond. In: Hanushek, E. A., Welsh, F. (Eds.), Handbook of the Economics of Education,Vol. 1. Elsevier, Ch. 7, pp. 307–458.
Heckman, J. J., Moon, S. H., Pinto, R., Savelyev, P. A., Yavitz, A., 2010. The rate of return to the HighScope PerryPreschool Program. Journal of Public Economics 94 (1-2), 114–128.URL http://linkinghub.elsevier.com/retrieve/pii/S0047272709001418
Heckman, J. J., Pinto, R., Savelyev, P. A., 2013. Understanding the Mechanisms Through Which an Influential EarlyChildhood Program Boosted Adult Outcomes. The American Economic Review 103 (6), 2052–2086.
Heckman, J. J., Stixrud, J., Urzua, S., 2006b. The Effects of Cognitive and Noncognitive Abilities on Labor MarketOutcomes and Social Behavior. Journal of Labor Economics 24 (3), 411–482.URL http://www.jstor.org/stable/10.1086/504455
Heineck, G., 2011. Does it Pay to be Nice? Personality and Earnings in the United Kingdom. Industrial and LaborRelations Review 64 (5), 1020–1038.
Heineck, G., Anger, S., 2010. The returns to cognitive abilities and personality traits in Germany. Labour Economics17 (3), 535–546.URL http://linkinghub.elsevier.com/retrieve/pii/S0927537109000670
Holland, J. L., Johnston, J. A., Asama, N. F., Polys, S. M., 1993. Validating and Using the Career Beliefs Inventory.Journal of Career Development 19 (4), 233–244.URL http://jcd.sagepub.com/cgi/doi/10.1177/089484539301900401
Joreskog, K., Sorbom, D., 1979. Advances in Factor Analysis and Structural Equation Models. Abt Books, Cambridge,Massachusetts.
Jovanovic, B., 1979. Job Matching and the Theory of Turnover. The Journal of Political Economy 87 (5), 972–990.Judge, T. A., Bono, J. E., Ilies, R., Gerhardt, M. W., 2002. Personality and Leadership: A Qualitative and Quanti-
tative Review. Journal of Applied Psychology 87 (4), 765–780.URL http://doi.apa.org/getdoi.cfm?doi=10.1037/0021-9010.87.4.765
Judge, T. A., Higgins, C. A., Thoresen, C. J., Barrick, M. R., 1999. The Big Five Personality Traits, General MentalAbility, and Career Success Across the Life Span. Personnel Psychology 52 (3), 621–652.
Judge, T. A., Locke, E. A., Durham, C. C., Kluger, A. N., 1998. Dispositional Effects on Job and Life Satisfaction:The Role of Core Evaluations. Journal of Applied Psychology 83 (1), 17–34.
26

Kane, T. J., Rouse, C. E., 1993. Labor-Market Returns to Two- and Four-Year Colleges: Is a credit a credit and dodegrees matter? NBER Working Paper Series (4268).URL http://www.nber.org/papers/w4268
Kassenboehmer, S. C., Leung, F., Schurer, S., forthcoming. University education and noncognitive skill development.Oxford Economic Papers.
Kuhn, P., Weinberger, C., 2005. Leadership Skills and Wages. Journal of Labor Economics 23 (3), 395–436.Leibowitz, A., 1974. Home Investments in Children. Journal of Political Economy 82 (2, Part 2: Marriage, Family
Human Capital and Fertility (Mar.-Apr.)), S111–S131.Leon, G. R., Gillum, B., Gillum, R., Gouze, M., 1979. Personality Stability and Change Over a 30-Year Period—
Middle Age to Old Age. Journal of Consulting and Clinical Psychology 47 (3), 517–24.URL http://www.ncbi.nlm.nih.gov/pubmed/528720
Lleras-Muney, A., 2005. The Relationship Between Education and Adult Mortality in the United States. Review ofEconomic Studies 72 (1), 189–221.URL http://restud.oxfordjournals.org/lookup/doi/10.1111/0034-6527.00329
Lodi-Smith, J., Jackson, J., Bogg, T., Walton, K., Wood, D., Harms, P., Roberts, B. W., 2010. Mechanisms ofhealth: Education and health-related behaviours partially mediate the relationship between conscientiousness andself-reported physical health. Psychological Health 25 (3), 305–319.
Lubinski, D., 2016. From Terman to Today: A Century of Findings on Intellectual Precocity.URL http://rer.sagepub.com/cgi/doi/10.3102/0034654316675476
Lucas, R. E., Donnellan, M. B., 2011. Personality development across the life span: Longitudinal analyses with anational sample from Germany. Journal of Personality and Social Psychology 101 (4), 847–861.
MacCann, C., Duckworth, A. L., Roberts, R. D., 2009. Empirical identification of the major facets of Conscientious-ness. Learning and Individual Differences 19 (4), 451–458.
Martin, L. R., Friedman, H. S., 2000. Comparing Personality Scales Across Time: An Illustrative Study of Validityand Consistency in Life-Span Archival Data. Journal of Personality 68 (1), 85–110.
Martin, L. R., Friedman, H. S., Clark, K. M., Tucker, J. S., 2005. Longevity following the experience of parentaldivorce. Social Science and Medicine 61 (10), 2177–2189.
McCrae, R. R., John, O. P., 1992. An Introduction to the Five-Factor Model and Its Applications. Journal ofPersonality 60 (2), 175–215.
Michael, R. T., 1976. Factors Affecting Divorce: A Study of the Terman Sample. NBER Working Paper Series (147).Miller, R. A., 1984. Job Matching and Occupational Choice. Journal of Political Economy 92 (6), 1086.
URL http://www.journals.uchicago.edu/doi/abs/10.1086/261276
Mincer, J., 1974. Schooling, Experience and Earnings. Columbia University Press for National Bureau of EconomicResearch, New York.
Moffitt, T. E., Arseneault, L., Belsky, D., Dickson, N., Hancox, R. J., Harrington, H., Houts, R., Poulton, R.,Roberts, B. W., Ross, S., Sears, M. R., Thomson, W. M., Caspi, A., 2011. A gradient of childhood self-controlpredicts health, wealth, and public safety. Proceedings of the National Academy of Sciences 108 (7), 2693–8.
Mokdad, A. H., Marks, J. S., Stroup, D. F., Gerberding, J. L., 2004. Actual Causes of Death in the United States,2000. JAMA : The Journal of the American Medical Association 291 (10), 1238–45.URL http://www.ncbi.nlm.nih.gov/pubmed/15657315
Mount, M. K., Barrick, M. R., Stewart, L., 1998. Five-Factor Model of Personality and Performance in Jobs InvolvingInterpersonal Interactions. Human Performance 11 (2-3), 37–41.
Mueller, G., Plug, E., 2006. Estimating the Effect of Personality on Male and Female Earnings. Industrial and LaborRelations Review 60 (1), 3–22.
Mulaik, S. A., 2010. Foundations of Factor Analysis, 2nd Edition. Chapman & Hall/ CRC, Boca Raton, FL.Murnane, R. J., Willett, J. B., Braatz, M. J., Duhaldeborde, Y., 2001. Do different dimensions of male high school
students’ skills predict labor market success a decade later? Evidence from the NLSY. Economics of EducationReview 20 (4), 311–320.URL http://linkinghub.elsevier.com/retrieve/pii/S027277570000056X
Noftle, E. E., Robins, R. W., 2007. Personality Predictors of Academic Outcomes: Big Five Correlates of GPA andSAT Scores. Journal of Personality and Social Psychology 93 (1), 116–30.URL http://www.ncbi.nlm.nih.gov/pubmed/17605593
Nyhus, E. K., Pons, E., 2005. The effects of personality on earnings. Journal of Economic Psychology 26 (3), 363–384.URL http://linkinghub.elsevier.com/retrieve/pii/S0167487004000546
O’Connell, M., Sheikh, H., 2011. ‘Big Five’ personality dimensions and social attainment: Evidence from beyond thecampus. Personality and Individual Differences 50 (6), 828–833.
27

URL http://linkinghub.elsevier.com/retrieve/pii/S0191886911000079
O’Connor, M. C., Paunonen, S. V., 2007. Big Five personality predictors of post-secondary academic performance.Personality and Individual Differences 43 (5), 971–990.URL http://linkinghub.elsevier.com/retrieve/pii/S0191886907001249
Oreopoulos, P., von Wachter, T., Heisz, A., 2012. The Short- and Long-Term Career Effects of Graduating in aRecession. American Economic Journal: Applied Economics 4 (1), 1–29.
Piatek, R., Pinger, P. R., 2016. Maintaining (Locus of) Control? Data Combination for the Identification andInference of Factor Structure Models. Journal of Applied Econometrics 31, 734–755.
Poropat, A. E., 2009. A meta-analysis of the five-factor model of personality and academic performance. PsychologicalBulletin 135 (2), 322–338.
Poropat, A. E., 2014. Other-rated personality and academic performance: Evidence and implications. Learning andIndividual Differences 34, 24–32.URL http://dx.doi.org/10.1016/j.lindif.2014.05.013
Prevoo, T., ter Weel, B., 2015. The Importance of Early Conscientiousness for Socio-Economic Outcomes. Evidencefrom the British Cohort Study. Oxford Economic Papers (2006), 1–46.URL http://oep.oxfordjournals.org/cgi/doi/10.1093/oep/gpv022
Roberts, B. W., Caspi, A., Moffitt, T. E., 2001. The Kids Are Alright: Growth and Stability in Personality Devel-opment From Adolescence to Adulthood. Journal of Personality and Social Psychology 81 (4), 670–683.URL http://doi.apa.org/getdoi.cfm?doi=10.1037/0022-3514.81.4.670
Roberts, B. W., DelVecchio, W. F., 2000. The Rank-Order Consistency of Personality Traits From Childhood to OldAge: A Quantitative Review of Longitudinal Studies. Psychological Bulletin 126 (1), 3–25.
Roberts, B. W., Walton, K. E., Viechtbauer, W., 2006. Patterns of Mean-Level Change in Personality Traits acrossthe Life Course: A Meta-Analysis of Longitudinal Studies. Psychological Bulletin 132 (1-25).
Robins, R. W., Fraley, R. C., Roberts, B. W., Trzesniewski, K. H., 2001. A Longitudinal Study of Personality Changein Young Adulthood. Journal of Personality 69 (4), 617–40.
Salgado, J. F., 1997. The Five Factor Model of Personality and Job Performance in the European Community. TheJournal of Applied Psychology 82 (1), 30–43.URL http://www.ncbi.nlm.nih.gov/pubmed/9119797
Savelyev, P. A., 2012. Conscientiousness, Education, and Longevity of High-Ability Individuals. Unpublishedmanuscript, Vanderbilt University.
Savelyev, P. A., 2014. Socioemotional Skills, Education, and Longevity of High-Ability Individuals.URL https://my.vanderbilt.edu/petersavelyev/files/2014/12/TermanLongevityPaper-appx.pdf
Savelyev, P. A., Tan, K. K. T., 2015. Socioemotional Skills, Education, and Health-Related Outcomes of High-AbilityIndividuals.
Schurer, S., 2017. Does education strengthen the life skills of adolescents? IZA World of Labor (June), 1–11.URL https://wol.iza.org/articles/does-education-strengthen-the-life-skills-of-adolescents
Sears, R. R., 1984. The Terman gifted children study. In: Mednick, S., Harway, M., Finello, K. (Eds.), Handbook ofLongitudinal Research. Vol. 1. Praeger, New York, pp. 398–414.
Soto, C. J., John, O. P., Gosling, S. D., Potter, J., 2011. Age Differences in Personality Traits from 10 to 65: BigFive Domains and Facets in a Large Cross-Sectional Sample. Journal of Personality and Social Psychology 100 (2),330–348.URL http://www.ncbi.nlm.nih.gov/pubmed/21171787
Specht, J., Egloff, B., Schmukle, S. C., 2011. Stability and change of personality across the life course: The impactof age and major life events on mean-level and rank-order stability of the Big Five. Journal of Personality andSocial Psychology 101 (4), 862–882.URL http://doi.apa.org/getdoi.cfm?doi=10.1037/a0024950
Specht, J., Luhmann, M., Geiser, C., 2014. On the consistency of personality types across adulthood: Latent profileanalyses in two large-scale panel studies. Journal of Personality and Social Psychology 107 (3), 540–556.URL http://www.ncbi.nlm.nih.gov/pubmed/25133730
Spengler, M., Brunner, M., Damian, R. I., Ludtke, O., Martin, R., Roberts, B. W., 2015. Student Characteristicsand Behaviors at Age 12 Predict Occupational Success 40 years Later Over and Above Childhood IQ and ParentalSocioeconomic Status. Developmental Psychology 51 (9), 1329–1340.
Terman, L. M., e. a., 1992. Terman Life-Cycle Study of Children with High Ability, 1922-1986. InteruniversityConsortium for Political and Social Research [distributor], ICPSR08092-v3. Ann Arbor, MI.URL http://www.icpsr.umich.edu/icpsrweb/ICPSR/studies/8092
Terman, L., 1916. The measurement of intelligence: An explanation of and a complete guide for the use of the
28

Stanford revision and extension of the Binet-Simon Intelligence Scale. Houghton Mifflin, Boston.Terman, L. M., Sears, R. R., 2002. The Terman Life-Cycle Study of Children with High Ability, 1922-1986. Vol. 1,
1922-1928. Inter-University Consortium for Political and Social Research, Ann Arbor, MI.Thiel, H., Thomsen, S. L., 2013. Noncognitive skills in economics: Models, measurement, and empirical evidence.
Research in Economics 67 (2), 189–214.URL http://linkinghub.elsevier.com/retrieve/pii/S1090944313000136http://dx.doi.org/10.1016/j.
rie.2013.03.002
Tomes, N., 1981. A Model of Fertility and Children’s Schooling. Economic Inquiry 19 (2), 209.Tucker, J. S., Friedman, H. S., Wingard, D. L., Schwartz, J. E., 1996. Marital History at Midlife as a Predictor of
Longevity: Alternative Explanations to the Protective Effect of Marriage. Health Psychology 15 (2), 94–101.Turner, C. F., Martinez, D. C., 1977. Socioeconomic Achievement and the Machiavellian Personality. Sociometry
40 (4), 325–336.University of Chicago Crime Lab, 2012. BAM - Sports Edition. University of Chicago Crime Labe Research and
Policy Brief (July).Uysal, S. D., Pohlmeier, W., 2011. Unemployment duration and personality. Journal of Economic Psychology 32 (6),
980–992.URL http://linkinghub.elsevier.com/retrieve/pii/S0167487011000481
Williams, R., 2006. Generalized ordered logit/partial proportional odds models for ordinal dependent variables. TheStata Journal 6 (1), 58–82.
29