personalized web search by using learned user profiles in re-ranking
TRANSCRIPT
Personalized Web Search by Using Learned User Profiles in Re-ranking
by
Jia Hu
Bachelor of Engineering Computer Science Department
Sichuan University 1998
Master of Communication & Computer Engineering
in Graduate School of Engineering Fukuoka Institute of Technology
2001
A thesis submitted to Florida Institute of Technology
in partial fulfillment of the requirements for the degree of
Master of Science in
Computer Science
Melbourne, Florida May 2008
TR-CS-2008-02

©Copyright 2008 Jia Hu
All Rights Reserved
The author grants permission to make single copies
Personalized Web Search by Using Learned User Profiles in Re-ranking a thesis by
Jia Hu
Approved as to style and content
Philip K. Chan, Ph.D. Associate Professor, Computer Sciences Dissertation Advisor Marius C. Silaghi, Ph.D. Assistant Professor, Computer Sciences Georgios C. Anagnostopoulos, Ph.D. Assistant Professor, Electrical and Computer Engineering William D. Shoaff, Ph.D. Associate Professor, Computer Sciences Department Head
iii
Abstract
Personalized Web Search by Using Learned User Profiles in Re-ranking
by
Jia Hu
Dissertation Advisor: Philip K. Chan, Ph.D.
Search engines return results mainly based on the submitted query; however, the
same query could be in different contexts because individual users have different
interests. To improve the relevance of search results, we propose re-ranking results
based on a learned user profile. In our previous work we introduced a scoring
function for re-ranking search results based on a learned User Interest Hierarchy
(UIH). Our results indicate that we can improve relevance at lower ranks, but not
at the top 5 ranks. In this thesis, we improve the scoring function by incorporating
new term characteristics, image characteristics and pivoted length normalization.
Our experimental evaluation shows that the proposed scoring function can improve
relevance in each of the top 10 ranks.

iv
Table of Contents
List of Figures . . . . . . . . . . . . . . . . . . . . . . . . . . . . . . . . . . . . . . . . . . . . . . . . . . . . . vi
Acknowledgements. . . . . . . . . . . . . . . . . . . . . . . . . . . . . . . . . . . . . . . . . . . . . . . . . vii
Chapter 1. Introduction . . . . . . . . . . . . . . . . . . . . . . . . . . . . . . . . . . . . . . . . . . . . . . 1
Chapter 2. Related Work . . . . . . . . . . . . . . . . . . . . . . . . . . . . . . . . . . . . . . . . . . . . . 4
Chapter 3. Re-Ranking with Long-Term Profiles . . . . . . . . . . . . . . . . . . . . . . . . . . 7
3.1. Term Characteristics . . . . . . . . . . . . . . . . . . . . . . . . . . . . . . . . . . . . . . 7
3.1.1. Term Frequency . . . . . . . . . . . . . . . . . . . . . . . . . . . . . . . . . . . 8
3.1.2. Term Span . . . . . . . . . . . . . . . . . . . . . . . . . . . . . . . . . . . . . . . 8
3.1.3. Term Specificity–Inverse Document Frequency . . . . . . . . . . 9
3.1.4. Node Specificity . . . . . . . . . . . . . . . . . . . . . . . . . . . . . . . . . 10
3.2. Image Characteristics . . . . . . . . . . . . . . . . . . . . . . . . . . . . . . . . . . . . . 11
3.3. Scoring a Web Page . . . . . . . . . . . . . . . . . . . . . . . . . . . . . . . . . . . . . . 12
3.3.1. Scoring Based On Term Characteristics . . . . . . . . . . . . . . . 12
3.3.2. Scoring Based On Image Characteristics . . . . . . . . . . . . . . 14
3.3.3. Combining Term and Image Scores . . . . . . . . . . . . . . . . . . 14
3.3.4. Combining Personal with Public Score . . . . . . . . . . . . . . . . 14
3.4. Document Length Normalization . . . . . . . . . . . . . . . . . . . . . . . . . . . . 15
3.4.1. Cosine Normalization . . . . . . . . . . . . . . . . . . . . . . . . . . . . . 15
3.4.2. Pivoted Normalization . . . . . . . . . . . . . . . . . . . . . . . . . . . . . 16

v
3.4.2.1. Pivoted Normalization Function . . . . . . . . . . . . . .19
Chapter 4. Empirical Evaluation of Re-Ranking with Long-Term Profiles . . . . . 23
4.1. Criteria . . . . . . . . . . . . . . . . . . . . . . . . . . . . . . . . . . . . . . . . . . . . . . . . 23
4.2. Dataset and Procedures . . . . . . . . . . . . . . . . . . . . . . . . . . . . . . . . . . . 24
4.3. Previous and Proposed Term Characteristics . . . . . . . . . . . . . . . . . . . 25
4.4. Term Characteristics . . . . . . . . . . . . . . . . . . . . . . . . . . . . . . . . . . . . . 28
4.5. Image Term Characteristics . . . . . . . . . . . . . . . . . . . . . . . . . . . . . . . . 29
4.6. Combining Term and Image Term Characteristics . . . . . . . . . . . . . . 30
4.7. Document Length Normalization . . . . . . . . . . . . . . . . . . . . . . . . . . . . 31
4.8. Analysis of Search Queries and Bookmarks . . . . . . . . . . . . . . . . . . . 33
Chapter 5. Conclusion . . . . . . . . . . . . . . . . . . . . . . . . . . . . . . . . . . . . . . . . . . . . . . 35
References . . . . . . . . . . . . . . . . . . . . . . . . . . . . . . . . . . . . . . . . . . . . . . . . . . . . . . . 38

vi
List of Figures
Figure 1. Personalized Search based on UIH . . . . . . . . . . . . . . . . . . . . . . . . . . . . . .5
Figure 2. User Interest Hierarchy . . . . . . . . . . . . . . . . . . . . . . . . . . . . . . . . . . . . . . .5
Figure 3. P(retrieval) – P(relevance) based on term scores . . . . . . . . . . . . . . . . . .18
Figure 4. P(retrieval) – P(relevance) based on image term scores . . . . . . . . . . . . 18
Figure 5. Pivoted Normalization Factor . . . . . . . . . . . . . . . . . . . . . . . . . . . . . . . . . 20
Figure 6. DCG Score based on Previous Four Characteristics . . . . . . . . . . . . . . . 26
Figure 7. DCG Score based on Three New Characteristics . . . . . . . . . . . . . . . . . .27
Figure 8. DCG Score based on Term Characteristics . . . . . . . . . . . . . . . . . . . . . . 28
Figure 9. DCG Score based on Image Term Characteristics . . . . . . . . . . . . . . . . .29
Figure 10. DCG Score based on Term and Image Characteristics . . . . . . . . . . . . 30
Figure 11. DCG Score based on Term with Normalization . . . . . . . . . . . . . . . . . 31
Figure 12. DCG Score based on Combined Normalization . . . . . . . . . . . . . . . . . 32
vii
Acknowledgements
I would like to thank my thesis advisor, Dr Chan, who helped me to make this
research success. I thanks for his strong instruction, innovative ideas and
constructive criticism. I also thank my committee members, Dr Silaghi and Dr
Anagnostopoulos, who gave me the comments and helped to finish this thesis. I
extend thanks to Hyoung-rae Kim and Chris Tanner who gave me the technical
support to construct the program for research.
I would also like to thank my parents in China, who always support me throughout
my educational endeavors.
1
1. INTRODUCTION
One of the users’ most frequent internet activities is looking for information via a
search engine. Although today’s search engines can meet a general request, they
cannot distinguish different users’ specific needs well. For example, a computer fan
may use the search term Leopard to search for information on Apple OS X Leopard,
but a biologist may use the same term to find information on the animal Leopard;
however, a public search engine treat the two queries the same way. Alternatively
personalized web search results provide customized results depending on each
user’s interests.
In our previous work we introduced a scoring function for personalizing search
results [1]. In this scoring function we trained an User Interest Hierarchy (UIH)
from each user’s bookmarks [2], and used four characteristics (the depth of a node,
where a term belongs to, the length of a term, the frequency of a term and the
emphasis of a term) to score a term that matches the UIH, then used the total term
scores for a web page to re-rank the search results. Results on precision and recall
showed that the personalized search based on the scoring function performed better
than public search in general, but not the top 5 ranks. In this thesis we improve the
scoring function by abandoning two characteristics of length and emphasis, which
we found ineffective experimentally, adding two characteristics of inverse
document frequency (IDF) and term span, and modifying the node depth
2
characteristic to node specificity characteristic. We also add image characteristics
into the scoring function to afford more robust information for scoring. And we
apply document length normalization in the scoring function to remove the bias to
longer web pages. We use Discounted Cumulative Gain (DCG) [3] as the
evaluation criterion and the results show our approach can perform better than
Google and our previous work at all top 10 ranks.
The main contributions of this thesis are:
• Removing two characteristics of term length and term emphasis from
previous scoring function by finding them ineffective
• Modifying depth of node characteristic to node specificity characteristic to
improve ranking accuracy
• Adding two new characteristics: inverse document frequency (IDF) and
term span to improve ranking accuracy
• Adding image characteristics by extracting image terms from img tags in a
web page
• Utilizing pivoted normalization on cosine normalization to balance the
scoring function for web pages with various length
• Performing experimental evaluations based on 11 users’ 22 search data, and
the results show the improved personalized search can perform better than
previous work and public search engine at all top 10 ranks.
3
The rest of this thesis is organized as follows: Chapter 2 presents related work
regarding personalized search. Chapter 3 describes our main approach to improve
the scoring function. Chapter 4 shows the experimental evaluation results. Finally,
Chapter 5 summarizes our work.
4
2. RELATED WORK
Jeh and Widom [4] proposed a personalized web search by modifying the global
PageRank algorithm. Instead of starting from random pages on the web, the
“random surfer” starts from a set of preferred pages (such as bookmarks). Hence,
the pages related to the preferred pages get higher PageRank score. Gauch and
Pretschner [5] presented a system that allows for the automatic creation of
structured user profile, and used the user profile to re-rank the search results, their
user profiles were built based on an existing category hierarchy. Agichtein and Brill
[6] investigated various implicit features to construct user profile and used different
ranking methods based on machine learning to re-rank the search results. Speretta
and Gauch [7] proposed another way to build user profile as a weighted concept
hierarchy, which is created from the Open Directory Project (ODP). Sieg et al. [8]
also used ODP to learn user profile for personalized web search. Today the ODP
contains more than 590,000 concepts, so they can only use a restricted depth of
level in the ODP hierarchy for experimental purpose. This caused the user profile
only contain the high level concepts in the hierarchy, and cannot cover the low
level concepts which are more specific in the hierarchy. So this may reduce the
accuracy of the personalized web search to match the user profile for satisfying
individual user needs. And using an existing hierarchy can make the user profile
contain many irrelevant concepts since each user’s interest could be quite specific.
To avoid these disadvantages of using existing category, Kim and Chan [2]
5
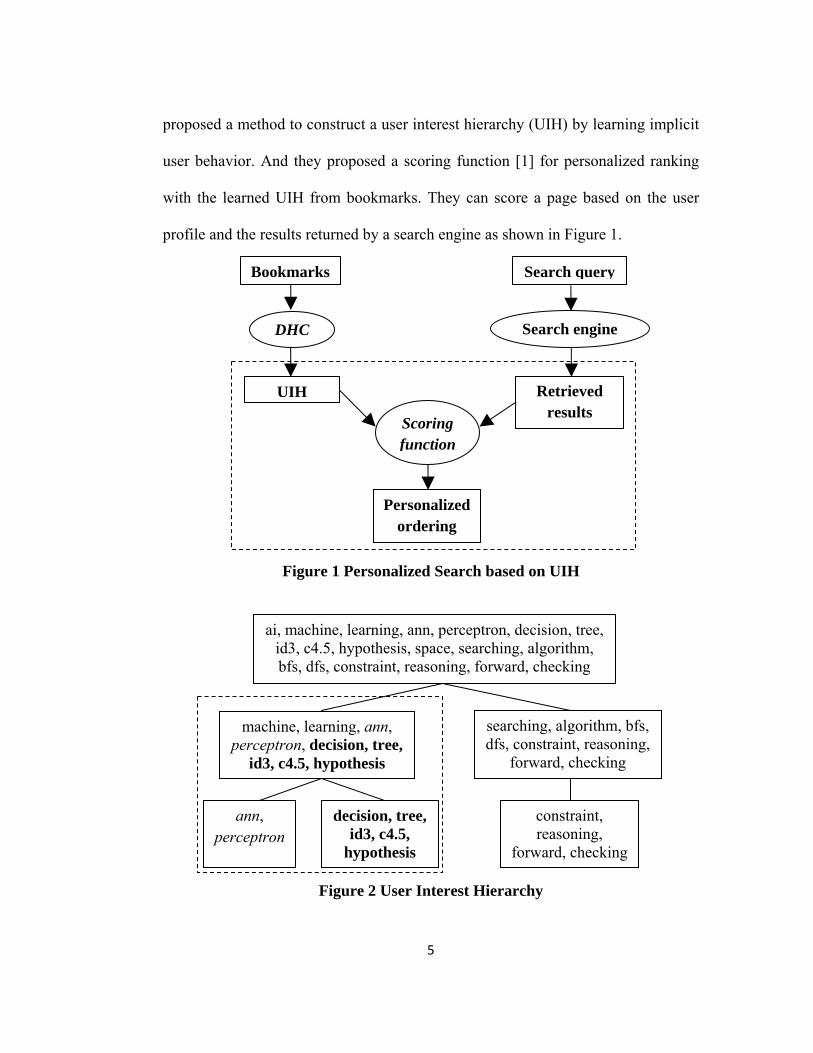
proposed a method to construct a user interest hierarchy (UIH) by learning implicit
user behavior. And they proposed a scoring function [1] for personalized ranking
with the learned UIH from bookmarks. They can score a page based on the user
profile and the results returned by a search engine as shown in Figure 1.
Figure 1 Personalized Search based on UIH
Figure 2 User Interest Hierarchy
Bookmarks
UIH
Personalized ordering
Retrieved results
Scoring function
DHC Search engine
ai, machine, learning, ann, perceptron, decision, tree, id3, c4.5, hypothesis, space, searching, algorithm, bfs, dfs, constraint, reasoning, forward, checking
machine, learning, ann, perceptron, decision, tree,
id3, c4.5, hypothesis
ann, perceptron
searching, algorithm, bfs, dfs, constraint, reasoning,
forward, checking
decision, tree, id3, c4.5,
hypothesis
constraint, reasoning,
forward, checking
Search query
6
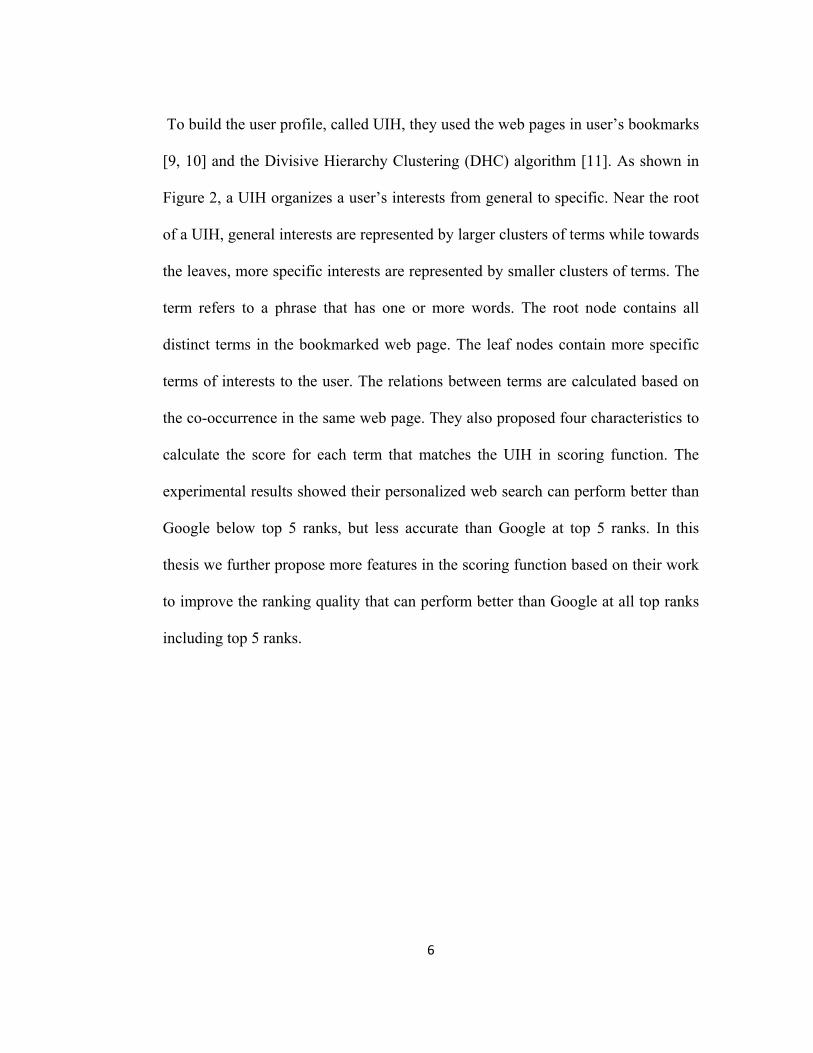
To build the user profile, called UIH, they used the web pages in user’s bookmarks
[9, 10] and the Divisive Hierarchy Clustering (DHC) algorithm [11]. As shown in
Figure 2, a UIH organizes a user’s interests from general to specific. Near the root
of a UIH, general interests are represented by larger clusters of terms while towards
the leaves, more specific interests are represented by smaller clusters of terms. The
term refers to a phrase that has one or more words. The root node contains all
distinct terms in the bookmarked web page. The leaf nodes contain more specific
terms of interests to the user. The relations between terms are calculated based on
the co-occurrence in the same web page. They also proposed four characteristics to
calculate the score for each term that matches the UIH in scoring function. The
experimental results showed their personalized web search can perform better than
Google below top 5 ranks, but less accurate than Google at top 5 ranks. In this
thesis we further propose more features in the scoring function based on their work
to improve the ranking quality that can perform better than Google at all top ranks
including top 5 ranks.

7
3. RE-RANKING WITH LONG -TERM PROFILES
Given a web page from the search results and a UIH, we identify matching terms
(words/phrases) that reside both in the web page and in the UIH. The scoring
function for matching terms consists of three major parts:
• Term characteristics
• Image characteristics
• Document length normalization
Below we introduce the three parts in detail.
3.1 Term Characteristics
Each matching term, ti, is analyzed according to four characteristics: the term
frequency of a term (Fti), the span of a term (Sti), the inverse document frequency of
a term (Iti), and the specificity of the UIH node, where a term belongs to (Nti). N can
be calculated while building a UIH from the web pages in a user’s bookmarks, and
different web page has different values for F, S and I characteristics. We estimate
the probability of these four characteristics and based on these probabilities, we
approximate the significance of each matching term.
8
3.1.1 Term Frequency
More frequent terms are more significant than less frequent terms. A document
that contains a matching term a number of times will be more related to a user’s
interest than a document that has the matching term only once.
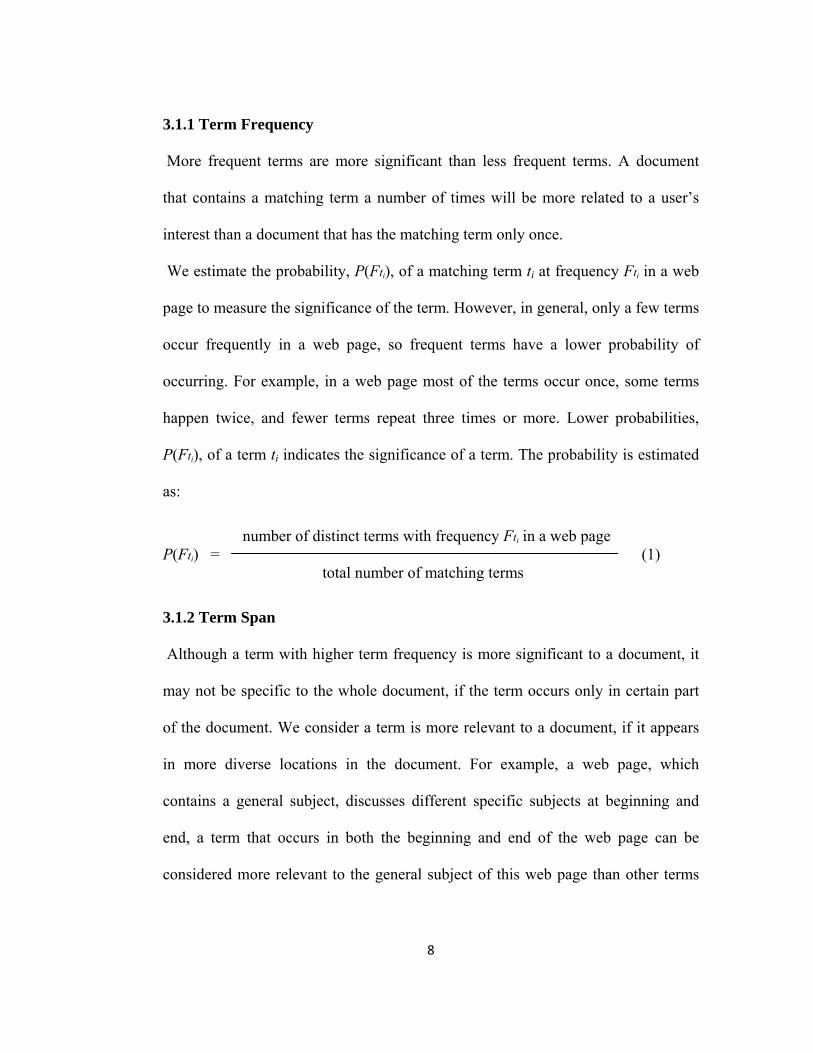
We estimate the probability, P(Fti), of a matching term ti at frequency Fti in a web
page to measure the significance of the term. However, in general, only a few terms
occur frequently in a web page, so frequent terms have a lower probability of
occurring. For example, in a web page most of the terms occur once, some terms
happen twice, and fewer terms repeat three times or more. Lower probabilities,
P(Fti), of a term ti indicates the significance of a term. The probability is estimated
as:
number of distinct terms with frequency Fti in a web page P(Fti) = (1) total number of matching terms
3.1.2 Term Span
Although a term with higher term frequency is more significant to a document, it
may not be specific to the whole document, if the term occurs only in certain part
of the document. We consider a term is more relevant to a document, if it appears
in more diverse locations in the document. For example, a web page, which
contains a general subject, discusses different specific subjects at beginning and
end, a term that occurs in both the beginning and end of the web page can be
considered more relevant to the general subject of this web page than other terms

9
that only occur in the beginning, which are considered only relevant to the specific
subject at beginning.
We measure the probability, P(Sti), of a matching term ti by counting the span Sti,
of the first occurring position and the last occurring position in a web page.
However, when a term occurs only once, Sti is zero. In general, terms with large
span have a lower probability of occurring. For example, in a web page most of the
terms occur only once, some terms occur multiple times at very close positions, and
fewer terms occur at much separated positions. Lower probabilities, P(Sti), of a
term ti indicates more significance of a term. The probability is estimated as:
number of distinct terms with span Sti in a web page P(Sti) = (2)
total number of matching terms
3.1.3 Term Specificity – Inverse Document Frequency
A term which occurs in many documents is not a good discriminator, and has less
significance than one which occurs in few documents. It is the more specific, low-
frequency terms that are likely to be of particular importance in identifying relevant
material.
How specific a term is estimated by how many documents contain this term and
can be calculated by the probability, P(Iti), of number of documents Iti in the search
results which contain the term ti over total number of documents in the search
results to measure the significance of the term. The probability is estimated as:
10
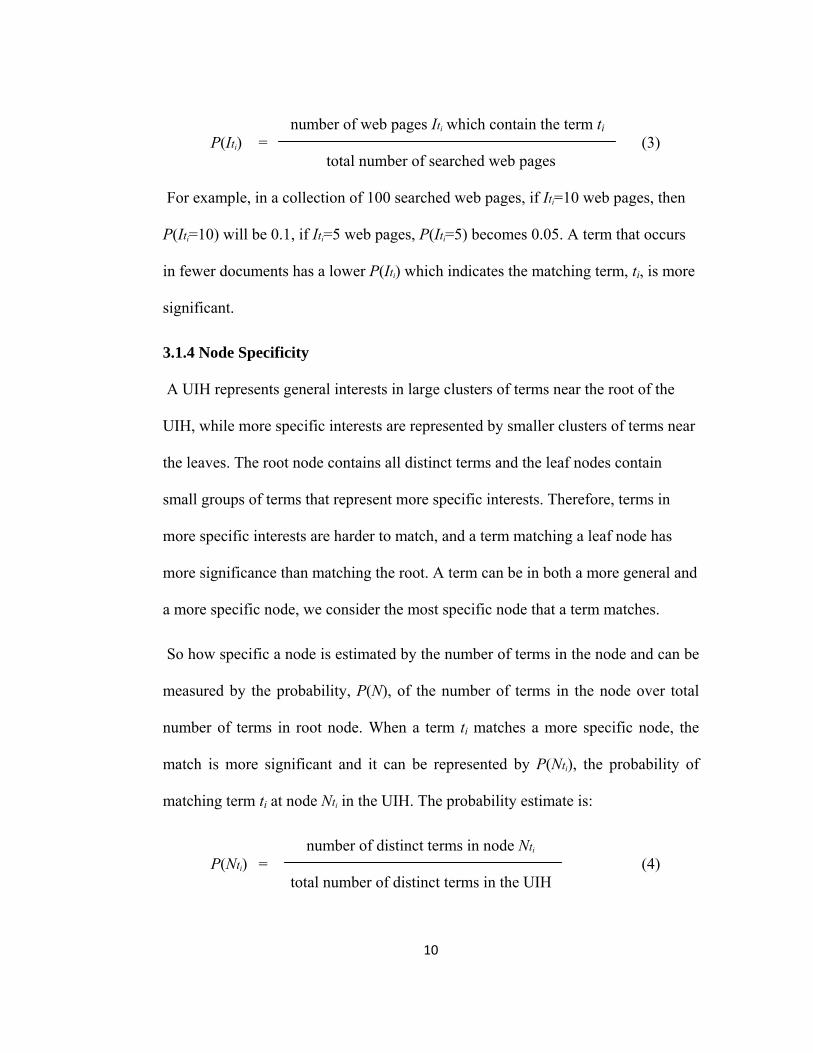
number of web pages Iti which contain the term ti P(Iti) = (3)
total number of searched web pages
For example, in a collection of 100 searched web pages, if Iti=10 web pages, then
P(Iti=10) will be 0.1, if Iti=5 web pages, P(Iti=5) becomes 0.05. A term that occurs
in fewer documents has a lower P(Iti) which indicates the matching term, ti, is more
significant.
3.1.4 Node Specificity
A UIH represents general interests in large clusters of terms near the root of the
UIH, while more specific interests are represented by smaller clusters of terms near
the leaves. The root node contains all distinct terms and the leaf nodes contain
small groups of terms that represent more specific interests. Therefore, terms in
more specific interests are harder to match, and a term matching a leaf node has
more significance than matching the root. A term can be in both a more general and
a more specific node, we consider the most specific node that a term matches.
So how specific a node is estimated by the number of terms in the node and can be
measured by the probability, P(N), of the number of terms in the node over total
number of terms in root node. When a term ti matches a more specific node, the
match is more significant and it can be represented by P(Nti), the probability of
matching term ti at node Nti in the UIH. The probability estimate is:
number of distinct terms in node Nti P(Nti) = (4)
total number of distinct terms in the UIH

11
For example, root node includes 100 terms (all terms), Nti=1 contains 20 terms, and
Nti=2 contains 10 terms. Then, P(Nti=1) will be 0.2 and P(Nti=2) becomes 0.1, the
Nti is more specific.
3.2 Image Characteristics
As images can speak a thousand words, images in a web page can attract a user’s
attention. So besides terms, we also extract terms associated with images from web
pages. A meaningful image should be large enough to attract users. If an image is
too small, it might be just an icon that has no relevance to the content of the
document. So we only consider images that satisfy one of these two conditions:
• Both the image width and height are larger than 50;
• Either the image width or height is larger than 50, and there is no icon or
arrow term included in the src, name or alt parameter.
From the img tags, we extract the image file name from the src parameter, and
terms from the alt and name parameters. For example, from the img tag below:
<img src="graphics/florida.gif" name="florida scene" alt="World | United States
| South | Florida" width="200" height="105" >
we extract the term florida from the src parameter, terms florida, scene from the
name parameter, and terms world, united, states, south, florida from the alt
parameter. Thus the terms we extracted from this img tag are florida, scene, world,
united, states, south.

12
But from the img tag below:
<img src="graphics/florida.gif" name="icon image" alt="World | United States |
South | Florida" width="40" height="50" >
we extract nothing since there is a term icon in the name parameter and the width is smaller than 50.
After extracting terms from all the qualified img tags that satisfy the conditions, we
filter these image terms by a stop list and a stemmer, then match these terms to the
UIH. Each matching image term, gi, is analyzed according to the same four
characteristics we discussed at previous section: the image term frequency (Fgi), the
span of an image term (Sgi), the inverse document frequency of an image term (Igi)
and the UIH node specificity where an image term belongs to (Ngi).
3.3 Scoring a Web Page
Now we have introduced the four characteristics for terms and image terms, in this
section we will describe in detail how to score a term based on these characteristics,
how to evaluate a web page by the terms extracted from the web page, and how to
combine the personalized score with public score to get a final page score.
3.3.1 Scoring Based On Term Characteristics
P(Fti, Sti, Iti, Nti) is the joint probability of all four characteristics occurring in term
ti -- Fti is the frequency of the term, Sti is the span of the term in the same web page,
Iti is the inverse document frequency of the term and Nti is the node where the term
belongs to. For computational reasons we model these four characteristics as

13
independent, which is a common approximation. Assuming independence among
the four characteristics, we estimate:
P(Fti, Sti, Iti, Nti) = P(Fti) × P(Sti) × P(Iti) × P(Nti)
The corresponding negative log likelihood is:
– log P(Fti, Sti, Iti, Nti) = – log P(Fti) – log P(Sti) – log P(Iti) – log P(Nti) (5)
Larger negative log likelihood means the term match is more significant. In
information theory [12], –log2 P(e) is the number of bits needed to encode event e,
hence Equation 5 yields the total number of bits needed to encode the four
characteristics, and it also stands for the average amount of gained information
which is measured in bits, when the four characteristics are observed. We also
consider that some characteristics are more important than the others. Term
frequency Fti, term span Sti and inverse document frequency Iti characteristics
represent the term relevance to a web page, however, node specificity Nti represents
the term relevance to a user’s interests. A simple heuristic used in this thesis
assumes Nti is twice as more important than the other characteristics. Thus the
weights w1=0.2, w2=0.2, w3=0.2, and w4=0.4 are assigned to Equation 5:
STi = – w1 log2 P(Fti) – w2 log2 P(Sti) – w3 log2 P(Iti) – w4 log2 P(Nti) (6)
The personal page score is based on the number of matching terms and how
interesting the terms are in a web page. We add all the term scores together as part
of the personalized page score and the scoring function for a web page pj is
formulated as:

14
n STpj = ∑ STi (7) i=1
where n is the total number of terms in a web page that match the UIH.
3.3.2 Scoring Based On Image Characteristics
In a similar way, we calculate the image term score SGi for image term gi:
SGi = – w1 log2 P(Fgi) – w2 log2 P(Sgi) – w3 log2 P(Igi) – w4 log2 P(Ngi) (8)
And we calculate the total image score SGpj for a web page pj as:
m SGpj = ∑ SGi (9) i=1
where m is the total number of matching image terms in a web page.
3.3.3 Combining Term and Image Score
After we get page score STpj from terms in Equation 7 and SGpj from image terms
in Equation 9 of a web page, we can combine them by simply adding them together,
so this leads to the final personalized score Spj for a web page:
Spj = STpj + SGpj (10)
3.3.4 Combining Personal with Public Score
The user profile (UIH) contains user preference, but it does not know the
importance of a document among all documents on the web. We wish to
incorporate the public scoring into our page scoring function so both public
importance of a page and individual interests are taken into account. We use the
rank order returned by Google as our public score. GOOGLEpj is the score of a
web page pj based on the page rank returned by Google for a search term. For a
given web page, pj, the personal and public page score (PPS) is calculated as:

15
PPSpj = c × R(Spj) + (1-c) × R(GOOGLEpj) (11)
The function R(GOOGLEpj) returns the rank of a web page, pj, with the public
page score GOOGLEpj, and R(Spj) is the rank of a web page, pj, with the personal
page score Spj (Equation 10). If the function R returns the rank in an ascending
order, more interesting web pages will have lower PPS values. Therefore, the
function R reverses the rank. The personal page score and the public page score are
weighted by the value of the constant c. According to [13], the equal weight c=0.5
shows the highest performance and is used in our experiments.
3.4 Document Length Normalization
Since longer documents have more terms, they are likely to have more matching
terms. Hence, n and m in Equations 7 and 9 are inherently larger for longer
documents. Thus longer documents might have a bias of getting higher scores and
are more likely to be retrieved. Document Length Normalization is used to reduce
the bias that the longer documents have in retrieval over the shorter documents.
3.4.1 Cosine Normalization
The most commonly used normalization technique is cosine normalization [14].
The cosine normalization factor can be computed as:
C = √ST12 + ST2
2 + ST3
2 + … + STn
2
where STi is the score for each term in a web page. The normalized term score is
formulated as:

16
STi STi
’ = (12)
C
The page score STpj in Equation 7 becomes:
n STpj = ∑ STi
’ (13) i=1
Similarly the Equation 9 for SGpj becomes:
m SGpj = ∑ SGi
’ (14) i=1
where SGi’ is the normalized score for each distinct image term.
3.4.2 Pivoted Normalization
Singhal et al. [15] show that better retrieval effectiveness results when a
normalization strategy retrieves documents with probability similar to their
probability of relevance. When the probability of retrieval is larger than the
probability of relevance, some non-relevant documents maybe retrieved, we need to
decrease the probability of retrieval. On the contrary, when the probability of
retrieval is smaller than the probability of relevance, some relevant documents may
not be retrieved, we need to increase the probability of retrieval. When the
probability of retrieval is similar with the probability of relevance, all the relevant
documents may be retrieved, which is the most effective.
We analyzed the data set from 22 searches collected in Section 4.2. For each
search, we ordered the searched top 100 web pages by their byte lengths and divide
them into 10 equal sized bins and each bin contains 10 web pages, thus there are a
17
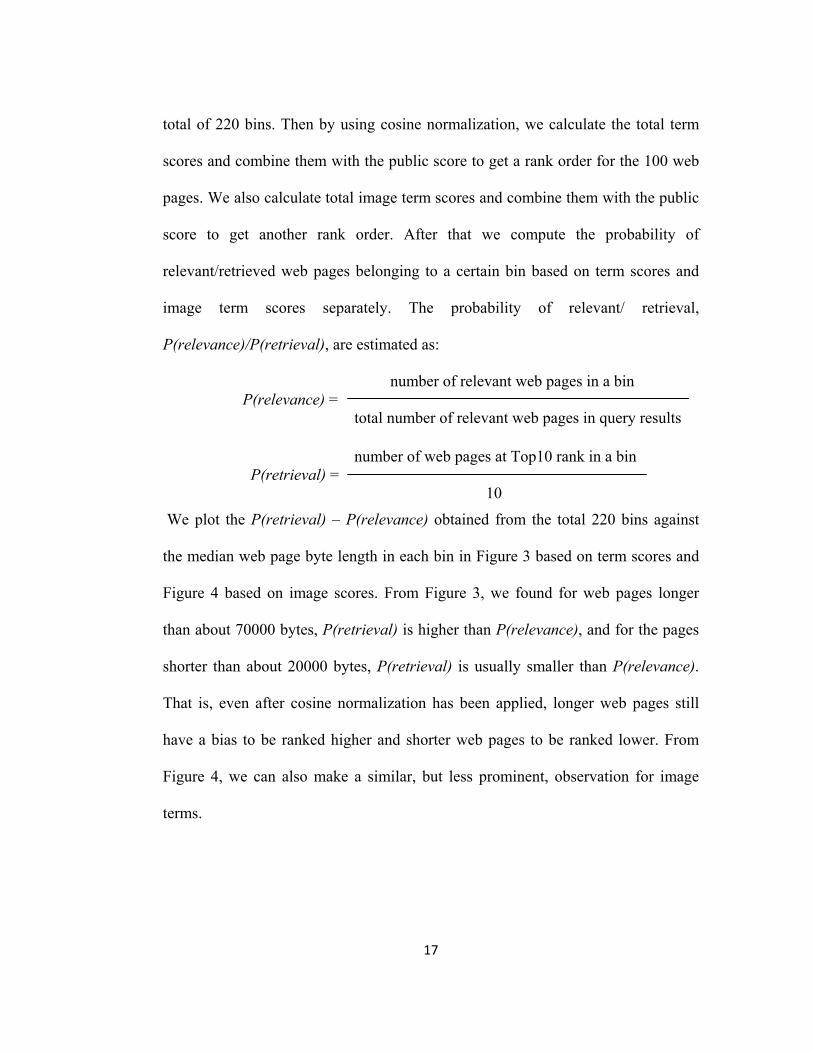
total of 220 bins. Then by using cosine normalization, we calculate the total term
scores and combine them with the public score to get a rank order for the 100 web
pages. We also calculate total image term scores and combine them with the public
score to get another rank order. After that we compute the probability of
relevant/retrieved web pages belonging to a certain bin based on term scores and
image term scores separately. The probability of relevant/ retrieval,
P(relevance)/P(retrieval), are estimated as:
number of relevant web pages in a bin P(relevance) = total number of relevant web pages in query results number of web pages at Top10 rank in a bin
P(retrieval) = 10
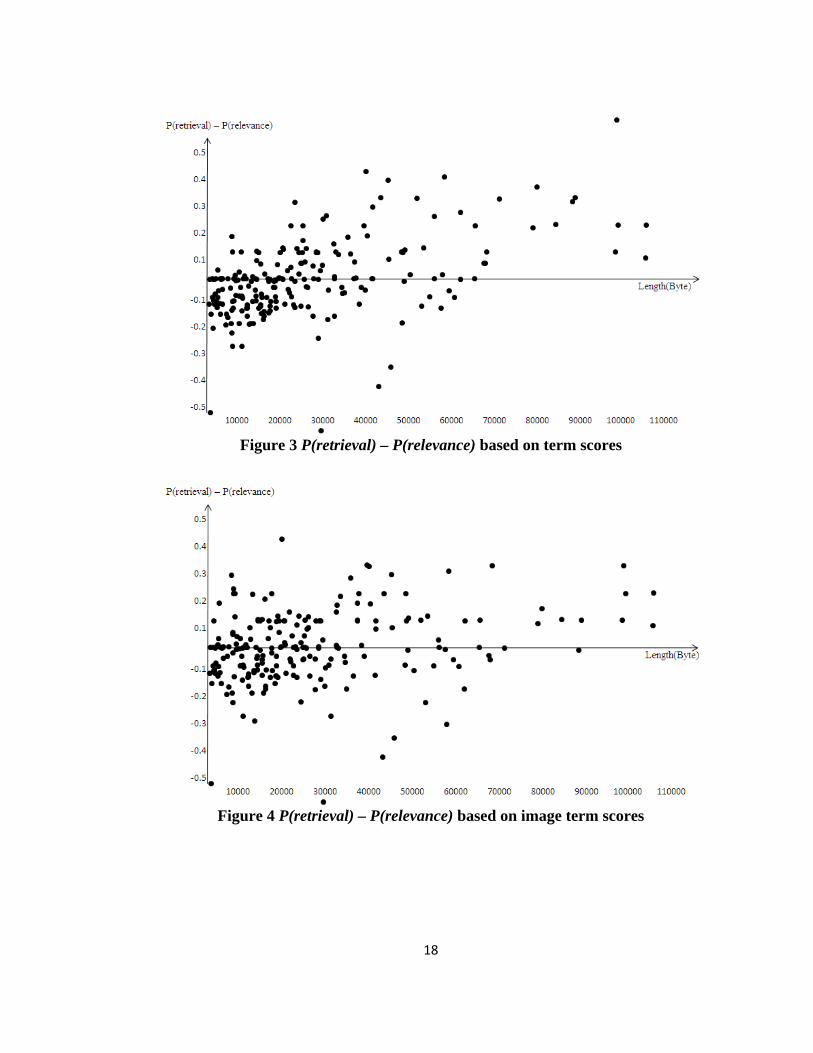
We plot the P(retrieval) – P(relevance) obtained from the total 220 bins against
the median web page byte length in each bin in Figure 3 based on term scores and
Figure 4 based on image scores. From Figure 3, we found for web pages longer
than about 70000 bytes, P(retrieval) is higher than P(relevance), and for the pages
shorter than about 20000 bytes, P(retrieval) is usually smaller than P(relevance).
That is, even after cosine normalization has been applied, longer web pages still
have a bias to be ranked higher and shorter web pages to be ranked lower. From
Figure 4, we can also make a similar, but less prominent, observation for image
terms.
18
Figure 3 P(retrieval) – P(relevance) based on term scores
Figure 4 P(retrieval) – P(relevance) based on image term scores
19
3.4.2.1 Pivoted Normalization Function
From Equation 12 we know a higher normalization factor decreases the score.
Thus the probability of retrieval of a web page is inversely related to the
normalization factor. From Figure 3 and Figure 4 we observe longer web pages
have a bias to be ranked higher than shorter web pages with cosine normalization
factor, so we should increase the normalization factor for longer web pages and
decrease it for shorter web pages.
Singhal et al. [15] propose a new normalization, pivoted normalization, based on
cosine normalization. Their observation is opposite from ours: P(retrieval) is larger,
not smaller, than P(relevance) for shorter documents and P(retrieval) is smaller,
not larger, than P(relevance) for longer documents. Thus when the cosine
normalization factor is less than a “pivot”, they increase the pivoted normalization
factor for shorter documents to decrease P(retrieval) for shorter documents,
otherwise they decrease the pivoted normalization factor for longer documents to
increase P(retrieval). But in our case, we need to decrease the pivoted
normalization factor for shorter documents and increase it for longer documents.
We illustrate the relationship between our pivoted normalization P (x-axis) and
cosine normalization C (y-axis) as a solid line in Figure 5. The amount of tilting of
the solid line at the pivot away from the identity (C=P) dotted line is the slope,
which is a parameter. From Figure 5, slope is:

20
P: P
ivot
ed n
orm
aliz
atio
n fa
ctor
α
(Clow,Plow)
(C,P) C = P
pivot (Cpivot,Ppivot)
P – Ppivot slope = tan (α) =
C – Cpivot
Since Cpivot = Ppivot the equation can be rewritten as:
P = Cpivot + slope × (C – Cpivot) (15)
C: Cosine normalization factor
Figure 5 Pivoted Normalization Factor
P is smaller than C on the left side of pivot, and P becomes negative when C is
smaller than the “x–intercept”. In order to avoid a negative value for P, we draw an
additional line from the origin to a point (Clow,Plow) on the line for the pivoted
normalization:
Plow P = tan (β) × C = × C (16)
Clow
β0

21
For each search query, Plow is the smallest positive pivoted normalization factor,
and Clow is the corresponding cosine normalization factor according to Equation 17
by substituting C with Clow and P with Plow in Equation 15:
Plow – Cpivot Clow = + Cpivot (17)
slope
So the revised pivoted normalization is:
Cpivot + slope × (C – Cpivot) if C ≥ Clow
P = Plow (18) × C if 0< C <Clow Clow
The new term score and image term score become:
STi STi
’ = (19)
P
SGi SGi
’ = (20)
P
STi is the score for each term in Equation 6 based on four term characteristics. SGi
is the score for each image term in Equation 8.
Similar to [15], we choose the average cosine normalization factor as the pivot.
After training from the data set we collected, we found the slope=1.2 is the best
value for term scores in Equation 19, and slope=1.1 is the best value for image
term scores in Equation 20. The difference is consistent with the trend being
steeper in Figure 3 for term scores than Figure 4 for image scores.
22
Besides the linear function for calculating pivoted normalization factor, we also
tried other non-linear functions like P = Cx/y, x and y are unequal integers, across
the zero point and pivot point with different combinations of x and y. And we also
tried the sigmoid function across the pivot point. But these functions could not
make a better performance than linear function and showed worse rank quality than
Google. We think this is because the pivoted normalization function is calculated
based on original cosine normalization function which is a linear function (the
diagonal in Figure 5), using non-linear function for pivoted normalization function
is not consistent with the original cosine normalization function. So this make the
non-linear functions increase/decrease the cosine normalization factor irregularly,
not like linear functions which increase/decrease the cosine normalization factor by
a certain regular slope.
23
4. EMPIRICAL EVALUATION OF RE-RANKING
WITH LONG-TERM PROFILES
In this section we evaluate all the features described in Section 3 to show how
search results can be improved to satisfy each user’s interests. We will evaluate the
results based on scoring term characteristics, image characteristics separately with
and without pivoted normalization, and the combined results with pivoted
normalization.
4.1 Criteria
To measure the ranking quality, we use the Discounted Cumulative Gain (DCG)
[3]. DCG is a measurement that gives more weight to higher ranked documents by
giving them different gain values G(r), where r is the rank, to incorporate different
relevance levels (highly relevant, relevant, and not relevant). DCG is defined as:
G(1) if r = 1 DCG(r) =
DCG(r–1) + G(r)/log(r) otherwise In our experiments, we used G(r) = 1 for non-relevant results, G(r) = 2 for
relevant results, and G(r) = 3 for highly relevant results, to reflect different
importance. So each ranked web page gets a DCG score, we compare the DCG
score computed from our personalized search results with public search results, the
bigger the DCG score at the same top rank the better rank quality.
24
4.2 Dataset and Procedures
In our experiments we used the same data set in previous work [1], the data were
collected from 11 different users and each user submitted 2 search terms that can
contain any Boolean operators. Some examples of the search terms used are
{review forum +"scratch remover", cpu benchmark, aeronautical, Free cross-stitch
scenic patterns, neural networks tutorial, DMC(digital media center), artificial
intelligence , etc.}
Then for each search term we used the top 100 web pages returned by Google. So
there are 2200 web pages used in our evaluation. To evaluate the ranking quality,
we asked each user to submit relevant ratings for the searched web pages. The
relevant rating is divided to three scales: highly relevant, relevant and not relevant.
As to UIHs, we used the same user profile data in [1], the profile data are
bookmarks from the 11 users and an UIH is learned for each user using the DHC
algorithm [11]. Web pages from both Google and bookmarks were parsed to
retrieve only texts. The terms (words and phrases) in the web pages are stemmed
and filtered through the stop list [16]. A phrase-finding algorithm [17] was used to
collect variable-length phrases. Words in selection boxes/menus were also removed
because they did not appear on the screen until a user clicked on them. Unimportant
contexts such as comments and style were also removed. To remove any negative
bias to Google, broken links that were still ranked high erroneously by Google
were excluded from the test, since those web pages are non-relevant to the user for
25
sure. Visual Basic and Java were used for implementation, and the program ran on
an Intel Pentium 4 CPU with 1.5G memory.
4.3 Previous and Proposed Term Characteristics
In our previous work [1], we used four characteristics for a term: the depth level of
a node where a term belongs to (Dti), the length of a term such as how many words
are in the term (Lti), the frequency of a term (Fti), and the emphasis of a term (Eti).
By using these four characteristics in scoring function, the precision and recall
results showed it performed better than Google at top 10, top 15 and top 20 ranks,
but could not outperform Google in top 5 ranks, which are the most important ones.
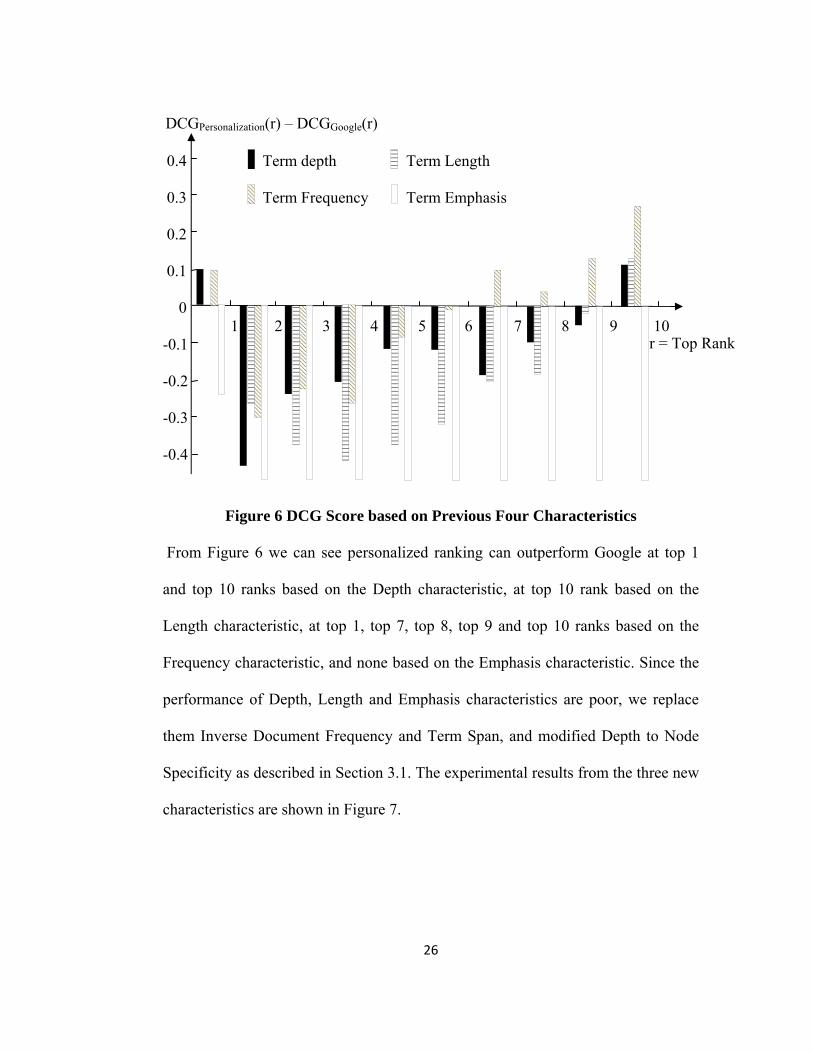
We analyzed the top 10 DCG scores for each of these four characteristics by the
experimentation described at previous section and compared them with Google
search. We show the results in Figure 6. The x axis is top rank r and the y axis is
the difference between the average DCG score from personalized ranking and the
score from Google search computed from total 22 searches, positive difference in
DCG means better performance than Google.
26
r = Top Rank
DCGPersonalization(r) – DCGGoogle(r)
0.4 Term depth Term Length 0.3 Term Frequency Term Emphasis 0.2 0.1 0
1 2 3 4 5 6 7 8 9 10 -0.1
-0.2
-0.3
-0.4
Figure 6 DCG Score based on Previous Four Characteristics
From Figure 6 we can see personalized ranking can outperform Google at top 1
and top 10 ranks based on the Depth characteristic, at top 10 rank based on the
Length characteristic, at top 1, top 7, top 8, top 9 and top 10 ranks based on the
Frequency characteristic, and none based on the Emphasis characteristic. Since the
performance of Depth, Length and Emphasis characteristics are poor, we replace
them Inverse Document Frequency and Term Span, and modified Depth to Node
Specificity as described in Section 3.1. The experimental results from the three new
characteristics are shown in Figure 7.
27
r = Top Rank
DCGPersonalization(r) – DCGGoogle(r)
0.4 IDF Term Span Node Specificity 0.3 0.2 0.1 0
1 2 3 4 5 6 7 8 9 10 -0.1
-0.2
-0.3
-0.4
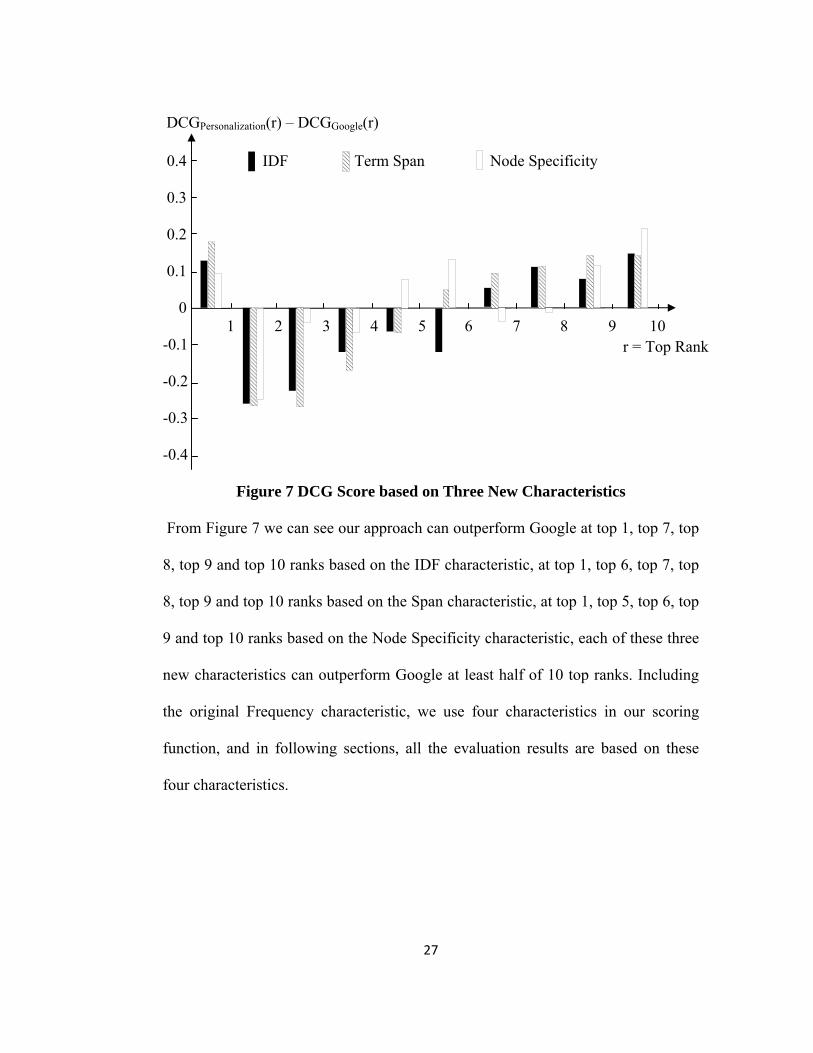
Figure 7 DCG Score based on Three New Characteristics
From Figure 7 we can see our approach can outperform Google at top 1, top 7, top
8, top 9 and top 10 ranks based on the IDF characteristic, at top 1, top 6, top 7, top
8, top 9 and top 10 ranks based on the Span characteristic, at top 1, top 5, top 6, top
9 and top 10 ranks based on the Node Specificity characteristic, each of these three
new characteristics can outperform Google at least half of 10 top ranks. Including
the original Frequency characteristic, we use four characteristics in our scoring
function, and in following sections, all the evaluation results are based on these
four characteristics.

28
r = top Rank
DCGPersonalization(r) – DCGGoogle(r)
4.4 Term Characteristics
We next combine these four characteristics to score each page and compare the
results with our previous approach and Google in Figure 8.
0.4 Term Characteristics Previous Work 0.3 0.2 0.1 0
1 2 3 4 5 6 7 8 9 10 -0.1
-0.2
-0.3
-0.4
Figure 8 DCG Score based on Term Characteristics
From Figure 8 we can see our personalized ranking based on term characteristics
can outperform Google at top 1, top 7, top 9 and top 10 ranks, at other top ranks
Google performs better. In most top ranks it performs better than our previous work,
which can only outperform Google at top 1, top 9 and top 10 ranks. However the
result is not ideal since we can only outperform Google at 4 top ranks out of 10.
29
r = top Rank
DCGPersonalization(r) – DCGGoogle(r)
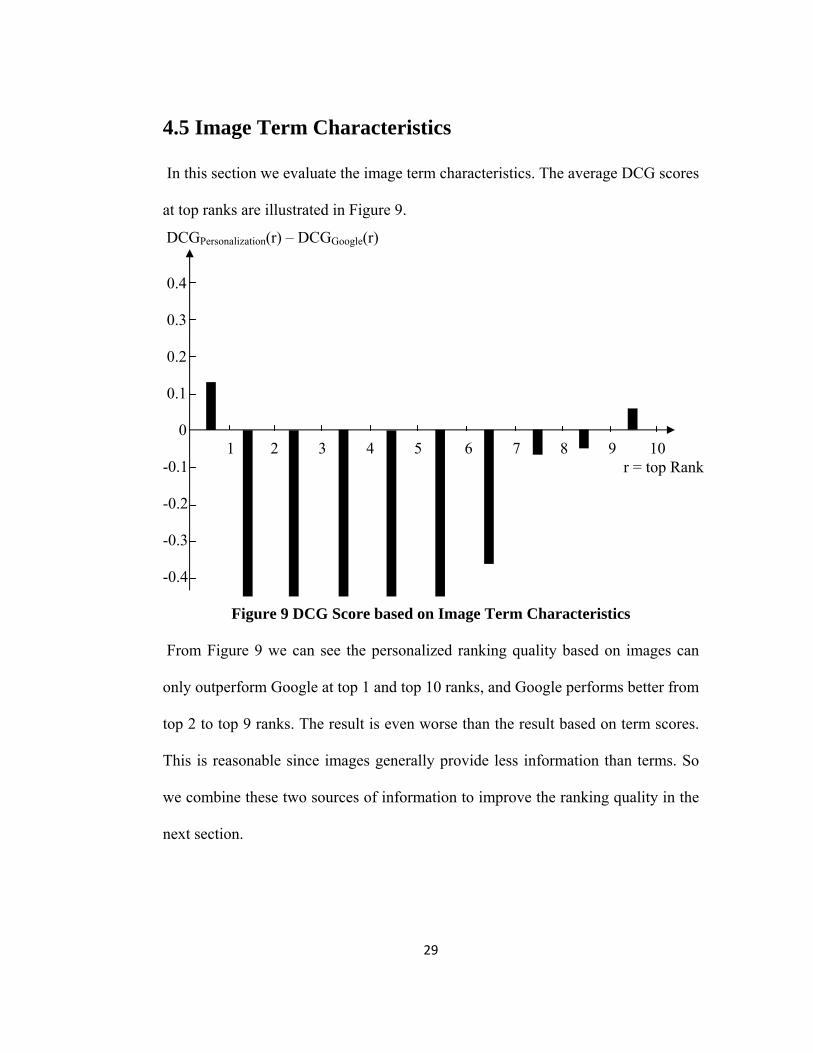
4.5 Image Term Characteristics
In this section we evaluate the image term characteristics. The average DCG scores
at top ranks are illustrated in Figure 9.
0.4 0.3 0.2 0.1 0
1 2 3 4 5 6 7 8 9 10 -0.1
-0.2
-0.3
-0.4
Figure 9 DCG Score based on Image Term Characteristics
From Figure 9 we can see the personalized ranking quality based on images can
only outperform Google at top 1 and top 10 ranks, and Google performs better from
top 2 to top 9 ranks. The result is even worse than the result based on term scores.
This is reasonable since images generally provide less information than terms. So
we combine these two sources of information to improve the ranking quality in the
next section.

30
r = top Rank
DCGPersonalization(r) – DCGGoogle(r)
4.6 Combining Term and Image Term Characteristics
In Equation 10, the personalized score is based on term score plus image score,
and after combine with Google rank in Equation 11, we re-rank each search’s
results, and compare the ranking quality with Google and our previous work. The
average DCG scores at top 10 ranks are illustrated in Figure 10.
0.4 Combined Result Previous Work 0.3 0.2 0.1 0
1 2 3 4 5 6 7 8 9 10 -0.1
-0.2
-0.3
-0.4
Figure 10 DCG Score based on Term and Image Characteristics
From Figure 10 we can see the personalized ranking quality based on the
combination of term and image characteristics can outperform Google at top 1, top
5, top 8, top 9 and top 10 ranks (half out of 10 top ranks). And it performs better
than our previous work at all 10 top ranks. This shows using the combined score is
better than using only term scores or image scores.
31
r = top Rank
DCGPersonalization(r) – DCGGoogle(r)
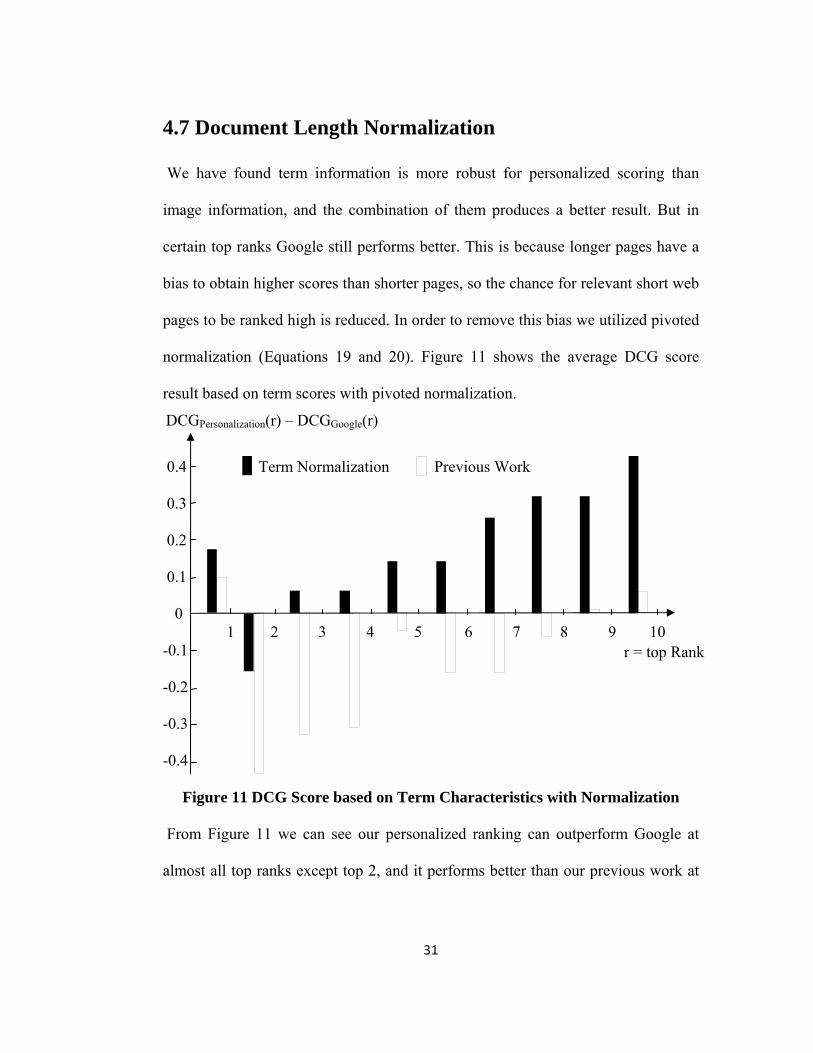
4.7 Document Length Normalization
We have found term information is more robust for personalized scoring than
image information, and the combination of them produces a better result. But in
certain top ranks Google still performs better. This is because longer pages have a
bias to obtain higher scores than shorter pages, so the chance for relevant short web
pages to be ranked high is reduced. In order to remove this bias we utilized pivoted
normalization (Equations 19 and 20). Figure 11 shows the average DCG score
result based on term scores with pivoted normalization.
0.4 Term Normalization Previous Work 0.3 0.2 0.1 0
1 2 3 4 5 6 7 8 9 10 -0.1
-0.2
-0.3
-0.4
Figure 11 DCG Score based on Term Characteristics with Normalization
From Figure 11 we can see our personalized ranking can outperform Google at
almost all top ranks except top 2, and it performs better than our previous work at
32
r = top Rank
DCGPersonalization(r) – DCGGoogle(r)
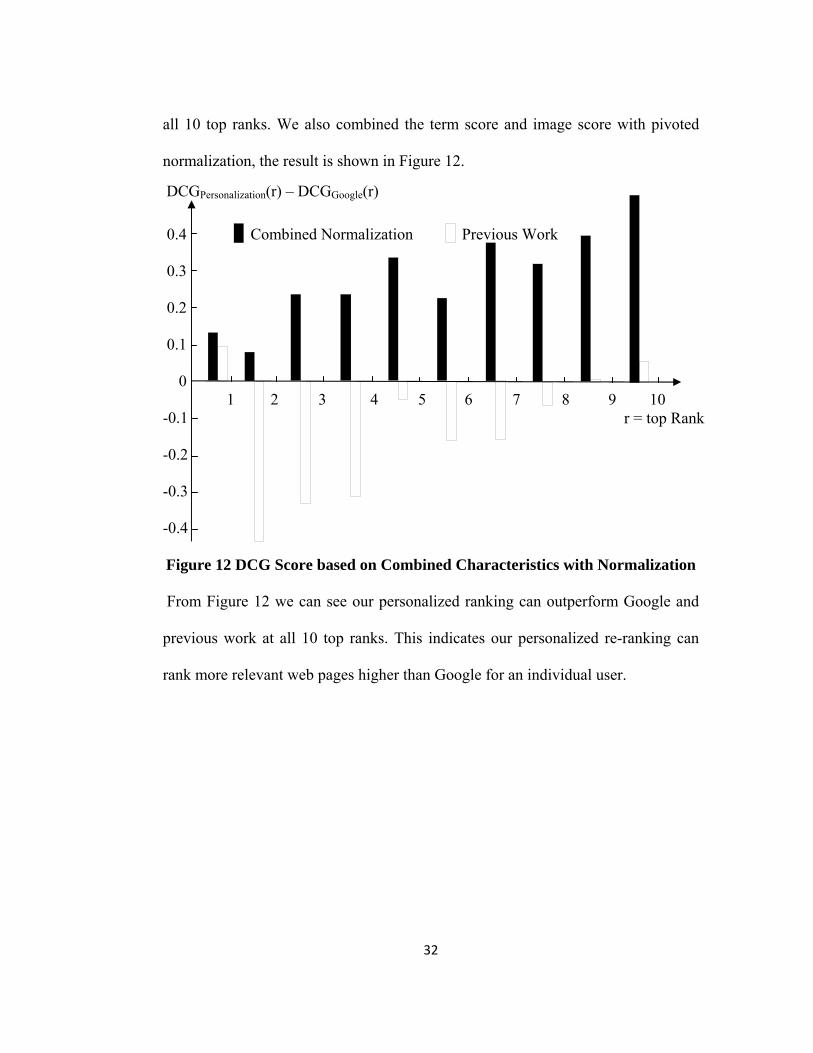
all 10 top ranks. We also combined the term score and image score with pivoted
normalization, the result is shown in Figure 12.
0.4 Combined Normalization Previous Work 0.3 0.2 0.1 0
1 2 3 4 5 6 7 8 9 10 -0.1
-0.2
-0.3
-0.4 Figure 12 DCG Score based on Combined Characteristics with Normalization
From Figure 12 we can see our personalized ranking can outperform Google and
previous work at all 10 top ranks. This indicates our personalized re-ranking can
rank more relevant web pages higher than Google for an individual user.
33
4.8 Analysis of Search Queries and Bookmarks
We also investigated which search queries yielded higher DCG score with
personalized search than with Google search. Out of 22 search queries (11 users × 2
search queries), our approach outperforms Google in 8 search queries (36%) at all
10 top ranks, partially outperform Google in 5 search queries (23%) over half of 10
top ranks, Google did completely for 5 search queries (23%), partially for 4 search
queries (18%). The search queries that personalized search outperforms completely
are {aeronautical, Caribbean History, Free cross-stitch scenic patterns, XML
Repository, ddr2 memory, Australia adventure tours. Australia ecology, java design
patters}, partially are {boston pics, complex variables, beos operating system,
artificial intelligence, sniper rifle}. The queries that Google outperforms
completely are {aerospace, cpu benchmark, review forum +"scratch remover",
windows xp +theme +skin, neural networks tutorial}, partially are {DMC (digital
media center), military weapons, extreme programming principles, woodworking
tutorial,}. For the search queries that our algorithm did not outperform Google, we
analyzed the search results and found that the relevant web pages in search results
are very few. For example, when a user searches review forum +"scratch remover",
there are only 4 highly relevant web pages rated by user out of 100 search results,
so improving the ranking quality for this search is quite difficult.
To understand why some search queries did not perform well using personalized
search, we also analyzed the bookmarks, which are used for learning the user
34
profiles. When we compare the bookmarks with the highly relevant retrieved web
pages, we found that they are unrelated. For example, a user used “woodworking
tutorial” as a search query, but he never bookmarked web pages related to that
query. This implies bookmarks are useful for building user profiles, but they are not
sufficient.
35
5. CONCLUSION
This thesis improves our previous work on personalized search by enhancing the
accuracy of scoring function. We eliminated two term characteristics, term length
and term emphasis, from previous scoring function because we found these two
characteristics made little contribution to the rank quality. We also modified the
depth of node characteristic to the node specificity characteristic which is more
effective to a high rank quality. And we proposed two additional term
characteristics, inverse document frequency (term specificity) of a term and term
span, which we found are very useful to score a term. So the four characteristics
used in our new scoring function are: term frequency, term span, inverse document
frequency (term specificity) and node specificity. Our new scoring function works
by the following steps:
1. For each term that matches the user’s UIH profile in a web page, we
calculated the probability for each of the four characteristics.
2. After scoring all the terms, we applied a pivoted normalization factor to
each term score for normalizing the document length, and added the
normalized term scores together to represent the personalized term score for
this web page.
3. In order to enrich the content of scoring function we also extracted image
terms from all qualified img tags in a web page and calculated the
personalized image score for this web page in the same way.
36
4. After getting the personalized term score and image score for a certain web
page, we added them together to represent a final personalized score for this
web page.
5. We combined the personalized score with public score equally to get a final
score of personalized search for this web page.
6. Re-rank the returned top 100 public search results by the final score in a
decreasing order as a personalized search result.
After re-ranking the search results by our proposed scoring function, we evaluated
the performance by comparing with Google search and our previous work. Our
previous work showed it could not perform better than Google at Top5 rank. By
calculating average DCG scores from a collected data set, we found the improved
personalized search based on term score without pivoted normalization factor can
outperform Google at 4 top ranks out of 10, and can outperform our previous work
at 9 top ranks out of 10. While combining term score and image score without
pivoted normalization factor as the personalized search score the result was better,
it can outperform Google at 5 top ranks out of 10, and can outperform our previous
work at all 10 top ranks. After we added pivoted normalization factor into the
scoring function to normalize the document length, our approach can outperform
Google at 9 top ranks out of 10, and can outperform our previous work at all 10 top
ranks. The personalized search based on combination of term score and image
score with pivoted normalization factor can outperform both Google and our
37
previous work at all 10 top ranks. So the new characteristics, extracted image terms
and pivoted normalization help to improve the ranking quality.
Although the new scoring function performed well on average for the 22 search
queries, for some queries, our algorithm did not outperform Google. We found
some search queries are too specific that the relevant search results are very few.
This makes the scoring function very hard to improve the ranking quality of these
certain searches. And we also found some search queries are not related to the
user’s bookmarks. Hence, improving ranking quality with only information from
bookmarks is not sufficient. Our future work may capture user’s recent interested
web pages by implicit indicators like mouse movement, mouse click etc, and use
these recent interested web pages to construct short term UIH to improve the
ranking quality.
38
REFERENCES
1. Kim, H., and Chan, P. K. Personalized Ranking of Search Results with
Learned User Interest Hierarchies from Bookmarks. In Advances in Web
Mining and Web Usage Analysis (LNCS 4198), O. Nasraoui, O. Zaine, M.
Spiliopolou, B. Mobasher, B. Masand & P. Yu (editors) pp 158-176,
Springer, 2006.
2. Kim, H., and Chan, P. K. Learning implicit user interest hierarchy for
context in personalization. International Conference on Intelligent User
Interfaces (2003) 101-108.
3. Järvelin, K., and Kekäläinen, J. IR evaluation methods for retrieving highly
relevant documents. In Proceedings of SIGIR ‘00, 41-48, 2000.
4. Jeh, G., and Widom, J. Scaling Personalized Web Search. The Twelfth
International World Wide Web Conference, 2003, Budapest, HUNGARY.
5. Susan, G., and Alexander P. Ontology Based Personalized Search. Proc.
11th IEEE Intl. Conf. on Tools with Artificial Intelligence, pp. 391-398,
Chicago, November 1999.
6. Eugene, A., Susan, D., and Eric, B. Improving Web Search Ranking by
Incorporating User Behavior Information. SIGIR’06, August 6–11, 2006,
Seattle, Washington, USA.
7. Mirco, S., and Susan, G. Personalized search based on user search histories.
In Proceedings of WI ’05, pages 622–628, 2005.
39
8. Ahu, S., Bamshad, M., and Robin, B. Learning Ontology-Based User
Profiles: A Semantic. Approach to Personalized Web Search. IEEE
Intelligent Information Bulletin. November2007 Vol.8 No.1.
9. Li, W. S., Vu, Q., Agrawal, D., Hara, Y., and Takano, H.
PowerBookmarks: A System for personalizable web information
organization, sharing, and management. In Proc. of the 8th Intl. World
Wide Web Conference, Toronto, Canada (1999).
10. Maarek, Y. S., and Ben-Shaul, I. Z. Automatically Organizing Bookmarks
Per Contents, Proc. 5th International World Wide Web Conference (1996).
11. Kim, H., and Chan, P. K. Learning implicit user interest hierarchy for
context in personalization. International Conference on Intelligent User
Interfaces (2003) 101-108.
12. Mitchell, T. M. Machine Learning. New York: McGraw Hill (1997).
13. Kim, H. Learning Implicit User Interest Hierarchy for Web Personalization,
PhD Thesis, Florida Tech, 2005.
14. Salton, G., Wong, A., and Yang, C. S. A vector space model for
information retrieval. Journal of the American Society for Information
Science, 18(11):613-620, November 1975.
15. Singhal, A., Buckley, C., Mitra, M., and Salton, G. Pivoted Document
Length Normalization. In Proc. 19th Annual International ACM SIGIR
40
Conference on Research and Development in Information etrieval, pp. 21-
29, 1996.
16. Frakes, W. B., and Baeza-Yates, R. Information Retrieval: Data Structures
and Algorithms, Prentice-Hall (1992).
17. Kim, H., and Chan, P. K. Identifying variable-length meaningful phrases
with correlation functions, IEEE International Conference on Tools with
Artificial Intelligence, IEEE press (2004) 30-38.