perspectives for the brazilian economy and the role of bndes andre carvalhal head of international...
Post on 19-Dec-2015
213 views
TRANSCRIPT

Perspectives for the Brazilian Economy and the Role of BNDES
Andre CarvalhalHead of International Capital Markets
June 2010 – São Paulo

BNDES Highlights
Founded on June 20th, 1952
100% state-owned company
Key instrument for implementation of Federal Government’s
industrial and infrastructure policies
Support to micro, small and medium-sized companies
Main provider of long-term financing in Brazil
Emphasis on financing investment projects
EXIM activities
Equity investor through BNDESPAR

Finances long-term investments
Equity Participation
BNDES
BNDESPAR
Internationalization of Brazilian companies
BNDES Limited
Group Structure
Finances capital goods production and purchases
FINAME
As of Dec 31, 2009
Consolidated Assets
R$ 386.6 billion US$ 222.0 billion

Financing of:
• Complete business projects
• Export of goods and services
• Machinery and equipment
Equity Investment
• Stocks and debentures
• Venture Capital
• Seed Capital Funds
• Private Equity Funds
Main Instruments
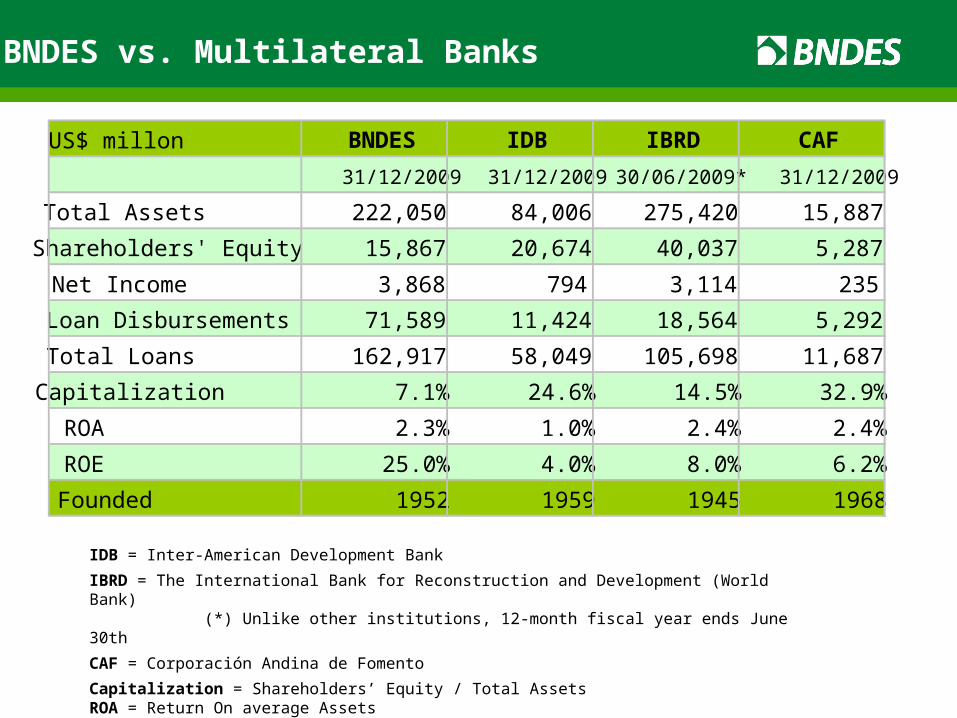
BNDES vs. Multilateral Banks
IDB = Inter-American Development Bank
IBRD = The International Bank for Reconstruction and Development (World Bank) (*) Unlike other institutions, 12-month fiscal year ends June 30th
CAF = Corporación Andina de Fomento
Capitalization = Shareholders’ Equity / Total AssetsROA = Return On average AssetsROE = Return On average Equity
US$ millon BNDES IDB IBRD CAF
31/12/2009 31/12/2009 30/06/2009* 31/12/2009
Total Assets 222,050 84,006 275,420 15,887
Shareholders' Equity 15,867 20,674 40,037 5,287
Net Income 3,868 794 3,114 235
Loan Disbursements 71,589 11,424 18,564 5,292
Total Loans 162,917 58,049 105,698 11,687
Capitalization 7.1% 24.6% 14.5% 32.9%
ROA 2.3% 1.0% 2.4% 2.4%
ROE 25.0% 4.0% 8.0% 6.2%
Founded 1952 1959 1945 1968

Perspectives for the Brazilian Economy
The Brazilian economy can grow much faster than the
average in developed countries
Investments will be driven by four main sectors: oil & gas,
electric power, logistics and housing
Opportunities for intensive strategies in innovation and social
and environmental sustainability
Main challenges: increase aggregate investment/GDP rate,
and boost competitive progress in the manufacturing industry

GDP may grow 5% p.a. in the 2010-2014 period
Source: IBGE.
GDP: Annual Real Variation (%)GDP: Annual Real Variation (%)
* 2009 and Avg 2010-14: BNDES' Forecasts.
Sources: IBGE and BNDES.
*
2.8 2.5
5.7
3.24.0
6.15.1 5.0
-0.2
-0.50.51.52.53.54.55.56.5
Average1984-93
Average1994-03
2004 2005 2006 2007 2008 2009 Average2010-14

Investment has strong growth path
Source: BNDES. Elaborated by: APE/BNDES
Forecast of Investment Ratio 2009-2012 (% of GDP)
16,4
17,4
18,7
21,2
20,2
18,6
16,7
15,0
16,0
17,0
18,0
19,0
20,0
21,0
22,0
2006 2007 2008 2009 2010 2011 2012
Forecast

BNDES was responsible for 37% of total credit increase since sep/08
BNDES was responsible for 37% of total credit increase since sep/08
Source: BNDES. *considering the average exchange rate for each year
BNDES Approvals and Disbursements1 (US$ billion)BNDES Approvals and Disbursements1 (US$ billion)
10.913.1 13.6 12.9
19.322.3 23.5
34.1 33.1
50.6 50.5
66.3 68.8
85.2
71.5
88.2
0
10
20
30
40
50
60
70
80
90
2003 2004 2005 2006 2007 2008 2009 2010*
Dis burs ements A pprovals
*last 12 months up to January 2010

Disbursements by Business Sector
52%
30%
11%
7%
46%
35%
12%
7%
48%
30%
14%
8%
40%
38%
17%
5%
50%
36%
9%
5%
53%
33%
7%
7%
40%
40%
8%
12%
43%
39%
6%
12%
46%
35%
5%
14%
2001 2002 2003 2004 2005 2006 2007 2008 2009
I ndustry I nfrastructure Farming and Cattle Raising Trade and Services

3,776 5%
2,632 4%
45,558 64%
13,026 18%
547 1%6,055 8%
2009 Operations
Exchanged to US dollar on disbursement date
US$ 72 billion
Number of Operations
390,729
Disbursements
225,29658%
28,725 7%
23,711 6%
112,997 29%
micro and small individuals large othermedium
PetrobrasPetrobras
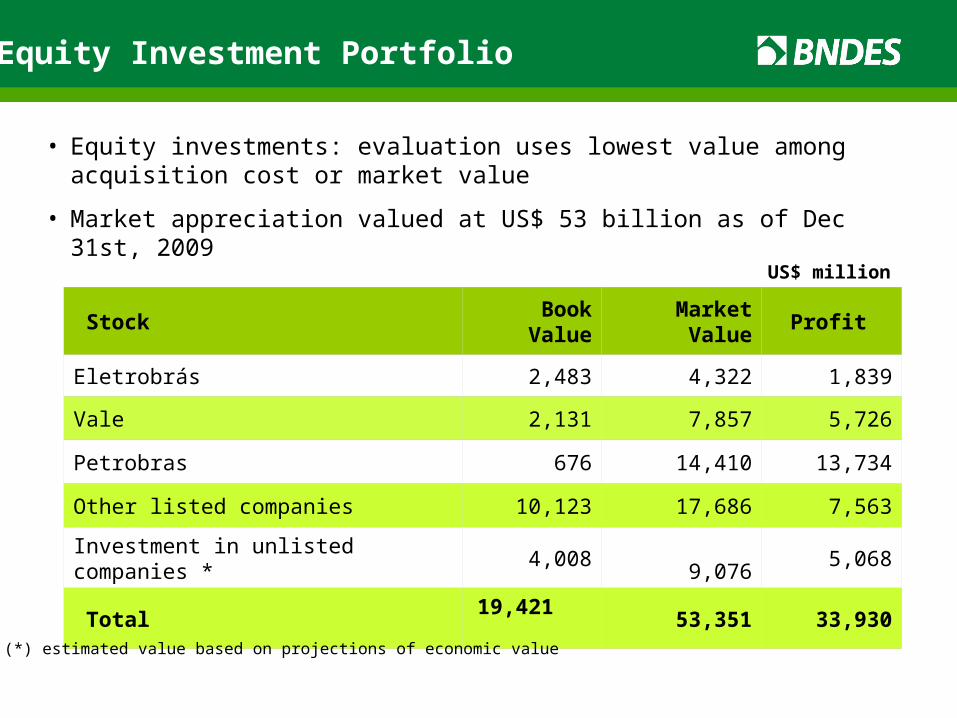
Equity Investment Portfolio
• Equity investments: evaluation uses lowest value among acquisition cost or market value
• Market appreciation valued at US$ 53 billion as of Dec 31st, 2009
Stock Book Value Market Value Profit
Eletrobrás 2,483 4,322 1,839
Vale 2,131 7,857 5,726
Petrobras 676 14,410 13,734
Other listed companies 10,123 17,686 7,563
Investment in unlisted companies * 4,008 9,076 5,068
Total 19,421 53,351 33,930
(*) estimated value based on projections of economic value
US$ million

Investment Outlook: Positive ProspectsInvestment Outlook: Positive Prospects
Sectors Growth 2005-8 2010-13 (%)
Infrastructure 111 152 6.5
Industry 191 271 7.2
Total 302 423 7.0
US$ billion
US$/R$ = 1.80
Source: BNDES Forecast

Sectors
US$ billion Growth
2005-2008 2010-2013 % year
Electric Power 38 51 6.4
Telecom 37 37 0.2
Sanitation 12 22 11.7
Railroads 9 16 13.2
Roads 23 33 7.8
Ports 5 14 22.9Infra 111 152 6.5
Investments in Infrastructure were not affected by the crisis
Investments in Infrastructure were not affected by the crisis
Source: BNDES

Investment in Industry: Domestic-led sectors have already recovered from the crisis
Investment in Industry: Domestic-led sectors have already recovered from the crisis
Sectors US$ billion Growth
2005-2008 2010-2013 % year
Oil and Gas 112 171 8.8
Mining 29 25 (3.1)
Steel 15 20 5.7
Petrochemical 5 17 28.9
Vehicles 12 17 7.3
Electronics 8 12 6.7
Pulp & Paper 10 10 0.5
Industry 191 271 7.3
Source: BNDES

Challenges for InfrastructureChallenges for Infrastructure
PAC (Growth Acceleration Program)
2014 World Cup
2016 World Olympics
Pre-salt
Environmentally sustainable projects
PAC (Growth Acceleration Program)
2014 World Cup
2016 World Olympics
Pre-salt
Environmentally sustainable projects

Focus on infrastructure: PAC (Growth Acceleration Program )
BRAZIL AGENDA
PAC Program
Source: Presidency of Republic (www.pac.gov.br)
FX: 1.7412 (Dec.09)
PAC Investments: 2007 - 2010US$ billion % of Share
ENERGY: 157.8 55
SOCIAL & URBAN: 98.1 34LOGISTICS: 33.5 12
TOTAL 289.4 100.0
ENERGY Electric Energy - Generation - Transmission - Distribution Oil & Gas Renewable Energy
LOGISTICS Highways Railroads Ports Airports Waterways Merchant Marine
SOCIAL & URBAN Electricity for Everyone Sanitation Urbanization Subways Water Resources

Disbursements by Region
BNDES is an Important Supporter of PAC
% of Share
73.4
6.520.1
100.0
Inter-regional
27%
Center-West
5%
Northeast
24%
North16%
South8%
South-East20%
BNDES in PAC
• 327 projects: - Supported Projects: US$ 57.3 Bn
- Eligible Projects: US$ 13.1 Bn• 17 Prospective Projects: US$ 6.7 Bn
FX: 1.7306 (Apr.10)
BNDES Portfolio in PACUS$ billion % of Share
ENERGY: 56.5 73.4
SOCIAL & URBAN: 5.0 6.5LOGISTICS: 15.5 20.1
TOTAL 77.0 100.0

• US$ 883.3 billion in investments as of 2011: US$ 532.7 billion in the 2011-2014 period and US$ 350.9
billion after 2014:
US$ 633.3 billion for energy
US$ 60.5 billion in transport, including railways and the High-speed Train (TAV)
Assorted social investments:
US$ 10 billion in urban mobility
US$ 12,8 billion in the Citizen’s Community program
My House, My Life (MHML) goal of 2 million homes
Other programs include A Better City, Water for Everyone and Electricity for Everyone
US$/R$ = 1.80
PAC 2

2014 World Cup2014 World Cup
• For the 2014 World Cup, FIFA requires investments to the tune of US$ 6.4 billion
• BNDES ProCopa Programs
• Arenas
Up to US$ 2.7 billion to build and remodel stadiums and urbanization investments in surrounding areas.
• Tourism
Up to US$ 556 million to build, remodel, expand and modernize hotels.
• For the 2014 World Cup, FIFA requires investments to the tune of US$ 6.4 billion
• BNDES ProCopa Programs
• Arenas
Up to US$ 2.7 billion to build and remodel stadiums and urbanization investments in surrounding areas.
• Tourism
Up to US$ 556 million to build, remodel, expand and modernize hotels.
US$/R$ = 1.80

Brazil has a great opportunity to improve its urban
infrastructure and generate employment
Investment in: transport, urban mobility, hotels, tourism,
communications, security, stadiums and electric energy:
US$ 16 billion in investments in the Olympics will
produce an impact US$ 56.8 billion by the end of 2027*
All these investments will have relevant impacts on a
wide array of production chains as well as on the
expectations of the private sector.
*government’s forecast US$/R$ = 1.80
2016 Olympics2016 Olympics
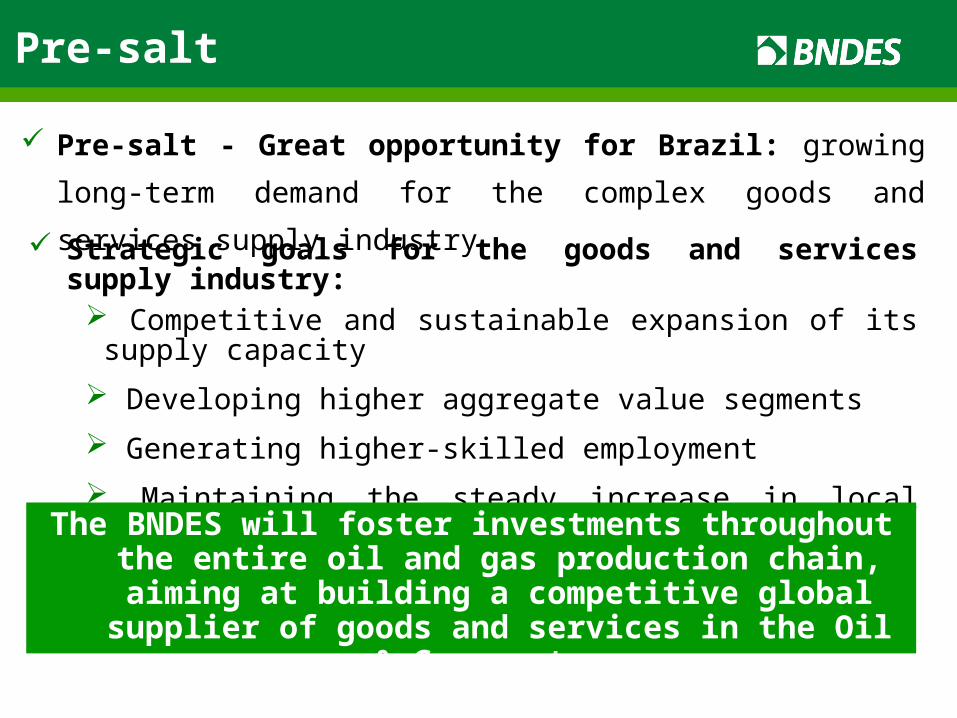
Pre-salt - Great opportunity for Brazil: growing long-term
demand for the complex goods and services supply industry
Strategic goals for the goods and services supply industry: Competitive and sustainable expansion of its supply capacity
Developing higher aggregate value segments
Generating higher-skilled employment
Maintaining the steady increase in local goods & services
Pre-salt
The BNDES will foster investments throughout the entire oil and gas production chain, aiming at building a
competitive global supplier of goods and services in the Oil & Gas sector.

Impacts from Petrobras investments on the production chain (2009-2013)
US$ 111.6 bn in investments may generate industrial production of almost US$ 202.2 billion
Total investments represent 22% of the pre-salt. Therefore, such impacts are still underestimated and have room for growth.
Source: Petrobrás and IBGE. Elaborated: APE/BNDES
In US$ billion Direct Effect Indirect Effect Total
Machinery and Equipment 43.1 8.3 51.4Transport Equipment (especially Ship-building) 28.1 6.8 34.9Metals 11.0 19.9 30.9Other production sectors 9.1 36.9 46.0Trade 13.2 8.6 21.9Services 7.1 34.0 17.1
Total 111.6 90.6 202.2
US$/R$ = 1.80

Brazil’s Long Term ChallengesBrazil’s Long Term Challenges
Resume and qualify long-term planning (energy, logistics, environment, IT infrastructure, ...)
Promote and stimulate domestic savings in order to provide long-term funds for investment (banks and capital market)
Develop capacity for innovation and competitiveness in the manufacturing industry, and promote global presence of Brazilian companies (vs. significant challenge due to exchange rate appreciation)
Increase opportunities for social mobility (job expansion, development/improvement in education) and reduction of the inequality in income distribution
Promote innovation and development of renewable energy sources
The Brazilian Government, specifically the BNDES, is committed to supporting investments, particularly in energy and infrastructure

Thank you!
Brazilian Development Bank - BNDES
To contact us:www.bndes.gov.br/english/