perspectives on america’s water - nestle-watersna.com · learn more at nestle-watersna.com 2...
TRANSCRIPT

Perspectives on America’s Water August 2018
Learn more at nestle-watersna.com 2
Introduction
Our second annual, comprehensive
national study of American
Consumers and Experts from
across water, environmental and
infrastructure sectors to better
understand their outlook on access
to clean water.

Learn more at nestle-watersna.com 3
Survey Methodology
Penn Schoen Berland
(PSB) conducted
6,142 interviews online
in the U.S. among both
Consumer and Expert
audiences from
March 9 - 26, 2018.
Nationally representative sample of
4,000 U.S. adults, age 18 or older.
An additional 1,767 over-sample
interviews were conducted to enable
state-level analysis among 14 key
states in Nestlé Waters North
America’s overarching footprint.
n=5,767Consumers
n=375Experts
All numbers shown represent 2018 data unless stated otherwise.
All numbers are shown in percentages. Due to rounding, percentages may not always add up to 100.
Senior professionals who work in the
U.S. water, infrastructure, health, and
environmental policy:
n=75 Government Officials
n=75 Academics
n=75 NGO Employees
n=75 Utility Business Decision Makers
n=75 Engineers
Learn more at nestle-watersna.com 4
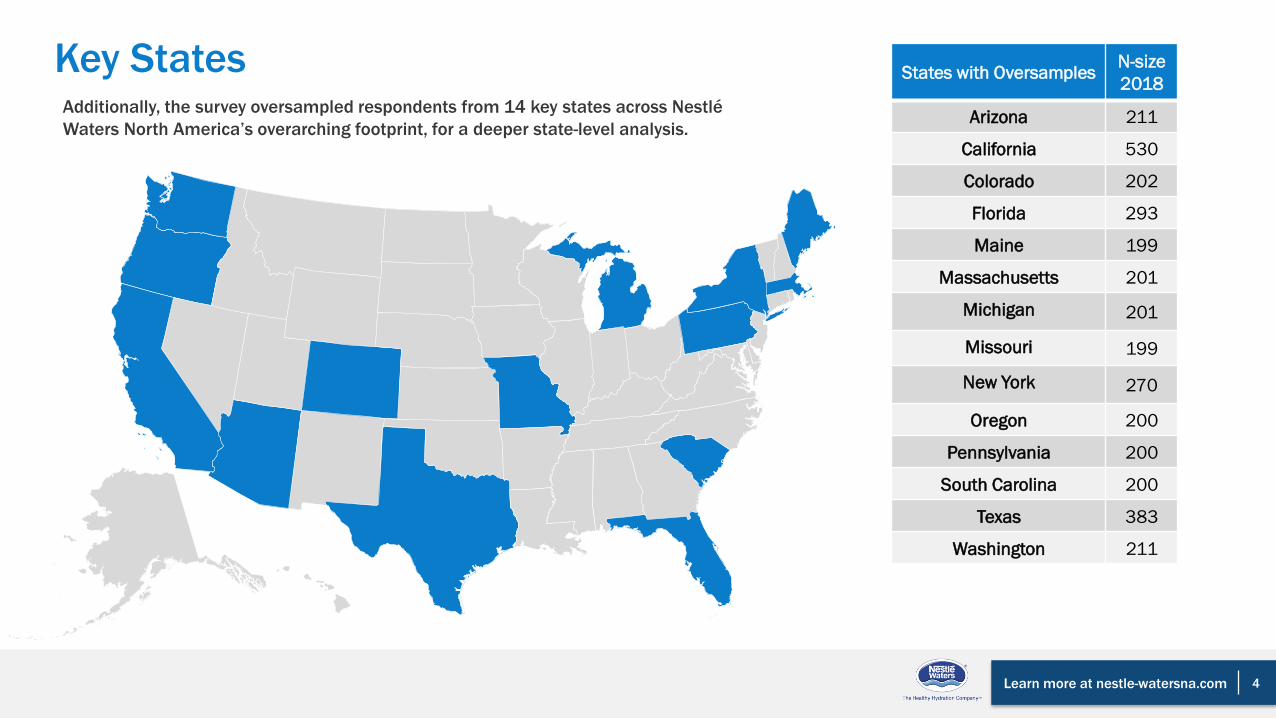
Key States States with OversamplesN-size
2018
Arizona 211
California 530
Colorado 202
Florida 293
Maine 199
Massachusetts 201
Michigan 201
Missouri 199
New York 270
Oregon 200
Pennsylvania 200
South Carolina 200
Texas 383
Washington 211
Additionally, the survey oversampled respondents from 14 key states across Nestlé
Waters North America’s overarching footprint, for a deeper state-level analysis.
Learn more at nestle-watersna.com 5
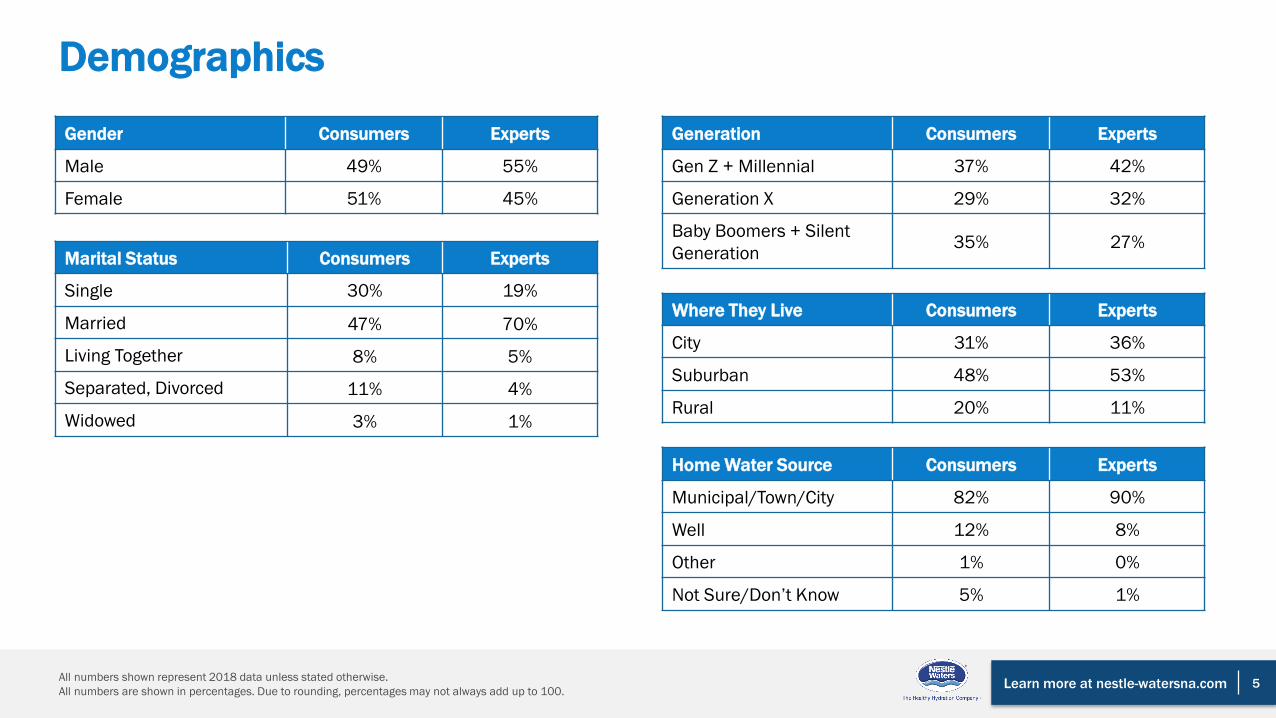
Demographics
Gender Consumers Experts
Male 49% 55%
Female 51% 45%
Generation Consumers Experts
Gen Z + Millennial 37% 42%
Generation X 29% 32%
Baby Boomers + Silent
Generation35% 27%
Marital Status Consumers Experts
Single 30% 19%
Married 47% 70%
Living Together 8% 5%
Separated, Divorced 11% 4%
Widowed 3% 1%
Where They Live Consumers Experts
City 31% 36%
Suburban 48% 53%
Rural 20% 11%
Home Water Source Consumers Experts
Municipal/Town/City 82% 90%
Well 12% 8%
Other 1% 0%
Not Sure/Don’t Know 5% 1%
All numbers shown represent 2018 data unless stated otherwise.
All numbers are shown in percentages. Due to rounding, percentages may not always add up to 100.
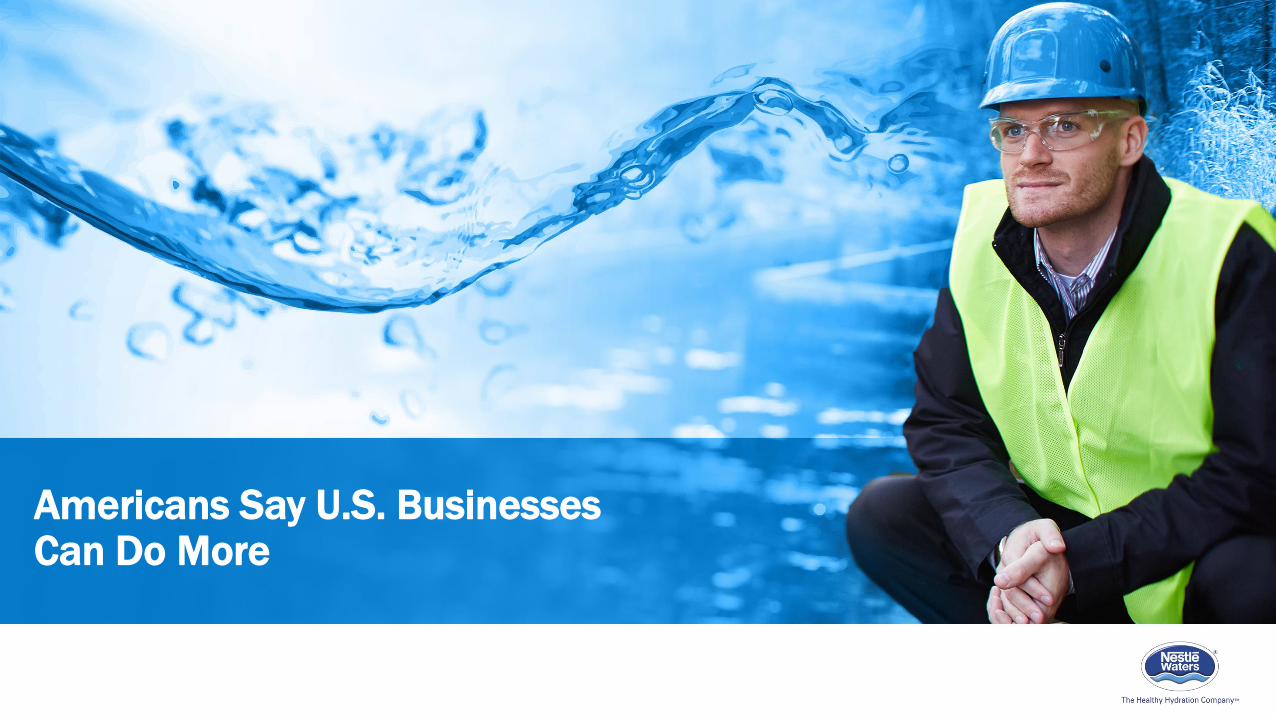
Americans Say U.S. Businesses Can Do More
Learn more at nestle-watersna.com
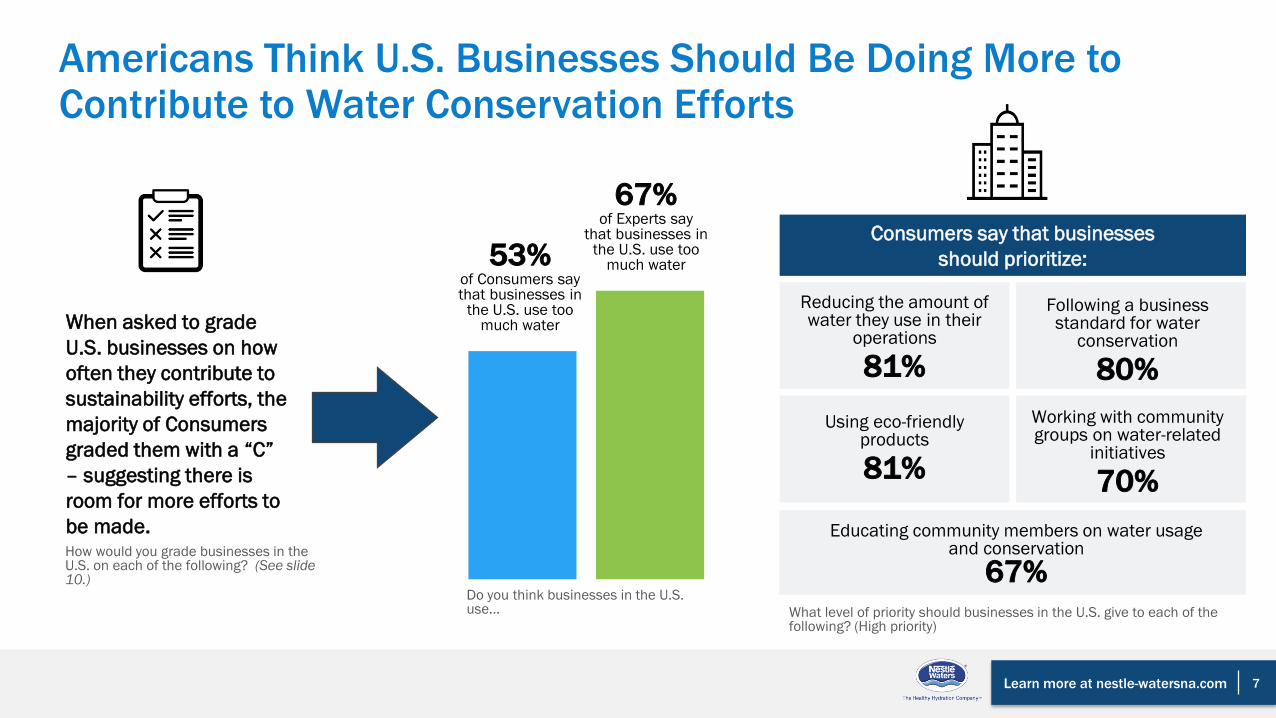
Americans Think U.S. Businesses Should Be Doing More to Contribute to Water Conservation Efforts
When asked to grade
U.S. businesses on how
often they contribute to
sustainability efforts, the
majority of Consumers
graded them with a “C”
– suggesting there is
room for more efforts to
be made.
53%of Consumers say that businesses in
the U.S. use too much water
67%of Experts say
that businesses in the U.S. use too
much water
7
Do you think businesses in the U.S. use… What level of priority should businesses in the U.S. give to each of the
following? (High priority)
Consumers say that businesses
should prioritize:
Reducing the amount of water they use in their
operations
81%
Using eco-friendly products
81%
Following a business standard for water
conservation
80%
Working with community groups on water-related
initiatives
70%
Educating community members on water usage and conservation
67%How would you grade businesses in the U.S. on each of the following? (See slide 10.)
Learn more at nestle-watersna.com
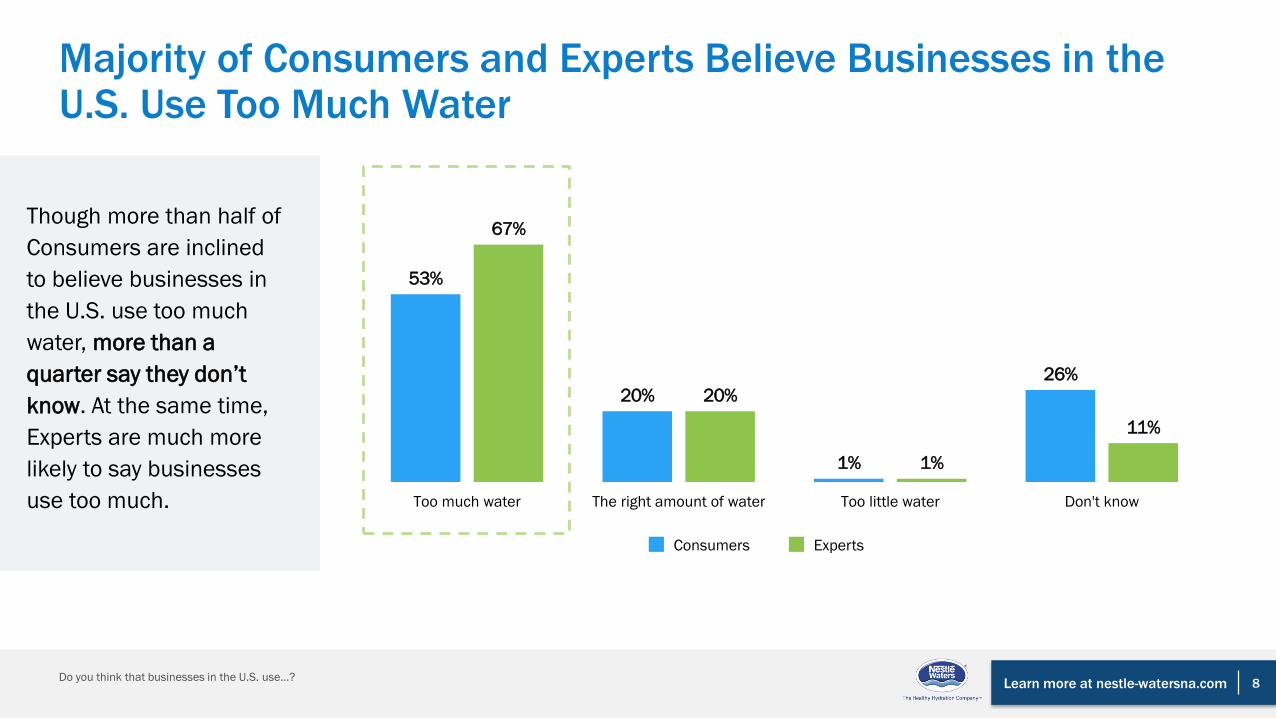
53%
20%
1%
26%
67%
20%
1%
11%
Too much water The right amount of water Too little water Don't know
8
Majority of Consumers and Experts Believe Businesses in the U.S. Use Too Much Water
Though more than half of
Consumers are inclined
to believe businesses in
the U.S. use too much
water, more than a
quarter say they don’t
know. At the same time,
Experts are much more
likely to say businesses
use too much.
Consumers Experts
Do you think that businesses in the U.S. use…?

Learn more at nestle-watersna.com 9
Do U.S. Businesses Use Too Much Water?
Do you think businesses in the U.S. use…? Too much waterWest: AK, AZ, CA, CO, HI, ID, MT, NV, NM, OR, UT, WA, WY
Midwest: IL, IN, IA, KS, MI, MN, MO, NE, ND, OH, SD, WI
Northeast: CT, ME, MA, NH, NJ, NY, PA, RI, VT
South: AL, AR, DE, FL, GA, KY, LA, MD, MI, NC, OK, SC, TN, TX, VA, WV
The majority of Americans
in key states agree with
Consumers at the national
level (53%) that U.S.
businesses use too much
water.
Consumers in California and
Michigan are far more likely
to think that businesses in
the U.S. use too much
water.
66%
57%
53%
53%
54%
59%
48%
56%
50%
44%
40% 59%
57%
64%
On par with the Consumer Average
Higher than the Consumer Average
Lower than the Consumer Average
53%ConsumerAverage

Learn more at nestle-watersna.com 10
Report Card: U.S. Business Water Conservation
Both Consumers and Experts give businesses middling grades for how frequently they
contribute to most water conservation measures.
Donating
money to water
conservation
efforts
Consumers
Experts
C
C
Donating time
to water
conservation
efforts
C
D
Educating community
members on water
usage and
conservation
C
C
Following a
business standard
for water
conservation
C
C
Using eco-
friendly
products
C
C
Working with
community groups
on water-related
initiatives
C
D
About one-third of Consumers say they don’t know how to grade U.S. businesses on
each metric.
How would you grade businesses in the U.S on each of the following? When grading businesses, please consider using “A” if they perform this action all the
time, ranging to an “F” if they never perform this action.
Learn more at nestle-watersna.com 11
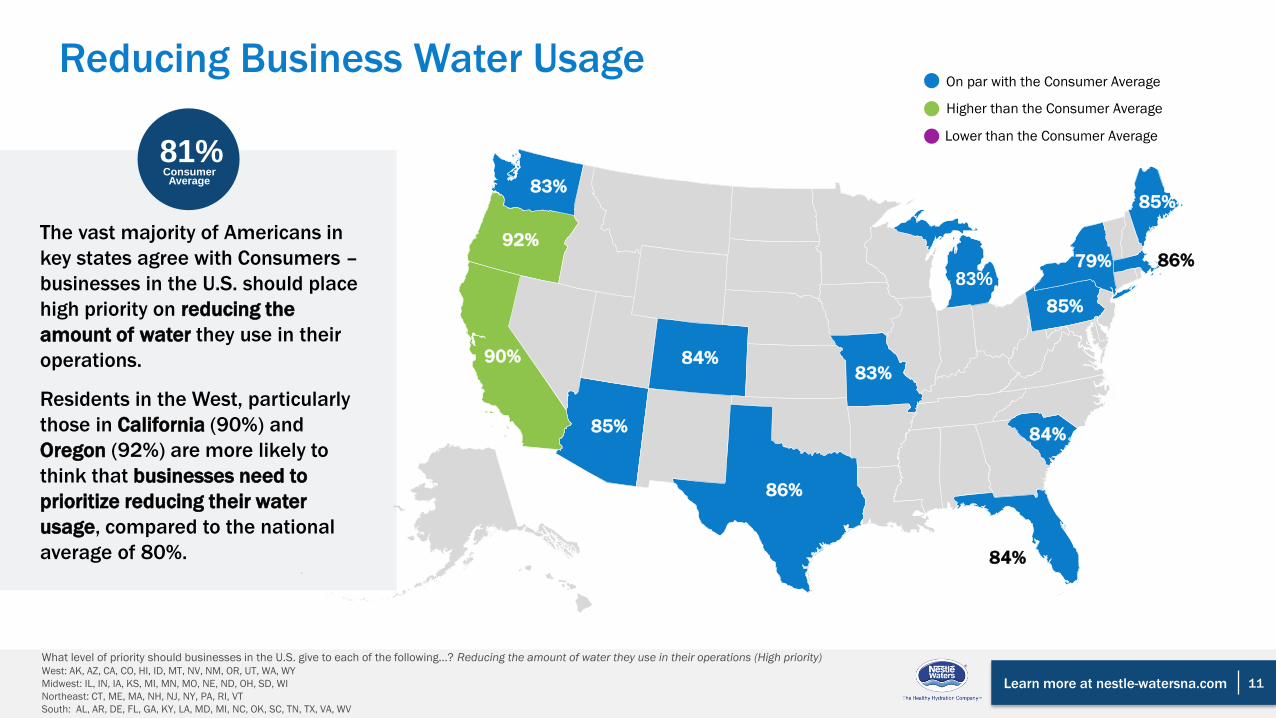
Reducing Business Water Usage
What level of priority should businesses in the U.S. give to each of the following…? Reducing the amount of water they use in their operations (High priority) West: AK, AZ, CA, CO, HI, ID, MT, NV, NM, OR, UT, WA, WY
Midwest: IL, IN, IA, KS, MI, MN, MO, NE, ND, OH, SD, WI
Northeast: CT, ME, MA, NH, NJ, NY, PA, RI, VT
South: AL, AR, DE, FL, GA, KY, LA, MD, MI, NC, OK, SC, TN, TX, VA, WV
The vast majority of Americans in
key states agree with Consumers –
businesses in the U.S. should place
high priority on reducing the
amount of water they use in their
operations.
Residents in the West, particularly
those in California (90%) and
Oregon (92%) are more likely to
think that businesses need to
prioritize reducing their water
usage, compared to the national
average of 80%.
81%Consumer Average
On par with the Consumer Average
Higher than the Consumer Average
Lower than the Consumer Average
90%
85%
84%
83%
92%
85%
84%
84%
86%
85%
79% 86%
83%
83%
Learn more at nestle-watersna.com
80%ConsumerAverage
12
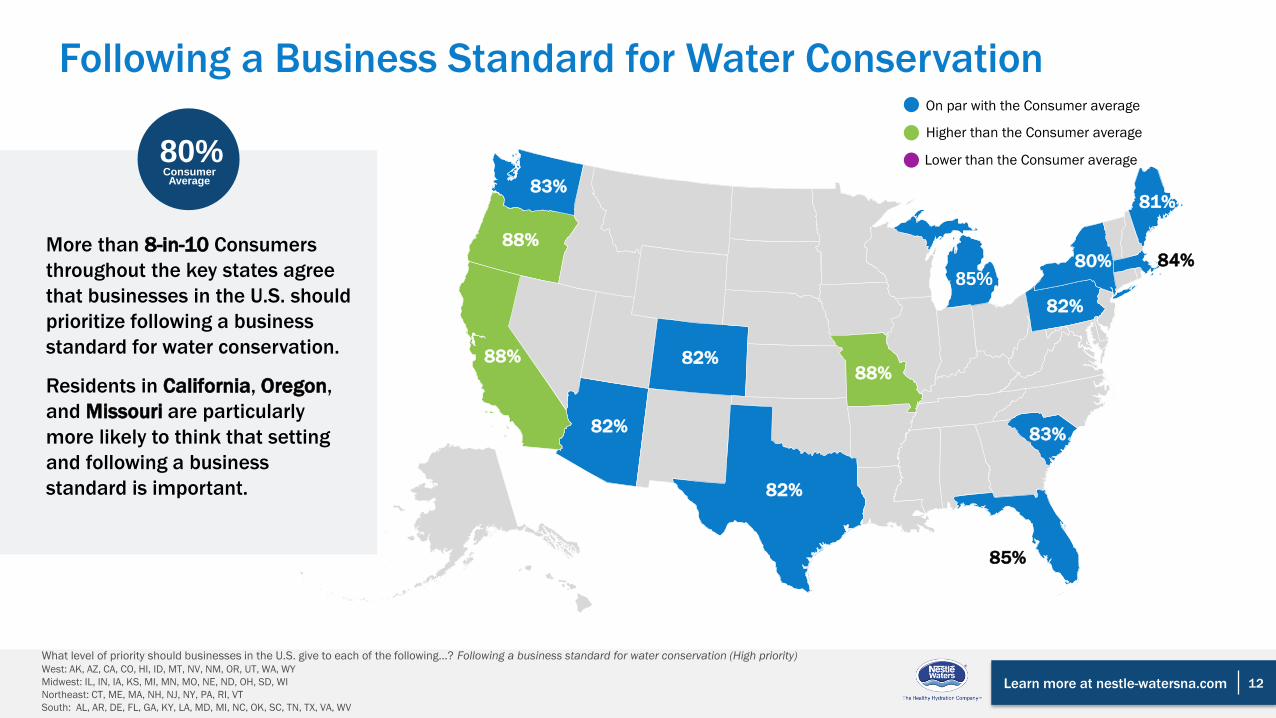
Following a Business Standard for Water Conservation
More than 8-in-10 Consumers
throughout the key states agree
that businesses in the U.S. should
prioritize following a business
standard for water conservation.
Residents in California, Oregon,
and Missouri are particularly
more likely to think that setting
and following a business
standard is important.
On par with the Consumer average
Higher than the Consumer average
Lower than the Consumer average
88%
82%
85%
83%
88%
81%
83%
82%
82%
82%
80% 84%
88%
85%
What level of priority should businesses in the U.S. give to each of the following…? Following a business standard for water conservation (High priority) West: AK, AZ, CA, CO, HI, ID, MT, NV, NM, OR, UT, WA, WY
Midwest: IL, IN, IA, KS, MI, MN, MO, NE, ND, OH, SD, WI
Northeast: CT, ME, MA, NH, NJ, NY, PA, RI, VT
South: AL, AR, DE, FL, GA, KY, LA, MD, MI, NC, OK, SC, TN, TX, VA, WV
Learn more at nestle-watersna.com 13
Valeria OrozcoDirector, Sustainability
“There is a clear call to action for the business community to
do more when it comes to protecting our water resources.
That’s why Nestlé Waters has committed to certifying 100
percent of our facilities around the world according to the
Alliance for Water Stewardship Standard. This is our way of
ensuring and demonstrating that our water use is not only
environmentally sustainable, but also socially equitable and
economically beneficial to the local community.”

Water Conservation Is Top Priority for Americans
Learn more at nestle-watersna.com
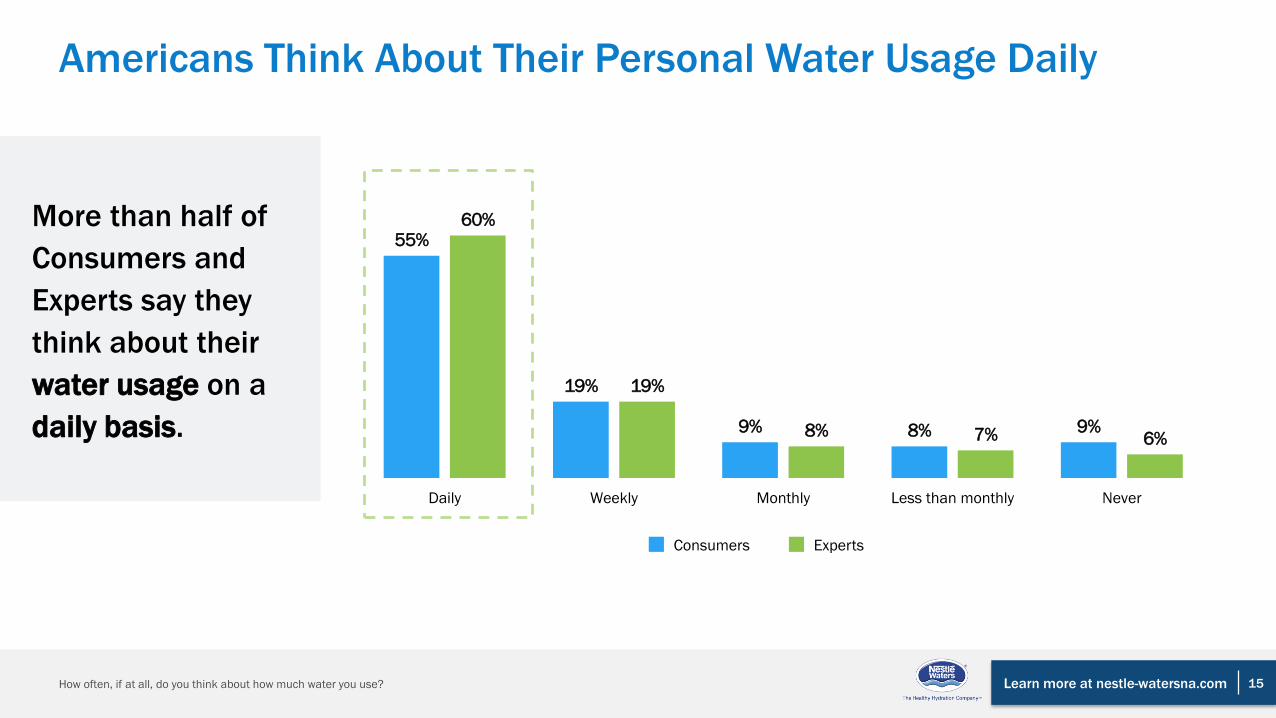
55%
19%
9% 8% 9%
60%
19%
8% 7% 6%
0%
10%
20%
30%
40%
50%
60%
70%
Daily Weekly Monthly Less than monthly Never
15
Americans Think About Their Personal Water Usage Daily
More than half of
Consumers and
Experts say they
think about their
water usage on a
daily basis.
How often, if at all, do you think about how much water you use?
Consumers Experts
Learn more at nestle-watersna.com
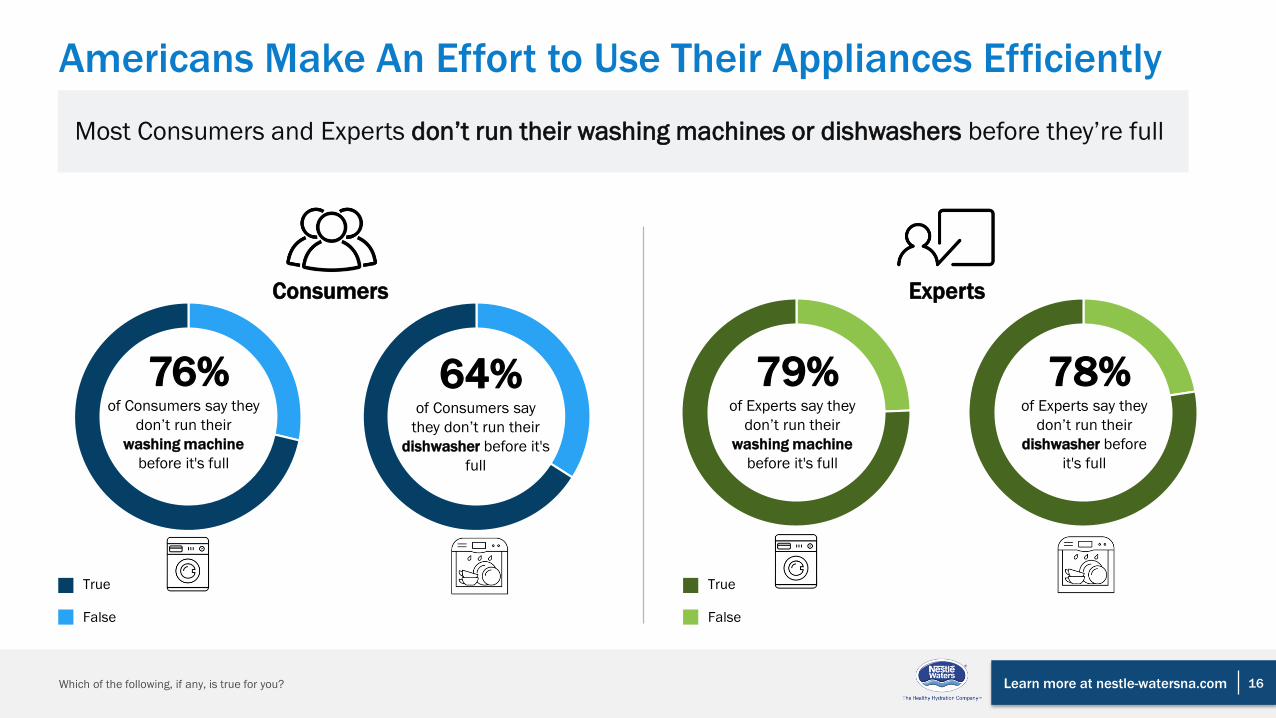
Most Consumers and Experts don’t run their washing machines or dishwashers before they’re full
16
Americans Make An Effort to Use Their Appliances Efficiently
True
False
True
False
Consumers Experts
Which of the following, if any, is true for you?
76%of Consumers say they
don’t run their
washing machine
before it's full
64%of Consumers say
they don’t run their
dishwasher before it's
full
79%of Experts say they
don’t run their
washing machine
before it's full
78%of Experts say they
don’t run their
dishwasher before
it's full

Learn more at nestle-watersna.com 17
Americans Are Willing to Conserve More
11% 11% 13% 12% 8% 6%13% 14%
8% 7% 8% 5%
43% 46% 41%38% 42%
39%
43% 42%44% 43%
46%41%
46% 43% 45% 49% 50%55%
44% 43% 48% 50%47%
54%
Bathing Laundry CleaningToilet Use Cooking Recreational Use
Actively
trying to
conserve
Willing to
conserve
Not willing
to conserve
Consumers
Experts
The majority of Consumers and Experts are split between actively conserving water and saying
they currently don’t, but are willing to, across a range of daily activities.
When doing each of the following, please indicate if you… Are actively trying to conserve water, would be willing to try to actively conserve water; or are not
willing to try to conserve water?
Learn more at nestle-watersna.com
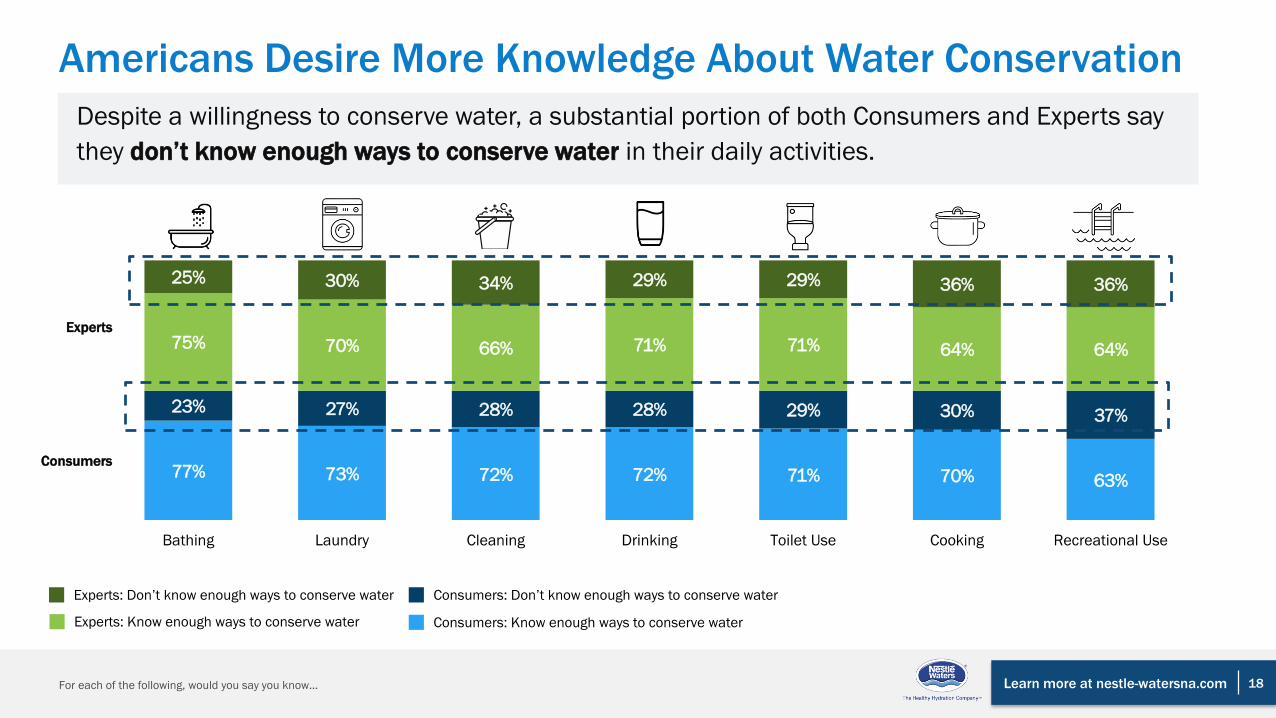
Despite a willingness to conserve water, a substantial portion of both Consumers and Experts say
they don’t know enough ways to conserve water in their daily activities.
18
Americans Desire More Knowledge About Water Conservation
77% 73% 72% 72% 71% 70% 63%
23% 27% 28% 28% 29% 30% 37%
75% 70% 66% 71% 71% 64% 64%
25% 30% 34% 29% 29% 36% 36%
0%
50%
100%
150%
200%
250%
Bathing Laundry Cleaning Drinking Toilet Use Cooking Recreational Use
Consumers
Experts
For each of the following, would you say you know…
Experts: Know enough ways to conserve water
Experts: Don’t know enough ways to conserve water
Consumers: Know enough ways to conserve water
Consumers: Don’t know enough ways to conserve water
Learn more at nestle-watersna.com 19
B C F F F F
B B F F C F
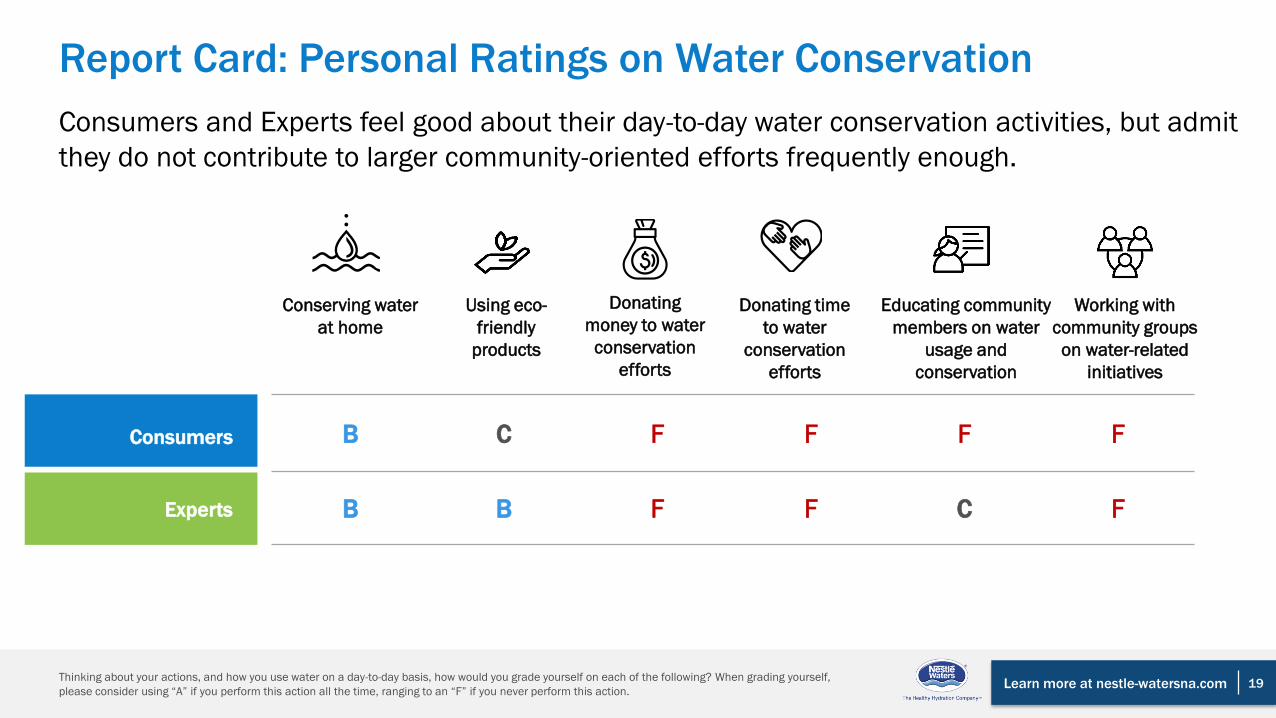
Report Card: Personal Ratings on Water Conservation
Consumers and Experts feel good about their day-to-day water conservation activities, but admit
they do not contribute to larger community-oriented efforts frequently enough.
Donating
money to water
conservation
efforts
Consumers
Experts
Donating time
to water
conservation
efforts
Educating community
members on water
usage and
conservation
Conserving water
at home
Using eco-
friendly
products
Working with
community groups
on water-related
initiatives
Thinking about your actions, and how you use water on a day-to-day basis, how would you grade yourself on each of the following? When grading yourself,
please consider using “A” if you perform this action all the time, ranging to an “F” if you never perform this action.
Learn more at nestle-watersna.com 20
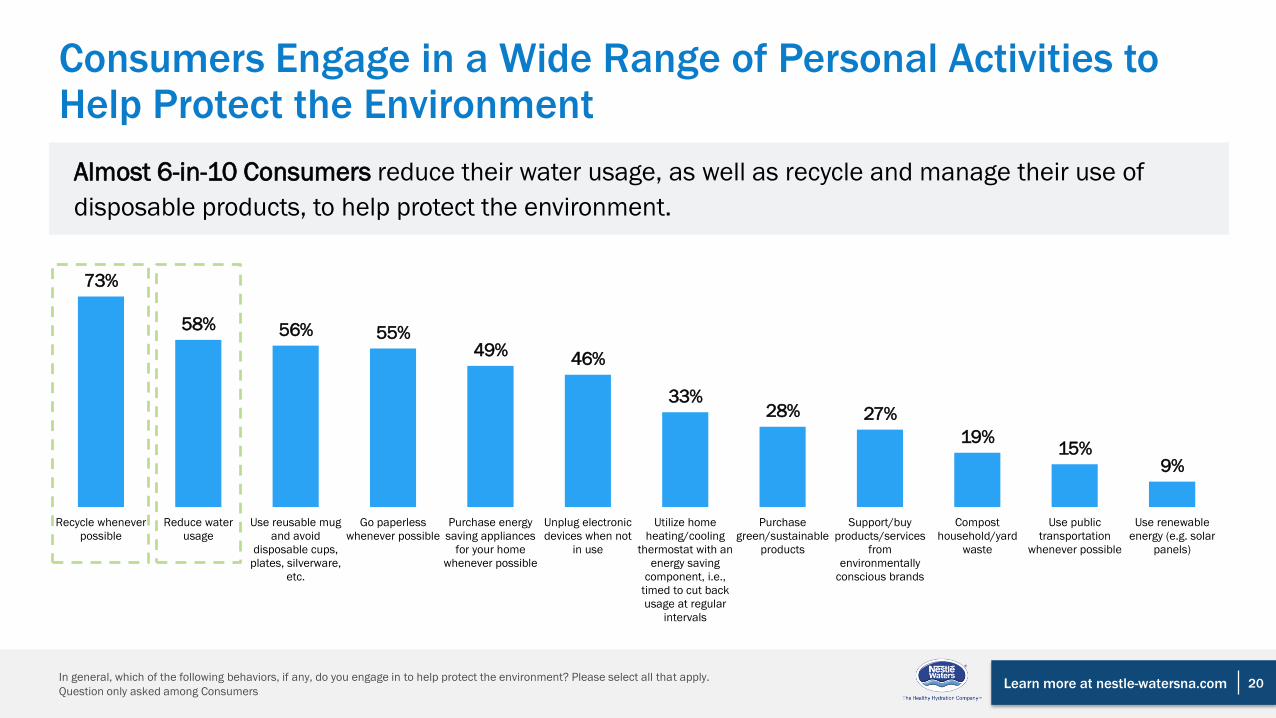
Consumers Engage in a Wide Range of Personal Activities to Help Protect the Environment
In general, which of the following behaviors, if any, do you engage in to help protect the environment? Please select all that apply.
Question only asked among Consumers
Almost 6-in-10 Consumers reduce their water usage, as well as recycle and manage their use of
disposable products, to help protect the environment.
73%
58% 56% 55%49%
46%
33%28% 27%
19%15%
9%
Recycle whenever
possible
Reduce water
usage
Use reusable mug
and avoid
disposable cups,
plates, silverware,
etc.
Go paperless
whenever possible
Purchase energy
saving appliances
for your home
whenever possible
Unplug electronic
devices when not
in use
Utilize home
heating/cooling
thermostat with an
energy saving
component, i.e.,
timed to cut back
usage at regular
intervals
Purchase
green/sustainable
products
Support/buy
products/services
from
environmentally
conscious brands
Compost
household/yard
waste
Use public
transportation
whenever possible
Use renewable
energy (e.g. solar
panels)

Water Contamination Is a Top Concern and Solutions Focused on Addressing It Are Seen as Essential Shot at Fuller Lake, near Lukens Springs, CA
Learn more at nestle-watersna.com
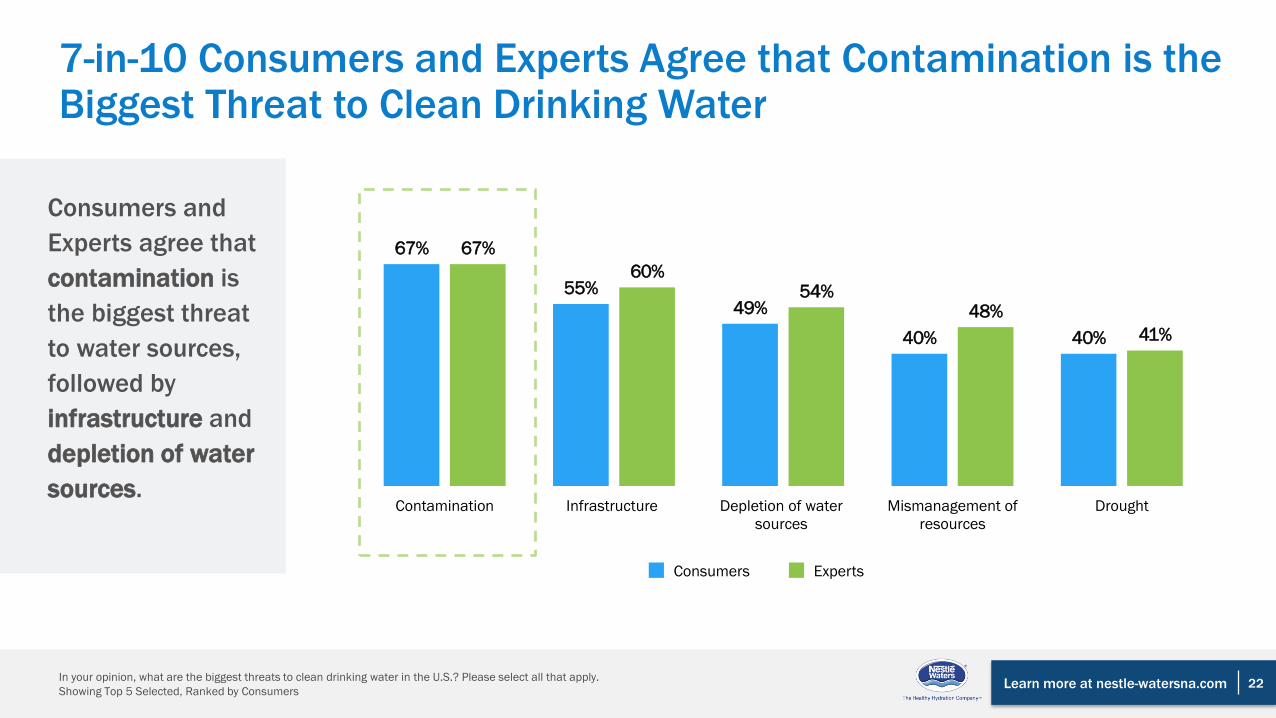
7-in-10 Consumers and Experts Agree that Contamination is the Biggest Threat to Clean Drinking Water
22
Consumers and
Experts agree that
contamination is
the biggest threat
to water sources,
followed by
infrastructure and
depletion of water
sources.
Consumers Experts
67%
55%49%
40% 40%
67%
60%54%
48%
41%
0%
10%
20%
30%
40%
50%
60%
70%
80%
Contamination Infrastructure Depletion of water
sources
Mismanagement of
resources
Drought
In your opinion, what are the biggest threats to clean drinking water in the U.S.? Please select all that apply.
Showing Top 5 Selected, Ranked by Consumers
Learn more at nestle-watersna.com
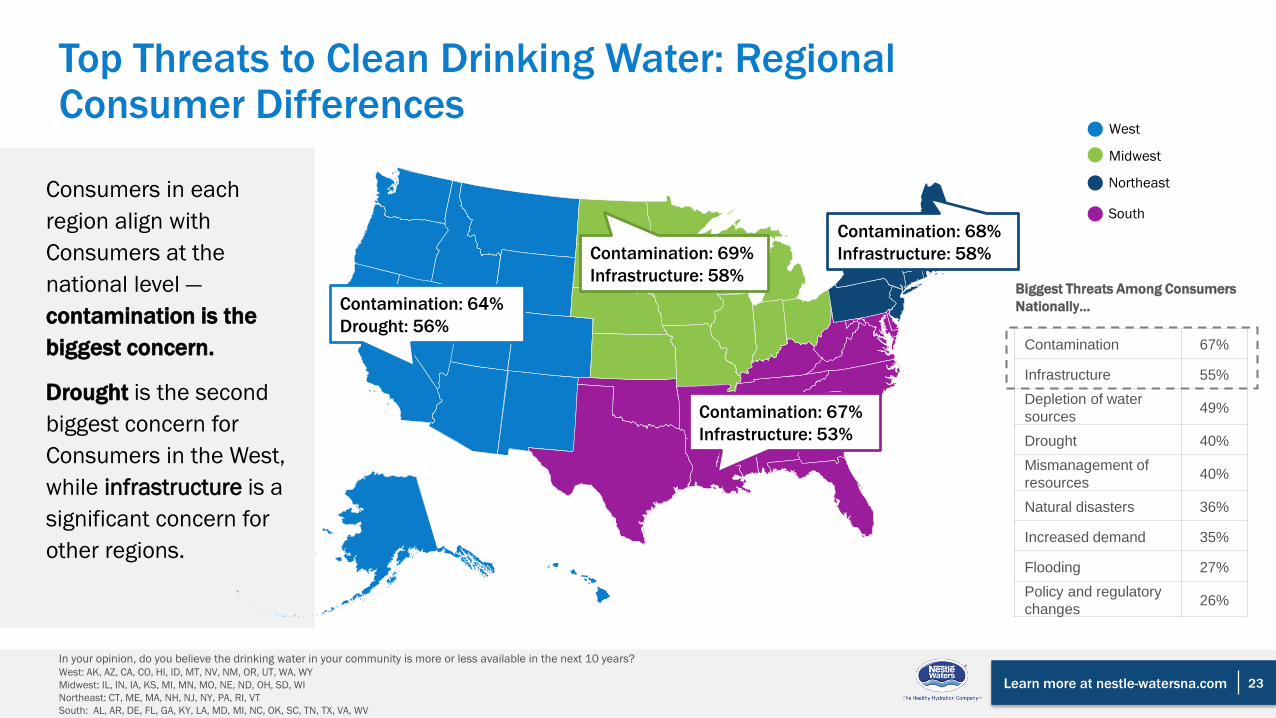
Top Threats to Clean Drinking Water: Regional Consumer Differences
Contamination 67%
Infrastructure 55%
Depletion of water
sources 49%
Drought 40%
Mismanagement of
resources40%
Natural disasters 36%
Increased demand 35%
Flooding 27%
Policy and regulatory
changes26%
Biggest Threats Among Consumers
Nationally…
Consumers in each
region align with
Consumers at the
national level —
contamination is the
biggest concern.
Drought is the second
biggest concern for
Consumers in the West,
while infrastructure is a
significant concern for
other regions.
Contamination: 64%
Drought: 56%
Contamination: 68%
Infrastructure: 58%Contamination: 69%
Infrastructure: 58%
Contamination: 67%
Infrastructure: 53%
Midwest
West
Northeast
South
In your opinion, do you believe the drinking water in your community is more or less available in the next 10 years? West: AK, AZ, CA, CO, HI, ID, MT, NV, NM, OR, UT, WA, WY
Midwest: IL, IN, IA, KS, MI, MN, MO, NE, ND, OH, SD, WI
Northeast: CT, ME, MA, NH, NJ, NY, PA, RI, VT
South: AL, AR, DE, FL, GA, KY, LA, MD, MI, NC, OK, SC, TN, TX, VA, WV
23

Learn more at nestle-watersna.com
31%
27%
22%
12%
6%
2%
31%
28%26%
12%
2% 1%
0%
5%
10%
15%
20%
25%
30%
35%
Infrastructure Conservation Innovation Alternative sources None of the above Other
Approaches Focused on Addressing Existing Systems and Solutions are Seen as Most Impactful Among Consumers and Experts
24
Americans believe
that addressing
existing solutions
such as
infrastructure and
conservation are
more of a priority
than completely
new solutions.
Consumers Experts
When thinking about possible approaches to addressing access to clean water in the U.S., which of the following do you believe will have the greatest impact?
Learn more at nestle-watersna.com 25
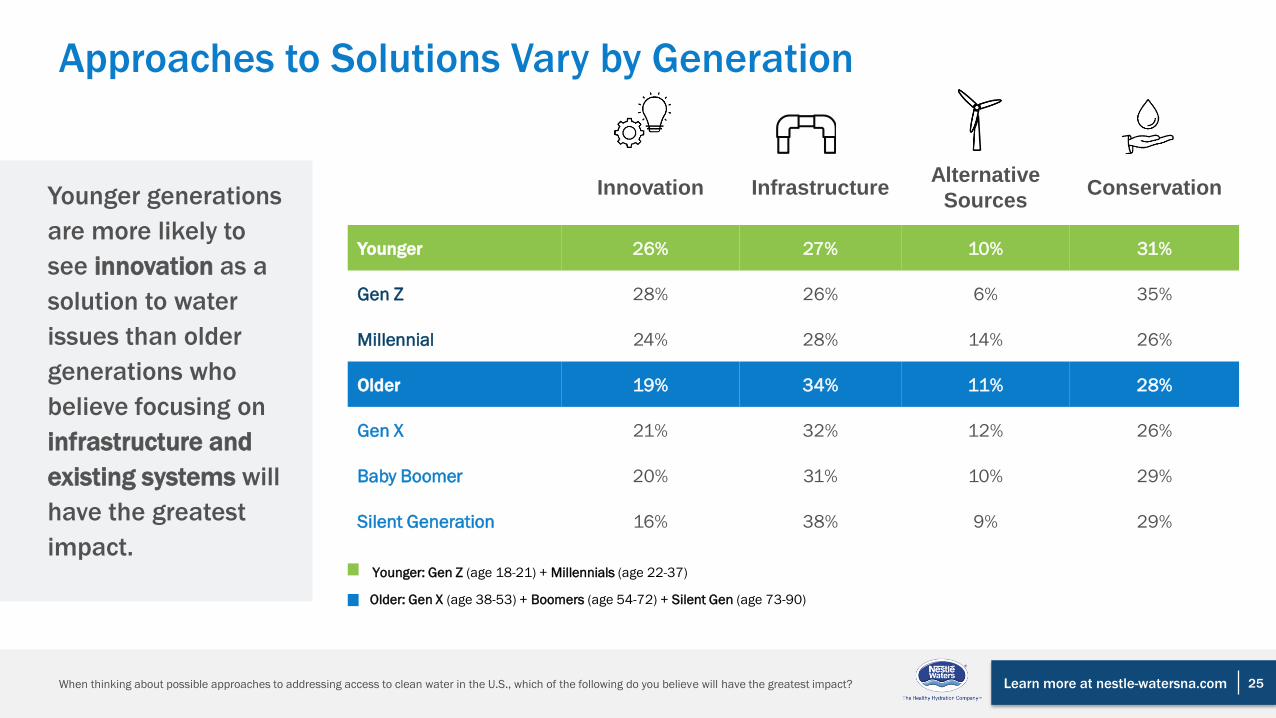
Approaches to Solutions Vary by Generation
When thinking about possible approaches to addressing access to clean water in the U.S., which of the following do you believe will have the greatest impact?
Innovation InfrastructureAlternative
SourcesConservation
Younger 26% 27% 10% 31%
Gen Z 28% 26% 6% 35%
Millennial 24% 28% 14% 26%
Older 19% 34% 11% 28%
Gen X 21% 32% 12% 26%
Baby Boomer 20% 31% 10% 29%
Silent Generation 16% 38% 9% 29%
Younger: Gen Z (age 18-21) + Millennials (age 22-37)
Older: Gen X (age 38-53) + Boomers (age 54-72) + Silent Gen (age 73-90)
Younger generations
are more likely to
see innovation as a
solution to water
issues than older
generations who
believe focusing on
infrastructure and
existing systems will
have the greatest
impact.
Learn more at nestle-watersna.com 26
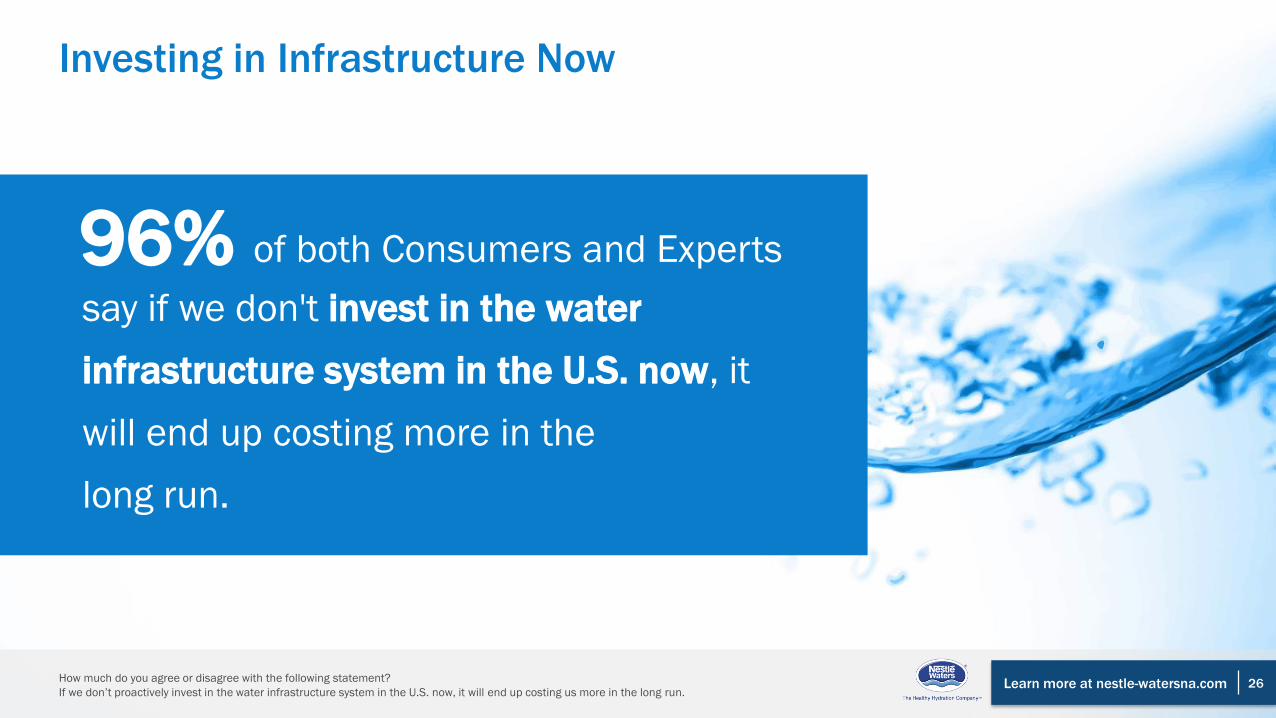
Investing in Infrastructure Now
How much do you agree or disagree with the following statement?
If we don’t proactively invest in the water infrastructure system in the U.S. now, it will end up costing us more in the long run.
say if we don't invest in the water
infrastructure system in the U.S. now, it
will end up costing more in the
long run.
96% of both Consumers and Experts

Learn more at nestle-watersna.com
88%
77% 76% 75%
62%
49%
35%36%
23%
37%
59%
42%46%
24%
Clean drinking water Electricity Sewer services Roads and bridges Recycling services Public transportation Mobile connectivity (e.g.,
4G/LTE)
Drinking Water Infrastructure is Important, but Underperforms
Difference Between Importance of Infrastructure Type vs. How Well Consumers Believe it
Performs
How important do you consider each of the following types of infrastructure? (Clean drinking water)
In your opinion, how would you rate the existing infrastructure in the U.S. at delivering each of the following products or services? (Clean drinking water)
Despite its extremely high importance, Consumers and Experts agree the U.S. is underperforming on clean
drinking water infrastructure.
Clean Drinking Water Infrastructure is Very Important
Clean Drinking Water Infrastructure in the U.S. is Fair/Poor
27
Learn more at nestle-watersna.com
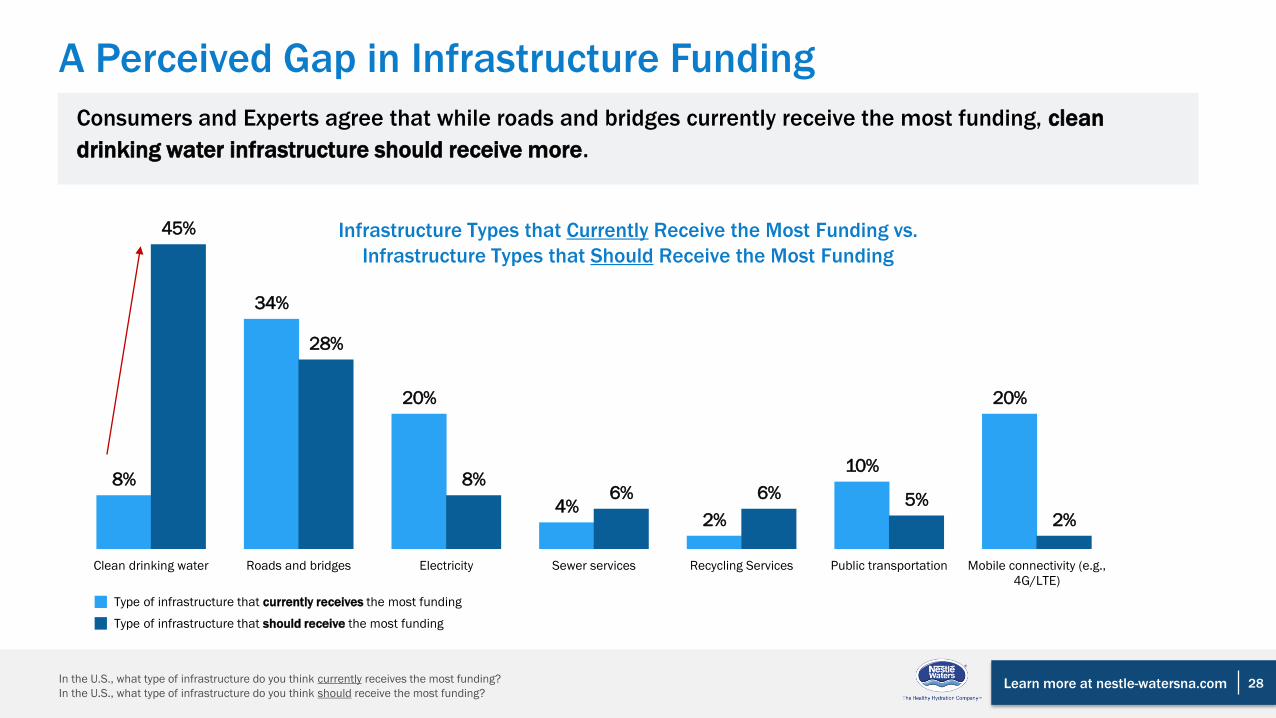
8%
34%
20%
4%2%
10%
20%
45%
28%
8%6% 6% 5%
2%
Clean drinking water Roads and bridges Electricity Sewer services Recycling Services Public transportation Mobile connectivity (e.g.,
4G/LTE)
28
A Perceived Gap in Infrastructure Funding
In the U.S., what type of infrastructure do you think currently receives the most funding?
In the U.S., what type of infrastructure do you think should receive the most funding?
Consumers and Experts agree that while roads and bridges currently receive the most funding, clean
drinking water infrastructure should receive more.
Type of infrastructure that currently receives the most funding
Type of infrastructure that should receive the most funding
Infrastructure Types that Currently Receive the Most Funding vs.
Infrastructure Types that Should Receive the Most Funding

Learn more at nestle-watersna.com
65%61%
54% 54% 54%
66% 64%60%
52%55%
0%
10%
20%
30%
40%
50%
60%
70%
Early detection systems to
identify contamination in
water supply
New technology to restore
contaminated water to safe
drinking water
Better efficiency measures
in water collection and
purification methods to
save time and money
Infrastructure initiatives to
use natural systems to filter
and store water
Infrastructure initiatives to
replenish depleted water
sources
Contamination Solutions Are Seen As Most Important
29
Solutions focused
on identifying and
addressing
contamination are
viewed as most
necessary among
Consumers and
Experts.
Consumers Experts
How necessary do you think it is to invest in the following to deliver clean drinking water?
Solutions: Very Necessary to Invest In
Learn more at nestle-watersna.com 30
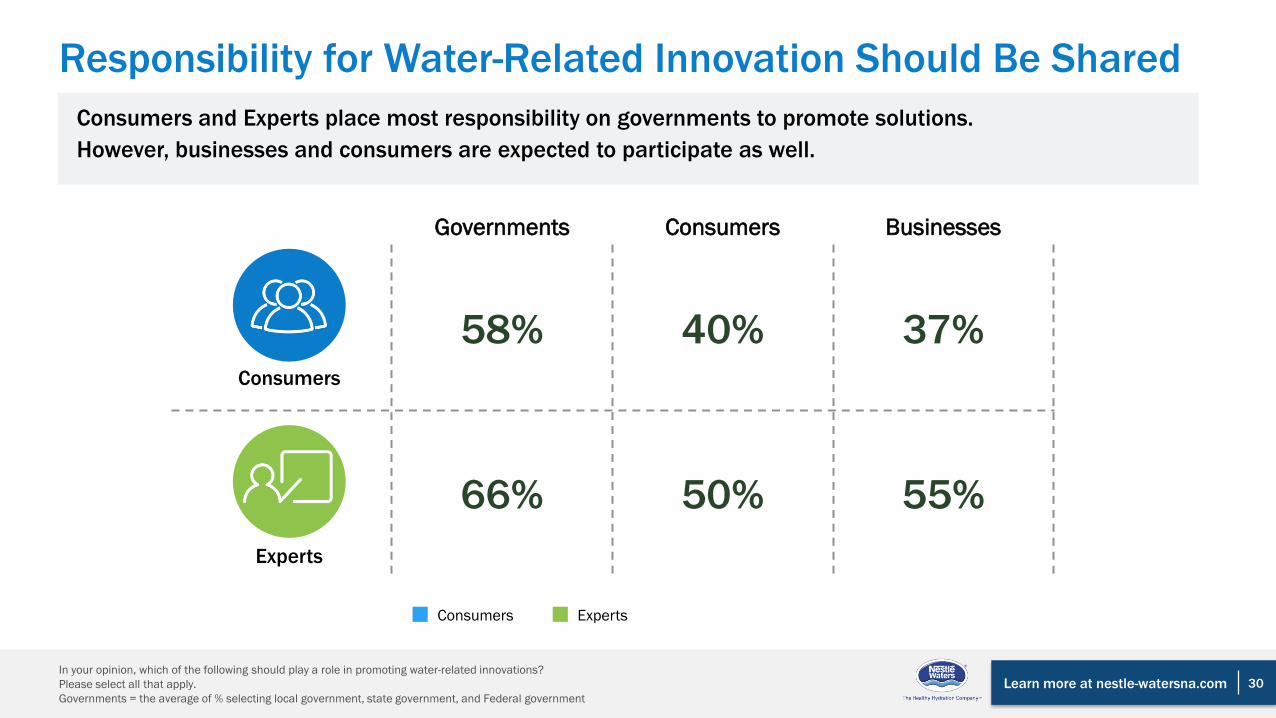
Responsibility for Water-Related Innovation Should Be Shared
In your opinion, which of the following should play a role in promoting water-related innovations?
Please select all that apply.
Governments = the average of % selecting local government, state government, and Federal government
Governments Consumers Businesses
58% 40% 37%
66% 50% 55%
Consumers Experts
Consumers and Experts place most responsibility on governments to promote solutions.
However, businesses and consumers are expected to participate as well.
Consumers
Experts

Additional Findings
Learn more at nestle-watersna.com
27%25%
23%
14%
10%
1%
32%
22%
25%
16%
5%
0%0%
5%
10%
15%
20%
25%
30%
35%
Clean Water Sleep/rest Healthy Foods Exercise Medical care Other
32
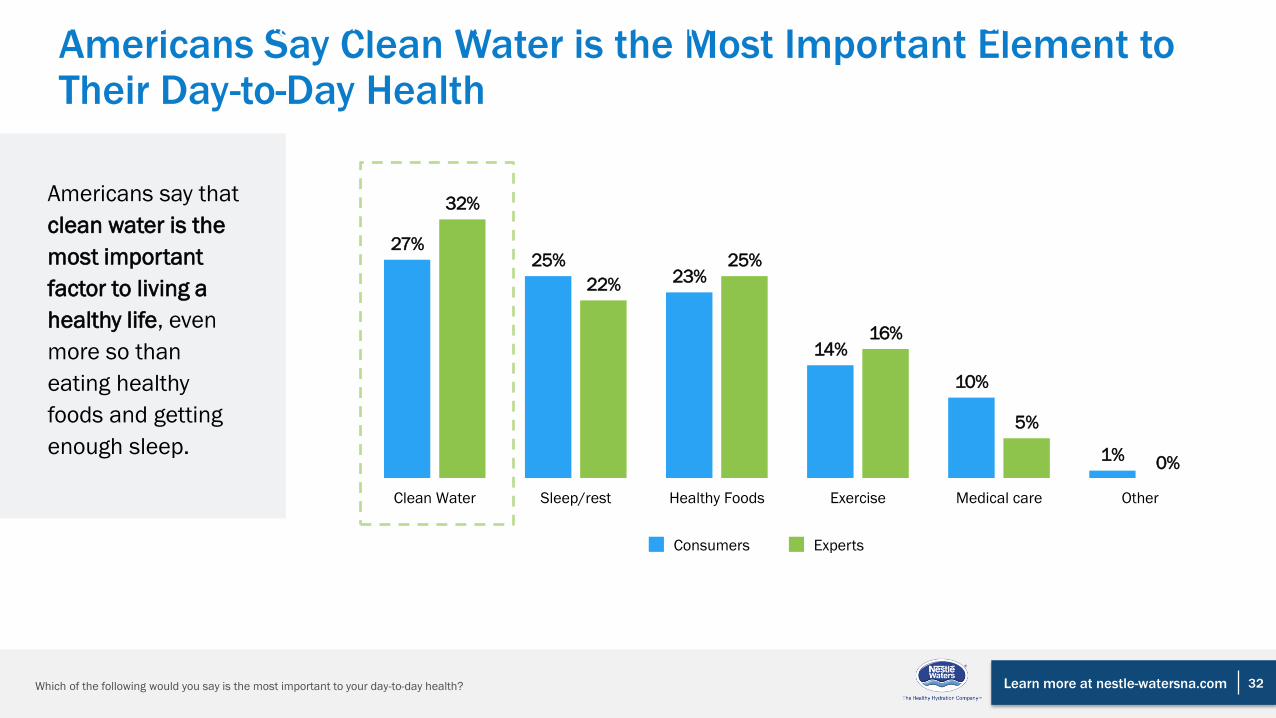
Americans Say Clean Water is the Most Important Element to Their Day-to-Day Health
Americans say that
clean water is the
most important
factor to living a
healthy life, even
more so than
eating healthy
foods and getting
enough sleep.
Consumers Experts
Which of the following would you say is the most important to your day-to-day health?
Which of the following would you say is the most important to your day-to-day health?
Learn more at nestle-watersna.com
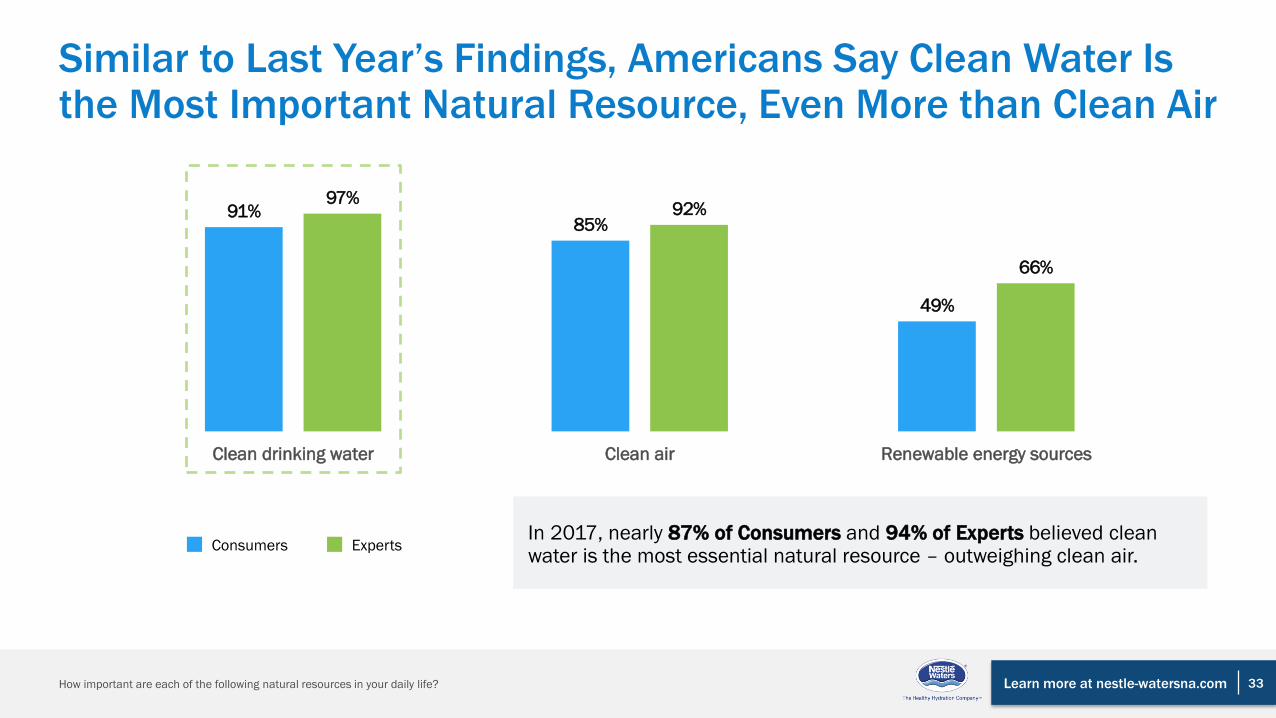
Similar to Last Year’s Findings, Americans Say Clean Water Is the Most Important Natural Resource, Even More than Clean Air
91%85%
49%
97%92%
66%
Clean drinking water Clean air Renewable energy sources
In 2017, nearly 87% of Consumers and 94% of Experts believed clean water is the most essential natural resource – outweighing clean air.
How important are each of the following natural resources in your daily life? 33
Consumers Experts
Learn more at nestle-watersna.com
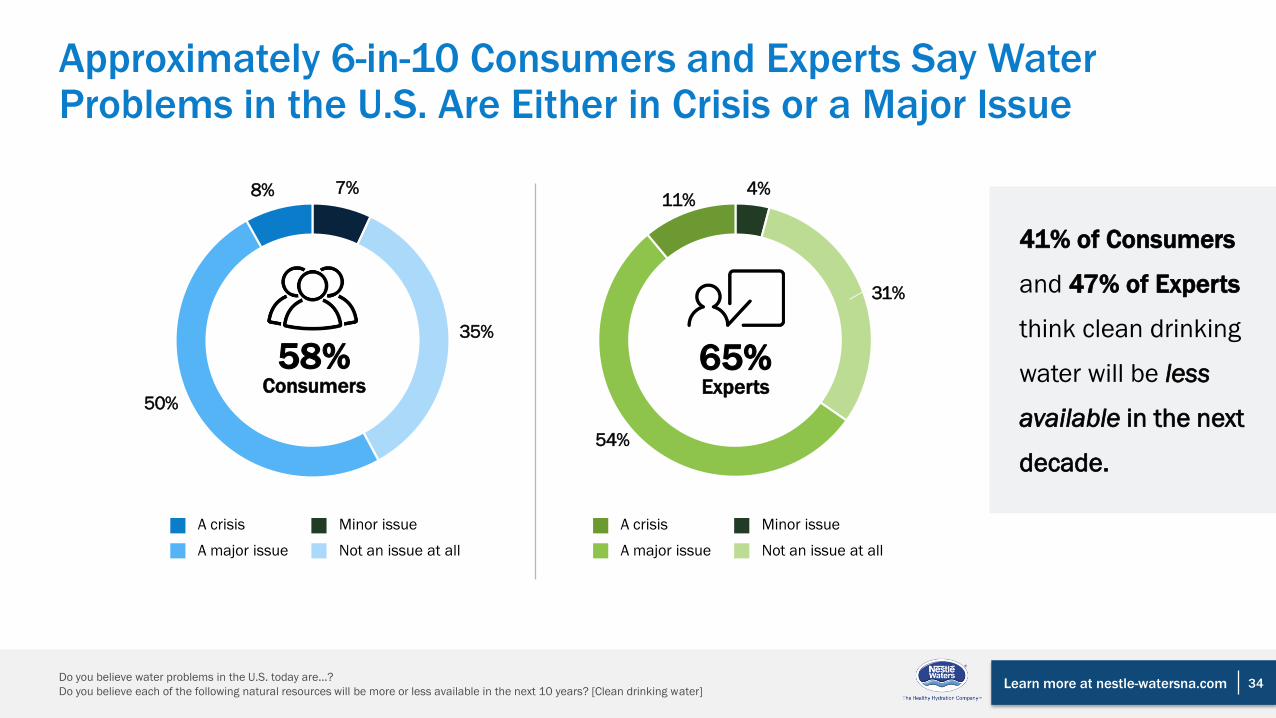
4%
31%
54%
11%7%
35%
50%
8%
41% of Consumers
and 47% of Experts
think clean drinking
water will be less
available in the next
decade.
A crisis
A major issue
Minor issue
Not an issue at all
A crisis
A major issue
Minor issue
Not an issue at all
65%Experts
58%Consumers
34
Approximately 6-in-10 Consumers and Experts Say Water Problems in the U.S. Are Either in Crisis or a Major Issue
Do you believe water problems in the U.S. today are...?
Do you believe each of the following natural resources will be more or less available in the next 10 years? [Clean drinking water]
Learn more at nestle-watersna.com 35
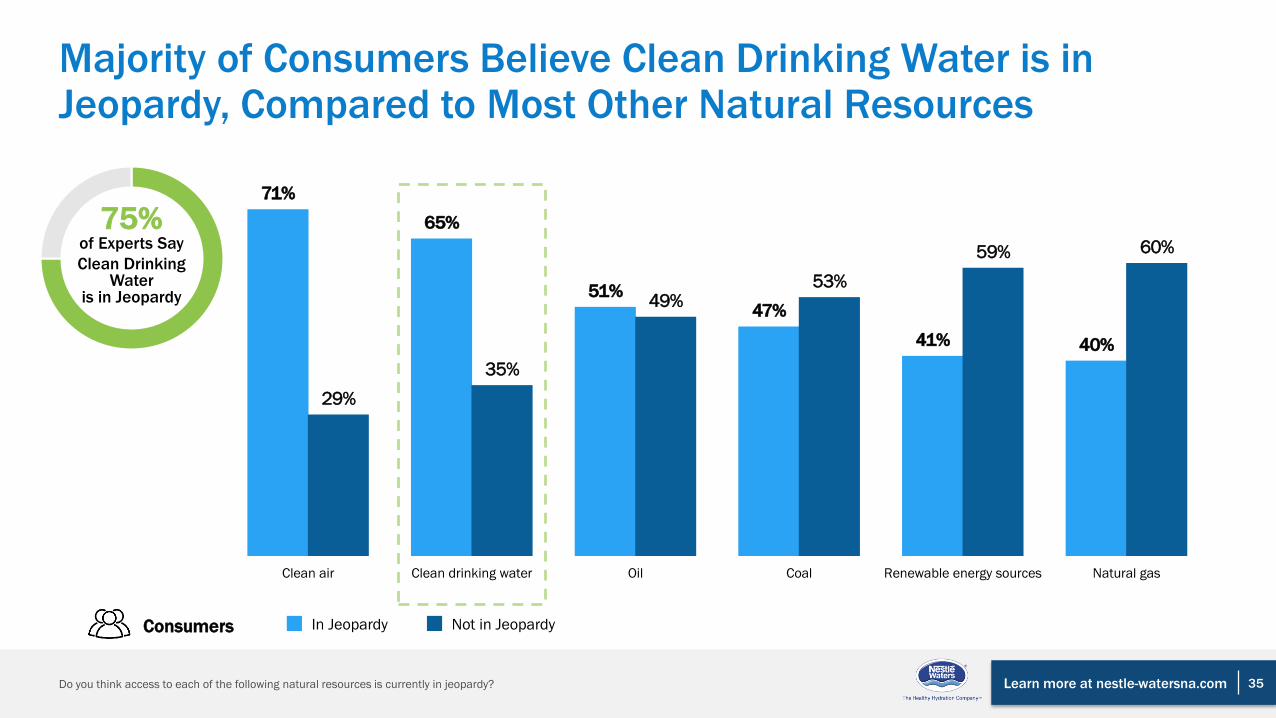
Majority of Consumers Believe Clean Drinking Water is in Jeopardy, Compared to Most Other Natural Resources
Do you think access to each of the following natural resources is currently in jeopardy?
71%
65%
51%47%
41% 40%
29%
35%
49%53%
59% 60%
0
0
0
0
0
1
1
1
1
Clean air Clean drinking water Oil Coal Renewable energy sources Natural gas
Consumers In Jeopardy Not in Jeopardy
75%of Experts Say
Clean Drinking Water
is in Jeopardy
Learn more at nestle-watersna.com 36
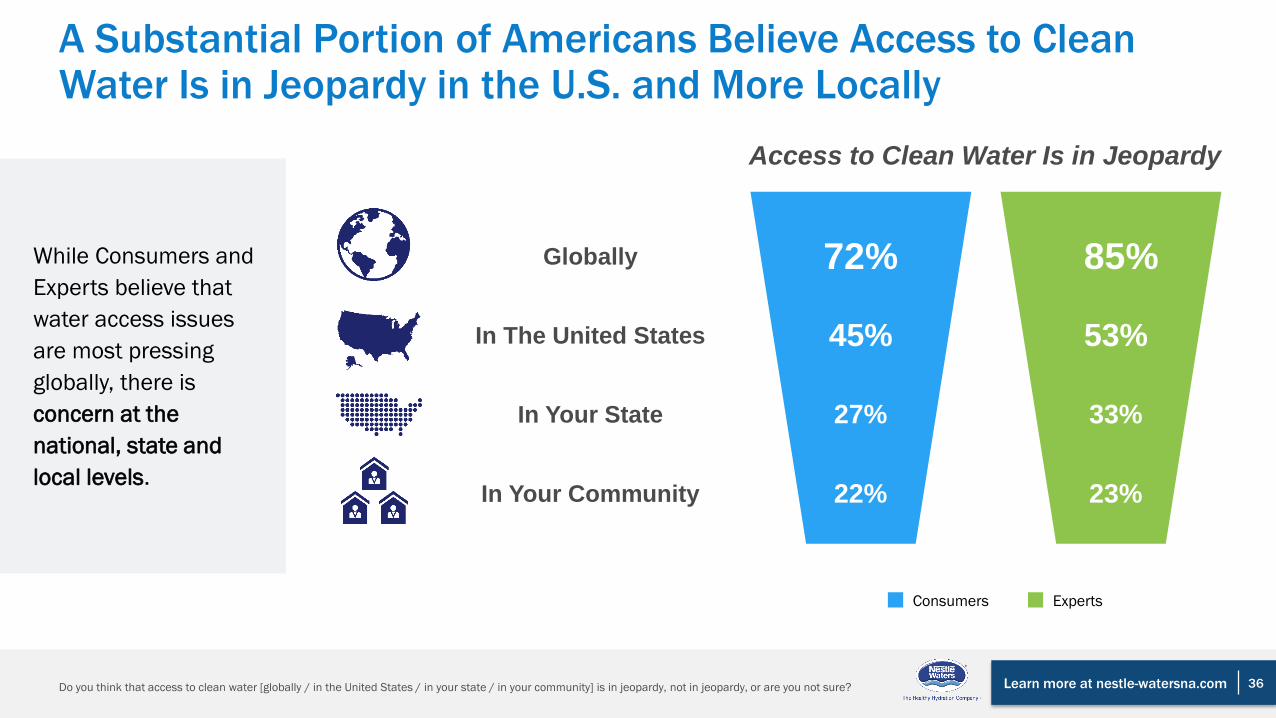
A Substantial Portion of Americans Believe Access to Clean Water Is in Jeopardy in the U.S. and More Locally
Consumers Experts
Do you think that access to clean water [globally / in the United States / in your state / in your community] is in jeopardy, not in jeopardy, or are you not sure?
Globally 72% 85%
In The United States 45% 53%
In Your State 27% 33%
In Your Community 22% 23%
While Consumers and
Experts believe that
water access issues
are most pressing
globally, there is
concern at the
national, state and
local levels.
Access to Clean Water Is in Jeopardy
Learn more at nestle-watersna.com
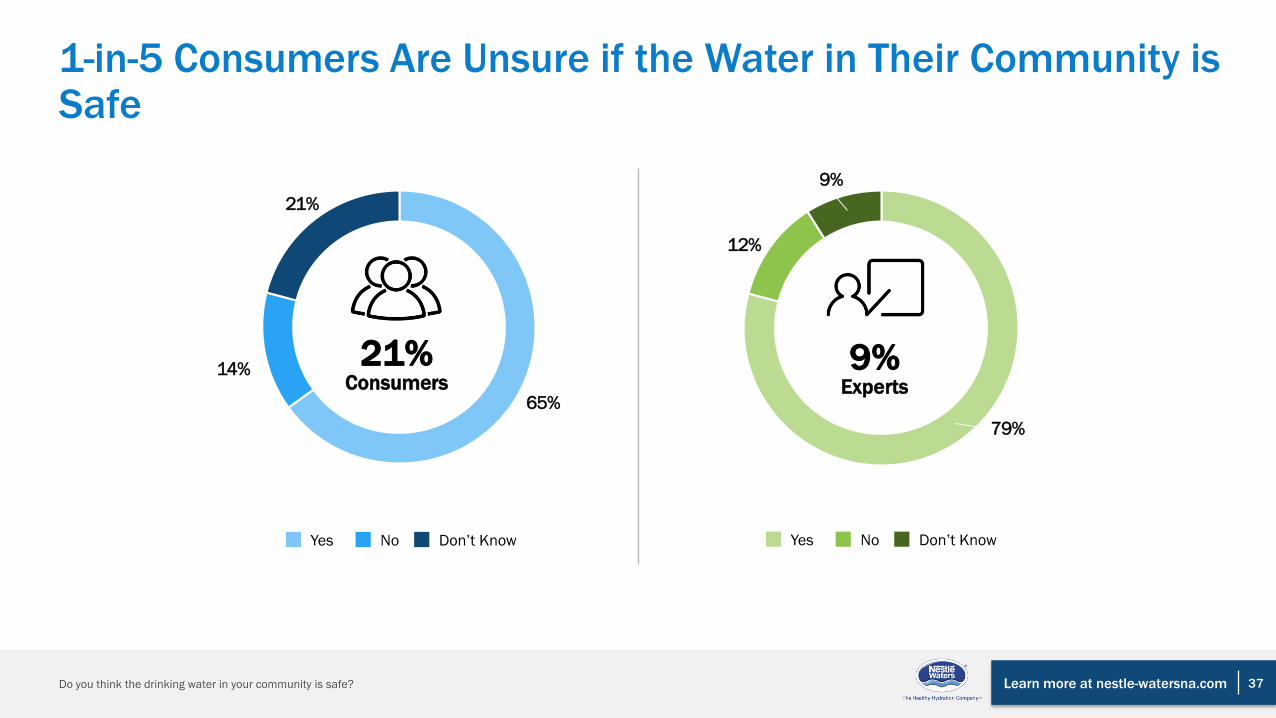
1-in-5 Consumers Are Unsure if the Water in Their Community is Safe
79%
12%
9%
65%
14%
21%
Yes Don’t KnowNo Yes Don’t KnowNo
Do you think the drinking water in your community is safe? 37
21%Consumers
9%Experts
Learn more at nestle-watersna.com
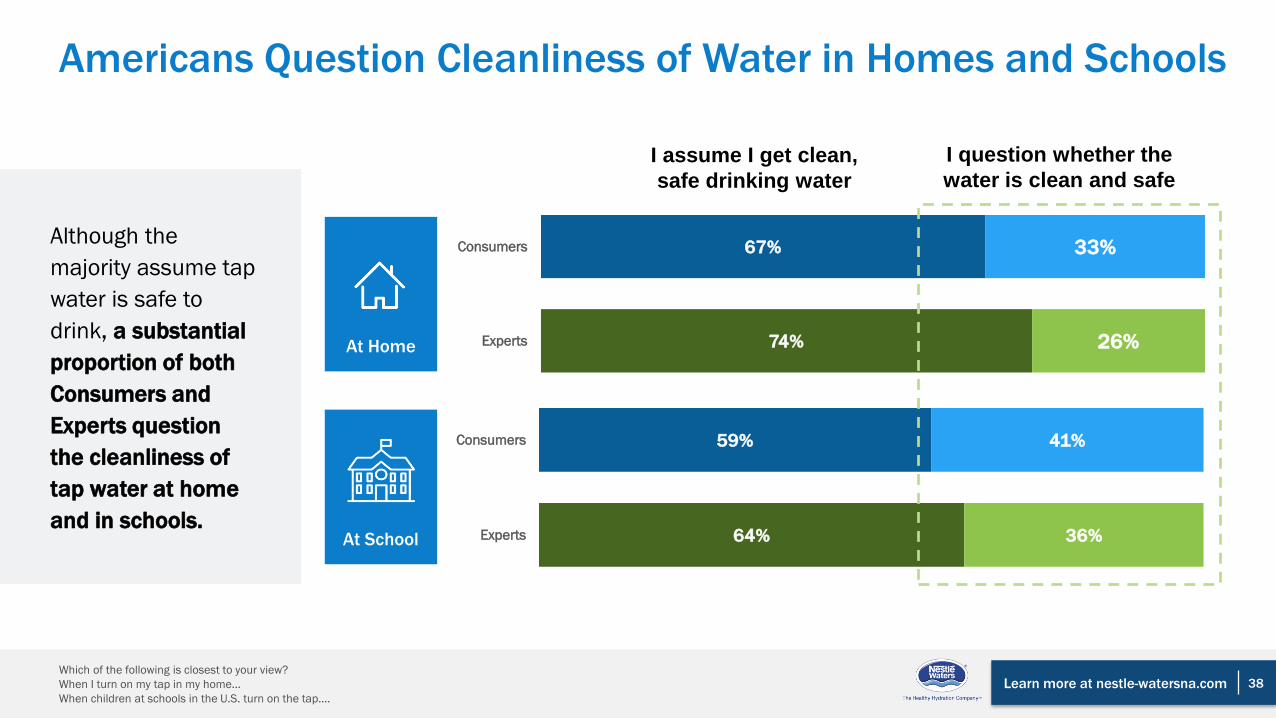
64%
59%
36%
41%
Experts
Consumers
74%
67%
26%
33%
Experts
Consumers
38
Americans Question Cleanliness of Water in Homes and Schools
Although the
majority assume tap
water is safe to
drink, a substantial
proportion of both
Consumers and
Experts question
the cleanliness of
tap water at home
and in schools.
I question whether the
water is clean and safe
I assume I get clean,
safe drinking water
At School
At Home
Which of the following is closest to your view?
When I turn on my tap in my home…
When children at schools in the U.S. turn on the tap….

Learn more at nestle-watersna.com 39
More than 4-in-10 Respondents Are Concerned that Clean Drinking Water Will Become Less Available in the Next Decade
Do you believe the following natural resources will be more or less available in the next 10 years? (less available)
54% 54%
49%
41%
31%
17%
57% 56%
51%47%
44%
12%
0
0
0
0
0
1
1
Coal Clean air Oil Clean drinking water Natural gas Renewable energy sources
Chart Title
Consumers Experts
Learn more at nestle-watersna.com
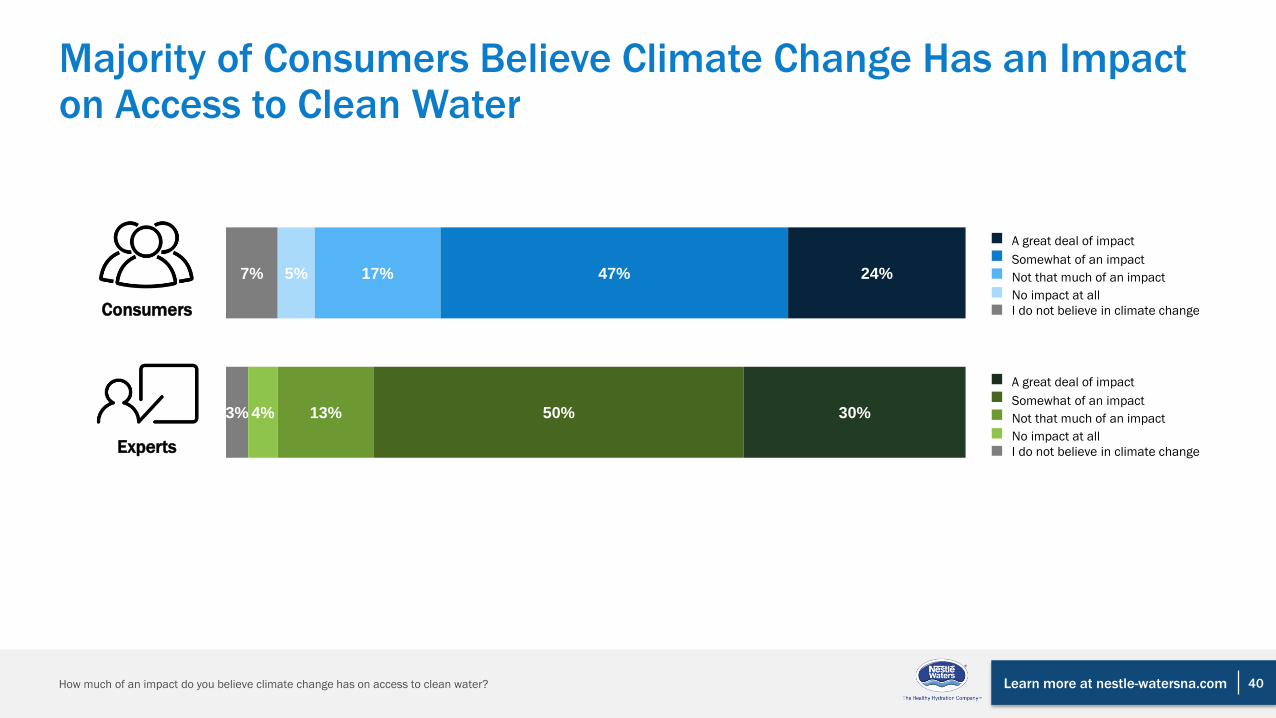
3%
7%
4%
5%
13%
17%
50%
47%
30%
24%
40
Majority of Consumers Believe Climate Change Has an Impact on Access to Clean Water
A great deal of impact
Somewhat of an impact
Not that much of an impact
No impact at all
I do not believe in climate change
A great deal of impact
Somewhat of an impact
Not that much of an impact
No impact at all
I do not believe in climate change
How much of an impact do you believe climate change has on access to clean water?
Consumers
Experts

Perspectives on America’s Water August 2018