persum: novel systems for document summarization in persian · persum: novel systems for document...
TRANSCRIPT

International Journal of Asian Language Processing 26(2): 67-108 67
PerSum: Novel Systems for Document
Summarization in Persian
Saeid Parvandeh1, Shibamouli Lahiri2, Fahimeh Boroumand3 1Tandy School of Computer Science, University of Tulsa, Tulsa, OK 74104, USA
2Computer Science and Engineering, University of Michigan, Ann Arbor, MI 48109, USA 3Department of Computer Engineering, Borujerd Branch, Islamic Azad University,
Borujerd, Lorestan, Iran
[email protected], [email protected], [email protected]
Abstract
In this paper we explore the problem of document summarization in Persian language from
two distinct angles. In our first approach, we modify a popular and widely cited Persian
document summarization framework to see how it works on a realistic corpus of news
articles. Human evaluation on generated summaries shows that graph-based methods
perform better than the modified systems. We carry this intuition forward in our second
approach, and probe deeper into the nature of graph-based systems by designing several
summarizers based on centrality measures. Ad hoc evaluation using ROUGE score on these
summarizers suggests that there is a small class of centrality measures that perform better
than three strong unsupervised baselines.
Keywords
Persian language, Summarization, Hamshahri, Pasokh, Human evaluation, ROUGE,
Centrality, JROUGE, Parsumist.
1. Introduction
The Persian language is spoken by 110 million people worldwide, and is considered one of
the official languages in three different countries – Iran, Afghanistan, and Tajikistan.1
Persian (also known as Farsi) has a rich literary and political history spanning at least two
1Source: https://en.wikipedia.org/wiki/Persian_language.
68 Parvandeh, Lahiri, Boroumand
and a half millennia, and has influenced a number of modern languages including Arabic,
Urdu, Hindi, Turkish, and Uzbek. Prominent Persian poets from the Middle Ages include
Rumi, Hafez, Saadi Shirazi, Omar Khayyam, Ferdowsi, Nizami, Shams Tabrizi, and Attar
of Nishapur. Persian literature is vast and complex, and spans the geographical boundaries
of a multitude of countries, permeating and pervading in the process their unique culture
and art forms, and infusing their social psyche since time immemorial with ever-fresh
forms of literary tapestry.2
Despite having such a large speaker population and a vibrant presence in many
countries, Natural Language Processing in Persian has been stymied by a lack of publicly
available corpora and tools, which has only very recently started to change (Seraji, 2013;
Seraji, 2015). In particular, research studies in Persian document summarization are fairly
new and limited, and there is still a lot of room to try different approaches (please see
Section 2 for a discussion of related recent work).
In this paper, we address the problem of document summarization in Persian language
from two different angles. In our first approach, we used a well-known Persian news corpus
(Hamshahri (AleAhmad et al., 2009)) to evaluate Parsumist – a popular Persian document
summarization framework (Sections 3 and 4). The reason we chose to re-implement
Parsumist is because it is one of the most highly cited and most detailed Persian
summarization systems. Also, it is simple, flexible, modular, intuitive, and relatively easy to
understand and implement. Therefore, a re-implementation of Parsumist, and evaluation on
a large realistic corpus would give us a unique opportunity to peer into the strengths and
weaknesses of such a traditional system. Our results indicate that graph-based systems
perform better than Parsumist-based systems, and the choice of threshold is of particular
importance for Parsumist. In our second approach, we used centrality measures on sentence
networks (similar to TextRank (Mihalcea and Tarau, 2004) and LexRank (Erkan and Radev,
2004)) to perform single and multi-document summarization on the recently released
Pasokh corpus (Sections 5 and 6). Pasokh consists of human-constructed summaries of
news articles, and happens to be the first publicly available research corpus of its kind in
the Persian language (Behmadi Moghaddas et al., 2013). It should be noted that we are the
first to bring centrality-based approaches in Persian document summarization, and we are
also the first to use ROUGE (Lin, 2004) in the above setting. Our results indicate that
different centrality measures perform differently in this task, and only about half of the
centrality indices perform better than strong unsupervised baselines.
Our contributions include: (a) extending a popular Persian document summarization
2https://en.wikipedia.org/wiki/Persian_literature

Persum: Novel Systems for Document Summarization in Persian 69
framework in multiple ways, and measuring its impact on a large, realistic corpus of news
articles, (b) extensive human evaluation to identify the strengths and weaknesses of
particular extensions, (c) introduction of centrality-based approaches to Persian document
summarization for the first time (both single and multi-document), and (d) introduction of
three intuitive baselines, and variations of the standard evaluation measure ROUGE – to
build the first meaningful and valid comparison point on a publicly available annotated
dataset.
This paper is organized as follows. Section 2 discusses existing work (mostly recent) in
Persian document summarization. We describe Parsumist (Shamsfard et al., 2009a;
Shamsfard et al., 2009b) and our extensions in Section 3, followed by human evaluation on
the Hamshahri corpus in Section 4. 3 Centrality-based summarization methods are
explained in detail in Section 5, followed by the results on single and multi-document
summarization on Pasokh corpus in Section 6. Section 7 concludes the paper, offering
future research directions, and discussing and outlining potential problems and limitations
of our work. Systems, tools, and corpora are introduced and explained as and when they
appear in the text for the first time.
2. Related Work
Arguably the first Persian text summarization system was FarsiSum (Hassel and Mazdak,
2004). It used a client-server application written in Perl, and was little more than an earlier
implementation – SweSum (Dalianis, 2000) – augmented by a Persian stop word list. No
evaluation was reported in Hassel and Mazdak (2004)’s study.
Zamanifar et al. (2008) reported the next study using lexical chains, word clustering,
and a summary coefficient for each cluster. Words were clustered by their co-occurrence
degree assessed by a bigram language model. Results on 60 Persian news articles showed
that Zamanifar et al. (2008)’s approach was superior to FarsiSum (in terms of precision and
recall) at compression ratios of 30%, 40%, and 50%.
Berenjkoob et al. (2009) explored the qualitative and quantitative merits of
incorporating stemming and stop word removal in Persian document summarization.
Parsumist – one of the most important research efforts in Persian summarization – came
in 2009 (Shamsfard et al., 2009a; Shamsfard et al., 2009b). Parsumist used an elaborate
pipeline of three stages – preprocessing, analysis, and content selection. In the
preprocessing stage, stop words were removed and content words were mapped to a sense
hierarchy akin to WordNet (Miller, 1995). In the analysis stage, ten features were used to 3Note that we were not the first to use Hamshahri in Persian document summarization. Kamyar et al. (2011) were the first.

70 Parvandeh, Lahiri, Boroumand
score a sentence, followed by a selection and redundancy removal step. In the final
selection stage, anaphora were resolved and sentences were re-ordered to restore coherence
and temporal cues. Parsumist was shown to perform better than FarsiSum (in terms of
precision and recall) on documents from different genres.
A flurry of research activity ensued after Parsumist. Kiyoumarsi and Esfahani (2011)
introduced fuzzy logic in Persian document summarization. They reported performance
superior to four other systems in a simulation study. Zamanifar and Kashefi (2011)
discussed AZOM – a summarizer that takes into account the implicit or explicit structure of
a document (in terms of paragraphs, blocks, etc). AZOM performed better than two
state-of-the-art approaches, and a “flat summary” baseline. Tofighy et al. (2011) used a
more rigorous structure-based approach, leveraging block nesting and sibling blocks. The
performance was better than FarsiSum at 30-40% compression ratio, but the precision and
recall values were lower compared to AZOM.
Bazghandi et al. (2012) clustered sentences based on the semantic similarity of their
content words. Semantic similarity between two words was defined as a variant of their
PMI (pointwise mutual information). Sentences were clustered using a particle swarm
optimization (PSO) algorithm. The system achieved competitive results with traditional
clustering approaches.
Shakeri et al. (2012) constructed an undirected sentence network similar to LexRank
(Erkan and Radev, 2004) and TextRank (Mihalcea and Tarau, 2004). They applied the
system to ten Persian scientific papers at a compression ratio of 50%. The network-based
system performed significantly better than FarsiSum against a human-generated gold
standard (in terms of precision, recall, F-score, and ROUGE-1).
An interesting study employing Analytical Hierarchy Process (AHP) to Persian
document summarization was discussed in (Tofighy et al., 2013). The authors arranged six
existing summarization features (word frequency, keywords, headline word, cue word,
sentence position, and sentence length) in an AHP matrix to assess their relative importance,
and to come up with an optimal selection of sentences. Results showed better F-score than
FarsiSum at compression ratios of 30% and 40%.
Finally, Nia (2013) did his Master’s thesis in generating gold standards for Persian
document summarization using the pyramid method (Nenkova et al., 2007).
It should be noted from the discussion in this section that while the studies in Persian
document summarization have been numerous, they are mostly recent, and as a result, not
very mature. For example, few of them used the recently released Pasokh corpus of
annotated summaries, and very few explored a large and realistic corpus such as Hamshahri.
Furthermore, no studies looked into centrality-based (also known as graph-based)

Persum: Novel Systems for Document Summarization in Persian 71
approaches to summarization. In this paper, we bridge these gaps.
3. Parsumist and Its Extensions
Document summarization systems have traditionally been classified into several categories:
extractive vs. abstractive, single-document vs. multi-document, generic vs. query-focused,
and neutral vs. opinionative. For the purpose of illustration, we briefly define these terms
here. An extractive summarization system chooses sentences and/or sub-sentence units (e.g.,
phrases and clauses) from the original document(s) to build the summary; an abstractive
one, on the other hand, creates its own language – usually by some form of a natural
language generation component – to build a summary. There could be some extractive
components within an abstractive summarizer. It should be noted that abstractive
summarization is a much more difficult problem than extractive, and most existing research
literature is on extractive summarization. Parsumist follows the extractive approach.
Summarization systems can work on single documents and/or multiple documents.
Multiple-document summarization is generally harder than single-document summarization,
owing to the additional complexity of inter-relationship between documents, which may
involve comparison, contrast, conflicting points of view, differing opinions, redundant
information, spurious information, and style mismatch – among others. Parsumist can work
in both single-document and multi-document modes.
An interesting take on document-summarization is generic vs. query-focused. Generic
summarizers give an overview of a document, without regard to any other source of
information. Query-focused summarizers, on the other hand, present information that is
relevant to a particular information need (i.e., a query). Parsumist can act as either a generic
summarization system, or as a query-focused one.
Lastly, oftentimes a document presents opinionated content. This is especially prevalent
in social media – news, blogs, forums, tweets, product reviews, comments, Facebook posts,
etc. A good summarizer should therefore include some of the opinionated content to give its
users an idea about contrasting points of view, and the resulting conflict, if any. Parsumist
does not provide such a functionality, and is therefore categorized as a neutral summarizer,
rather than an opinionative one.
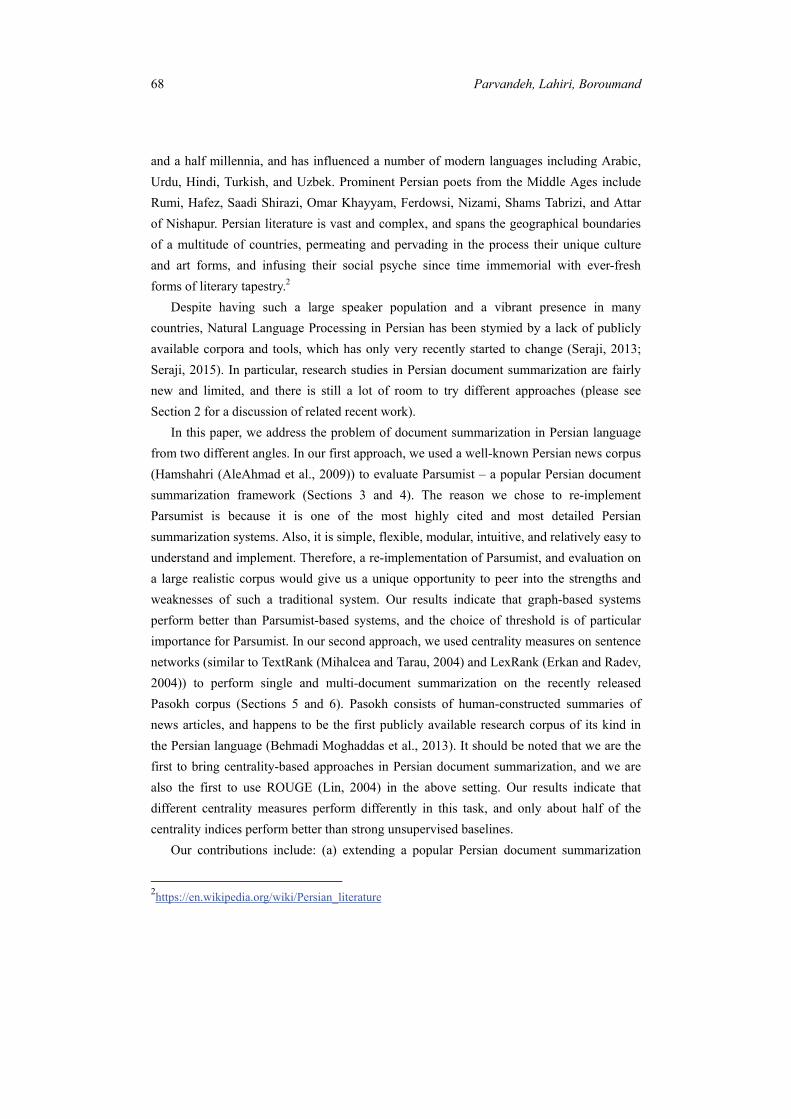
The overall structure of Parsumist is shown in Figure 1. As mentioned before, Parsumist
is an extractive summarizer, and thus saves much of the design complexity that naturally
comes into play while building a full-blown abstractive system. Furthermore, Parsumist is
flexible because it can perform both single and multi-document summarization. It follows a
pipelined approach that is highly modular, extensible, and language-independent save the
resources (Figure 1). There are four main modules – preprocessing, analysis and scoring,

72 Parvandeh, Lahiri, Boroumand
selection and redundancy checking, and smoothing the summary for coherence. The authors
mostly focused on the first three modules, and mentioned the fourth module rather cursorily.
While re-implementing Parsumist, we therefore needed to exercise a fair bit of creative
license on our own. We maintained the form and spirit of Parsumist, while altering its
content as and when necessary. One example is the resources used: Parsumist used a stop
word list, a cue word list, and a list of Persian synsets (the authors came up with their own
version of synsets). While we did have access to a stop word list, we did not have a publicly
available cue word list or a list of synsets. Thus, we had to resort to alternative resources
that will be described as they are introduced.
The remainder of this section is organized as follows. In Subsections 3.1-3.4, we
describe the four components of Parsumist, along with details on our re-implementation of
the same. In the end, we designed four systems based on Parsumist. Subsection 3.5 gives
details on the multi-document summarization part of Parsumist, and Subsection 3.6 outlines
Parsumist’s evaluation strategy – and how we re-implemented it.
Figure 1: Pipeline structure of Parsumist

Persum: Novel Systems for Document Summarization in Persian 73
3.1. Preprocessing
Parsumist uses a combination of statistical, semantic, and heuristic methods. The
preprocessing step consists of tokenization, stop word removal, and conceptual mapping
(i.e., mapping words and phrases to synsets). Note that tokenization of free-form Persian
text is rather non-trivial because of encoding problems, mixed ordering (i.e., presence of
intermingled right-to-left and left-to-right sequences of characters), omitting Ezafe in Ezafe
construction, and irregularities in word segmentation. While Parsumist uses a home-grown
tokenizer, we used the tokenizer made available by Mojgan Seraji as part of the Persian
language processing toolkit she developed (Halácsy et al., 2007; Seraji, 2013; Seraji, 2015).
The version we used is based on a Ruby-on-Rails framework for basic preprocessing, and a
couple of Perl scripts for sentence segmentation and subsequent word segmentation. Note
further that we used Hamshahri (AleAhmad et al., 2009) as our input corpus for this part,
and Hamshahri is released in NCR (numeric character encoding) encoded XML format, so
we needed to convert NCR into UTF-8 Unicode first. We used the ltchinese Python library4
for this purpose.
Stop word removal requires a standard stop word list. Since the stop word list used by
Parsumist authors was not publicly available, we used the stop word list that comes with the
Hamshahri corpus. Similarly, Parsumist authors mapped each word and phrase to a concept
(i.e., a synset) in a small concept hierarchy akin to WordNet (Miller, 1995). This concept
hierarchy was later used to construct an undirected sentence network (please see Subsection
3.2). Since the concept hierarchy was not publicly available, we constructed our sentence
networks using Latent Semantic Analysis (LSA; see Subsection 3.2 for details).5
3.2. Analysis and Scoring
As mentioned before, Parsumist uses an extractive summarization strategy for the most part.
This strategy requires scoring sentences for their importance (salience), and subsequently
selecting the highest-scored sentences that are presumably also the most important. There
are many different ways to score sentences; Parsumist uses a very simple additive strategy
based on surface, syntactic, and semantic features. The overall scoring function is as
follows:
j
ijji pcsW )( (1)
4https://pypi.python.org/pypi/ltchinese 5Note that we are not the first to introduce LSA in Persian document summarization. Poormasoomi et al. (2011) were the first.

74 Parvandeh, Lahiri, Boroumand
where W(si) is the score of the i-th sentence, cj is the weight of feature j (assumed to be 1 by
the authors), and pij is the value of feature j in sentence i. The features are as follows:
1. Number of main words, title words, and query words. Presence of important
words in a sentence (esp. words that appeared in the document title) often
indicates that the sentence is important, and should probably be included in the
summary. Furthermore, note that Parsumist can work as a query-focused
summarizer by enhancing the importance of sentences that contain query words. In
our implementation, we only considered title words (i.e., words that appeared in
the document title), and disregarded main words and query words. Thus, our
summarizer is generic (as opposed to query-focused). Moreover, we used the
frequency of title words in a sentence (normalized by sentence length) as the
feature value.
2. Length of the sentence. Authors posited that shorter sentences were more likely
to appear in a summary. While the merit of this decision is debatable (longer
sentences presumably contain more information, and should therefore be given a
higher weight), in our implementation we simply added a feature – reciprocal of
the sentence length – to simulate the correct behavior.
3. Proper nouns. Authors correctly observed that the importance of proper nouns
(named entities – more generally) depends on the type of document. If we are
summarizing news articles, academic papers, or short stories, proper nouns usually
are important because they signal the presence of a named entity. For informal
media like blogs, emails, tweets and online forums on the other hand, proper
nouns may be much less important. In our implementation, we used the frequency
of proper nouns in a sentence (normalized by sentence length) as the feature value.
4. English words and phrases. The authors made an interesting observation about
English words in Persian text; presence of English words usually indicates the first
appearance of a new term in a document. Such terms are especially relevant if the
document is talking about a scientific study (e.g., research articles). Our
implementation uses the frequency of English words in a sentence (normalized by
sentence length) as the feature value.
5. Quotation marks. Quotation marks in a sentence should be given due importance
because they signify an important previous commentary. We used the frequency of
quotation marks in a sentence (normalized by sentence length) as the feature value.
6. Pronouns. Most pronouns indicate some form of anaphora. Authors correctly
Persum: Novel Systems for Document Summarization in Persian 75
pointed out that we should select the sentence that contained the referent, in
addition to selecting the sentence with the pronoun. However, this would require
anaphora resolution, which is a hard problem for Persian. The authors therefore
opted for an easier solution – reduce the score of a sentence that contains a
pronoun, but do not delete it. We chose to use the same solution – with a twist. We
used the frequency of non-pronoun words in a sentence (normalized by sentence
length) as the feature value.
7. Percentage sign (“%”). The percentage sign is used to represent results (esp.
improvement) in scientific documents, and profit margins and general
increments-decrements in financial documents. Hence derives its importance. We
used the frequency of percentage signs in a sentence (normalized by sentence
length) as the feature value.
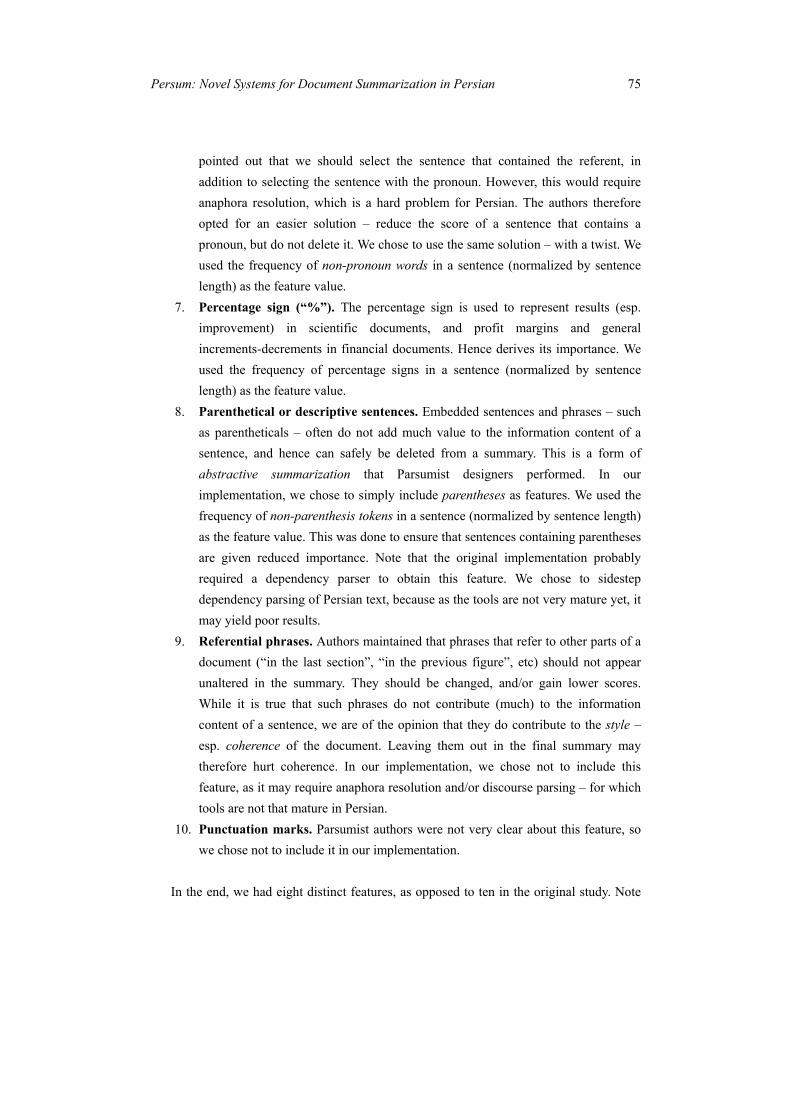
8. Parenthetical or descriptive sentences. Embedded sentences and phrases – such
as parentheticals – often do not add much value to the information content of a
sentence, and hence can safely be deleted from a summary. This is a form of
abstractive summarization that Parsumist designers performed. In our
implementation, we chose to simply include parentheses as features. We used the
frequency of non-parenthesis tokens in a sentence (normalized by sentence length)
as the feature value. This was done to ensure that sentences containing parentheses
are given reduced importance. Note that the original implementation probably
required a dependency parser to obtain this feature. We chose to sidestep
dependency parsing of Persian text, because as the tools are not very mature yet, it
may yield poor results.
9. Referential phrases. Authors maintained that phrases that refer to other parts of a
document (“in the last section”, “in the previous figure”, etc) should not appear
unaltered in the summary. They should be changed, and/or gain lower scores.
While it is true that such phrases do not contribute (much) to the information
content of a sentence, we are of the opinion that they do contribute to the style –
esp. coherence of the document. Leaving them out in the final summary may
therefore hurt coherence. In our implementation, we chose not to include this
feature, as it may require anaphora resolution and/or discourse parsing – for which
tools are not that mature in Persian.
10. Punctuation marks. Parsumist authors were not very clear about this feature, so
we chose not to include it in our implementation.
In the end, we had eight distinct features, as opposed to ten in the original study. Note

76 Parvandeh, Lahiri, Boroumand
that in almost all the above cases, we needed to exercise our own discretion to come up
with an appropriate feature value. This was due to under-specification and lack of clarity on
the part of Parsumist authors, who did not adequately specify and/or quantify most of the
above features. We therefore needed to come up with our own best (educated) guesses as to
what they could have been. We also had to alter parameters and introduce new ones as
appropriate. For example, we came up with sentence length normalization to combat the
variability of sentence length. Many of the features needed a part-of-speech tagger; we used
Mojgan Seraji’s tagger (Halácsy et al., 2007; Seraji, 2015) for this purpose.6
Once the score of each sentence is known, Parsumist constructs an undirected graph
between sentences – each node is a sentence, and two nodes are connected if their similarity
exceeds a certain threshold. Similarity between two nodes (sentences) is computed using
lexical chains and a synset hierarchy akin to WordNet (Miller, 1995). The authors are very
vague in describing how they computed this similarity metric. They do mention that the
similarity is computed using the number of common or related words due to lexical chains
and synsets, but no further details are provided. Moreover, the authors came up with their
own synset hierarchy, and never released it to the public. Hence, we had to come up with
our own similarity measure (instead of using the original method).
We defined the similarity between two sentences as the cosine between their LSA
vectors.7 Note that LSA relies on Singular Value Decomposition, a matrix factorization
technique that comes from Linear Algebra. The basic premise of LSA is very simple; if two
words have similar meaning (say “rat” and “mouse”), then they should occur in similar
contexts. Hence, if we were to construct a co-occurrence matrix between words, and
somehow compress this matrix into a low-dimensional form (known as low-rank
approximation), then the resulting matrix will yield vectorial representations for
semantically similar words that are “close” to each other in terms of cosine similarity –
even if the original vectors were not close together.
The particular way LSA works is as follows: we first construct a term-document matrix,
where rows are words, and columns are documents. Each word is represented as a row
vector, and each document is a column vector. The particular value of a single matrix cell
could be term frequency, tfidf, or even binary presence/absence (see, e.g., Chung and
Pennebaker (2008)). For our implementation, we chose simple term frequency as the value.
Once the term-document matrix (say, X) is constructed, we perform a Singular Value
Decomposition (SVD) as follows:
6Available at http://stp.lingfil.uu.se/~mojgan/tagper.html. 7Latent Semantic Analysis (Landauer and Dumais, 2008).

Persum: Novel Systems for Document Summarization in Persian 77
TVUX (2)
where U and V are orthogonal matrices, and Σ is a diagonal matrix. The diagonal entries σi
of Σ are known as singular values. Now, say X was an M-by-N matrix; then U is an
M-by-M matrix, V is an N-by-N matrix, and Σ is an M-by-N matrix.8
With that, we are now ready to describe the low-rank approximation (compression) step
of LSA. Essentially, we perform a truncated SVD:
Tkkkk VUX (3)
where Xk is an M-by-N low-rank approximation of the original term-document matrix X,
Uk is an M-by-k matrix (the first k columns of U), Σk is a k-by-k square diagonal matrix
(the first k rows and first k columns of Σ), and Vk is an N-by-k matrix (the first k columns
of V). As it turns out, this truncated SVD representation is a form of lossy compression that
is the “closest” to the original term-document matrix X, in the sense that it minimizes the
Frobenius Norm of the difference between X and Xk. Xk is known as the “rank-k
approximation” of X, since we took the largest k singular values, and the leftmost k
columns of U and V to construct Xk. What comes out as the most important upshot of this
decomposition procedure is a fact we alluded to in the above discussion: words that are
semantically close to each other (say “rat” and “mouse”), become closer in their vectorial
representation (i.e., on the vector space). In other words, the original sparse matrix X
becomes a dense matrix Xk, where semantically similar terms occupy similar regions of the
vector space.
Finally, we project a sentence onto this dense LSA space Xk, as follows. We first
construct a term-vector for the sentence (say, s), whose dimensionality is M-by-1. The
individual elements of this vector are simple term frequencies (as before). Once this vector
is constructed, we use the following equation to turn it into a compressed (low-ranked)
vector sk of dimensionality k-by-1:
sUs Tkkk
1 (4)
8M is the number of unique words. N is the number of documents.

78 Parvandeh, Lahiri, Boroumand
This sk is what we will henceforth refer to as the “LSA vector” of a sentence. Note that
the reason we needed to perform LSA on sentences is because Parsumist uses a semantic
similarity between sentences, and LSA yields a very good proxy for semantic similarity. It
is one of the cornerstones of modern distributional semantics (see, e.g., Bruni et al. (2014)),
and is reasonably free from statistical assumptions.9 Parsumist authors used lexical chains
and synsets to come up with semantic associations; we believe LSA is a finer-grained
solution than that. We performed LSA on the full Hamshahri corpus, and chose the value of
k to be 200 after initial parameter tuning.
3.3. Selection and Redundancy Checking
As we mentioned before, sentence selection is a key step in any extractive summarization
system. Redundancy checking, however, is more germane to multi-document
summarization than single-document summarization. In single-document summarization,
the sentences usually describe different aspects of an underlying issue. In multi-document
summarization, there is no such guarantee. Two sentences from two different documents
may describe exactly the same aspect of the same issue. Since Parsumist has the option of
working as a multi-document summarizer, checking and managing redundancy becomes a
paramount objective.
The way Parsumist handles redundancy consists of a three-step process that is merged
with sentence selection:
a) Begin with an empty summary.
b) As long as the summary length is shorter than desired, choose the sentence with
highest score and minimum resemblance with the already-selected sentences.
c) Continue until the desired summary length is reached.
As we can see, the above description leaves several questions un-answered (e.g., what is
the minimum resemblance threshold? How many of the previously selected sentences to
consider? How to choose among previously selected sentences?). We conducted extensive
parameter tuning, and came up with the following algorithm (described in Python
pseudocode):
9With concomitant limitations, however; the discussion of which is outside the scope of this paper.

Persum: Novel Systems for Document Summarization in Persian 79
What this algorithm does, is as follows. It keeps selecting highest-scored sentences for
inclusion in the summary until the desired summary length (10 sentences) is reached. The
algorithm makes sure that too long and too short sentences are excluded, by only taking
into account sentences whose length falls within the 1st and 3rd quartiles of all Hamshahri
sentences. It also excludes sentences that are too similar to already selected sentences, by
enforcing a threshold on the minimum cosine similarity with the previously selected ones.
Note that the 10 sentences length and minimum cosine similarity were selected as part of
preliminary parameter tuning. Later, we observed that cosine thresholds of 0.1 and 0.2
produced reasonably good summaries. Among median, maximum, and minimum thresholds,
minimum yielded the best results. This gives us two systems:
1. Top 10 sentences, modified Parsumist, minimum cosine threshold of 0.1
2. Top 10 sentences, modified Parsumist, minimum cosine threshold of 0.2
Next we went ahead and experimented with two more systems that are graph-based
(also called centrality-based). Graph-based summarizers are one of the mainstays in
extractive summarization, and we will discuss them in detail in Section 5. Briefly, they
construct a network (graph) where each node is a sentence, and an edge appears between
two sentences if their similarity exceeds a certain threshold. For our implementation, we
chose to use the complete graph of sentences, and weighted edges with cosine similarity on
LSA vectors. Then we followed the popular TextRank (Mihalcea and Tarau, 2004) and
LexRank (Erkan and Radev, 2004) formalism that prescribed running a random walk on
this sentence network, and scoring nodes by their PageRank value (Page et al., 1998).10
Following recent studies, we also experimented with the weighted degree (or strength) of a
10More discussion appears in Section 5.
sorted_list = sort(sentences) by score in descending order
selected_sentences = []
for sentence in sorted_list:
if len(selected_sentences) == 10: break
if sentence_length is outside 1st and 3rd quartiles: continue
if min_cosine_sim(sentence, selected_sentences) > threshold:
continue
append(selected_sentences, sentence)

80 Parvandeh, Lahiri, Boroumand
sentence instead of PageRank.11 This gives rise to our last two systems in this section:
3. Top 10 sentences, PageRank on LSA vector cosine similarity graph
4. Top 10 sentences, weighted degree (strength) on LSA vector cosine similarity
graph
The reason we chose to use two graph-based systems at this point was to see how
(modified) Parsumist competes against these popular and powerful frameworks – on the
same kind of sentence vectors. If Parsumist works better than graph-based systems, then we
have a strong contender for state-of-the-art extractive summarization in Persian language.
On the other hand, if graph-based systems perform better, then we have yet one more strand
of evidence in support of their power, pervasiveness, ubiquity, and applicability. Our results
show that graph-based systems do in fact perform better than Parsumist-based systems (cf.
Section 4).
3.4. Smoothing the Summary for Coherence
Coherence is a thorny issue in extractive summarizers, esp. multi-document ones. In
single-document summarization, different sentences present different aspects of an
underlying issue. Hence, presenting extracted sentences in temporal order largely resolves
the coherence problem. However, for multi-document summarization, since two sentences
may refer to the same aspect of the same issue at the same time point, it becomes difficult
to maintain logical coherence – since two successive sentences may talk about the same
issue from two completely opposite angles.
Note that abstractive summarizers by default suffer less from the coherence problem,
because the summary can be smoothed in different ways to give it a more polished and
coherent look. Parsumist, however, is an extractive summarizer for the most part, so
addressing coherence becomes a key issue. The way Parsumist handles coherence is by
penalizing sentences containing anaphora and/or taboo words. The taboo word list can be
specified by the user, which is an important flexibility.12 Anaphoric sentences are one of
the principal contributors to the coherence problem, because they do not – by definition –
refer to the sources of anaphora.
Parsumist employs a few other heuristics to manage the lack of coherence in generated
11Please see Boudin (2013) and Lahiri et al. (2014) for evidence that non-PageRank centrality measures often perform as well as or better than PageRank, when it comes to keyphrase extraction. We suspect that similar observations will hold true in the summarization domain. 12Parsumist authors came up with their own taboo words list – which was never made public.

Persum: Novel Systems for Document Summarization in Persian 81
summaries. For bulleted lists, it chooses to either ignore the list, or select at least one
sentence from each bullet. It also curbs redundancy in both single and multi-document
modes at the sentence, morphological, and word-semantic levels – as described before.
Sentences deemed too similar are collapsed into a single cluster, and only one
representative from each cluster is chosen. Furthermore, Parsumist strives to retain the
temporal ordering of sentences as much as possible – without violating the “Selection and
Redundancy Removal” algorithm.
In our implementation, we chose to skip coherence handling and management – for two
reasons: (a) details of implementation were unclear in the Parsumist paper, and (b) existing
publicly available Persian tools and resources were inadequate to handle issues like
anaphora and taboo words.
3.5. Multi-Document Summarization by Parsumist
Existing literature on multi-document summarization prescribes two distinct ways of
approaching this problem:
1. Concatenate all documents, and then run the single-document summarizer.
2. Generate single-document summaries for all documents, concatenate the
summaries, and then run the single-document summarizer (esp. the redundancy
eliminator) on this concatenated document to produce a more compact summary.
Parsumist authors found that there was no significant difference in performance between
the two approaches. It should be noted, however, that the second approach has the obvious
advantage that the redundancy eliminator is run twice, thereby (potentially) resulting in a
more compact, coherent, and readable summary. The trade-off, however, betrays itself in
time complexity. The second approach is more time-consuming, because the whole
summarization process needs to run twice.
In our implementation, since we performed redundancy elimination implicitly rather
than explicitly, and since we did not have an explicit coherence management module, we
opted for the first approach – concatenate all documents, and then run the single-document
summarizer once.
3.6. Evaluation of Parsumist
Evaluation turns out to be the Achilles’ heel for most summarization systems, simply
because there is no agreed-upon or universal standard of summarization. Human
summarizers tend to vary a lot regarding content selection and style, and most human
82 Parvandeh, Lahiri, Boroumand
summarizers follow an abstractive approach to summarization, as opposed to the extractive
approach followed by computational systems. Evaluation is further complicated by the fact
that it is often unclear (esp. for long documents or multiple documents) which units of
information are important enough to be included in the summary. This concerns both the
granularity of linguistic units (Words? Phrases? Clauses? Sentences? Paragraphs?), as well
as their salience (i.e., importance).
Extractive summarizers deal with the granularity issue by (mostly) focusing on
sentences. The salience issue is resolved by adopting a scoring function (also variously
known as an objective function) – perhaps in addition to other constraints and/or heuristics
– and thus imposing a ranking (i.e., an order) on the otherwise unordered set of linguistic
units. Evaluation is usually performed by comparing system-generated summaries (also
known as “peer summaries”) with multiple human-generated summaries (also known as
“model summaries”) to reduce variability. As one can deduce from this discussion,
agreement among human judges tends to be fairly low for extractive summarization.
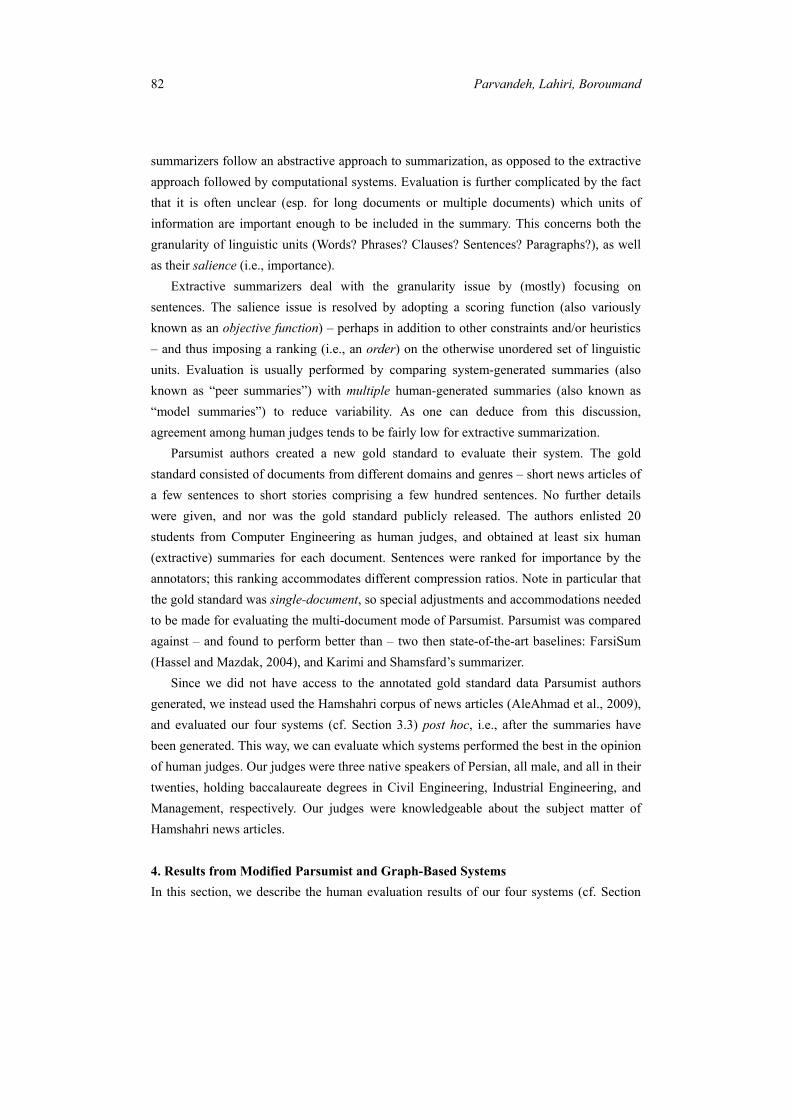
Parsumist authors created a new gold standard to evaluate their system. The gold
standard consisted of documents from different domains and genres – short news articles of
a few sentences to short stories comprising a few hundred sentences. No further details
were given, and nor was the gold standard publicly released. The authors enlisted 20
students from Computer Engineering as human judges, and obtained at least six human
(extractive) summaries for each document. Sentences were ranked for importance by the
annotators; this ranking accommodates different compression ratios. Note in particular that
the gold standard was single-document, so special adjustments and accommodations needed
to be made for evaluating the multi-document mode of Parsumist. Parsumist was compared
against – and found to perform better than – two then state-of-the-art baselines: FarsiSum
(Hassel and Mazdak, 2004), and Karimi and Shamsfard’s summarizer.
Since we did not have access to the annotated gold standard data Parsumist authors
generated, we instead used the Hamshahri corpus of news articles (AleAhmad et al., 2009),
and evaluated our four systems (cf. Section 3.3) post hoc, i.e., after the summaries have
been generated. This way, we can evaluate which systems performed the best in the opinion
of human judges. Our judges were three native speakers of Persian, all male, and all in their
twenties, holding baccalaureate degrees in Civil Engineering, Industrial Engineering, and
Management, respectively. Our judges were knowledgeable about the subject matter of
Hamshahri news articles.
4. Results from Modified Parsumist and Graph-Based Systems
In this section, we describe the human evaluation results of our four systems (cf. Section

Persum: Novel Systems for Document Summarization in Persian 83
3.3). The systems were evaluated on 50 topics of Hamshahri corpus. Each topic in
Hamshahri consists of several Persian news articles. Hamshahri was built for Cross-Lingual
Information Retrieval (CLIR), which is a different task than summarization. We adapted the
dataset to our purpose. Adapting a CLIR dataset for summarization is a challenging task,
and the trade-offs are not well-understood. We are the first to experiment with such an idea
in Persian, and we will show (later in this section) that Hamshahri, in fact, is very
well-suited for the task of summarization.
We treated the problem as multi-document summarization, and concatenated all
documents within a single topic as a big topic-document. This way, we ended up with 50
topic-documents, and ran our summarization systems on them. Parsumist, as already noted,
can perform multi-document summarization in this way; so can graph-based systems like
TextRank (Mihalcea and Tarau, 2004) and LexRank (Erkan and Radev, 2004). We posit that
our fourth system based on weighted degree (strength) should be able to do the same.
We gave our human judges the title and description of each of the 50 topics, to facilitate
understanding and acclimatization. Then we gave them four summaries for each topic
(totaling 200 summaries), and instructed them to read the summaries very carefully. Once
they have read the summaries of a particular topic, they were asked to assign a score
between 1 and 7 as to how good the summaries were, where “goodness” is measured by
relevance to the topic title and description,13 and overall presentation. The scale is as
follows:
1. Very bad summary
2. Bad summary
3. Somewhat bad summary
4. Borderline summary (not too good, not too bad)
5. Somewhat good summary
6. Good summary
7. Very good summary
This way, each summary of each topic was given a score by each human annotator.
Note that the above scheme corresponds to a Likert Scale style annotation (Likert, 1932),
and is widely used in summarization research. It allows for some amount of variability in
human judgment, rather than forcing the judges to make a binary or ternary judgment. This
13Note that it is in general impossible for the human judges to read all documents of all topics, and then assign a score to a summary. As a proxy, we asked them to merely read the topic title and description.

84 Parvandeh, Lahiri, Boroumand
turns out to be an important decision, because as we will see later in this section, on
average the judges converge toward the middle of the scale – a phenomenon known in the
social sciences as the central tendency bias. With strict binary or ternary judgment, the
presence of such bias is eliminated, which could be both good (because now we have 2-3
crisp classes of summaries) and bad (because now the bias is removed rather artificially,
and the resulting 2-3 classes may contain a jumble of different types of good/bad
summaries). We are of the opinion that a nuanced judgment should be the way to go –
rather than a binary or ternary decision.
The rest of this section is organized around several research questions we asked of the
data obtained from our human judges. The questions probe several topics, ranging from
inter-annotator agreement and intra-annotator bias to inter-system difference and inter-topic
difference.
4.1. Question 1: How Much do the Judges Agree?
Inter-annotator agreement is very important for all summarization systems, not only
because it gives us an idea of how hard the task is (lower agreement implies greater
difficulty), but also because it gives an upper bound (roofline) on the performance of a
proposed computational system.
Judge Judge 1 Judge 2 Judge 3
Judge 1 1.0 0.94 0.91
Judge 2 0.94 1.0 0.91
Judge 3 0.91 0.91 1.0
Table 1: Cosine similarity between judges
We represented each human judge as a vector of 200 elements (50 topics, 4 summaries
per topic), and measured agreement between those vectors. As shown in Table 1, the three
judges indeed have a very high cosine similarity among themselves. This is reassuring, but
not completely satisfying, because the correlation among the judges is fairly low (cf. Tables
2-4), and in fact statistically indistinguishable from zero in at least one of the cases
(between Judge 2 and Judge 3). Correlation is a better measure of agreement than cosine
similarity, because correlation is invariant to both translation and rotation of vectors,
whereas cosine is only invariant to rotation, but not translation.
This shows that the task of multi-document summarization in Persian is in fact very
difficult, and we should expect the performance of existing summarizers to be low.

Persum: Novel Systems for Document Summarization in Persian 85
Judge Judge 1 Judge 2 Judge 3
Judge 1 1.0 0.35 0.14
Judge 2 0.35 1.0 0.12*
Judge 3 0.14 0.12* 1.0
Table 2: Pearson correlation between judges; “*” indicates statistical indistinguishability
from zero at 95% confidence level.
Judge Judge 1 Judge 2 Judge 3
Judge 1 1.0 0.30 0.13*
Judge 2 0.30 1.0 0.05*
Judge 3 0.13* 0.05* 1.0
Table 3: Spearman correlation between judges; “*” indicates statistical indistinguishability
from zero at 95% confidence level.
Judge Judge 1 Judge 2 Judge 3
Judge 1 1.0 0.23 0.10*
Judge 2 0.23 1.0 0.04*
Judge 3 0.10* 0.04* 1.0
Table 4: Kendall correlation between judges; “*” indicates statistical indistinguishability
from zero at 95% confidence level.
4.2. Question 2: Are the Judges Biased? If yes, by How Much?
It is instructive to look into intra-annotator bias, and see how much individual judges tilt
towards a certain direction of the Likert Scale. Also, it allows us to identify relatively
lenient judges and relatively harsh judges, and then adjust our evaluation accordingly.
Judge Mean Standard Deviation
Judge 1 4.61 1.47
Judge 2 4.84 1.53
Judge 3 4.51 1.62
Table 5: Mean and standard deviation of each of the three judges
We represented each judge as a vector of 200 elements (as before), and computed the
means and standard deviations of those vectors. Table 5 shows the results. Note that Judge
2 is the most “lenient”, in the sense that he gave the highest ratings on average. Judge 3 was

86 Parvandeh, Lahiri, Boroumand
the most “harsh” from that perspective. Compared between themselves, judges were
actually quite similar in terms of their average ratings, which may point to the presence of a
central tendency bias (more discussion below).
Considering variability, Judge 3’s ratings are the most spread out, indicating the fact
that he had the most varied set of opinions. On the other hand, Judge 1 has the lowest
standard deviation, which implies that his opinion is much more concentrated and focused.
Overall, all three annotators exhibit central tendency bias, because all three means are very
close to the central point of the Likert Scale (which is 4), and far from the two extremities
(1 and 7, respectively). This may indicate two things – not necessarily mutually exclusive:
(a) the task was difficult, and annotators resorted to a middling scoring tactic, and (b) the
annotators were unable to judge the goodness/badness of the summaries. We opine that the
first of these alternatives is true, because all three annotators were background-checked and
had no reason not to understand simple newswire text in their native language. So the
upshot of this section is that: (a) yes, the annotators were biased, but not too much when
compared between themselves; (b) there was a clear central tendency bias; and (c) the
central tendency bias was due to the difficulty of the task, and not due to annotator
incompetence or laziness.
4.3. Question 3: Are the Judges Similar?
We already observed that owing to central tendency bias, mean ratings of all three judges
were quite close to each other. We performed repeated measures ANOVA (also called paired
ANOVA (equivalent to paired t-test on multiple samples)) to find out if the mean ratings are
statistically significantly different.14 The results show that they are in fact not significantly
different from each other (i.e., we failed to reject the null hypothesis) at 95% confidence
level. That is, judges are similar to each other in terms of mean ratings. This establishes
beyond doubt the presence of central tendency bias as a ubiquitous phenomenon in our
Likert Scale style annotation.
4.4. Question 4: Are the Four Systems Different from Each Other? How Different Are
They?
We would like to know how our systems performed on Hamshahri as multi-document
summarizers. Recall that we have four systems (cf. Section 3.3) – two based on Parsumist,
and two graph-based. How did they perform compared to each other? To answer this
question, we first needed to do annotator standardization.
14The p-value was computed from this website: http://graphpad.com/quickcalcs/PValue1.cfm

Persum: Novel Systems for Document Summarization in Persian 87
Recall from Section 4.2 that our annotators were biased – they had different mean
overall ratings, and different standard deviations. To remove this intra-annotator bias, we
computed a z-score for each annotator:
x
z (5)
where x is a particular rating, µ is the mean of all ratings assigned by one annotator, and σ is
the standard deviation of the annotator. The z-score effectively tells us how many standard
deviations away from the mean a particular rating lies.
System Mean Rating
System 1 -0.155
System 2 -0.069
System 3 0.140
System 4 0.084
Table 6: Mean ratings of four summarization systems
Each annotator was represented as a vector of 200 elements, and each element was
standardized by Equation (5), thus yielding a 200-length z-score vector. Next, we
represented a summarization system as a vector of 50 elements, where each element
corresponds to a Hamshahri topic (Hamshahri had 50 topics), and the element value is the
mean of three z-scores from three annotators. Then we performed paired ANOVA (like
Section 4.3) on the four vectors (corresponding to four summarization systems). Results
indicate that there is – in fact – some statistically significant difference among the mean
ratings of the four systems at 95% confidence level. Mean ratings of the four systems are
shown in Table 6. Note that the ratings could be positive or negative, because they are
averaged across multiple z-scores, and z-scores can be positive or negative. Note also that
System 3 (PageRank on sentence network) has the highest mean rating, followed by System
4 (weighted degree on sentence network), System 2 (modified Parsumist), and System 1
(modified Parsumist), respectively. This shows that graph-based systems are undoubtedly
better than the systems we implemented by modifying Parsumist. It also shows that the
choice of minimum cosine threshold is important – in particular, System 2 performs better
than System 1, and the only difference between the two systems is in cosine threshold.
The next question that arises is: is any of the systems statistically significantly better

88 Parvandeh, Lahiri, Boroumand
than any other system? To answer this question, we performed paired t-tests among all
system pairs (with Bonferroni Correction for multiple comparison (adjusted α = 0.05/6)).
Results indicate that indeed, Systems 1 and 3, Systems 1 and 4, and Systems 2 and 3 are
statistically significantly different from each other at 95% confidence level (by one-tailed
p-value). According to magnitude of the p-value, Systems 1 and 3 are maximally different
from each other (lowest p-value), followed by Systems 1 and 4, and then by Systems 2 and
3. What this implies is that Systems 3 and 4 (the graph-based systems) are significantly
better than System 1 (modified Parsumist), and System 3 (graph-based) is significantly
better than System 2 (Parsumist-based). Hence, graph-based systems are better on Persian
extractive summarization than Parsumist-based systems.
4.5. Question 5: Are Similar Systems Similar in Terms of Performance?
Now consider two “system clusters”: one on graph-based systems, and another on
Parsumist-based systems. Are the two graph-based systems and the two Parsumist-based
systems more similar within themselves than between each other? In other words, are the
clusters more tightly knit within themselves than between each other? To see this, we
measured cosine similarity between all pairs of system vectors (each of length 50). Table 7
shows the results.
System Pair Cosine Similarity
Systems 1 and 2 0.61
Systems 1 and 3 0.34
Systems 1 and 4 0.38
Systems 2 and 3 0.30
Systems 2 and 4 0.30
Systems 3 and 4 0.91
Table 7: Cosine similarity between system pairs
As seen from Table 7, the highest cosine similarities occur within clusters: graph-based
systems (Systems 3 and 4) achieve a cosine of 91% between themselves, whereas
Parsumist-based systems (Systems 1 and 2) achieve a cosine of 61% between themselves.
All other pairs are between-group pairs, and they achieve much lower cosines.
To probe this phenomenon further, we took the vector average of Systems 1 and 2, and
Systems 3 and 4, to come up with two prototype vectors – one for each of the “system
clusters”. These two prototype vectors achieve a cosine of 38% between themselves, which

Persum: Novel Systems for Document Summarization in Persian 89
is indeed much lower than within-cluster cosines.
What this discussion shows is that similar systems are similar in terms of
human-assigned ratings, and dissimilar systems are dissimilar.
4.6. Question 6: How Are the 50 Topics Different in Terms of Summarization?
Now that we have analyzed and dissected the annotators and the four systems, the next
question to ask is: how are the 50 Hamshahri topics different in terms of summarization?
Are they all equally easy/hard to summarize? Or is there some difference? Note that the
answer to these questions has important implications in designing future Persian
summarizers. For example, if we can show that some topics are inherently more difficult to
summarize than some other topics, then we can follow different summarization strategies
for those two classes of topics. Perhaps we can come up with class-based strategies to
orient summarization systems towards different topical difficulty levels.
To probe these issues, we first define the notion of summarizability. The
“summarizability” of a topic is defined as the mean of four ratings (from four systems) for
that topic – each rating being an average across three annotators. This way, we obtain a
single number for each of the 50 topics.
Figure 2: Summarizability of Hamshahri topics
Next, we sorted the summarizability values in descending order, and plotted them
against topic ID (Figure 2). This plot shows a clear trend: a few topics are highly

90 Parvandeh, Lahiri, Boroumand
summarizable, a few are highly un-summarizable, and most fall in between. Hence, there
are three classes of topics:
1. Highly summarizable topics (easiest to summarize)
2. Agnostic topics (in-between difficulty in terms of summarization)
3. Highly un-summarizable topics (hardest to summarize)
For Hamshahri, most of the topics turn out to be agnostic – which is a fairly broad range.
Interestingly, this shows that Hamshahri – originally conceived as a dataset for
Cross-Lingual Information Retrieval (CLIR) – is also a very good corpus for
summarization research, with a mix of topics that touch different summarizability levels,
and most of the topics either highly summarizable or agnostic. We show the topics along
with their English description and summarizability values in Table 8 (sorted in descending
order of summarizability).
Topic English Description Summarizability
607-AH Commemorations of Sadi Shirazi 1.05
642-AH Shahr Theater Programs 0.72
608-AH House Prices 0.71
613-AH Children’s Rights 0.61
643-AH Earthquake Damage in Iran 0.60
628-AH NATO vs. Yugoslavia in 1998 0.55
650-AH Fluctuations in Gas Imports 0.55
629-AH Global Drought Predictions 0.53
611-AH Information Technology and Employment 0.49
612-AH Internet Users 0.48
635-AH Iran in 1998 World Cup 0.48
616-AH Hand-woven Carpet Exports 0.45
619-AH Iranian Non-oil Exports 0.43
622-AH Tehran Car Accidents 0.40
644-AH Electronic Commerce 0.35
617-AH Tourist Attractions 0.32
609-AH Fruit Packing 0.31
634-AH University Acceptance Limits 0.30
623-AH North Iran Forestry Conservation 0.22

Persum: Novel Systems for Document Summarization in Persian 91
615-AH Remembrance of Dr Ali Shariati 0.21
618-AH 7 July 1999 Protests 0.19
631-AH Relations between Iran and the United States 0.17
639-AH Bovine Spongiform Encephalopathy 0.11
630-AH Iranian Traditional Celebrations 0.11
614-AH E-commerce Congress 0.06
625-AH Places to Visit in Golestan 0.05
647-AH Buying Military Service Exemption 0.02
632-AH Olive Oil Benefits -0.05
641-AH Pollution in the Persian Gulf -0.05
605-AH Hatamikia's Films -0.11
640-AH Persian Rugs -0.15
638-AH Barriers for Investments in Iran -0.16
610-AH Benefits of Copyright Laws -0.18
620-AH Freight Transport by Rail -0.22
602-AH Heart Disease and Smoking -0.23
606-AH Youth Leisure in Summer -0.25
626-AH Women in Politics -0.25
636-AH Air Pollution -0.25
646-AH Applying to Study out of Iran -0.28
648-AH Attack on the Twin Towers -0.29
637-AH Tehran Air Pollution Sources -0.31
621-AH Television and Mental Health -0.48
645-AH 11 September and Air Travel -0.56
649-AH Khatami Government Oil Crisis -0.59
624-AH Films for the Fajr Festival -0.62
633-AH Daei's World Cup Goals -0.62
603-AH Gas Rationing in Iran -0.74
627-AH Nuclear Energy -0.92
604-AH Lung Cancer -1.55
601-AH US Attack on Iran -1.60
Table 8: Summarizability of 50 topics
Note that about half of the topics have positive summarizability values, and the other
half have negative. This is intuitive, because as we mentioned before, summarizability is

92 Parvandeh, Lahiri, Boroumand
coming from averaging several z-scores, and taken together, z-scores cancel each other out.
Hence, we may expect to see (almost) equal number of positive and negative
summarizability values.
Also of interest is the fact that the topics, when organized in this order, clearly show a
trend: more concrete (and focused) topics tend to be highly summarizable, whereas more
abstract (and diverse) topics – also, topics fraught with differing opinions, political
controversy, etc – tend to be highly un-summarizable. Furthermore, local and national
topics tend to be more summarizable than technical and international topics. A curious
upshot of the above analysis is that most topics are from local and national news, and very
few come from international. Even fewer relate to the United States, and contemporary
friction arising from September 11 attacks. This shows a social distinctiveness of news
topics. There is an inner core of densely connected and most popular regional topics, then
there is an intermediate layer of loosely connected and somewhat less popular national
topics, and finally there is the outermost layer (periphery) of sparsely connected and least
popular international topics.
Figure 3: Document count of Hamshahri topics against summarizability
4.7. Question 7: Is There a Relationship Between Summarizability and Number of
Documents?
We can reason that the less number of documents a topic has, the more focused (and
marginal) it should be, and hence easier to summarize. In other words, there should be an

Persum: Novel Systems for Document Summarization in Persian 93
inverse correlation between number of documents and summarizability. However, the
following plot (Figure 3) – where X-axis is Hamshahri topics (sorted in descending order of
summarizability), and Y-axis is the number of documents for each topic – shows that this is
clearly not the case.
As seen from Figure 3, there is almost no correlation between the two variables. The
Pearson correlation between summarizability and document count was found to be 0.09,
which was not only too low, but also statistically indistinguishable from zero at 95%
confidence level.
What this shows is that the issue of summarizability is complex, and needs to be
investigated further. Perhaps there are other variables at play, e.g., document length, that
have a greater bearing on how summarizability works, and hence can better explain the
underlying process. Besides, it will be interesting to explore classification of Persian
documents according to summarizability, because then we can predict – even before the
actual summarization begins – whether the resulting summary will be any good. We leave
this line of research to future work.
5. Centrality-Based Summarization
We already observed that centrality-based systems outperformed Parsumist-based systems
in a post hoc analysis of multi-document summarization on the Hamshahri corpus. The next
question we asked, is: if we were given an annotated corpus of summarized Persian
documents, which centrality measures would perform the best in single and multi-document
summarization? To answer this question, we resorted to the recently released Pasokh corpus
of annotated Persian summaries (Behmadi Moghaddas et al., 2013). Note that we could
have done this analysis post hoc, but that would have required our human annotators to go
through hundreds of system-generated summaries manually – a clearly untenable approach.
Instead, we used the popular ROUGE package (Lin, 2004) – in particular, its recent Java
implementation called JROUGE (Ganesan et al., 2010) – to evaluate our centrality-based
systems.
The rest of this section is organized as follows. In Section 5.1, we give an overview of
centrality-based approaches, and discuss – using a cognitive science argument – why it
makes sense to use them and why they perform so well in practice. Section 5.2 describes
the systems we designed, and Section 5.3 details the evaluation strategy, including a
description of Pasokh and ROUGE.
5.1. Centrality-Based Methods
It is well-known in distributional semantics that a word is known by the company it keeps

94 Parvandeh, Lahiri, Boroumand
(Firth, 1957). Words can have both local (and long-range) syntactic dependencies, and
mostly global semantic dependencies. Hence, a word network (also variously known as a
collocation network or a collocation graph; cf. (Lahiri, 2014)), where nodes are words and
edges are word co-occurrence relationships, can succinctly and explicitly capture such
dependencies. It has been observed (Mihalcea and Tarau, 2004) that in such networks,
words with the highest centrality also happen to be the most important words (keywords) in
the document. It has been similarly observed that if we construct the network on sentences,
where nodes are sentences and edges are weighted (perhaps pruned, too) by sentence
similarity, then the most important sentences in the document turn out to have highest
centrality in the resulting network (Mihalcea and Tarau, 2004; Erkan and Radev, 2004).
These two observations started the field of graph-based summarization and keyword
extraction (Mihalcea and Radev, 2011). Apart from the curious and interesting
underpinnings as mentioned above, graph-based methods have the additional advantage
that they are unsupervised, do not require any Natural Language Processing tools such as
part-of-speech tagger, parser, or semantic role labeler, and still deliver acceptable (and in
many cases, state-of-the-art) performance. The beauty and elegance of these approaches led
to a flurry of research activities (cf. (Boudin, 2013; Lahiri et al., 2014)), and graph-based
approaches are still being pursued by several research groups around the world.
It is interesting to note that the “word neighborhood” analogy holds for sentences too. It
may initially come as a surprise how (or why) graph-based methods perform so well in
practice, esp. when they take almost no help from existing Natural Language Processing
tools. This is an important question, and the jury is still out. However, as Mihalcea and
Tarau (2004) pointed out using a cognitive science argument, any network – be it words or
sentences or people (social networks) – encodes a system of endorsements and
recommendations, where each edge denotes a form of endorsement. In essence, therefore,
these networks are representing a reputation model where less important (thus, less reputed)
words connect to more important (hence, more reputed) words, and less reputed sentences
connect to more reputed sentences. If this model is taken as the prima facie proof of the
success of graph-based approaches, then we can clearly see (and evidence suggests) that
words and sentences with the most connections (i.e., highest centrality) are – in fact – the
most important (reputed) words and sentences. Intriguingly enough, for summarization
purposes, most important sentences are exactly what we need. Hence comes the general
three-step approach to graph-based (or centrality-based) summarization:
1. Construct a network of sentences.
2. Rank the sentences by their centrality in the network.

Persum: Novel Systems for Document Summarization in Persian 95
3. Take top k of those sentences, and present them in temporal order.
Note that the above framework is very general, and can accommodate several types of
networks and centrality measures. We under-specified the framework on purpose, so that
we can play with different parameters. In practice, the concept of centrality has been
studied in the social sciences for several decades (Borgatti, 2005). As Boldi and Vigna
(2014) point out, there exist at least six different categories (families) of centrality indices
that measure different aspects of a node in a network, as follows:
1. The node with largest degree
2. The node that is closest to other nodes
3. The node through which most shortest paths pass
4. The node with the largest number of incoming paths of length k, for every k
5. The node that maximizes the dominant eigenvector of the graph matrix
6. The node with the highest probability in the stationary distribution of the natural
random walk on the graph
However, as Borgatti and Everett (2006) observed, most (if not all) of these indices assess a
node’s involvement in the walk structure of a network, and summarize a node’s
contribution to the cohesiveness of the network. Note that if language is represented as a
network (of words or sentences), then the most important words/sentences should be the
ones that contribute most highly to the cohesiveness of the document. So even from
Borgatti and Everett’s perspective, centrality-based approaches to summarization do make
sense, and can be predicted to work well in practice.
5.2. Centrality-Based Systems
Following the general framework for graph-based summarization that we described in the
previous section, it can be observed that there are essentially two free parameters: network
type, and centrality measure. Network type can have important implications in a
summarization system. Parsumist, for example, constructed a complete graph of sentences
– then pruned the nodes that were deemed too similar to their neighbors. LexRank, on the
other hand, went ahead with a complete graph representation and no pruning whatsoever.
We, too, followed the same approach in Sections 3 and 4. Sentence similarity can also be an
important aspect of network construction, because they allow us to weight the edges
differently. While LexRank employs simple cosine similarity, TextRank used a modified
form of Dice Similarity.
96 Parvandeh, Lahiri, Boroumand
In this part of the study, we constructed sentence networks for both single and
multi-document summarization. Sentences were extracted from the Pasokh corpus using the
normalizer and tokenizer developed by Mojgan Seraji (Halácsy et al., 2007; Seraji, 2013;
Seraji, 2015), in the same spirit as Section 3.1. Our networks are undirected and weighted
complete graphs, where edge weights are given by cosine similarity between two sentences.
Note that the network structure and choice of similarity measure will have an impact on the
final result, but since our goal in this part of the study was to compare centrality measures,
and not to tweak the network structure, we went ahead with the standard LexRank
construction.
We experimented with three different vector representations of sentences – tf, tfidf, and
binary (presence/absence of words). Vector elements are all unique words in the Pasokh
corpus, and idf was computed on the Hamshahri corpus. Furthermore, we constructed
sentence vectors in two ways – removing all stop words, and keeping them.15 This gives
rise to six types of sentence networks.
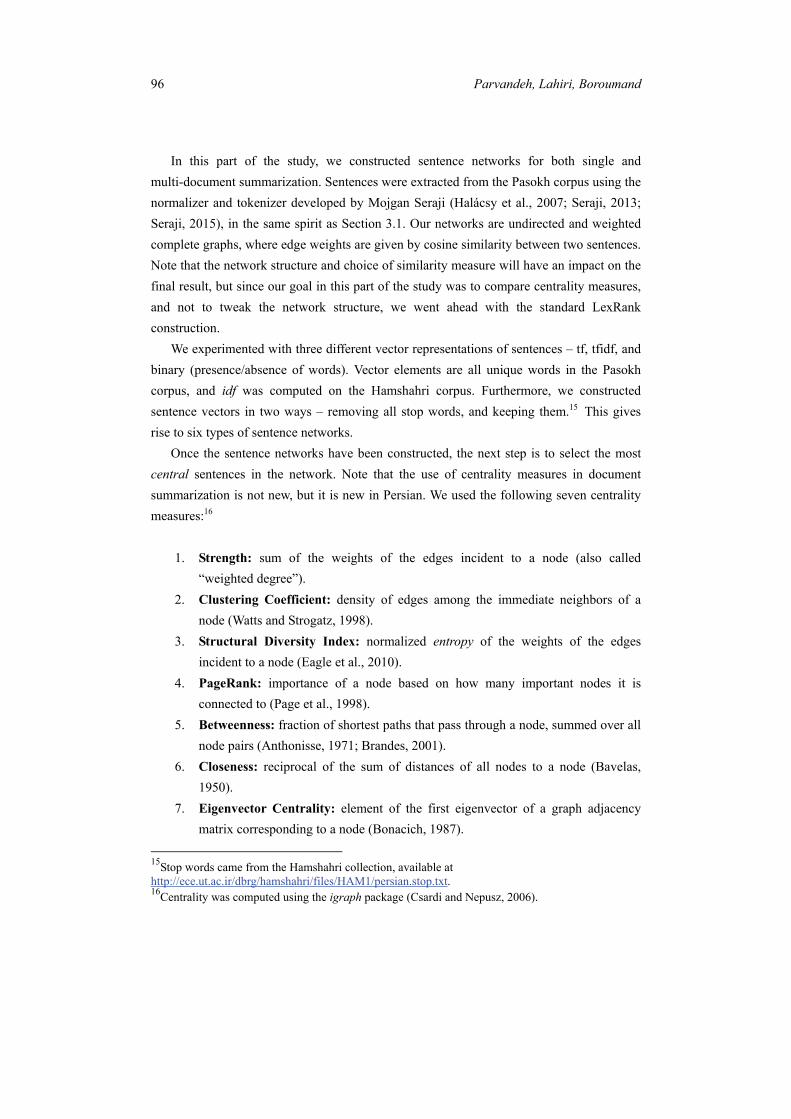
Once the sentence networks have been constructed, the next step is to select the most
central sentences in the network. Note that the use of centrality measures in document
summarization is not new, but it is new in Persian. We used the following seven centrality
measures:16
1. Strength: sum of the weights of the edges incident to a node (also called
“weighted degree”).
2. Clustering Coefficient: density of edges among the immediate neighbors of a
node (Watts and Strogatz, 1998).
3. Structural Diversity Index: normalized entropy of the weights of the edges
incident to a node (Eagle et al., 2010).
4. PageRank: importance of a node based on how many important nodes it is
connected to (Page et al., 1998).
5. Betweenness: fraction of shortest paths that pass through a node, summed over all
node pairs (Anthonisse, 1971; Brandes, 2001).
6. Closeness: reciprocal of the sum of distances of all nodes to a node (Bavelas,
1950).
7. Eigenvector Centrality: element of the first eigenvector of a graph adjacency
matrix corresponding to a node (Bonacich, 1987).
15Stop words came from the Hamshahri collection, available at http://ece.ut.ac.ir/dbrg/hamshahri/files/HAM1/persian.stop.txt. 16Centrality was computed using the igraph package (Csardi and Nepusz, 2006).

Persum: Novel Systems for Document Summarization in Persian 97
The above seven centrality measures touch all six different centrality families identified
by Boldi and Vigna (2014), hence they may be deemed comprehensive for the purposes of
our study. Note further that all the above measures except Structural Diversity Index above
are true centrality indices, hence sentences need to be sorted in their descending order. For
the Structural Diversity Index, however, we want sentences to have minimum possible
values, so they need to be sorted in the ascending order. Lastly, we used strength instead of
degree, because our networks are complete graphs, hence all nodes have the same degree.
The seven centrality measures we used gave us 42 graph-based systems in the end (six
types of graphs, seven centrality measures on each of them). In the evaluation, we will see
that most systems behave rather similarly, and differences emerge from centrality measures
rather than narrow, document-specific optimizations. In particular, strength, PageRank,
eigenvector centrality and Structural Diversity Index perform the best in terms of ROUGE
score.
5.3. Evaluation of Centrality-Based Systems
As mentioned in Section 3.6, evaluation is the Achilles’ heel for most summarization
systems, which is exacerbated by the fact that oftentimes, no human-annotated gold
standard dataset is available on which competing systems can be evaluated. We were rather
fortunate in this regard, because recently such a gold standard corpus – Pasokh – has been
released by a team of researchers that specifically looks into Persian single and
multi-document summarization (Behmadi Moghaddas et al., 2013).
Pasokh is a corpus of Persian news articles annotated with human-generated summaries
– both extractive and abstractive – for single-document as well as multi-document
summarization. It took over 2000 man-hours of work to construct Pasokh. The meaning of
the word “Pasokh” is “answer”; it is a contraction of the original Persian: Peykare-ye
(A)estândârd-e Sâmânehâ-ye (O is added for ease of pronunciation) KHolâse-sâz. The
news content of Pasokh comes from seven popular Persian news agencies (including
Hamshahri), and six genres of documents (Economic, Cultural, Social, Political, Sports,
and Scientific). Pasokh has 100 documents in the single-document summarization section.
Each document has five extractive and five abstractive summaries that come from five
different human annotators. In total, this gives us 500 extractive and 500 abstractive
summaries to work with.
The multi-document section of Pasokh comprises 50 news topics, 20 documents per
topic. The same seven news agencies were used. Five extractive and five abstractive
summaries were created for each topic – by five different human annotators – at a 30%

98 Parvandeh, Lahiri, Boroumand
compression ratio. So in this section, we obtain 250 extractive and 250 abstractive
summaries.
Ten male and ten female undergraduate students constructed the corpus. They were
trained to represent the central content of each document/topic in the summary, while at the
same time avoiding repetition and redundancy; according with the key points of the original
text; maintaining coherence and readability, particularly in the abstractive summaries;
maintaining cohesion; and not exceeding the set compression ratio (30%). The large size
and complexity of the corpus forced its creators to design a separate software interface
called Kholâse-yâr (roughly translates as “summarization aid”) to help the human
annotators. The annotators had to supply reasons for why they chose a particular piece of
text to be included in the summary. Thus, Pasokh turned out to be a very exhaustive,
complete, and holistic corpus, and a great exercise in human annotation in Persian language.
For single documents, Pasokh summaries are mostly three to seven sentences long.
We used the extractive portion of Pasokh, and left the abstractive part for future work.
Note that the extractive summaries in Pasokh do not always obey strict extraction rules. For
example, many of them extract phrases and clauses rather than full sentences, and then
“glue” together components in an abstractive fashion. Hence, the extractive summaries are
not purely extractive – they oftentimes contain abstractive components. This observation
makes standard evaluation using precision, recall, and F-score (at sentence level) difficult
on the Pasokh extractive set. We used the ROUGE score (Lin, 2004) instead.
The word “ROUGE” stands for Recall-Oriented Understudy for Gisting Evaluation.
ROUGE essentially measures overlap between system-generated summaries (also called
“peer summaries”) with human-generated summaries (also called “model summaries”).
Note that recall is more important in the summarization setting than precision, because we
would like to have as many important units of information as possible in the final summary,
rather than only the top few most salient ones. There are four different ROUGE measures:
ROUGE-N, ROUGE-L, ROUGE-W, and ROUGE-S. ROUGE-N is based on n-gram
co-occurrence statistics, ROUGE-L is based on longest common subsequences (LCS) at the
summary level, ROUGE-W represents weighted longest common subsequences, and
ROUGE-S involves skip-bigram co-occurrence statistics.
As one can notice, the ROUGE scores become progressively more complex from
ROUGE-N to ROUGE-S. In practice, most researchers use ROUGE-N, because it is simple
to understand, and gives good results. We, too, used ROUGE-N. The formula for
ROUGE-N is as follows:

Persum: Novel Systems for Document Summarization in Persian 99
}{
}{
)(
)(
riesModelSummaS Sgramn
riesModelSummaS Sgramnmatch
N
n
n
gramCount
gramCount
ROUGE (6)
where n is the length of the n-gram, S is a particular human-generated summary, gramn is a
particular n-gram, and Countmatch(gramn) is the maximum number of n-grams co-occurring
in a system-generated summary and a set of human-generated summaries.
Note that ROUGE talks about a set of human-generated summaries – not a single
human-generated summary. This is typical in summarization research. Owing to the high
variability between human annotators, we would like to generate as many model summaries
as we can, and then evaluate the peer summaries against all of them. This is a time-tested
way to combat variability in Natural Language Processing tasks such as keyword extraction
and summarization. Note further that the standard ROUGE-N formula above can be
adapted to make way for a precision-oriented measure, which in turn gives rise to an
F-score-style measure. In our evaluation, we used all three (precision, recall, and F-score).
F-score combines precision and recall in a theoretically sound way, but as we will see in
Section 6, precision and recall showed their own interesting trends.
Interestingly, it would not have been possible to use ROUGE in Sections 3 and 4 (i.e.,
on the Hamshahri corpus), because there we did not have human-annotated gold-standard
summaries (model summaries). A particular problem with ROUGE is that its vanilla
implementation in Perl does not handle Unicode characters. Hence, we resorted to the
recently released JROUGE package written in Java (Ganesan et al., 2010). We used three
baselines to compare our centrality-based systems against:
1. Random k sentences extracted from the document.
2. First k sentences extracted from the document.
3. Last k sentences extracted from the document.
While random baseline is a common staple in almost all Natural Language Processing
evaluation tasks, the first and last k sentences baselines are special in summarization. They
derive their importance from the fact that in a document (esp. news articles like Pasokh and
Hamshahri), first k sentences often contain the most important and/or the most central
pieces of information. Hence, a summary consisting of first k sentences often constitutes a
very strong and very effective baseline in practice. On the other hand, the last k sentences in
a document often include concluding remarks and thoughts on future directions or courses

100 Parvandeh, Lahiri, Boroumand
of events. Hence, those sentences could turn out to be important in terms of summarization.
We therefore opted for all three baselines in this study. We used the 42 centrality-based
systems, and the above three baseline systems at compression ratios of 25%, 50%, 75%,
and 100%, respectively.
6. Results on the Pasokh Corpus
As mentioned in Section 5.3, we used ROUGE-N for evaluation. We experimented with
three values of N: 1, 2, and 3. These correspond to ROUGE on unigrams, ROUGE on
bigrams, and ROUGE on trigrams, respectively. They are standard metrics in
summarization literature. What we observed is that qualitatively, ROUGE-1, ROUGE-2 and
ROUGE-3 are similar to each other. Hence, we report ROUGE-3 only. Quantitatively,
ROUGE-1 is higher than ROUGE-2, which in turn is higher than ROUGE-3. This is
expected, because between any two pieces of text, the number of common unigrams should
be at least as many as the number of common bigrams, and the number of common bigrams
should be at least as many as the number of common trigrams. This makes ROUGE-3 the
most pessimistic (conservative) of all three ROUGE-N scores we tried.
Furthermore, note that we used three vectorial representations: binary, tf, and tfidf. We
observed that they had very little difference among themselves – qualitatively and
quantitatively. Hence, we only report tfidf. In the following, we encode our centrality-based
systems and baseline systems using a three-character code, as follows:
Bet: Betweenness centrality
Clo: Closeness centrality
Clu: Clustering Coefficient
Div: Structural Diversity Index
Eig: Eigenvector Centrality
Pag: PageRank
Str: Strength
Fir: First k sentences baseline
Las: Last k sentences baseline
Ran: Random k sentences baseline
Lastly, in the following stacked bar diagrams, the lowest level corresponds to 25%
compression ratio, second lowest level 50% compression ratio, third lowest (i.e., second
highest) level 75% compression ratio, and the highest level 100% compression ratio. They
are denoted by four different colors for ease of visualization.

Persum: Novel Systems for Document Summarization in Persian 101
Figure 4: ROUGE-3 F-score on single-document summarization; without stop words on left,
with stop words on right.
Figure 5: ROUGE-3 F-score on multi-document summarization; without stop words on left,
with stop words on right.
As seen from Figures 4 and 5, with stop words and without stop words systems perform
quite similarly in terms of F-score across all compression ratios. Overall, best F-scores are
realized by strength, PageRank, eigenvector centrality, and Structural Diversity Index. It is
intriguing to see that PageRank is not the only best-performing measure. Presence of
Structural Diversity Index among the best performers is another intriguing finding, and
should be researched in more depth. Interestingly, all three baselines perform quite well,
esp. compared to betweenness, closeness, and clustering coefficient. Compression-ratio
-wise, 50% and up seems good enough for single-document summarization. However, we
should keep in mind that for long documents, 50% may be too high. For multi-document
summarization, best results come at 25% compression ratio. This is intuitive, because for
multiple documents, 25% is already large enough to contain most (if not all) units of

102 Parvandeh, Lahiri, Boroumand
importance.
Figure 6: ROUGE-3 recall on single-document summarization; without stop words on left,
with stop words on right.
Figure 7: ROUGE-3 recall on multi-document summarization; without stop words on left,
with stop words on right.
We report ROUGE-3 recall in Figures 6 and 7. Note from the discussion in Section 5.3
that recall is in fact the most important performance measure in summarization. As seen
from Figures 6 and 7, recall increases with increasing compression ratio, and the best
values are obtained at the maximum compression ratio of 100% (i.e., no compression). This
makes intuitive sense, because as more and more units of information are included in the
summary, it becomes more and more probable to find a particular relevant piece of
information in them. Hence, recall goes up.

Persum: Novel Systems for Document Summarization in Persian 103
Figure 8: ROUGE-3 precision on single-document summarization; without stop words on
left, with stop words on right.
Figure 9: ROUGE-3 precision on multi-document summarization; without stop words on
left, with stop words on right.
The opposite happens with ROUGE-3 precision (Figures 8 and 9). As compression ratio
goes up, precision goes down, because we are including many more irrelevant pieces of
information in the summary than relevant ones. This dichotomy of precision and recall is a
standard phenomenon in Information Retrieval (IR), but it was interesting to observe the
same dichotomy hold true in the domain of summarization and ROUGE – especially in
Persian.
7. Conclusion and Future Work
We have described three classes of novel unsupervised systems for single and
multi-document summarization in Persian – one based on Parsumist, a popular Persian
summarizer, and two based on sentence networks and centrality measures. Experimental
results indicate that graph-based methods perform better than Parsumist-based methods,

104 Parvandeh, Lahiri, Boroumand
and there are some centrality measures (strength, PageRank, eigenvector centrality, and
Structural Diversity Index) that perform better than others. Detailed human evaluation (post
hoc), as well as evaluation using ROUGE score have been reported.
There are several limitations of our study, all of which can be improved upon in future
work:
Our study does not consider the problem of supervised summarization, where a
machine learning system is trained to identify sentences and/or other linguistic
units for inclusion in the summary. Existing literature suggests that supervised
systems perform better than unsupervised ones.
We have not been able to compare our systems with state-of-the-art Persian
summarizers, because their implementation is not publicly available. It will be an
interesting and revealing exercise to follow up on this lead.
Parameter tuning and optimization: we performed minimal parameter tuning.
There are many opportunities to do so, esp. in Parsumist, and/or graph-based
systems. Future work should look into parameter tuning with more rigor and
depth.
We did not attempt abstractive summarization in this work, because it involves
non-trivial amount of syntactic judgment calls. Since we did not have a Persian
linguist in our team, such judgment calls were deemed arbitrary and hard to justify.
Future work should look into this very interesting and exciting line of research.
We did not use syntactic and semantic features. Dependency treebanks have been
developed and are currently available for Persian (Rasooli et al., 2013; Seraji,
2015). It will be a very promising and interesting research direction to integrate
such resources with extractive and/or abstractive summarization in Persian.
Overall, we believe that we have presented a convincing study in Persian document
summarization with existing resources, and hope that our work will spark interest in the
still nascent but growing area of research in document summarization in Persian.
8. References
AleAhmad, A., Amiri, H., Darrudi, E., Rahgozar, M., and Oroumchian, F., 2009,
Hamshahri: A standard Persian text collection. Knowledge-Based Systems,
22(5):382–387, July.
Anthonisse, J. M., 1971, The rush in a directed graph. Technical report, Stichting
Mathematisch Centrum, Amsterdam, October.

Persum: Novel Systems for Document Summarization in Persian 105
Bavelas, A., 1950, Communication Patterns in Task-Oriented Groups. The Journal of the
Acoustical Society of America, 22(6):725–730.
Bazghandi, M., Tabrizi, G. T., and Jahan, M. V., 2012, Extractive Summarization Of Farsi
Documents Based On PSO Clustering. International Journal of Computer Science Issues
(IJCSI), 9(3):329–332.
Behmadi Moghaddas, B., Kahani, M., Toosi, S. A., Pourmasoumi, A., and Estiri, A., 2013,
Pasokh: A Standard Corpus for the Evaluation of Persian Text Summarizers, In
Proceedings of the 3rd International eConference on Computer and Knowledge
Engineering (ICCKE), pages 471–475, October.
Berenjkoob, M., Mehri, R., Khosravi, H., and Nematbakhsh, M. A., 2009, A Method for
Stemming and Eliminating Common Words for Persian Text Summarization, In
Proceedings of the International Conference on Natural Language Processing and
Knowledge Engineering (NLP-KE), pages 1–6, September.
Boldi, P. and Vigna, S., 2014. Axioms for Centrality. Internet Mathematics, 10(3-4), pages
222–262.
Bonacich, P., 1987, Power and Centrality: A Family of Measures. American Journal of
Sociology, 92(5):1170–1182.
Borgatti, S. P., 2005, Centrality and network flow. Social Networks, 27(1):55–71.
Borgatti, S. P., and Everett, M. G., 2006, A Graph-theoretic perspective on centrality.
Social Networks, 28(4):466–484.
Boudin, F., 2013, A Comparison of Centrality Measures for Graph-Based Keyphrase
Extraction, In Proceedings of the Sixth International Joint Conference on Natural
Language Processing, pages 834–838, Nagoya, Japan, October. Asian Federation of
Natural Language Processing.
Brandes, U., 2001. A Faster Algorithm for Betweenness Centrality. The Journal of
Mathematical Sociology, 25(2):163–177.
Bruni, E., Tran, N. K., and Baroni, M., 2014, Multimodal Distributional Semantics. Journal
of Artificial Intelligence Research, 49(1):1–47, January.
Chung, C. K., and Pennebaker, J. W., 2008, Revealing Dimensions of Thinking in
Open-Ended Self-Descriptions: An Automated Meaning Extraction Method for Natural
Language. Journal of Research in Personality, 42(1):96–132, February.
Csardi, G., and Nepusz, T., 2006, The igraph software package for complex network
research. Inter-Journal, Complex Systems:1695.
Dalianis, H., 2000, SweSum – a text summarizer for Swedish. Technical Report
TRITA-NA-P0015, Department of Numerical Analysis and Computing Science, Royal
Institute of Technology (KTH), Stockholm, Sweden, August.

106 Parvandeh, Lahiri, Boroumand
Eagle, N., Macy, M., and Claxton, R., 2010, Network Diversity and Economic
Development. Science, 328(5981):1029–1031, May.
Erkan, G., and Radev, D. R., 2004, LexRank: Graph-based Lexical Centrality as Salience in
Text Summarization. Journal of Artificial Intelligence Research, 22(1):457–479,
December.
Firth, J. R., 1957, Papers in linguistics, 1934-1951. Oxford University Press.
Ganesan, K., Zhai, C., and Han, J., 2010, Opinosis: A Graph-Based Approach to
Abstractive Summarization of Highly Redundant Opinions, In Proceedings of the 23rd
International Conference on Computational Linguistics (COLING 2010), pages 340–348,
Beijing, China, August.
Halácsy, P., Kornai, A., and Oravecz, C., 2007, HunPos – an open source trigram tagger, In
Proceedings of the 45th Annual Meeting of the ACL on Interactive Poster and
Demonstration Sessions, pages 209–212, Stroudsburg, PA, USA. Association for
Computational Linguistics.
Hassel, M., and Mazdak, N., 2004, FarsiSum – A Persian text summarizer, In Proceedings
of the Workshop on Computational Approaches to Arabic Script-based Languages
(Semitic 2004), pages 82–84, Stroudsburg, PA, USA. Association for Computational
Linguistics.
Kamyar, H., Kahani, M., Kamyar, M., and Poormasoomi, A., 2011, An Automatic
Linguistics Approach for Persian Document Summarization, In Proceedings of the
International Conference on Asian Language Processing (IALP), pages 141–144,
November.
Kiyoumarsi, F., and Esfahani, F. R., 2011, Optimizing Persian Text Summarization Based
on Fuzzy Logic Approach, In Proceedings of the International Conference on Intelligent
Building and Management, volume 5.
Lahiri, S., 2014, Complexity of Word Collocation Networks: A Preliminary Structural
Analysis, In Proceedings of the Student Research Workshop at the 14th Conference of
the European Chapter of the Association for Computational Linguistics, pages 96–105,
April.
Lahiri, S., Ray Choudhury, S., and Caragea, C., 2014, Keyword and Keyphrase Extraction
Using Centrality Measures on Collocation Networks, ArXiv e-print, January.
Landauer, T. K., and Dumais, S. T., 2008, Latent semantic analysis. Scholarpedia,
3(11):4356.
Likert, R., 1932, A Technique for the Measurement of Attitudes. Archives of Psychology,
22(140):1–55.
Lin, C.-Y., 2004, ROUGE: A Package for Automatic Evaluation of Summaries, In Text

Persum: Novel Systems for Document Summarization in Persian 107
Summarization Branches Out: Proceedings of the ACL-04 Workshop, pages 74–81,
Barcelona, Spain, July. Association for Computational Linguistics.
Mihalcea, R., and Radev, D., 2011, Graph-based Natural Language Processing and
Information Retrieval. Cambridge University Press.
Mihalcea, R., and Tarau, P., 2004, TextRank: Bringing Order into Texts, In Proceedings of
the Conference on Empirical Methods in Natural Language Processing (EMNLP), July.
Miller, G. A., 1995, WordNet: A Lexical Database for English. Communications of the
ACM, 38(11):39–41, November.
Nenkova, A., Passonneau, R., and McKeown, K., 2007, The Pyramid Method:
Incorporating Human Content Selection Variation in Summarization Evaluation. ACM
Transactions on Speech and Language Processing, 4(2), May.
Nia, M. J., 2013, Using the Pyramid Method for generating gold standards for Persian texts.
Page, L., Brin, S., Motwani, R., and Winograd, T., 1998, The PageRank Citation Ranking:
Bringing Order to the Web, In Proceedings of the 7th International World Wide Web
Conference, pages 161–172, Brisbane, Australia.
Poormasoomi, A., Kahani, M., Yazdi, S. V., and Kamyar, H., 2011, Context-Based Persian
Multi-Document Summarization (global view), In Proceedings of the International
Conference on Asian Language Processing (IALP), pages 145–149, November.
Rasooli, M. S., Kouhestani, M., and Moloodi, A., 2013, Development of a Persian
Syntactic Dependency Treebank, In Proceedings of the 2013 Conference of the North
American Chapter of the Association for Computational Linguistics: Human Language
Technologies, pages 306–314, Atlanta, Georgia, June. Association for Computational
Linguistics.
Seraji M., 2013, PrePer: A Pre-processor for Persian, In Proceedings of the Fifth
International Conference on Iranian Linguistics (ICIL5), Bamberg, Germany.
Seraji, M., 2015, Morphosyntactic Corpora and Tools for Persian, Ph.D. Thesis, Uppsala
University.
Shakeri, H., Gholamrezazadeh, S., Amini Salehi, M., and Ghadamyari, F., 2012, A New
Graph-based Algorithm for Persian Text Summarization. Computer Science and
Convergence, vol. 114 of Lecture Notes in Electrical Engineering, pages 21–30.
Springer.
Shamsfard, M., Akhavan, T., Erfani Joorabchi, M., 2009a, Persian Document
Summarization by Parsumist. World Applied Sciences Journal, 7:199–205.
Shamsfard, M., Akhavan, T., Erfani Jourabchi, M., 2009b, Parsumist: A Persian Text
Summarizer, In Proceedings of the International Conference on Natural Language
Processing and Knowledge Engineering (NLP-KE), pages 1–7, September.
108 Parvandeh, Lahiri, Boroumand
Tofighy, M., Kashefi, O., Zamanifar, A., and Seyyed Javadi, H. H., 2011, Persian Text
Summarization Using Fractal Theory. Informatics Engineering and Information Science,
vol. 252 of Communications in Computer and Information Science, pages 651–662.
Springer.
Tofighy, S. M., Raj, R. G., and Seyyed Javadi, H. H., 2013, AHP Techniques for Persian
Text Summarization. Malaysian Journal of Computer Science, 26(1):1–8.
Watts, D. J., and Strogatz, S. H., 1998, Collective dynamics of ‘small-world’ networks.
Nature, 393(6684):409–410.
Zamanifar, A., and Kashefi, O., 2011, AZOM: A Persian Structured Text Summarizer.
Natural Language Processing and Information Systems, vol. 6716 of Lecture Notes in
Computer Science, pages 234–237. Springer.
Zamanifar, A., Minaei-Bidgoli, B., and Sharifi, M., 2008, A New Hybrid Farsi Text
Summarization Technique Based on Term Co-Occurrence and Conceptual Property of
the Text. In Proceedings of the Ninth ACIS International Conference on Software
Engineering, Artificial Intelligence, Networking, and Parallel/Distributed Computing
(SNPD 2008), pages 635–639, August.