pertanika j. sci. & technol. 26 (1): 367 - 378 (2018 ... papers/jst vol. 26 (1...mohamad, n. s.,...
TRANSCRIPT

Pertanika J. Sci. & Technol. 26 (1): 367 - 378 (2018)
SCIENCE & TECHNOLOGYJournal homepage: http://www.pertanika.upm.edu.my/
ISSN: 0128-7680 © 2018 Universiti Putra Malaysia Press.
ARTICLE INFO
Article history:Received: 03 March 2017Accepted: 28 September 2017
E-mail addresses: [email protected] (Mohamad, N. S.),[email protected] (Deni, S. M.),[email protected] (Ul-Saufie, A. Z.) *Corresponding Author
Application of the First Order of Markov Chain Model in Describing the PM10 Occurrences in Shah Alam and Jerantut, Malaysia
Mohamad, N. S.1*, Deni, S. M.1 and Ul-Saufie, A. Z.2
1Faculty of Computer and Mathematical Sciences, Universiti Teknologi MARA, 40450 UiTM, Shah Alam, Malaysia2Department of Computer and Mathematical Sciences, Universiti Teknologi MARA, 13500 UiTM, Permatang Pauh, Pulau Pinang, Malaysia
ABSTRACT
PM10 has been identified as being a common problem in Malaysia and many other countries all over the world. A Markov chain probability model is found to fit the average daily PM10 concentrations data of urban station (Shah Alam) and background area station (Jerantut) in Malaysia. This study aims to identify the occurrence of polluted and non-polluted days affected by PM10 concentrations based on data for 12 years’ period (2002-2013). The first order transition probability matrix of a Markov chain model and a two-state Markov chain, which are polluted days (1) and non-polluted days (0), were used for this purpose. The threshold value used in this study is referring to WHO 2006 guidelines (50µgm-3). Results of the analysis shows that there is a high probability that the next day event depends on what has happened on the previous day. The recurrence of the polluted day for Shah Alam is 4-5 days, while 2-3 days for Jerantut. By fitting the first order of Markov chain model, the results show that the higher order of Markov chain model is needed in order to get the best fitted distribution of polluted events at these two monitoring stations. Thus, the prediction of PM10 concentrations event can be made by considering the conditions of the previous day event.
Keywords: Markov chain model, PM10 concentrations, polluted days, non-polluted days, occurrence
INTRODUCTION
Particles or particulate matter is a type of air pollution. PM10, which is a particulate matter with aerodynamic diameter less than 10 micrometre, has been identified as being a common problem in Malaysia and some other countries. Furthermore, PM10 is also mainly considered in Malaysia as this pollutant gives

Mohamad, N. S., Deni, S. M. and Ul-Saufie, A. Z.
368 Pertanika J. Sci. & Technol. 26 (1): 367 - 378 (2018)
greatest concern to public health, apart from being the main air pollutant that has exist since the haze event in 1980 (Awang et al., 2000). Cardiovascular diseases, respiratory problems and cancer are some examples of health problems caused by this air pollutant (EPA, 2001). PM10 is emitted by both anthropogenic and natural sources. There are five major PM10 emissions in Malaysia, which are motor vehicle exhausts, industrial sources, open burning, heat and power plants (DoS, 2013). However, the main causes of this pollutant in Malaysia are industrial activities and heavy traffic (Ul-Saufie et al., 2012). Many efforts have been done in order to monitor the effects of this pollutant; these include the regression model that is used to predict PM10 concentrations (Paschalidou et al., 2011; Chaloulakou et al., 2003; Pires et al., 2008). However, the study of the sequence of polluted and non-polluted days using Markov chain model still receives less attention.
Markov chain model was introduced at the beginning of the 20th century and it has been used in many disciplines including geography, meteorology, biology, physics, behaviour, social sciences, chemistry and others (Berchtold & Raftery, 2002). Many researchers have used this method to model the daily occurrences of rainfall and have successfully used it especially for the first order (Gabriel & Neumann, 1962; Mangaraj et al., 2013; Basu, 1971). The first order Markov chain is simple and it does not require a lot of computational efforts. The study of Berchtold and Raftery (2002) successfully used Markov chain model in describing the occurrence of daily rainfall in Tel Aviv for the mid-winter season. Besides that, other researchers such as Haan et al., (1976), Jimoh and Webster, (1996), Rahimi et al. (2011) and Chin (1977) also used Markov chain model in their fields of study. The order of the chain gives the number of time steps in the past influencing the probability distribution of the present state, which could be greater than one. Several authors have found that the order more than one gave the optimum result for certain conditions. For example, Deni et al. (2009) found that the first order of Markov chain model is the optimum order for the rainfall occurrence during the northwestern and eastern regions of peninsula, while a higher order is fit for the rainfall occurrence during the northeast monsoon season. However, this study only considers the first order of Markov chain model because of its simplicity.
The main purpose of this study is to determine the occurrence of polluted and non-polluted days affected by PM10 concentrations at an urban area (Shah Alam) and a background area (Jerantut) in Malaysia. This kind of study still receives less attention from other researchers. This study was conducted as follows. After a brief description of the PM10 concentrations at both stations in the data and methodology section, the explanation on how to determine the polluted day and non-polluted day and the transition probability are also discussed. Testing for the Markov chain property is also discussed in this section to determine whether or not this study possesses the first order of Markov property. This is followed by the persistency of the polluted (non-polluted) events. Results of the analysis and conclusion of this study are discussed in the results and discussion, and conclusion, respectively.

First Order of the Markov Chain Model in Describing the PM10
369Pertanika J. Sci. & Technol. 26 (1): 367 - 378 (2018)
DATA AND METHODOLOGY
Study Area and Data Preparation
Shah Alam is the state capital of Selangor, Malaysia (Figure 1). It is located about 25 kilometres west of the country’s capital, Kuala Lumpur. Shah Alam monitoring station is located at Sekolah Kebangsaan Raja Muda, Shah Alam. This station was chosen based on its land use background (urban area) as the absence of PM10 concentrations is higher at this area because of the daily activities and heavy traffic emissions. In Jerantut, the background station is located at the Meteorology Monitoring Station, Batu Embun, Jerantut. This monitoring station was selected as the background area because it is situated at the rural area and still has low potential of recording air pollution in Malaysia (Latif et al., 2014). The latitude and longitude for both stations are shown in Table 1.
7
Figure 1. The location of the monitoring stations for Shah Alam and Jerantut, Malaysia
Data for twelve years (2002-2013) of the PM10 concentration monitoring, provided by
the Department of Environment (DoE) Malaysia, are used in this study. In this study, the
hourly data of PM10 concentrations were transformed into daily average data. However,
the PM10 concentrations data were incomplete due to missing values as they were obtained
using an automated machine. Thus, according to Junninen et al. (2004), the missing value
for the air pollution monitoring record is in the category of missing at random and as the
Shah Alam, Selangor
Jerantut
Legend Urban area Background area
Figure 1. The location of the monitoring stations for Shah Alam and Jerantut, Malaysia

Mohamad, N. S., Deni, S. M. and Ul-Saufie, A. Z.
370 Pertanika J. Sci. & Technol. 26 (1): 367 - 378 (2018)
Data for twelve years (2002-2013) of the PM10 concentration monitoring, provided by the Department of Environment (DoE) Malaysia, are used in this study. In this study, the hourly data of PM10 concentrations were transformed into daily average data. However, the PM10 concentrations data were incomplete due to missing values as they were obtained using an automated machine. Thus, according to Junninen et al. (2004), the missing value for the air pollution monitoring record is in the category of missing at random and as the data used in this study contained small number percentage of missing value (which is < 1%) (Table I), the missing value is completely ignored. Little and Rubin (2002) stated that the low percentage of missing value can use the easiest and most common approach method to deal with these missing values, which is to completely ignore the missing values (delete all the missing values) and continue with the complete datasets.
Table 1 Basic descriptions of the monitoring stations and descriptive statistics
Station Shah Alam JerantutLatitude (°N) 3.08 3.95Longitude (°E) 101.51 102.36Valid Data 4369.00 4342.00% missing 0.32 0.94Mean (µg/m3) 56.28 38.63Median (µg/m3) 51.57 36.22Standard Deviation (µg/m3) 26.15 15.27Minimum value (µg/m3) 14.00 10.00Maximum value (µg/m3) 587.00 211.00
Methodology
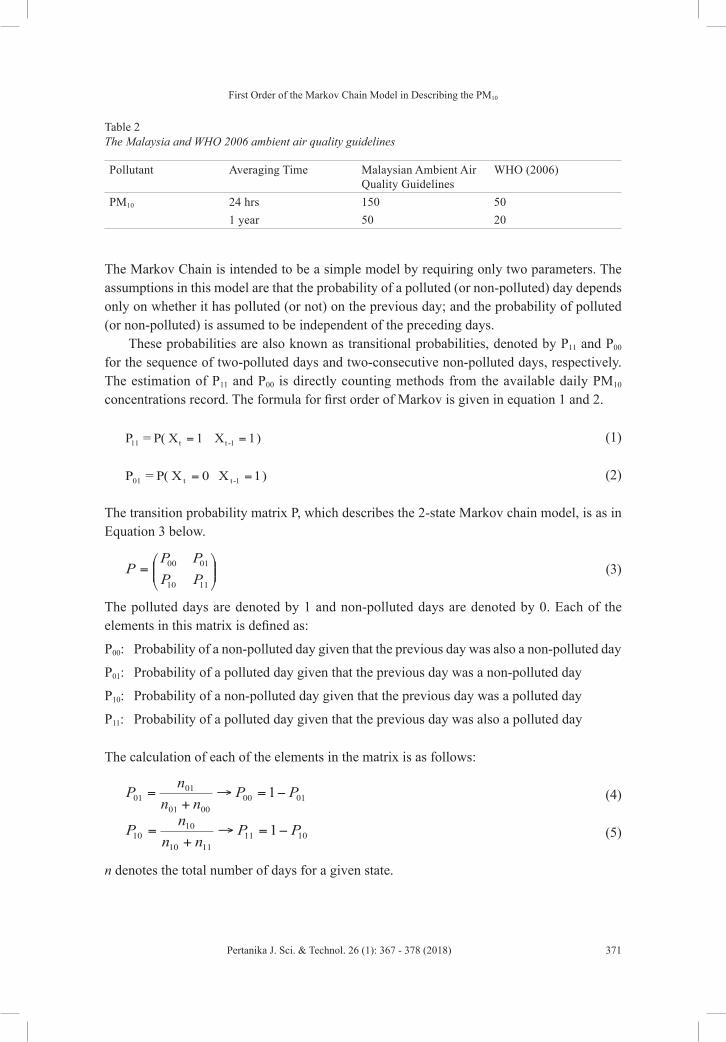
The PM10 concentrations were divided into two states: polluted day and non-polluted day. A polluted day can be defined as a day when the PM10 concentrations exceed or is equal to a certain threshold value, while the day is considered as a non-polluted day when the PM10 concentrations are lesser than the threshold value. According to DoE (2013), the current guidelines used in Malaysia for all the parameters, including PM10 concentration, are less relevant and outdated. Thus, this study considers the threshold value based on the World Health Organization (WHO), which is the PM10 concentrations should not exceed 50 µg/m³ for 24 hours as one of the issues discussed and updated in Malaysia Ambient Air Quality Standard 2013 as the new standard in the line with WHO 2006 guidelines (see Table 2). Table 2 was adopted from ADB and CAI-Asia (2006).
First Order of the Markov Chain Model in Describing the PM10
371Pertanika J. Sci. & Technol. 26 (1): 367 - 378 (2018)
The Markov Chain is intended to be a simple model by requiring only two parameters. The assumptions in this model are that the probability of a polluted (or non-polluted) day depends only on whether it has polluted (or not) on the previous day; and the probability of polluted (or non-polluted) is assumed to be independent of the preceding days.
These probabilities are also known as transitional probabilities, denoted by P11 and P00
for the sequence of two-polluted days and two-consecutive non-polluted days, respectively. The estimation of P11 and P00 is directly counting methods from the available daily PM10 concentrations record. The formula for first order of Markov is given in equation 1 and 2.
(1)
(2)
The transition probability matrix P, which describes the 2-state Markov chain model, is as in Equation 3 below.
(3)
The polluted days are denoted by 1 and non-polluted days are denoted by 0. Each of the elements in this matrix is defined as:
P00: Probability of a non-polluted day given that the previous day was also a non-polluted day
P01: Probability of a polluted day given that the previous day was a non-polluted day
P10: Probability of a non-polluted day given that the previous day was a polluted day
P11: Probability of a polluted day given that the previous day was also a polluted day
The calculation of each of the elements in the matrix is as follows:
(4)
(5)
n denotes the total number of days for a given state.
Table 2 The Malaysia and WHO 2006 ambient air quality guidelines
Pollutant Averaging Time Malaysian Ambient Air Quality Guidelines
WHO (2006)
PM10 24 hrs 150 501 year 50 20
Mohamad, N. S., Deni, S. M. and Ul-Saufie, A. Z.
372 Pertanika J. Sci. & Technol. 26 (1): 367 - 378 (2018)
The Markov chain properties of the daily occurrence can be tested statistically by checking whether or not the successive events are independent of each other. If the successive events are dependent, the events can form the first-order Markov chain model. The hypotheses are as follows:
H0: The successive events are independent
H1: The successive events are dependent
According to Moon et al. (1994), if the successive events are independent, then the statistics, α, is defined by
(6)
Where equation 6 is distributed asymptomatically as χ2 with (m – 1)2 degree of freedom. Meanwhile, m is the total number of state (in this case: m =2) and the marginal probabilities for jth column of the transition probabilities matrix is presented by Pj.
Besides that, P11 and P00 can be used to determine the average lengths of the polluted and non-polluted spell, as follows:
The average length of polluted spells is
(7)
whereas the average length of non-polluted spells is
(8)
Bessons’s coefficient of persistence is used to determine whether persistency is commonly used in meteorology. The formula has the following form:
(9)
where P1 is the probability of a polluted day and P11 is the probability of a polluted day, given that the previous day was also a polluted day. The positive value of RB indicates that the occurrence of a polluted or non-polluted event followed by an immediate preceding event. If the value is zero, then it indicates no persistence for a similar event. Many other researchers such as Deni et al. (2009) and Dahale et al. (1994) have used this particular method.
In fitting the first order of the Markov chain model, the expected distribution closer to the observed distribution of polluted events was analysed. The purpose of fitting this Markov chain model was to check whether the first order obtained was the appropriate fitted order to describe the observed distribution of polluted events for the data set at these two monitoring

First Order of the Markov Chain Model in Describing the PM10
373Pertanika J. Sci. & Technol. 26 (1): 367 - 378 (2018)
stations. The first order of the Markov chain model considers only the condition of the state, either polluted or non-polluted, for one preceding day only. Equation 10 shows the probability of the duration of n days for the polluted events.
(10)
The chi-square goodness of fit test was employed to compare the observed and expected distributions of polluted days. The calculation of the chi-square test statistics is as follows (Skuriat-Olechnowska, 2005):
(11)
Where Oi = observed data
Ei = Expected data
This statistics follows the chi-square distribution, with a number of degree of freedom (d=v-1), where v is the length of polluted days. All the expected frequencies must be at least five days and the hypothesis is that the data follows the observed distribution when is at 5% significant level.
RESULTS AND DISCUSSION
Over the study period of 12 years, Shah Alam recorded the maximum value of PM10
concentration at 587 μg/m3, while the maximum value of PM10 concentrations for Jerantut was 211 μg/m3 (see Table 1). The absence of this pollutant at both stations is over the threshold value of PM10 concentrations for certain days. Besides that, the average daily PM10 concentrations for Shah Alam and Jerantut shows that for both stations, the PM10 concentrations are higher between day 177 (June) up to day 221 (August), as shown in Figure 2. This result indicates that the present of this pollutant is higher during the South west monsoon (June to September) or dry weather condition (Yusof et al., 2011). This study also shows that Shah Alam recorded the highest number of polluted days (2396 days), whereas Jerantut recorded the highest number of non-polluted days (3552 days).
The frequencies of the first order transitions by considering today’s polluted (1) and non-polluted (0) day, followed by yesterday’s events (polluted or non-polluted day) for both the stations, are shown in Table 3. Shah Alam recorded the highest frequency of polluted days given that the previous day was also a polluted day, while Jerantut recorded the highest frequency of a non-polluted day, given that the previous day was also a non-polluted day. These results show that Jerantut still has low potential of recording air pollution in Malaysia.
Table 3 also shows results of the transition probabilities for a first order Markov chain obtained directly by using the transition counts using the formula in equation 4 and equation 5 for both stations. Shah Alam and Jerantut recorded a high probability of the next day being polluted when the previous day was polluted (P11) and also recorded a low probability for the next day being not polluted when the previous day was polluted (P10). This finding can help

Mohamad, N. S., Deni, S. M. and Ul-Saufie, A. Z.
374 Pertanika J. Sci. & Technol. 26 (1): 367 - 378 (2018)
responsible authorities to take action by providing early warning to the respective population when the previous day is a polluted day and also made prediction of PM10 event by referring to the condition of the previous day event.
Table 3 Tally matrix and transition probabilities of the occurrence of polluted and non-polluted days for 12 years at both stations
Station Tally Matrix Transition probabilitiesShah Alam 1472 501 0.7461 0.2539
502 1894 0.2095 0.7905Jerantut 3271 281 0.9209 0.0791
281 513 0.3539 0.6461
The successive state of daily PM10 concentrations was checked by computing a statistic of independence, α, and the results are shown in Table 4. The value of α at both the stations are larger than the χ2 value of 3.841 at the 5 per cent level, with one degree of freedom. Thus, H0
is rejected and the successive transitions are dependent. Hence, this study concludes that the transitions of daily PM10 concentrations occurrence possesses the first-order Markov chain model property, where the successive events are dependent on each other. The analysis of the mean length of polluted and non-polluted days, based on equation 7 and equation 8 for Shah Alam, indicates that on average, 4-5 days for the recurrence of the polluted days, while this is about 3-4 days for the recurrence of the non-polluted day. On average, Jerantut showed 2-3 days for the recurrence of the polluted day and 12-13 days for the recurrence of non-polluted days. Thus, these reflect the fact that Jerantut is relatively a less polluted area compared to Shah Alam.
Table 4 The mean length of polluted and non-polluted days for both stations
Station Mean α Besson’scoefficient (RB)Polluted days Non-polluted days
Shah Alam 4.77 3.94 660.22 1.61Jerantut 2.83 12.64 567.92 1.31
Analysis of the persistency of the polluted (non-polluted) events was done by applying the Besson’s coefficient of persistence (RB) as in equation 9. Table 4 shows results of the coefficient and for both stations, the value of RB was found to be positive, indicating that the occurrence of a polluted (or non-polluted) event was followed by an immediate preceding event. The result shows that the land used background has a strong influence on persistency since the persistent polluted events in Shah Alam were relatively much longer compared to Jerantut.

First Order of the Markov Chain Model in Describing the PM10
375Pertanika J. Sci. & Technol. 26 (1): 367 - 378 (2018)
Results of the chi-square test at 5% level of significant shown in Table 5 show that the first order of Markov chain model does not a good fitting on the PM10 concentrations data at the two monitoring stations. The value of chi-square at both monitoring stations (χ2) have bigger value than and the hypothesis that the data follow the observed distribution cannot be accepted at 5% significant level.
16
Analysis of the persistency of the polluted (non-polluted) events was done by applying the
Besson’s coefficient of persistence (RB) as in equation 9. Table 4 shows results of the
coefficient and for both stations, the value of RB was found to be positive, indicating that
the occurrence of a polluted (or non-polluted) event was followed by an immediate
preceding event. The result shows that the land used background has a strong influence on
persistency since the persistent polluted events in Shah Alam were relatively much longer
compared to Jerantut.
Figure 2. The average daily PM10 concentrations in Shah Alam and Jerantut, Malaysia, for
a period of twelve years (2002-2013)
Results of the chi-square test at 5% level of significant shown in Table 5 show that
the first order of Markov chain model does not a good fitting on the PM10 concentrations
data at the two monitoring stations. The value of chi-square at both monitoring stations (
2χ ) have bigger value than 21,95.0 −vχ and the hypothesis that the data follow the observed
distribution cannot be accepted at 5% significant level.
0
20
40
60
80
100
120
1 14
27
40
53
66
79
92
105
118
131
144
157
170
183
196
209
222
235
248
261
274
287
300
313
326
339
352
365
PM10
con
cent
ratio
ns
Days
Daily average of PM10 concentrations
Jerantut
Shah Alam
Figure 2. The average daily PM10 concentrations in Shah Alam and Jerantut, Malaysia, for a period of twelve years (2002-2013)
Table 5 The observed and expected frequency distributions computed with the first order of Markov chain model in Shah Alam and Jerantut monitoring stations
Length of polluted day Shah Alam JerantutObserved (day) Expected (day) Observed (day) Expected(day)
1 209 105 131 992 90 83 52 643 49 66 44 414 24 52 15 275 24 41 8 176 16 32 7 117 10 26 3 78 13 20 4 89 12 16 16 610 8 13 - -11 2 10 - -12 5 8 - -13 1 6 - -14 6 9 - -15 6 6 - -16 13 8 - -Total 488 501 280 283Degree of freedom χ2 p-value 15.00 8.00
173.30 45.322.20E-16 3.20E-07

Mohamad, N. S., Deni, S. M. and Ul-Saufie, A. Z.
376 Pertanika J. Sci. & Technol. 26 (1): 367 - 378 (2018)
Figure 3 shows the observed and expected frequencies of polluted events for the first order of Markov chain model for the Shah Alam and Jerantut monitoring stations. From the figures, it can be seen that the expected distribution of polluted events obtained does not closely describe the observed distribution. Thus, it can concluded that there is a need to use the higher order Markov chain model in assessing the best or appropriate fitting in describing the distribution of the polluted events.
Figure 3. The observed (line) and expected (dot) frequencies of polluted event of the first order for both stations
18
Figure 3. The observed (line) and expected (dot) frequencies of polluted event of the first order for
both stations
0
50
100
150
200
1 2 3 4 5 6 7 8 9 10 11 12 13 14 15 16 17 18 19
Freq
uenc
ies (
days
)
Length of polluted events (days)
Shah Alam
Observed Expected
0
50
100
150
200
1 2 3 4 5 6 7 8 9 10 11 12 13 14 15 16 17 18 19
Freq
uenc
ies (
days
)
Length of polluted events (days)
Jerantut
Observed Expected
18
Figure 3. The observed (line) and expected (dot) frequencies of polluted event of the first order for
both stations
0
50
100
150
200
1 2 3 4 5 6 7 8 9 10 11 12 13 14 15 16 17 18 19
Freq
uenc
ies (
days
)
Length of polluted events (days)
Shah Alam
Observed Expected
0
50
100
150
200
1 2 3 4 5 6 7 8 9 10 11 12 13 14 15 16 17 18 19
Freq
uenc
ies (
days
) Length of polluted events (days)
Jerantut
Observed Expected
CONCLUSION
The results obtained from the analysis can provide a better understanding of PM10 occurrences and the pattern at these two monitoring stations. In this study, the first order of Markov chain model was applied and the threshold value used was referring to WHO 2006 guidelines (50µgm-3). The results of the analysis show the high probability that the next day event depends on what has happened on the previous day. Besides that, the analysis of persistency showed that for both stations, the occurrence of polluted (non-polluted) event, followed by an immediate preceding event and the recurrence of polluted day in Shah Alam (4-5 days), is longer compared to Jerantut (2-3 days). By fitting the first order of Markov chain model, the results showed that the higher order of Markov chain model is needed in order to get the best fitted distribution of polluted events at these two monitoring stations. This study can help the responsible authorities to provide early warning to the public so that they can avoid from being exposed to air pollutant when the previous day is a polluted day. Further analysis could be done by considering other monitoring stations in Malaysia and different threshold value of PM10 concentrations in order to get more valuable information for the purpose of prediction. Besides that, the higher order (order more than one) could be carried out to find the optimum order that best describes the occurrence of PM10 concentrations in Malaysia and thus, a better prediction can be made.

First Order of the Markov Chain Model in Describing the PM10
377Pertanika J. Sci. & Technol. 26 (1): 367 - 378 (2018)
ACKNOWLEDGEMENT
This study was funded by Universiti Teknologi MARA (UiTM), under the Grant 600-RMI/IRAGS 5/3 (36/2015). Special recognition goes to the Department of Environment (DoE) and Alam Sekitar Malaysia Sdn. Bhd. (ASMA) for providing the air quality data for this study. Special appreciation also goes to Universiti Teknologi MARA (UiTM).
REFERENCESADB & CAI-Asia. (2006). Country Synthesis Report on Urban Air Quality Management. Malaysia:
Asian Development Bank (ADB) and the Clean Air Initiative for Asian Cities (CAI-Asia) Centre.
Awang, M., Jaafar, A. B., Abdullah, A. M., Ismail, M., Hassan, M. N., Abdullah, R., & Noor, H. (2000). Air quality in Malaysia: impacts, management issues and future challenges. Respirology (Carlton, Vic.), 5(2000), 183-96.
Basu, A. (1971). Fitting of a Markov chain model for daily rainfall data at Calcutta. Indian Journal of Meteorology and Geophysics, 22, 67-74.
Berchtold, A., & Raftery, A. (2002). The Mixture Transition Distribution Model for High-Order Markov Chains and Non-Gaussian Time Series. Statistical Science, 17(3), 328-356.
Chaloulakou, A., Grivas, G., & Spyrellis, N. (2003). Neural network and multiple regression models for PM10 prediction in Athens: a comparative assessment. Journal of the Air and Waste Management Association (1995), 53, 1183-1190. http://doi.org/10.1080/10473289.2003.10466276
Chin, E. H. (1977). Modeling daily precipitation occurrence process with Markov Chain. Water Resources Research, 13(6), 949-956.
Dahale, S. D., Panchawagh, N., Singh, S. V., Ranatunge, E. R., & Brikshavana, M. (1994). Persistence in rainfall occurrence over Tropical south-east Asia and equatorial Pacific. Theoretical and Applied Climatology, 49(1), 27-39. http://doi.org/10.1007/BF00866286
Deni, S. M., Jemain, A. A., & Ibrahim, K. (2009). Fitting optimum order of Markov chain models for daily rainfall occurrences in Peninsular Malaysia. Theoretical and Applied Climatology, 97, 109-121.
DoE. (2013). Malaysia Environmental Quality Report 2013. Kuala Lumpur: Department of Environment. Ministry of Natural Resources and Environment, Malaysia.
DoS. (2013). Compendium of Environment Statistics. Malaysia: Department of Statistics, Malaysia.
EPA. (2001). Latest Findings on National Air Quality: 2000 Status and Trends. United State Environmental Protection Agency.
Gabriel, K. R., & Neumann, J. (1962). A Markov Chain Model for Daily Rainfall Occurrence at Tel Aviv. Quarterly Journal of the Royal Meteorological Society, 88(375), 90-95.
Haan, C. T., Allen, D. M., & Street, J. O. (1976). A Markov Chain Model of daily rainfall. Water Resources Research, 12(3), 443-449. http://doi.org/10.1029/WR012i003p00443
Jimoh, O. D., & Webster, P. (1996). The optimum order of a Markov chain model for daily rainfall in Nigeria. Journal of Hydrology, 185, 45–69.
Junninen, H., Niska, H., Tuppurainen, K., Ruuskanen, J., & Kolehmainen, M. (2004). Methods for Imputation of Missing Values in Air Quality Data Sets. Atmospheric Environment, 38(18), 2895-2907.

Mohamad, N. S., Deni, S. M. and Ul-Saufie, A. Z.
378 Pertanika J. Sci. & Technol. 26 (1): 367 - 378 (2018)
Latif, M. T., Dominick, D., Ahamad, F., Khan, M. F., Juneng, L., Hamzah, F. M., & Nadzir, M. S. M. (2014). Long Term Assessment of Air Quality from A Background Station on the Malaysian Peninsula. Science of the Total Environment, 482-483(2), 336-348.
Little, J., & Rubin, D. (2002). Statistical Analysis with Missing Data. New York: Wiley.
Mangaraj, A. K., Sahoo, L. N., & Sukla, M. K. (2013). A Markov Chain Analysis of Daily Rainfall. Journal of Reliability and Statistical Studies, 6(1), 77-86.
Moon, S. E., Ryoo, S. B., & Kwon, J. G. (1994). A Markov chain model for daily precipitation occurrence in South Korea. International Journal of Climatology, 14, 1009-1016.
Paschalidou, A. K., Karakitsios, S., Kleanthous, S., & Kassomenos, P. A. (2011). Forecasting hourly PM10 concentration in Cyprus through artificial neural networks and multiple regression models: Implications to local environmental management. Environmental Science and Pollution Research, 18(2), 316-327.
Pires, J. C. M., Martins, F. G., Sousa, S. I. V., Alvim-Ferraz, M. C. M., & Pereira, M. C. (2008). Prediction of the Daily Mean PM10 Concentrations Using Linear Models. American Journal of Environmental Sciences, 4(5), 445-453.
Rahimi, J., Bazfarshan, J., & Rahimi, A. (2011). Study of Persistence of Days Infected Pollutant Particulate Matter (PM10) in City of Tehran Using Markov Chain Model. In 13th Conference on Atmospheric Chemistry (p. 231).
Skuriat-Olechnowska, M. (2005). Statistical inference and hypothesis testing for Markov chains with Interval Censoring. Delft University of Technology. Retrieved from http://www.ewi.tudelft.nl/fileadmin/Faculteit/EWI/Over_de_faculteit/Afdelingen/Applied_Mathematics/Risico_en_Beslissings_Analyse/Theses/MSkuriat_thesis.pdf
Ul-Saufie, A. Z., Yahaya, A. S., Ramli, N. A., & Hamid, H. A. (2012). Robust Regression Models for Predicting PM10 Concentration in an Industrial Area. International Journal of Engineering and Technology, 2(3), 364-370.
Yusof, N. F. F. M., Ramli, N. A. R., & Yahaya, A. S. (2011). Extreme Value Distribution for Prediction of Future PM10 Exceedences. International Journal of Environmental Protection, 1(4), 28-36.