peru food service - hotel restaurant institutional 2010 gain publications/food service... · food...
TRANSCRIPT

THIS REPORT CONTAINS ASSESSMENTS OF COMMODITY AND TRADE ISSUES MADE BY
USDA STAFF AND NOT NECESSARILY STATEMENTS OF OFFICIAL U.S. GOVERNMENT
POLICY
Date:
GAIN Report Number:
Approved By:
Prepared By:
Report Highlights: At $3.2 billion, the sales of Peru‟s full service restaurants accounted for 65 percent of those of total
food service sector in 2009. Almost 40 percent of this is the sales made by high-end restaurants.
Importation of food products used by the food service sector was estimated at $1 billion, 20 percent of
total food service sales. Trade opportunities for U.S. food products increased after the implementation
of the U.S.-Peru Trade Promotion Agreement (US-PTPA). Food products used by the food service
sector that will be benefitted by the US- PTPA are food ingredients, fruits, cheeses, processed fruits and
Alvaro Loza
Emiko Purdy
2010
Food Service - Hotel Restaurant Institutional
Peru
12/27/2010
Required Report - public distribution

vegetables, meats, and specialty foods.

Post:
Executive Summary:
Section I. Market Summary
Despite the international financial crisis, Peru‟s economy has experienced one of the highest growth
rates in Latin America in the last five years. This was stimulated by investments in mining, construction,
gastronomy, and tourism sectors, all of which has had a positive impact on the food service sector. Peru
has also proven its capacity to host international conferences, like the Asia-Pacific Economic
Cooperation and the Organization of American States, which have further motivated investors. It is
projected that by 2012, the private sector will invest almost $2 billion on tourism, including more hotels,
restaurants and other services connected to the food service sector.
The Peruvian consumers‟ purchasing power, and economy are likely to post significantly higher growth
rates in 2010. Overall, apart from 2009, gross domestic product (GDP) per capita and average
disposable incomes have shown a steady increase, although the benefits of growth have been
concentrated in the coastal area where GDP per capita is already significantly higher than elsewhere in
the country. The increase in disposable incomes has led to increased consumption, but reduced domestic
savings, which are likely to have long-term implications for growth and consumption in the country.
In 2009, food service sales accounted for nearly $4.9 billion of which full service restaurants
represented almost 65 percent. From 2008 to 2009, Peru‟s food service sales grew by 5 percent. During
the same period, at $1 billion, Peruvian food service imports accounted for 20 percent of the country‟s
total food service sales.
Estimated Consumer Food Service by Type (Current Value): 2005-2009
Sub Sector
Food Service (US Million $)
2005 2006 2007 2008 2009 Growth (percent)
08/09
Full-service restaurants 1,906 2,112 2,409 2,983 3,126 5
Cafes/Bars 565 571 690 840 918 9
Fast Food 169 177 226 234 266 14
Home Delivery 58 62 75 94 98 4
Street stalls/kiosks 279 291 339 467 449 -4
TOTAL 2,977 3,213 3,737 4,619 4,857 5
Source: INEI (Peruvian National Statistical Institute)
Euromonitor International
The niche market for U.S. exporters in the food service sector includes high-end hotels and restaurants,
family style restaurants, fast food chains, and coffee shops. Fast food chains have demonstrated the
Lima

fastest annual growth with approximately 8 percent in the last five years.
Food service products that will benefit from the PTPA with lower or duty free tariffs include food
ingredients, fruits, cheeses, processed fruits and vegetables, meats, and specialties.
Lima is the major market for consumer-oriented foods with almost one third of Peru‟s population and
more than 60 percent of the national income. High and middle-income consumers, currently the main
market for U.S. food sales, reach around 1.8 million inhabitants with an average monthly family income
of $1,200. These consumers spend roughly 32 percent of their income on food (12 percent of which is
spent eating outside the home).
Social factors that affect the food service market include the growth of tourism (7 percent per year),
urban expansion, an increase of women in the workforce (38 percent) and a growing population of
young people that demand fast food or meals prepared outside of the home.
Advantages and Challenges of U.S. products to Peru’s Food Service Sector
Advantages Challenges
1. Appreciation for U.S. food quality and culture.
1. Food service products will
benefit from the PTPA with lower or duty free rates.
1. There are more
competitors in the sector, including international chains.
1. Fast food chains are expanding in Lima suburbs and
in major cities (Arequipa, Trujillo, Chiclayo and Piura).
1. Peru’s government fund to
promote tourism.
1. High-end hotels are associated with international
chains and foreign operators to expand and assure high
occupancy levels.
1. Peruvians prefer meals based on “fresh products.”
1. Low purchasing power; 78
percent of Lima’s population is low-income consumers. Outside
of Lima 87 percent of the population is low income.
1. U.S. exporters need to
incorporate U.S. food
ingredients in international and Peru’s traditional menus.
1. Limited infrastructure and
low quality service discourage longer stays of international
tourists.

Section II. Road Map for Market Entry
A. Entry Strategy
U.S. exporters can approach the Peruvian food service market through a large importer,
wholesaler/distributor or a specialized importer. Most food service companies buy imported
goods from local intermediaries.
Personal visits are highly recommended. The local partner should be well known by the
U.S. company before any permanent contractual arrangement is made.
The local company should be able to provide updated information on market consumer
trends, current market development, and trade business practices.
In addition, it is recommended that U.S. exporters work with chefs and local importers in
performing innovative marketing activities in the high-end food service sector to:
Incorporate U.S. food ingredients in local and international menus.
Break down local preference for European specialties. The strength for U.S. food
products in this market is that they are considered to be of superior quality, taste and
presentation.
A. Market Structure

Food service sources are mainly domestic due to strong local preferences for fresh food
products at lower prices.
Food service importers are also suppliers for the retail market, which accounts for more
than 70 percent of their profits in most cases.
Almost all food service businesses purchase through intermediaries (97 percent).
However, high-end restaurants and hotels import equipment directly.
International franchises (KFC, Pizza Hut, Burger King, Mc Donalds), and the local chain
Bembos, reach enough volumes to import some of their food ingredients directly.
A. Sub-sector Profiles
1. Hotels
Number of Hotels in Peru, Classify by Categories in 2009
Hotel
Category
Number of
Outlets
Number of
Rooms
Number of
Beds
Outlet Location
Lima Provinces
Five-stars 31 3,926 7,257 20 11
Four-stars 44 3,170 5,854 25 19
Three-stars 500 14,041 26,792 73 303
Two-stars 1,050 21,434 37,840 200 850
One-stars 362 6,340 10,902 97 265
Total 1,987 48,911 88,645 415 1,448
Source: Ministry of Foreign Commerce and Tourism (Mincetur)
Growth in the tourism sector, according to the National Institute of Statistics (INEI) was 2.3 percent in
2009. Hotels expanded 2.5 percent, due to increased local tourism (6 percent), which offset the drop in
hotel overnight stays by foreign tourists. The tourism boom, however, is not only caused by the increase
in number of foreign visitors, but also by new investments in hotels and restaurants. The country often is
featured in international tourism magazines as one of the most desirable tourist destinations in the
world.
At 2.1 million, the number of foreign visitors to Peru rose 3.6 percent in 2009 compared with the
previous year. Tourism is one of the major industries in Peru, representing foreign currency earnings of
$2.25 million. While tourists from Japan and the United Kingdom declined, there was a greater inflow
of Argentinean (26 percent), Brazilian (29 percent), and Colombian (14 percent) travelers. Despite the
international financial crisis, there were also increases of tourists from countries such as Canada (5
percent), United States (1 percent), Spain (7 percent), China (15 percent), and Australia (8 percent).
In 2009, classified and unclassified (unclassified lodging are all not included in the chart above) lodging
establishments offered almost 340 thousand beds, a 4.4 percent increase from 2008. Accommodations
offered by classified and categorized hotel establishments rose by 2.4 percent in 2009.

The niche market for U.S. exporters in this sub-sector is high-end hotels, mainly four and five-star, that
use higher proportions of imported food products. Among all foods served in hotels, imported food
items represented approximately 16 percent. Marketing efforts in this sub-sector should target activities
to introduce U.S. food ingredients and U.S. gourmet products in high-end hotel restaurants that offer
local and international cuisine.
Major high-end hotels are located in Lima (75 percent), the center of business activities. Many hotels
are developing strategic alliances with international hotel chains or key local groups, with the intent of
having a hotel in every important tourist destination in Peru (Lima, Cuzco, Arequipa and Puno).
The hotel sector experienced 10 percent growth in 2009 over a year ago level, however, the growth is
expected to be more marginal level of 6 percent in 2010 due to global financial slowdown.
According to the president of the Peruvian Hotel Society, a $1.5 billion dollar investment
is expected over the next three years.
Source: Ministry of Foreign Commerce and Tourism (Mincetur)
International Visitor Profile (According to Mincetur):

Source: MINCETUR
Foreign tourists spend around $89 daily. Food represents the third largest expense (18
percent), with lodging and transportation topping the list (28 percent and 20 percent,
respectively).
Local tourists spend around $103 daily. Transportation is their highest expense at 41
percent followed by food at 16 percent.
The top five destinations for foreign tourists are Lima, Cusco, Puno, Arequipa, and Ica.
The high season for foreign tourists is July and August.
Around 70 percent of foreign tourists are between 25 and 54 years of age.
Male visitors constitute 66 percent of the total.
Purpose of visits: vacations (61 percent), business (19 percent), visit family or friends (10
percent), attending seminars (4 percent), others (6 percent).
Types of tourism: urban, cultural, ecological, adventure, live cultures, and sun bathing.
Restaurant preferences: Peruvian style, seafood, and meat.
Accommodations: for vacations, three star hotels; for business, five star hotels, and four-star
hotels; for seminar attendance, five-star hotels, four-star hotels, and three-star hotels.
Major Hotel Profiles (2009)
Name of Hotel No. of
Outlets
Total Sales
Est. (million $)
City
J.W. Marriott
Inversiones La Rioja S.A.
1 26 Lima
Country Club Lima
Hotel 3 18 Lima, Piura, Tarma

Los Portales Hotels Los Portales S.A.
Libertador Hotels
Inversiones Nacionales de Turismo
S.A.
11 7 Lima, Trujillo, Cuzco, Puno
Sonesta Posadas del
Inca
Inmobiliaria de Turismo S.A.
6 15 Lima, Arequipa, Cuzco
Swissotel Hotelera Costa del
Pacífico S.A.
1 17 Lima
Miraflores Park Orient-Express Peru
S.A. Inversiones Malecon
de la Reserva S.A.
3 22 Lima, Cuzco
Sheraton Lima Hotel & Casino
Hoteles Sheraton del Peru S.A.
1 12 Lima
Hotel Monasterio
Peru OEH S.A. 1 17 Cuzco
Melia Hotel Corporacion Hotelera
Metor S.A.
1 10 Lima
Apart Hotel El Golf Los Incas
Suites El Golf Los Incas S.A.
1 4 Lima
Doubletree El Pardo
Hotel Inversiones Brade
S.A.
1 8 Lima
Inka Terra Hotels Inka Terra Peru
S.A.C.
3 8 Cuzco, Tambopata
Las Dunas Sun Resort Inversiones en
Turismo S.A.
1 4 Ica
Hotel & Suites Las
Americas 4 3 Lima

La Caja, Servicio de Hoteles S.A.C.
Hotel Jose Antonio
Cartir Peru S.R.L. 3 5 Lima, Cuzco
Novotel
Corporacion Hotelera del Cuzco S.A.
1 3 Cuzco
Costa del Sol Hotel
Costa del Sol S.A. Turismo Costa del Sol
S.A.
5 9 Tumbes, Piura, Lima, Cajamarca, Chiclayo
Plaza del Bosque Apart Hotel
Hotelera del Pilar S.A.C.
1 1 Lima
Los Tallanes Hotel &
Suites Turismo Los
Algarrobos S.A.
1 3 Lima
El Condado Suites Turismo Costa Sur
S.A.
2 3 Lima
Hotel Radisson Consorcio Hotelero
Las Palmeras S.A.
2 9
Casa Andina Nessus Hoteles Peru
S.A
17 25 Lima, Cuzco, Ica,
Puno, Arequipa
Business Tower Prince Hotel
Figtur S.A.
1 4 Lima
Hotel Las Americas
Thunderbird Hoteles Las Americas S.A.
1 23
Source: The 10,000 Major Companies in Peru
2. Restaurants
Peruvian gastronomy has earned international recognition. Proof of this is the rapid development of

Peruvian restaurant franchises abroad and the growing number of publications about Peruvian Cuisine.
Locally, the gastronomic offering is highly diversified and new eateries are always opening, due to
growing numbers of foreign visitors eager to sample new food. The number of restaurants has increased
to 70,000 throughout the country with 48 percent in Lima. Shopping centers, particularly those of
outside of Lima, have many fast food chains as their tenants.
The Peruvian government has been actively promoting tourism. In September 2009, the first general
tourism law was enacted to promote tourism and entrepreneurial development, particularly in
“alternative zones,” the areas that have been adjusted recently to lodge tourists.
State and private institutions help strengthen the sector: Promperu organized the First Gastronomic
Tourism Fair, “Peru Mucho Gusto” (Peru, pleased to meet you) in northern Peru, while in the south
“Tincuy 2009” was the regional fair. In Lima, The Peruvian Gastronomy Association successfully
sponsored the “Second Mixed Gastronomy Fair 2009,” with the participation of Peru‟s renowned chefs.
The Ministry of Foreign Trade and Tourism (MINCETUR), launched the national campaign entitled
„The Seven Gastronomical Wonders of Peru.”
Increasing demands for modern and convenient commercial shopping centers in Lima and other cities
have made franchising popular among local investors and consumers. At present, most of the franchise
outlets are located in Lima; however, franchisers have started to establish outlets in other cities such as
Chiclayo, Trujillo, Piura, Arequipa and Cusco.
Based on industry estimates, about 100 franchises are operating over 1,000 outlets. The franchise
market has focused mainly on restaurants, representing 64 percent of the sector. Foreign-owned
franchises dominate the Peruvian market (around 70 percent). The United States introduced the concept
of franchising in the 80`s, and it still enjoys the highest market share at almost 50 percent. Other key
players in the Peruvian franchising market are Spain, Mexico, Argentina, Canada, Brazil and Colombia.
The niche market for U.S. products is constituted by high-end restaurants, some family style restaurants,
coffee shops and fast food chains. These restaurants commonly purchase between 10 to 20 percent of
imported food products, usually in food ingredients (sauces, meats, processed fruit and vegetables,
cheeses), specialties (pork products), and wine and liquors.
High-end restaurants purchase imported products from wholesalers, distributors or
retailers.
There is a growing trend to offer tourists a variety of dishes made from Andean products
called “Novoandina” cuisine.
Bembos, a local fast food franchise, has grown 10 percent annually in the last five years.
Bembos is viewed as the local hamburger of high quality. This franchise uses imported food
ingredients to standardize products. With 36 outlets, Bembos reaches $19 million people.
Major food franchises are expanding to middle and low-income areas in the suburbs of
Lima and capitals of provinces. The total sales of these international and domestic franchises
have reached $500 million in 2008.
The fast food chains typically source its chicken and bread locally. However, they
import meat, French fries and sauces from the United States, Argentina, and Chile.
Broiled chicken restaurants, known as “pollerías,” reach around 1,100 outlets in 2009.
Annual growth is averaged at 10 to 15 percent. “Pollerías” owns seven food chains (120
outlets). These chains compete directly with supermarkets (30 percent of market share) and
delivery accounts for 35 percent of their sales. Their target market is families and office
employees. Purchases of chicken and French fries, the two most important ingredients, are
mainly local but are good prospects for future U.S. exports.
Coffee shops use mainly local products in their menus but have strong potential to
increase supplies of U.S. liqueurs.
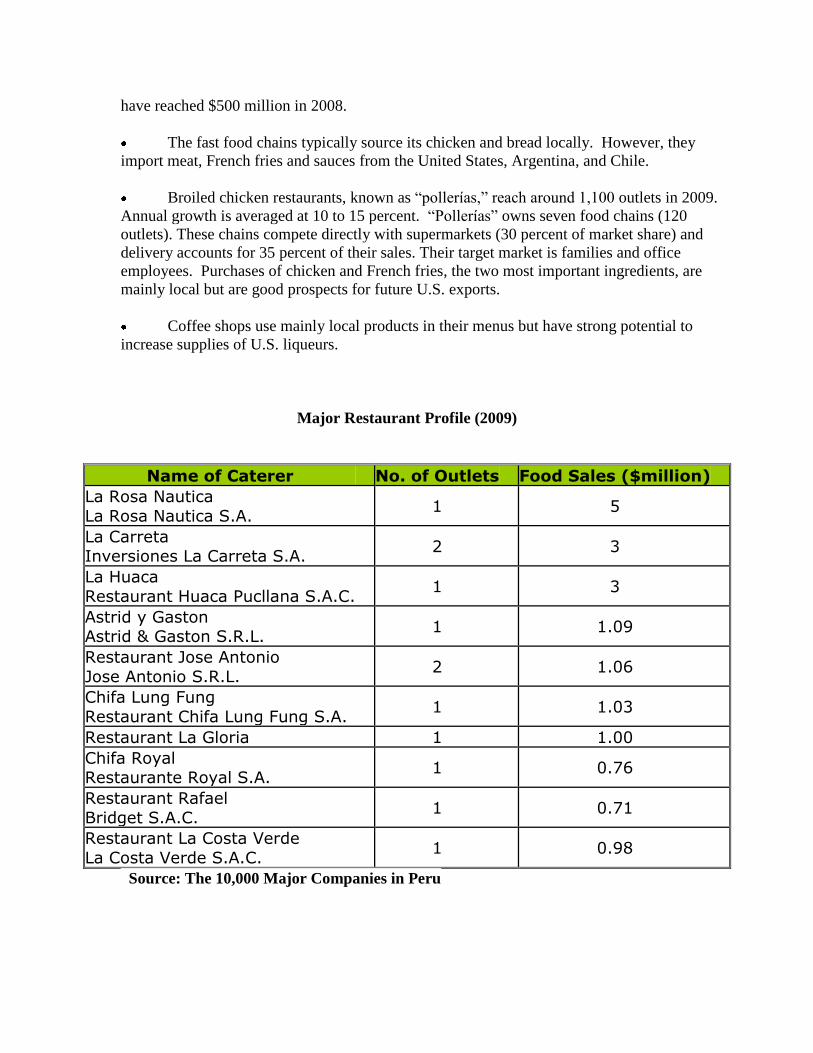
Major Restaurant Profile (2009)
Name of Caterer No. of Outlets Food Sales ($million)
La Rosa Nautica
La Rosa Nautica S.A. 1 5
La Carreta Inversiones La Carreta S.A.
2 3
La Huaca
Restaurant Huaca Pucllana S.A.C. 1 3
Astrid y Gaston Astrid & Gaston S.R.L.
1 1.09
Restaurant Jose Antonio
Jose Antonio S.R.L. 2 1.06
Chifa Lung Fung
Restaurant Chifa Lung Fung S.A. 1 1.03
Restaurant La Gloria 1 1.00
Chifa Royal Restaurante Royal S.A.
1 0.76
Restaurant Rafael
Bridget S.A.C. 1 0.71
Restaurant La Costa Verde
La Costa Verde S.A.C. 1 0.98
Source: The 10,000 Major Companies in Peru

Many years ago the café culture in Peru was still in its infancy. Although coffee shops and salons de té
(tea shops) were common decades ago, they became largely associated with the elderly and were no
longer seen as fashionable. This has changed significantly with the spread of the international chain
Starbucks, which can now be found in most malls in Lima, and elsewhere. This began a trend that has
led to the updating of coffee houses, especially in richer neighborhoods and the business areas. The
increasing popularity of these cafes can be attributed in part to increased access to U.S. sitcoms through
cable and satellite TV. Their popularity with students and business people has also helped them thrive.
For most Peruvians going to coffee shops is not a regular occurrence. However, those in the habit of
visiting them are likely to go once a day during the working/studying week.
As in other parts of the region, coffee shops have become very popular with a broader range of
customers and they will continue to expand. As they become a way of life for more and more people,
the variety of coffee shops will also increase, thereby reducing the market power of large international
firms. The demand for coffee, milk and milk substitutes, flavorings will increase as a result. Peruvian
coffee shops are beginning to emulate their U.S. counterparts by offering free Wi-Fi internet access. In a
consumer market where most people do not have personal access to the internet, this could be usefully
combined with internet café culture.
Family Style Restaurants and Coffee Shops Profiles (2009)
Name of Restaurant No. of
Outlets Food Sales ($million)
City
Bohemia Café y Mas Bohemia Corp S.A. 1/
2 3 Lima, Cuzco
Mangos 1/ 1 2 Lima
Quattro D
Quattro D S.A. 7 3 Lima
Pasteleria San Antonio Pasteleria San Antonio
S.A.
4 3 Lima
Pardo’s Chicken Servicios de Franquicia
Pardo’s S.A.C.
20 3 Lima
Chili’s
Cindel S.A. 7 9 Lima
Tony Roma’s Inversiones La Floresta
S.A.
3 1 Lima
Starbucks Delosi S.A.
29 54 Lima, Arequipa, Trujillo, Chiclayo

Note: 1/ Estimated values for 2009
Source: The 10,000 Major Companies in Peru
Fast Food Chain profiles (2009)
Name of Restaurant
No.
of Outle
ts
Food
Sales ($milli
on)
Direct Food
Imports
($million)
City
Purchas
ing
Agent for
imports
Kentucky
Fried Chicken
Delosi S.A.
48 54 1.0
Lima, Trujillo,
Arequipa,Chiclayo,Huancayo
Direct
Burger King Pizza Hut
Sigdelo S.A.
12
24 38 0.80
Lima, Trujillo,
Arequipa Direct
Mc Donalds Operaciones
Arcos Dorados de
Peru S.A.
30 22 1.50 Lima, Cuzco Direct
Bembos Burger Grill
Bembos S.A.C.
47 26 0.75
Lima, Trujillo,
Arequipa, Cuzco, Chiclayo, Piura
Direct,
importer
Domino’s
Pizza Comercializa
dora de Alimentos
Latinos S.A.C.
24 4.45 None Lima, Callao, Arequipa
Importer
Papa Johns
Corporacion Peruana de
Restaurantes S.A.
14 7 0.55 Lima Importer
Note: Estimated values for 2009
Source: The 10,000 Major Companies in Peru (2010)

3. Institutional Contractors
1. This sub-sector represents approximately 14 percent of total food service sales, with an
estimated growth of 10 percent in 2009.
1. U.S. marketing potential includes large caterers that supply airports and mining
companies. Currently, these companies use mostly local products in their menus.
1. Vending machines and stores in mining camps require imported goods such as snacks,
canned goods and confectionary that are supplied through local importers, wholesalers,
distributors, or caterers.
Major Peruvian Suppliers for the Food Service Sector (2009)
Company Name
Total food
Imports ($Million
)
Total
Sales ($Million
)
Type of Company
Food Supply
Imported
Food Products
Alicorp S.A. 22 1,283
Processor,
importer, distributor
Pasta, wheat flour,
margarine, food
ingredients, mayonnaise,
breakfast cereals,
cookies, jelly, ice
cream, sauces, pet
food.
Wheat, wheat flour,
edible oils, soy cake,
sauces.
Gloria S.A. 18 881
Processor,
importer, distributor
Dairy and pork
products, juices,
canned
seafood.
Dairy ingredients,
juices, lactose and
other
sugars.
Nestle Peru S.A.
6 352
Processor,
importer, distributor
Dairy
products, soups and
broths,
Dairy
ingredients, chocolate,
infant

infant formula,
instant coffee and
chocolate, breakfast
cereal, cookies,
chocolates, bakery
goods.
formula, food
preparations, baked
goods, chicory
extract, sauces, soup
preparations.
Kraft Foods Peru S.A.
4 94
Processor,
importer, distributor
Cookies,
juices, cheeses.
Cheese, sauces,
bakery and dairy
ingredients, chocolates.
G.W.Yi
Chang & Cia S.A.
3 59 Importer,
distributor
Canned
fruits, canned
seafood, chocolate,
wine and
spirits.
Canned
fruits, canned
seafood, chocolate,
wine and
spirits.
Servicios
Frigorificos S.A.
2 10
Processor,
importer, distributor
Processed
meats, meats and
edible offals.
Meats and edible offals.
Química Suiza S.A.
3 225 Importer, distributor
Sweeteners, fishmeal,
chocolate, wine,
processed
fruit.
Canned food, food
ingredients, sweeteners,
animal feed.
Diageo
Peru S.A. 3 22
Importer,
distributor Liquors. Liquors.
Unilever Andina
Peru S.A.
4 86 Processor, importer
Sauces, soups.
Sauces, soups.
Halema
S.A. 1 15
Processor,
importer
Processed meats,
meats and edible offals.
Meats and
edible offals.

Laive S.A. 1 108 Processor,
importer
Dairy and
pork products,
Cheese, butter and
pork products.
Agro Corporacio
n S.A.C.
1 15 Processor, importer
Processed
meats, meats and
edible offals.
Meats and edible offals.
Perufarma
S.A. 14 71
Importer,
distributor
Chocolate, confectionar
y, wine and liquors.
Chocolate, confectionar
y, wine and liquors.
Arcor del Peru S.A.
4 30
Processor,
importer, distributor
Chocolate, confectionar
y, bakery goods,
canned fruit.
Chocolate,
confectionary, canned
fruit, bakery goods,
bakery ingredients.
Drokasa
Peru S.A. 1 17
Importer,
distributor
Wine and
liquors.
Wine and
liquors.
Mayorsa S.A.
3 31
Wholesale
r, importer
Peas and
lentils,
popcorn, canned fruit,
starch.
Peas and
lentils,
popcorn, canned fruit,
starch.
Oregon
Foods S.A.C.
3 15 Importer, distributor
Processed
meats,
meats and edible offals,
fresh fruits.
Meats and
edible offals, fresh fruits.
Corporacio
n Jose R.
Lindley S.A.
3 472 Processor,
importer.
Sodas,
juices.
Canned
fruit, gelatin.
Braedt S.A. 2 32
Processor,
importer,
distributor.
Pork
products, cheese.
Pork products,
cheese,
dairy ingredients,
condiments.
Industrias
Molitalia 2 4
Processor,
importer,
Chocolates,
pasta, Wheat.

S.A. distributor.
confectionary, sauces.
Delosi S.A. 1 54 Fast food
franchise
Hamburgers
, salads.
French fries,
bakery goods,
sauces, cheese.
Destileria
Peruana S.A.
1 6 Processor, importer
Wholesalers,
retailers, food service
Liquors.
L.S. Andina S.A.
1 7 Importer, distributor
French fries preserved,
chocolates,
sweeteners, confectionar
y, olive oil, baked goods
French fries preserved,
chocolates,
sweeteners, confectionar
y, olive oil, baked goods
Sociedad
Suizo Peruana de
Embutidos S.A.
1 44 Processor,
importer
Sausages,
cheese.
Pork
products, poultry,
edible offals, cheese
Sigdelo
S.A. 1 38
Fast food
chain
Hamburgers
, pizza
Cheese,
meat preparations
, sauces, French fries,
condiments
KMC
International S.A.C.
1 4 Importer, distributor
Microwave
popcorn, soups,
baked goods
Microwave popcorn,
soups, baked
goods.
L C e Hijos S.A.
1 6 Importer, distributor
Wine and liquors
Wine and liquors
Bembos S.A.C.
1 26 Fast food chain
Hamburgers French fries, meat,
cheeses
Note: Total food imports are distributed between the three food sectors: HRI, Retail and Food
Processing.
Source: The 10,000 Major Companies in Peru 2010 and Peru’s Customs (Sunat)

III. Competition
Source: World Trade Atlas (2009)
Peru gives tariff preferences to the Andean Community of Nations (CAN - Bolivia, Colombia,
and Ecuador), and to Mexico, Paraguay, Argentina, Brazil, Uruguay and Cuba.
According to Peru‟s customs data, total consumer-oriented food imports were $552 million in
2009, down 10 percent, compared to the previous year. The U.S. was the third largest supplier
($62.5 million), with 11 percent of the market share, facing stiff competition from Chile and
Colombia (28, and 12 percent, respectively).
Peru‟s trade policy is oriented to open markets. Peru has signed an Economic Complementation
Agreement (ECA) with MERCOSUR, a major U.S. competitor in bulk commodities and meats.
Dairy products were exempted from the negotiations. Peru recently expanded its ECA with
Chile, Peru‟s major supplier of food and agricultural goods, and is negotiating the extension of
its ECA with Mexico. Peru finished negotiating a free trade agreement with Thailand and is
currently negotiating a free trade agreement with Singapore, South Korea, and Japan. Peru is
also seeking a free trade agreement with the E.U and China.
The PTPA will reinforce U.S. competitiveness within the Peruvian market. The quality of U.S.
products is already appreciated among the high-end consumers. Imported food products have

tariff rates that range between 0 and 17 percent.
Peru is looking forward the implementation of PTPA agreement which will allow lower or duty
free tariffs for many food and agricultural products. For a complete list of products that will be
benefited from the PTPA, please check
http://www.ustr.gov/Trade_Agreements/Bilateral/Peru_TPA/Section_Index.html.
.
Competitive Situation facing U.S. Suppliers in the
HRI Food Service Market in 2009
Product
Category/ Net Imports
Major
Supply Sources
Strengths of Key Supply Countries
Advantages and
Disadvantages of Local
Suppliers
Dairy Products
28,945 tons ($72.96
million)
Mexico: 21 percent
Chile: 18 percent
New Zealand: 11
percent Colombia:
11 percent Ireland: 10
percent
- Mexico is major supplier
of dairy ingredients, especially preparation of
cereals and infant milk. Both are duty free.
- Only two
companies are major producers
of evaporated
milk and yogurt. - Local
homemade cheeses are
commonly sold.
Snack Foods
26,930 tons ($54.5 million)
Colombia: 44 percent
Argentina: 15 percent
Ecuador: 13
percent U.S.: 8
percent Chile: 5
percent
- Tariff preferences
applied to neighbor countries.
- Local producers
are major food processors. They
import food ingredients for
snacks and also snacks in bulk.
Processed Fruits and
Vegetables 52,761 tons
($56.58
million)
Chile: 46 percent
U.S.: 11 percent
Netherlands:
10 percent
Chile sells at cheaper prices
due to proximity and
tariff
preferences.
- Local processors are
major exporters, but their local
supply is limited

China: 5 percent
Argentina: 5 percent
- E.U. products are positioned as being of
good quality. - China has increased its
tomatoes prepared exports
Fresh Fruits 58,050 tons
($46.60
million)
Chile: 93
percent Argentina: 4
percent
U.S.: 3 percent
- Chile is the main
supplier because of proximity, price and duty
free entrance.
- Argentina has a window for pears and apples
- There is an
open window from November
to February for the U.S.
- Local fruit sold at retail market
is of lower quality.
Fruit and vegetable
juices 1,255,740 L
($ 2.1 million)
U.S.: 32
percent Brazil: 27
percent Chile: 21
percent Colombia: 4
percent
- Chile has advantages of tariffs and proximity.
- Brasil has increased its frozen orange exports
- Local brands are well
positioned in the market at
competitive prices.
Wine and Beer
11.9 Million liters
($23.68million)
Argentina: 41 percent
Chile: 25 percent
Spain: 9
percent Italy: 7
percent Brazil: 6
percent France: 4
percent U.S.: 3
percent Germany: 1
percent
- Proximity and recognized quality of
Chilean and Argentinean wines.
- Brazil is the major supplier of imported beer.
- Major local breweries are
well positioned, price competitive
and belong to
international companies,
representing 95 percent of the
market. - Local wine is
well positioned and price
competitive, but does not satisfy
demand.
Red Meats (fresh, chilled
or frozen) 24,691 tons
Argentina: 26 percent
Brazil: 25 percent
- Major imports come
from nearby countries.
- Peru’s market for the U.S.
reopened in October 2006.

($39.40 million)
Paraguay: 21 percent
U.S.: 16 percent
Chile: 7 percent
Uruguay: 3 percent
- U.S. meats are of superior
quality. - Peru imports
three times more offals than
meats. - Local meat
does not satisfy the demand.
Red Meats (prepared,
preserved) 1,126 tons
($4.56 million)
Chile: 31
percent Argentina:
16 percent Bolivia: 10
percent Italia: 10
percent
Denmark: 10 percent
Spain: 8 percent
U.S.: 6 percent
Brazil: 6 percent
- Chile has the advantages of tariff
preferences and proximity.
- There pork
products industry that also imports
prepared meats.
- U.S. product tariffs will go
down from 5 to 7 years linear.
Poultry Meat
17,852 tons
($21.57 million)
Chile: 31
percent Brazil: 23
percent Italy: 20
percent Argentina:
12 percent U.S.: 10
percent Bolivia: 5
percent
- U.S. poultry product imports reopened in
October 2006. - Brazil and Chile are
major suppliers of poultry cuts.
- Local poultry
producers are major suppliers
with good
distribution channels.
- Imports are mainly chicken
and turkey parts.
Note: Net imports correspond to the three food sectors: Food Service, Retail and Food Processing.
Source: World Trade Atlas
IV. Best Products Prospects

Source: World Trade Atlas (2009)
A. Products Present in the Market Which Have Good Sales Potential:
Product/
Product Category
Mark
et
Size 2009
est.
Impor
ts 2009
Average Annual
Import Growth
(2004-09)
Impor
t Tariff
Rate
Key Constraint
s Over Market
Development
Market
Attractiveness for the
U.S.
Cheese
(HS 0406)
18,480
MT
2,005
tons
($8.35
million)
8.2 percent
040610, 20
and 40 0
percent
04063
0 04069
0 0
percen
- U.S. competitor
s are: Uruguay
(16percent) and
Netherland
s (16percent
). - Strong
preference
- U.S. cheeses are
mainly used in the food
processing sector, but
have
potential in the HRI and
Retail Food Sectors.
- In 2009,

t
for EU cheese at
high-end HRI and
Retail Sectors.
the United States was
the first supplier
with a market
share of 42 percent.
- TPA*: 17 years linear,
2,500 MT quota with
12 percent
increase per year.
Confectionary – non
chocolate (HS 1704)
N/A
12,729
tons
($30.9 million
)
14.7
percent
0 percen
t
- Major suppliers
are Colombia
and Ecuador.
- Local industry is
strong.
Major owners are
foreign companies.
- United States
represents 2
percent of total
imports, however,
U.S. imports remained at
the same level in
2009. - TPA*:
Duty free on entry into
force.
Confection
ary – chocolate
(HS 1806)
N/A
3,239 tons
($10.9
million)
12.5
percent
0
percen
t
- Chile is the major
supplier (23percent
). - Local
industry is competitive
.
- The U.S. is the third
major supplier
with
15percent. The U.S.
strength is in chocolate
for the retail sector.

- TPA*: Duty free on
entry into force.
Apples
and Pears (HS 0808)
168,000 MT
51,211
tons (35
million)
16.5percent
0perce
nt
- Chile is
the major supplier
with 93 percent of
the market.
- The United
States is the third
largest supplier
with 3
percent of the
market.
- There is a
window of opportunity
for the United
States
between November
and February.
- TPA*: Duty free on
entry into force.
Grapes,
fresh (HS
080610)
207,000 MT
3,611 tons
($2.8
million)
62percent
0
percent
- Local
production
is strong. - Chile is a
major importer
(96 percent).
- Low imports.
- U.S.
window: September
to December.
- TPA*: Duty free on
entry into force.
Prime and choice
beef
(HS 020230)
Total beef
and offals
market:
268,924 MT
1,253
tons
($4.78 million
)
8.9perce
nt
0 percen
t
- Competes
with quality meats from
Argentina,
Uruguay, Brazil and
Bolivia.
- Currently
the market is
experiencing a shortage
of supplies. - TPA*:
Duty free on entry into
force.
Edible Beef Offals
180,000 MT
4,529 tons
HS 020621
0 percen
- Major supplier for
- The United States holds

(HS 020621,
020622)
($4.7 million
)
31percent
HS 020622
16.5percent
t
HS 020621 is Brazil
with 68 percent of
the market.
87 percent of the liver
import (020622)
market. - TPA*: 10
years linear, 800 MT
quota with 6 percent
increase.
Fruit and
Vegetable juices
(HS 2009)
N/A
12,557 hl
($2.1
million)
22 percent
9
percent
- Major suppliers
are the United
States (32percent
), Brazil
(27percent), and Chile
(21percent).
- TPA*:
Duty free on entry into
force, 5 and 10 years
linearly depending
on the product.
Pet foods (HS
230910)
38,80
0 MT
10,035
MT
($11.4
million)
17.6
percent
0 percen
t
- Growing
local pet industry.
- There is an informal
industry arising.
- Colombia 42
percent), and
Argentina (27
percent) are major
competitor
s.
- The United
States holds 27 percent
of the market, with
an 18 percent
increase from 2008.
- TPA*: duty free on
entry into force, or 5
years linearly for
canned pet
food.
Pasta (HS 1902)
300,0
00 tons
1,251
MT
($1.4
3.14 percent
0
percent
- Major
competitors are Italy
(25percent
- U.S. holds
23 percent of the
market and

million)
), Chile (15percent
),
is the second
largest supplier.
Imports increased by
38 percent in 2009.
- TPA*: duty free on
entry into force or
within 5
years.
Turkey
(HS 020725,
020726, 020727)
21,20
0 MT
4,171
tons
(5.45 million
)
HS 020725
37.8 percent,
HS 020726
0.5 percent,
HS
020727 25
percent
9
percent
- Major
exporters
are Brazil (44percent
) and Chile (31percent
) followed by the
United States with
26 percent. - Local
poultry industry is
strong.
- Peruvians
are major consumers
of turkey
during Christmas
and New Year’s.
- The food retail sector
is becoming more
popular not only in
Lima, but also in the
province. - TPA*: 5
years.
Poultry
meat cuts
(HS 020711,
020712)
$1,23
0 million
7,242 tons
($7.5
million)
40.5
percent
9
percen
t
- Strong local
industry. - Argentina
(35 percent
of the market),
Brazil (34 percent),
Chile (20 percent)
- Peruvians are major
consumers
of poultry. - TPA*: 10
years.

and Bolivia (12
percent) are major
exporters.
Bread,
pastry, cookies
(HS 1905)
N/A
3,644
tons ($7.9
million)
20 percent
0
percent
- Major suppliers
are the United
States (21 percent
market share),
Colombia (20
percent), Ecuador
(20
percent), Brazil (10
percent) and
Argentina (8 percent)
- TPA*: duty
free on entry into
force, 3 or 5 years.
Sauces,
soups & broths
(HS 2103, 2104)
N/A
5,752 tons
($10.9
7 million
)
HS 2103
6.8
percent, HS 2104
17.8 percent
9
percent
- Major
suppliers are the
United States (33
percent market
share), Chile (14
percent) Colombia
(13 percent).
China (11
percent) and Mexico
(9 percent)
- TPA*: duty free on
entry into
force except for soy
sauce and mustard (5
years).
Wine
21
7.3
12.4
percent
9
- Argentina
(47 percent
- There is a

(HS 2204) million liters
million liters
($20.5 million
)
percent
market share),
Chile (29 percent),
and Spain (11
percent) are major
exporters. - Strong
promotions.
- Only
regular wine
consumers recognize
U.S. wine quality.
niche market for
quality wines for
which the United
States can be
appreciated and price
competitive. - Peru’s
wine
consumption is growing.
- TPA*: 3 to 5 years
linear.
Note: TRQ = Tariff Rate Quota, on a first-come first-serve basis.
Sources: World Trade Atlas, USTR, Ministry of Agriculture (Minag), Gestion and El Comercio
Newspapers
B. Products not Present in Significant Quantities, but which have good sales Potential:
Product/
Import
Average
Annual
Import
Key
Constraints
Market

Product Category
s 2009
Import Growth
(2004-09)
Tariff Rate
Over Market Developmen
t
Attractiveness for the U.S.
Chicken
leg quarters
(HS 020713,
020714)
5,575 tons
($4.3
million)
41 percent
9 percent
- Strong Poultry
industry in
Peru. - The United
States’ major competitor is
Chile (81 percent of the
market),
- TPA*: 17
years, 12,000 MT quota with
8 percent increase; for
mechanically deboned meat
(MDM), 3 years.
- The sausage
industry demands the
product as a lower cost
ingredient. - Open market
for the United States since
April 2006. In 2009, the
United States held 20
percent of the market.
Peaches,
cherries and
Nectarines
(HS
0809)
1,798 tons
($1.4 million)
1.2
percent
9 percent
- Chile is major
supplier with 98 percent of
the market.
- Importers are
interested in U.S. peaches
and nectarines. - TPA*: Duty
free on entry
into force.
Nuts and almonds
(HS 0802)
277 tons
($1.2
million)
25 percent
9percen
t
- Chile (47 percent of the
market) is
the second largest
supplier.
- U.S. imports
have grown 783 percent in
respect to
2008. The United States
is the major supplier with

51percent of the market.
- Importers recognize that
U.S. quality of nuts and
almonds is better than
competitors. - TPA*: Duty
free on entry into force
except for
chestnut (5 years).
Grapes, raisins
(HS 080620)
6,322
tons
($7.6 million)
14 percent
9 percent
- There are no significant
imports from
the United States.
- Chile holds almost 100
percent of the market.
- U.S. window:
September to
December. - TPA*: Duty
free on entry into force.
Citrus (HS
0805)
56 tons
($0.04
million)
-15
percent
9 percent
- Chile is the
second major supplier with
44 percent of the market.
- The United States holds
49 percent of the market.
- Recognized
quality of U.S. oranges and
tangerines. - Export
window for the United States
is from January to March.
- TPA*: Duty free on entry
into force or 5 years.
Other fresh fruit
(HS 0810)
925
tons
($1 million)
34 percent
9 percent
- Chile is
practically the only supplier.
- Imports are mainly kiwi.
- The TPA will
open opportunities
for the United States not only
to export kiwis,

but also cranberries
(very well accepted in
juice), strawberries,
etc. - TPA*: Duty
free or 5 years
Pork Meat
(HS 0203)
1,251 tons
($2.2
million)
52 percent
9
percent
- Peruvians are not used
to eating pork.
- Local industry
produces more than
100,000 MT
- The industry is the same
as the poultry industry.
- Chile is the major
supplier with 93 percent of
the market. Canada has
begun to export (7
percent of the market).
- Pork imports are growing.
- U.S. pork will benefit from
TPA implementation
. - TPA*: 5
years
Sausages
(HS
1601)
394 tons
($1
million)
8.1
percent
9
percent
- Major
exporters are Chile (50
percent of the market),
Spain (13
percent), United States
(13 percent), Italy (9
percent), and Argentina (9
- There is a high-end
segment for gourmet
sausages, in
which the United States
can compete. - TPA*: 5
years

percent).
Ham, processed
HS 160241,
160242
62 tons
($0.71 million)
HS 160241
27 percent,
HAS160242 6
percent
9
percent
- Major
suppliers are Italy (54
percent of the market) and
Spain (33 percent).
- The United
States has
quality products to
introduce to the gourmet
market - TPA: 7 years
Beer
(HS 2203)
4.4
million liters
($2.8
million)
127
percent
9
percent
- Local
breweries are very strong
and owned by international
companies. - Local
breweries produce and
import new brands for
introduction in the
market.
Brazil is the major
supplier (52 percent of the
market).
- Niche market for premium
beers.
- Growing consumption of
beer (43 lts per capita)
- TPA: Duty free on entry
into force
Note: TRQ = Tariff Rate Quota, on a first-come first-serve basis.
Sources: World Trade Atlas, USTR, Ministry of Agriculture (Minag), Gestion and El Comercio
Newspapers
C. Products not Present because they Face Significant Barriers:
None.
Section V. Key Contacts and Further Information
If you have any question or comments regarding this report or need assistance exporting to Peru, please
contact the Foreign Agricultural Service in Lima at the following address:

U.S. Embassy Lima, Foreign Agricultural Service (FAS)
Mailing Address: Office of Agricultural Affairs, Unit 3785, APO AA 34031
Address: Av. La Encalada cdra. 17, Monterrico, Lima 33
Phone: (511) 434-3042
Fax: (511) 434-3043
E-mail: [email protected]
For further information, check the FAS web site www.fas.usda.gov or our web site
www.usdaperu.org.pe. Please, also refer to our other current food market related reports: Exporter
Guide, Food and Agricultural Import Regulations and Standards (FAIRS), FAIRS Export Certificate
and Retail Food Sector.
Ministry of Foreign Trade and Tourism (MINCETUR)
Minister: Eduardo Ferreyros Kuppers
Address: Calle Uno Oeste 050, Urb. Corpac, San Isidro, Lima 27
Phone: (511) 513-6100
Fax: (511) 224-3362
Web site: www.mincetur.gob.pe
Hotel and Restaurant Association (AHORA)
President: Fernando Puga
Address: Av. Benavides 881, Miraflores, Lima 18
Phone: (511) 444-4303
Fax: (511) 444-7825
E-mail: [email protected]
Web site: www.ahora-peru.com
American Chamber of Commerce (AmCham Peru)
Executive Director: Aldo Defilippi
Address: Av. Ricardo Palma 836, Miraflores, Lima 18
Phone: (511) 705-8000
Fax: (511) 241-0709
E-mail: [email protected]
Web site: www.amcham.org.pe
Author Defined: