pervaporation methodology2 for improving alcohol-free beer
TRANSCRIPT
1
1
Pervaporation methodology for improving alcohol-free beer through aroma recovering 2
3
4
5
By 6
7
Álvaro del Olmo1, Carlos A. Blanco1*, 8 Laura Palacio2, Pedro Prádanos2and Antonio Hernández2 9
10 11 12 13 14 15 16 (1) Dpto. Ingeniería Agrícola y Forestal (Área de Tecnología de los Alimentos) E.T.S. Ingenierías 17
Agrarias. Universidad de Valladolid, 34004 Palencia, Spain 18 (2) Grupo de superficies y Materiales porosos (SMAP, UA-UVA-CSIC), Dept. Física Aplicada, 19
Facultad de Ciencias, Universidad de Valladolid, Paseo de Belén, 47011 Valladolid, Spain 20 21 22 23 24 25 26 27 28 29 30 31 32 33 34 35 36 37 38 39 40 *Corresponding author 41 Phone: 34 79108359 42 e-mail: [email protected] 43
44
*ManuscriptClick here to view linked References
2
45
Abstract 46
Two different beers, a Special beer (5.5 % ABV) and a Reserve beer (6.5% ABV) were 47
pervaporated in order to recover aromas to be added to a low-alcohol beer (less than 1% ABV) 48
and an alcohol-free beer (less than 0.1% ABV) to improve their sensory quality. Sensory 49
analysis confirmed that this was accomplished. 50
Through the pervaporation process, three flavor constituents of beer (isobutyl alcohol, ethyl 51
acetate and isoamyl acetate) were analyzed in detail. Selectivities were roughly predicted by 52
an easy model based on the Hildebrand solubility parameters for the polymer and the species 53
in the solution. According to the model, a polymer will transmit a species almost perfectly if 54
their solubility parameters coincide. 55
This model helps to calculate the relative selectivities from solubility parameters and can 56
provide guidance when choosing the membrane for specific separation requirements in food 57
processing or other separation problems where pervaporation can be of great help. 58
59
60
61
62
63
64
Keywords 65
Membranes, Pervaporation, Beer, De-alcoholization, Aroma recovery 66
67
3
68
1. Introduction 69
Beer is obtained by the brewing and fermentation of starch (mainly derived from malted 70
barley) germinated in water in the presence of yeast. It is a traditional beverage and closely 71
linked to the Mediterranean culture (Olaniran et al., 2011). Recent studies have demonstrated 72
that a moderate consumption of beer produces beneficial effects on health (Nascentes et al., 73
2005). 74
Non-alcohol beer is a beer with very low or no alcohol content. Depending on legal regulations 75
in different countries, the required alcohol by volume (ABV) maximum thresholds are diverse. 76
In most of the EU countries beers with low alcohol content are divided into alcohol free beers, 77
less than or equal to 0.5% ABV, and low-alcohol beers with no more than 1.2% ABV. However, 78
in the United States alcohol-free beer means that there is no alcohol present, while 0.5% ABV 79
corresponds to the upper limit of so-called non-alcoholic beer or ‘‘near-beer’’ (Brányik et al., 80
2012). 81
The market of non-alcoholic brews has improved over the last five to ten years, mainly 82
because new driving/drinking rules, a healthier lifestyle and religious reasons. However, 83
alcohol-free and low-alcohol beers markedly differ in taste and flavor from regular beer. This 84
stems from a lack of flavor due to the elimination of ethanol and other alcohols, some 85
favorable compounds are missing because ethanol operates as a solvent and the risk of non-86
alcohol beer contamination with spoilage microorganisms increases as a result of the lack of 87
ethanol (Blanco et al., 2013). Therefore, it becomes important to bring the flavor of non-88
alcoholic beverages into line with that of their typical alcoholic counterparts. Despite recent 89
developments, there still seems to be a gap in the market waiting to be filled. 90
Habitual non-alcoholic brews, such as beer or wine, are produced by arresting fermentation. 91
During fermentation, yeasts produce by-products, such as higher alcohols and esters, making a 92
great contribution to the aroma and taste of the brew. If the fermentation is interrupted, the 93
flavor of the non-alcoholic brew does not improve unto the typical flavor of the alcoholic 94
brews (Kunze, 1999). There are other processes for producing non-alcoholic beverages, by 95
restricting the ethanol fermentation, such as the use of special or immobilized yeasts as well as 96
the use of low sugar raw materials (Lewis and Young, 1995; Pickering, 2000). 97
Alternatively, non-alcoholic beverages can be produced by removing the ethanol from a 98
completely fermented beverage. The most common separation techniques for beverage 99
dealcoholization are heat treatment or membrane-based processes (Catarino et al., 2007). 100
Heat treatment processes include evaporation and distillation or vapor stripping, in both cases 101
under vacuum conditions (Gómez-Plaza et al., 1999; Belisario et al., 2009). Membrane-based 102
processes include reverse osmosis (Labanda et al., 2009; López et al,. 2005; Pilipovik and 103
Riverol, 2005), nanofiltration (Verhoef et al., 2008), dialysis (Petkovska et al., 1997; Leskosek et 104
al., 1997) and pervaporation (Takacs et al., 2007). 105
Pervaporation is a process used to separate one or more compounds in a liquid using 106
semipermeable membranes in which the permeate exits as vapor in the low pressure 107
4
permeate side where there is vacuum, while the material retained remains as liquid (Feng and 108
Huang, 1997; Kimmerle and Gudernatsch, 1991). Permeate which is in vapor phase is then 109
condensed and would be reintroduced into de final product. The retentate keeps other 110
components and may be used by other process or recycled for further separation. 111
Pervaporation is one of the most effective membrane processes for aroma recovery in 112
beverages. Pervaporation membranes are very selective for several chemical groups important 113
in the aroma profiles of beverages (Shepherd et al., 2002; Sampranpiboon et al., 2000; Baudot 114
et al., 1999; Dobrak et al., 2010). During the last years, pervaporation has been successfully 115
applied for recovering aroma compounds from fruit juices (Figoli et al., 2009, Raisi and 116
Aroujalian, 2011; Pereira et al., 2002; Karlsson and Tragardh, 1997; Borjesson et al., 1996) for 117
subsequent addition to the same juice, after concentration by evaporation (Karlsson and 118
Tragardh, 1996; She and Hwang, 2006; García et al., 2008). Pervaporation has been also 119
applied, over the last few years, for ethanol removal (Verhoef et al., 2008; Takacs et al., 2007) 120
and aroma recovery from alcoholic beverages (Karlsson et al., 1996; Brazinha and Crespo, 121
2009). It has also been used in wine dealcoholization (Catarino and Mendes, 2011a). This 122
method has been used too in the process of developing non-alcohol beer (Kimmerle and 123
Gudernatsch, 1991). 124
Catarino tried to extract and analyze seven aromatic compounds characterizing the profile of a 125
beer by pervaporation (Catarino M. et al., 2009). The compounds analyzed were four 126
alcohols (ethanol, propanol, isobutanol and isoamyl alcohol), two esters (ethyl acetate 127
and isoamyl acetate) and an aldehyde (acetaldehyde). The ratio alcohol/ester increases with 128
increasing temperature and decreases with the feed rate and pressure (Catarino M. et al., 129
2009). 130
In 2010 Catarino produced non-alcohol beer extracting firstly the aromas by pervaporation 131
using POMS/PEI type membranes and then proceeding to dealcoholization by spinning cone 132
column distillation (SCC); the extracted aroma was reincorporated and subsequently both the 133
quality of the aroma and productivity of the process were assessed (Catarino and 134
Mendes, 2011b). 135
Pervaporation represents an alternative to the conventional separation processes, such as, 136
steam distillation, liquid solvent extraction and vacuum distillation. Their energy consumption 137
is normally lower and there is no need of chemical additives. Besides, they can be operated at 138
low temperatures, which is essential when sensitive aroma compounds are intended to be 139
separated (Pereira et al., 2005; Bluemke and Schrader, 2001; Raisi et al., 2008). 140
The aim of this work was to develop a non-alcoholic beer recovering flavors from regular beers 141
by pervaporation and incorporating them later to non-alcoholic beer. 142
143
1.1 Theory 144
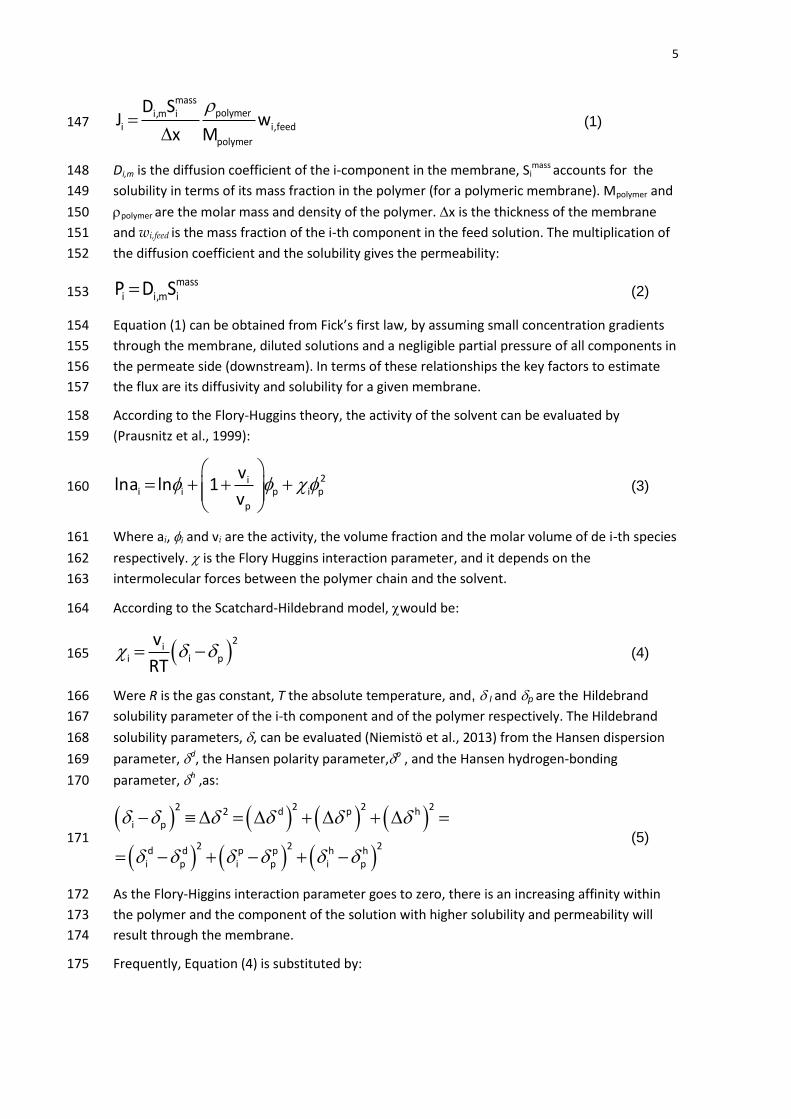
The flux of matter of an i-species through a pervaporation membrane can be described by a 145
solution-diffusion model (Lonsdale et al., 1965): 146
5
masspolymeri,m i
i i,feed
polymer
D SJ w
x M (1) 147
Di,m is the diffusion coefficient of the i-component in the membrane, Simass accounts for the 148
solubility in terms of its mass fraction in the polymer (for a polymeric membrane). Mpolymer and 149
polymer are the molar mass and density of the polymer. x is the thickness of the membrane 150
and wi,feed is the mass fraction of the i-th component in the feed solution. The multiplication of 151
the diffusion coefficient and the solubility gives the permeability: 152
massi i,m iP D S (2) 153
Equation (1) can be obtained from Fick’s first law, by assuming small concentration gradients 154
through the membrane, diluted solutions and a negligible partial pressure of all components in 155
the permeate side (downstream). In terms of these relationships the key factors to estimate 156
the flux are its diffusivity and solubility for a given membrane. 157
According to the Flory-Huggins theory, the activity of the solvent can be evaluated by 158
(Prausnitz et al., 1999): 159
2ii i p i p
p
vlna ln 1
v (3) 160
Where ai, i and vi are the activity, the volume fraction and the molar volume of de i-th species 161
respectively. is the Flory Huggins interaction parameter, and it depends on the 162
intermolecular forces between the polymer chain and the solvent. 163
According to the Scatchard-Hildebrand model, would be: 164
2
ii i p
v
RT (4) 165
Were R is the gas constant, T the absolute temperature, and, I and p are the Hildebrand 166
solubility parameter of the i-th component and of the polymer respectively. The Hildebrand 167
solubility parameters, , can be evaluated (Niemistö et al., 2013) from the Hansen dispersion 168
parameter, d, the Hansen polarity parameter,p , and the Hansen hydrogen-bonding 169
parameter, h ,as: 170
2 2 22 2 d p hi p
2 2 2d d p p h hi p i p i p
(5) 171
As the Flory-Higgins interaction parameter goes to zero, there is an increasing affinity within 172
the polymer and the component of the solution with higher solubility and permeability will 173
result through the membrane. 174
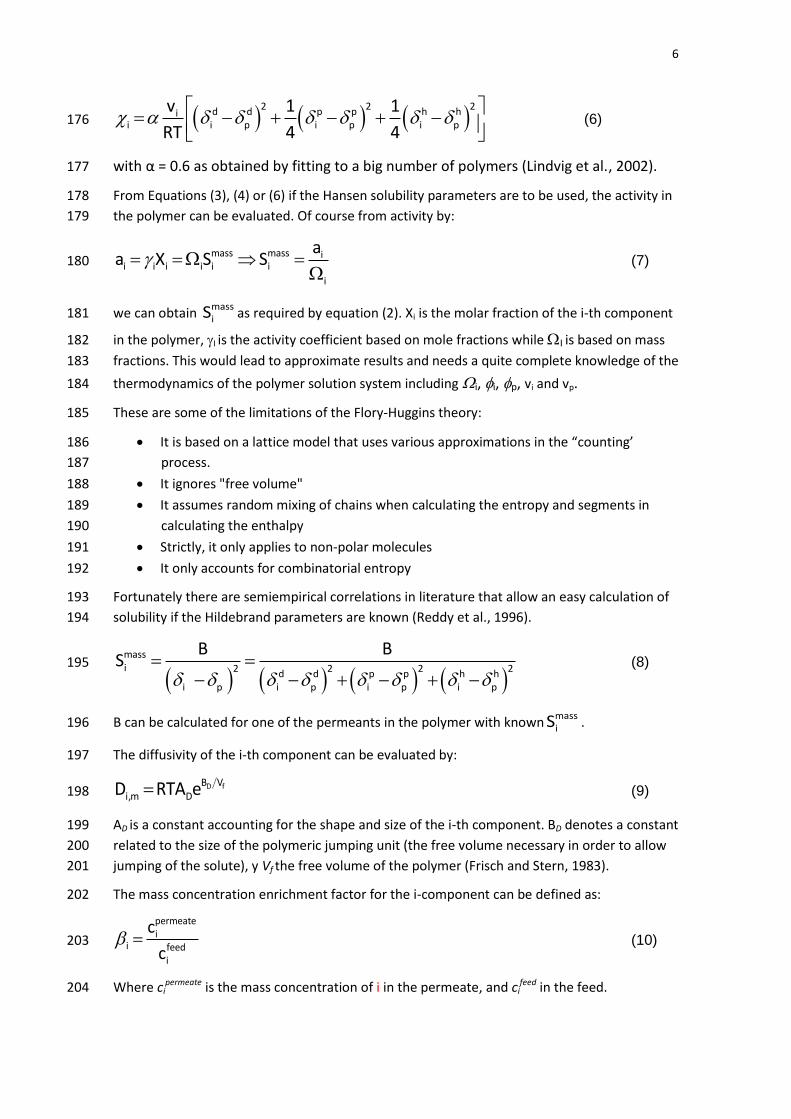
Frequently, Equation (4) is substituted by: 175
6
2 2 2d d p p h hi
i i p i p i p
v 1 1
RT 4 4
(6) 176
with α = 0.6 as obtained by fitting to a big number of polymers (Lindvig et al., 2002). 177
From Equations (3), (4) or (6) if the Hansen solubility parameters are to be used, the activity in 178
the polymer can be evaluated. Of course from activity by: 179
mass mass ii i i i i i
i
aa X S S
(7) 180
we can obtain massiS as required by equation (2). Xi is the molar fraction of the i-th component 181
in the polymer, I is the activity coefficient based on mole fractions while I is based on mass 182
fractions. This would lead to approximate results and needs a quite complete knowledge of the 183
thermodynamics of the polymer solution system including i, i, p, vi and vp. 184
These are some of the limitations of the Flory-Huggins theory: 185
It is based on a lattice model that uses various approximations in the “counting’ 186
process. 187
It ignores "free volume" 188
It assumes random mixing of chains when calculating the entropy and segments in 189
calculating the enthalpy 190
Strictly, it only applies to non-polar molecules 191
It only accounts for combinatorial entropy 192
Fortunately there are semiempirical correlations in literature that allow an easy calculation of 193
solubility if the Hildebrand parameters are known (Reddy et al., 1996). 194
massi 2 2 2 2d d p p h h
i p i p i p i p
B BS
(8) 195
B can be calculated for one of the permeants in the polymer with knownmassiS . 196
The diffusivity of the i-th component can be evaluated by: 197
D fB Vi,m DD RTA e (9) 198
AD is a constant accounting for the shape and size of the i-th component. BD denotes a constant 199
related to the size of the polymeric jumping unit (the free volume necessary in order to allow 200
jumping of the solute), y Vf the free volume of the polymer (Frisch and Stern, 1983). 201
The mass concentration enrichment factor for the i-component can be defined as: 202
permeatei
i feedi
c
c (10) 203
Where cipermeate is the mass concentration of i in the permeate, and ci
feed in the feed. 204
7
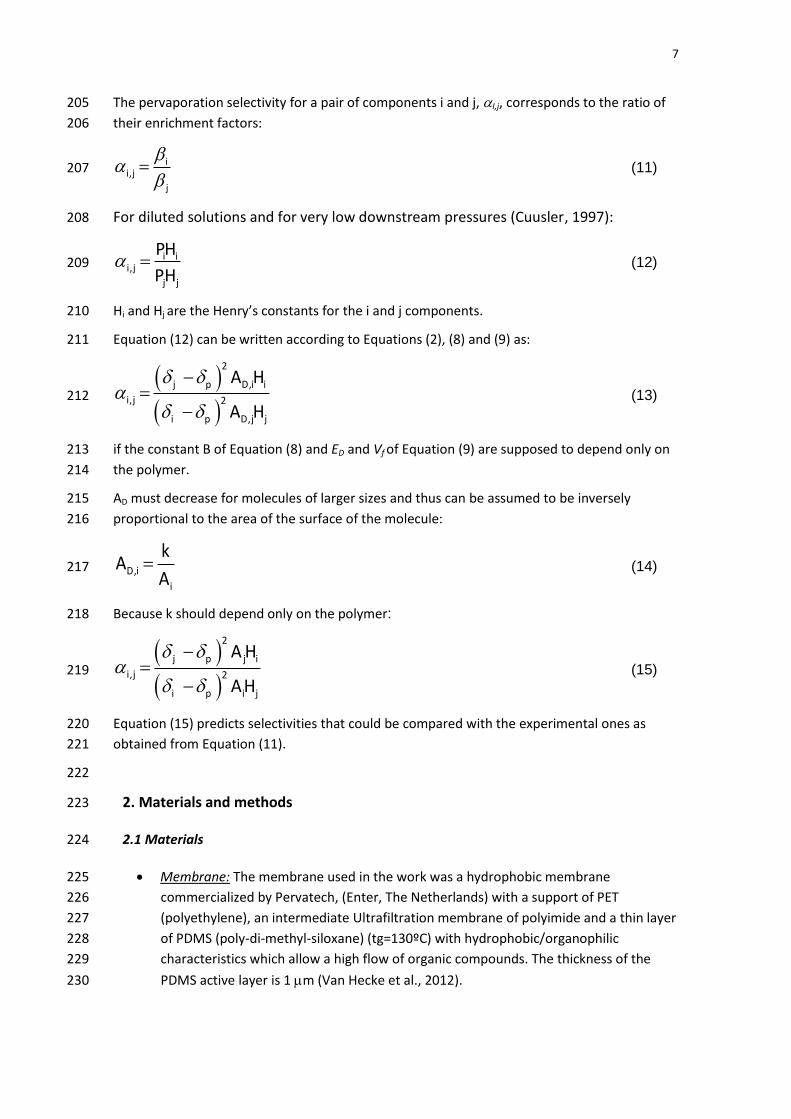
The pervaporation selectivity for a pair of components i and j, I,j, corresponds to the ratio of 205
their enrichment factors: 206
ii,j
j
(11) 207
For diluted solutions and for very low downstream pressures (Cuusler, 1997): 208
i ii,j
j j
PH
PH (12) 209
Hi and Hj are the Henry’s constants for the i and j components. 210
Equation (12) can be written according to Equations (2), (8) and (9) as: 211
2
j p D,i i
i,j 2
i p D,j j
A H
A H (13) 212
if the constant B of Equation (8) and ED and Vf of Equation (9) are supposed to depend only on 213
the polymer. 214
AD must decrease for molecules of larger sizes and thus can be assumed to be inversely 215
proportional to the area of the surface of the molecule: 216
D,i
i
kA
A (14) 217
Because k should depend only on the polymer: 218
2
j p j i
i,j 2
i p i j
A H
AH (15) 219
Equation (15) predicts selectivities that could be compared with the experimental ones as 220
obtained from Equation (11). 221
222
2. Materials and methods 223
2.1 Materials 224
Membrane: The membrane used in the work was a hydrophobic membrane 225
commercialized by Pervatech, (Enter, The Netherlands) with a support of PET 226
(polyethylene), an intermediate Ultrafiltration membrane of polyimide and a thin layer 227
of PDMS (poly-di-methyl-siloxane) (tg=130ºC) with hydrophobic/organophilic 228
characteristics which allow a high flow of organic compounds. The thickness of the 229
PDMS active layer is 1 m (Van Hecke et al., 2012). 230
8
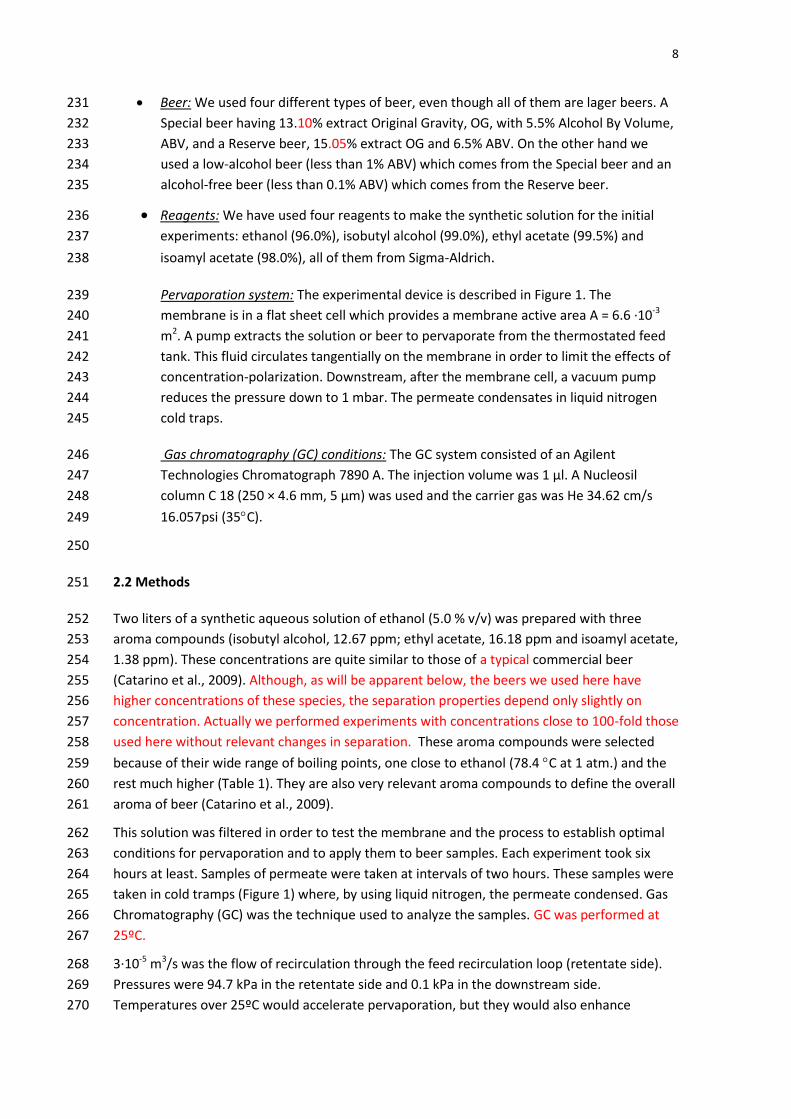
Beer: We used four different types of beer, even though all of them are lager beers. A 231
Special beer having 13.10% extract Original Gravity, OG, with 5.5% Alcohol By Volume, 232
ABV, and a Reserve beer, 15.05% extract OG and 6.5% ABV. On the other hand we 233
used a low-alcohol beer (less than 1% ABV) which comes from the Special beer and an 234
alcohol-free beer (less than 0.1% ABV) which comes from the Reserve beer. 235
Reagents: We have used four reagents to make the synthetic solution for the initial 236
experiments: ethanol (96.0%), isobutyl alcohol (99.0%), ethyl acetate (99.5%) and 237
isoamyl acetate (98.0%), all of them from Sigma-Aldrich. 238
Pervaporation system: The experimental device is described in Figure 1. The 239
membrane is in a flat sheet cell which provides a membrane active area A = 6.6 ·10-3 240
m2. A pump extracts the solution or beer to pervaporate from the thermostated feed 241
tank. This fluid circulates tangentially on the membrane in order to limit the effects of 242
concentration-polarization. Downstream, after the membrane cell, a vacuum pump 243
reduces the pressure down to 1 mbar. The permeate condensates in liquid nitrogen 244
cold traps. 245
Gas chromatography (GC) conditions: The GC system consisted of an Agilent 246
Technologies Chromatograph 7890 A. The injection volume was 1 μl. A Nucleosil 247
column C 18 (250 × 4.6 mm, 5 μm) was used and the carrier gas was He 34.62 cm/s 248
16.057psi (35C). 249
250
2.2 Methods 251
Two liters of a synthetic aqueous solution of ethanol (5.0 % v/v) was prepared with three 252
aroma compounds (isobutyl alcohol, 12.67 ppm; ethyl acetate, 16.18 ppm and isoamyl acetate, 253
1.38 ppm). These concentrations are quite similar to those of a typical commercial beer 254
(Catarino et al., 2009). Although, as will be apparent below, the beers we used here have 255
higher concentrations of these species, the separation properties depend only slightly on 256
concentration. Actually we performed experiments with concentrations close to 100-fold those 257
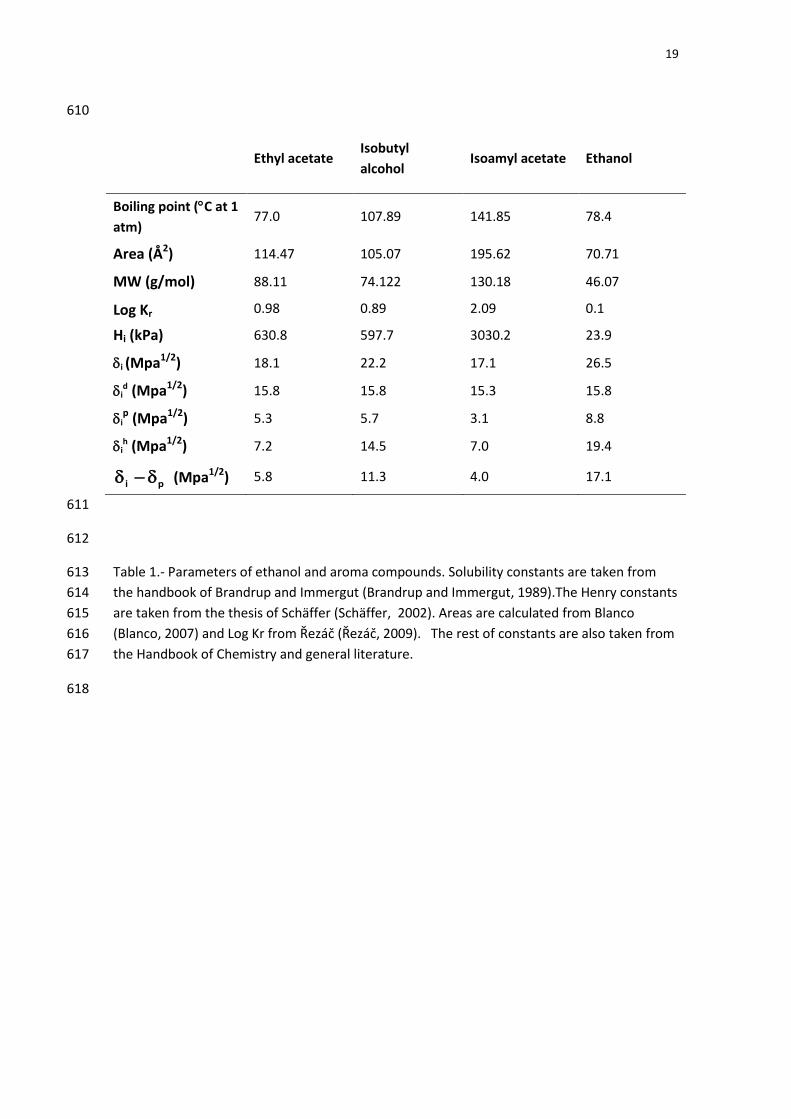
used here without relevant changes in separation. These aroma compounds were selected 258
because of their wide range of boiling points, one close to ethanol (78.4 C at 1 atm.) and the 259
rest much higher (Table 1). They are also very relevant aroma compounds to define the overall 260
aroma of beer (Catarino et al., 2009). 261
This solution was filtered in order to test the membrane and the process to establish optimal 262
conditions for pervaporation and to apply them to beer samples. Each experiment took six 263
hours at least. Samples of permeate were taken at intervals of two hours. These samples were 264
taken in cold tramps (Figure 1) where, by using liquid nitrogen, the permeate condensed. Gas 265
Chromatography (GC) was the technique used to analyze the samples. GC was performed at 266
25ºC. 267
3·10-5 m3/s was the flow of recirculation through the feed recirculation loop (retentate side). 268
Pressures were 94.7 kPa in the retentate side and 0.1 kPa in the downstream side. 269
Temperatures over 25ºC would accelerate pervaporation, but they would also enhance 270
9
evaporation in the feed and could cause denaturation of beer. Lower temperatures would slow 271
down the process. 272
In preliminary tests, the synthetic solution was pervaporated at different feed pressures 273
without any significant variation of flux. This would discard convective fluxes. Also 274
measurements at 80 ºC were performed with fluxes nearly 4 times those at 25ºC. This seems 275
to confirm that there is no convection and the solution-diffusion model should be appropriate 276
as used in common literature (Baudot et al., 1999; Borjesson et al., 1996;Dobrak et al., 2010) 277
for this polymer. 278
The flow rate used corresponds to a tangential speed of 1 m/s which allows considering 279
concentration polarization as negligible. The feed pressure is only slightly over the atmospheric 280
pressure and is determined by the recirculation flow rate, while the downstream pressure 281
gives a high enough gradient of concentration through the membrane. 282
Once optimum conditions for the experiment were reached, beer samples were pervaporated. 283
The duration of the tests was equal to those of the preview tests (6 hours), for the Special 284
Beer. In the case of Reserve Beer, each experiment took 8 hours due to its more aromatic 285
character. Samples of permeate were taken every two hours. Samples of feed, retentate and 286
permeate were taken to analyze their content of aroma compounds using GC. 287
We incorporated the recovered permeate into low-alcohol and alcohol-free beers to enrich 288
their flavor. The permeated solution is added into a non-alcoholic beer volume equal to the 289
volume of regular beer used to recover these aromas by pervaporation. 290
After enrichment, we checked by sensory evaluation if the enriched beers were preferred to 291
original non-alcohol beers. Sensory analysis of the beer samples was conducted in the sensory 292
analysis room of the Department of Agricultural and Forest Engineering (Food Technology 293
Area, University of Valladolid). The panel was composed of 10 assessors who had been trained 294
according to the Standard ISO 8586-1:1993 (ISO 8586-1, 1993). The panel evaluated different 295
beers with a wide variety of sensory characteristics as external appearance, smell or olfactory-296
gustatory sensations. After their training, the panel realized two tests, firstly the enriched 297
sample had to be distinguished from non-enriched samples, and, after this, they had to decide 298
which sample they preferred. The samples were presented to the tasters in glass cups and in 299
single cabins. 300
301
3. Results and Discussion 302
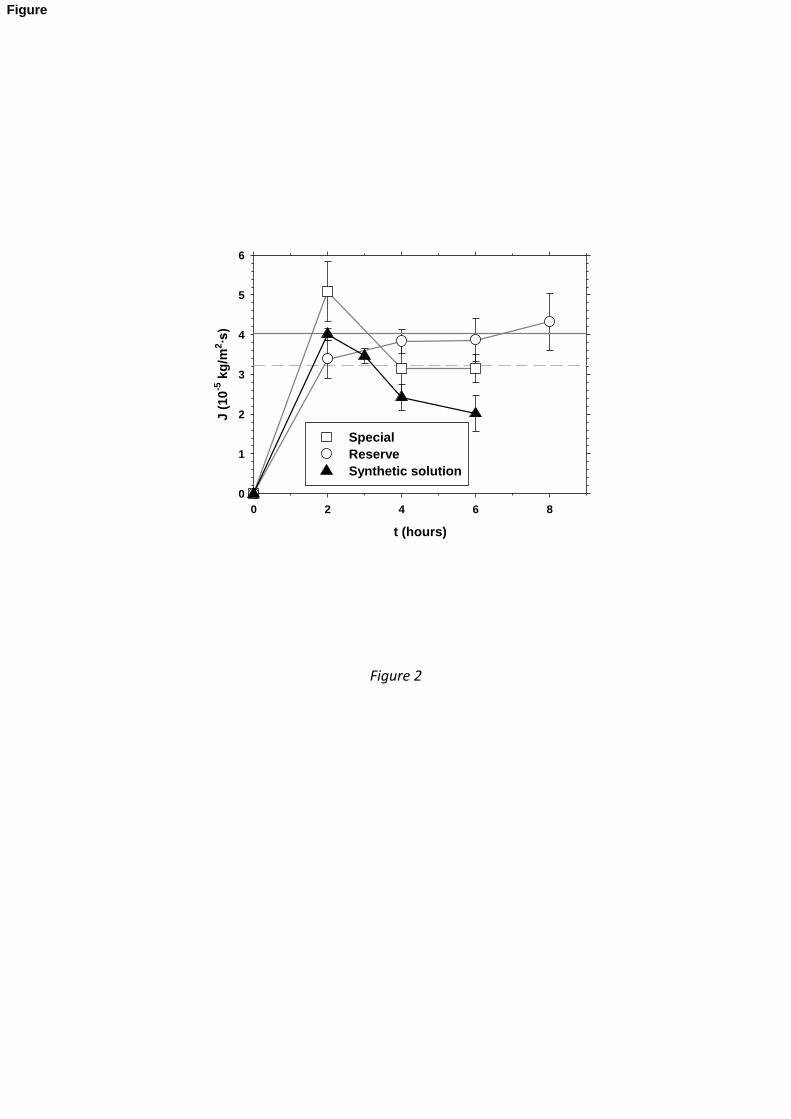
In Figure 2 the time evolution of the permeate for both the special and reserve beers and the 303
synthetic solutions are shown. The average fluxes for the two beers are shown as well. 304
For both the beers, the flux is more or less stable. For the Special beer, there is a higher flux at 305
the initial steps of the process probably due to its lower content of substances hindering the 306
transport of aromas. In fact, this beer has a lower free dry matter content than the Reserve 307
beer, as mentioned in section 2.1. The average and final flux are higher for the Reserve beer, 308
which has a larger concentration of volatile compounds than the Special beer. 309
10
The synthetic solution has similar flux evolution than the special beer possibly because they 310
have similar alcohol contents. Fluxes are slightly lower for the synthetic solution and they 311
decrease after the initial increase because its aroma contents are a lower and the decrease of 312
concentration is significant. A slower decay at long times appears also for the special beer 313
probably due to similar reasons. 314
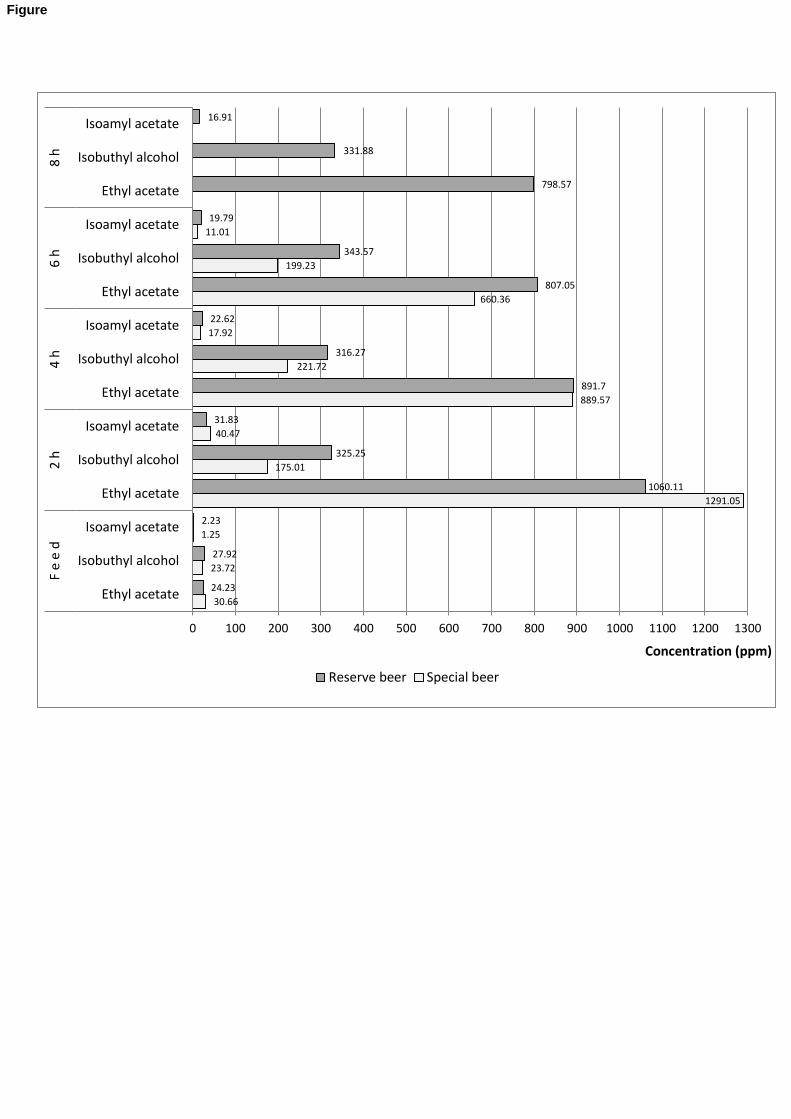
The consecutive average concentrations for the feed and permeate are shown in Figure 3. The 315
ethanol concentration in the permeate is quite similar for each beer along time. This seems 316
logic because the feed concentration of ethanol is constant for each beer. The average 317
concentration of ethanol in the permeate for the special beer is 3.90.8 g/L and 4.30.2 g/L for 318
the reserve beer. These data correspond to a very similar enrichment factor of ethanol in both 319
the beers and the synthetic solution; Ethanol=9.90.5. If the variation of ethanol in the beers is 320
evaluated we obtain 0.11% ABV for the special beer and 0.19% ABV for the reserve one. 321
Generally, recovery of compounds increases in Reserve beer because, as mentioned, Reserve 322
beer is usually more aromatic than Special beer. It is important to appreciate in this figure how 323
the recovered concentration of ethyl acetate decreases in each time slot for both beers. The 324
same holds true for isoamyl acetate. This is due to the decrease of the content of these 325
compounds in the feed with time. 326
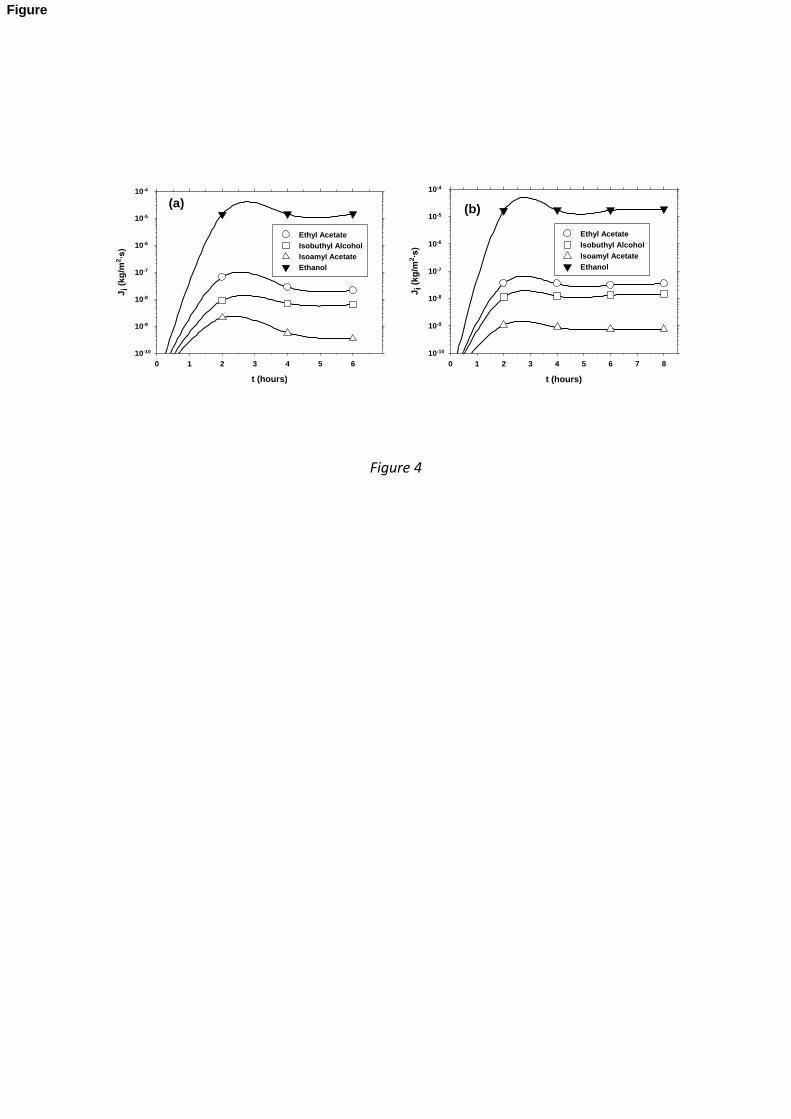
From data in Figures 2 and 3, the flux for each aroma can be evaluated as shown in Figure 4. 327
The flux of ethanol is almost constant and higher for the reserve beer as could be expected 328
due to its initial higher alcohol content. The alcohol flux is some orders of magnitude higher 329
than the corresponding flux for the aromas again due to their much slower concentration in 330
the feed. The highest flux corresponds to ethyl acetate for both beers. Initially for all the 331
aromas, and especially for ethyl acetate, there is a strong increase in flux followed by a 332
significant decrease and stabilization. In all cases flux is correlated with the initial 333
concentration of the aroma. 334
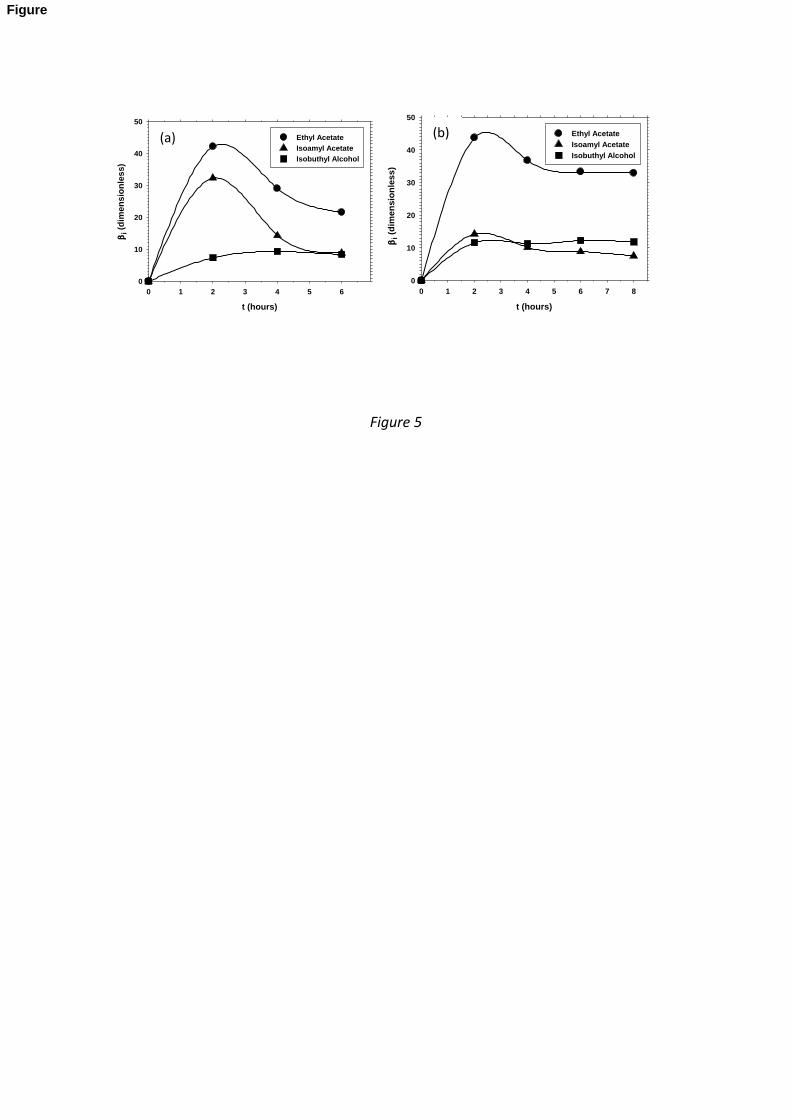
To avoid the influence of initial concentration, the mass concentration enrichment factor for 335
each component has been evaluated according to Equation (10). As can be seen in Figure 5, 336
the two most abundant aromas have actually a clear initial over-flux followed by a clear 337
stabilization. Ethyl acetate has the highest enrichment factor, while the other two aromas have 338
much lower enrichment factors and are quite similar for a long period of time in both beers. 339
To understand why enrichment is obtained the membrane-solute interaction has to be taken 340
into account. In our case the appropriate membrane must be hydrophobic in order to prevent 341
the passage of water, the main component of beer by far. The membrane selected showed an 342
ethanol/water selectivity over 15 for aqueous 5 % ethanol solution. 343
This strong hydrophobicity will hinder the transport of other polar species such as ethanol 344
against other less polar substances such as those responsible for the aroma in beer. This is 345
interesting in order to selectively retard the passage of ethanol. The compounds passed 346
through the membrane could then be incorporated into non-alcohol beer without requiring 347
ulterior separations to avoid an undesired increase of alcohol content. 348
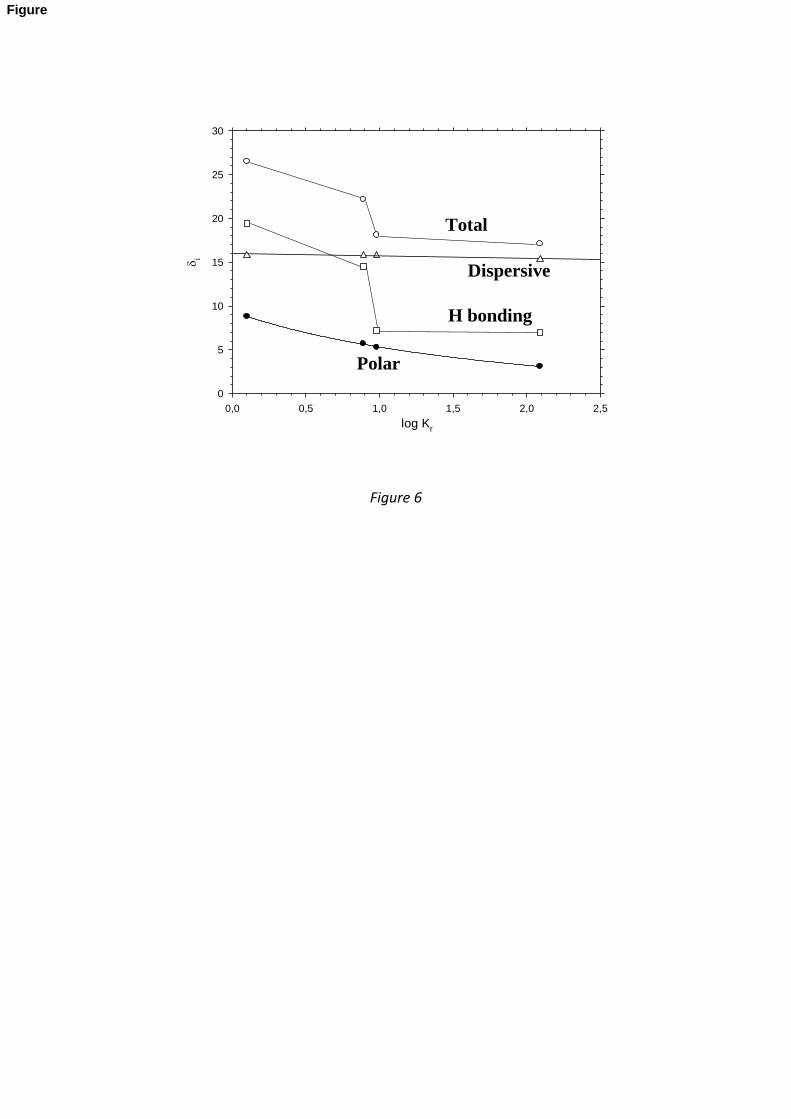
A relevant parameter to quantify the membrane-solute interactions is the partition coefficient 349
Kr . It is the ratio of concentrations of each species in non-polar and polar phases. Given that 350
this coefficient has a wide range of variation, a logarithmic scale is conventionally used, log Kr 351
11
(sometimes it is called log P, here we preferred to use log Kr to avoid possible confusions with 352
permeability). It was previously suggested (Blanco et al., en el 2007) that log Kr is correlated 353
with the molecular surface (Table 1) and with the affinity of this surface to each species. The 354
values obtained for log Kr are shown in Table 1. The compound with a higher log Kr would 355
dissolve better in the organic phase and thus would pervaporate better. As shown in Figure 6 356
the order for log Kr is the same as that based on the solubility parameters. As expected, the 357
polar solubility coefficient was particularly well correlated with log Kr . 358
As mentioned in the theory section, the flux of the flavor substances depends on the feed 359
concentration and their interaction with the membrane that determines their solubility 360
(Equation (8)) and diffusivity (Equation (9)) according to Equation (15). The selectivity can also 361
be evaluated from their mass concentration enrichment factors and Equation (11). 362
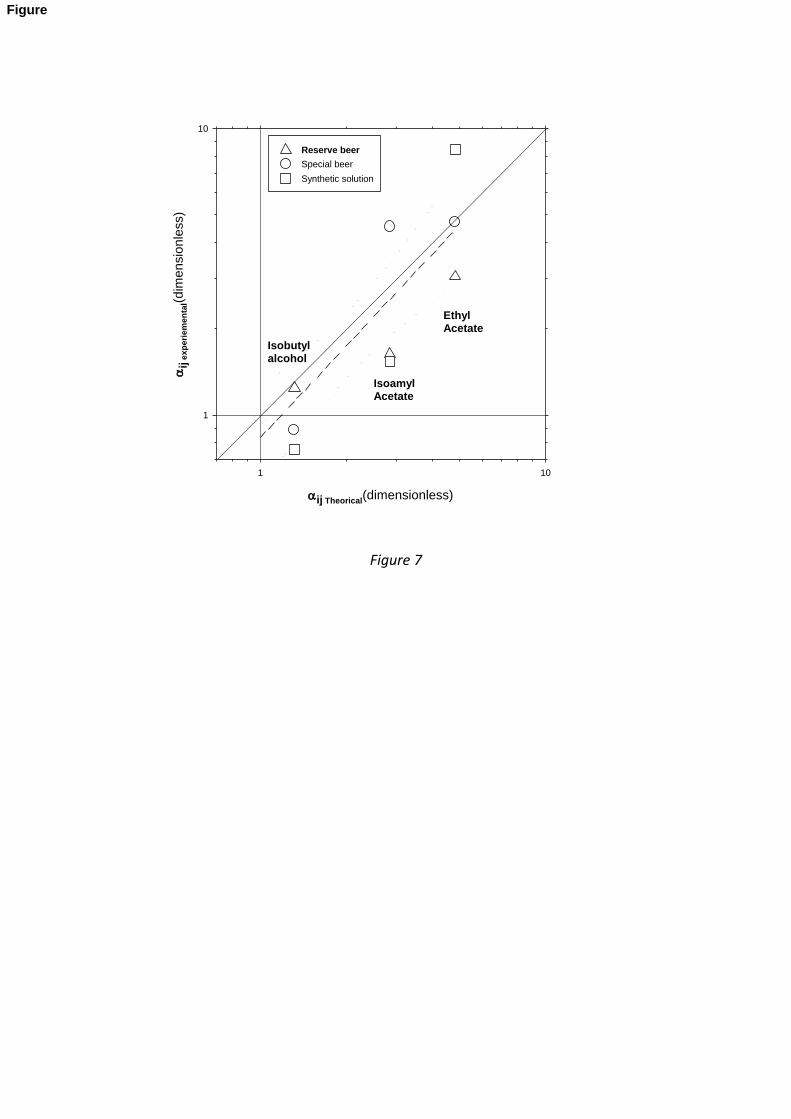
In Figure 7, the experimental selectivity (Equation (11)) is shown in relation to that of ethanol 363
in the synthetic solution and in the three beers studied compared to the theoretical selectivity 364
according to Equation (15). 365
Figure 7 shows the experimental tendency is in accordance with the theoretical one. Of course 366
the accordance is far from being accurate as should be if the points in this figure were on the 367
plotted bisecting line. Note there are many factors that have not been taken into account in 368
Equation (15), among them, for example, the interaction solute-solute which would be very 369
different in the three solutions studied. Hence, a perfect accordance could not be expected. In 370
any case, there can be no doubt that such a study can be useful to design and predict 371
performances in order to adopt an appropriate pervaporation procedure because the trend is 372
correctly predicted. 373
The membrane clearly shows a higher selectivity for ethyl acetate over ethanol. The same is 374
true for isoamyl acetate to a lower extent. Nevertheless its presence in the permeate is low 375
(Figure 3) due to its low concentration in the feed. In the figure it can be seen that both the 376
esters show a decreasing concentration in the permeate while isobutyl alcohol gives an almost 377
constant concentration. Which is due to its low solubility. 378
It is worth noting that the differences in j p between isobutyl alcohol and ethyl acetate or 379
isoamil acetate show that it could be less transported due to the contribution of hydrogen 380
bonds to solubility (see ih in Table 1). 381
Except for the special beer, isobutyl alcohol, exhibits a selectivity below 1. This means that a 382
significant recovering of this aroma would imply an appreciable passage of alcohol to the 383
permeate. Fortunately this is not too important because of its low impact on the flavor of beer 384
and sensations in mouth (also true for other high molecular weight alcohols) (García et al. 385
1994). 386
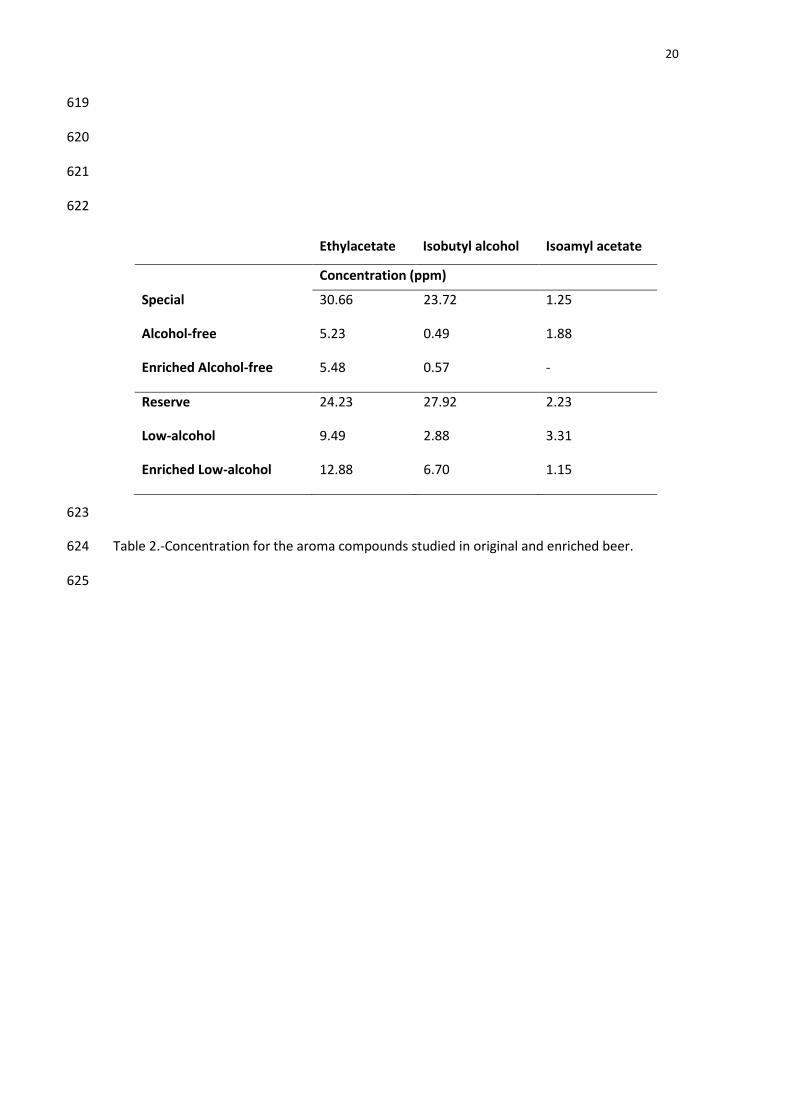
After adding the aroma compounds recovered by pervaporation from the alcoholic beers into 387 the original low-alcohol and alcohol-free original beers, they were analyzed by Gas 388 Chromatography (GC). Table 2 shows how the concentration of aroma compounds generally 389 increased in both reduced alcohol beers after aroma addition. In the case of isoamyl acetate, 390 its concentration in the beers (with or without alcohol) was so low that addition could not be 391 detected by GC. The increase in the alcohol content of the beers after addition of aromas was 392 also negligible. This corresponds to the loss of pervaporated beers that was already mentioned 393
12
to be 0.11 % for the special beer and 0.19% ABV for the reserve one. These small increases in 394 the alcohol degree keeps the enriched beers between the law requirements mentioned in the 395 introduction. 396
We can also see in Table 2 how the increase in the concentration of aroma compounds is 397
important in both beers. For instance, isobutyl alcohol in alcohol-free beer increases 16.33% in 398
the enriched beer, and ethyl acetate in low-alcohol beer increases 35.72% due to the 399
enrichment of this beer. 400
The increase of aroma compounds in enriched beers, shown in Table 2, has a high impact on 401 the sensorial properties of beers. Sensory evaluation was performed in two tests as mentioned 402 above, informing of a certain improvement in aroma. The preference test, showed that, 90% of 403 tasters preferred enriched low-alcohol beer instead of low-alcohol beer and 80% of tasters 404 preferred enriched alcohol-free beer instead of alcohol-free beer. These results can be 405 interpreted as a relevant improvement in quality of non-alcohol beers due to the addition of 406 the aroma compounds recovered by pervaporation. As can be seen in Table 2, the percentages 407 of the selected aroma compounds in the enriched beers are still far below those in the special 408 and reserve beers, further additions would increase even more the taste of the enriched beers 409 although the percentages reached clearly improve their flavour. 410 411
4. Conclusions 412
413 We have demonstrated that pervaporation can be used to recover aroma compounds in beer. 414
The addition of these aroma compounds to more or less de-alcoholized beer enriches their 415
flavor. This increases their appreciation and could be used to meet the quality standards 416
required by the market. 417
The relevance of the polymer of the membrane has been highlighted here. Note that according 418
to Equation (15) a polymer will transmit almost perfectly a species if their solubility parameters 419
coincide. A wise tuning of the polymer (or polymers) with the adequate solubility parameter 420
would allow us to obtain very selective membranes for a given (or several) volatile 421
components. In particular it is clear that similar feed concentrations are recovered to different 422
extents due to their different solubilities. 423
The theoretical approximate calculation of relative selectivities from solubility parameters can 424
help in the design of the process and the selection of the membrane in order to comply with 425
specific separation requirements. A good selection of the membrane material could be the key 426
to reaching higher productivities for aroma recovery in beer and other pervaporation 427
processes. 428
429
5. Acknowledgements 430 431
Financial support from Junta de Castilla y León (VA332A12-2) and from “Ministerio de Ciencia e 432
Innovación (MCINN)” (CTQ2009-07666, CTQ2012-31076 and MAT2011-25513) is gratefully 433
acknowledged. 434
The authors would like to express their gratitude to Hijos de Rivera S. A. for supplying the 435
beers used in this study. 436

13
437
6. References 438
Baudot A., Souchon I. & Marin M. (1999). Total permeate pressure influence on the 439
selectivity of the pervaporation of aroma compounds. Journal of Membrane 440
Science, 158 (1–2), 167–185. 441
Belisario-Sanchez Y. Y., Taboada-Rodriguez A. Marin-Iniesta F. & Lopez-Gomez A. 442
(2009).Dealcoholized wines by spinning cone column distillation: phenolic 443
compounds and antioxidant activity measured by the 1, 1-diphenyl-2-picrylhydrazyl 444
method. Journal Agric. Food Chemistry. 57 (15), 6770–6778. 445
Blanco C. A., Andrés-Iglesias C. & Monero O. (2013) Low-alcohol beers: Flavour 446
compounds, defects and improvement strategies. Critical Reviews in Food Science 447
and Nutrition. 448
Blanco C. A., Rojas A. & Nimubona D. (2007). Effects of acidity and molecular size 449
on bacteriostatic properties of beer hop derivates. Trends in Food Science & 450
Technology, 18, 144-149 451
Bluemke W. & Schrader J. (2001). Integrated bioprocess for enhanced production 452
of natural flavors and fragrances by Ceratocystismoniliformis. Biomolecular 453
Engineering, 17 (4–5), 137–142. 454
Borjesson J., Karlsson H.O.E & Tragardh G. (1996). Pervaporation of a model apple 455
juice aroma solution: comparison of membrane performance. Journal of 456
Membrane Science, 119 (2), 229–239. 457
Brandrup J. & Immergut E. H. (1989). Polymer handbook. 3ª edición, Wiley 458
Interscience, New York. 459
Brányik, T., Silva, D.P., Baszczyňski, M., Lehnert, R. &Almeida e Silva, J.B.(2012). A 460
review of methods of low alcohol and alcohol-free beer production.Journal of 461
FoodEngineering, 108, 493-506. 462
Brazinha C. & Crespo J. G. (2009). Aroma recovery from hydro alcoholic solutions 463
by organophilicpervaporation: modelling of fractionation by condensation. Journal 464
of Membrane Science, 341 (1–2), 109–121. 465
Catarino M., Ferreira A. & Mendes A. (2009). Study and optimization of aroma 466
recovery from beer by pervaporation. Journal of Membrane Science, 341, 51-59. 467
Catarino M. & Mendes A (2011a). Dealcoholizing wine by membrane separation 468
processes. Innovative Food Science & Emerging Technologies, 12, 330-337. 469
Catarino M. & Mendes A. (2011b). Non-alcoholic beer. A new industrial process. 470
Separation and Purification Technology, 79, 342-351. 471
14
Catarino M., Mendes A., Madeira L. M. & Ferreira A. (2007) Alcohol removal from 472
beer by reverse osmosis, Sep. Sci. Technology, 42 (13), 3011–3027. 473
Cuusler, E.L. (1997). Diffusion: Mass Transfer in Fluid Systems, Cambridge 474
University Press, Cambridge, UK. 475
Dobrak A., Figoli A., Chovau S., Galiano F., Simone S., Vankelecom I. F. J., Drioli E. & 476
Van der Bruggen B. (2010). Performance of PDMS membranes in pervaporation: 477
effect of silicalite fillers and comparison with SBS membranes. Journal of Colloid 478
Interface Science, 346 (1), 254–264. 479
Feng X. & Huang Y. M. (1997). Liquid Separation by Membrane Pervaporation: A 480
Review. Ind. Engineering Chemistry Res., 36, 1048-1066. 481
Figoli A., Tagarelli A., Cavaliere B., Voci C., Sindona G., Sikdar S. K. & Drioli E. (2009). 482
Evaluation of pervaporation process of kiwifruit juice by SPME-GC/Ion Trap Mass 483
Spectrometry. Desalination, 250, 1113-1117. 484
Frisch H. L. & Stern S. A. (1983). Diffusion of small molecules in polymers, Critical 485
Reviews in Solid State and Materials Sciences, 11:2, 123-187. 486
García V., Diban N., Gorri D., Keiski R., Urtiaga A. & Ortiz I. (2008). Separation and 487
concentration of bilberry impact aroma compound from dilute model solution by 488
pervaporation. Journal Chem. Technol. Biotechnol., 83 (7), 973–982. 489
García, A. I., García, L. A. & Díaz, M. (1994). Fusel Alcohols Production in Beer 490
Fermentation Processes. Process Biochemistry, 29, 303-309. 491
Gómez-Plaza E., Lopez-Nicolas J. M., Lopez-Roca J. M. & Martinez-Cutillas A. (1999). 492
Dealcoholization of wine. Behaviour of the aroma components during the process. 493
Lebensm. Wiss. Technology. 32 (6), 384–386. 494
ISO 8586-1 (1993). Sensory analysis. General guidance for the selection, training 495
and monitoring of assessors. Part 1: Selected assessors. International Organization 496
for Standardization. 497
Karlsson H. O. E. & Tragardh G. (1997). Aroma recovery during beverage 498
processing. Journal of Food Engineering 34 (2), 159–178. 499
Karlsson H.O.E. & Tragardh G. (1996). Applications of pervaporation in food 500
processing. Trends Food Science Technology, 7 (3), 78–83. 501
Karlsson H.O.E., Loureiro S. & Tragardh G. (1995). Aroma compound recovery with 502
pervaporation – temperature effects during pervaporation of a muscat wine. 503
Journal of Food Engineering, 26 (2), 177–191. 504
Kimmerle K. & Gudernatsch W. (1991). Pilot dealcoholization of beer by 505
pervaporation. Proceedings of fifth international conference on pervaporation 506
processes in the chemical industry, 291-307. 507
15
Kunze W. (1999). Technology Brewing and Malting, 2nd edition, VLB, Berlin. 508
Labanda J., Vichi S., Llorens J. & Lopez-Tamames E. (2009). Membrane separation 509
technology for the reduction of alcoholic degree of a white model wine. LWT Food 510
Science Technology 42 (8), 1390–1395. 511
Leskosek I., Nedovic V. & Petkovska M. (1997). Effect of convective mass transfer 512
on beer diafiltration. Journal of Institute of Brewering, 103 (5), 279–282. 513
Lewis M. J. & T.W. Young T. W. (1995). Brewing, 1st edition, Chapman & Hall, 514
London. 515
Lindvig T., Michelsen M. L., & Kontogeorgis G. M. (2002). A Flory–Huggins model 516
based on the Hansen solubility parameters, Fluid Phase Equilibria 203, 247–260 517
López M., Álvarez S., Riera F. A. & Álvarez R. (2002). Production of low alcohol 518
content apple cider by reverse osmosis. Ind. Eng. Chem. Res. 41 (25,) 6600–6606. 519
Lonsdale H. K., Merten U. & Riley R. L. (1965). Transport properties of cellulose 520
acetate osmotic membranes, Journal of Applied Polymer Science, 9(4) 1341–1362. 521
Nascentes C.C., Kamogawa M.Y., Fernandes K.G., Arruda M.A.Z., Nogueira A.R.A. & 522
Nobrega J.A. (2005). Direct determination of Cu, Mn, Pb and Zn in beer by 523
thermospray flame furnance atomic absorption spectrometry. SpectrochimActa 524
Part B 60:749–753 525
Niemistö J., Kujawski W. & Keisk R. L. (2013). Pervaporation performance of 526
composite poly(dimethyl siloxane) membrane for butanol recovery from model 527
solutions, Journal of Membrane Science, Volume 434, Pages 55-64 528
Olaniran A. O., Maharaj Y. R. & Pillay B. (2011). Effects of fermentation 529
temperature on the composition of beer volatile compounds, organoleptic quality 530
and spent yeast density. Electronic Journal of Biotechnology, 14. No.2. 531
Pereira C. C., Rufino J. R. M., Habert A. C., Nobrega R., Cabral L. M. C. & Borges C. P. 532
(2005). Aroma compounds recovery of tropical fruit juice by pervaporation: 533
membrane material selection and process evaluation. Journal of Food Engineering, 534
66 (1), 77–87. 535
Pereira C. C., Rufino J. M., Habert A. C., Nobrega R., Cabral L. M. C. & Borges C. P. 536
(2002). Membrane for processing tropical fruit juice. Desalination 148 (1–3), 57–537
60. 538
Petkovska M., Leskosek I. & Nedovic V. (1997). Analysis of mass transfer in beer 539
diafiltration with cellulose-based and polysulfone membranes. Food Bioprod. 540
Process, 75 (4), 247–252. 541
Pickering G. J. (2000) Low- and reduced-alcohol wine: a review. Journal Wine Res. 542
11 (2) 129–144. 543
16
Pilipovik M. V. & Riverol C. (2005). Assessing dealcoholization systems based on 544
reverse osmosis. Journal of Food Engineering, 69 (4), 437–441. 545
Prausnitz J. M., Lichtenthaler R. N. & E. Gomes de Azevedo E. (1999) Molecular 546
Thermodynamics of Fluid-Phase Equilibria, 3rd ed., Prentice Hall, Upper Saddle 547
River, New Jersey, USA. 548
Raisi A. & Aroujalian A. (2011). Aroma compound recovery by hydrophobic 549
pervaporation: The effect of membrane thickness and coupling phenomena. 550
Separation and Purification Technology 82, 53-62. 551
Raisi A., Aroujalian A. & Kaghazchi T. (2008). Multicomponent pervaporation 552
process for volatile aroma compounds recovery from pomegranate juice. Journal of 553
Membrane Science, 322 (2), 339–348. 554
Reddy K. K., Kawakatsu T., Snape J. B. & Nakajima M. (1996). Membrane 555
concentration and separation of L-aspartic acid and l-phenylalanine derivatives in 556
organic-solvents, Separation science and technology, 31(8), 1161-1178. 557
Řezáč J., Fanfrlík J., Salahub D. & Hobza P. (2009). Semiempirical quantum chemical 558
pm6 method augmented by dispersion and h-bonding correction terms reliably 559
describes various types of noncovalent complexes. Journal of Chemical Theory and 560
Computation, 5 (7), 1749–1760 561
Sampranpiboon P., Jiraratananon R., Uttapap D., Feng X. & R.Y.M. Huang R. Y. M. 562
(2000). Separation of aroma compounds from aqueous solutions by pervaporation 563
using polyoctylmethylsiloxane (POMS) and polydimethylsiloxane (PDMS) 564
membranes. Journal of Membrane Science, 174 (1), 55–65. 565
Schäffer T. (2002). Recovery of wine-must aroma by pervaporation, Doctoral Thesis, 566
Lisboa. 567
She M. & Hwang S. T. (2006). Recovery of key components from real flavour 568
concentrates by pervaporation. Journal of Membrane Science, 279 (1–2), 86–93. 569
Shepherd A., Habert A. C. & Borges C. P. (2002). Hollow fibre modules for orange 570
juice aroma recovery using pervaporation. Desalination, 148 (1–3), 111–114. 571
Takacs L., Vatai G. & Korany K. (2007). Production of alcohol free wine by 572
pervaporation. Journal of Food Engineering, 78 (1), 118–125. 573
Van Hecke W, Vandezande P, Claes S, Vangeel S, Beckers H, Diels L & De Wever H. 574
(2012). Integrated bioprocess for long-term continuous cultivation of Clostridium 575
acetobutylicum coupled to pervaporation with PDMS composite membranes. 576
Bioresour Technology, 111, 368-77 577
578
579
580

17
581
18
Figure and table captions 582
583
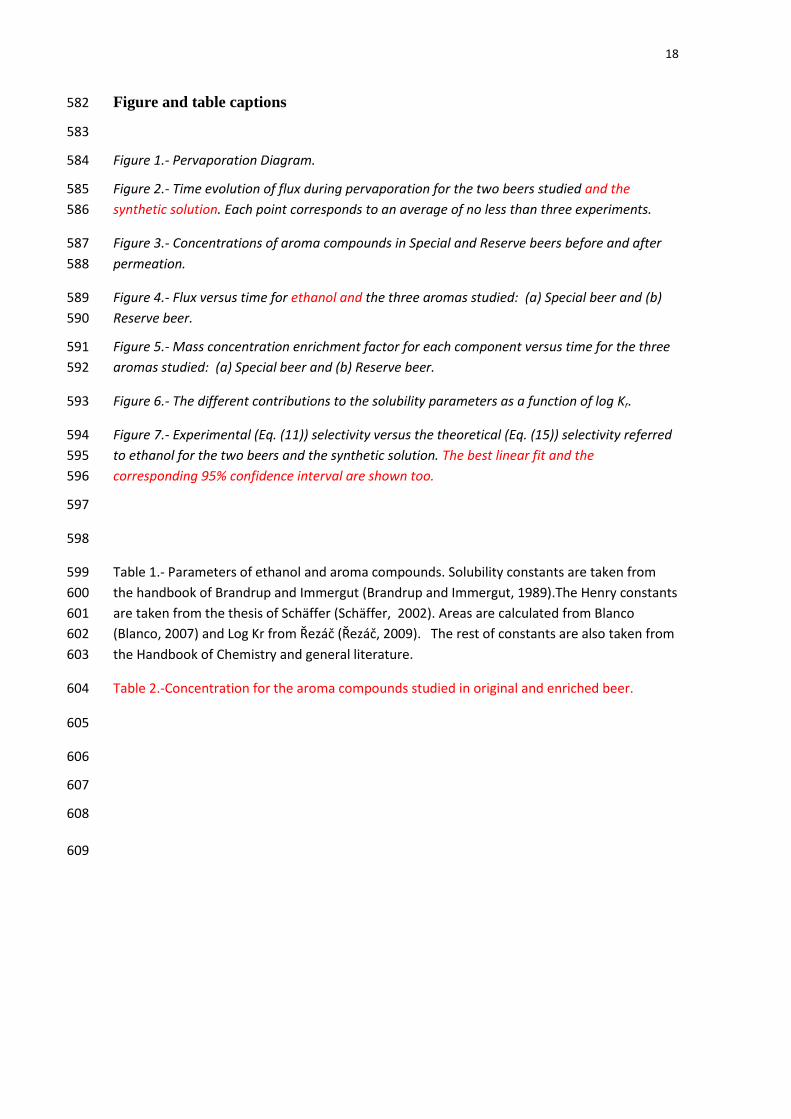
Figure 1.- Pervaporation Diagram. 584
Figure 2.- Time evolution of flux during pervaporation for the two beers studied and the 585
synthetic solution. Each point corresponds to an average of no less than three experiments. 586
Figure 3.- Concentrations of aroma compounds in Special and Reserve beers before and after 587
permeation. 588
Figure 4.- Flux versus time for ethanol and the three aromas studied: (a) Special beer and (b) 589
Reserve beer. 590
Figure 5.- Mass concentration enrichment factor for each component versus time for the three 591
aromas studied: (a) Special beer and (b) Reserve beer. 592
Figure 6.- The different contributions to the solubility parameters as a function of log Kr. 593
Figure 7.- Experimental (Eq. (11)) selectivity versus the theoretical (Eq. (15)) selectivity referred 594
to ethanol for the two beers and the synthetic solution. The best linear fit and the 595
corresponding 95% confidence interval are shown too. 596
597
598
Table 1.- Parameters of ethanol and aroma compounds. Solubility constants are taken from 599
the handbook of Brandrup and Immergut (Brandrup and Immergut, 1989).The Henry constants 600
are taken from the thesis of Schäffer (Schäffer, 2002). Areas are calculated from Blanco 601
(Blanco, 2007) and Log Kr from Řezáč (Řezáč, 2009). The rest of constants are also taken from 602
the Handbook of Chemistry and general literature. 603
Table 2.-Concentration for the aroma compounds studied in original and enriched beer. 604
605
606
607
608
609
19
610
Ethyl acetate Isobutyl
alcohol Isoamyl acetate Ethanol
Boiling point (C at 1
atm) 77.0 107.89 141.85 78.4
Area (Å2) 114.47 105.07 195.62 70.71
MW (g/mol) 88.11 74.122 130.18 46.07
Log Kr 0.98 0.89 2.09 0.1
Hi (kPa) 630.8 597.7 3030.2 23.9
i(Mpa1/2) 18.1 22.2 17.1 26.5
id(Mpa1/2) 15.8 15.8 15.3 15.8
ip (Mpa1/2) 5.3 5.7 3.1 8.8
ih (Mpa1/2) 7.2 14.5 7.0 19.4
i p (Mpa1/2) 5.8 11.3 4.0 17.1
611
612
Table 1.- Parameters of ethanol and aroma compounds. Solubility constants are taken from 613
the handbook of Brandrup and Immergut (Brandrup and Immergut, 1989).The Henry constants 614
are taken from the thesis of Schäffer (Schäffer, 2002). Areas are calculated from Blanco 615
(Blanco, 2007) and Log Kr from Řezáč (Řezáč, 2009). The rest of constants are also taken from 616
the Handbook of Chemistry and general literature. 617
618
20
619
620
621
622
Ethylacetate Isobutyl alcohol Isoamyl acetate
Concentration (ppm)
Special 30.66 23.72 1.25
Alcohol-free 5.23 0.49 1.88
Enriched Alcohol-free 5.48 0.57 -
Reserve 24.23 27.92 2.23
Low-alcohol 9.49 2.88 3.31
Enriched Low-alcohol 12.88 6.70 1.15
623
Table 2.-Concentration for the aroma compounds studied in original and enriched beer. 624
625
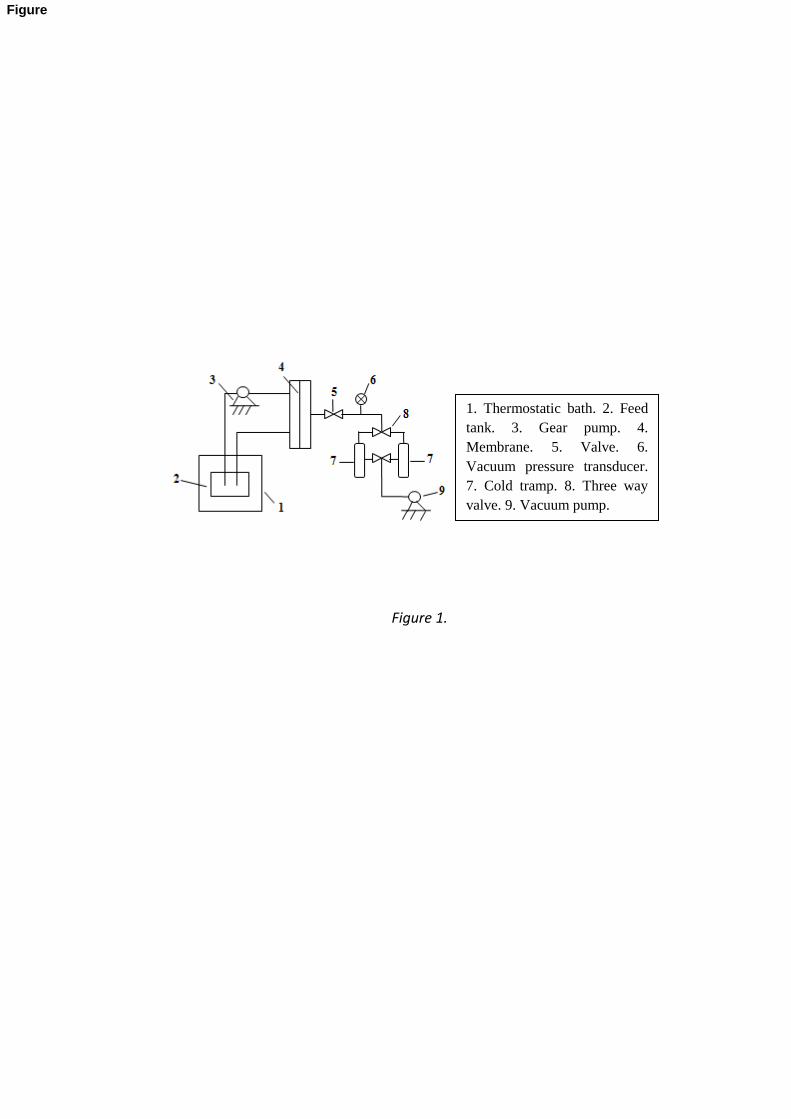
Figure 1.
1. Thermostatic bath. 2. Feed
tank. 3. Gear pump. 4.
Membrane. 5. Valve. 6.
Vacuum pressure transducer.
7. Cold tramp. 8. Three way
valve. 9. Vacuum pump.
Figure
t (hours)
0 2 4 6 8
J (
10
-5 k
g/m
2·s
)
0
1
2
3
4
5
6
Special
Reserve
Synthetic solution
Figure 2
Figure
30.66
23.72
1.25
1291.05
175.01
40.47
889.57
221.72
17.92
660.36
199.23
11.01
24.23
27.92
2.23
1060.11
325.25
31.83
891.7
316.27
22.62
807.05
343.57
19.79
798.57
331.88
16.91
0 100 200 300 400 500 600 700 800 900 1000 1100 1200 1300
Ethyl acetate
Isobuthyl alcohol
Isoamyl acetate
Ethyl acetate
Isobuthyl alcohol
Isoamyl acetate
Ethyl acetate
Isobuthyl alcohol
Isoamyl acetate
Ethyl acetate
Isobuthyl alcohol
Isoamyl acetate
Ethyl acetate
Isobuthyl alcohol
Isoamyl acetate
F e
e d
2 h
4 h
6 h
8 h
Concentration (ppm)
Reserve beer Special beer
Figure
t (hours)
0 1 2 3 4 5 6
Ji (k
g/m
2·s
)
10-10
10-9
10-8
10-7
10-6
10-5
10-4
Ethyl Acetate
Isobuthyl Alcohol
Isoamyl Acetate
Ethanol
(a)
t (hours)
0 1 2 3 4 5 6 7 8
Ji (k
g/m
2·s
)
10-10
10-9
10-8
10-7
10-6
10-5
10-4
Ethyl Acetate
Isobuthyl Alcohol
Isoamyl Acetate
Ethanol
(b)
Figure 4
Figure
t (hours)
0 1 2 3 4 5 6
i(d
ime
ns
ion
les
s)
0
10
20
30
40
50
Ethyl Acetate
Isoamyl Acetate
Isobuthyl Alcohol
t (hours)
0 1 2 3 4 5 6 7 8
i (d
ime
ns
ion
les
s)
0
10
20
30
40
50
Ethyl Acetate
Isoamyl Acetate
Isobuthyl Alcohol
Figure 5
(a) (b)
Figure
log Kr
0,0 0,5 1,0 1,5 2,0 2,5
i
0
5
10
15
20
25
30
H bonding
Total
Dispersive
Polar
Figure 6
Figure
ij Theorical(dimensionless)
1 10
ij
ex
pe
rie
me
nta
l(d
ime
nsio
nle
ss)
1
10
Reserve beer
Special beer
Synthetic solution
Isobutylalcohol
IsoamylAcetate
EthylAcetate
Figure 7
Figure