peter bajcsy, ph.d. research scientist adjunct assistant professor, cs department, uiuc automated...
TRANSCRIPT

Peter Bajcsy, Ph.D.Research ScientistAdjunct Assistant Professor, CS Department, UIUC
Automated Learning GroupNational Center for Supercomputing ApplicationsUniversity of Illinois
Supercomputing 2002
Introduction to Data Mining

alg | Automated Learning Group
Course Overview
• Introduction to Knowledge Discovery in Databases and Data Mining• Why Data Mining? What is Data Mining? On What Kind of Data?
• Applications of Data Mining• Application Domains and Examples
• Knowledge Discovery in Databases and Data Mining Process• Processing Steps• Data Quality, Preparation, and Transformations
• Data Mining Tools• D2K, SAS, Clementine, Intelligent Miner, Insightful Miner, K-Wiz
• Data Mining Methods• Association Rules• Decision Trees• Information Visualization
• Summary

alg | Automated Learning Group
Acknowledgement
• Contributions:• Michael Welge, Loretta Auvil, Lisa Gatzke, Automated Learning
Group, National Center for Supercomputing Applications (NCSA), University of Illinois at Urbana-Champaign
• Jiawei Han, Computer Science, University of Illinois at Urbana-Champaign

alg | Automated Learning Group
Literature
Data Mining – Concepts and Techniques by J. Han & M. Kamber, Morgan Kaufmann Publishers, 2001
Pattern Classification by R. Duda, P. Hart and D. Stork, 2nd edition, John Wiley & Sons, 2001

alg | Automated Learning Group
Introduction to Knowledge Discovery in Databases and Data Mining

alg | Automated Learning Group
Computational Knowledge Discovery
alg | Automated Learning Group
Terminology
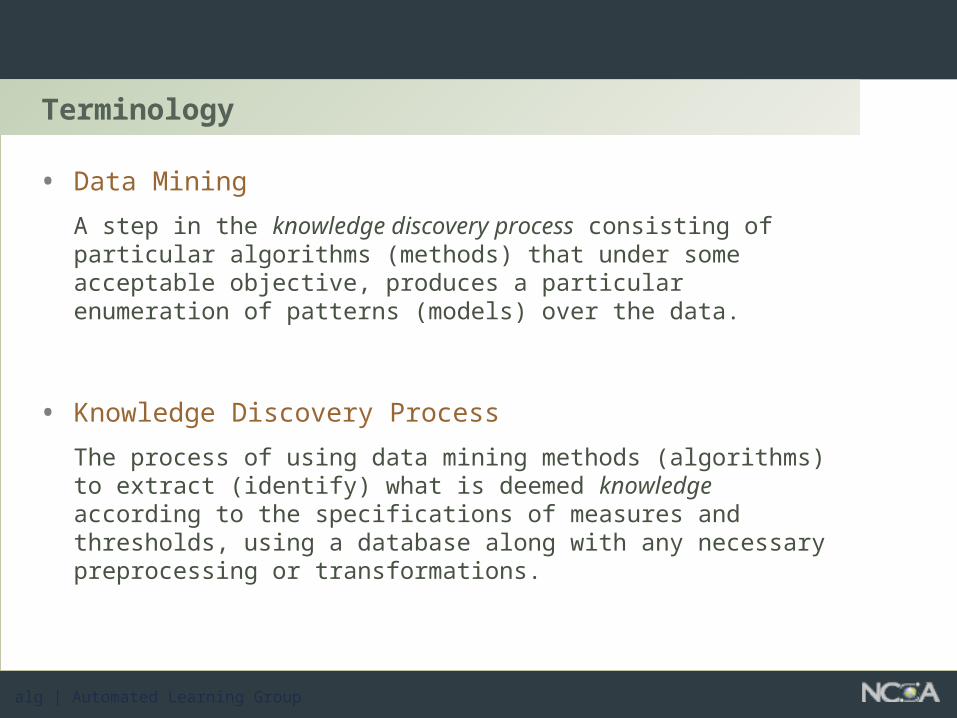
• Data Mining
A step in the knowledge discovery process consisting of particular algorithms (methods) that under some acceptable objective, produces a particular enumeration of patterns (models) over the data.
• Knowledge Discovery Process
The process of using data mining methods (algorithms) to extract (identify) what is deemed knowledge according to the specifications of measures and thresholds, using a database along with any necessary preprocessing or transformations.

alg | Automated Learning Group
Terminology - A Working Definition
• Data Mining is a “decision support” process in which we search for patterns of information in data.
• Data Mining is a process of discovering advantageous patterns in data.
• A pattern is a conservative statement about a probability distribution.
• Webster: A pattern is (a) a natural or chance configuration, (b) a reliable sample of traits, acts, tendencies, or other observable characteristics of a person, group, or institution

alg | Automated Learning Group
Data Mining: On What Kind of Data?
• Relational Databases
• Data Warehouses
• Transactional Databases
• Advanced Database Systems• Object-Relational• Spatial and Temporal• Time-Series• Multimedia• Text• Heterogeneous, Legacy, and Distributed• WWW
Structure - 3D Anatomy
Function – 1D Signal
Metadata – Annotation

alg | Automated Learning Group
Data Mining: Confluence of Multiple Disciplines
?
20x20 ~ 2^400 10^120 patterns

alg | Automated Learning Group
Why Do We Need Data Mining ?
• Data volumes are too large for classical analysis approaches:• Large number of records (108 – 1012 bytes)• High dimensional data ( 102 – 104 attributes)
How do you explore millions of records, tens or hundreds of fields, and find patterns?

alg | Automated Learning Group
Why Do We Need Data Mining ?
• Leverage organization’s data assets• Only a small portion (typically - 5%-10%) of the collected data is
ever analyzed
• Data that may never be analyzed continues to be collected, at a great expense, out of fear that something which may prove important in the future is missing.
• Growth rates of data precludes traditional “manually intensive” approach

alg | Automated Learning Group
Why Do We Need Data Mining?
• As databases grow, the ability to support the decision support process using traditional query languages becomes infeasible
• Many queries of interest are difficult to state in a query language (Query formulation problem)
• “find all cases of fraud”
• “find all individuals likely to buy a FORD expedition”
• “find all documents that are similar to this customers problem”
QUERY
RESULT
(Latitude, Longitude)1
(Latitude, Longitude)2

alg | Automated Learning Group
What is It?
Knowledge Discovery in Databases is the non-trivial process of identifying valid, novel, potentially useful, and ultimately understandable patterns in data.
• The understandable patterns are used to:• Make predictions or classifications about new data• Explain existing data• Summarize the contents of a large database to support decision
making• Graphical data visualization to aid humans in discovering deeper
patterns

alg | Automated Learning Group
Applications of Data Mining

alg | Automated Learning Group
Data Mining Applications
• Market analysis
• Risk analysis and management
• Fraud detection and detection of unusual patterns (outliers)
• Text mining (news group, email, documents) and Web mining
• Stream data mining
• DNA and bio-data analysis
alg | Automated Learning Group
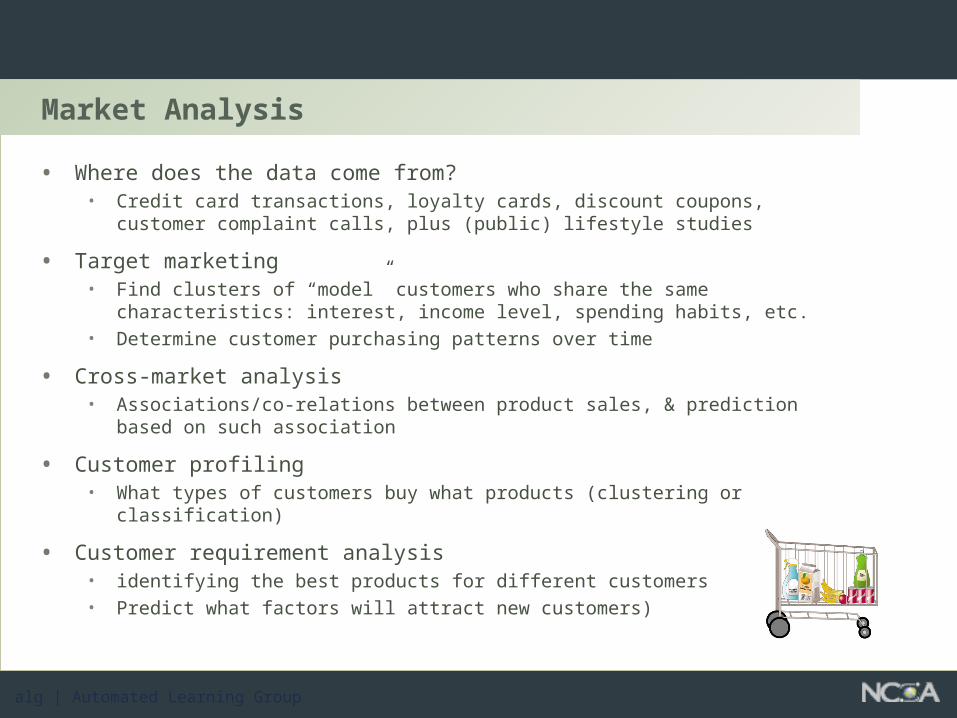
Market Analysis
• Where does the data come from?• Credit card transactions, loyalty cards, discount coupons, customer
complaint calls, plus (public) lifestyle studies
• Target marketing• Find clusters of “model” customers who share the same characteristics:
interest, income level, spending habits, etc.• Determine customer purchasing patterns over time
• Cross-market analysis• Associations/co-relations between product sales, & prediction based on
such association
• Customer profiling• What types of customers buy what products (clustering or classification)
• Customer requirement analysis• identifying the best products for different customers• Predict what factors will attract new customers)

alg | Automated Learning Group
Corporate Analysis & Risk Management
• Finance planning and asset evaluation• cash flow analysis and prediction• contingent claim analysis to evaluate assets • cross-sectional and time series analysis (financial-ratio, trend analysis, etc.)
• Resource planning• summarize and compare the resources and spending
• Competition• monitor competitors and market directions • group customers into classes and a class-based pricing procedure• set pricing strategy in a highly competitive market
alg | Automated Learning Group
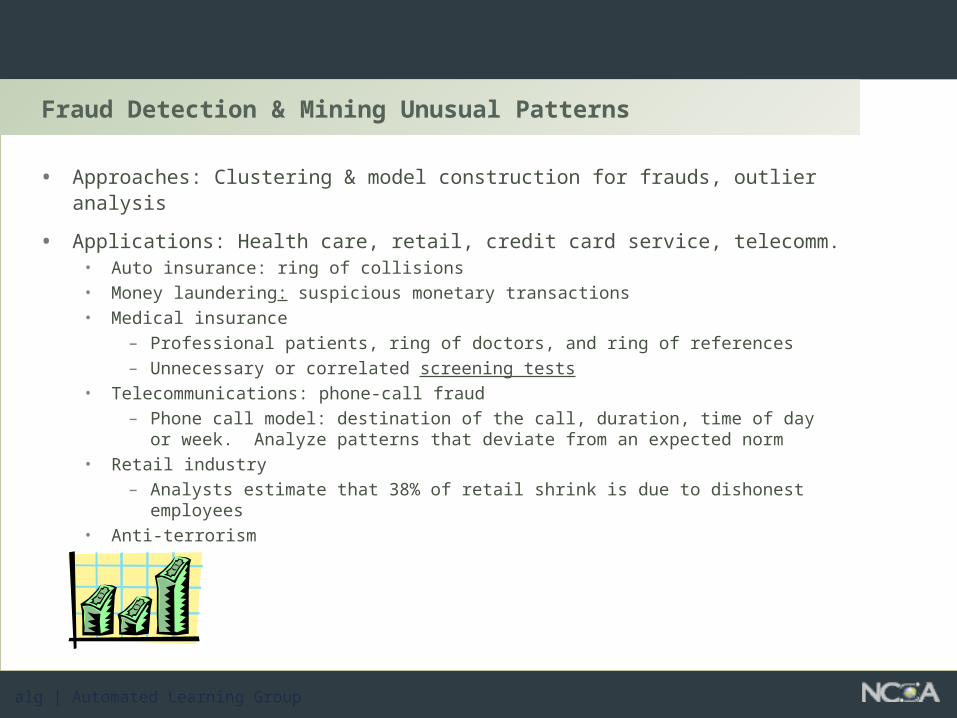
Fraud Detection & Mining Unusual Patterns
• Approaches: Clustering & model construction for frauds, outlier analysis
• Applications: Health care, retail, credit card service, telecomm.• Auto insurance: ring of collisions • Money laundering: suspicious monetary transactions • Medical insurance
– Professional patients, ring of doctors, and ring of references– Unnecessary or correlated screening tests
• Telecommunications: phone-call fraud– Phone call model: destination of the call, duration, time of day or week.
Analyze patterns that deviate from an expected norm• Retail industry
– Analysts estimate that 38% of retail shrink is due to dishonest employees
• Anti-terrorism

alg | Automated Learning Group
Data Mining and Business Intelligence

alg | Automated Learning Group
Knowledge Discovery in Databases Process

alg | Automated Learning Group
KDD Process
• Develop an understanding of the application domain
• Relevant prior knowledge, problem objectives, success criteria, current solution, inventory resources, constraints, terminology, cost and benefits
• Create target data set• Collect initial data, describe, focus on a subset of
variables, verify data quality
• Data cleaning and preprocessing• Remove noise, outliers, missing fields, time
sequence information, known trends, integrate data
• Data Reduction and projection• Feature subset selection, feature construction,
discretizations, aggregations
Precision Farming
Filter

alg | Automated Learning Group
KDD Process
• Selection of data mining task• Classification, segmentation, deviation detection, link analysis
• Select data mining approach
• Data mining to extract patterns or models
• Interpretation and evaluation of patterns/models
• Consolidating discovered knowledge

alg | Automated Learning Group
Knowledge Discovery
alg | Automated Learning Group
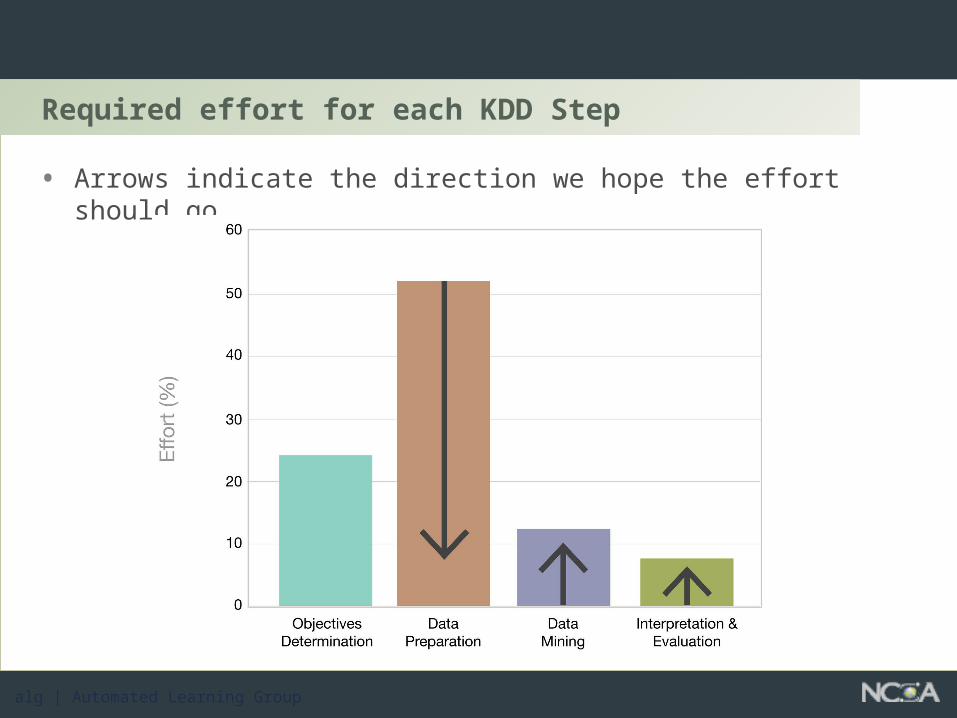
Required effort for each KDD Step
• Arrows indicate the direction we hope the effort should go.

alg | Automated Learning Group
Data Mining Tools

alg | Automated Learning Group
Commercial and Research Tools
Data To Knowledge http://www.ncsa.uiuc.edu/Divisions/DMV/ALG/d2k/
SAS http://www.sas.com/
Clementinehttp://www.spss.com/spssbi/clementine/
Intelligent Miner http://www-3.ibm.com/software/data/iminer/
Insightful Miner http://www.insightful.com/products/product.asp?PID=26
K-Wizhttp://www.thinkanalytics.com/products/factsheets/Kwiz_product_brief.htm

alg | Automated Learning Group
Software Engineering in Data Mining
Conceptual Software Hierarchy
• Operating System (Windows, Mac OS, UNIX, Linux)
• Programming Language (Java)
• Modules = Sequences of Programming Language Commands
• Itineraries = Linked Modules
• Streamlines = Linked Itineraries
Software for
Users with Various Levels of Programming Skills
Collaborating Users

alg | Automated Learning Group
D2K - Software Environment for Data Mining
• Visual programming system employing a scalable framework
• Robust computational infrastructure• Enable processor intensive apps, support distributed computing• Enable data intensive apps, support multi-processor, shared memory
architectures, thread pooling• Very low granularity, fast data flow paradigm, integrated control flow
• Reduction of development time• Increase code reuse and sharing• Expedite custom software developments• Relieve distributed computing burden
• Flexible and extensible architecture• Create plug and play subsystem architectures, and standard APIs
• Rapid application development (RAD) environment
• Integrated environment for models and visualization

alg | Automated Learning Group
D2K Architecture
• D2K Infrastructure• Defines the D2K API
• D2K Modules• Computational unit written in Java
that follows the D2K API
• D2K Itineraries• A group of modules that are
connected to form an application
• D2K ToolKit• User interface
• D2K Driven Applications• Applications that use D2K modules• D2K SL

alg | Automated Learning Group
Data Flow Programming Environment: D2K
Jump Up Panes
Workspace
Tool Bar
Tool Menu
Side Tab Panes

alg | Automated Learning Group
D2K Programming and Runtime Environment

alg | Automated Learning Group
Streamlined Data Mining Environment: D2K SL
KDD Steps
Session
KDD Options
Workspace

alg | Automated Learning Group
Data Mining Techniques in D2K
• Discovery• Association RulesAssociation Rules, Link Analysis, Self Organizing Maps
• Predictive Modeling • Classification – Naive BayesianNaive Bayesian, Neural NetworksNeural Networks, Decision TreesDecision Trees
• Regression – Neural NetworksNeural Networks, Regression Trees
• Deviation Detection• VisualizationVisualization
• Text To Knowledge (T2K)
• Image To Knowledge (I2K)
• ----------------------
• Audio, Touch, Scent and Savor To Knowledge
• Knowledge To Wisdom (K2W)

alg | Automated Learning Group
Data Mining at Work
Dat
a S
ou
rces
Project Objectives
Single
Multiple
Numerous
Diagnostics
Target Marketing
Effluent Quality Control
Decision Support Automation
Transaction Management
Cost Prediction(Warranty, Insurance Claims)Warranty Clustering
Territorial Ratemaking
Web Information Retrieval, Archival and Clustering
Auto Loss Ratio Predictions
Precision Farming
Bio-Informatics
Functional Foods
Heterogeneous Data Visualization
Crime Data Analysis
Data Fusion and Visualization
Survey Study of Disability

alg | Automated Learning Group
Examples of Data Mining Methods

alg | Automated Learning Group
Three Primary Data Mining Paradigms
• Discovery• Example: Association Rules
• Predictive Modeling • Classification Example: Decision Trees
• Deviation Detection• Visualization

alg | Automated Learning Group
Association Rules and Market Basket Analysis

alg | Automated Learning Group
What is Market Basket Analysis?
• Customer Analysis• Market Basket Analysis uses the information about what a
customer purchases to give us insight into who they are and why they make certain purchases.
• Product Analysis• Market basket Analysis gives us insight into the merchandise by
telling us which products tend to be purchased together and which are most amenable to purchase.

alg | Automated Learning Group
Market Basket Example
Is soda typically purchased with bananas?Does the brand of soda make a difference?
Where should detergents be placed in theStore to maximize their sales?
Are window cleaning products purchased when detergents and orange juice are bought together?
How are the demographics of the neighborhood affecting what customers are buying?
?
?
?
?

alg | Automated Learning Group
Association Rules
• There has been a considerable amount of research in the area of Market Basket Analysis. Its appeal comes from the clarity and utility of its results, which are expressed in the form association rules.
• Given• A database of transactions• Each transaction contains a set of items
• Find all rules X->Y that correlate the presence of one set of items X with another set of items Y
• Example: When a customer buys bread and butter, they buy milk 85% of the time
+

alg | Automated Learning Group
Results: Useful, Trivial, or Inexplicable?
• While association rules are easy to understand, they are not always useful.
Useful: On Fridays convenience store customers often purchase diapers and beer together.
Trivial: Customers who purchase maintenance agreements are very likely to purchase large appliances.
Inexplicable: When a new Super Store opens, one of the most commonly sold item is light bulbs.

alg | Automated Learning Group
How Does It Work?
Orange juice, Soda
Milk, Orange Juice, Window Cleaner
Orange Juice, Detergent
Orange juice, detergent, soda
Window cleaner, soda
OJ
4
1
1
2
1
OJ
Window Cleaner
Milk
Soda
Detergent
1
2
1
1
0
1
1
1
0
0
2
1
0
3
1
1
0
0
1
2
WindowCleaner Milk Soda Detergent
Co-Occurrence of Products
Customer Items
1
2
3
4
5
Grocery Point-of-Sale Transactions
Orange Juice, Soda
Milk, Orange Juice, Window Cleaner
Orange Juice, Detergent
Orange Juice, Detergent, Soda
Window Cleaner, Soda

alg | Automated Learning Group
OJ
Window Cleaner
Milk
Soda
Detergent
1
1
1
0
0
2
1
0
3
1
1
0
0
1
2
OJWindowCleaner Milk Soda Detergent
1
2
1
1
0
• The co-occurrence table contains some simple patterns• Orange juice and soda are more likely to be purchased together than any other
two items• Detergent is never purchased with window cleaner or milk• Milk is never purchased with soda or detergent
• These simple observations are examples of Associations and may suggest a formal rule like:
• If a customer purchases soda, THEN the customer also purchases orange juice
How Does It Work?
4
1
1
2
1

alg | Automated Learning Group
How Good Are the Rules?
• In the data, two of five transactions include both soda and orange juice, These two transactions support the rule. The support for the rule is two out of five or 40%
• Since both transactions that contain soda also contain orange juice there is a high degree of confidence in the rule. In fact every transaction that contains soda contains orange juice. So the rule If soda, THEN orange juice has a confidence of 100%.

alg | Automated Learning Group
Confidence and Support - How Good Are the Rules
• A rule must have some minimum user-specified confidence• 1 & 2 -> 3 has a 90% confidence if when a customer bought 1 and
2, in 90% of the cases, the customer also bought 3.
• A rule must have some minimum user-specified support• 1 & 2 -> 3 should hold in some minimum percentage of
transactions to have value.

alg | Automated Learning Group
Association Examples
• Find all rules that have “Diet Coke” as a result. These rules may help plan what the store should do to boost the sales of Diet Coke.
• Find all rules that have “Yogurt” in the condition. These rules may help determine what products may be impacted if the store discontinues selling “Yogurt”.
• Find all rules that have “Brats” in the condition and “mustard” in the result. These rules may help in determining the additional items that have to be sold together to make it highly likely that mustard will also be sold.
• Find the best k rules that have “Yogurt” in the result.
alg | Automated Learning Group
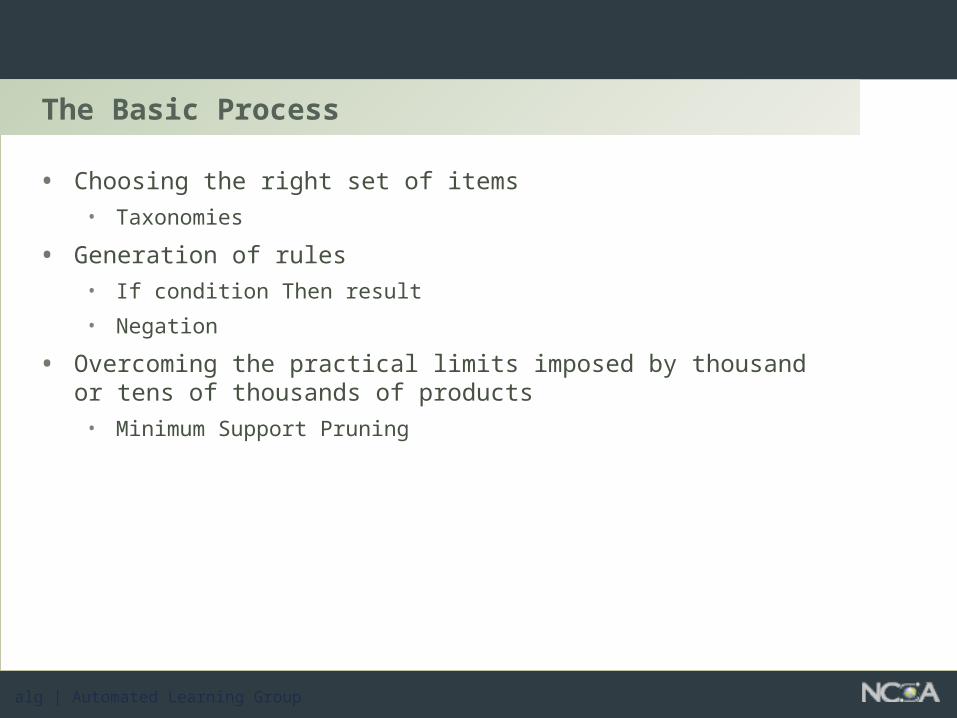
The Basic Process
• Choosing the right set of items• Taxonomies
• Generation of rules• If condition Then result
• Negation
• Overcoming the practical limits imposed by thousand or tens of thousands of products
• Minimum Support Pruning

alg | Automated Learning Group
Choosing the Right Set of Items
FrozenFoods
FrozenDesserts
FrozenVegetables
FrozenDinners
FrozenYogurt
FrozenFruit Bars
IceCream Peas Carrots Mixed Other
RockyRoad
Chocolate Strawberry Vanilla CherryGarcia
Other
Part
ial P
rod
uct
Taxon
om
yG
en
era
lS
pecifi
c

alg | Automated Learning Group
Example - Minimum Support Pruning / Rule Generation
Transaction ID # Items
1
2
3
4
{ 1, 3, 4 }
{ 2, 3, 5 }
{ 1, 2, 3, 5 }
{ 2, 5 }
Itemset Support
{ 1 }
{ 2 }
{ 3 }
{ 4 }
{ 5 }
2
3
3
1
3
Itemset Support
{ 2 }
{ 3 }
{ 5 }
3
3
3
Itemset
{ 2 }
{ 3 }
{ 5 }
Itemset Support
{ 2, 3 }
{ 2, 5 }
{ 3, 5 }
2
3
2
Itemset Support
{ 2, 5 } 3
Scan Database Find Pairings Find Level of Support
Scan Database Find Pairings Find Level of Support
Two rules with the highest supportfor two item set: 2->5 and 5->2

alg | Automated Learning Group
Other Association Rule Applications
• Quantitative Association Rules• Age[35..40] and Married[Yes] -> NumCars[2]
• Association Rules with Constraints• Find all association rules where the prices of items are > 100 dollars
• Temporal Association Rules• Diaper -> Beer (1% support, 80% confidence)• Diaper -> Beer (20%support) 7:00-9:00 PM weekdays
• Optimized Association Rules• Given a rule (l < A < u) and X -> Y, Find values for l and u such that support
greater than certain threshold and maximizes a support and confidence.• Check Balance [$ 30,000 .. $50,000] -> Certificate of Deposit (CD)= Yes
+
alg | Automated Learning Group
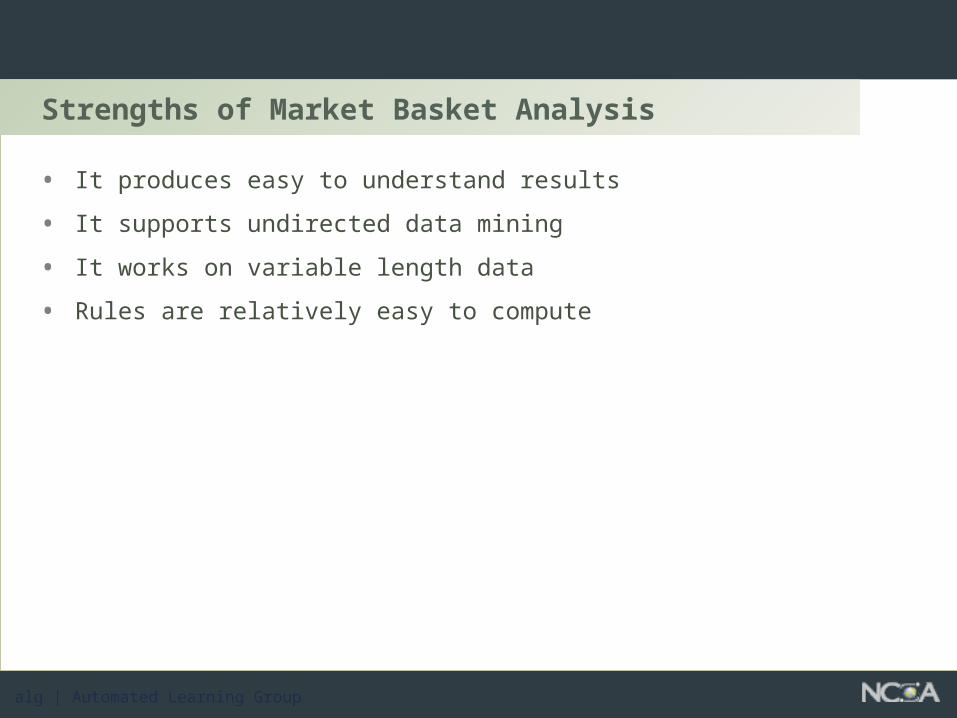
Strengths of Market Basket Analysis
• It produces easy to understand results
• It supports undirected data mining
• It works on variable length data
• Rules are relatively easy to compute

alg | Automated Learning Group
Weaknesses of Market Basket Analysis
• It an exponentially growth algorithm
• It is difficult to determine the optimal number of items
• It discounts rare items
• It is limited on the support that it provides attributes

alg | Automated Learning Group
Decision Tree Learning

alg | Automated Learning Group
Example: Supervised Learning with Decision Trees

alg | Automated Learning Group
• Start with data at the root node
• Select an attribute and form a logical test on attribute
• Branch on each outcome of test, move subset of example satisfying that out come to corresponding child node
• Recurse on each child node
• Termination rule specifies when to declare a node is a leaf node
Note: this is a one-step look ahead, non-backtracking search through the space of all decision trees
Critical Steps• Formulation of good logical tests• Selection measure for attributes
Decision Tree Learning

alg | Automated Learning Group
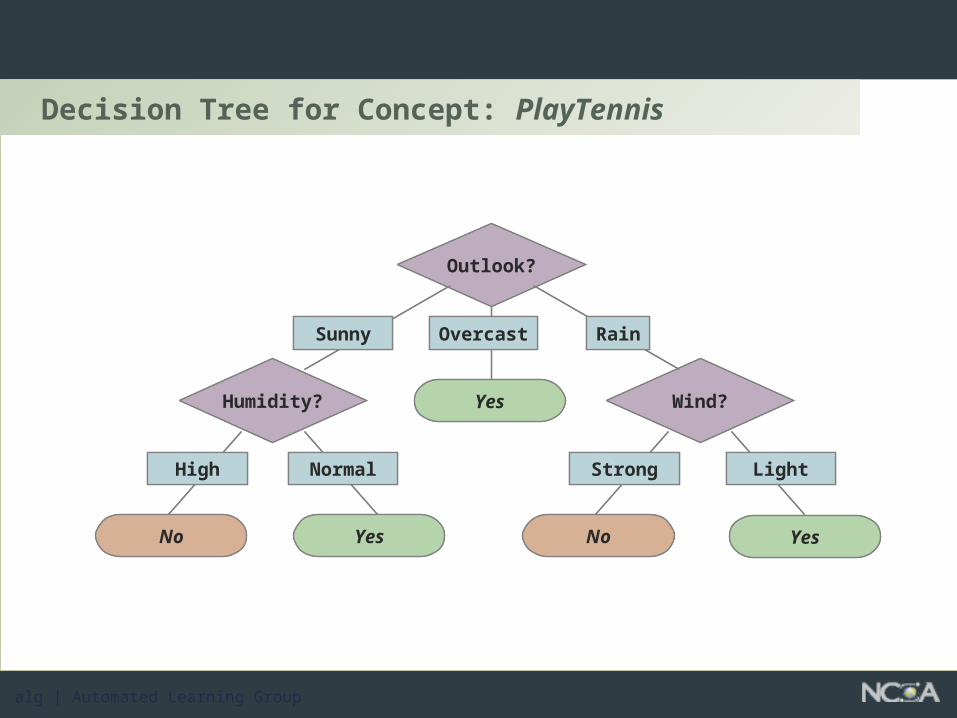
Decision Trees
• Classifiers• Instances (unlabeled examples): represented as attribute (“feature”) vectors
• Internal Nodes: Tests for Attribute Values• Typical: equality test (e.g., “Wind = ?”)• Inequality, other tests possible
• Branches: Attribute Values• One-to-one correspondence (e.g., “Wind = Strong”, “Wind = Light”)
• Leaves: Assigned Classifications (Class Labels)
alg | Automated Learning Group
Decision Tree for Concept: PlayTennis
Outlook?
Humidity? Wind?
Sunny Overcast Rain
YesNo
High Normal
No
Strong Light
Outlook?
Humidity? Wind?
Sunny Overcast Rain
YesNo
High Normal
No
Strong Light
YesYes
YesYes

alg | Automated Learning Group
Decision Trees and Decision Boundaries
+
+-
-
y > 7?
No Yes
+
+
x < 3?
No Yes
y < 5?
No Yes
x < 1?
No Yes
+
+
-
-
y
x1 3
5
7
How to Visualize Decision Trees?
Example: Dividing Instance Space into Axis-Parallel Rectangles
More than two variables ?

alg | Automated Learning Group
An Illustrative Example
123456789
1011121314
Day
SunnySunnyOvercastRainRainRainOvercastSunnySunnyRainSunnyOvercastOvercastRain
HotHotHotMildCoolCoolCoolMildCoolMildMildMildHot Mild
TemperatureHumidity Wind PlayTennis?
HighHighHighHighNormalNormalNormalHighNormalNormalNormalHighNormalHigh
Outlook
LightStrongLightLightLightStrongStrongLightLightLightStrongStrongLightStrong
NoNoYesYesYesNoYesNoYesYesYesYesYesNo
Training Examples for Concept PlayTennis

alg | Automated Learning Group
Constructing a Decision Tree for PlayTennis
123456789
1011121314
Day
SunnySunnyOvercastRainRainRainOvercastSunnySunnyRainSunnyOvercastOvercastRain
HotHotHotMildCoolCoolCoolMildCoolMildMildMildHot Mild
Temperature
Humidity Wind Play Tennis?
HighHighHighHighNormalNormalNormalHighNormalNormalNormalHighNormalHigh
Outlook
LightStrongLightLightLightStrongStrongLightLightLightStrongStrongLightStrong
NoNoYesYesYesNoYesNoYesYesYesYesYesNo
[9+, 5-]
E(D) = min(9/14, 5/14) = 5/14 = 36%
The Initial Decision Tree with One Leaf
Goal: maximize error reduction E, where the error reduction relative to attribute A is the expected reduction in error due to splitting on A:
Question: What attribute A and what value of A should we split on?
alg | Automated Learning Group
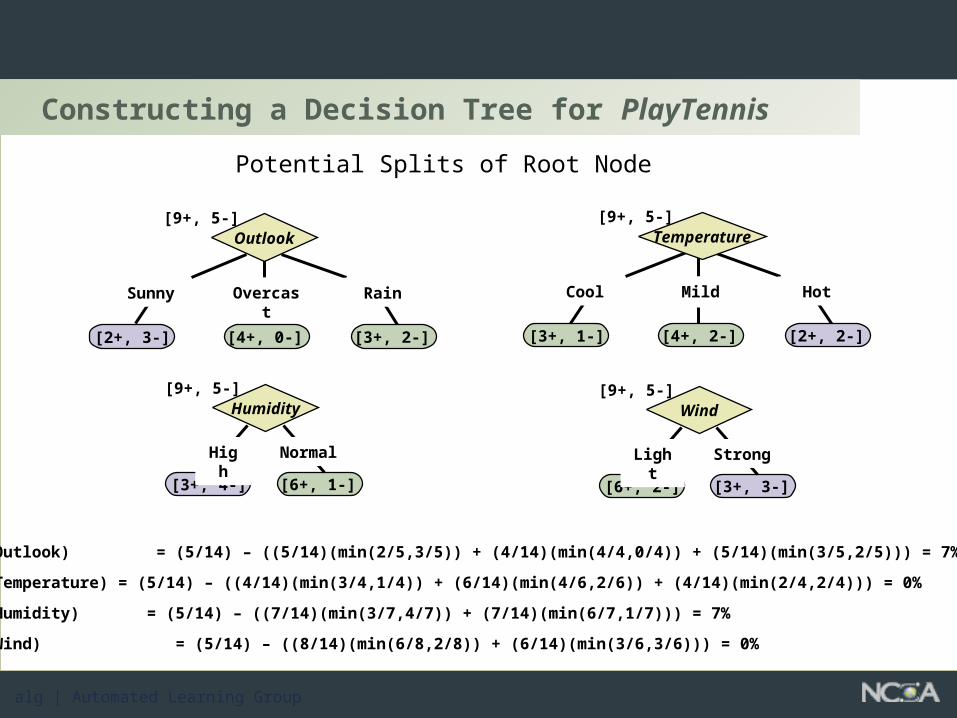
Constructing a Decision Tree for PlayTennis
Potential Splits of Root Node
[3+, 4-] [6+, 1-]
Humidity
High Normal
[9+, 5-]
[6+, 2-] [3+, 3-]
Wind
Light Strong
[9+, 5-]
[2+, 3-] [3+, 2-]
Outlook
Sunny Rain
[9+, 5-]
Overcast
[4+, 0-] [3+, 1-] [2+, 2-]
Temperature
Cool Hot
[9+, 5-]
Mild
[4+, 2-]
E(Split/Outlook) = (5/14) – ((5/14)(min(2/5,3/5)) + (4/14)(min(4/4,0/4)) + (5/14)(min(3/5,2/5))) = 7%
E(Split/Temperature) = (5/14) – ((4/14)(min(3/4,1/4)) + (6/14)(min(4/6,2/6)) + (4/14)(min(2/4,2/4))) = 0%
E(Split/Humidity) = (5/14) – ((7/14)(min(3/7,4/7)) + (7/14)(min(6/7,1/7))) = 7%
E(Split/Wind) = (5/14) – ((8/14)(min(6/8,2/8)) + (6/14)(min(3/6,3/6))) = 0%
alg | Automated Learning Group
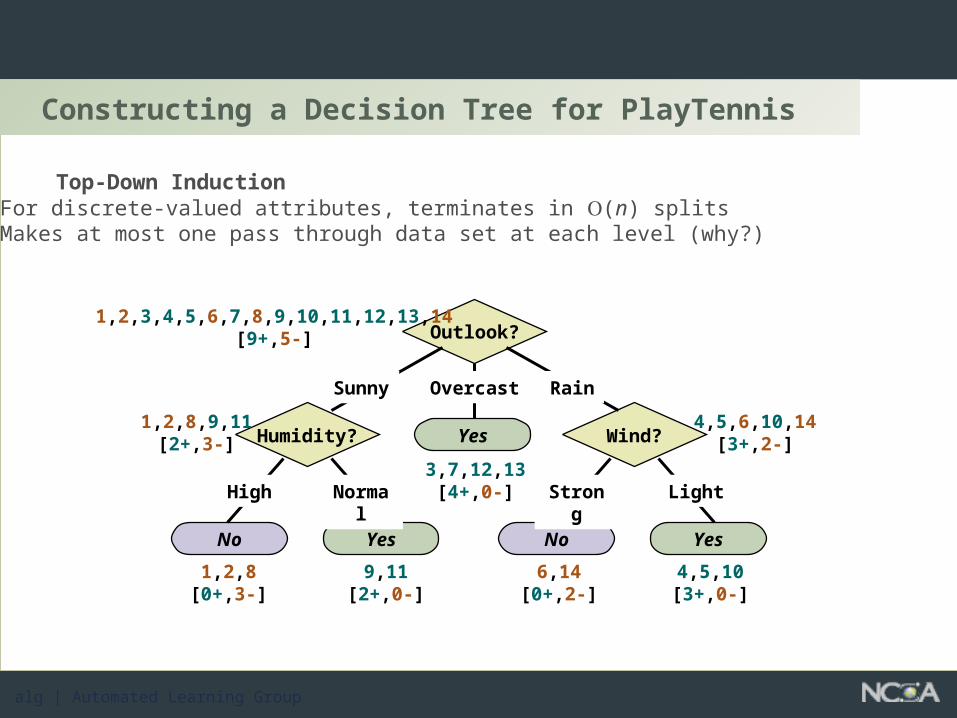
Constructing a Decision Tree for PlayTennis
Humidity? Wind?Yes
YesNo YesNo
Outlook?1,2,3,4,5,6,7,8,9,10,11,12,13,14
[9+,5-]
Sunny Overcast Rain
1,2,8,9,11[2+,3-]
3,7,12,13[4+,0-]
4,5,6,10,14[3+,2-]
High Normal
1,2,8[0+,3-]
9,11[2+,0-]
Strong Light
6,14[0+,2-]
4,5,10[3+,0-]
• Top-Down InductionFor discrete-valued attributes, terminates in (n) splitsMakes at most one pass through data set at each level (why?)

alg | Automated Learning Group
Strengths Of Decision Trees
• Decision trees are able to generate understandable results
• Decision trees perform classification without requiring much computation
• Decisions trees can handle both continuous and categorical variables
• Decision trees provide a clear indication of which attributes are most important for prediction or classification

alg | Automated Learning Group
Weakness Of Decision Trees
• Error-prone with too many classes
• Quick partitioning of data results in fast deterioration in attribute selection quality
• Trouble with non-rectangular regions

alg | Automated Learning Group
Visualization

alg | Automated Learning Group
Visualization Example: Naïve Bayesian
Three Flower Types; Petal and Sepal Based Classification
alg | Automated Learning Group
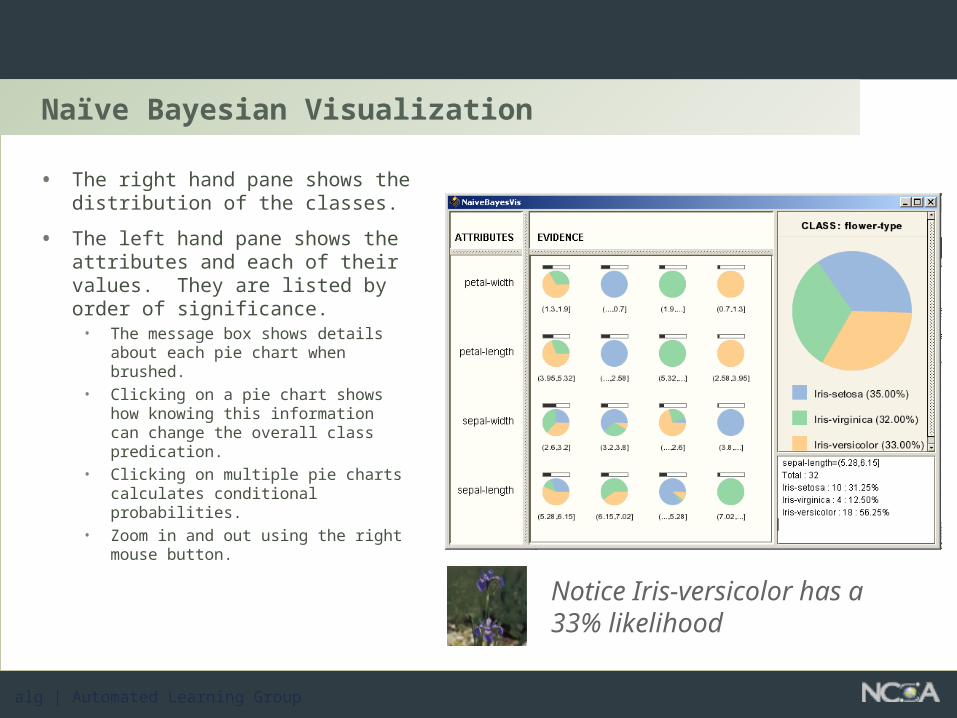
Naïve Bayesian Visualization
• The right hand pane shows the distribution of the classes.
• The left hand pane shows the attributes and each of their values. They are listed by order of significance.
• The message box shows details about each pie chart when brushed.
• Clicking on a pie chart shows how knowing this information can change the overall class predication.
• Clicking on multiple pie charts calculates conditional probabilities.
• Zoom in and out using the right mouse button. Notice Iris-versicolor has a
33% likelihood

alg | Automated Learning Group
Rule Association Visualization
• Read rules down the column
• Example - the rule in the column labeled as 2 is
• if petal-width Binned=(…, 2.) then flower-type=Iris-setosa
• Support = 25%• Confidence = 100%

alg | Automated Learning Group
Discovery Using Rule Association
• What services are purchased together?
• What products or transactions are executed by customers on a single visit to your website?
• What are the relationships in the data?

alg | Automated Learning Group
Parallel Coordinates - Visualization
• Each vertical line represents a field with the minimum and maximum values represented at bottom and top.
• Each record has a line that connects it to the its value at each field
• Lines are colored based on the output field
• Clicking on the label boxes allows the lines to be rearranged
• Zooming is accomplished by dragging a box over the desired area. Clicking returns to the original view.

alg | Automated Learning Group
Scatterplots - Visualization
alg | Automated Learning Group
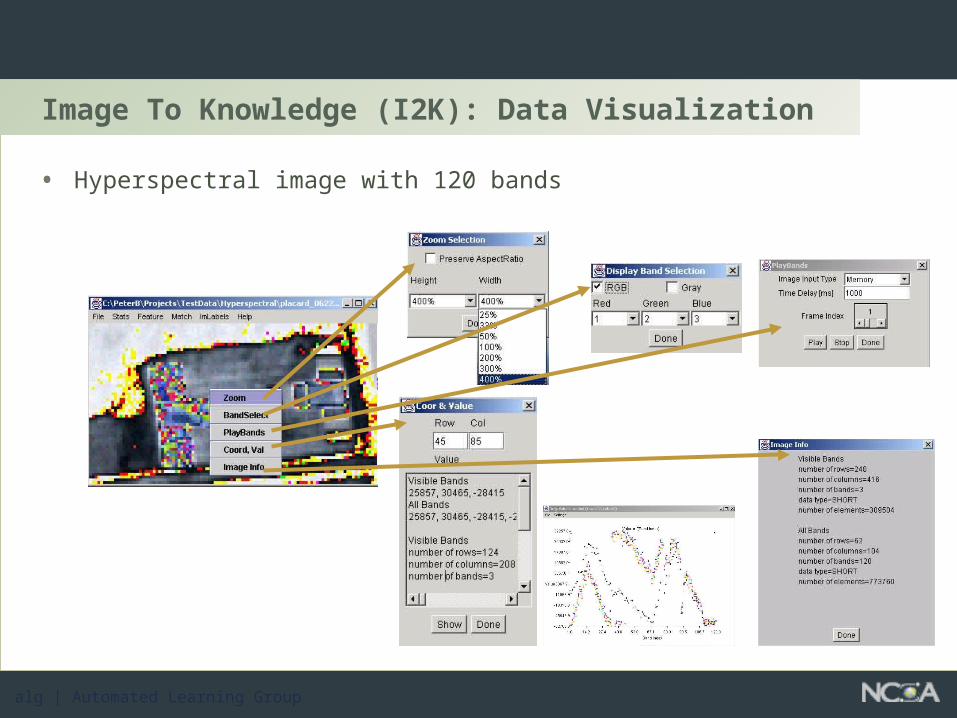
Image To Knowledge (I2K): Data Visualization
• Hyperspectral image with 120 bands

alg | Automated Learning Group
Image To Knowledge (I2K): Visualization of Results
• Classification Results• Class labels per pixel• Class labels per geographical entity• Class labels of aggregations
• Alignment Results• Overlays• Summary Charts
• Image Operations• Enhancements• Image Restoration• Filtering

alg | Automated Learning Group
T2K - Text to Knowledge: Topic Evolution
Any chronologically ordered text
• News feeds

alg | Automated Learning Group
Protein Consumption Dynamics
• Objective• To understand,
through database visualization, global protein consumption patterns by providing a means to directly compare historical and simulated data.
• Presented at the Global Soy Forum - 1999

alg | Automated Learning Group
Data Comparison, Reduction & Synthesis
• Goal• Development of a
3D visualization tool for multi-channel on-board sensor data. This tools allows for multiple time series comparison, reduction and synthesis.
• Related Projects• Derivative
Monitoring• Real-time System
Monitoring
alg | Automated Learning Group
Summary
• Curious? Puzzled?
• Found Application? Domain Specific Questions?
• Learn !
• Become Familiar with Data Mining Terminology
• Introduction to Data Mining
• Look For Tools
• Apply Data Mining Techniques to Problems
• Ask For Help