peterson, norman g., ed. report 739. institution va. · tories measuring temperament,biodata, and...
TRANSCRIPT
ED 292 864
AUTHORTITLE
INSTITUTION
SPONS AGENCY
PUB DATECONTRACTNOTEAVAILABLE FROM
PUB TYPE
EDRS PRICEDESCRIPTORS
IDENTIFIERS
DOCUMENT RESUME
TM 011 270
Peterson, Norman G., Ed.Development and Field Test of the Trial Battery forProject A. Improving the Selection, Classificationand Utilization of Army Enlisted Personnel. ProjectA: Improving the Selection, Classification andUtilization of Army Enlisted Personnel. ARI TechnicalReport 739.Human Resources Research Organization, Alexandria,Va.Army Research Inst. for the Behavioral and SocialSciences, Alexandria, Va.May 87MDA-903-82-C-0531413p.U.S. Army Re.,earch Institute for the Behavioral andSocial Sciences, ATTN: PERI-POT, 5001 EisenhowerAvenue, Alexandria, VA 22333-5600.Reports Evaluative/Feasibility (142)
MF01/PC17 Plus Postage.Biographical Inventories; Classification; CognitiveMeasurement; Computer Assisted Testing; *EnlistedPersonnel; *Field Tests; Interest Inventories; JobPerformance; Military Personnel; Occupational Tests;Perception Tests; Personality Measures; PersonnelEvaluation; * Personnel Selection; PredictiveMeasurement; Psychomotor Skills; *TestConstruction*Armed Services Vocational Aptitude Battery; Paperand Pencil Tests
ABSTRACTAs part of the United States Army's Project A,
research has been conducted to develop and field test a battery ofexperimental tests to complement the Armed Services VocationalAptitude Battery in predicting soldiers' job performance. Project Ais the United States Army's large-scale manpower effort to improveselection, classification, and utilization of enlisted personnel.Findings from an extensive literature review and associated expertjudgments and administration of a preliminary battery of"off-the-shelf" measures guided the development of new tests. Threemajor types of tests were prepared, namely, paper-and-pencil tests ofcognitive ability; computer-administered tests of perceptual andpsychomotor abilities; and paper-and-pencil inventories measuringtemperament, biographical data, and vocational interests. Afteriterative pilot tests and revisions, the measures were field tested.Analysis indicted that the new tests had adequate to excellentpsychometric qualities, were relatively unique, and w're not undulyaffected by practice or by faking in an applicant setting. Theresulting trial battery contains six cognitive tests; 10computer-administered perceptual and psychomotor tests; and twoinventories measuring temperament, biographical factors, andinterests. The battery is being used in the next Project A phase,which involves concurrent validation to evaluate predictor measuresagainst subsequent job performance. (TJH)
Nt" Technical Report 739%0
016)
(\IthN
OAN'10.4
v*.4
0
Zt'
Project A:Improving the Selection, Classification and
Utilization of Army Enlisted Personnel
Development and Field Test of theTrial Battery for Project A
Norman G. Peterson, EditorPersonnel Decisions Research Institute
Selection and Classification Technical AreaManpower and Personnel Research Laboratory
MIU S DEP/ RTMENT OF EDUCATION
Office of Educational Researcn and Improver,EDUCATIONAL RESOURCES INFORMATION
CENTER (ERIC)
4' This dOcumen" has been reprOduCed as'mewed from the person or organizationoriginating it
P Minor changes have been made to improverepro( Ction quality
Points of view or opinions slated in thisdocument do not necessarily represent officialOERI position or poliCY
U.S. Army
Research Institute for The Behavioral and Social Sciences
M.ay 1937
Appro.. et: for public release; distribution unlimited.
BEST COPY AVAILABLE
U. S. ARMY RESEARCH INSTITUTE
FOR THE BEHAVIORAL AND SOCIAL SCIENCES
A Field Operating Agency under the Jurisdiction of the
Deputy Chief of Staff for Personnel
EDGAR M. JOHNSONTechnical Director
WM. DARRYL HENDERSONCOL, INCommanding
Research accomplished under contractfor the Department of the Army
Human Resources Research Organization
Technical review by
Deirdre KnappElizabeth SmithHildz, Wing
NOTICES
DISTRIBUTICN. Primary distribution of this report has been made by ARI. Please address corre-spondence concerning distribution of reports to. U.S. Army Research Institine for the Behavioraland Social Sciences, ATTN PERI-POT, 5001 Eisenhower Ave , Alexandria, Virginia 22333-5600
FINAL DISPOSITION This report may be destroyed when it is no longer needed Please do notreturn it to the U.S Army Research Institute ior the Behavioral and Social Sciences
NOTE The findings in this report are not to be construed as an official Department of the Armyposition, unless so designated by other authorized documents
UNCLASSIFIEDSLCuRitY CLASSifi(o ION UI THIS PAGE
REPORT DOCUMENTATiON PAGEla. REPORT SECURITY CLASSIFICATION
Unclassifiedlb. RESTRICTIVE MARKINGS
2a. SECURITY CLASSIFICATION AUTHORITY 3 DISTRIBUTION/AVAILABILITY OF REPORT
Approved for public release; distributionunlimited.
2b. DECLASSIFICATION/DOWNGRADING SCHEDULE
4. PERFORMING ORGANIZATION REPORT NUMBER(S) 5. MONITORING ORGANIZATION REPORT NUMBER(S)
ARI Technical Report 739
6a. NAME OF PERFORMING ORGANIZATION
Human Resources ResearchOrganization
6b OFFICE SYMBOL(if applicable)
HumRRO
7a. NAME OF MONITORING ORGANIZATION
U.S. Army Research Institute for theBehavioral and Social Sciences
6c. ADDRESS (City, State, and ZIP Code)
1100 South Washington StreetAlexandria, VA 22314-4499
lb. ADDRESS (City, State, and ZIP Code)
5001 Eisenhower AvenueAlexandria, VA 22333-5600
8a. NAME OF FUNDING/SPONSORINGORGANIZATION
--
8b. OFFICE SYMBOL(If applkable)
9. PROCUREMENT INSTRUMENT IDENTIFICATION NUMBER
MDA 903-82-C-0531
8c. ADDRESS (City, State, and ZIP Code)
__
10. SOURCE OF FUNDING NUMBERS
PROGRAMELEMENT NO.
6.37.31.A
PROLENO. GliZbi
731A792
TASKTASKNO.
2.3.2
WORK UNITcassecN NO.'2.3.2.C.1
11. TITLE (Include Secunty Classification)
Development and Field Test of the Trial Battery for Project A
12 PERSONAL AUTHOR(S)
Norman G. Peterson, Editor (Personnel Decisions Research Institute)
13a. TYPE OF REPORTFinal Report
In. TIME COVEREDFROM Oct 82 roSep 85
14. DATE OF REPORT (Year, Month, Day)I 1987, May
5. PAGE COUNT
39116 SUPPLEMENTARY NOTATION Project A: Improving the Selection, Classification, and Utilizationof Army Enlisted Personnel (Human Resources Research Organization, American Institutes forResearch Personnel Decisions Research Institute U.S. Army Resear i -I-
17. COSATI COOES 18. SUBJECT TERMS (Continue on reverse if necessary and ideally by block number)
Classification, Cognitive Measures, Computer-Administeredests, Field Tests, Non-Cognitive Measures, Predictor Mea-sures, Project A, Psychomotor Tests, Selection, Trial Battery
FIELD GROUP SUB -GROUP
19. ABSTRACT (Continue on revers. if necessary and identify by block number)
This research was nerformed under Project A, the U.S. Army's large-scale manpowereffort to improve selection, classification, and utilization of enlisted personnel. Thisreport deals with development and field test of a battery of experimental tests to com-plement the Armed Services Vocational Aptitude Battery in predicting soldiers' jobperformance.
Findings from an extensive literature review, expert judgments on validity of mea-sures identified in the review, and administration of a preliminary battery of "off-the-shelf" measures guided the development of new tests. Three major types were prepared:paper-and-pencil tests of cognitive ability; computer-administered tests of perceptual/psychomotor abilities; and paper-and-pencil inventories measuring temperament, bio-graphical data, and vocational interests. After iterative pilot tests and revisions,
(Continued)
20. DISTRIBUTION /AVAILAIIII ITY OF ABSTRACT
COUNCLASSIFIEDAJNUMITED SAME AS RPT. 0 DTIC USERS21. ABSTRACT SECURITY CLASSIFICATION
UnclassifiedUs. NAME OF RESPONSIBLE INDIVIDUAL
Lawrence M, Hanser22b.TELEPHONE Orclude Area Code)
(202) 274-827522c. OFFICE SYMBOLPER/I$
,
OD FORM 1473,m MAR 03 APR edition may be used until exhausted.AU other editions are obsolete.
SECURITY CLASSIFICATION OF THIS PAGE
UNCLASSIFIED
UNCLASSIFIEDSECURITY CLASSIFICATION OF THIS PAGE
ARI Technical Report 739
, 19. Abstract (Continued)
the measures were field tested. Analysis indicated the new tests had adequate toexcellent psychometric qualities, were relatively unique, and were not unduly affectedby..practice or by faking ig an applicant setting.
The resulting Trial Battery contains six cognitive paper-and-pencil tests, 10computer-administered_perceptual/psychomotorjests, and two paper-and-pencil inven-tories measuring temperaMent,biodata, and interests. It is being used in tre nextProject A phase, concurrent validation executed with FY83/84 accessions to evaluatethe, redictor measures against subsequent job performance.
This report is supplemented by a limited-distribution Research Note, Test Ap-pendixes to ARI Technical Report 739: Development and Field Test of the Trial Batteryfor Project A, ARI Research Note 87-24, April 1987.
ii
UNCLASSIFIED
SECURITY CLASSIFICATION OF THIS PAGE
"i (...7%
TechnicabReport_739.1, .
9-1;
---PrbjeCtImproving the Selection, Classification and Utilization of Army Enlisted Personnel
Development and Field Test of theTrial Battery for Project A
Norman G. Peterson, EditorPersonnel Decisions Research institute
Selection and Classification Technical AreaLawrence M. Hanser, Chief
Manpower and Personnel Research LaboratoryNewell K. Eaton, Director
U.S. ARMY RESEARCH INSTITUTE FOR THE BEHAVIORAL AND SOCIAL SCIENCES5001 Elsenhowe- Avenue, Alexandria, Virginia 22333
Office, Deputy Chief of Staff for PersonnelDepartment of the Army
May 1987
asals ,,m=emrArmy Project NumberManpower and Personnel
20283731A792
Approved for public release; distribution unlimited.
III
0
ri
ARI Research Reports and Technical Reports are intended for sponsors ofR&D tasks and for other research and military agencies. Any findings readyfor implementation at the time of publication are presented in the last partof the Brief. Upon completion of a major phase of the task, formal recom-mendations for official action normally are conveyed to appropriate militaryagencies by briefing or Disposition Fot m.
7
iv
FOREWORD
This document describes the development and field testing of a trial bat-tery of newly constructed predictor measures for evaluating the potential performance of Army applicants. The research was part of the Army's current,large-scale manpower and personnel effort for improving the selection, classi-fication, and utilization of Army enlisted personnel. The thrust for theproject came from the practical, professional, and legal need to validate theArmed Services Vocational Aptitude Battery (ASVAB--the current U.S. militaryselection/classification test battery) and other selection variables as pre-dictors of training and performance. The portion of the effort describedherein is devoted to the development and validation of Army Selection andClassification Measures, and referred to as "Project A.' Another part of theeffort is the development of a prototype Computerized Personnel Allocation Sys-tem, referred to as "Project B." Together, these Army Research Institute re-search efforts, with their in-house and contract components, comprise a land-mark-program to develop a state-of-the-art, empirically validated personnelselection, classification, and allocation system.
EDGAR M. JOHNSONTechnical Director
ACKNOWLEDGMENTS--
feS]ear'61?tifititiffea isTStattc'e waSts .cfti r the course' ttevelbOilient "Vtiel'r fat Battery.LloyA and 'Jay: -Uhla r`e, Orloti'O' for'
PrOjekA; 'r:o4v5cygcl --StuteVid''.inslgt)ts ta7greatlY seer tife'':Scterie ifrigor ra I .re-l'ev,a_n_ceof wo'rk'-.1' 's \rid 's'obt-tft forthe w i.s.ctorit 'arid iiVineetthat'fbe e two ()WA "Wave 'sha'rEcr with' id: Cimp-
be l Jj'AS 'Iceptfout ,Clear;:6( 'f -getke'iitentffic It ask g and
co niiiNtAd s 'ProrYeis well f Ierit actedsuperbly. as:. our Ai* ."0iiscieneed: with his ckeSi' 'for-precision and
clarktYltn Ewe 1,10rjc. Laurie 'Ytise :arid e `excel lent andtimely 'data "-expert i-S6 and suppeni at vaeiodS'potritt'-in-tfiis"effort.-"Ceiti_ZpokiirbytdectinValu'ag,i ariefkitirctureport, C 4;41; ;Wyman -.fro men ant tireless 1er 0R ft & tt-frtduCe
i n ntmirable , re44,4ble dVetjent's the u*PrtiYicectprvratde II andiFfifnvi ded firer. 'gr.> GoSer4 'tia-patieritly-tqTerifedi' 'we1 t as suppOi ted''a group of researchers not unfairly 'charactiFfiedLai "Oiniii-ddnna."
The greatest and,,most heart-felt acknowledgment goes, however, to all theArmy personnel who cont-riout.4 their time and effort to the development, pilottesting, and fieldf-testin§,,Aof the measures of the Trial Battery. They are toonumerous to mention, but we,tbank ,them ill' for the sincere effort and hig)motivation they showed ,as'tfikY-woked with us on Project A.
vi
DEVELOPMENT AND FIELD TEST OF THE TRIAL bITTERY FOR PROJECT A
EXECUTIVE SUMMARY
Requirement:
Project A is a large-scale, multiyear research program intended to improvethe selection and classification for initial assignment of persons to U.S. ArmyMilitary Occupational Specialties (MOS). A comprehensive set of job perfor-mance measures are being developed to assess the validity of the Armed ServicesVocational Aptitude Battery (ASVAB) and a set of newly developed experimentalpredictor measures.
This report describes the development and field test of the newly devel-oped predictor measures.
Procedure:
Initial work concentrated on the development of a theoretical approach andresearch design to effectively and efficiently accomplish the research objec-tive: the development of new predictor tests and inventories that would com-plement the Armed Services Vocational Aptitude Battery (ASVAB), primarily bymeasuring abilities that would be valid for predicting soldiers' job perfor-mance but were not measured on the ASVAB.
Early activities included a large-scale literature review, the collectionand analysis of expert judgments of the validity of tests and inventories iden-tified in the literature review, and the construction and administration of aPreliminary Battery of "off-the-shelf" tests and inventories. These activitiesserved to direct the development of new predictor measures toward those abili-ties that seemed to hold most promise.
Three major types of new measures were developed: paper-and-pencil testsof cognitive ability (primarily in the spatial ability domain), paper-and-pencil inventories measuring temperament, biographical data, and vocationalinterest variables, and a set of computer-administered measures of perceptual/psychomotor abilities.
These new measures were developed in an iterative manner. Tte measureswere subjected to three pilot tests with revisions occurring between each pilottest. All the measures were then collectively administered in a field test andfinal revisions were made.
During the pilot tests and the field test, several analyses and evalua-tions of the new measures were made. Score distributions and various types oftest reliability were computed. The extent to which each new test or scalemeasured an ability not presently measured by the ASVAB (called uniqueness)was determined. The way in which the new measures related to each other andto the ASVAB subtests was analyzed. Investigations were made of the effect
vii
of practice and idiosyncrasies of testing stations on computer-administered
tests. The effects of faking on the temperament, biodata, and vocational in-
terest measures were also investigated.
Findings:
The intended objectives of the research were realized. The newly devel-
oped predictor measures were shown to have adequate to excellent psychometric
properties (that is, sufficiently large score distributions and acceptably high
reliabilities), to be relatively unique (that is, to measure abilities not mea-
sured by the ASVAB), to be not unduly affected by practice, and not largely af-
fected by faking in an applicant-like setting. Also, preliminary methods for
detecting and correcting for faking were shown to be effective.
The final set of measures, called the Trial Battery, contains six pape,..-
and-pencil, cognitive ability tests, 10 computer-administered tests of percep-
tual/psychomotor ability, and two paper-and-pencil inventories containing over
30 scales that measure temperament, biographical data, and vocational inter-
ests. The entire battery requires about 4 hours of time to administer.
Utilization of Findings:
The Trial Battery will be used in the Concurrent Validation Phase of
Project A. Soldiers' scares on the Trial Battery will be compared to their
scores on job performance cri.erion measures (also developed by Project A) to
evaluate the validity of the Trial Battery and to evaluate the extent to which
it improves the prediction of job performance over that achieved by the ASVAB.
viii
1
DEVELOPMENT AND FIELD TEST OF THE TRIAL BATTERY FOR PROJECT A
CONTENTS
Page
OVERVIEW OF PROJECT A 1
CHAPTER 1. THEORETICAL APPROACH, RESEARCH DESIGN AND ORGANIZATION,AND DESCRIPTION OF INITIAL RESEARCH ACTIVITIES
TASK 2: APPROACH AND RESEARCH DESIGN
1-1
1-1
Theoretical Approach 1-1Research Objectives 1-2Research Design 1-4Organization 1-6
TASK 2: PROGRESS SUMMARY 1-7
LITERATURE REVIEW 1-9
Purpose 1-9Search Procedures 1-9Literature Search Results 1-10Screening of Predictors 1-10
EXPERT JUDGMENTS 1-13
Approach and Rationale 1-13Identification of Predictor Variables 1-14Identification of Criterion Variables 1-14Subjects 1-16Instructions and Procedures 1-16Results 1-17
PRELIMINARY BATTERY 1-21Purpose 1-21Selection of Preliminary Battery Measures 1-21
Sample and Administration of Battery 1-23Analyses 1-23
COMPUTER BATTERY DEVELOPMENT 1-25
Background 1-25Phase 1. Information Gathering 1-25Phase 2. Demonstration Battery 1-27
Phase 3. Selection/Purchase of Microprocessors andDevelopment/Tryout of Software 1-28
Phase 4. Continued Software Development and Design/Construction of a Response Pedestal 1-31
ix
2
CONTENTS (Continued)
Page
PILOT TRIAL BATTERY 1-34
Identification of Measures 1-34Pilot Tests and Field Tests 1-34
pter1 References 1-36
CHAPTER 2. TEST DATA COLLECTION: PROCEbURES AND SAMPLES 2-1
PILOT TESTS 2-1Pilot Test#1: Fort Carson 2-1
Pilot Test #2: Fort Campbell 2-3
Pilot Test #3: Fort Lewis , 2-4Summary of.Pilet Tests 2-7
FIELD TESTS 2-11Cield Test of Pilot Trial Battery: Fort Knox 2-11Summary 2-17
CHAPTER 3. COGNITIVE PAPER-AND-PENCIL MEASURES: PILOT TESTING . . . . 3-1
GENERAL 3-1Target Population '3-1
Power vs. Speed 3-2Reliability 3-3
Predictor Categories . . .
c . .
3-4
.:SPATIAL VISUALIZATION. 3-5Spatial Visualization - Rotation 3-5Spatial Visualization - S;anning 3-14
FIELD INDEPENDENCE 3-24
SPATIAL ORIENTATION 3-29
INDUCTION - FIGURAL .:EASONING 3-44
OVERALL.ANALYSIS OF.PILOT.TEST RESULTS FOR COGNITIVE:PAPER-AND-PENCIL MEASURES ..... . . 3-54Test Intercorrelations and-Factor Analysis Results 3-54Subgroup Analyses - Results 3-59Other Cognitive Tests . . 3-59
C.
Chapter 3 References 3-63
x
13
CONTENTS Continued
Page
CHAPTER 4 COGNITyglfPAF1-E);:1PirPC5J1t-J4591?Ei . 4-1...
ANALYSES OF' DATA FROM FIELD- TEST ADMINISTRATION' ..... . . . 4-2
Mean. andRellakil,fitx4spapes-,;., prz p .; ,f 4-2
ys sCoyari ance. wi th ASVAB Subtep.,s :0;
V-0 . .Uniqueneis Eitimites of togniti4e Tests .
1
"4111cr Summary of- Ahaly§e'i , . e. j 4-13
. , . .)'j -fn JG ;;'; rc., : . ,,!
CHAPTER 5.. PERCEPTUAL7PSYe4340T TESTING
GENERAL
tpkiPuTER-Appivistqltp nA$01ESI:
;e!f!v' 1- --5r1
Test Development '5-1
De'veloPment of Resimhse PedeStal` . ' " . .
;
. . . . . . :3-2
3(EACT ION TIME (PROCESiNGlifE1CTENCi)':Reattioh Reatti oh Title" Test 1 "-- -'''/' "'
Choice Reaction-Time: Reaction.Time Test 25-6
5-13
.SHORT -TERM MEMORY '5-17,...
Memory Search Test' -5-17
-PERCEPTUAL SPEED AND ACCURACY 5-23Perceptual Speed and Accuracy Test 5-23Target Identification Test . 5-32
PSYCHOMOTOR PRECISION 5 -39
Target Tracking Test 1 5-39Target' Shoat' Test
1 1
5-43
MUT I L IMB COORDINATION ............. - . 5-47. . .
7 Target Tracking TeSt 2 '5-47
NUMBER OPERATIONS 5-50. .
Number Memory Test 5-50
MOVEMENT JUDGMENT 5-53Cannon Shoot Test 5-53
-SUMMARY' 5-55:
/.[_,,. Investigation of Machine Effects .-,,-. ., .-
Piziot Test' Results': Comment's
.., ,7
,R.
'.: .. r-56, ' v
.
7 Chapte r 5 ReferenCes 5-60-.--,.
,, ;
xi
CONTENTS (Continued)
CHAPTER 6: PERCEPTUAL/PSYCOMOTOR COMPUTER- ADMINISTERED MEASURES:
FIELD TEST
Page
6-1
PERCEPTUAL/PSYCHOMOTOR COMPUTERIZED TESTS ADMINISTERED 6-1
ANALYSIS OF DATA FROM FIELD TEST ADMINISTRATION 6-10
Field Test Scoring Procedures 6-10Mean Scores and Reliability Estimates 6-13
Uniqueness Estimates of Computer-Administered Test Scores . . . 6-14Correlations with Video Game-Playing Experience 6-14
Effects of Differences in "Machine" or ComputerTesting Station 6-14
EFFECTS OF PRACTICE ON SELECTED COMPUTER-ADMINISTERED
TEST SCORES
COVARIANCE ANALYSES WITH ASVAB SUBTESTS AND COGNITIVE
PAPER-AND-PENCIL TESTS
6-19
6-25
FACTOR ANALYSIS OF PTB COGNITIVE PAPER-AND-PENCIL MEASURES,
PTB PERCEPTUAL-PSYCHOMOTOR COMPUTER-ADMINISTERED TESTS,AND ASVAB SUBTESTS 6-29
Chapter 6 References 6-32
CHAPTER 7. NON-COGNITIVE MEASURES: PILOT TESTING 7-1
GENERAL 7-1
Desired Characteristics 7-1
ABLE and AVOICE 7-2
TEMPERAMENT/BIODATA CONSTRUCTS 7-3
Adjustment 7-4
Dependability 7-5
Achievement 7-6
Physical Condition 7-6
Leadership (Potency) 7-7
Locus of Control 7-7
Agreeableness /Li keabi 1 i ty 7-8
Response Validity Scales 7-8
ABLE REVISIONS BASED ON PILOT TESTING 7-11
PILOT TEST DATA FOR THE ABLE 7-13
Fort Campbell 7-13
Fort Lewis 7-17
xii
I
CONTENTS (Continued
Page
INTERESTS CONSTRUCTS 7-25Realistic Interests 7-25Conventional Interests 7-29Social Interest:. 7-30Investigative Interests 7-30Enterprising Interests 7-31Artistic Interests 7-31
Organizational Climate/Environment Scales 7-32Expressed Interests Scale 7-32
AVOICE REVISIONS BASED ON PILOT TESTING 7-34
PILOT TEST DATA FOR THE AVOICEFort CampbellFort Lewis
SUMMARY
7-357-357-35
7-47
Chapter 7 References 7-48
CHAPTER 8. NON-COGNITIVE MEASURES: FIELD TESTS 8-1
ANALYSIS OF DATA FROM FIELD TEST ADMINISTRATION 8-4Results of Data Quality Screening 8-4Mean Scores and Reliability Estimates 8-4Uniqueness Estimates for Non-Cognitive Measures 8-9Factor Analysis of ABLE and AVOICE Scales 8-9
FAKABILITY INVESTIGATIONSPurposes of the FakingProcedure and DesignFaking Study Results -Faking in An ApplicantFaking Study Results -
CONCLUDING COMMENTS
8-17
Study 8-178-17
Temperament Inventory 8-20Setting 8-25Interests Inventory 8-28
8-38
Chapter 8 References 8-39
CHAPTER 9. FORMULATION OF THE TRIAL BATTERY 9-1
REVISIONS TO THE PILOT TRIAL BATTERY 9-2Changes to Cognitive Paper-and-Pencil Tests 9-4Changes to Perceptual/Psychomotor Computer-AdministeredTests 9-8
Changes to Non-Cognitive Measures (ABLE and AVOICE) 9-13
id
CONTENTS (Continued)
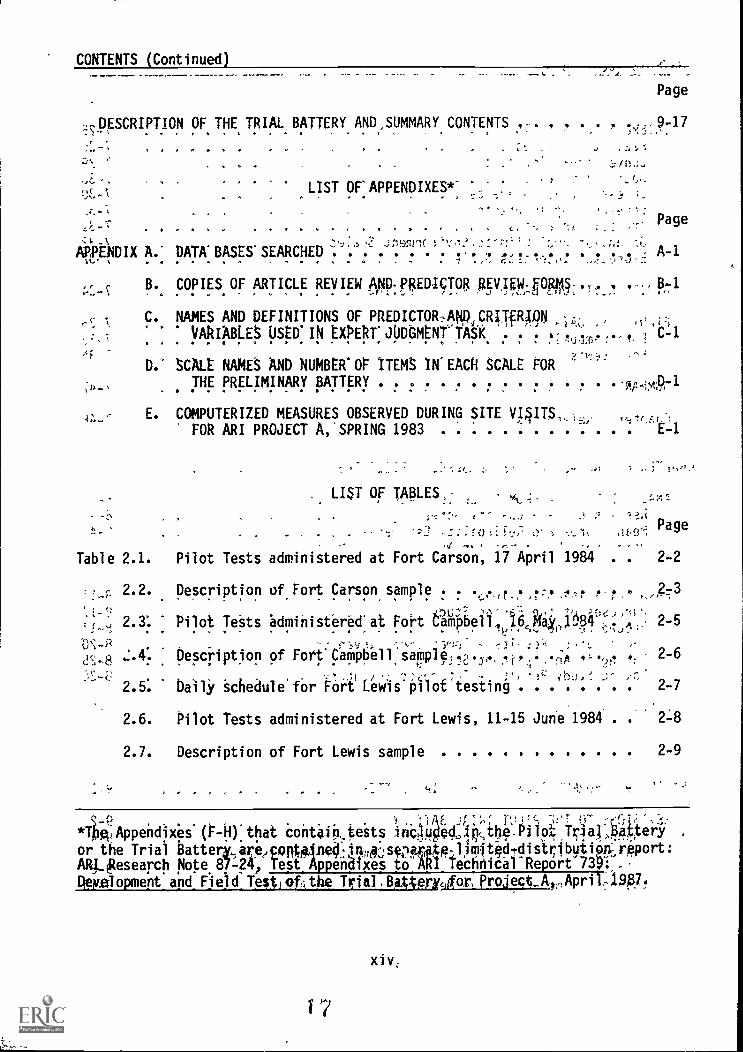
DESCRIPTION OF THE TRIAL BATTERY AND SUMMARY CONTENTS
.;i... ,
LIST OFAPPENDIXES*-!.;;-.- 4 " 4 0 . ..... -'' ' " 3
..--% 1 -.
4.,-.0 . A . G 4 4 4 4 4 0 i ,,,,,, 4 C. % 'H! :_ ..7: Page.:...
,..7:,,,, ,",:' ..;;-xlrIcl',,,,,..-...;....-:-::',, ':;.,. -,,.;,:, ,,;.
APPENDIX A.: DATA:BASES.SEARCHED . . . . . . 1-.:. ...1: ...: A-1
B. COPIES OF ARTICLE REVIEW ApD,PREDI5TOR REVIEW-FORMS-, . .---8-1
C. NAMES AND DEFINITIONS OF PREDICTORANO,CRITfRMN ,.;6. ,
VANABLEt USED 'IN tXPERTJOD6MttrTAS'k ': . ': ....:': l'CL1...... . . . . . . . , . , . ,
,
Page
;."D. SCALt NAMES AND NUMBER OF ITEMS IWEACH SCALE POR
THE PRELIMINARY BATTERY
E. COMPUTERIZED MEASURES OBSERVED DURING SITE VI§ITS,,.../
FOR ARI PROJECT A,'SPRING 1983
LIST OF TABLES:
4,-
E-1
Pager
Table 2.1. Pilot Tests administered at Fort Carson, 17 April 1984 . . 2-2
2.2. Description of Fort Carson sample . . ,10,4 ..0
: Pilot Tests administered at port a*Pbeii06sNoi: 2-5
(A-P - :,,, .
Description of Fort. COpbell:samp191.?.,, 2-6
2.5: Daily Schedulefor FOrf Lewis piloitesting 2-7
2.6. Pilot Tests administered at Fort Lewis, 11-15 June 1984 . . 2-8
2.7. Description of Fort Lewis sample 2-9
(.;
. . . , . iT I r Q-*TbgpAppendixes (1-H) that contalp,tests incOgedipthe PflotTrial,gpt;teryor the Trial 13atter-5,areecontgine0:,14114;svmotft-1)mitid-distributioni,rOport:ARJ..gesearch Note 8 -24, Test AppenMxes to AR1 fechnical-Report'73 .
Welopment apd_Field_Testiofithe Trial,BAX4priqifor,Project_A,,Apri109A7.
xiv;
CONTENTS (Continued) .
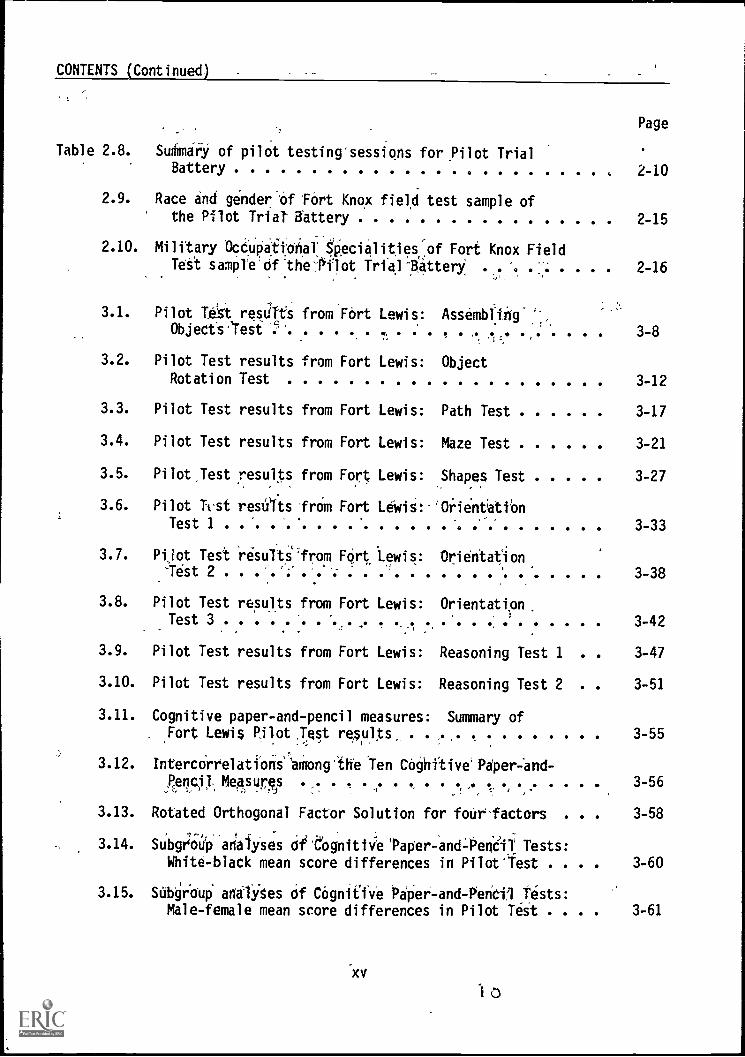
Table 2.8. SuMmarY of pilot testing'sessions for ,Pilot TrialBattery
2.9. Race and gender 'of Fort Knox field test sample of
the Pilot Trial Battery
Page
2-10
2-15
2.10. Military OcdmiattotaT gecialities.of Fort Knox FieldTest sampTe ofttie-ftflot TrfaliktenY 2-16
,
3.1. Pilot Ten results from Fort Lewis: AssembliigObjecfs:Tesi c
_ ...,,, * OOOOO 3-8
3.2. Pilot Test results from Fort Lewis: Object
Rotation Test
3.3. Pilot Test
3.4. Pilot Test
3.5. Pilot'Test
3.6. Pilot Tcst
Test 1
3.7. Pilot Test-fest 2
results from Fort Lewis:
results from Fort Lewis:
results from Fort Lewis:
rest?1ts from Fort Lewis:
'result 'from Rift Lewis:
Path Test
Maze Test
Shapes Test
:OrientatiOn
Orientatlon
3.8. Pilot Test results from Fort Lewis: Orientatton,Test 3
3.9. Pilot Test results from Fort Lewis: Reasoning Test 1 .
3.10. Pilot Test results from Fort Lewis: Reasoning Test 2 .
3.11. Cognitive paper-and-pencil measures: Summary ofFort Lewis Pilot Test results
3.12. Intercorrelationsamongitie Ten Coghitive' Paper:and-
Pencil Measures
3-12
3-17
3-21
3-27
3-33
3-38
3-42
3-47
3-51
3-55
3-56
3.13. Rotated Orthogonal Factor Solution for fouP factors . . . 3-58
3.14. Subgr'ou'p ariaiySes ci.e.eognitt%)e'Paper-and-Peneri, Tests:
White-black mean score differences in Pilot'Test . . . . 3-60
3.15. SUbirblip analyses of CognitIve Pifier-and-Perkil _Tests:
Male-female mean score differences in Pilot Test . . . . 3-61
xv
CONTENTS (Continued)
Page
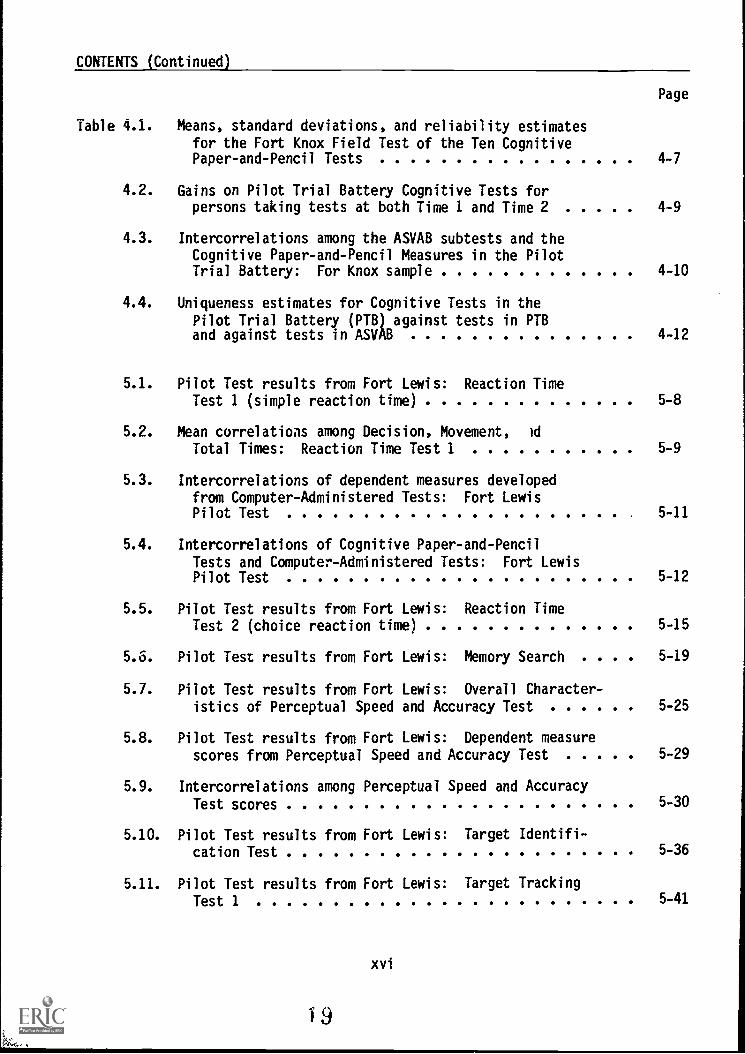
Table 4.1. Means, standard deviations, and reliability estimates
for the Fort Knox Field Test of the Ten CognitivePaper-and-Pencil Tests 4-7
4.2. Gains on Pilot Trial Battery Cognitive Tests forpersons taking tests at both Time 1 and Time 2 4-9
4.3. Intercorrelations among the ASVAB subtests and the
Cognitive Paper-and-Pencil Measures in the PilotTrial Battery: For Knox sample
4.4. Uniqueness estimates for Cognitive Tests in the
Pilot Trial Battery (PTB) against tests in PTBand against tests in ASVAB
4-10
4-12
5.1. Pilot Test results from Fort Lewis: Reaction Time
Test 1 (simple reaction time) 5-8
5.2. Mean correlations among Decision, Movement, id
Total Times: Reaction Time Test 1 5-9
5.3. Intercorrelations of dependent measures developed
from Computer-Administered Tests: Fort LewisPilot Test 5-11
5.4. Intercorrelations of Cognitive Paper-and-Pencil
Tests and Computer-Administered Tests: Fort LewisPilot Test 5-12
5.5. Pilot Test results from Fort Lewis: Reaction Time
Test 2 (choice reaction time) 5-15
5.6. Pilot Test results from Fort Lewis: Memory Search . . . 5-19
5.7. Pilot Test results from Fort Lewis: Overall Character-
istics of Perceptual Speed and Accuracy Test 5-25
5.8. Pilot Test results from Fort Lewis: Dependent measure
scores from Perceptual Speed and Accuracy Test 5-29
5.9. Intercorrelations among Perceptual Speed and Accuracy
Test scores 5-30
5.10. Pilot Test results from Fort Lewis: Target Identifi-
cation Test 5-36
5.11. Pilot Test results from Fort Lewis: Target Tracking
Test 1 5-41
xvi
CONTENTS (Continued)
Page
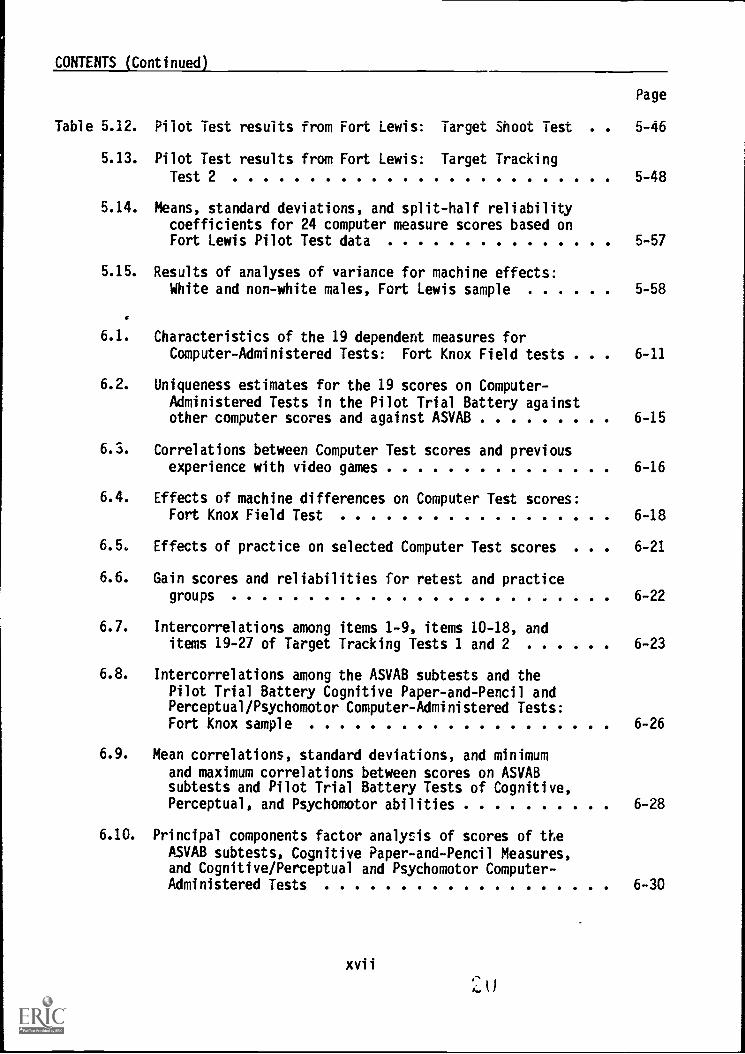
Table 5.12. Pilot Test results from Fort Lewis: Target Shoot Test . . 5-46
5.13. Pilot Test results from Fort Lewis: Target Tracking
Test 2 5-48
5.14. Means, standard deviations, and split-half reliabilitycoefficients for 24 computer measure scores based onFort Lewis Pilot Test data 5-57
5.15. Results of analyses of variance for machine effects:White and non-white males, Fort Lewis sample 5-58
6.1. Characteristics of the 19 dependent measures forComputer-Administered Tests: Fort Knox Field tests . . . 6-11
6.2. Uniqueness estimates for the 19 scores on Computer-
Administered Tests in the Pilot Trial Battery againstother computer scores and against ASVAB 6-15
6.3. Correlations between Computer Test scores and previousexperience with video games 6-16
6.4. Effects of machine differences on Computer Test scores:Fort Knox Field Test 6-18
6.5. Effects of practice on selected Computer Test scores . . 6-21
6.6. Gain scores and reliabilities for retest and practicegroups 6-22
6.7. Intercorrelations among items 1-9, items 10-18, anditems 19-27 of Target Tracking Tests 1 and 2 6-23
6.8. Intercorrelations among the ASVAB subtests and thePilot Trial Battery Cognitive Paper-and-Pencil andPerceptual/Psychomotor Computer-Administered Tests:Fort Knox sample 6-26
6.9. Mean correlations, standard deviations, and minimum
and maximum correlations between scores on ASVABsubtests and Pilot Trial Battery Tests of Cognitive,Perceptual, and Psychomotor abilities 6-28
6.10. Principal components factor analysis of scores of the
ASVAB subtests, Cognitive Paper-and-Pencil Measures,and Cognitive/Perceptual and Psychomotor Computer-Administered Tests 6-30
xvii
mil
CONTENTS (Continued)
Table 7.1. Temperament/Biodata Scales (by construct) developedfor Pilot Trial Battery: ABLE - Assessment ofBackground and Life Experiences
Page
7-4
7.2. Fort Campbell Pilot Test: ABLE Scale statistics 7-14
7.3. 'Font Campbell Pilot Test: ABLE Scale intercorrelations . 7-15
7.4. Fort Campbell Pilot Test: Varimax rotated principal
factor analyses of 10 ABLE'Scales 7-16
7.5. Fort Campbell Pilot Test: Correlations between ABLE
constructs and scales and Personal Opinion Inventory(POI) marker variables 7-17
7.6. Fort Lewis Pilot Test: ABLE Scale statistics for
total group 7-18
7.7. Fort Lewis Pilot Test: ABLE Scale means and standard
deviations separately for males and females 7-19
7.8. Fort Lewis Pilot Test: ABLE SCaie means and standard
deviations separately for blacks and whites 7-20
7.9. Fort Lewis 'Pilot 'Test: ABLE Scale intercorrelations . . 7-21
7.10. Fort Lewis PilOtTest: ABLE Scale intercorrelations
with social desirability variance partialed out . . . . 7-23
7.11. Fort Lewis 'Pilot Test: Varimax rotated principal
factor analyses of 10 ABLE Scales 7-24
7.12. Holland BaSic Interest Constructs, and Army VocationalInterest Career Examination Scales developed for PilotTrial Battery: AVOICE - Army Vocational InterestCareer Examination 7-26
7.13. Additional-AVOICE measures: Organizational Climate/Environment and Expressed Interests Scales 7-27
7.14. Fort Campbell Pilot Testi' AVOICE Scale statistics . . . 7-36
7.15. Fort Lewis Pilot Test.: AVOICE Scale statistics for
total group 7-38
7.16. Fort LeWrks Pilot Test: AVOICE means and standarddeviations separately for males and females 7-40
21
CONTENTS (Continued)
Table 7.17.
7.18. Fort Lewis Pilot Test:
Fort,Lewis Pilot. Test: mpicE means and standarddevlsafioni'Seliar'atelY fWbfackS ,White's'
8.1.
8.2.
8.3:
8.4.
8.5.'
Fort Knox Field Test:
AVOICE.Scale intercorrelations
Data quality screekresults
Fort KnoxifieldTnt: :My:. Scale score characteristics
Fon'Kha Field Tett: 'AWE test'-retest results
Page
7-44
8-5
8-6
8-7
Forele6iNelkt-esi 'AVcdetcil'es&A'ttiaratieii'stics'. 8-8
'the PiVotBattery: against. p.T4Tr .p4- scores. (and against
!6)1Ar;-:' , '. . . . 8-10
8.6. Uniqueness estipatps;for?2,4, AVAICg .the PilotTrial-Battei-yagainstssASVAB 8-11
8.7. Summary of overlap of non-cognitive measures with otherPilot TrialjattPrYilmeasur 8-12
8.8. Fort Knox Field Test:'-ABLE facibr analysis 8-13
8.9. Fort Knok neid"le'st':.4.AVO'ICE'faCtOr4rialysiS' "". 8-15
8.10. Faking Experiment, ABLE and AVOICE: Fort Bragg 8-19
8.11. Fakabillii S.W4y, for 'OLE"*Ao,, . O 8-21Fort Bragg
HOpelY-4110 Wng effsp,ct,s, ABLE. Content Spales:'FOrt Bragg 8-22
8.12.
8.13. Honesty and fAfngSfectS, ABLE Response ValidityScales: Fort Bragg 8-23
8.14. Effects of regressing out two Response Validity
Scales" (SoCial.DesirabilitY"and Poor Impression)on faking condition, ABLE Content Scale Scores:Fort Bragg 8-24
8.15. Comdarison of results from Fort Bragg honest,Fort Knox, and MEPS (recruits) ABLE Scales 8-27
xix
CONTENTS (Continued)
Page
Table 8.16. Fakability Study, MANOVA results for AVOICE Combat-
Related Scales: Fort Bragg 8-29
8.17. Fakability Study, MANOVA Results for AVOICE Combat-Support Scales: Fort Bragg 8-30
8.18. Effects of faking, AVOICE Combat Scales: Fort Bragg . . 8-31
8.19. Effects of faking, AVOICE Combat Support Scales:
Fort Bragg 8-32
8.20. Effects of regressing out Response Validity Scales(Unlikely Virtues and Poor Impression) on fakingcondition, AVOICE Combat Scales scores: Fort Bragg . 8-33
8.21. Comparison of Fort Bragg honest, Fort Knox, and MEPS
(recruits) AVOICE Combat-Related Scales 8-35
8.22. Comparison of Fort Bragg honest, Fort Knox, and MEPS
(recruits) AVOICE Noncombat-Related Scales 8-36
9.1. Summary of changes to Cognitive Paper-and-PencilMeasures in the Pilot Trial Battery 9-5
9.2. Summary of changes to Computer-Administered Pilot
Trial Battery Measures 9-6
9.3. Summary of changes to Pilot Trial Battery versionsof Assessment of Background and Life Experiences(ABLE) and Army Vocational Interest Career
Examination (AVOICE) 9-7
9.4. Summary of item reduction changes for ABLE and AVOICE . 9-14
9.5. Number of items in Pilot Trial Battery and Trial
Battery versions of ABLE Scales 9-15
9.6. Number of items in Pilot Trial Battery and Trial
Battery versions of AVOICE Scales 9-16
xx
23
CONTENiS (Continued)
UST OF FIGURES
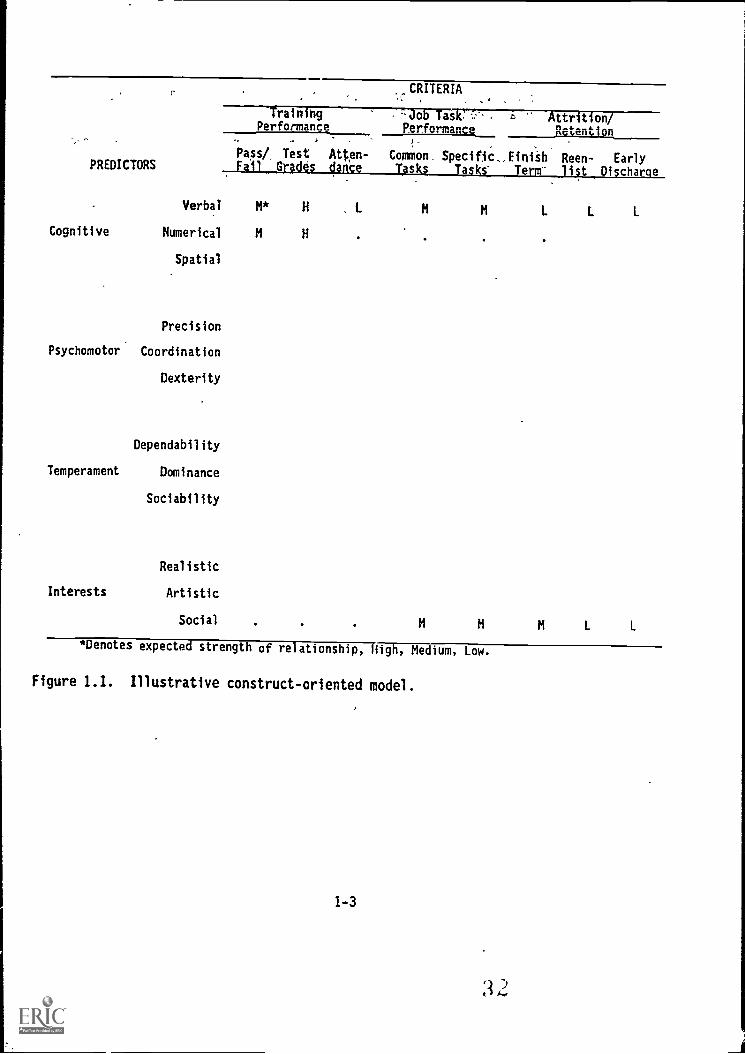
Figure 1.1. Illustrative construct-oriented model
Page
1-3
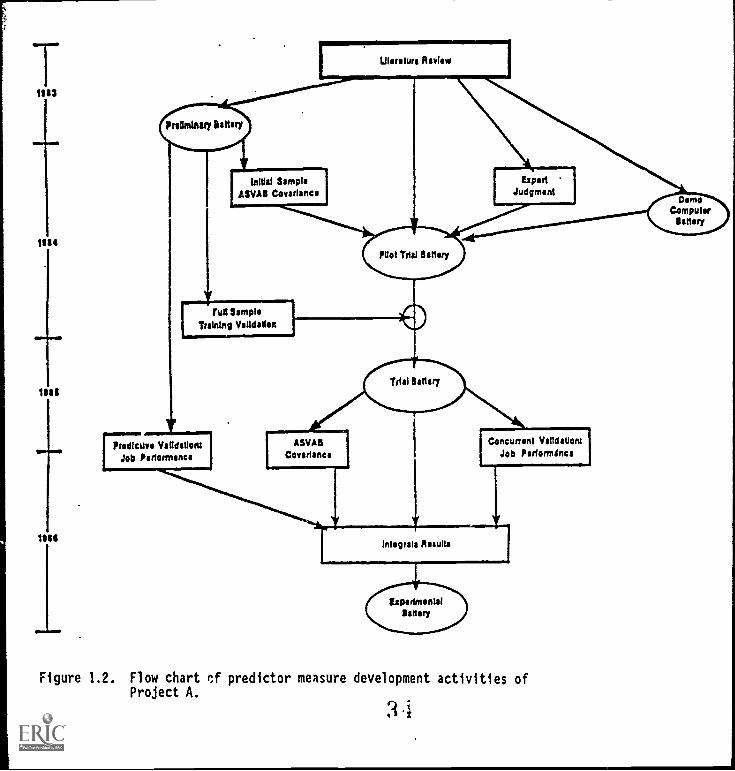
1.2. Flow chart of predictor m-asure development activitiesof Project A 1-5
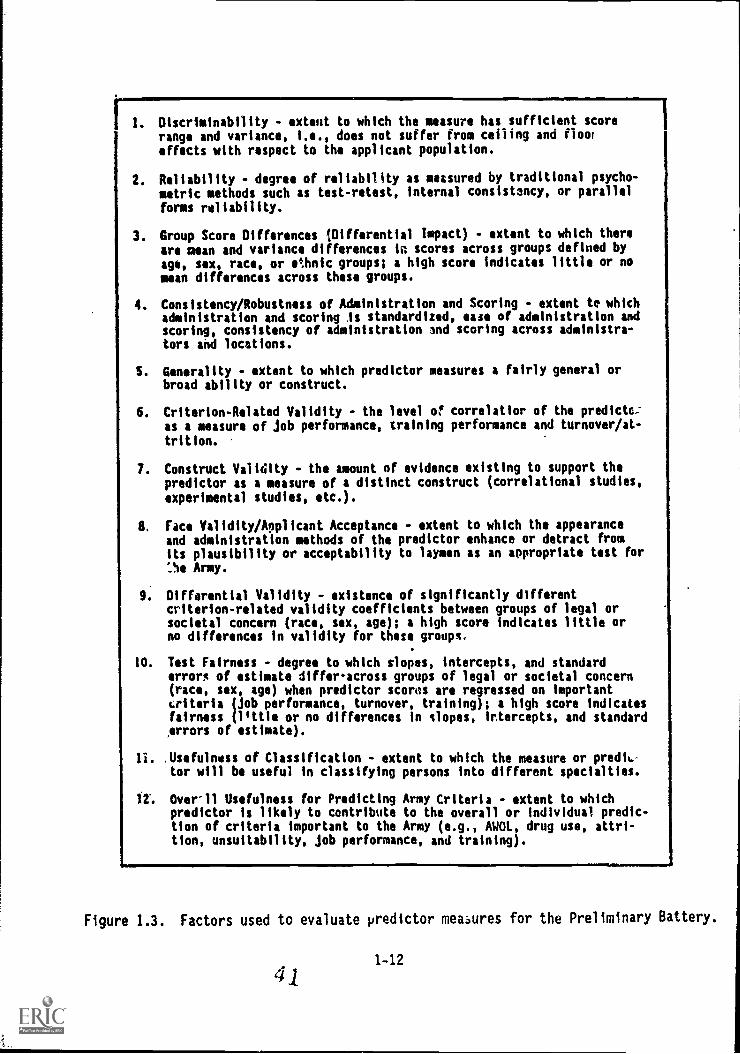
1.3. Factors used to evaluate predictor measures for thePreliminary Battery 1-12
1.4. Hierarchical map of predictor space 1-18
1.5. Predictor categories discussed at IPR March 1984,
linked to Pilot Trial Battery test names 1-35
2.1. Daily testing schedule for Fort Knox Field Test,weeks 1 and 2 2-12
2.2. Daily location schedule for Fort Knox Field Test,weeks 1 and 2 2-13
2.3. Daily schedule for Fort Knox Field Test, weeks 3 and 4 . . 2-14
3.1. Sample items from Assembling Objects Test 3-6
3.2. Distribution of items difficulty levels: AssemblingObjects Test 3-9
3.3. Sample test items from Object Rotations Test 3-11
3.4. Distribution of item difficulty levels: ObjectRotation Test 3-13
3.5. Sample items from Path Test 3-15
3.6. Distribution of item difficulty levels: Path Test . . . 3-18
3.7. Sample items for the Maze Test 3-20
3.8. Distribution of item difficulty levels: Maze Test . . . . 3-22
3.9. Sample items from the Shapes Test 3-25
3.10. Distribution of item difficulty levels: Shapes Test . . . 3-28
3.11. Sample items from Orientation Test 1 3-31
xxi
24
CONTENTS (Continued)
Page
F4gure 3.12. Distribution of item difficulty levels:
Orientation Test 1
3.13. Sample items from Orientation Test 2
t.
3-34
-66
11,.;11{",':) .(1.491.) . , '3.14., Distribution of item,difficulty` levels:
Orientation Test 2 3-39
yp.1,!z-v)3.15., Sample, items frop Orientation felts 3 -41
T ...1 3,.16. Distribution, of ilffludift.ficmityi lft,YOS; , :,..- ,-:- . .--Orientation Test 3 3-43
a_ f 3.17.. Sample items roni:
42pTo4 s1,o,n r g:;:T
e°s,t..0-,1. '. . r. .. .,f,.. 3-46
3.18. Distribution of item difficulty levels:
Rea,s0./TinSjest%.,:11,-4. ,!- - -:(.,--1 -) -...., - ,f. 3-48
!
3.19. Sample items from Reaion.irig Test 2 '''' 3-50
3.20. Distribution of item difficulty levels:
Reasoning Test 2 3-52
iE
4.1. Description of Cognitive Paper-and-Pencil Measures in
.Fi eld Jest A, 'a "II, ''' a 4-3
5.1. Response pedestal for computerized tests 5-3
5.2. Key to flow Oiagrams:cof computer-administered tests 5-5
5.3. Reaction Time :Test, 1 . , . . . 5-6
5.4. Readifori Tinie Iesf 2 5-14
, .
5.5. Memory Test 5-18
5.6. Perceptual Speed and Accuracy Test 5-24
5.7. Type x Digit analysis of variance on Total Reaction
-Tillie -.:) .. !. . .. 000000000000 5-27
5.8. .Type x Digit an4lysts3A)fDvaptanpe oCi ,Movement _Time,. . . 5-28
5.9. -,Graphtic,dtsplays of example items from the.computer-
administered Target Identification Test 5-33
2 5
CONTENTS (Continued)
Page
Figure 5.10. Target Identification Test 5-34
5.11. Distribution of 48 items on the revised Target
Identification Test according to five parameters . . . . 5-38
5.12. Target Tracking Test 1 5-40
5.13. Target Shoot Test 5-44
5.14. Target Tracking Test 2 5-48
5.15. Number Memory Test 5-52
5.16. Cannon Shoot Test 5-54
6.1. Description of Perceptual/Psychomotor Computer-Administered Measures in Field Test 6-2
6.2. Experimental design of the practice effectsinvestigation 6-20
6.3. Items in the Computer Practice Battery used at theFort Knox Field Test 6-20
7.1. Organizational climate/environment preferenceconstructs, scales within constructs, and an itemfrom each scale 7-33
8.1. ABLE scales organized by construct 8-2
8.2. AVOICE scales organized by construct 8-3
8.3. Debriefing Form used in the caking study at the
Military Entrance Processing Station (MEPS) 8-26
8.4. Form filled out by MEPS recruits before debriefing . . . . 8-26
9.1. Guidelines for evaluating and retaining Pilot TrialBattery measures in order to produce the TrialBattery 9-3
9.2. Description of Trial Battery measures 9-18
23
OVERVIEW OF PROJECT A
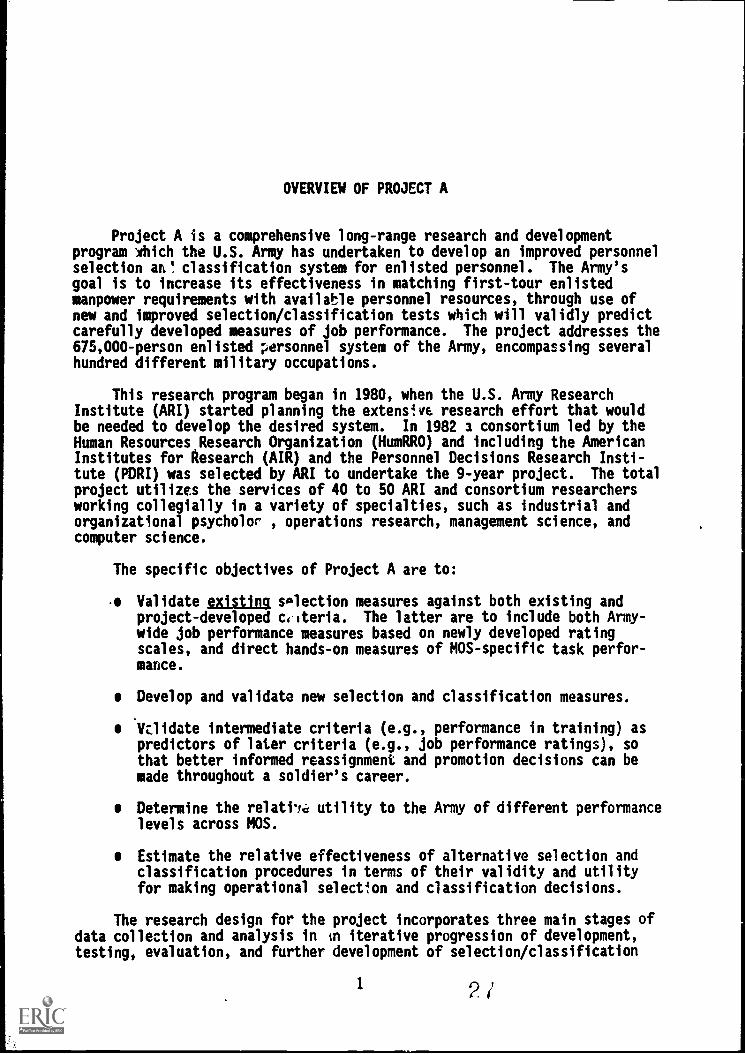
Project A is a comprehensive long-range research and developmentprogram 'hich the U.S. Army has undertaken to develop an improved personnelselection an! classification system for enlisted personnel. The Army'sgoal is to increase its effectiveness in matching first-tour enlistedmanpower requirements with available personnel resources, through use ofnew and improved selection/classification tests which will validly predictcarefully developed measures of job performance. The project addresses the675,000-person enlisted personnel system of the Army, encompassing severalhundred different military occupations.
This research program began in 1980, when the U.S. Army ResearchInstitute (ARI) started planning the extensive research effort that wouldbe needed to develop the desired system. In 1982 2 consortium led by theHuman Resources Research Organization (HumRRO) and including the AmericanInstitutes for Research (AIR) and the Personnel Decisions Research Insti-tute (PDRI) was selected by ARI to undertake the 9-year project. The totalproject utilizes the services of 40 to 50 ARI and consortium researchersworking collegially in a variety of specialties, such as industrial andorganizational psycholor , operations research, management science, andcomputer science.
The specific objectives of Project A are to:
Validate existing selection measures against both existing andproject-developed c,iteria. The latter are to include both Army-wide job performance measures based on newly developed ratingscales, and direct hands-on measures of MOS-specific task perfor-mance.
Develop and validate new selection and classification measures.
Validate intermediate criteria (e.g., performance in training) aspredictors of later criteria (e.g., job performance ratings), sothat better informed reassignment and promotion decisions can bemade throughout a soldier's career.
Determine the relathc utility to the Army of different performancelevels across MOS.
Estimate the relative effectiveness of alternative selection andclassification procedures in terms of their validity and utilityfor making operational selection and classification decisions.
The research design for the project incorporates three main stages ofdata collection and analysis in in iterative progression of development,testing, evaluation, and further development of selection/classification
1 2
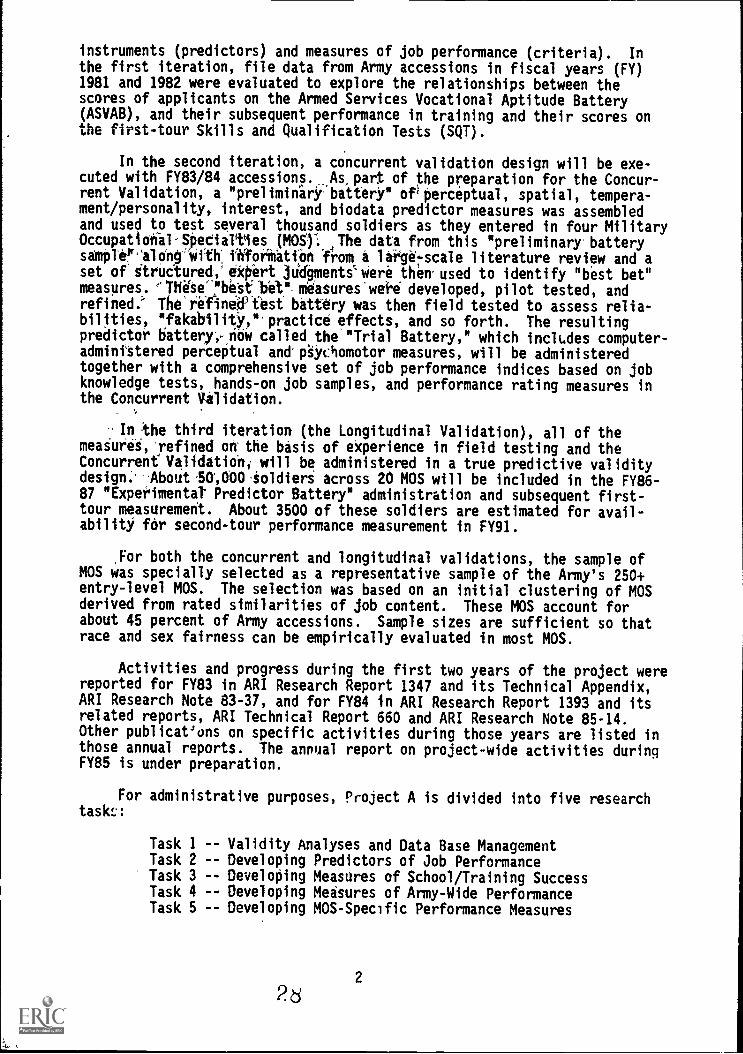
instruments (predictors) and measures of job performance (criteria). In
the first iteration, file data from Army accessions in fiscal years (FY)1981 and 1982 were evaluated to explore the relationships between thescores of applicants on the Armed Services Vocational Aptitude Battery(ASVAB), and their subsequent performance in training and their scores onthe first-tour Skills and Qualification Tests (SQT).
In the second iteration, a concurrent validation design will be exe-cuted with FY83/84 accessions. As part of the preparation for the Concur-rent Validation, a "preliminary oPperceptual, spatial, tempera-ment/personality, interest, and biodata predictor measures was assembledand used to test several thousand soldiers as they entered in four MilitaryOccupational-10edialt1es (MOS):,,The data from-this "preliminary batterysamples'aldng with' Worthatibn from a large-scale literature review and a
set of structured,' expert jUd#menteWere then-used to identify "best bet"measures. "Thise-!betfbet" measures'wei'd developed, pilot tested, andrefined.' The'refinatest battery was then field tested to assess relia-bilities, "fakabilitY,"*practice effects, and so forth. The resultingpredictor battery, -now called-the "Trial Battery," which includes computer -administered perceptual and- p'SYchomotor measures, will be administeredtogether with a comprehensive set of job performance indices based on jobknowledge tests, hands-on job samples, and performance rating measures inthe Concurrent Validation.
In-the third iteration (the Longitudinal Validation), all of themeasures, refined on' the basis of experience in field testing and theConcurrent' Validation, will be administered in a true predictive validitydesign. About samo -ioldieri across 20 MOS will be included in the FY86-87 "Experimental' Predictor Battery" administration and subsequent first-tour measurement. About 3500 of these soldiers are estimated for avail-ability for second-tour performance measurement in FY91.
For both the concurrent and longitudinal validations, the sample ofMOS was specially selected as a representative sample of the Army's 250+entry-level MOS. The selection was based on an initial clustering of MOSderived from rated similarities of job content. These MOS account forabout 45 percent of Army accessions. Sample sizes are sufficient so thatrace and sex fairness can be empirically evaluated in most MOS.
Activities and progress during the first two years of the project werereported for FY83 in ARI Research Report 1347 and its Technical Appendix,ARI Research Note 83 -31, and for FY84 in ARI Research Report 1393 and itsrelated reports, ARI Technical Report 660 and ARI Research Note 85-14.Other publications on specific activities during those years are listed inthose annual reports. The annual report on project-wide activities duringFY85 is under preparation.
For administrative purposes, Project A is divided into five researchtaskf.::
Task 1 -- Validity Analyses and Data Base ManagementTask 2 -- Developing Predictors of Job PerformanceTask 3 -- Developing Measures of School/Training SuccessTask 4 -- Developing Measures of Army-Wide PerformanceTask 5 -- Developing MOS-Specific Performance Measures
2
18
The development and revision of the wide variety of predictor andcriterion measures reached the stage of extensive field testing during FY84and the first half of FY85. These field tests resulted In the formulation ofthe test batteries that will be used in the comprehensive ConcurrentValidation program which is being initiated in FY85. .
The present report is one of five reports prepared under Tasks 2-5 toreport the development of the measures and the results of the field tests,and to describe the measures to be used in Concurrent Validation. The fivereports are:
Task 2 -- "Development and Field Test of the Trial Battery forProject A," Norman G. Peterson, Editor, ARI Technical Report739, May 1987.
Task 3 -- "Development and Field Test of Job-Relevant Knowledge Testsfor Selected MOS," by Robert H. Davis, et al., ARI TechnicalReport in preparation.
Task 4 -- "Development and Field Test of Army-Wide Rating Scales and theRater Orientation and Training Program," by Elaine D. Pulakos,and Walter C. Borman, Editors, ARI Technical Report 716,October 1985.
Task 5 -- "Development and Field Test of Task-Based MOS-SpecificCriterion Measures," Charlotte H. Campbell, et al., ARITechnical Report 717, October 1985.
-- "Development and Field Test of Behaviorally Anchored RatingScales for Nine MOS," Jody L. Toquam, et al., ARI TechnicalReport in preparation.
32 d
CHAPTER 1
THEORETICAL APPROACH, RESEARCH DESIGN AND ORGANIZATION, AND DESCRIPTIONOF INITIAL RESEARCH ACTIVITIES
Norman G. Peterson
TASK 2: APPROACH AND RESEARCH DESIGN
As described in the Overview, Project A is organized into five re-search tasks, and activities of Task 2 are the focus of this report. Task2's specific objective is the development and validation of new (or im-proved) selection and classification measures.
At present, the U.S. Army has a large number of jobs (called MilitaryOccupational Specialties or NOS) and hires, almost exclusively, inexperi-enced and untrained persons to fill those jobs. As obvious as these factsare, they need to be stated because they are the overriding facts that haveto be addressed by Task 2 research.
One implication of these facts is that a highly varied set of indivi-dual differencei' variables must be put into use if there is to be areasonable chance of improving the present level of accuracy of predictingtraining performance, job performance, and attrition/retention in a sub-stantial proportion, if not all, of those jobs. Much less evident is theparticular content of that set of individual differences variables, and theway the set should be developed and organized.
A second, and perhaps less obvious, implication is the notion that newpredictor measures must be appropriate for selecting persons who do nothale .the training and experience to immediatesy begin performing theirassigned jobs. This is true partly because of the vast numbers of jobpositions that need to be filled, partly because of the kinds of jobs foundin the Army (infantry, artillery, etc.), and partly because of the popula-tion of persons that the Army draws from (young high-school graduates withlittle or no specialized training and job experience).
Theoretical Approach
These considerations led us to adopt a construct-oriented strategy ofpredictor development, but with a healthy leavening from the content-oriented strategy. Essentially, we endeavored to build up a model ofpredictor space by (1) identifying the major, relatively independent do-mains or types of individual differences' constructs that existed; (2)selecting measures of constructs within each domain that met d number ofpsychometric and pragmatic criteria; and (3) further selecting those con-structs that appeared to be the "best bets" for incrementing (over presentpredictors) the prediction of the set of criteria of concern (i.e., train-ing/job performance and attrition/retention in Army jobs).
Ideally, the model would, we hoped, lead to the selection of a finiteset of relatively independent predictor constructs that were also rela-tively independent of present predictors and maximally related to the
1-1
30
criteria of interest. If these conii4if6iii were met, then the resulting setof mgauce4,w0,414 preflictall or most of the criteria, yet possess enough
heibidleftAtil tiimyiehT00000010Wfailaig bliifficat4oci,ofpciiioniMiiadifferent jobs. cTirVITJA 143r1A353 jArriAl 30
The development of such FtWitlalioliFthe virtue that it could be
at least partially "tested" at many points during the research effort, and
not just at the end go alll,f4kprgliquAl0 crItqripn data are in. For
GAample, we could entiT14 thertbarili60 6f4fleOlideVeloped measures with
one another and with the present predictors, notably the Armed Services
Vocational. Aptitude Battery (ASVAq). It the,new measures were not rela-
t;tiveIgliagaiitudiefirVIAVarid5Wilure.T6Putfier'llo}Whi'iVpre-dtEfed.bj1 d'inke libitNe 86111CfakeltipPto!eoffectildit. lth,'Wconstficaielficeaqigttileriodft,ATROUPOWit*WiiitTonianiti6--provements could be implementeemdailiofi'strii6fitforwictili!"-:'9':- '''"''
'.:TY "WI: tilf"Wittii. 'PaCai's i. 00rvarity:Roariiis.0, is,pre, ei tiiiraet eigpf,4ea thopt ',W vsi AtE.-3 ty4,:to4ltnkh';Oe'
geia -641-orthew k'of'PrdjeeeWlY d 4 '/Irgi. 0 to A01 0- .igYff 044 003110 q cor* 0.01. e il 1 L$.mintiediOkiillet, a;.,
criterion measures, and we, on the predielSe side, -h v 't ke -advItitigeocr
the WormatIgn SoTitni from.those.efforts.0,4200 tpROMaijable.r1.:rir ,c, c '9 b .1,421. 6 ...t:;, ; ,.J.,i..7 .v...-;.t. 1 '....t.u..,11 X e;i.;
tgritilsi44 74 Oq r / ,, ydutite95.9!- 4 fr iSmhlooNTbil; e.ATf t,
's 11 'A iliftif rm8441;'Wqg, ',Vi iiVegl OAK 4: 0 itt.'.
t4 ri .0 090,14sAft OlTleirilrgiclINV 1,re refill"'y-latgLillet: titirtilZPPjay4;to. rigl ty. f ean
we have kept this firmly in mind. 'flowever; fie posses'slofi"drtutk-a "model
WARliniasitgegliglitT,14tartMirti%ridpnilttioali414114of a IMOcenTlig:i4Ail$40-110,E/cqCIJO2,-!:),:x9 Df!;;;.1 :AiL.tA
ril-v' '4"" ;': /, ,,,.' 'mpf,--,,-
MU0 _,4 4,t, 1° 1 I WA y4s-lrmkr ),(;111" t.1 g.ar c ,:dirf(?0.00 if It' 0:61 '''" iie''' ' 0 -tth" hi filli'a"
tin Of:'ciI 10 Aectowsjano.00, coluTns:,,Weifiayg fOxl-Atog 40 ;_,,'
en* v,ffiibb49raEsnicalApt4in:bec4u0Af.41140 bwtoi.i.fii,41714 erfsricYT
appropria i levels Of:sw1f14.y"for a,parfic4ar proOle040e ktik;research, or for future applications of measures. (See Mervin andBownas, 1982, for further discussion of this type of mo4044-. -,:.:-,.,_
;ln 5r,:., t.fil if::_ "; !, .i -. *,, ;.
This,theoretical approach led.ta,the.delineation of seven, more con-
crete objectives -of our research, ,These were: ,
belzxt) 36ill .T,2321t.) ;',..3:,15 f,.. ;1.,i. J , _- ,,
,,i.;_,Adenti f.YrIPleaPire4 i PC, hurqwabilj ti es .,o.trOutes, smcit.ai-a0gri..s,.:mgs whigb,age most-likely to.:beseftectiveJR,predtctingiPrOr Acv
=: T:-'entry )440jgbeArRY,,Auccessful soldier PerforMonce-Jnaenerkl,,and.
::, in4lOss,ifying POTIOROntolMWwhere 10ey.willcbe:*tst .ticceAsful,
with specJa1.4eTPhesAsonrattributes. notrtoPed.OY4vrrent-prer,,
enlistment measures.
.?,-1 : -:, aorloElf5. ?n: '; c-; .'. ,,,' (,% ,'''Jci..: :,:-, ':,'" ' i,''
-2eDlesign anJwdevelop new-measures 4r,:modify)extsting measures= of I,e
9:1these.0"best-;bet",predictors'_ -, .--,', .,7. ; -,1
1-2
31
CRITERIA
Training -Job Task: ::". T., Attrition/Performance Detention
-.--. . .
Pass/ Test Atten- Common. Specific,,Finthl Reen- EarlyPREDICTORS Fail Grades dance tasks Tasks' Term- list Discharge
Cognitive
Verbal M* H 1. M M I 1 L
Numerical M H . . .
Spatial
Precision
Psychomotor Coordination
Dexterity
Dependability
Temperament Dominance
Sociability
Interests
Realistic
Artistic
Social
*Denotes expected strength of relationship, Nigh, Medium, Low.
Figure 1.1. Illustrative construct-oriented model.
1-3
32
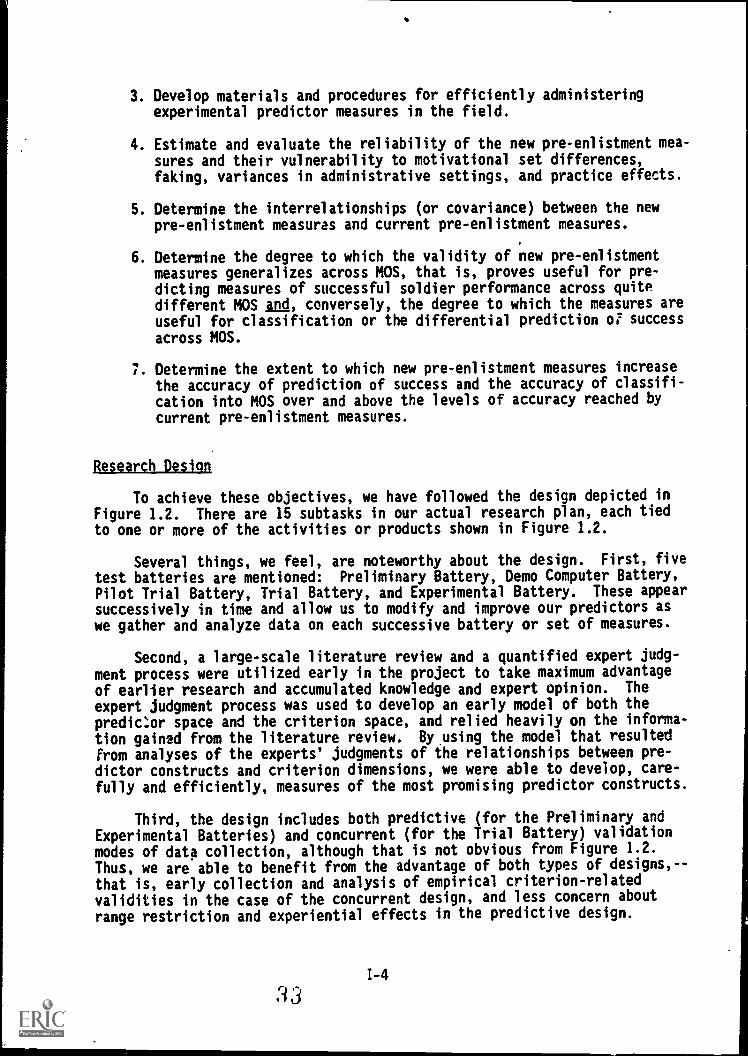
3. Develop materials and procedures for efficiently administeringexperimental predictor measures in the field.
4. Estimate and evaluate the reliability of the new pre-enlistment mea-sures and their vulnerability to motivational set differences,faking, variances in administrative settings, and practice effects.
5. Determine the interrelationships (or covariance) between the newpre-enlistment measures and current pre-enlistment measures.
6. Determine the degree to which the validity of new pre-enlistmentmeasures generalizes across MOS, that is, proves useful for pre-dicting measures of successful soldier performance across quitedifferent MOS Ind, conversely, the degree to which the measures areuseful for classification or the differential prediction o? successacross MOS.
7. Determine the extent to which new pre-enlistment measures increasethe accuracy of prediction of success and the accuracy of classifi-cation into MOS over and above the levels of accuracy reached bycurrent pre-enlistment measures.
Research Design
To achieve these objectives, we have followed the design depicted inFigure 1.2. There are 15 subtasks in our actual research plan, each tiedto one or more of the activities or products shown in Figure 1.2.
Several things, we feel, are noteworthy about the design. First, five
test batteries are mentioned: Preliminary Battery, Demo Computer Battery,Pilot Trial Battery, Trial Battery, and Experimental Battery. These appearsuccessively in time and allow us to modify and improve our predictors aswe gather and analyze data on each successive battery or set of measures.
Second, a large-scale literature review and a quantified expert judg-ment process were utilized early in the project to take maximum advantage
of earlier research and accumulated knowledge and expert opinion. The
expert judgment process was used to develop an early model of both thepredictor space and the criterion space, and relied heavily on the informa-
tion gained from the literature review. By.using the model that resultedfrom analyses of the experts' judgments of the relationships between pre-dictor constructs and criterion dimensions, we were able to develop, care-fully and efficiently, measures of the most promising predictor constructs.
Third, the design includes both predictive (for the Preliminary andExperimental Batteries) and concurrent (for the Trial Battery) validationmodes of data collection, although that is not obvious from Figure 1.2.Thus, we are able to benefit from the advantage of both types of designs,- -
that is, early collection and analysis of empirical criterion-related
validities in the case of the concurrent design, and less concern about
range restriction and experiential effects in the predictive design.
1-4
33
T1183
1184
T1188
1188
Literature Review
Pro limitary battery
Initial SampleAtIVAII Covariance
ExpertJudgment
DemoComputer
Battery
Pilot Trial Battery
run SampleVeining Vent Seiko
Vial Battery
Predictive ValtdatiotuJob Performance
ASVABCamisole.
Coneunent Vends Con:Job Pertormincs
1111111116
Integrate AssulW
ExperimentalBinary
Figure 1.2. Flow chart cf predictor measure development activities ofProject A. 3i
Dysinization
We organized Task 2 researchers into three "domain teams" as we workedour way through this research design and toward the earlier describedresearch objectives. One team concerned itself with the temperament,biographical data, and vocational interest variables and came to be called
the "non-cognitive" team. Another team concerned itself with cognitive andperceptual kinds of variables and was called the "cognitive" team. Thethird team concerned itself with psychomotor and perceptual variables andwas labeled the "psychomotor" team or sometimes the "computerized" team,since all the measures developed by that team were computer-administered.
1-6
TASK 2: PROGRESS SUMMARY
One gauge of progress is the degree to which the seven research objec-tives presented earlier have been accomplished. Following is a shortsummary of progress in terms of those objectives.
I. Identify "best bet" measures--This objective has been met. Wesifted through a mountain of literature, translating the informa-tion onto a common form that enabled us to evaluate constructs andmeasures in terms of several psychomotor and pragmatic criteria.The results of that effort fed into the expert judgment processwherein 35 personnel psychologists provided the data necessary todevelop our first model of the predictor space. After furtherreview by experienced researchers in the Army and an advisorygroup, a set of "best bet" constructs was settled on. We also madesome field visits to observe combat arms jobs first-hand,in addi-tion to receiving criterion-side information from other Project Aresearchers; all of this information was very useful in developingnew measures.
2. Develop measures of "best bet" predictors--This objective was ac-complished by following the blueprint provided from the firstobjective. We carried out many small and not-so-small sampletryouts. of these measures as they were developed, as is documentedin the remainder of this report. The Trial Battery is the tangibleproduct of meeting this objective.
3. Develop procedures for efficiently administering predictor mea-sures--As anyone who has done research in military settings isaware, soldiers' time is precious and awarded research time is notto be squandered. We think we have developed and implementedeffective methods for getting maximum quality and quantity of dataout of our data collection efforts. The favorable results we haveso far achieved in completeness and usefulness of data are due inlarge part, we think, to the attention paid to this objective.
4. Estimate reliability and vulnerability of measures--This objectivehas also been largely accomplished. We can report that analyses todate indicate that the new measures are psychometrically sound andacceptably invulnerable to the various sources of measurement prob-lems--or we have devised some ways to adjust for such effects.However, more specifically targeted research would be useful inthis area.
5. Determine the interrelationships between the new measures and cur-rent pre-enlistment measures--Work still remains on this objective,but the data collected to date show that the new measures have muchvariance that is not shared with the ASVAB, and that the across-domain shared variance is low (e.g., the new cognitive measureshave low correlations with the non-cognitive measures).
6. and 7. Determine the level of prediction of soldier performance,classification efficiency, and incremental validity of the new mea-sures--The jury is still out on these questions since the data that
1-7
36
will enable us to address these objectives have not yet been ana-
lyzed.
We turn now to a description of the initial research activities de-voted to development of new predictors, specifically: literature review;expert judgments; development, administration, and analysis of the Prelim-inary Battery; and initial development of a computer battery. As Figure1.2 shows, all of these activities led up to the development of the PilotTrial Battery.
1-8
3 7
LITERATURE REVIEW
Purpose
The overriding purpose of the literature review was, simply put, tomake maximum use of earlier research on the problem of accurately pre-dicting job performance and classifying persons into jots in such a waythat both the person and the organization receive maximum benefits. Morespecifically, we wished to identify those variables or constructs, andtheir measures, that had proven effective for such purposes. As Figure 1.2shows, the information obtained from the literature review was used in allthe immediately succeeding research activities.
Search Procedures
The search was conducted by the three research teams, each responsiblefor a fairly broadly defined area of human abilities or characteristics:cognitive abilities; non-cognitive characteristics such as vocational in-terests, biographical data, and measures of temperament; and psychomotor/-physical abilities. While these domains were convenient for purposes oforganizing and conducting literature search activities, they were not usedas (nor intended to be) a final taxonomy of possible predictor measures.
The literature search was conducted in late 1982 and early 1983. Ineach of the three areas, the teams carried out essentially the same steps:
1. Compile an exhaustive list of possibly relevant reports, articles,books, or other sources.
2. Review each source and determine its relevancy for the project byexamining the title and abstract (or other brief review).
'3. Obtain the sources identified as relevant in the second step.
4. For relevant materials, carry out a thorough review and transferrelevant information onto special review forms developed for theproject.
In the first step, several activities were designed to insure ascomprehensive a list as possible. Several computerized searches of rele-vant data bases were done; Appendix A names and describes the data basessearched. Across all three ability areas, more than 10,000 sources wereidentified via the computer search. (Of course, many of these sources wereidentified as relevant in more than one area, and were thus counted morethan once.)
In addition to the computerized searches, we obtained reference listsfrom recognized experts in each area, emphasizing the most recent researchin the field. We also obtained several annotated bibliographies frommilitary research laboratories. Finally, we scanned the last severalyears' editions of research journals that are frequently used in eachability area, as well as more general sources such as textbooks, handbooks,and appropriate chapters in the Annual Review of Psychology (which reviewsthe most recent research in a number of conceptually distinct areas ofpsychology).
The vast majority of the sources identified were not relevant to ourpurpose--that is, the identification and development of promising measuresfor personnel selection in the U.S. Army. These nonrelevant sources wereweeded out in Step 2. The relevant sources were obtained and reviewed, andtwo forms were completed for each source: an Article Review form and aPredictor Review form (several of the latter could be completed for eachsource). These forms were designed to capture, in a standard format, theessential information about the reviewed sources, which varied considerablyin their organization and reporting styles.
The Article Review form contained seen sections: citation, abstract,list of predictors (keyed to the Predictor Review forms), descriptiun ofcriterion measures, description of sample(s), description of methodology,other results, and reviewer's comments. The Predictor Review form alsocontained seven sections: description of predictor, reliability, norms/descriptive statistics, correlations with other predictors, correlationswith criteria, adverse impact/differential validity/test fairness, andreviewer's recommendations (about the usefulness of the predictor). Each
predictor was tentatively classified into an initial working taxonomy ofpredictor constructs (based primarily on the taxonomy described in Petersonand Bownas, 1982). Appendix B contains copies of these two forms.
Literature Search Results
The Review forms and the actual sources that had been located wereused in two primary ways. First, three working documents were written, onefor each of the three areas. (These work documents were put into ARIResearch Note form: Toquam, Corpe, Ounnette and Keyes, in preparation;McHenry and Rose, in preparation; Hough, Kampe, and Barge, in preparation-)These documents identified and summarized the literature with regard toissues important to the research being conducted, the most appropriateorganization or taxonomy of the constructs in each area, and the validitiesof the various measures for different types of job performance criteria.Second, the predictors identified in the review were subjected to further,structured scrutiny in order to (1) select tests, and inventories to makeup the Preliminary Battery, and (2) select the "best bet" predictorconstructs to be used in the expert judgment research activity.
Screening of Predictors
An initial' list was compiled of all predictor measures that seemedeven remotely appropriate for Army selection and classification. This listwas further screened by eliminating measures according to several "knock-out factors: (1) measures developed for a single research project only;(2) measures designed for a narrowly specified population/occupationalgroup (e.g., pharmacy students); (3) measures targeted toward younger agegroups; (4) measures requiring special apparatus for administration;(5) measures requiring unusually long testing times; (6) measures requiringdifficult or subjective scoring; and (7) measures requiring individualadministration.
Knockout factor (4) was applicable only with regard to screening forthe Preliminary Battery, which could not have any computerized tests or
1-10

other apparatus since it was to be administered early in the project,before such testing devices could be developed. Factor (4) was j appliedwith regard to screening measures for inclusion in the expert judgmentprocess.
AppliceJon of knockout factors resulted in a second list of candidatemeasures. Each of these measures was evaluated on the 12 factors shown inFigure 1.3, by at least two researchers. (A 5-point rating scale wasapplied to each of the 12 factors.) Discrepancies in ratings were resolvedby discussion. We point out that there was not always sufficient informa-tion for a variable to allow a rating on all factors.
This second list of measures, each with a set of evaluations, wasin at to (1) the final selection of measures for the Preliminary Batteryant (2) the final selection of constructs to be included in the expertjudgment process, to which we now turn.
'1 0
1111111MMIIIMEMM.
. Discriminability - extent to which the measure has sufficient scorerange and variance, i.e., does not suffer from ceiling and floor
effects with respect to the applicant population.
. Reliability - degree of reliability as measured by traditional psycho-metric methods such as test-retest, internal consistency, or parallel
forms reliability.
.Group Score Differences (Differential Impact) - extent to which thereare mean and variance differences in scores across groups defined by
age, sex, race, or ethnic groups; a high score indicates little or nomean differences across these groups.
. Consistency/Robustness of Administration and Scoring - extent to whichadministration and scoring As standardized, ease of administration andscoring, consistency of administration and scoring across administra-tors and locations.
S. Generality - extent to which predictor measures a fairly general orbroad ability or construct.
. Criterion-Related Validity the level of correlatior of the predictc:
as a measure of job performance, training performance and turnover/at-trition.
7. Construct Validity - the amount of evidence existing to support thepredictor as a measure of a distinct construct (correlational studies,experimental studies, etc.).
8, race Validity/Applicant Acceptance extent to which the appearanceand administration methods of the predictor enhance or detract fromits plausibility or acceptability to laymen as an appropriate test for
:he Army.
9. Differential Validity - existence of significantly differentcriterion-related validity coefficients between groups of legal orsocietal concern (race, sex, age); a high score indicates little orno differences in validity for these groups,
10. Test Fairness - degree to which slopes, intercepts, and standarderror% of estimate differ-across groups of legal or societal concern(race, sex, age) when predictor scores are regressed on importantcriteria (job performance, turnover, training); a high score indicatesfairness (little or no differences in slopes, intercepts, and standarderrors of estimate).
li. Usefulness of Classification - extent to which the measure or predic-tor will be useful in classifying persons into different specialties.
Overll Usefulness for Predicting Army Criteria - extent to whichpredictor is likely to contribute to the overall or Individual predic-tion of criteria important to the Army (e.g., AWOL, drug use, attri-tion, unsuitability, job performance, and training).
Figure 1.3. Factors used to evaluate predictor meaAres for the Preliminary Battery.
4j 1-12
EXPERT JUDGMENTS
kussigh and Rational e
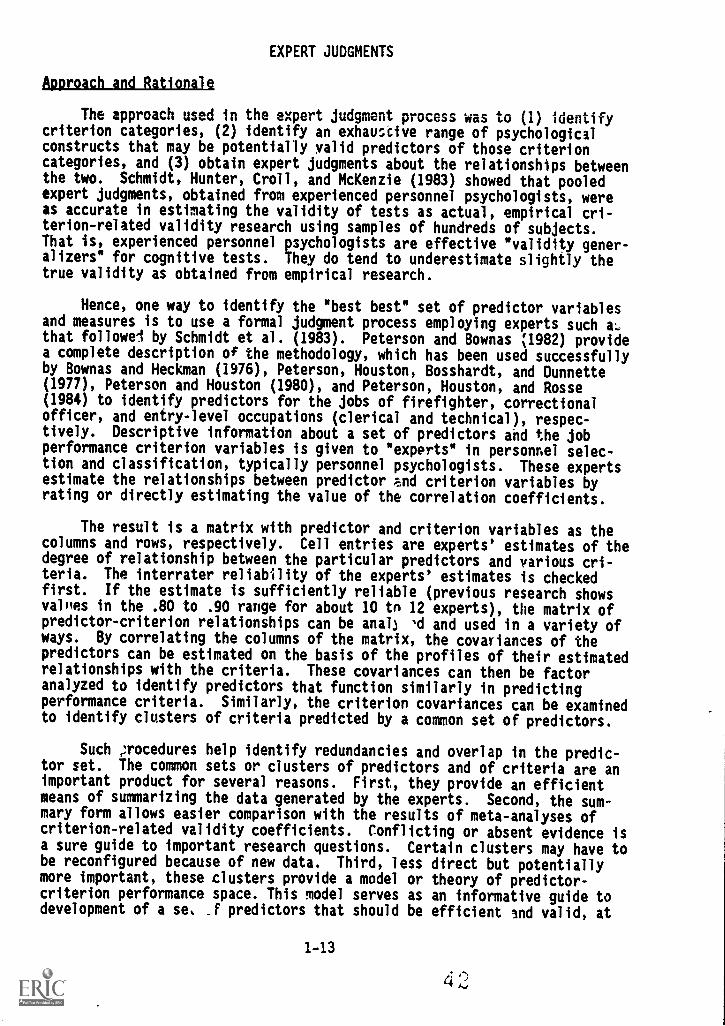
The approach used in the expert judgment process was to (1) identifycriterion categories, (2) identify an exhau:cive range of psychologicalconstructs that may be potentially valid predictors of those criterioncategories, and (3) obtain expert judgments about the relationships betweenthe two. Schmidt, Hunter, Croll, and McKenzie (1983) showed that pooledexpert judgments, obtained from experienced personnel psychologists, wereas accurate in estimating the validity of tests as actual, empirical cri-terion-related validity research using samples of hundreds of subjects.That is, experienced personnel psychologists are effective "validity gener-alizers" for cognitive tests. They do tend to underestimate slightly thetrue validity as obtained from empirical research.
Hence, one way to identify the "best best" set of predictor variablesand measures is to use a formal judgment process employing experts such
al..
that followed by Schmidt et al. (1983). Peterson and Bownas ;1982) providea complete description of the methodology, which has been used successfullyby Bownas and Heckman (1976), Peterson, Houston, Bosshardt, and Dunnette(1977), Peterson and Houston (1980), and Peterson, Houston, and Rosse(1984) to identify predictors for the jobs of firefighter, correctionalofficer, and entry-level occupations (clerical and technical), respec-tively. Descriptive information about a set of predictors and the jobperformance criterion variables is given to "experts" in personnel selec-tion and classification, typically personnel psychologists. These expertsestimate the relationships between predictor ;nod criterion variables byrating or directly estimating the value of the correlation coefficients.
The result is a matrix with predictor and criterion variables as thecolumns and rows, respectively. Cell entries are experts' estimates of thedegree of relationship between the particular predictors and various cri-teria. The interrater reliability of the experts' estimates is checkedfirst. If the estimate is sufficiently reliable (previous research showsvaries in the .80 to .90 range for about 10 to 12 experts), the matrix ofpredictor-criterion relationships can be anal 'd and used in a variety ofways. By correlating the columns of the matrix, the covariances of thepredictors can be estimated on the basis of the profiles of their estimatedrelationships with the criteria. These covariances can then be factoranalyzed to identify predictors that function similarly in predictingperformance criteria. Similarly, the criterion covariances can be examinedto identify clusters of criteria predicted by a common set of predictors.
Such procedures help identify redundancies and overlap in the predic-tor set. The common sets or clusters of predictors and of criteria are animportant product for several reasons. First, they provide an efficientmeans of summarizing the data generated by the experts. Second, the sum-mary form allows easier comparison with the results of meta-analyses ofcriterion-related validity coefficients. Conflicting or absent evidence isa sure guide to important research questions. Certain clusters may have tobe reconfigured because of new data. Third, less direct but potentiallymore important, these clusters provide a model or theory of predictor-criterion performance space. This model serves as an informative guide todevelopment of a se, predictors that should be efficient and valid, at
1-13
4 2
least insofar as the informed opinion of knowledgeable experts can propelone in that direction.
To carry out the expert judgment a( Avity, we had to identify predic-tor and criterion variables and prepare materials that would enable theexperts to provide reliable estimates of validity.
Identification of Predictor Variables
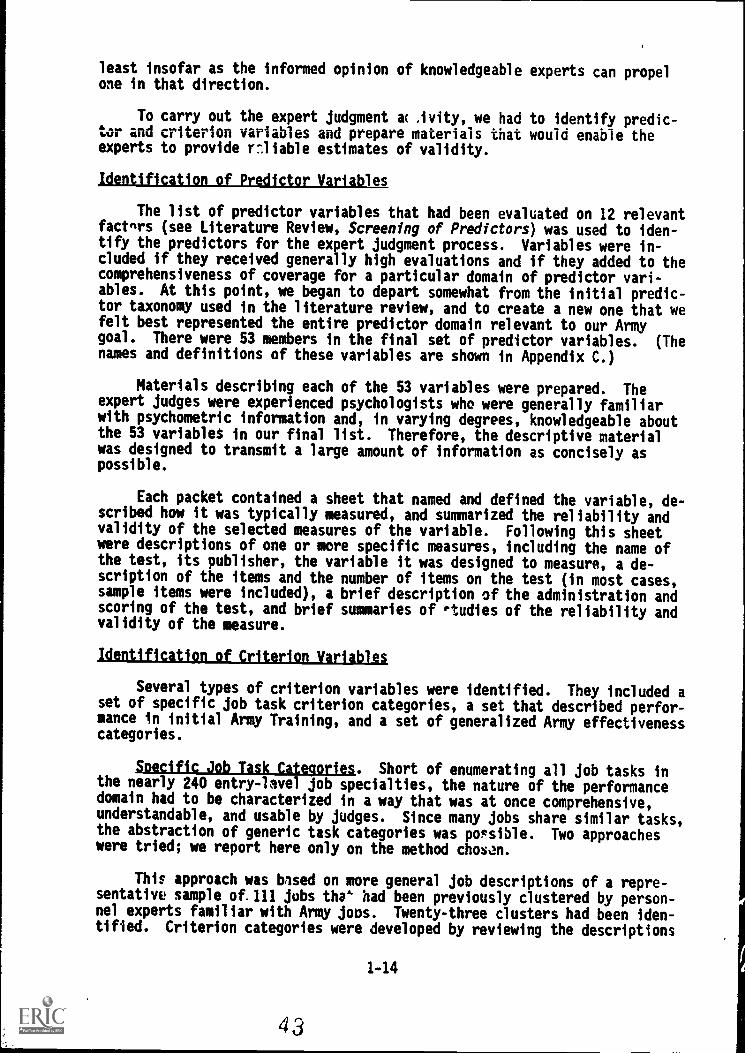
The list of predictor variables that had been evaluated on 12 relevantfact "rs (see Literature Review, Screening of Predictors) was used to iden-tify the predictors for the expert judgment process. Variables were in-cluded if they received generally high evaluations and if they added to thecomprehensiveness of coverage for a particular domain of predictor vari-ables. At this point, we began to depart somewhat from the initial predic-tor taxonomy used in the literature review, and to create a new one that wefelt best represented the entire predictor domain relevant to our Armygoal. There were 53 members in the final set of predictor variables. (Thenames and definitions of these variables are shown in Appendix C.)
Materials describing each of the 53 variables were prepared. Theexpert judges were experienced psychologists who were generally familiarwith psychometric information and, in varying degrees, knowledgeable aboutthe 53 variables in our final list. Therefore, the descriptive materialwas designed to transmit a large amount of information as concisely aspossible.
Each packet contained a sheet that named and defined the variable, de-scribed how it was typically measured, and summarized the reliability andvalidity of the selected measures of the variable. Following this sheetwere descriptions of one or more specific measures, including the name ofthe test, its publisher, the variable it was designed to measure, a de-scription of the items and the number of items on the test (in most cases,sample items were included), a brief description of the administration andscoring of the test, and brief summaries of 'tudies of the reliability andvalidity of the measure.
Identification of Criterion Variables
Several types of criterion variables were identified. They included aset of specific job task criterion categories, a set that described perfor-mance in initial Army Training, and a set of generalized Army effectivenesscategories.
Specific Job Task Categories. Short of enumerating all job tasks inthe nearly 240 entry -level job specialties, the nature of the performancedomain had to be characterized in a way that was at once comprehensive,understandable, and usable by judges. Since many jobs share similar tasks,the abstraction of generic task categories was possible. Two approacheswere tried; we report here only on the method chosen.
This approach was based on more general job descriptions of a repre-sentative sample of.111 jobs the had been previously clustered by person-nel experts familiar with Army join. Twenty-three clusters had been iden-tified. Criterion categories were developed by reviewing the descriptions
1-14
43
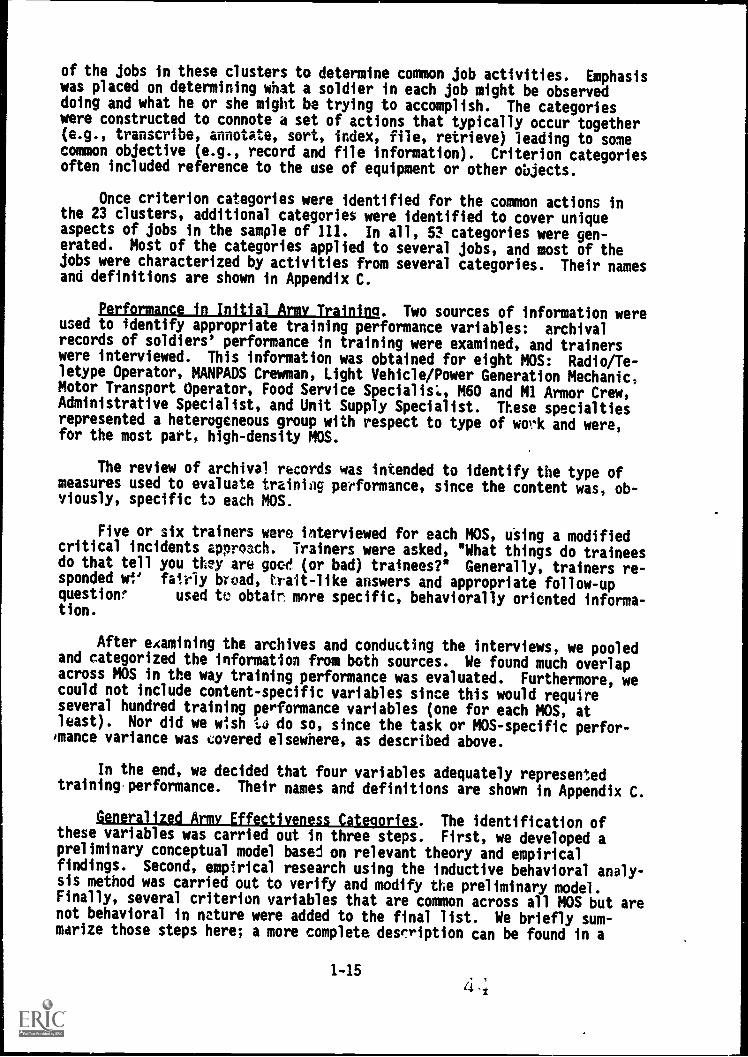
of the jobs in these clusters to determine common job activities. Emphasiswas placed on determining what a soldier in each job might be observeddoing and what he or she might be trying to accomplish. The categorieswere constructed to connote a set of actions that typically occur together(e.g., transcribe, annotate, sort, index, file, retrieve) leading to somecommon objective (e.g., record and file information). Criterion categoriesoften included reference to the use of equipment or other objects.
Once criterion categories were identified for the common actions inthe 23 clusters, additional categories were identified to cover uniqueaspects of jobs in the sample of 111. In all, 53 categories were gen-erated. Most of the categories applied to several jobs, and most of thejobs were characterized by activities from several categories. Their namesand definitions are shown in Appendix C.
Performance in Initial Armv Training. Two sources of information wereused to identify appropriate training performance variables: archivalrecords of soldiers' performance in training were examined, and trainerswere interviewed. This information was obtained for eight MOS: Radio/Te-letype Operator, MANPADS Crewman, Light Vehicle/Power Generation Mechanic,Motor Transport Operator, Food Service Specialis"., M60 and M1 Armor Crew,Administrative Specialist, and Unit Supply Specialist. These specialtiesrepresented a heterogeneous group with respect to type of wort and were,for the most part, high-density MOS.
The review of archival records was intended to identify the type ofmeasures used to evaluate training performance, since the content was, ob-viously, specific to each MOS.
Five or six trainers were interviewed for each MOS, using a modifiedcritical incidents approach. Trainers were asked, "What things do traineesdo that tell you they are goer! (or bad) trainees?" Generally, trainers re-sponded wi' fairly broad, trait-like answers and appropriate follow-upquestion' used to obtain more specific, behaviorally oriented informa-tion.
After examining the archives and conducting the interviews, we pooledand categorized the information from both sources. We found much overlapacross MOS in the way training performance was evaluated. Furthermore, wecould not include content-specific variables since this would requireseveral hundred training performance variables (one for each MOS, atleast). Nor did we wish to do so, since the task or MOS-specific perfor-mance variance was covered elsewhere, as described above.
In the end, we decided that four variables adequately representedtraining performance. Their names and definitions are shown in Appendix C.
Generalind Armv Effecttveness Categories. The identification ofthese variables was carried out in three steps. First, we developed apreliminary conceptual model based on relevant theory and empiricalfindings. Second, empirical research using the inductive behavioral analy-sis method was carried out to verify and modify the preliminary model.Finally, several criterion variables that are common across all MOS but arenot behavioral in nature were added to the final list. We briefly sum-marize those steps here; a more complete description can be found in a
1-154 .;
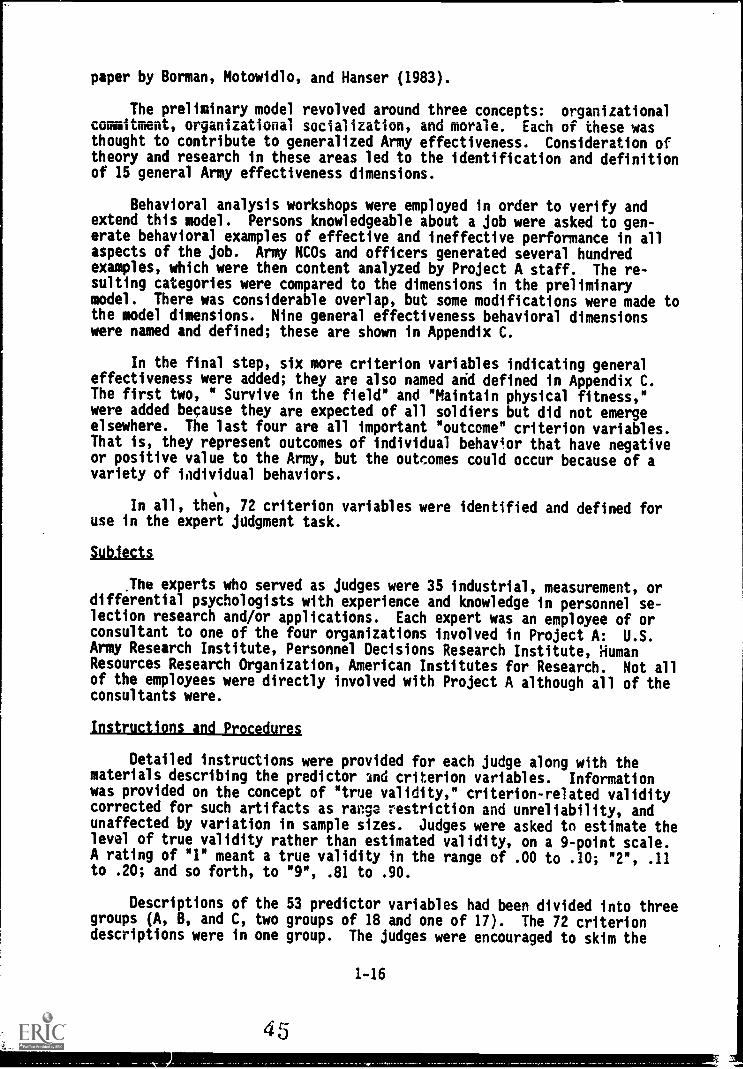
paper by Borman, Motowidlo, and Hanser (1983).
The preliminary model revolved around three concepts: organizationalcommitment, organizational socialization, and morale. Each of these wasthought to contribute to generalized Army effectiveness. Consideration oftheory and research in these areas led to the identification and definitionof 15 general Army effectiveness dimensions.
Behavioral analysis workshops were employed in order to verify andextend this model. Persons knowledgeable about a job were asked to gen-erate behavioral examples of effective and ineffective performance in allaspects of the job. Army NCOs and officers generated several hundredexamples, which were then content analyzed by Project A staff. The re-sulting categories were compared to the dimensions in the preliminarymodel. There was considerable overlap, but some modifications were made tothe model dimensions. Nine general effectiveness behavioral dimensionswere named and defined; these are shown in Appendix C.
In the final step, six more criterion variables indicating generaleffectiveness were added; they are also named and defined in Appendix C.The first two, " Survive in the field" and "Maintain physical fitness,"were added because they are expected of all soldiers but did not emergeelsewhere. The last four are all important "outcome" criterion variables.That is, they represent outcomes of individual behav4or that have negativeor positive value to the Army, but the outcomes could occur because of avariety of individual behaviors.
In all, then, 72 criterion variables were identified and defined foruse in the expert judgment task.
SubJects
.The experts who served as judges were 35 industrial, measurement, ordifferential psychologists with experience and knowledge in personnel se-lection research and/or applications. Each expert was an employee of orconsultant to one of the four organizations involved in Project A: U.S.Army Research Institute, Personnel Decisions Research Institute, HumanResources Research Organization, American Institutes for Research. Not allof the employees were directly involved with Project A although all of theconsultants were.
Instructions and Procedures
Detailed instructions were provided for each judge along with thematerials describing the predictor and criterion variables. Informationwas provided on the concept of "true validity," criterion-related validitycorrected for such artifacts as range restriction and unreliability, andunaffected by variation in sample sizes. Judges were asked to estimate thelevel of true validity rather than estimated validity, on a 9-point scale.A rating of "1" meant a true validity in the range of .00 to .10; "2", .11to .20; and so forth, to "9", .81 to .90.
Descriptions of the 53 predictor variables had been divided into threegroups (A, B, and C, two groups of 18 and one of 17). The 72 criteriondescriptions were in one group. The judges were encouraged to skim the
1-16
materials for a few predictors and for all the criteria before beginningthe rating task.
Each judge then estimated the validity of each predictor for each cri-terion. The order of the predictor groups (A, B, C) was counterbalancedacross judges, with about one-third of the 35 judges beginning with Group A(Predictors 1-18), another one-third with Group B (Predictors 19-36), andthe rest with Group C (Predictors 37-53).
Ratings were made on separate Judgment Record Sheets. Before makingany judgments about a predictor, the expert was to read the description andreview the examples given to measure it; judgments were to be made aboutthe predictor as a construct, not about the variable as measured by anyspecific instrument. The judge was then to read the description of thefirst criterion and to estimate the validity of that predictor for thatcriterion. Judgments could be either positive or negative; positive signswere not to be entered. The judge was then to read the description of thesecond criterion and rate the validity of the same predictor for thatcriterion. The judge was to estimate the validities of the first predictorvariable for all 72 criteria before moving to the next predictor.
All judges completed the task during the first week of October.1983.
Results
A number of analyses were carried out: reliability of the judgments,means and standard deviations of the estimated validities within eachpredictor/criterion cell and for various marginal values, and factor an-alyses of the predictors (based on their validity profiles across thecriteria) and the criteria (based on their validity profiles across thepredictors).
.The estimated validities were highly reliable when averages were used.The reliability of the mean estimated cell validities was .96. The factoranalyses were based on these cell means. Thq most pertinent analysis forpurposes of this report concerns the factor analysis of the predictors.
Factor solutions with two through 24 factors were calculated. Thenine-factor solution was selected as most meaningful. Eight of the ninefactors were interpretable; one was not interpreted. The eight interpret-able factors were named: Cognitive Abilities, Visualization/Spatial, In-formation Processing, Mechanical, Psychomotor, Social Skills, Vigor, Moti-vation/Stability.
These eight factors appeared to be composed of 21 clusters, based onthe profile of loadings of each predictor variable across all the factors.This hierarchical structure of the predictor variables is shown inFigure 1.4. Inspection of the profiles clarifies the meanings both of thefactors and of the clusters, as follows.
The eight predictor factors divide the predictor domain intoappearing parts. The first five refer to abilities and skills incognitive, perceptual, and psychomotor areas while the last threetraits or predispositions, in the noncognitive area. Most of thetative measures of the constructs defining the first five factors
1-17
4
reasonable-therefer torepresen-are of
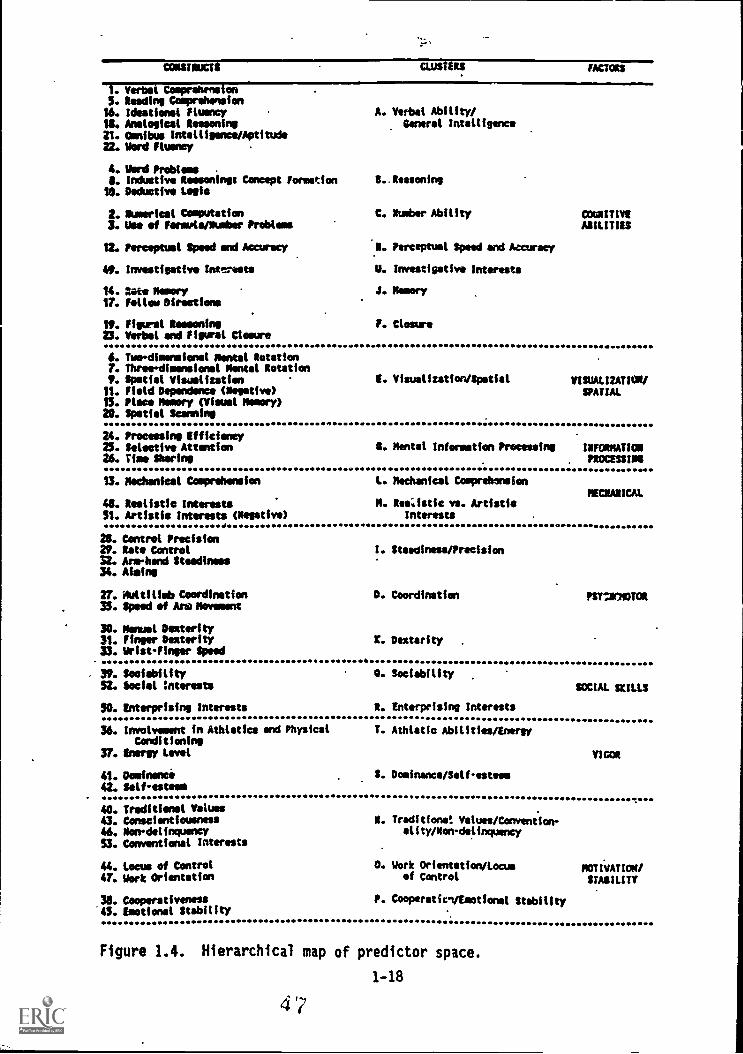
. Verbei Cosprebrns on5. Reeding ComprAinsion16. Idesticesi Fluency18. Analogical Reasoning21. Omnibus intelligence /Aptitude
22. Word fluency
4. Word ProblemsI. Inductive Ressonings Concept Formation10. Deductive Logic
2. Ouserical Computation3. Use of Feramle/Ikaber Problems
12. Perceptual Speed andlfturer,
49. Investigative Into. -Ests
14. sate Moor/17. Follow Directions
19. Figural ReasoningU. Verbal and Figural Closure
A. Verbal Ability/General Intelligence
C. *umber Ability
R. Perceptual Speed andAzturacy
U. Investigative Interests
J. Memory
F. Closure
COCNITIVIABILITIES
6. Tws-dimensiond Mental Rotation7. Three-dimensional Mental Rotation0. Spatial Visualisation11. FieltiDependince (Negstive)15. Place Memory (Visual Memory)20. Spatial Scanning
1. Visualization/Spatial VISUALIZATION/SPATIAL
24. Processing Efficiency15. Selective Attention26. Time Sharing
S. Mental Information Processing INFORMATICS. ptOCESSINS
13. Mechanical Comprehension
48. Realistic Interests51. Artistic Interests (Negative)
28. Control Precision29. Rate Control32. Arm -hand Steadiness34. Aiming
27. Nultilimb Coordination35. Speed if Arm Movement
3D. Minuet Dexterity31. Finger Dexterity33. WristFinger Speed
L. Mechanical Cosprehansion
M. Riaastic vs. ArtisticInterests
MUNANICAL
S. Steadiness/Precision
D. Coordination
K. Dexterity .
PST'211710TOR
39. Sociability52. Social Interests
50. Enterprising Interests
O. Sociability
R. Enterprising Interests
SOCIAL SKILLS
36. Involvement in Athletics and PhysicalConditioning
37. Energy Level
41. Daiwa42. Self-esteem
T. Athletic Abilities/Energy
S. Dominance/Self-esteem
VIGOR
40. Traditional Values43. Conscientiousness46. Non-delinquency53. Conventional Interests
44. Locus of Control47. Work Orientation
38. Cooperativeness.45. IMmtionel Stability
N. Traditions: Values/Conveniionality/Non-delinquency
0. Work Orientation/Locus MOTIVATION/of Control STABILITY
P. Cooperatien/Emotionel Stability
Figure 1.4. Hierarchical map of predictor space.
1-18
4'7
maximal performance while most of the representative measures of the lastthree factors are of typical performance, with the exception of the in-terest variables.
The first four factors, which include 11 clusters of 29 predictor con-structs or variables, are cognitive-perceptual in nature. The first fac-tor, labeled "Cognitive Abilities," includes seven clusters, five of whichappear to consist of more traditional mental test variables: Verbal Abil-ity/General Intelligence, Reasoning, Number Ability, Memory, Closure. ThePerceptual Speed and Accuracy cluster is linked to measures having a longhistory of inclusion in traditional mental tests. The seventh cluster,Investigative Interests, refers to no cognitive test at all but does tapinterest in things intellectual, the abilities for which are evaluated inthis factor.
The second factor, Visualization/Spatial, consists of only one clusterbut includes six constructs which have some history of assessment of spa-tial ability. Two of the clusters from the Cognitive Abilities factor,Reasoning and Closure, have some affinity to this second factor, as may beseen in the factor analysis data. This may be due to the tasks used toillustrate the assessment of the constructs, which are to solve problems ofa visual and nonverbal nature. The third factor, Information Processing,also consists of only one cluster, with the three constructs referring moredirectly to coghitive-perceptual functioning rather than accumulated knowl-edge and/or structure.
The fourth factor, Mechanical, includes two clusters, one of whichconsists only of the construct of Mechanical Comprehension while the otheris, again, an interest cluster consisting of a positive loading for Realis-tic Interests and negative loading for Artistic Interests.
The fifth factor, Psychomotor, consists of three clusters which in-clude the nine psychomotor constructs. The first cluster, Steadiness/Pre-cision, refers to aiming and tracking tasks, where the target may movesteadily or erratically. The second cluster, Coordination, indexPq thelarge-scale complexity of the response required in a psychomotor bask whilethe third factor, Dexterity, appears to index the small-scale complexity ofresponses.
The remaining three factors, noncognitive in character, refer more tointerpersonal activities. The Social Skills factor consists of two clus-ters. The first, Sociability, refers to a general interest in people whilethe second, Enterprising Interests, refers to a more specific interest inworking successfully with people. The seventh factor is called "Vigor" asit includes two clusters that both refer to general activity level. Thefirst, Athletic Abilities/Energy, includes two constructs which point to-wards a physical perspective while the second cluster, Dominance/Self-Esteem, points toward a psychological perspective.
The eighth and last factor, Motivation/Stability, includes three clus-ters or facets. The first, Traditional Values, includes both temperamentmeasures and interest scales, and refers to being rule-abiding and a goodcitizen. The second cluster, Work Orientation, refers to temperamentmeasures which index attitudes towards the individual vis-a-vis his/herefforts in the world. The third cluster, Cooperation/Stability, appears to
1-19
refer to skill in getting along with people, including getting along withoneself in a healthy manner.
The expert judgment task resulted in a hierarchical model of predictorspace that served as a guide for the development of new, pre-enlistment
measures (the Pilot Trial Battery, see Figure 1.2) for Army enlisted ranks.
(Wing, Peterson, and Hoffman, 1984, provide a detailed presentation of theexpert judgment process and results.) This model was not the unly set ofinformation that guided the development of the Pilot Trial Battery, how-ever. We turn now to the other major source of guidance, the development,administration, and initial analyses of the Preliminary Battery.
1-20
4 5
PRELIMINARY BATTERY
Puroose
The Preliminary Battery (PB) was conceived of as a set of proven "off-the-shelf" measures of predictors that overlapped very little with theArmy's current pre-enlistment predictors. There were two primary reasonsfor developing and administering a Preliminary Battery. First, the collec-tion of data on a number of predictors that represent the types of predic-tors not currently in use by the Army would allow an early determination ofthe extent to which such predictors contributed unique variance, that is,measured attributes not measured by current pre-enlistment predictors. Thisinformation would be useful for guiding the development of new predictorsinto areas most likely to be useful for increasing the accuracy of predic-tion and classification.
Second, the collection of predictor data (from soldiers in training)early in the project allowed the conduct of a predictive validity inves-tigation much earlier in the project than if we were to wait until theTrial Battery was developed (see Figure 1.2). Thus, the extent to whichthe different (from ASVAB) constructs represented in the Preliminary Bat-tery added to the prediction of training success and effectiveness of jobperformance could be ascertained via a predictive design approximately 18months and 36 months after Project A began, rather than many months laterthan that.
Selection of Preliminary Battery Measures
As described earlier, the literature review identified a large set ofpredictor measures, each with ratings by the researchers on 12 psychometricand substantive evaluation factors (see Figure 1.3). These ratings wereused to select a smaller set of measures as serious candidates for inclu-sion in the Preliminary Battery. Two major practical constraints came intoplay: (1) no apparatus or individualized testing methods could be usedbecause of the relatively short time available to prepare for batteryadministration, and the fact that the battery would be administered to alarge number of soldiers (several thousand! over a 9-month period by rela-tively unsophisticated test administratvs, and (2) only 4 hours wereavailable for testing.
Task 2 researchers made an initial selection of "off-the-shelf" mea-sures, but there were still too many measures for the time available. Thetentative list was referred to the Army Research Institute scientistsresponsible for Task 2 specifically, and Project A generally, and to theProject A Director and Principal Investigator. The available informationabout each measure (construct measured, psychometric characteristics, typeof job performance criteria it had predicted or was thought likely topredict) was presented and discussed. The set of measures selected wasthen reviewed by several consultants external to Project A, who had beenretained for their expertise in various predictor domains. These expertsmade several "fine-tuning" suggestions.
The Preliminary Battery included the following:
o Eight perceptual-cognitive measures
i-21
- Five from the Educational Testing Service (ETS) French Kit(Ekstrom, French, and Harman, 1976)
- Two from the Employee Aptitude Survey (EAS) (Ruch and Ruch, 1980)
- One from the Flanagan Industrial Tests (FIT) (Flanagan, 1965)
Q Eighteen scales from the Air Force Vocational Interest Career Exam-ination (VOICE) (Alley and Matthews, 1982)
o Five temperament scales adapted from published scales
- Two from the Differential Personality Questionnaire (DPQ)(Tellegen, 1982)
- One from the California Psychological Inventory (CPI) (Gough,1975)
- The Rotter I/E scale (Rotter, 1966)
- Validity scales from both the DP1 and the Personality ResearchForm (PRF) (Jackson, 1967)
o Owen's Biographical Questionnaire (BQ) (Owens and Schoenfeldt,1979). The BQ could be scored for either 11 scales for males or 14for females, based on Owen's research, or for 18 predesignated,combined-sex scales developed for this research and called RationalScales. The rational scales had no item on more than one scale;some of Owen's scales included items on more than one scale. Itemstapping religious or socio-economic status were deleted from Owens'instrument for this use, and items tapping physical fitness and vo-cational- technical course work were added.
Appendix D shows all the scale names and numbers of items for thePreliminary Battery.
In addition to the Preliminary Battery, scores were available for theArmed Services Vocational Aptitude Battery, which all soldiers take priorto entry into service. ASVAB's ten subtests are named below, with the testacronym and number of items in parentheses:
Word Knowledge (WK:35), Paragraph Comprehension (PC:15),Arithmetic Reasoning (AR:30), Numerical Operations 0!0:50),General Science (GS:25), Mechanical Comprehension (MC:25),Math Knowledge (MK:25), Electronics Information (EI:20),Coding Speed (CS:84), Auto-Shop Information (AS:25).
All but NO and CS are considered to be power tests; the two exceptionsare speeded. Prior research (in Kass, Mitchell, Grafton, & Wing, 1983) hasshown the reliability of the subtests to be within expectable limits forcognitive tests of this length (i.e., .78-.92).
51
1-22
Sample and Administration of Battery,
The Preliminary Battery was administered to soldiers entering AdvancedIndividual Training (AIT) for four MOS: 05C, Radio Teletype Operator (MOScode was later changed to 31C); 19 E/K, Armor Crewman; 63B, Vehicle andGenerator Mechanic; and 71L, Administrative Specialist. Almost all sol-diers entering AIT for these MOS during the period 1 October, 1983 to 30June, 1984 completed the Preliminary Battery. We are here concerned onlywith the sample of soldiers who completed the battery from 1 October, 1983to 1 December, 1983, approximately 2,200 soldiers.
The battery was administered at five training posts by civilian ormilitary staff already employed on site. Task 2 staff traveled to thesesites to deliver battery administration manuals and to train the personswho would administer the battery. A full day of training was provided, in-cluding a complete reading of the administration manual, role-playingpractice in reading test and inventory instructions, completion of alltests and inventories by the administrators, and question-and-answer ses-sions about each chapter of the administration manual. Thereafter, Task 2staff contacted each post each vaek by telephone to receive progress re-ports and answer questions. Administrators at posts also called Task 2staff whenever they had questions. The experience in training batteryadministrators and monitoring the administration over the nine-month periodprovided useful'information for the data collection efforts involving thePilot Trial Battery and Trial Battery.
We note here that the Preliminary Battery was administered to a sampleof 40 soldiers at Fort Leonard Wood prior to its implementat'on in order to'test the instructions, timing, and other administration procedures. Theresults of this tryout were used to adjust the procedures, prepare themanual, and identify topics to be emphasized during administrator training.
Analyses
An initial set of analyses was performed on the Preliminary Batterydata to inform the development of the Pilot Trial Battery (PTB). (The PTBwas intended to include newly developed tests and inventories that wouldmeasure the important abilities and traits identified via the literaturereview and expert judgment process. These PTB measures would be pilotedand field tested and then revised to become the Trial Battery. SeeFigure 1.2 for a flow chart showing the sequencing of the various bat-teries.) We summarize those findings here. They are more completelyreported in Hough, Dunnette, Wing, Houston, and Peterson (1984).
Three types of analyses were done. First, the psychometric charac-teristics of each scale were explored to pinpoint possible problems withthe measures or the construct being measured, so those problems could beavoided when the Pilot Trail Battery measures were developed. These anal-yses included descriptive statistics, item analyses (including numbers ofitems attempted in the time allowed), internal consistency reliabilityestimates, and, for the temperament inventory, percentage of subjectsfailing the scales intended to detect random or improbable response pat-terns.
Second, the covariances of the scales within and across the various
1-23
conceptual domains (i.e., cognitive, temperament, biographical data, andvocational interest) were investigated to detect excessive redundancy amongthe PB mea4ees, especially across the domains. If such redundancies weredetected, then steps could be taken to avoid such a problem in the PilotTrial Battery. Third, the covariances of the PB scales with ASVAB measureswere studied to identify any PB constructs that showed excessive redundancywith ASVAB constructs--again, so that steps could be taken to alleviatesuch'1roblems for the Pilot Trial Battery. Correlation matrices and factoranalyses were the major methods of analysis for these second and thirdpurposes.
The psychometric analyses showed some problems with the cognitivetests. The time limits appeared too stringent for several tests, and onetest, Hidden Figures, appeared to be much too difficult for the populationbeing tested. Since most of the cognitive tests used in the PreliminaryBattery had been developed on college samples or other samples somewhatbetter educated than the population seeking entry into the Army, thesefindings were not unexpected. The lesson learned was that the Pilot TrialBattery measures needed to be accurately, targeted (in difficulty of itemsand time limits) toward the population of persons seeking entry into theArmy. No serious problems were unearthed for the temperament, biodata,and interest scales. Item-total correlations were acceptably high and inaccordance with prior findings, and score distributions were not exces-sively skewed or different from expectation. About 8% of subjects failedthe scale that screened for inattentive or random responding on the temper-ament inventory, a figure that is in accord with findings in other selec-tion research.
Covariance analyses showed that vocational interest scales were rela-tively distinct from the biographical and temperament scales, but thelatter two types of scales showed considerable covariance. Five factorswere identified from the 40 non-cognitive scales, two that were primarilyvocational interests and three that were combinations of biographical dataand temperament scales. These findings led us to consider, for the PilotTrial Battery, combining biographical and temperament item types to measurethe constructs in these two areas. The five non-cognitive factors showedrelative independence from the cognitive PB tests, with the median absolutecorrelations of the scales within e;4ch of the five factors with each of theeight PB cognitive tests ranging from .01 to .21. This confirmed ourexpectations of little or no overlap between the cognitive and non-cogni-tive constructs.
Correlations and factor analysis of the ten ASVAB subtests and theeight PB cognitive tests confirmed prior analyses of the ASVAB (Kass, etal., 1983) and the relative independence of the PB tests. Although some ofthe ASVAB-PB test correlations were fairly high (the highest was .57), mostwere less than .30 (49 of the 80 correlations were .30 or less, 65 were .40or less). The factor analysis (principal factors extraction, varimaxrotation) of the 18 tests showed all eight PB cognitive tests loadinghighest on a single factor, with none of the ASVAB subtests loading higheston that factor. The non-cognitive scales overlapped very little with thefour ASVAB factors identified in the factor analysis of the ASVAB subtestsand PB cognitive tests. Median correlations of non-cognitive scales withthe ASVAB factors, computed within the five non-cognitive factors, rangedfrom .03 to .32, but 14 of the 20 median correlations were .10 or less.
1-24
COMPUTER BATTERY DEVELOPMENT
Roughly speaking, four phases of activities led up to the developmentof computerized predictor measures for the Pilot Trial Battery: (1) infor-mation gathering about past and current research in perceptual/psychomotormeasurement and computerized methods of testing such abilities; (2) con-struction of a demonstration computer battery, and a continuation of infor-mation gathering; (3) selection of commercially available microprocessorsand peripheral devices, writing of software for testing several abilitiesusing this hardware, and try out of this hardware and software; (4) con-tinued development of software, and design and construction of a custom-made peripheral device, which we called a response pedestal.
Background
Compared to the paper-and-pencil measurement of cognitive abilitiesand the major non-cognitive variables (temperament, biographical data, andvocational interests), the computerized measurement of psychomotor andperceptual abilities was in a relatively primitive state of knowledge.Much work had 1.,qn done in World War II using electro-mechanical apparatus,but relatively ..ttle work had occurred since then. Microprocessor tech-nology held out the promise of revolutionizing measurement in this area,but the work was (and still is) in its early stages. It was clear, how-ever, that cognitive ability testing was moving into a computer-assistedenvironment through tt.. .ethodology of adaptive testing. As Project Abegan, work was under way to implement the ASVAB via computer-assistedtesting methods in the Military Entrance Processing Stations. Therefore,it was also sensible from a practical point of view to investigate thesemethods of testing.
It was with this backdrop of relatively little research-based knowl-edge, excitement at the prospect of microprocessor-driven and, therefore,accurate and reliable testing, and the looming implementation of comput-erized testing in the military environment, that we began our work.
Blase I. Information G4therinq
The two major activities in this phase were literature review andvisits to several military laboratories that were engaged in apparatus,simulator, or microprocessor-driven testing of psychomotor and other abili-ties.
The literature review procedures were described earlier. Almost noliterature was available on computerized, especially microprocessor-driven,testing of psychomotor/perceptual abilities for selection/classificationpurposes. Considerable literature was available on the taxonomy or struc-ture of such abilities, based primarily on work done in World War II orshortly thereafter. Work from this era showed that testing such abilitieswith electro-mechanical apparatus did show useful levels of validity forsuch jobs as aircraft pilot, but that such apparatus had reliability prob-lems. This information focused our attention on the types of abilitiesthat would provide an efficient, yet comprehensive, coverage of this abil-ity domain, confirmed the notion that testing such abilities could yielduseful validities, but emphasized the problems with unreliability in theuse of electro-mechanical apparatus.
1-25
To obtain the most current information, in the spring of 1983 wevisited four military laboratories engaged in relevant research: the AirForce Human Resources Laboratory (AFHRL), Brooks Air Force Base; the NavalAerospace Medical Research Laboratory (NAIIRL), Pensacola Naval Air Station;the Army Research Institute Field Unit at Fort Rucker, Alabama; and theArmy Research Institute Field Unit at For, Ki;ox, Kentucky. We were primar-
ily after the answers to five questions:
1. What computerized measures are in use?
We found more than sixty different measures in use across the foursites. (Appendix E shows the names, location, and associated hard-ware/software for these measures.) A sizable number were special-ized simulators that were not relevant for Project A (e.g., ahelicopter simulator weighing several tons that is permanentlymounted in an air-conditioned building). However, many measures inthe perceptu.1, cognitive, and psychomotor areas were relevant.
2. What computers were selected for use? and,
3. What computer languages are being used?
We obsetved three d, :erent microprocessors in use--the Apple,Terak, and PDP 11--and three different computer languages-- PASCAL,BASIC, and FORTRAN. There appeared to be relative's little incommon among the sites in terms of the hardwar. /software used.
4. How reliable are these computerizeu measures? and,
5. What criterion-related validity evidence exists for these measuresso far?
Data were currently being collected at all four sites to addressthe reliability and criterion- related validity questions, but verylittle documented information was available. The research at AFHRLwas at the point of administering computerized measures to fairlylarge samples of subjects. This was also true of the research atFort Rucker, where they expected to have validity data collectedand analyzed by sometime in 1984.
A number of the measures had been under study at NAMRL for sometime, but criterion-related validity had not been the primary focusIf their work. The prototype information processing measures de-veloped there had been shown to be sensitive to individual differ-ences within chronological age groups as well as to age-relatedchanges across different age groups. We were not able to observethese measures directly as they were being administered off-site,under NAMRL contract at the Aviation Research Laboratory in Illi-nois, but the research was described to us in some detail.
1-26
5 o

Data on the computerized measures at Fort Knox were being analyzed.Their efforts apparently were hampered by severe range restrictionin the predictors as well as some problems with the criterionmeasures. They were finding significant, positive correlationsbetween microprocessor measures and their higher fidelity, "hands-on" counterparts.
To summarize, little information was then available on the reliabilityor criterion-related validity of the computerized measures in use at thesites. This was not surprising since most of the measures had been devel-oped only recently.
Nevertheless, we learned some valuable lessons. First, large-scaletesting can be carried out on microprocessor equipment (ARK was doingso). Second, a variety of software and hardware can produce satisfactoryresults, but we should carefully evaluate options before making thesechoices. Third, it would be highly desirable to have the testing devicesor apparatus be as compact and simple in design as possible, in order tominimize *down" time and make transportation feasible. Fourth, we began toform the impression that it would be highly ::esirable to develop our soft-ware and hardware devices to be as completely self-administering (i.e.,little or no input required from test monitors) as possible and as imper-vious as possible to prior experience with typewriting and playing videogames.
Phase 2. Demonstratton Battery
After conducting the site visits, we programmed a short demonstrationbattery in the BASIC language on the Osborne 1, a portable microprocessor.The purpose was to implement some of the techniques and procedures observedduring the visits in order to determine the degree of difficulty of suchprogramming, and to get an idea of the quality of results to be expectedfrom.using a common portable microprocessor and a language that is commonto many machines but has some disadvantages in processing power, speed, andflexibility.
This short battery was self-administering, recorded time-to-answer andthe answer made, and contained five tests: simple reaction time (pressinga key when a stimulus appeared), choice reaction time (pressing one of twokeys in response to one of two stimuli), perceptual speed and accuracy(comparing two alphanumeric phrases for similarity), verbal comprehension(vocabulary knowledge), and a self-rating form (indicating which of twoadjectives ."best " describes the examinee, on a 7-point scale). We alsoexperimented with the programming of several types of visual trackingtests, but did not include these in the self-administered demonstrationbattery.
No data were collected with this demonstration battery, but it ful-filled its intended purposes. Experience in developing and using thebattery convinced us that the BASIC language did not allow enough power andcontrol of timing events to be useful for our purposes. The ()clic methodsfor controlling stimulus presentation and response acquisition through akeyboard were thoroughly explored. Techniques for developing a self-administering battery of tests were tried out.
1-27
The second activity during this phase was consultation at the Univer-sity of Illinois with three experts about perceptual/psychomotor abilitiesand their measurement. We met with them to review what we had learnedfrom our activities to date, discuss our near-term development plans, andget their reactions. We also discussed their program of research in thisarea and observed their computerized testing facility. The major pointsthat emerged from this meeting were:
o Generally speaking, it may be difficult to obtain discriminantvalidity with the addition of new predictors (beyond the ASVAB),but the approach being taken by Project A Task 2 seems to allow themaximal opportunity for this to occur and it allows the testing ofthe hypothesis.
o The results obtained in World War II using electro-mechanical,psychomotor testing apparatus probably do generalize to the presentera in terms of the structure of abilities and the usefulness ofsuch abilities for predicting job performance in jobs like aircraftpilot.
o The taxonomy of psychomotor skills and abilities probably should beviewed in a hierarchical fashion, and perhaps Project A's develop-ment efforts would be best focused on two or three relatively high-level abilities such as gross motor coordination, multilimb con-stant processing tasks, and fine manipulative dexterity.
o Rate of learning or practice effects are viewed as a major concernfor evaluating the usefulness of psychomotor ability measures forpredicting on-the-job performance. If later test performance (af-ter many trials) was much more valid than early test performance(early trials), or worse, if early test performance was not validand later test performance was, then it is unlikely that psychomo-for testing would be practically feasible in the operational mili-tary-selection environment. There are, however, no empiricallybased answers to these questions, and it is acknowledged thatresearch is necessary to obtain answers, especially with micropro-cessor-driven testing methods.
Phase 3. Selection/Purchase of Microprocessors and Development/Trvout_ofSoftware
On the basis of the information from the first two phases, we definedthe desirable characteristics of a microprocessor useful for our research.A prime consideration was transportability. Almost all of our pilottesting and other data collection efforts would take place at various fieldsites throughout the United States and Europe. We would not be able tobuild a stationary laboratory and bring the soldiers to the site.
Following are the desired characteristics as we outlined them in theFall of 1983:
1 Charles Hulin, John Adams, and Phillip Ackerman were the consultants.
1-28
1. Reliability--This encompasses several considerations. First, themachine should be manufactured and maintained by a company that hasa history of backing its products and, even more basic, is likelyto remain in business. Second, thn machine itself should be fairlyrugged and capable of being carri,j around without breaking down.
2. Portability--Since we will need to transport the computer to sev-eral posts during development efforts, the machine should be asportable as possible, and, if feasible, extremely easy to assembleand disassemble.
3. Most Recent Generation of Machine--Progress is very rapid in thisarea; therefore, we should get the latest "proven" type of machine.That means getting a 16-bit microprocessor rather than an 8-bitmicroprocessor. This way, the software developed will be morelikely to be usable on future machines.
4. Compatibility--Although extremely difficult to achieve, a desirablegoal is to have a machine that is maximally compatible with othermachines, or that will have software that will be compatible withother machines. Thus, we think a CPM-based machine or some versionof the 8088 chip is best.
5. Appropriate Display Size, Memory Size, Disk Drives, Graphics, andPeripheral Capabilities--We need a video display that is at leastnine inches (diagonally), but it need not be a color monitor.Since we will be devcloping experimental software, we need a rela-tively large amount of random access memory, and 256 K seems to bethe largest memory size that is generally available. (Laterproject efforts to create maximally efficient use of memory mayconsiderably reduce this requirement.) Also we require two floppydisk drives to store needed software and to record subjects' re-sponses. High-resolution graphics capability is desirable for someof the kinds of tests we will develop. Finally, since several ofthe ability measurement processes will require the use of paddles,joysticks, or other similar devices, the machine must have theappropriate hardware and software to allow this.
The characteristics listed in the above statement were used as cri-teria for evaluating commercially available microprocessors. Most machineswere eliminated because they were very new on the market and thus had nohistory, or they were made by relatively unknown manufacturers.
In the end we selected Compaq portable microprocessors with 256 Krandom access memory, two 320 K-byte disk drives, a "game board" for ac-cepting input from peripheral devices such as joysticks, and software forFORTRAN, PASCAL, BASIC, and assembly language programming. Six of thesemachines were purchased in December 1983. We also purchased six commer-cially available, dual-axis joysticks.
We then developed the initial version of the software needed to testseveral perceptual/psychomotor abilities that we were reasonably certainwould be chosen for final inclusion in the Pilot Trial Battery, althoughthose abilities had not yet been finally selected. We had three general,operational objectives in mind for the software to be produced: (1) as far
1-29
5 s)
as possible, it should be transportable to other microprocessors; (2) itshould require as little intervention as possible from a test administratovin the process of presenting the tests to subjects and storing the data;and (3) it should enhance the standardization of testing by adjusting forhardware differences across computers and response pedestals.
We first had to choose a primary language. We chose to prepare thebulk of the software using the PASCAL language as implemented by Microsoft,Inc. PASCAL is a common language and it is implemented using a compilerthat permits modularized development and software libraries. As computerlanguages go, PASCAL it relatively easy for others to read and it can beimplemented on a variety of computers.
Some processes, mostly those that are specific to the hardware config-uration, had to be written in IBM-PC assembly language. Examples includeinterpretation of the peripheral device inputs, reading of the real-time-clock registers, calibrated timing loops, and specialized graphics andscreen manipulation routines. For each of these identified functions, aPASCAL-callable "primitive" routine with a unitary purpose was written inassembly language. Although the machine-specific code would be useless ona different type of machine, the functions were sufficiently simple andunitary in purpose so that they could be reproduced with relative ease.
The overall strategy of the software developr nt was to take advantageof each researcher's input as directly as possible. It quickly becameclear that the direct programming of every item in every test by one person(a programmer) was not going to be very successful in terms of either timeconstraints or quality of product. To make it possible for each researcherto contribute his/her judgment and effort to the project, it was necessaryto plan so as to, as much as possible, take the "programmer" out of thestep between conception and product and enable researchers to create andenter items without having to know special programming.
The testing software modules were designed as "command processors"which interpreted relatively simple and problem-oriented commands. Thesewere organized in ordinary text written by the various researchers usingword processors. Many of the commands were common across all tests. Forinstance, there were commands that permitted writing of specified text to"windows" on the screen and controlling the screen attributes (brightness,background shade, etc); a command could hold a display on the screen for a
period measured to 1/100th-second accuracy. There were commands thatcaused the program to wait for the respondent to push a particular button.Other commands caused the cursor to disappear or the screen to go blankduring the construction of a complex display.
Some of the commands were specific to particular item types. Thesecommands were selected and programmed according to the needs of a particu-lar test type. For each item type, we decided upon the relevant stimulusproperties to vary and built a command that would allow the item writer toquickly construct a set of commands for items which he or she could theninspect on the screen.
These techniques made it possible for entire tests to be constructedand experimentally manipulated by psycNologists who could not program acomputer.
1-30
As this software was written, we used it to administer the comput-erized tests to small groups of soldiers (N = 5 or fewer) at the Minnea-polis Military Entrance Processing Station (MEPS). These soldiers weretold about Project A, that their participation was voluntary and the testresults would not affect their status, but that we needed to have them trytheir very best so that we could evaluate the tests. They were also askedto write down anything about the tests that bothered them or any problemsthey encountered during the testing, and told that the researchers wouldtalk to them about the computerized test battery when they were finished.The soldiers completed the battery without assistance from the researchers,unless it was absolutely necessary, and were then questioned.
The nature of these questions varied over the progress of these devel-opmental tryouts, but mainly dealt with clarity of instructions, diffi-culty of tests or test items, screen brightness problems, difficultiesusing keyboard or joysticks, clarity of visual displays, and their general(favorable/unfavorable) reaction to this type of testing.
These tryouts were held from 20 January 1984 through 1 March 1984,and a total of 42 persons participated in nine sessions. The feedback fromthe participants was extremely useful in determining the shape of thetests, prior to tne first pilot test of the Pilot Trial Battery. Aftereach tryout, we would modify the software to clarify instructions, makeitem or test difficulties more appropriate, make stimulus displays andsequences of events more appropriate, and so forth. We also performedsimple analyses of the data collected, but mainly to insure that responseswere being captured and recorded correctly--not for any substantive an-alyses of the tests or constructs.
At the end of Phase 3, we had developed a self-administering, comput-erized test battery that was implemented on a Compaq portable computer.The subjects responded on the normal keyboard for all tests except atracking test that required them to use a joystick. This joystick was acommercially available device normally used for video games. Seven dif-ferent tests had been programmed. These were not necessarily tests wewished to include in the Pilot Trial Battery, out five did eventually endup in that battery.
Phase 4. Continued Software Development and Design/Construction of aResponse Pedestal.
During the fourth phase, several significant events took place duringMarch-May 1984. An in-progress-review (IPR) meeting was held at which wepresented the results of the development efforts to date and receivedguidance on next efforts from ARI staff, the Scientific Advisory Groupsubcommittee assigned to Task 2, and other Project A researchers. We madefield observations of some combat MOS in order to inform the further devel-opment of computerized tests; the first pilot test of the computerizedbattery we:. completed; and we designed and constructed a custom-made re-sponse pedestal for the computerized battery.
The primary result of the in-progress-review was the identificationand prioritization of the ability constructs for which computerized testsshould be developed. Chapter 5 describes these constructs in some detail.
1-31
Co
A second result of the review was a decision to go to the field to observeseveral combat arms MOS in order to target the tests more closely to thoseskills, insofar as that was possible.
These field observations subsequently took place at several posts.They were relatively informal; we simply observed soldiers (usually a verysmall number) working at their jobs in the field and, where possible, askedquestions to clarify their activities. We did complete a brief checklistthat required a rating of the degree of importance for the job of severalcognitive, perceptual, and psychomotor abilities; these checklists were notformally analyzed but were used for later discussions and developmentefforts. We also operated various training aids and simulators availableduring our visits. The MOS for which we were able to complete these fieldobservations were: 11B (Infantryman), 138 (Cannon Crewman), 19K (ArmorCrewman), 16S (MANPADS Crewman), and 05C (Radio Teletype Operator).
On one of these site visits we were able to administer the comput-erized battery to several trainers (for Armor Crewman, 19K). The primaryoutcome of their feedback was a decision to develop a test that utilizedmilitary aircraft and vehicle profiles in an identification task. Theirsuggestion corroborated our field observations that such a test seemed moreappropriate than a test then in the battery that was intended to predictskill at target identification (this test had been adapted from the HiddenFigures test in'the ETS battery).
The first pilot test of the Pilot Trial Battery occurred at FortCarson during this phase. (See Chapter 2 for a description of the sampleand procedures of that pilot test.) For the computerized tests, the sameprocedures were used as for the MEPS tryouts described above in Phase 3. Atotal of 20 soldiers completed the computerized battery.
The information from this pilot test primarily confirmed a majorconcern that had surfaced during the MEPS tryouts, namely the undesirabil-ity of the computer keyboard and commercially available joysticks foracquiring test responses. Feedback from subjects (and our observations)indicated that (1) it was difficult to pick out one or two keys on thekeyboard, and (2) fairly elaborate, and therefore confusing, instructionswere needed to use the keyboard in this manner. Even with such instruc-tions, subjects often missed the appropriate key, or inadvertently pressedthe keys because they were leaving their fingers on the key in order toretain the appropriate position for response. Also, subjects varied in theway they prepared for test items, and the more or less random positioningof their hands added unwanted (error) variance to their scores.
Similar issues arose with the joysticks, but the main problems weretheir lack of durability and the large variance across joysticks in theiroperating characteristics, again adding error variance.
After consultation with ARI and other Project A researchers, we de-cided to develop a custom-made response pedestal in an attempt to alleviatethese problems. We drew up a rough design for such a pedestal and con-tracted with an engineering firm to fabricate a prototype. We tried outthe first prototype, .suggested modifications, and had six copies producedin time for the Fort Lewis pilot test in June 1984. Chapter 5 describesthe response pedestal in some detail.
61
1-32
Completing work in Phase 4 we wrote additional software to (1) testthe abilities that had been chosen for inclusion in the Pilot Trial Batteryand (2) accommodate the new response pedestal.
1-33
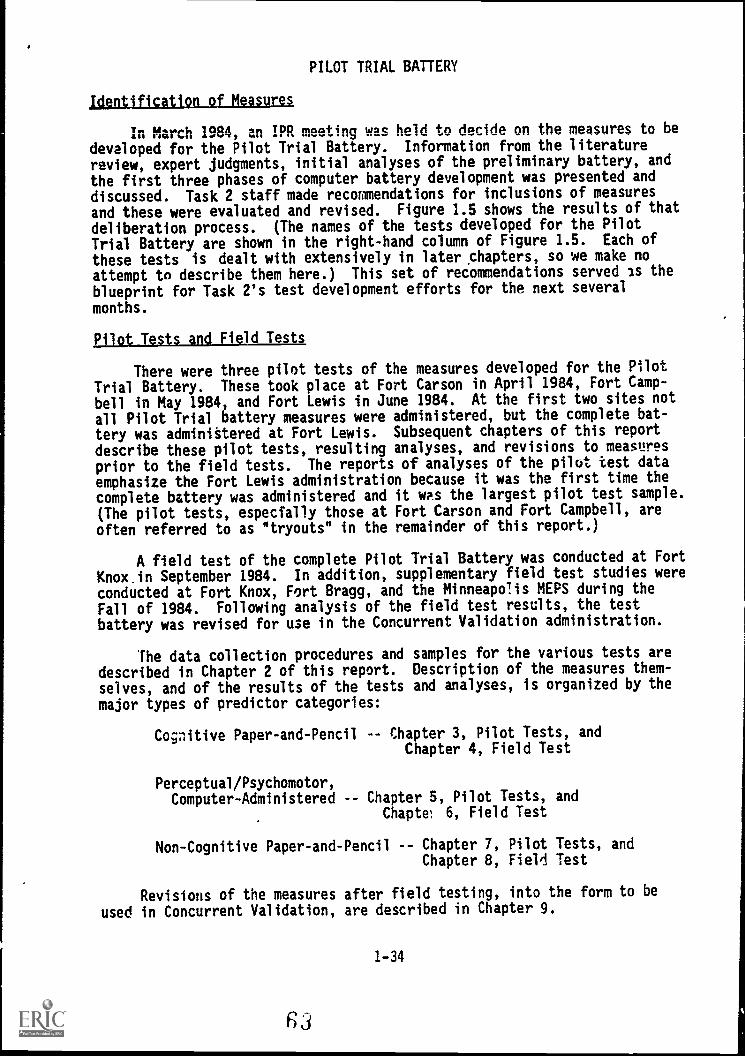
PILOT TRIAL BATTERY
jificatiop of Measures
In March 1984, an IPR meeting was held to decide on the measures to be
developed for the Pilot Trial Battery. Information from the literature
review, expert judgments, initial analyses of the preliminary battery, and
the first three phases of computer battery development was presented and
discussed. Task 2 staff made recommendations for inclusions of measuresand these were evaluated and revised. Figure 1.5 shows the results of that
deliberation process. (The names of the tests developed for the PilotTrial Battery are shown in the right-hand column of Figure 1.5. Each of
these tests is dealt with extensively in later chapters, so we make no
attempt to describe them here.) This set of recommendations served is theblueprint for Task 2's test development efforts for the next several
months.
Pilot Tests and Field Tests
There were three pilot tests of the measures developed for the Pilot
Trial Battery. These took place at Fort Carson in April 1984, Fort Camp-
bell in May 1984, and Fort Lewis in June 1984. At the first two sites not
all Pilot Trial battery measures were administered, but the complete bat-
tery was administered at Fort Lewis. Subsequent chapters of this report
describe these pilot tests, resulting analyses, and revisions to measures
prior to the field tests. The reports of analyses of the pilot test data
emphasize the Fort Lewis administration because it was the first time the
complete battery was administered and it was the largest pilot test sample.
(The pilot tests, especially those at Fort Carson and Fort Campbell, are
often referred to as "tryouts" in the remainder of this report.)
A field test of the complete Pilot Trial Battery was conducted at Fort
Knox.in September 1984. In addition, supplementary field test studies were
conducted at Fort Knox, Fort Bragg, and the Minneapolis MEPS during the
Fall of 1984. Following analysis of the field test results, the test
battery was revised for use in the Concurrent Validation administration.
The data collection procedures and samples for the various tests are
described in Chapter 2 of this report. Description of the measures them-
selves, and of the results of the tests and analyses, is organized by the
major types of predictor categories:
Cognitive Paper-and-Pencil -- Chapter 3, Pilot Tests, andChapter 4, Field Test
Perceptual/Psychomotor,Computer-Administered -- Chapter 5, Pilot Tests, and
Chapter 6, Field Test
Non-Cognitive Paper-and-Pencil -- Chapter 7, Pilot Tests, andChapter 8, Field Test
Revisions of the measures after field testing, into the form to be
used in Concurrent Validation, are described in Chapter 9.
1-34
f3
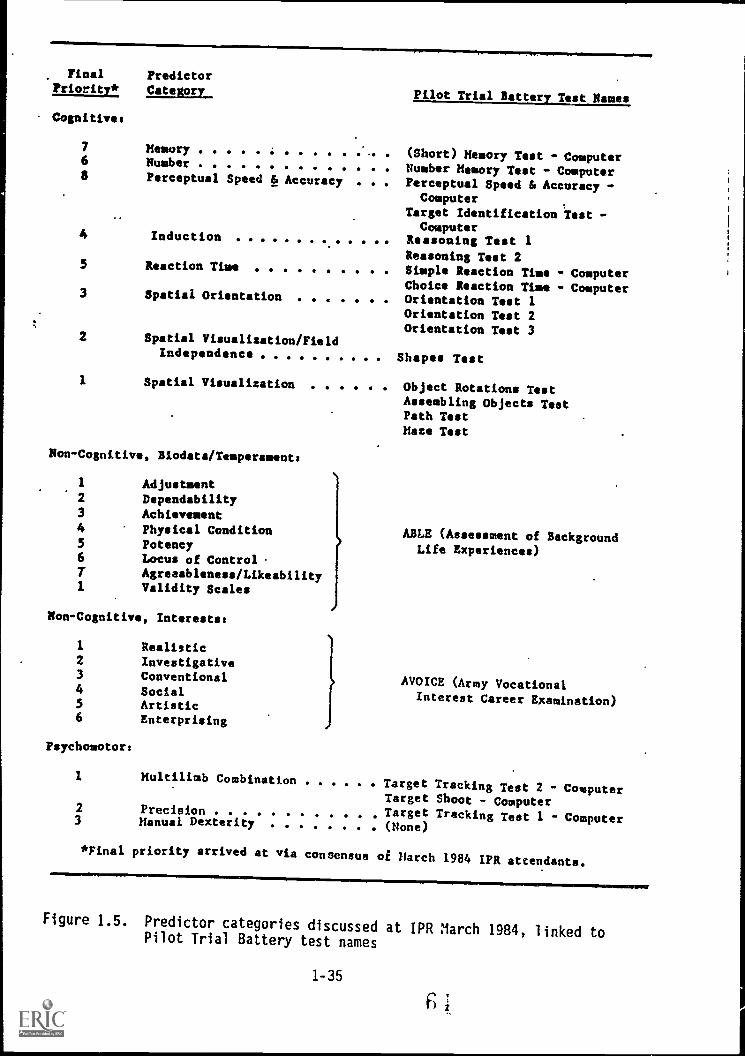
Final PredictorPriority* Category
Cognitive:
7 Memory . .
6 Number8 Perceptual Speed & Accuracy . .
4 Induction
5 Reaction Time
3 Spatial Orientation
2 Spatial Visualization/FieldIndependence
1 Spatial Visualization
Non-Cognitive, Biodata/Temperaments
1 Adjustment2 Dependability3 Achievement4 Physical Condition5 Potency6 Locus of Control
Agreaableness/Likeability1 Validity Scales
Non-Cognitive, Interests:
1 Realistic2 Investigative3 Conventional4 Social5 Artistic6 Enterprising 1
Pilot Trial Battery Test Names
(Short) Memory Test - ComputerNumber Memory Test - ComputerPerceptual Speed & Accuracy -
Computer
Target Identification Test -Computer
Reasoning Test 1Reasoning Test 2Simple Reaction Time - ComputerChoice Reaction Time - ComputerOrientation Test 1Orientation Test 2Orientation Test 3
Shapes Test
Object Rotations TestAssembling Objects TestPath TestMaze Test
ABLE (Assessment of BackgroundLife Experiences)
AVOICE (Army Vocational
Interest Career Examination)
Psychomotor:
1 Multilimb CombinationTarget Tracking Test 2 - ComputerTarget Shoot - Computer
2 Precision Target Tracking Test 1 - Computer3 Manual Dexterity (None)
*Final priority arrived at via consensus of March 1984 IPR attendants.
Figure 1.5. Predictor categories discussed at IPR March 1984, linked toPilot Trial Battery test names
1-35
Chapter 1 References
Alley, W. E., & Matthews, M. D. (1982). The vocational interest careerexamination. Journal of Psychology, 112, 169-193.
Borman, W. C., Motowidlo, S. J., & Hanser, L. M. (1983). Developing amodel of soldier effectiveness: A strategy and preliminary results.Presented at the 91st Annual Convention of the American PsychologicalAssociation, Anaheim, California. In Eaton, N.K., & Goer, M. H.
(Eds.) (1983). Improving the selection, classification, and utiliza-tion of Army enlisted personnel: Technical appendix to the annualreport (ARI Research Note 83-37).
Bownas, D. A., & Heckman, R. W. (1976). Job analysis of the entry-level
firefighter position. Minneapolis, MN: Personnel Decisions, Inc.
Ekstrom, R. B., French, J. W., & Harman, H. H. (1976). Manual for kit offactor-referenced cognitive tests. Princeton, NJ: EducationalTesting Service.
Flanagan, J. C. (1965). Flanagan industrial test manual. Chicago:
Science Research Associates.
Gough, H. G. (1975). Manual for the California Psychological Inventory.Palo Alto, CA: Consulting Psychologists Press.
Hough, L. M., Dunnette, M. D., Wing, H., Houston, J. S., & Peterson, N. G.(1984). Covariance analyses of cognitive and non-cognitive measuresof Army recruits: An initial sample of Preliminary Battery Data.Presented at the 92nd Annual Convention of the American PsychologicalAssociation, Toronto. In Eaton et al. (Eds.) (1984). Improving theselection, classifications and utilization of Army enlisted personnel:Annual report, 1984 fiscal year (ARI Technical Report 660).Alexandria, VA: Army Research Institute.
Hough, L. M., Kamp, J. D., & Barge, B. N. Literature review: Utility oftemperament, biodata, and interest assessment for predicting job
performance. ARI Research Note in preparation.
Jackson, D. N. (1967). Personality Research Form Manual. Goshen, NY:
Research Psychologists Press.
Kass, R. A., Mitchell, K. J., Grafton, F. C., & Wing, H. (1983). Factor
structure of the Armed Services Vocational Aptitude Battery (ASVAB)Forms 8, 9, and 10: 1981 Army applicant sample. Educational andPsychological Measurement, 43, 1077-1088.
McHenry, J. J., & Rose, S. R. Literature review: Validity and potentialusefulness of psychomotor ability tests for personnel selection and
classification. ARI Research Note in preparation.
Owens, W. A., & Schoenfeldt, L. F. (1979). Toward a classification of
persons. Journal of Applied Psychology Monographs, 64, 569-607.
1-36
Peterson, N. G., & Bownas, D. A. (1982). Skills, task structure, andperformance acquisition. In Marvin D. Dunnette and Edwin A. Fleishman(Eds.) Human performance and productivity (Vol. I). Hillsdale, NJ:Lawrence Erlbaum Associates.
Peterson, N. G., & Houston, J. S. (1980). The prediction of correctionalofficer job performance: Construct validation in an employment set-ting. Minneapolis, MN: Personnel Decisions Research Institute.
Peterson, N. G., Houston, J. S., Bosshardt, M. J., & Dunnette, M. D.(1977). A study of the correctional officer job at Marion Correc-tional Institution, Ohio: Development of selection procedures,training recommendations and an exit information program. Minnea-polis, MN: Personnel Decisions Research Institute.
Peterson, N. G., Houston, J. S., & Rosse, R. L. (1984.). The LOMA jobeffectiveness prediction system: Validity analyses (Technical ReportNo. 4). Atlanta, GA: Life Office Management Association.
Rotter, J. B. (1966). Generalized expectancies for internal versus exter-nal control of reinforcement. Psychological Monographs, 80, (1, WholeNo. 609).
Ruch, F. L., & Ruch, W. W. (1980). Employee Aptitude Surrey: TechnicalReport. Los Angeles, CA: Psychological Services, Inc.
Schmidt, F. L., Hunter, J. E., Croll, P. R., & KcKenzie, R. C. (1983).Estimation of employment test validities by expert nt. Journalof Applied Psychology, 68, 590-601.
Tellegen, A. (1982). Brief manual for the differential personality_questionnaire. Unpublished manuscript, University of Minnesota.
Toquam, J. L., Corpe, V. A., & Dunnette, M. D. Liieratttne review: Cognitiveabilitiestheory, hi'story, and validity. ARI Research Note inpreparation.
Wing, H., Peterson, N. G., & Hoffman, R. : (1984). Expert judgments ofpredictor-criterion validity relationships. Presented at the92nd Annual Convention of the American Psychological Association,Toronto, Ontario, Canada. In Eaton et al. (Eds.) (1984). Improvingthe selection, classification, and utilization of Army enlisted per-sonnel: Annual report, 1984 fiscal year (ARI Tehcnical Report 660).Alexandria, VA: Army Research Institute.
1-37
6
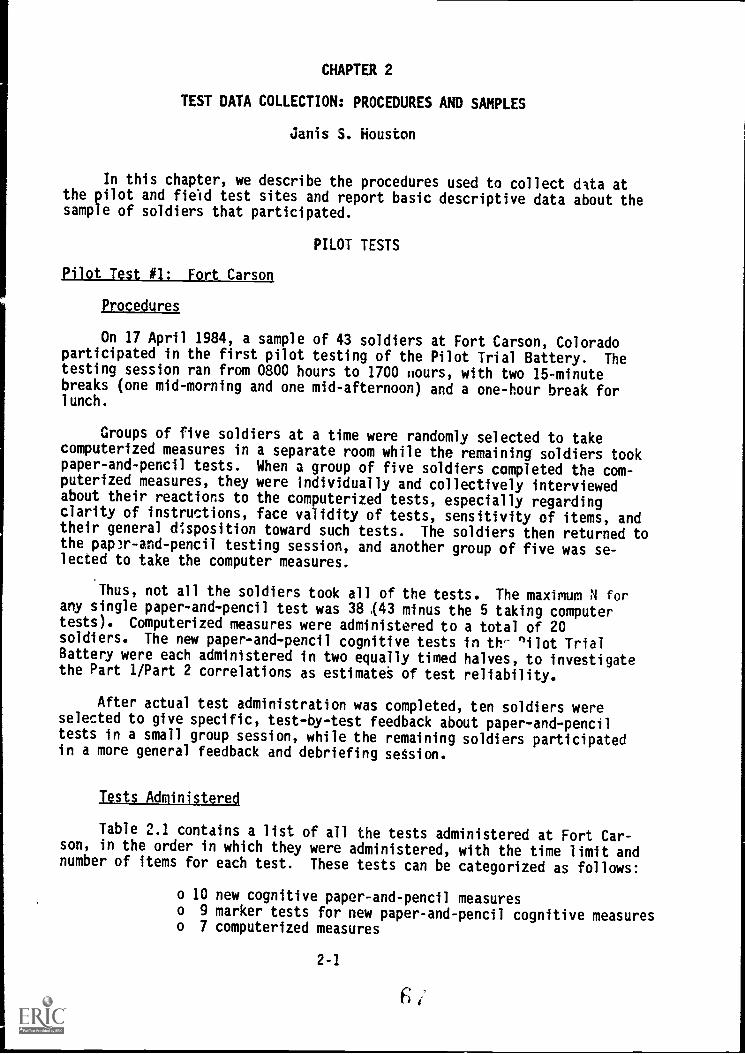
CHAPTER 2
TEST DATA COLLECTION: PROCEDURES AND SAMPLES
Janis S. Houston
In this chapter, we describe the procedures used to collect dlta atthe pilot and field test sites and report basic descriptive data about thesample of soldiers that participated.
PILOT TESTS
Pilot Test #1: Fort Carson
Procedures
On 17 April 1984, a sample of 43 soldiers at Fort Carson, Coloradoparticipated in the first pilot testing of the Pilot Trial Battery. Thetesting session ran from 0800 hours to 1700 Hours, with two 15-minutebreaks (one mid-morning and one mid-afternoon) and a one-hour break forlunch.
Groups of five soldiers at a time were randomly selected to takecomputerized measures in a separate room while the remaining soldiers tookpaper-and-pencil tests. When a group of five soldiers completed the com-puterized measures, they were individually and collectively interviewedabout their reactions to the computerized tests, especially regardingclarity of instructions, face validity of tests, sensitivity of items, andtheir general disposition toward such tests. The soldiers then returned tothe paper -and- pencil testing session, and another group of five was se-lected to take the computer measures.
Thus, not all the soldiers took all of the tests. The maximum N forany single paper-and-pencil test was 38,(43 minus the 5 taking computertests). Computerized measures were administered to a total of 20soldiers. The new paper-and-pencil cognitive tests in th- Nlot TrialBattery were each administered in two equally timed halves, to investigatethe Part 1/Part 2 correlations as estimate's of test reliability.
After actual test administration was completed, ten soldiers wereselected to give specific, test-by-test feedback about paper-and-penciltests in a small group session, while the remaining soldiers participatedin a more general feedback and debriefing session.
Tests Administered
Table 2.1 contains a list of all the tests administered at Fort Car-son, in the order in which they were administered, with the time limit andnumber of items for each test. These tests can be categorized as follows:
o 10 new cognitive paper-and-pencil measureso 9 marker tests for new paper-and-pencil cognitive measureso 7 computerized measures
2-1
6
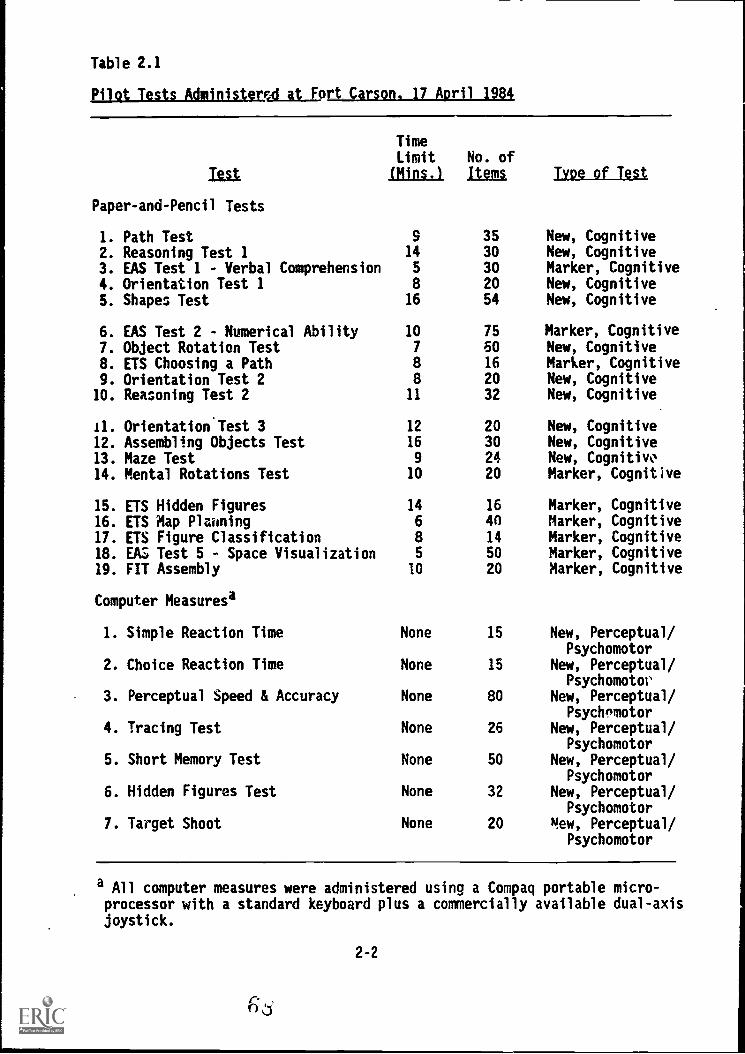
Table 2.1
Pilot:Tests Administercd at fort_Carson, 17 April 1984
T it
TimeLimit(Mins.)
No. ofItems Type of Test
Paper-and-Pencil Tests
1. Path Test 9 35 New, Cognitive2. Reasoning Test 1 14 30 New, Cognitive3. EAS Test 1 - Verbal Comprehension 5 30 Marker, Cognitive4. Orientation Test 1 8 20 New, Cognitive
5. Shapes Test 16 54 New, Cognitive
6. EAS Test 2 - Numerical Ability 10 75 Marker, Cognitive
7. Object Rotation Test 7 60 New, Cognitive8. ETS Choosing a Path 8 16 Marker, Cognitive
9. Orientation Test 2 8 20 New, Cognitive10. Reasoning Test 2 11 32 New, Cognitive
11. Orientation Test 3 12 20 New, Cognitive12. Assembling Objects Test 16 30 New, Cognitive13. Maze Test 9 24 New, Cognitive14. Mental Rotations Test 10 20 Marker, Cognitive
15. ETS Hidden Figures 14 16 Marker, Cognitive16. ETS Map Planning 6 40 Marker, Cognitive17. ETS Figure Classification 8 14 Marker, Cognitive18. EAS Test 5 - Space Visualization 5 50 Marker, Cognitive19. FIT Assembly 10 20 Marker, Cognitive
Computer Measuresa
1. Simple Reaction Time None 15 New, Perceptual/Psychomotor
2. Choice Reaction Time None 15 New, Perceptual/Psychomotor
3. Perceptual Speed & Accuracy None 80 New, Perceptual/Psychomotor
4. Tracing Test None 26 New, Perceptual/Psychomotor
5. Short Memory Test None 50 New, Perceptual/Psychomotor
6. Hidden Figures Test None 32 New, Perceptual/Psychomotor
7. Target Shoot None 20 New, Perceptual/Psychomotor
a All computer measures were administered using a Compaq portable micro-processor with a standard keyboard plus a commercially available dual-axisjoystick.
2-2
0 3
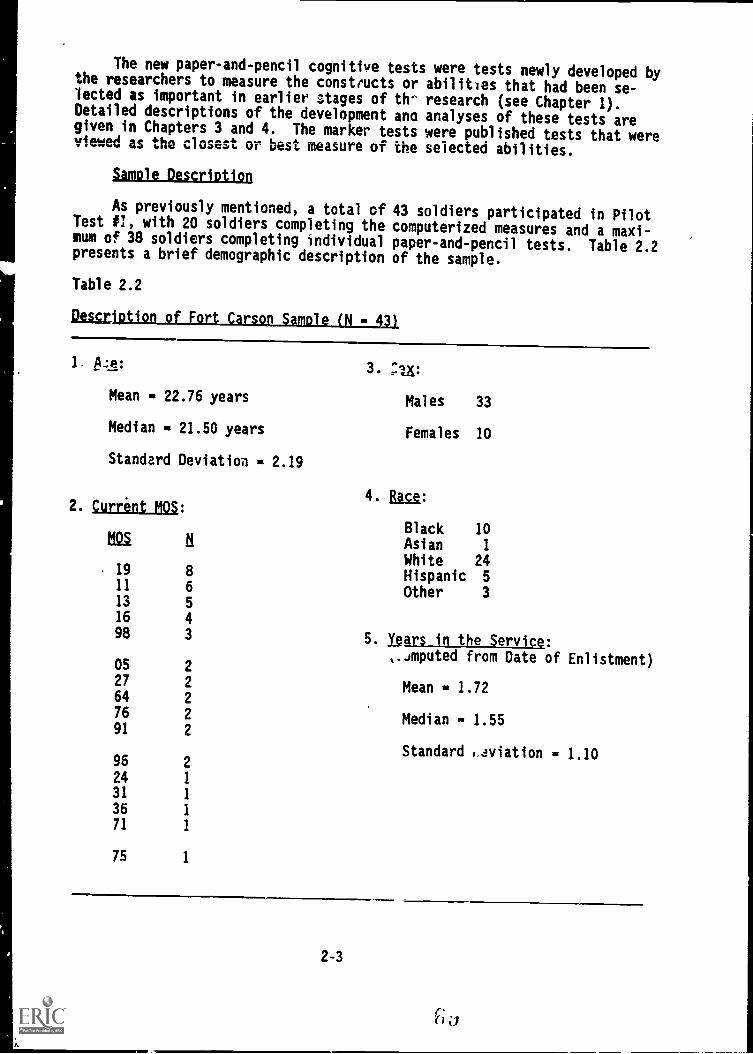
The new paper-and-pencil cognitive tests were tests newly developed bythe researchers to measure the constructs or abilities that had been se-lected as important in earlier stages of th- research (see Chapter 1).Detailed descriptions of the development and analyses of these tests aregiven in Chapters 3 and 4. The marker tests were published tests that wereviewed as the closest or best measure of the selected abilities.
Sample Description
As previously mentioned, a total cf 43 soldiers participated in PilotTest #1, with 20 soldiers completing the computerized measures and a maxi-mum of 38 soldiers completing individual paper-and-pencil tests. Table 2.2presents a brief demographic description of the sample.
Table 2.2
DescriktigndfirtLeagnlamiagjtj241).
1. Sze:
Mean = 22.76 years
Median - 21.50 years
Standard Deviation - 2.19
2. Current MOS:
3. ;120
Males 33
Females 10
4. Race:
Black 10N125, Asian 1
White 2419 8 Hispanic 511 6 Other 313 5
16 4
98 3 5. Years in the Service:imputed from Date of Enlistment)
05 2
27 2 Mean - 1.7264 2
76 2 Median - 1.5591 2
Standard ,.aviation - 1.1096 2
24 1
31 1
36 1
71 1
75 1
2-3
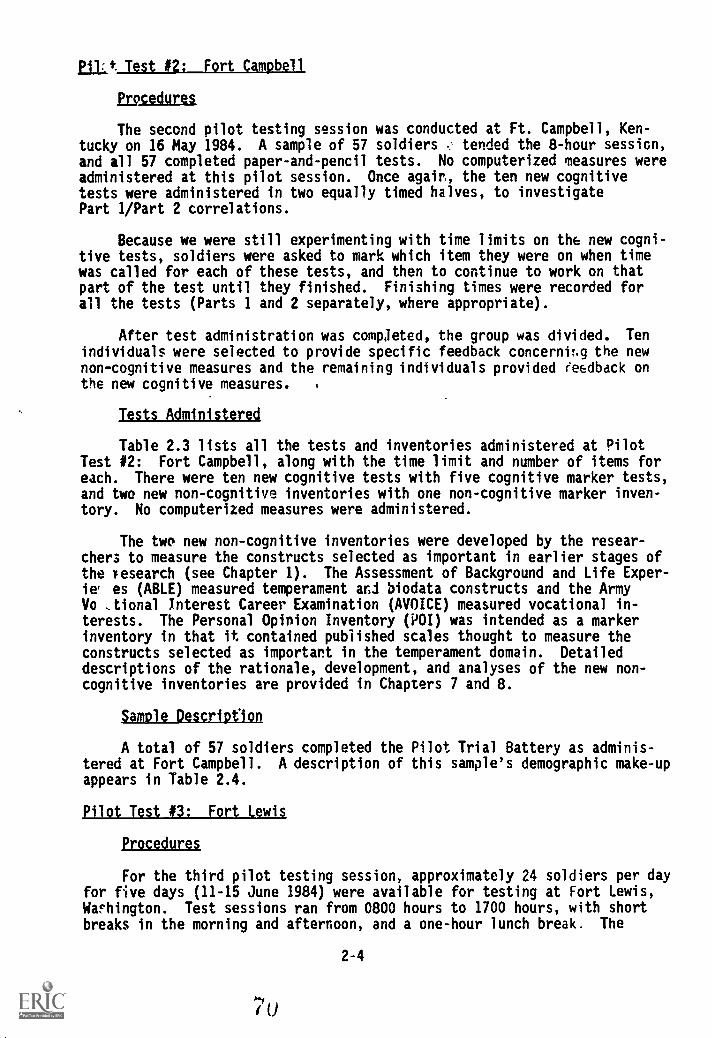
Wit Test #2: Fort Campbell
Erpcedures
The second pilot testing session was conducted at Ft. Campbell, Ken-tucky on 16 May 1984. A sample of 57 soldiers tended the 8-hour sessicn,
and all 57 completed paper-and-pencil tests. No computerized measures wereadministered at this pilot session. Once again, the ten new cognitivetests were administered in two equally timed halves, to investigatePart 1/Part 2 correlations.
Because we were still experimenting with time limits on the new cogni-tive tests, soldiers were asked to mark which item they were on when timewas called for each of these tests, and then to continue to work on thatpart of the test until they finished. Finishing times were recorded forall the tests (Parts 1 and 2 separately, where appropriate).
After test administration was completed, the group was divided. Ten
individuals were selected to provide specific feedback concernit.g the newnon-cognitive measures and the remaining individuals provided (eedback onthe new cognitive measures.
Tests Administered
Table 2.3 lists all the tests and inventories administered at PilotTest #2: Fort Campbell, along with the time limit and number of items foreach. There were ten new cognitive tests with five cognitive marker tests,and two new non-cognitive inventories with one non-cognitive marker inven-tory. No computerized measures were administered.
The two new non-cognitive inventories were developed by the resear-chers to measure the constructs selected as important in earlier stages ofthe Tesearch (see Chapter 1). The Assessment of Background and Life Exper-ie' es (ABLE) measured temperament ari biodata constructs and the ArmyVo Interest Career Examination (AVOICE) measured vocational in-terests. The Personal Opinion Inventory (POI) was intended as a markerinventory in that it contained published scales thought to measure theconstructs selected as important in the temperament domain. Detaileddescriptions of the rationale, development, and analyses of the new non-cognitive inventories are provided in Chapters 7 and 8.
Sample Description
A total of 57 soldiers completed the Pilot Trial Battery as adminis-tered at Fort Campbell. A description of this sample's demographic make-upappears in Table 2.4.
Pilot Test #3: Fort Lewis
Procedures
For the third pilot testing session, approximately 24 soldiers per dayfor five days (11-15 June 1984) were available for testing at Fort Lewis,Washington. Test sessions ran from 0800 hours to 1700 hours, with shortbreaks in the morning and afternoon, and a one-hour lunch break. The
2-4

Table 2.3
Pilot Tests Administered at Fort Campbell. 16 May 1984
Paper-and-Pencil Tests
TotalTimeLimit No. of(Mins.) LIM Type of Test
1. Path ',est 9 44 New, Cognitive2. Reasoning Test 1 14 30 New, Cognitive3. EIS Verbal Comprehension 5 30 Marker, Cognitive4. Orientation Test 1 9 30 New, Cognitive5. Shapes Test 16 54 New, Coynitive
6. Object Rotation Test 9 90 New, Cognitive7. Reasoning Test 2 11 32 New, Cognitive8. Orientation Test 2 8 20 New, Cognitive9. ABLE (Assessment of Background
and Life Experiences) None 291 New, Non-Cognitive
10. Orientation Test 3 12 20 New, Cognitive11. Assembling Objects Test 16 40 New, Cognitive12. Maze Test 8 24 New, Cognitive13. AVOICE (Army Vocational Interest
Career Examination) None 306 New, Non-Cognitive
14. ETS Hidden Figures 14 16 Marker, Cognitive15. ETS Map Planning 6 40 Marker, Cognitive16. ETS Figure Classification 8 14 Marker, Cognitive17. FIT Assembly 10 20 Marker, Cognitive18. POI (Personal Opinion Inventory) None 121 Marker, Non-Cognitive
2-5
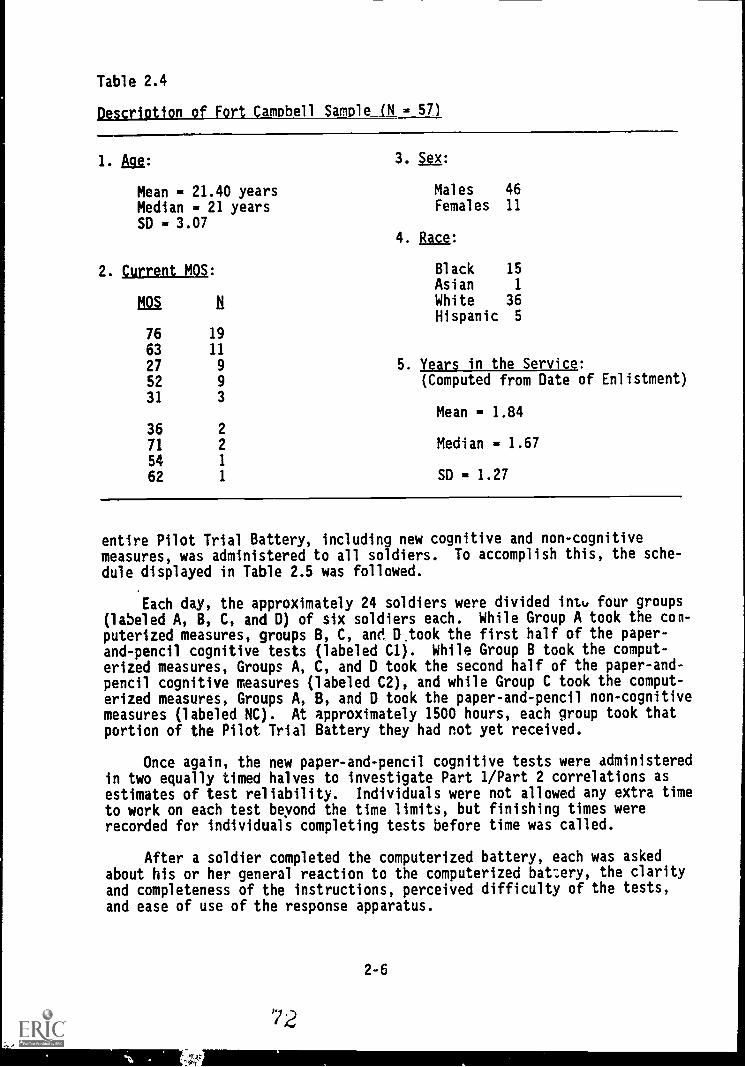
Table 2.4
Description of Fort Campbell Sample IN - 571
1. Agg: 3. 51X:
Mean - 21.40 yearsMedian 21 yearsSD - 3.07
Males 46
Females 11
4. Race:
2. Current MOS: Black 15
Asian 1
fly White 36Hispanic 5
7663
19
11
27 9 5. Years in the Service:
52 9 (Computed from Date of Enlistment)
31 3
Mean - 1.84
36 2
71 2 Median - 1.67
54 1
62 1 SD - 1.27
entire Pilot Trial Battery, including new cognitive and non-cognitivemeasures, was administered to all soldiers. To accomplish this, the sche-
dule displayed in Table 2.5 was followed.
Each day, the approximately 24 soldiers were divided into four groups(labeled A, B, C, and D) of six soldiers each. While Group A took the con-puterized measures, groups B, C, and D.took the first half of the paper-and-pencil cognitive tests (labeled C1). While Group B took the comput-erized measures, Groups A, C, and D took the second half of the paper-and-pencil cognitive measures (labeled C2), and while Group C took the comput-erized measures, Groups A, B, and D took the paper-and-pencil non-cognitivemeasures (labeled NC). At approximately 1500 hours, each group took thatportion of the Pilot Trial Battery they had not yet received.
Once again, the new paper-and-pencil cognitive tests were administeredin two equally timed halves to investigate Part 1/Part 2 correlations asestimates of test reliability. Individuals were not allowed any extra timeto work on each test beyond the time limits, but finishing times wererecorded for individuals completing tests before time was called.
After a soldier completed the computerized battery, each was askedabout his or her general reaction to the computerized battery, the clarityand completeness of the instructions, perceived difficulty of the tests,and ease of use of the response apparatus.
2-6
72
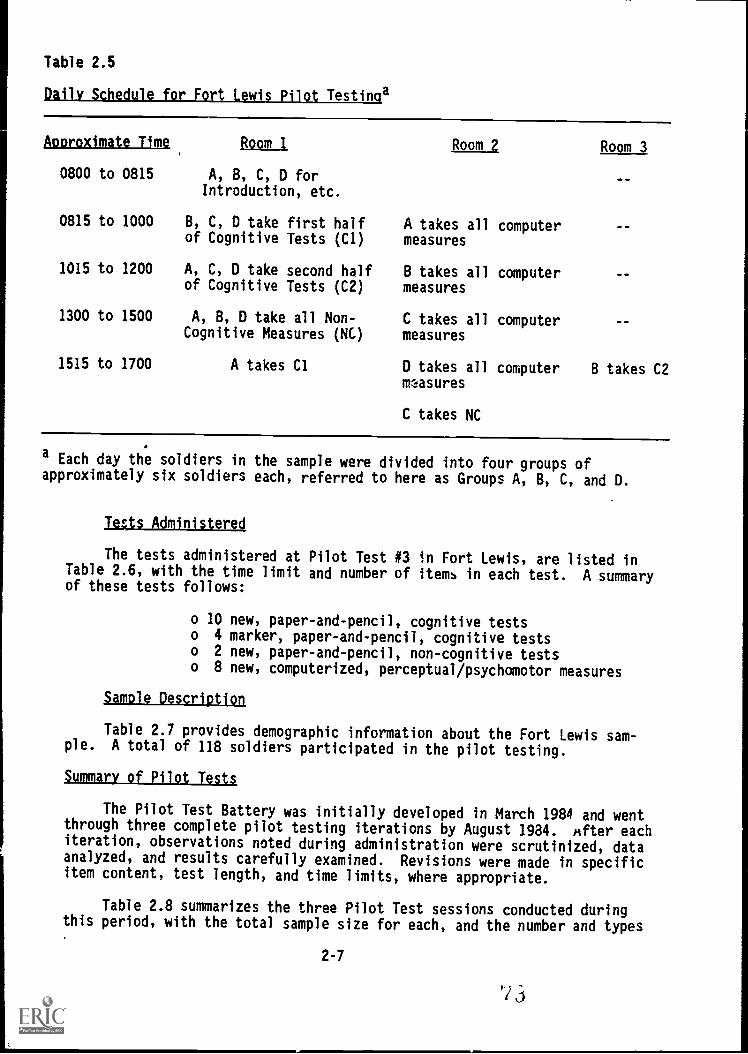
Table 2.5
Daily Schedule for sort Lewis Pilot Testinqa
APProximate Time
0800 to 0815
Room 1
A, B, C, D forIntroduction, etc.
0815 to 1000 B, C, D take first halfof Cognitive Tests (C1)
1015 to 1200 A, C, D take second halfof Cognitive Tests (C2)
1300 to 1500 A, B, D take all Non-Cognitive Measures (NC)
1515 to 1700 A takes Cl
Room 2
A takes all computermeasures
B takes all computermeasures
C takes all computermeasures
Room 3
D takes all computer B takes C2measures
C takes NC
a Each day the soldiers in the sample were divided into four groups ofapproximately six soldiers each, referred to here as Groups A, B, C, and D.
its Administered
The tests administered at Pilot Test #3 in Fort Lewis, are listed inTable 2.6, with the time limit and number of items in each test. A summaryof these tests follows:
o 10 new, paper-and-pencil, cognitive testso 4 marker, paper-and-pencil, cognitive testso 2 new, paper-and-pencil, non-cognitive testso 8 new, computerized, perceptual/psychomotor measures
Sample Description
Table 2.7 provides demographic information about the Fort Lewis sam-ple. A total of 118 soldiers participated in the pilot testing.
Summary of Pilot Tests
The Pilot Test Battery was initially developed in March 1984 and wentthrough three complete pilot testing iterations by August 1934. After eachiteration, observations noted during administration were scrutinized, dataanalyzed, and results carefully examined. Revisions were made in specificitem content, test length, and time limits, where appropriate.
Table 2.8 summarizes the three Pilot Test sessions conducted duringthis period, with the total sample size for each, and the number and types
2-7
Pi 3
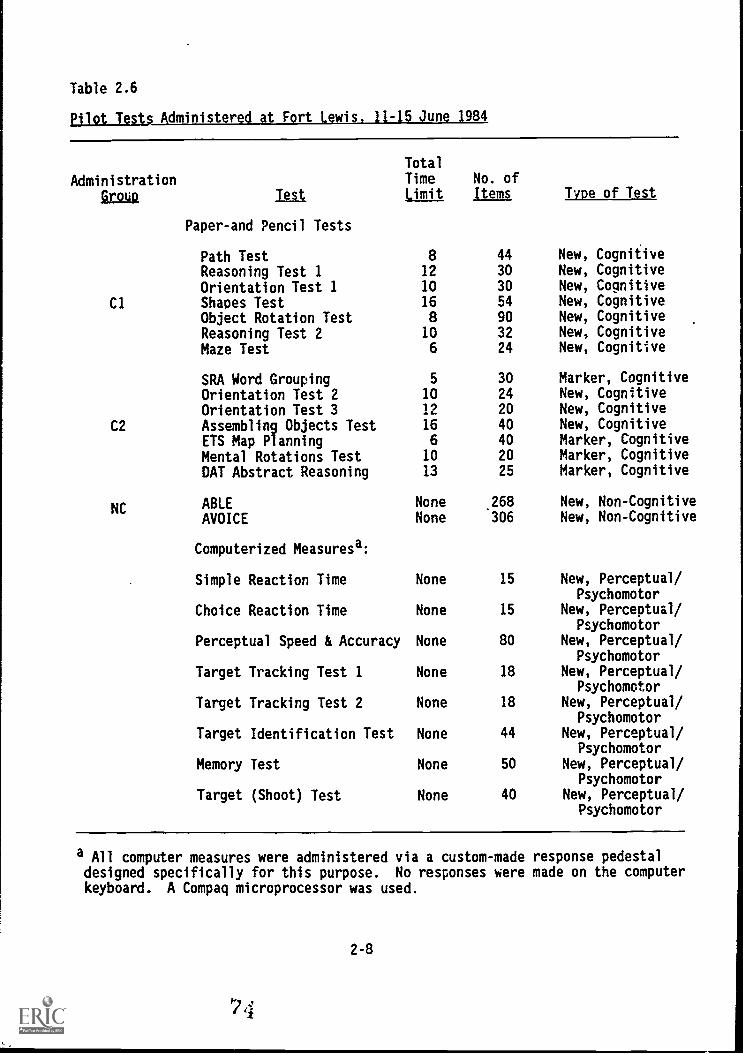
Table 2.6
diit -4 t F.rt un' 984
AdministrationGroup Test
TotalTime No. ofLimit Items Type of Test
Paper-and Pencil Tests
Path Test 8 44 New, Cognitive
Reasoning Test 1 12 30 New, Cognitive
Orientation Test 1 10 30 New, Cognitive
Cl Shapes Test 16 54 New, Cognitive
Object Rotation Test 8 90 New, Cognitive
Reasoning Test 2 10 32 New, Cognitive
Maze Test 6 24 New, Cognitive
SRA Word Grouping 5 30 Marker, Cognitive
Orientation Test 2 10 24 New, Cognitive
Orientation Test 3 12 20 New, Cognitive
C2 Assembling Objects Test 16 40 New, Cognitive
ETS Map Planning 6 40 Marker, Cognitive
Mental Rotations Test 10 20 Marker, Cognitive
DAT Abstract Reasoning 13 25 Marker, Cognitive
NC ABLEAVOICE
NoneNone
.268
306
New, Non-CognitiveNew, Non-Cognitive
Computerized Measuresa:
Simple Reaction Time None 15 New, Perceptual/Psychomotor
Choice Reaction Time None 15 New, Perceptual/Psychomotor
Perceptual Speed & Accuracy None 80 New, Perceptual/Psychomotor
Target Tracking Test 1 None 18 New, Perceptual/Psychomotor
Target Tracking Test 2 None 18 New, Perceptual/Psychomotor
Target Identification Test None 44 New, Perceptual/Psychomotor
Memory Test None 50 New, Perceptual/Psychomotor
Target (Shoot) Test None 40 New, Perceptual/Psychomotor
a All computer measures were administered via a custom-made response pedestaldesigned specifically for this purpose. No responses were made on the computerkeyboard. A Compaq microprocessor was used.
2-8
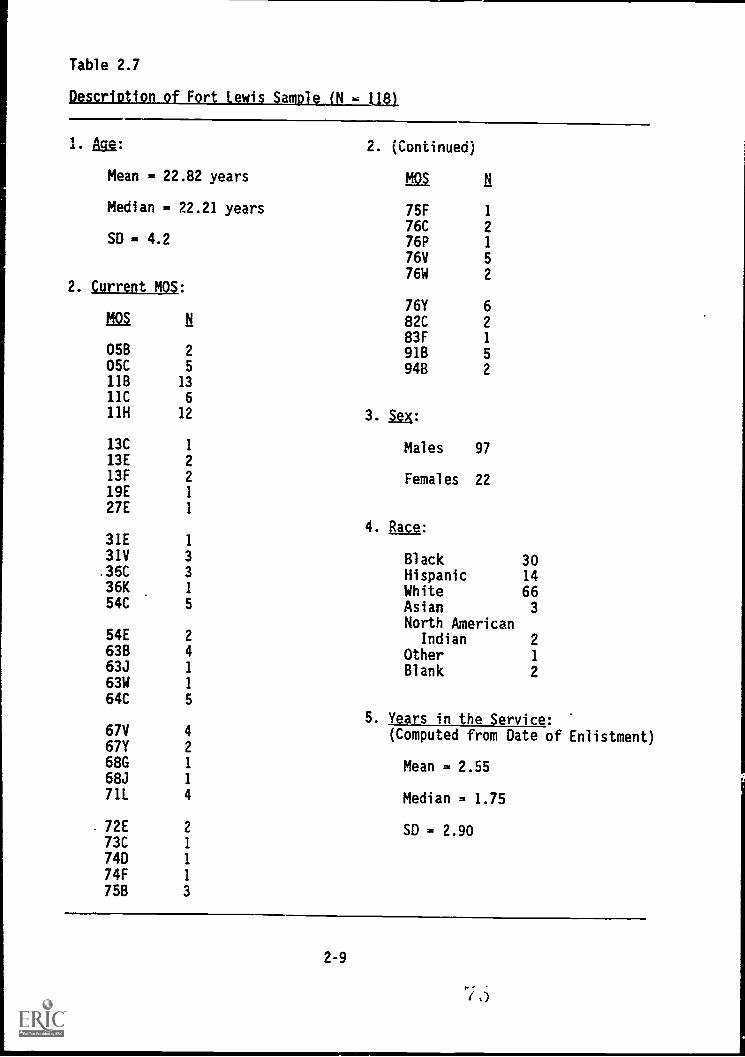
Table 2.7
Description of Fort Lewis Sample 04 - tal
1. Aig: 2. (Continued)
Mean - 22.82 years ma h
Median - 22.21 years 75F 1
76C 2SD - 4.2 76P 1
76V 5
76W 22. Current MOS:
Ma h
05B 2
05C 5
11B 13
11C 6
11H 12
13C 1
13E 213F 2
19E 1
27E 1
31E 1
31V 3.35C 3
36K 1
54C 5
54E 2
63B 4
63J 1
63W 1
64C 5
67V 4
67Y 2
68G 1
68J 1
71L 4
. 72E 2
73C 1
74D 1
74F 1
75B 3
76Y 682C 2
83F 1
91B 5
94B 2
3. laK:
Males 97
Females 22
4. Race:
Black 30Hispanic 14White 66Asian 3
North AmericanIndian 2
Other 1
Blank 2
5. Years in the Service:(Computed from Date of Enlistment)
Mean = 2.55
Median = 1.75
SD - 2.90
2-9
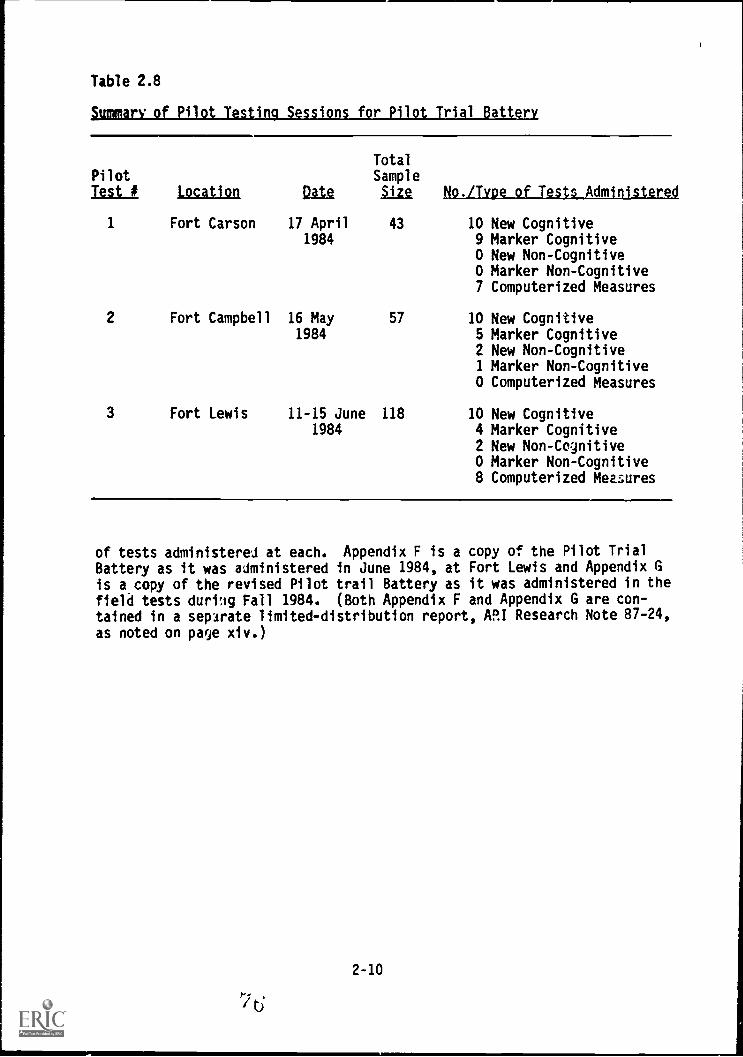
Table 2.8
§ummary of Pilot Testing Sessions for Pilot Trial Battery
TotalPilot SampleTest # Location Data Size liodlysggfs_ciir
1 Fort Carson 17 April 43 10 New Cognitive1984 9 Marker Cognitive
0 New Non-Cognitive0 Marker Non-Cognitive7 Computerized Measures
2 Fort Campbell 16 May 57 10 New Cognitive1984 5 Marker Cognitive
2 New Non-Cognitive1 Marker Non-Cognitive0 Computerized Measures
3 Fort Lewis 11-15 June 118 10 New Cognitive1984 4 Marker Cognitive
2 New Non-Cognitive0 Marker Non-Cognitive8 Computerized Measures
of tests administered at each. Appendix F is a copy of the Pilot TrialBattery as it was administered in June 1984, at Fort Lewis and Appendix Gis a.copy of the revised Pilot trail Battery as it was administered in thefield tests durin Fall 1984. (Both Appendix F and Appendix G are con-tained in a separate limited-distribution report, ARI Research Note 87-24,as noted on paw xiv.)
2-10
FIELD TESTS
The full Pilot Trial Battery was administered at Fort Knox in Septem-ber 1984 in a formal field test to evaluate all of the component measuresand to analyze psychometric characteristics of the data obtained. Inaddition, test-retest effects and practice effects were analyzed as part ofthe Fort Knox field testing, and fakability studies were conducted at FortBragg and the Minneapolis Military Entrance Processing Station (MEPS).
Field Test of Pilot Trial Battery: Fort Knox,
The field test of the Pilot Trial Battery at Fort Knox was conductedto evaluate the psychometric characteristics of all of the measures in thebattery, and to analyze the covariance of the measures with each other andwith the ASVAB.
Procedures
Data collection was scheduled for four weeks at Fort Knox. During thefirst two weeks, 24 soldiers were scheduled each day. On some days, how-ever, more than 24 soldiers arrived for testing. Because of the limitedavailability of computer testing stations (only six), 24 soldiers was themaximum number that could complete the entire battery. The "overflow"soldiers, however, did complete all of the paper-and-pencil measures.
Each group of soldiers assembled at 0800. The testing sessions in-cluded two 15-minute breaks, and one hour was allowed for lunch. When thesoldiers were assembled, they were divided into four groups if there were24 or fewer soldiers, and into five groups if there were more than 24 sol-diers.
Figure 2.1 shows the daily schedule of testing for the first two weekswhen.the full Pilot Trial Battery was being field tested. Figure 2.2 showsthe daily schedule in a different way, denoting the room assignments foreach group of soldiers throughout the day.
Figure 2.3 shows the schedule for weeks three and four, when the test-retest and practice-effects studies were being conducted. Each soldierfrom the first two weeks reported back for a half day of testing, either inthe morning (0800) or the afternoon (1300), exactly two weeks after his orher week 1 or 2 session. The soldier then completed one-third of all thepaper-and-pencil tests (a re-test), and completed either the computer"practice" session or the entire computer battery (a re-test).
Samole Description
If 24 soldiers had appeared for each testing day and completed alltests as scheduled, we would have achieved the following sample sizes:
N = 240 for all cognitive and non-cognitive paper-and-pencil tests
N = 240 for computer tests
N = 80 retes. of paper-and-pencil tests
2-11
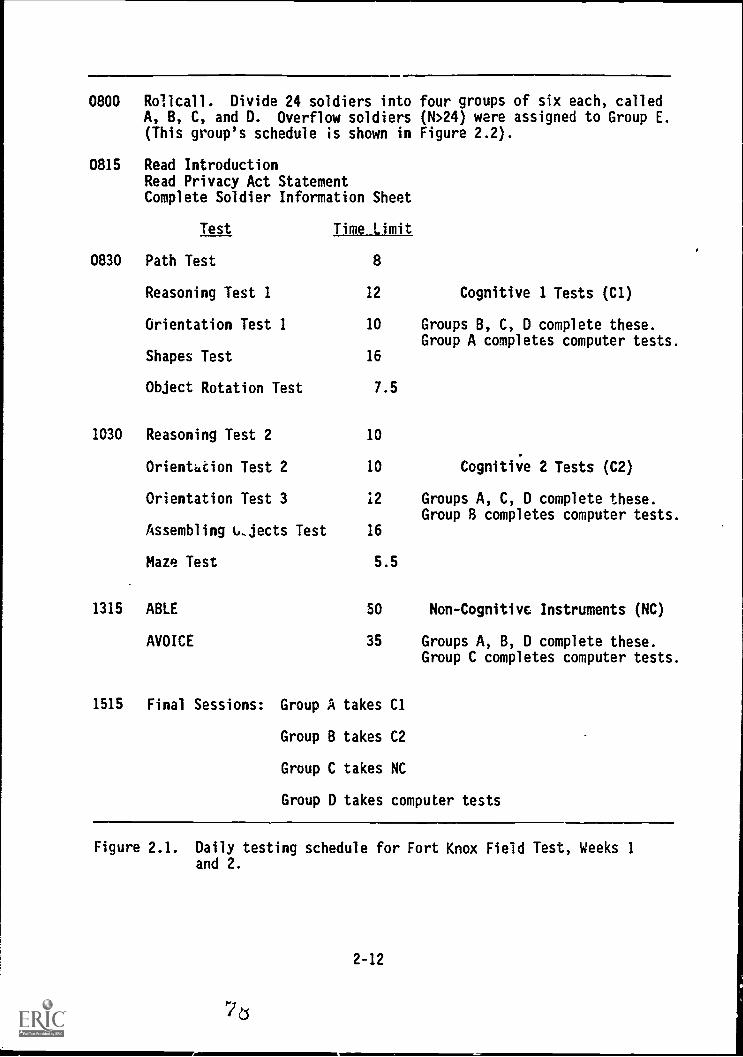
0800 Rollcall. Divide 24 soldiers into four groups of six each, calledA, B, C, and D. Overflow soldiers (N>24) were assigned to Group E.(This group's schedule is shown in Figure 2.2).
0815 Read IntroductionRead Privacy Act StatementComplete Soldier Information Sheet
Test Time Limit
0830 Path Test 8
Reasoning Test 1 12 Cognitive 1 Tests (C1)
Orientation Test 1 10 Groups B, C, D complete these.Group A completes computer tests.
Shapes Test 16
Object Rotation Test 7.5
1030 Reasoning Test 2 10
Orientation Test 2 10 Cognitive 2 Tests (C2)
Orientation Test 3 12 Groups A, C, D complete these.Group B completes computer tests.
Assembling 6..jects Test 16
Maze Test 5.5
1315 ABLE
AVOICE
50 Non-Cognitivc Instruments (NC)
35 Groups A, B, D complete these.Group C completes computer tests.
1515 Final Sessions: Group A takes Cl
Group B takes C2
Group C takes NC
Group D takes computer tests
Figure 2.1. Daily testing schedule for Fort Knox Field Test, Weeks 1and 2.
2-12
7
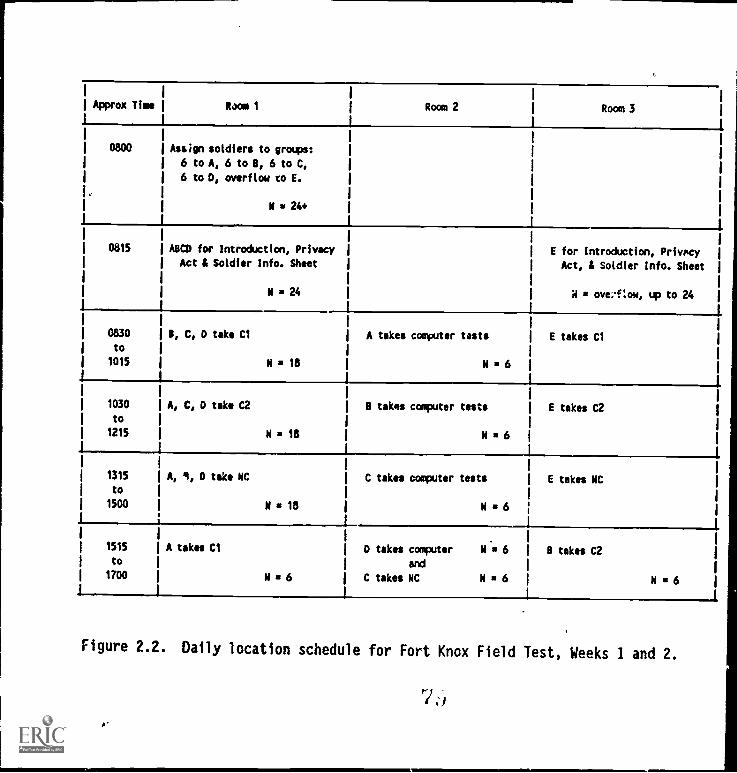
Approx Tian Roca 1 Room 2 Room 3
0800 Assign soldiers to groups:
6 to A, 6 to II, 6 to C,
6 to D, overflow to E.
N 24+
0815 A8CD for Introduction, Privacy E for Introduction, PrivacyAct i Soldier Info. Sheet I i Act, i Soldier Info. Sheet
N 24 I I R = ove;f:ow, up to 24
.1
I 0830 s, c, D take Ci
toA takes computer tests E takes C1
I 1015 N 18 N 6
4
I 1030 I A, C, D take C2
toB takes confuter tests E takes C2
I 1215 I II 18 N 6
I 1315 A, 1, 0 take NC C takes computer tests E takes NCI to
I 1500 N= 18 N = 61
I 1515 A takes C1 I 0 takes computer N. 6 8 takes C2to
i andI 1700 N 6 I C takes NC N 6 N 6
Figure 2.2. Daily location schedule for Fort Knox Field Test, Weeks 1 and 2.
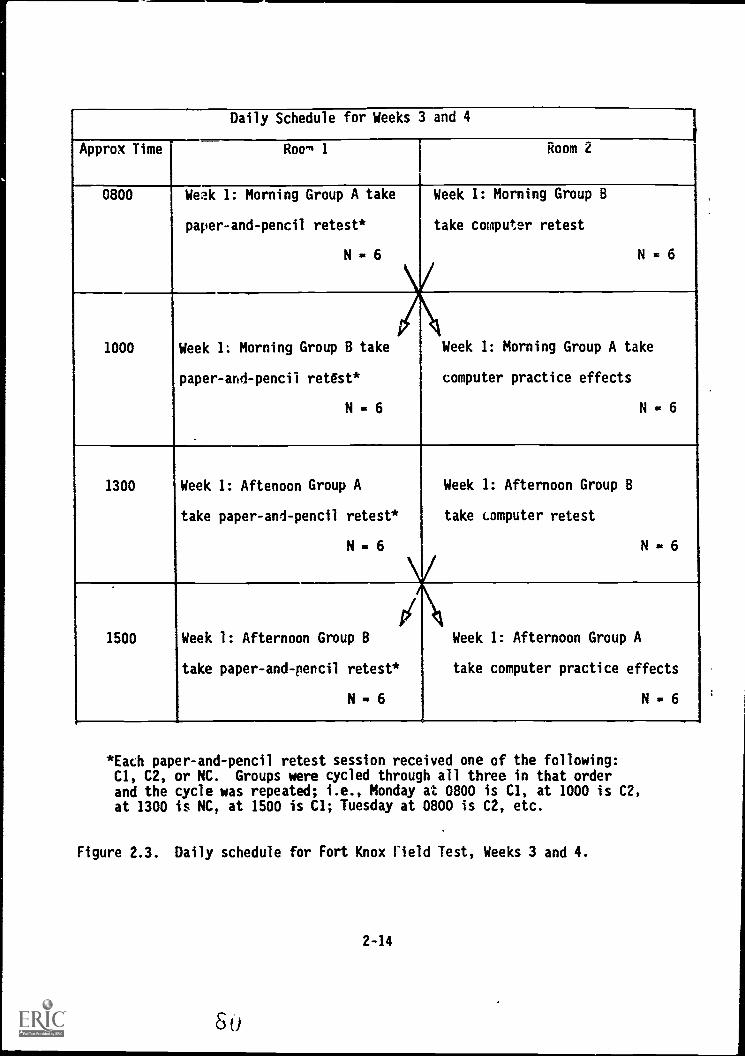
Daily Schedule for Weeks 3 and 4
Approx Time Roe., 1 Room 2
0800 Week 1: Morning Group A take
paper-and-pencil retest*
N - 6
Week 1: Morning Group B
take computer retest
N - 6
1000 Week 1: Morning Group B take
paper-and-pencil retest*
N - 6
Week 1: Morning Group A take
computer practice effects
N - 6
1300 Week 1: Aftenoon Group A
take paper-and-pencil retest*
N - 6
Week 1: Afternoon Group B
take computer retest
N - 6
1500 Week 1: Afternoon Group B
take paper-and-pencil retest*
N - 6
Week 1: Afternoon Group A
take computer practice effects
N - 6
*Each paper-and-pencil retest session received one of the following:Cl, C2, or NC. Groups were cycled through all three in that orderand the cycle was repeated; i.e., Monday at 0800 is Cl, at 1000 is C2,at 1300 is NC, at 1500 is Cl; Tuesday at 0800 is C2, etc.
Figure 2.3. Daily schedule for Fort Knox Field Test, Weeks 3 and 4.
2-14
u
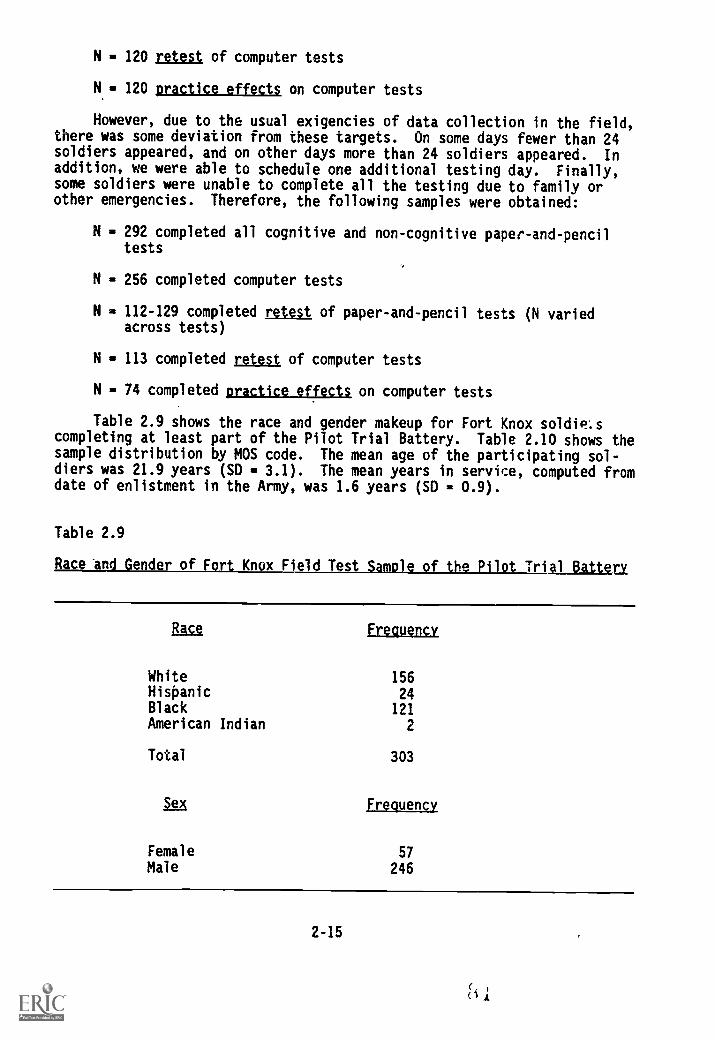
N = 120 retest of computer tests
N - 120 practice effects on computer tests
However, due to the usual exigencies of data collection in the field,there was some deviation from these targets. On some days fewer than 24soldiers appeared, and on other days more than 24 soldiers appeared. Inaddition, we were able to schedule one additional testing day. Finally,some soldiers were unable to complete all the testing due to family orother emergencies. Therefore, the following samples were obtained:
N - 292 completed all cognitive and non-cognitive paper-and-penciltests
N - 256 completed computer tests
N = 112-129 completed retest of paper-and-pencil tests (N variedacross tests)
N - 113 completed retest of computer tests
N - 74 completed practice effects on computer tests
Table 2.9 shows the race and gender makeup for Fort Knox soldie:scompleting at least part of the Pilot Trial Battery. Table 2.10 shows thesample distribution by MOS code. The mean age of the participating sol-diers was 21.9 years (SD = 3.1). The mean years in service, computed fromdate of enlistment in the Army, was 1.6 years (SD - 0.9).
Table 2.9
Race And Gender of Fort Knox Field Test Sample of the Pilot Trial Battery
Race Frequency
White 156Hispanic 24Black 121American Indian 2
Total 303
Sex Frequency
FemaleMale
57
246
2-15
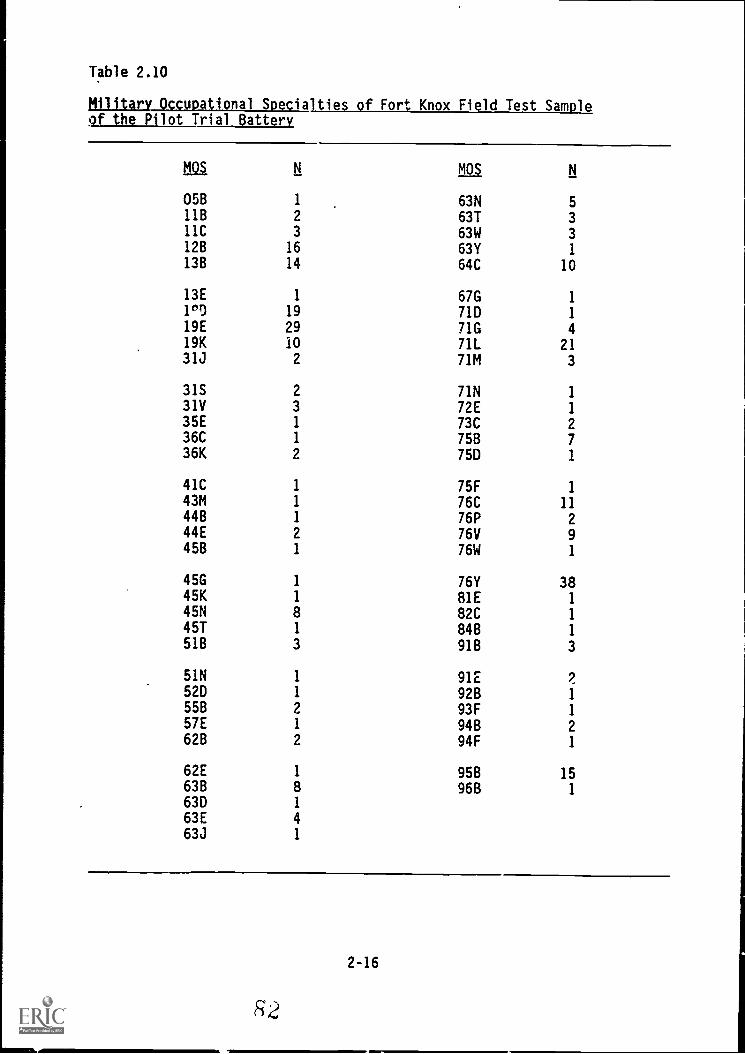
Table 2.10
Military Occupational Specialties of Fort Knox Field Test Sample9f the Pilot Trial Battery
WI N mu N
05B 1 63N 511B 2 63T 311C 3 63W 312B 16 63Y 1
13B 14 64C 10
13E 1 67G 1
1°D 19 71D 1
19E 29 71G 419K 10 71L 2131J 2 71M 3
31S 2 71N 1
31V 3 72E 1
35E 1 73C 2
36C 1 75B 736K 2 75D 1
41C 1 75F 1
43M 1 76C 1144B 1 76P 2
44E 2 76V 945B 1 76W 1
45G 1 76Y 3845K 1 81E 1
45N 8 82C 1
451 1 84B 1
51B 3 91B 3
51N 1 91E 2.
52D 1 92B 1
55B 2 93F 1
57E 1 94B 262B 2 94F 1
62E 1 95B 1563B 8 968 1
63D 1
63E 4
63J 1
2-16
fit
SAitional Field Testing
As noted previously, field tests were conducted at three sites. Thesites and the basic purpose of the field test at each site were as follows:
Fort Knox. The full Pilot Trial Battery was administered here, asdescribed above.
Fort Bragg. The non cognitive Pilot Trial Battery measures,Assessment of Background and Life Experiences (ABLE) and Army VocationalInterest Career Examination (AVOICE), were administered to soldiers at FortBragg under several experimental conditions in order to estimate the extentto wUich scores on these instruments could be altered or "faked," whenpersons are instructed to do so. Information on procedures and sample iscontained in Chapter 8.
MinneapoUlltilitary Entrance Processwg Station (MEPS). The non-cognitive measurs wce administered to a sample of soldiers as they werebeing proces A ,..tc the Army in order to estimate how persons might alterth ,r scores in an actual applicant setting. Information on procedures andsample is contained in Chapter 8.
Summary
Tht field test we. completed in September 1984. Appendix G contains acopy of the Pilot Trial Battery as it was administered during the fieldtests.
The remaining chapters in this report describe the development of thePilot Trial Battery measures, the analyses of the pilot test and field testdata, and the revisions made to the battery based on those an ?lyses.
2-17
R3
CHAPTER 3
COGNITIVE PAPER-AND-PENCIL MEASURES: PILOT TESTING
Jody L. Toquam, Marvin D. Dunnette, VyVy A. Corpe,Janis S. Houston, Norman G. Peterson, Teresa L. Russell,
and Fiery Ann Hanson
GENERAL
This chapter deals with the cognitive paper-and-pencil measures devel-oped for inclusion in the Pilot Trial Battery. As described in Chapter 1,the Task 2 research team, including contractor personnel, Army ResearchInstitute monitors, and designated members of the Scientific AdvisoryGroup, had previously evaluated and prioritized cognitive ability con-structs or predictor categories according to their relevance and importancefor predicting success in a variety of Army MOS (see Figure 1.5). Thesepriority ratings were used to plan cognitive paper-and-pencil test develop-ment activiti,s.
Before describing the development of the tests, we outline some issuesand objectives germane to all the cognitive paper-and-pencil measures.Each cognitive predictor category is then discussed in turn.
Within each category, we'provide a definition of the target cognitiveability. Next, for each test developed to measure the target ability, weoutline the strategy followed; this iiicluded identifying (1) the targetpopulation or target NOS for which the measure is hypothesized to mosteffectively predict success, (2) published tests that served as markers foreach new measure, (3) intended level of item difficulty, and (4) type oftest (i.e., speed, power, or a combination). The test itself is thendescribed and example items are provided. Results from the first two pilottest administrations or tryouts are reported to explain and document sub-sequent revisiors. Finally, psychometric test data from the third pilottest, conducted at Fort Lewis, are discussed and the form of the testdecided upon for field testing is described.
The last portion of this chapter presents a summary and analysis ofthe newly developed cognitive ability tests. This includes a discussion oftest intercorrelations, results from a factor analysis of the intercorrela-tions, and results from subgroup analyses of test scores from the pilottest at Fort Lewis. Field testing of these measures is then described inChapter 4.
IAMBI Pogu1.211
The population for which these tests have been developed is the sameone to which the Army applies the ASVAB, that is, persons applying toenlist in the Army. This is, speaking very generally, a population made upof recent high school graduates, not entering college, from all geographicsections of the United States. Non-high-school graduates may be acceptedinto the Army, but present policy gives preference to high school grad-uates. For a number of reasons, Army applicants are probably not a truly
3-1
Fi 4
random sample of all recent high school graduates, but for initial testdevelopment activities a highly refined specification of Army applicantswas not necessary, and was not attempted.
Another point to be made about the target population is the fact thatit was, practically speaking, inaccessible to us during our developmentprocess. We were corstrained to use enlisted soldiers to try out the newlydeveloped tests. Enlisted soldiers, of course, represent a restrictedsample of the target population in that they all have passed listmentstandards; furthermore, almost all of the soldiers that we were able to usein our pilot tests had also passed Basic and Advanced Individual Training.Thus, the persons in our samples are presumably more qualified, more able,more persevering, and so forth, on the average, than are the persons ia thetarget population.
The above discussion leads up to two major implications that served asgeneral guidelines for our development and pilot testing activities:
(1) The tests to be developed will be applied to a population with alarge range of abilities. Therefore, we should attempt to de-velop tests each of which have a broad range of item difficul-ties. Highly peaked tests, in the sense that all items wouldhave difficulty levels near a certain value (e.g.., .50, indicat-ing that half the examinees would answer correctly), were not ourgoal.
(2) The-soldiers upon whom the tests will be initially tried out aregenerally higher in abil!ty than the target population. There.fore, the tests should be somewhat easier than they would be ifwe had access to an unrestricted sample of the target populationin trying out the tests. With regard to this point, we point outthe somewhat confusing nature of the technical term "difficultylevel." This term is defined as the proportion of persons at-tempting an item who answer the item correctly. Thus, a highitem difficulty level (say .90) means the item is relativelyeasy, whereas a low item difficulty level (say .10) means theitem is relatively hard, When used in reference to an entiretest, it is usually defined as the proportion cf the total numberof items that are answered correctly, on the average. Thus, atest difficulty level of .75 means that, on the average, personstaking the test answer 75% of the items correctly.
Power vs. Speed
The above discussion of the target population shows how we derivedsome general guidelines about the difficulty level of the tests and theiritems. Another decision to be made about each test was its placement onthe power vs. speed continuum. This decision is, of course, linked to thetest difficulty issue, since a relatively easy test can usually be madedifficult simply by reducing the time allowed to take the test.
Very few tests used in practical testing situations are pure powertests, but quite a few are highly speeded tests. Most psychometricianswould agree that a "pure" power test is a test administered in such a waythat all persons taking the test are allowed enough time to attempt all
3-2
85
items on the test, and that a "pure" spevied test is a test administered insuch a way that no one taking the test has cough time to attempt all ofthe items. In practice, there appears to be a power/speed continuum, andmost tests fall somewhere between the two kx. 'ems on this continuum. Italso is the case that a power test usually contains items that not allpersons will be able to answer correctly, even given unlimited time tocomplete the test, wnile a speeded test usually contains items that all oralmost all persons could answer correctly, given enough time to attempt theitems.
As a matter of practical definition for this developmental effort, weused an "80% completion" rule-of-thumb to define a power test. That is, ifa test could be completed by 80 percent of all those taking the test, thenwe considered it a "power" test. Tests with completion rates lower thanthis were considered to have some "speededness" determining performance onthe test.
The Pilot Trial Battery contains cognitive ability tests that may beconsidered power tests, and tests that may be categorized as highly speededtests, using the above definition. It also contains tests that may beviewed as combinations of both power and speed. Each test is defined belowas a power, speeded, or combination test according to the developmentstrategy employes.
Reliability
A final issue related to evaluation of ttnt construction procedures istest reliability. Several procedures are available to assess the reli-ability of a measure and each provides distinctive information about atest. Internal consistency estimates are used to assess homogeneity oftest content; high values indicate nat test items are measuring the sameability or abilities. Test-retest procedures are used to estimate thestability or test scores across time; high values indicate that the testyields the same or very similar scores for each subject over time.
Split-hOf reliability estimates were obtained for each paper-and-penc:1 test administered at the pilot test sites: Fort Carson, FortCampbell, and Fort Lewis. For each tryout, each test was administered intwo separately timed parts. Reliability estimates were obtained by cor-relating scores from the two parts, and the Spearman-Brown correctionprocedure was then used to estimate the reliability for the whole test.The separately timed, split-half *:eliability estimates, corrected by theSpearman-Brown procedure, are reported for each test. This estimate ofreliability is appropriate for either speeded or power tests.
Further, we also report Hoyt internal consistency reliability esti-mates for each test. This method provides the average reliability acrossall possible split-test halves. We point out that this procedure is inap-propriate for speeded tests because it overestimates the reliability, butin the interest of complete reporting the Hoyt reliability estimate hasbeen calculated for all tests.
3-3
Ergdictor Categories
We turn now to the description of the tests, which are discussedwithin ccgnitive ability constructs. The four constructs treated in cogni-tive paper-and-pencil tests were spatial visualization, field independence,spatial orientation, and induction/figural reasoning.
SPATIAL VISUALIZATION
Spatial visualization involves tie ability to mentally manipulate com-ponents of two- or three-dimensional figures into other arrangements. Theprocess involves restructuring the components of an object and accuratelydiscerning their appropriate appearance in new configurations. This con-struct includes several subcomponents, two of which are:
o Rotation - the ability *o identify a two-dimensional figure when seenat different angular orientations within the picture plane. It alsoincludes three-dimensional rotation or the ability to identify athree-dimensional object projected on a two-dimensional plane, whenseen at different angular orientations either within the picture planeor about the axis in depth.
o Scanning - the ability to visually survey a complex field to find aparticular configuration representing a pathway through the field.
Visualization constructs had been given a mean validity estimateof .21 across all criterion constructs by our expert panel. 1 The highestmean validity estimate for visualization measures was .25 for criterionclusters involving Technical Skills.
Currently, no ASVAB measures are designed specifically to measurespatial abilities. For this reason, spatial visualization received apriority rating of one (see Figure 1.5), and development of spatial abilitymeasures was strongly emphasized. The visualization construct was dividedinto two areas: visualization/rotation and visualization/scanning. Wedeveloped two tests to tap 6ilities within each of these areas; these fourtests are described below.
Usitiiiliall11124tigiLalasItign
The rotation component of spatial visualization requires the abilityto mentally restructure or manipulate parts of a two- or three-dimensionalfigure. We developed two tests of this ability, Assembling Objects andObject Rotation. The former involves three-dimensional figures, and thelatter involves two-dimensional objects.
assembling Objects Test
Denlooment Strategy. Predictive validity estimates provided by ex-pert raters suggest that measures of the visualization/rotation constructwould be effective predictors of success in MOS that involve mechanicaloperations (e.g., inspect and troubleshoot mechanical systems, inspect andtroubleshoot electrical systems), construction (e.g., construct woodenbuildings, construct masonry structures), and drawing or using maps. Thus,
1 This panel was the group of J5 personnel psychologists who estimated there1.4tionships betwtIn a set of ability constructs and a set of Army cri-teriol constructs. See Chapter 1 of this report, also Wing, Peterson,and Hoffman (1984).
3-5
S 3
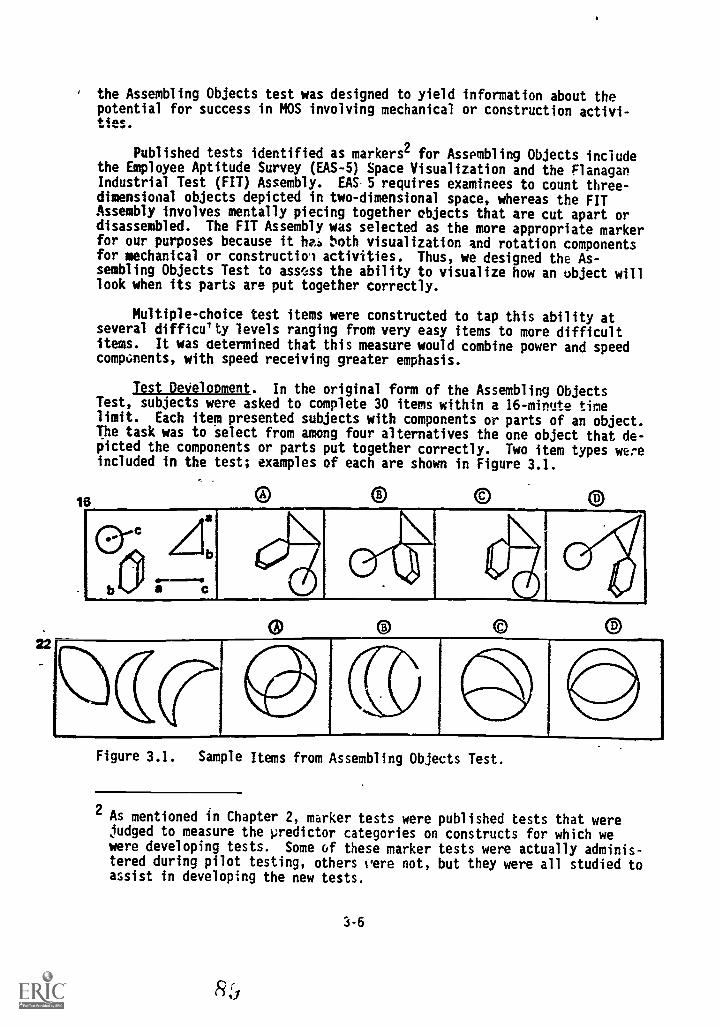
the Assembling Objects test was designed to yield information about thepotential for success in MOS involving mechanical or construction activi-ties.
Published tests identified as markers2 for Assembling Objects includethe Employee Aptitude Survey (EAS-5) Space Visualization and the FlanaganIndustrial Test (FIT) Assembly. EAS-5 requires examinees to count three-dimensional objects depicted in two-dimensional space, whereas the FITAssembly involves mentally piecing together objects that are cut apart ordisassembled. The FIT Assembly was selected as the more appropriate markerfor our purposes because it haz :'nth visualization and rotation componentsfor mechanical or constructioi activities. Thus, we designed the As-sembling Objects Test to ass'ss the ability to visualize how an object willlook when its parts are put together correctly.
Multiple-choice test items were constructed to tap this ability atseveral difficulty levels ranging from very easy items to more difficultitems. It was determined that this measure would combine power and speedcomponents, with speed receiving greater emphasis.
Test 0eVelopment. In the original form of the Assembling ObjectsTest, subjects were asked to complete 30 items within a 16- minute timelimit. Each item presented subjects with components or parts of an object.The task was to select from among four alternatives the one object that de-picted the components or parts put together correctly. Two item types wereincluded in the test; examples of each are shown in Figure 3.1.
i,
I)
Figure 3.1. Sample Items from Assembling Objects Test.
2 As mentioned in Chapter 2, marker tests were published tests that werejudged to measure the predictor categories on constructs for which wewere developing tests. Some of these marker tests were actually adminis-tered during pilot testing, others sere not, but they were all studied toassist in developing the new tests.
3-6
The `first tryout, conducted at Fort Carson, indicated that the testmay have suffered from ceiling effects. That is, nearly all recruits inthis sample (N = 36) completed the test; the mean score was 24.2 (SD =5.05). Further, item difficulty levels were somewhat higher than intended(mean = .80, SD = .12, median = .83); that is, the proportion of examineesobtaining high scores was greater than expected.
Therefore, ten new, more difficult items, five for each item type,were constructed and added to the test to reduce the likelihood of ceilingeffects. The 16-minute time limit was retained for the second tryout, atFort Campbell. Nearly all subjects (N = 56) completed the test (meanitems completed = 37.3, SD = 4.75); the mean score was 26.3 (SD = 8.34).Item difficulty levels were lower for the revised test (mean = .68, SD =.15, median = .72). Inspection of these results indicated that the testpossessed acceptable psychometric qualities, so no further changes weremade in preparation for the Fort Lewis pilot test.
Pilot Test Results. Fort Lewis results for the Assembling ObjectsTest are shown in Table 3.1. The test contains 40 items with a 16-minutetime limit; individual test scores were computed using the total numbercorrect. The mean number of items completed was 37.6, with a range of 18to 40. Corresponding values for number'correct (or test score) were 28.1and 7-40.
Parts 1 and 2 correlate .65 with each other. Reliabilities are esti-mated at .79 by split-half methods (Spearman-Brown corrected), and .89 withHoyt's estimate of reliability.
For the total test, item difficulties (see Figure 3.2) range from .31to .92 with a mean of .70. We also computed the correlation of scores oneach item (0 = incorrect, 1 = correct) with total scores (the number ofitems answered correctly). This index, usually called the item-totalcorrelation, measures the degree to which each item is measuring the sameability or abilities as the other items on the test. The higher the valueof this index, the "better" the item. Values of .25 or better are usuallyconsidered acceptable, though lower values are not necessarily unaccept-able. Item-total correlations for Assembling Objects r le from .18 to .60with a mean of .44 (SD = 9.99).
Correlations between scores on this measure and scores on other PilotTrial Battery paper-and-pencil measures are reported at the end of thischapter. It is important, however, to note the correlations between thistest and its marker tests. Both marker tests were administered in the FortCarson tryout and the FIT Assembly was also used at Fort Campbell. Resultsfrom Fort parson indicate that scores or the Assembling Objects Test cor-relate .74 with scores on EAS-5 and .76 with scores on FIT Assembly.Results from Fort Campbell indicate that this test correlates .64 with FITAssembly. This last value represents a better estimate of the relationshipbetween Assembling Objects and the FIT Assembly marker, because of therevisions made to Assembling Objects following the first tryout at FortCarson. Given the sample sizes involved and the goals for the AssemblingObjects Test, the .64 correlation was encouraging.
Modifications for the Fort Knox Field Test. In preparation for theFort Knox administration, some Assembling Objects items were redrawn to
3-7
tJi
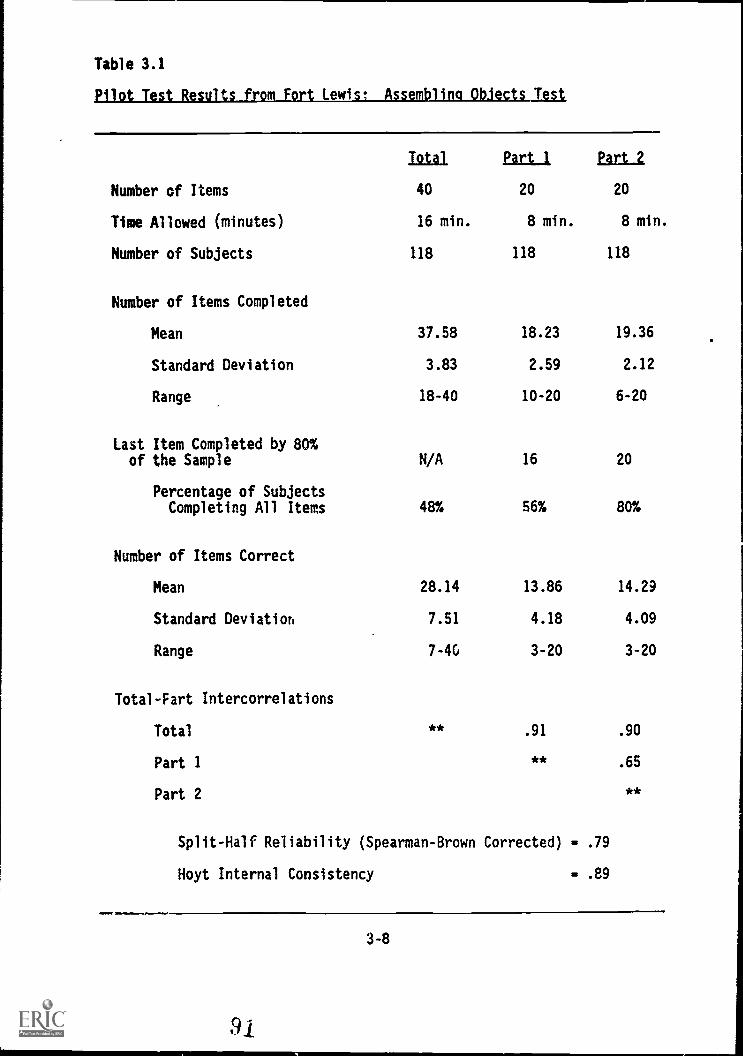
Table 3.1
Pilot Test Results from Fort _Lewis: Assembling ObJects Test.
Total Part 1 Part 2
Number of Items 40 20 20
Time Allowed (minutes) 16 min. 8 min. 8 min.
Number of Subjects 118 118 118
Number of Items Completed
Mean 37.58 18.23 19.36
Standard Deviation 3.83 2.59 2.12
Range 18-40 10-20 6-20
Last Item Completed by 80%of the Sample N/A 16 20
Percentage of SubjectsCompleting All Items 48% 56% 80%
Number of Items Correct
Mean 28.14 13.86 14.29
Standard Deviation 7.51 4.18 4.09
Range 7 -4G 3-20 3-20
Total-Fart Intercorrelations
Total * * .91 .90
Part 1 ** .65
Part 2 **
Split-Half Reliability (Spearman-Brown Corrected) - .79
Hoyt Internal Consistency - .89
3-8
91
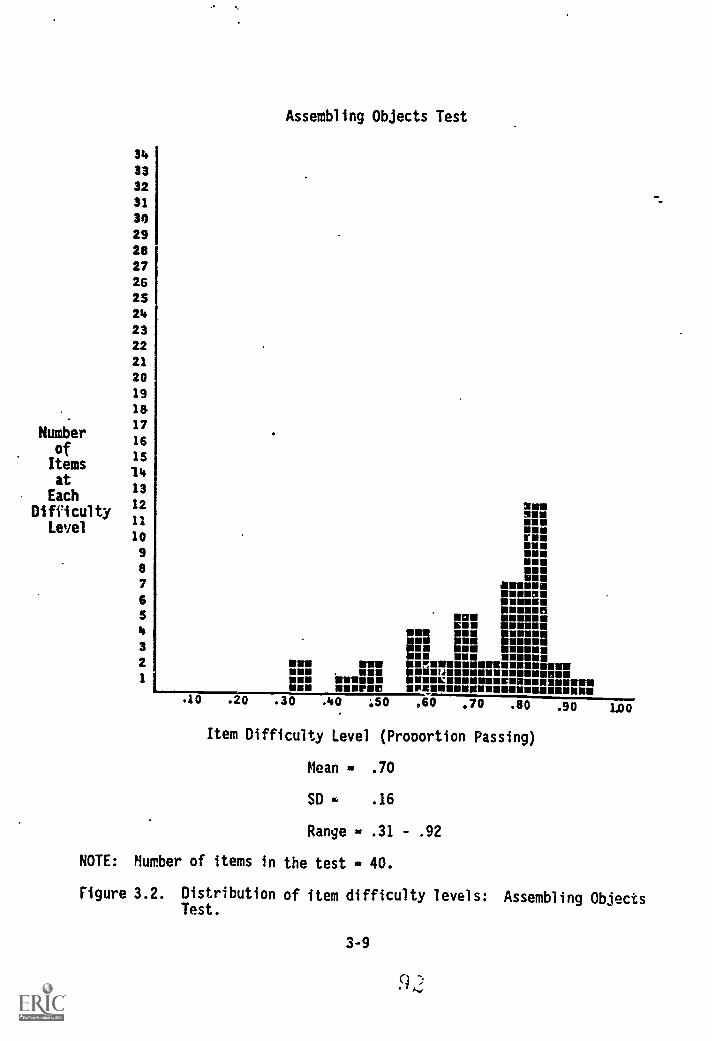
34
33
3231
30
2928
27262524
2322
21
20
19
1517
NumberofItems
is
1at
4
Each13
12Difficulty
11Level
10
9
87
65
4
3
2
Assembling Objects Test
.10 .20
2UU'NUN NW
momEMUrummum
ammomomWmoms.WOO Msm. pornoill 1:::11
pion ms momum mom Emma111: UMM SIMMUMMEMMEMMEMMOMBER
Uisms' mamsM PRMENUUMIUU.30 .40 ;50 .60 .70 .80 .90 LAO
Item Difficulty Level (Pr000rtion Passing)
Mean .70
SD - .16
Range - .31 - .92
NOTE: Number of items in the test 40.
Figure 3.2. Distribution of item difficulty levels: Assembling ObjectsTest.
3-9
clarify the figures. The item response format was modified to a form thatcould be used for machine scoring (i.e., the subject was instructed to fillin a circle for the correct answer). This change was made in all of thetests being prepared for field test administration.
Oblect Rotation Test
Development Strategy. Object Rotation is the second test developed to
measure spatial visualization/rotation. This measure is also expected topredict success in MOS involving mechanical operations, construction activ-ities, and drawing or using maps.
Published tests serving as markers for this measure include Educa-tional Testing Services (ETS) Card Rotations, Thurstone's Flags Test, andthe Shephard-Metzler Mental. Rotations. Each ef these measures requires thesubject to compare a test object with a standard object to determine whe-ther the two represent the same figure with one simply turned or rotated orwhether the two represent different figures. The first two measures, ETSCard Rotations and Thurstone's Flags, involve visualizing two-dimensionalrotation of an object, whereas the Mental Rotations test requires visualiz-ing three-dimensional objects depicted in two-dimensional space.
Object Rotation Test items were constructed to reflect a limited rangeof item difficulty levels ranging from very easy to moderately easy. Theseitems, on the average, were desIgned to be easier than those appearing inthe Assembling Objects Test. Further, we planned to construct a test thatcontains more.items and has a shorter time limit than the Assembling Ob-jects Test. Thus, the plan for Object Rotation was to develop a test thatfalls more toward the speeded end of the power-speed continuum.
Test Development. As initially developed, the Object Rotation Testcontained 60 items with a 7-minute time limit. The subject's task was toexamine a test object and determine whether the figure represented in eachitem is the same as the test object, only rotated, or is not the same asthe test object (e.g., is flipped over). For each test object there arefive test items, each requiring a response of "same" or "not same." Sample
test items are shown in Figure 3.3.
The Fort Carson tryout indicated that this test suffered from ceilingeffects. Subjects (N - 38), on the average, completed 59.3 (SD = 2.60) ofthe 60 items and obtained a mean score of 55.6 (SD - 6.06). Item diffi-
culty levels averaged .92 (SD = .05). Consequently, we decided to add 30new items to the test and to increase the time limit to 9 minutes for thesecono tryout at Fort Campbell.
In the second tryout, subjects, on the average, completed 87.6(SD - 7.96) of the 90 items and obtained a mean score of 77.0 (SD - 12.1).The time limit was reduced to 8 minutes for the Fort Lewis administration,in order to obtain a more highly speeded test.
Pilot Test Results. Detailed results from the Fort Lewis pilot testare shown in Table 3.2. As reported in the table, completion rates werefairly high (mean = 82.6), with a range of 48 to 90. Test scores, computedby the total number ccrrect, range from 36 to 90 with a mean of 73.4.
3-10
93
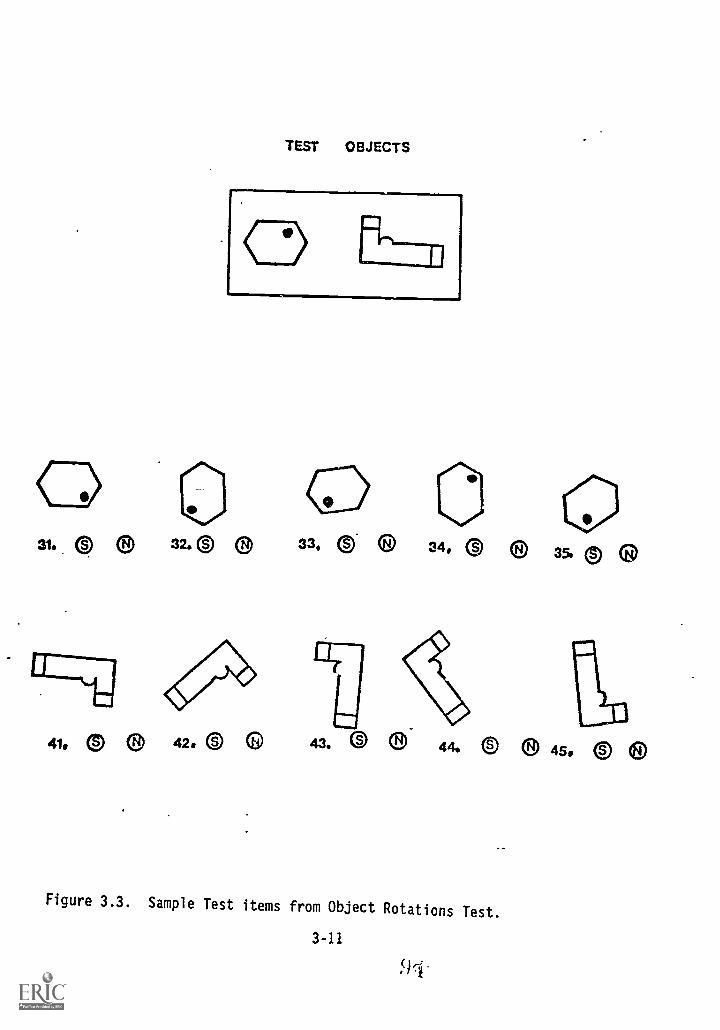
TEST OBJECTS
31. © 0 324) ®
41, e ® 42. 0
33. $0. 34. 0 ® 35. ®
43. @ 6 444 ® 6 45. Ci ©
Figure 3.3. Sample Test items from Object Rotations Test.
3-11
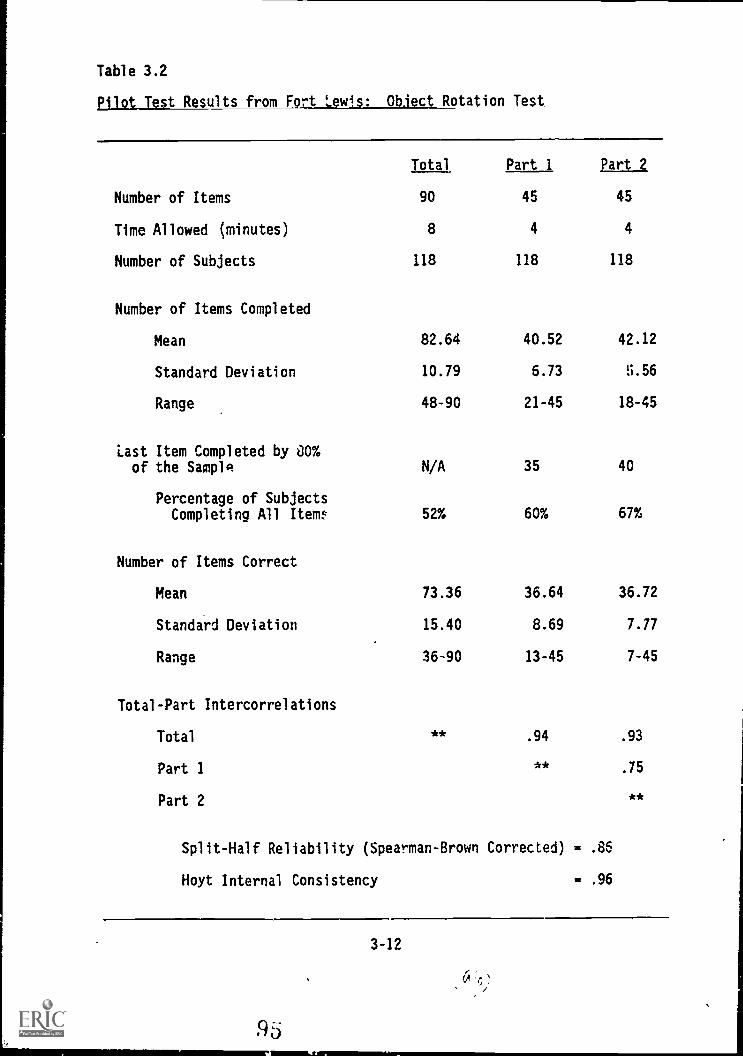
Table 3.2
pilot. est Results from Fort Lewis: Object Rotation Test
I2IA1 Part 1 Part 2
Number of Items 90 45 45
Time Allowed (minutes) 8 4 4
Number of Subjects 118 118 118
Number of Items Completed
Mean 82.64 40.52 42.12
Standard Deviation 10.79 6.73 5.56
Range 48-90 21-45 18-45
Last Item Completed by 00%of the Sample N/A 35 40
Percentage of SubjectsCompleting All Items 52% 60% 67%
Number of Items Correct
Mean 73.36 36.64 36.72
Standard Deviation 15.40 8.69 7.77
Range 36-90 13-45 7-45
Total-Part Intercorrelations
Total * * .94 .93
Part 1 * * .75
Part 2 * *
Split-Half Reliability (Spearman-Brown Corrected) = .86
Hoyt Internal Consistency = .96
3-12
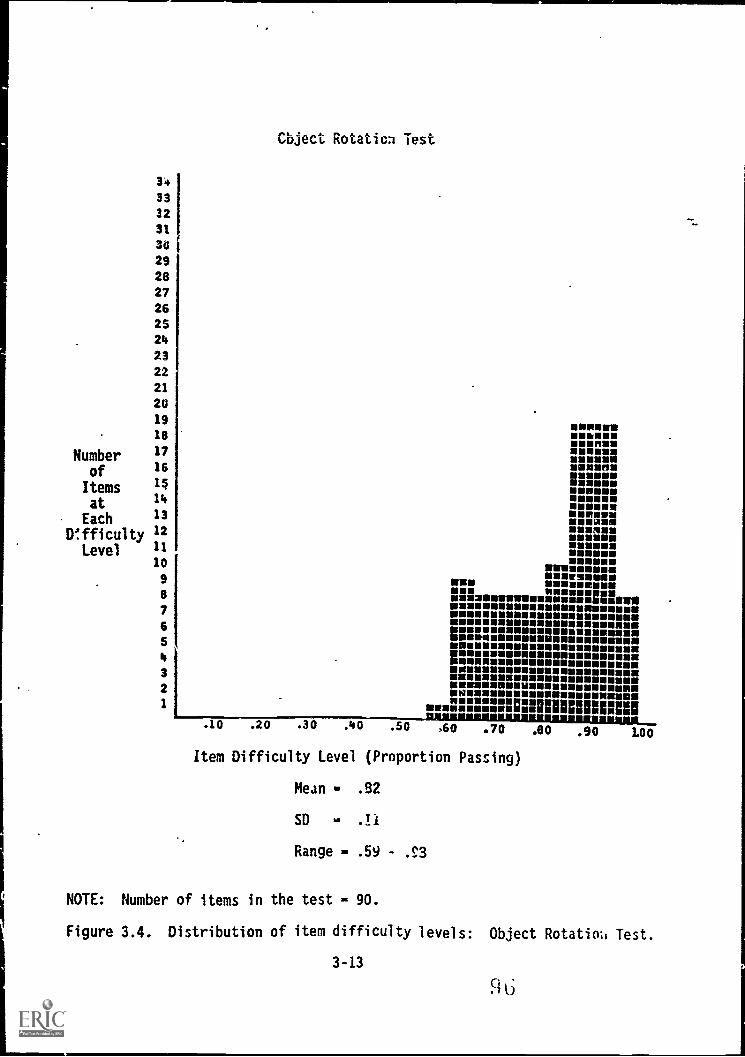
33
32
31
30
29
2827262524
23
22
21
20
19
18
Number 17
of 16
Items 1*
at /4
Each 13
Difficulty 12Level 11
10
9
87
6
54
3
2
1
Object Rotation Test
MUMSMMEWNIEmilmanim
Minion!mmoE mmaminimmmeO wn.Mom.
limmminiW m.MimsmMO
limmillSUINUOINImmrSOINIW mimmemmlil
N om unimmONENN EEMORUSUUMMommumiellanaEOONONEWOOMMEOMNMENOMMOMUMORMOMMEMENUNIOOENpmmommilIONNOMMUMMOMINEMMMEINIMINNOMMUNIIMMOMMUMNIONMEMONOMMOSEEMMSOMMposimpummummemmummummumummumummumummemilmememimmimm iuuuu11NOMENVONOMMMINOMEMEEMOMMOOW
alaa:::::11111111111111111.10 .20 .30 .40 .50 .60 .70
Item Difficulty Level (Proportion Passing)
Mean . .82
SD - .11
Range - .5Y - .S.'3
.80 .90 LOO
NOTE: Number of items in the test - 90.
Figure 3.4. Distribution of item difficulty levels: Object Rotatio:, Test.
3-13
9 6
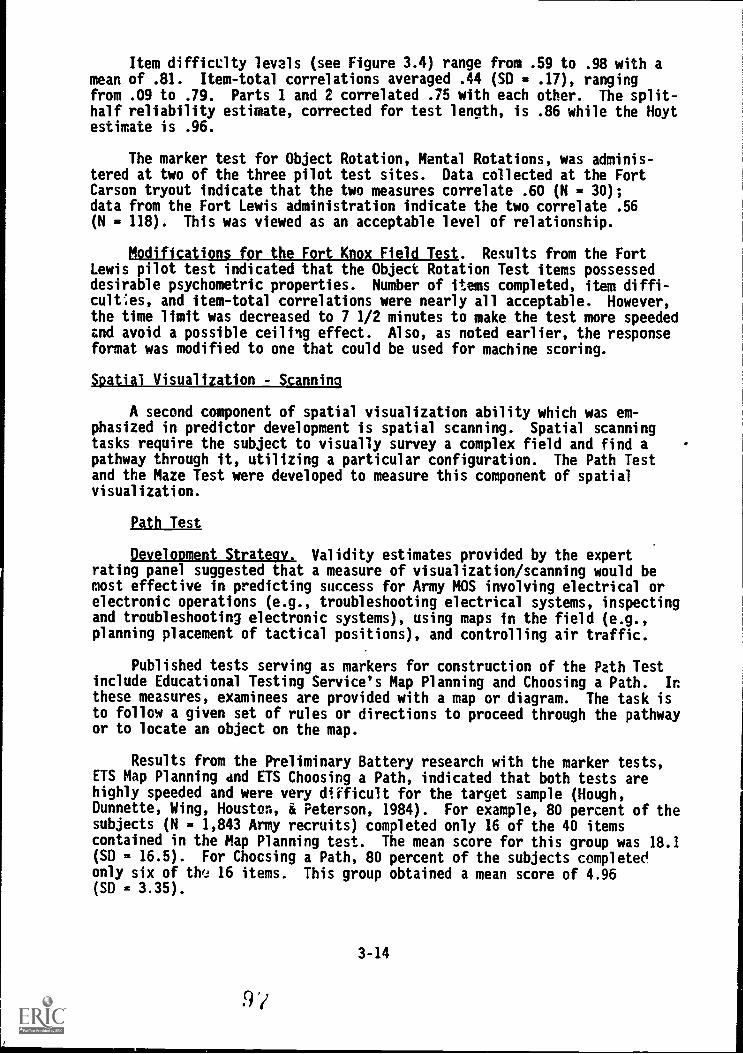
Item difficulty levels (see Figure 3.4) range from .59 to .98 with amean of .81. Item-total correlations averaged .44 (SD = .17), rangingfrom .09 to .79. Parts 1 and 2 correlated .75 with each other. The split-half reliability estimate, corrected for test length, is .86 while the Hoytestimate is .96.
The marker test for Object Rotation, Mental Rotations, was adminis-tered at two of the three pilot test sites. Data collected at the FortCarson tryout indicate that the two measures correlate .60 (N = 30);data from the Fort Lewis administration indicate the two correlate .56(N = 118). This was viewed as an acceptable level of relationship.
Modifications for the Fort Knox Field Test. Results from the FortLewis pilot test indicated that the Object Rotation Test items possesseddesirable psychometric properties. Number of items completed, item diffi-culCes, and item-total correlations were nearly all acceptable. However,the time limit was decreased to 7 1/2 minutes to make the test more speededand avoid a possible ceiling effect. Also, as noted earlier, the responseformat was modified to one that could be used for machine scoring.
Spatial Visualization Scanning
A second component of spatial visualization ability which was em-phasized in predictor development is spatial scanning. Spatial scanningtasks require the subject to visually survey a complex field and find apathway through it, utilizing a particular configuration. The Path Testand the Maze Test were developed to measure this component of spatialvisualization.
Path Test
Development Strategy. Validity estimates provided by the expertrating panel suggested that a measure of visualization/scanning would bemost effective in predicting success for Army MOS involving electrical orelectronic operations (e.g., troubleshooting electrical systems, inspectingand troubleshooting electronic systems), using maps in the field (e.g.,planning placement of tactical positions), and controlling air traffic.
Published tests serving as markers for construction of the Path Testinclude Educational Testing Service's Map Planning and Choosing a Path. Inthese measures, examinees are provided with a map or diagram. The task isto follow a given set of rules or directions to proceed through the pathwayor to locate an object on the map.
Results from the Preliminary Battery research with the marker tests,ETS Map Planning dnd ETS Choosing a Path, indicated that both tests arehighly speeded and were very difficult for the target sample (Hough,Dunnette, Wing, Houston, & Peterson, 1984). For example, 80 percent of thesubjects (N = 1,843 Army recruits) completed only 16 of the 40 itemscontained in the Map Planning test. The mean score for this group was 18.1(SD = 16.5). For Chocsing a Path, 80 percent of the subjects completedonly six of this 16 items. This group obtained a mean score of 4.96(SD - 3.35).
3-14
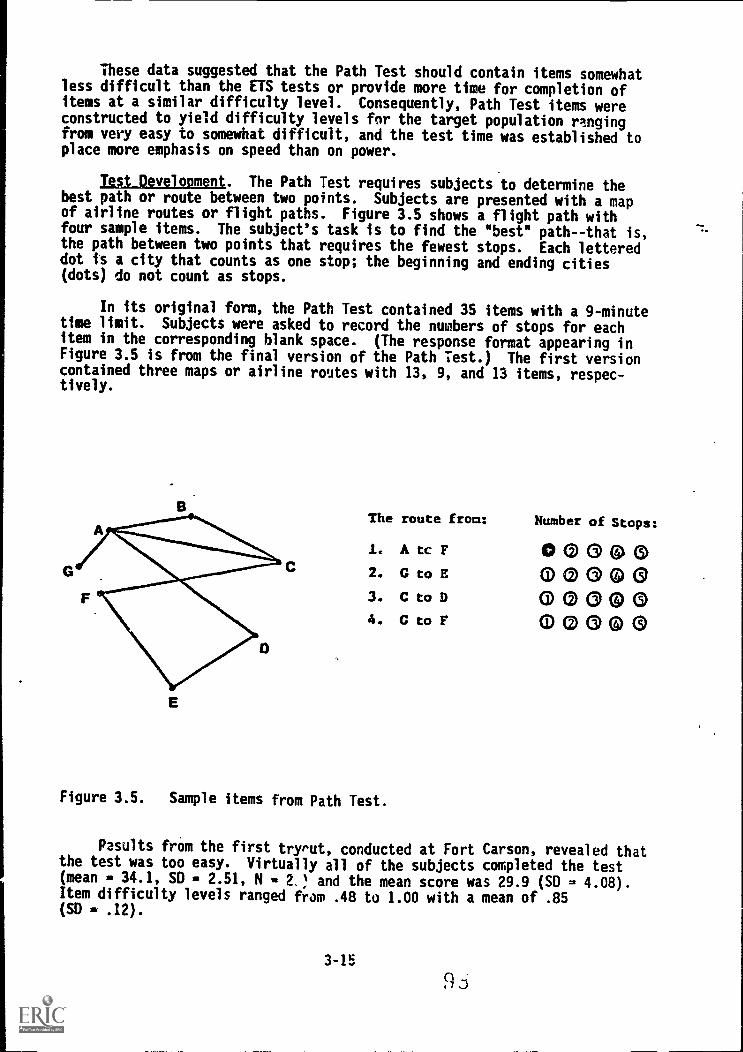
These data suggested that the Path Test should contain items somewhatless difficult than the ETS tests or provide more time for completion ofitems at a similar difficulty level. Consequently, Path Test items wereconstructed to yield difficulty levels for the target population rangingfrom very easy to somewhat difficult, and the test time was established toplace more emphasis on speed than on power.
hAtAgyiloprani. The Path Test requires subjects to determine thebest path or route between two points. Subjects are presented with a mapof airline routes or flight paths. Figure 3.5 shows a flight path withfour sample items. The subject's task is to find the "best" path--that is,the path between two points that requires the fewest stops. Each lettereddot is a city that counts as one stop; the beginning and ending cities(dots) do not count as stops.
In its original form, the Path Test contained 35 items with a 9-minutetime limit. Subjects were asked to record the numbers of stops for eachitem in the corresponding blank space. (The response format appearing inFigure 3.5 is from the final version of the Path Test.) The first versioncontained three maps or airline routes with 13, 9, and 13 items, respec-tively.
The route from: Number of Stops:
1. A tc F 0 CD CD CO CO
2. G to E CD CD CD (i) C9
3. C to D CD CD CD CD CO4. G to F 0) 0) CD G CO
Figure 3.5. Sample items from Path Test.
Pasultsthe test was(mean 34.1,Item difficul(SD a .12).
frOm the first tryrut, conducted at Fort Carson, revealed thattoo easy. Virtually all of the subjects completed the testSD - 2.51, N = 2.! and the mean score was 29.9 (SD = 4.08).
ty levels ranged from .48 to 1.00 with a mean of .85
3-15

To reduce the potential for ceiling effects, an additional map orflight path with 13 items was added to the test. Also, four very easyitems (i.e., difficulty levels ranging from .90 to 1.00) were deleted,resulting in 44 items on the revised test. The 9-minute time limit wasretained. In the second tryout subjects completed an average of 40.7 items(SD 5.07) and obtained a mean score of 32.6 (SD - 7.00). Item difficultylevels ranged from .55 to .96 with a mean of .80. Those results indicatedthat the changes had largely achieved the goal of making the test moredifficult.
To prepare for the pilot test conducted at Fort Lewis, the test re-sponse format was revised to allow subjects to circle the number of stops(i.e., 1-5) to avoid having to process written-in responses. In addition,the time limit was reduced from 9 minutes to 8 minutes to increase thespeededness of the test.
Pilot Test Results. Path Test results obtained from the Fort Lewistryout are reported in Table 3.3. Subjects, on the average, completed 35.3of the 44 items, with a range of 0 to 44. Test scores, computed by thetotal number correct, ranged from 0 to 44 with a mean of 28.3.
Item difficulty levels (see Figure 3.6) ranged from .20 to .91 with amean of .64). Item-total correlations averaged .47 (SD - 11) with a rangeof .25 to .69. 'Parts 1 and 2 correlate .70. The split-half reliabilityestimate, corrected for test length, is .82. The Hoyt internal consistencyvalue is .92. These results indicated that the test is generally in excel-lent shape. .
Both marker tests were administered at the first tryout, and the ETSMap Planning Test was also administered at the Fort Campbell and Fort Lewistryouts. Data from the first tryout indicate that the original Path Testcorrelates .34 with ETS Choosing a Path and -.01 with ETS Map Planning.The reader is reminded that results from Fort Carson are based on a verysmall sample size (N 19) and that the Path Test was modified greatlyfollowing this tryout. Data from the final two tryouts indicate that thePath Test and Map Planning correlate .62 (N - 54) and .48 (N 118),respectively. Although these values are not as high as marker test cor-relations for some of the other new tests, this was expected. Recall thatthe marker tests were known to be too difficult for the typical Army sampleand we set out to make the new tests easier than the marker tests.
Modifications for the Fort Knox Field Test. The Path Test remainedunchanged for the field test except for the modification in response for-mat.
Maze Test
Development Strategy. The Maze Test represents the second measureconstructed to assess spatial visualization/scanning. As with the PathTest, the expert panel of judges indicated that this measure would be mosteffective in predicting success for MOS involving electrical and electronicoperations, using maps in the field, and controlling air traffic.
The development strategy for this test mirrors that of the Path Test- -
markers for the Maze Test again included ETS Map PlanniLv and ETS Choosing
3-16
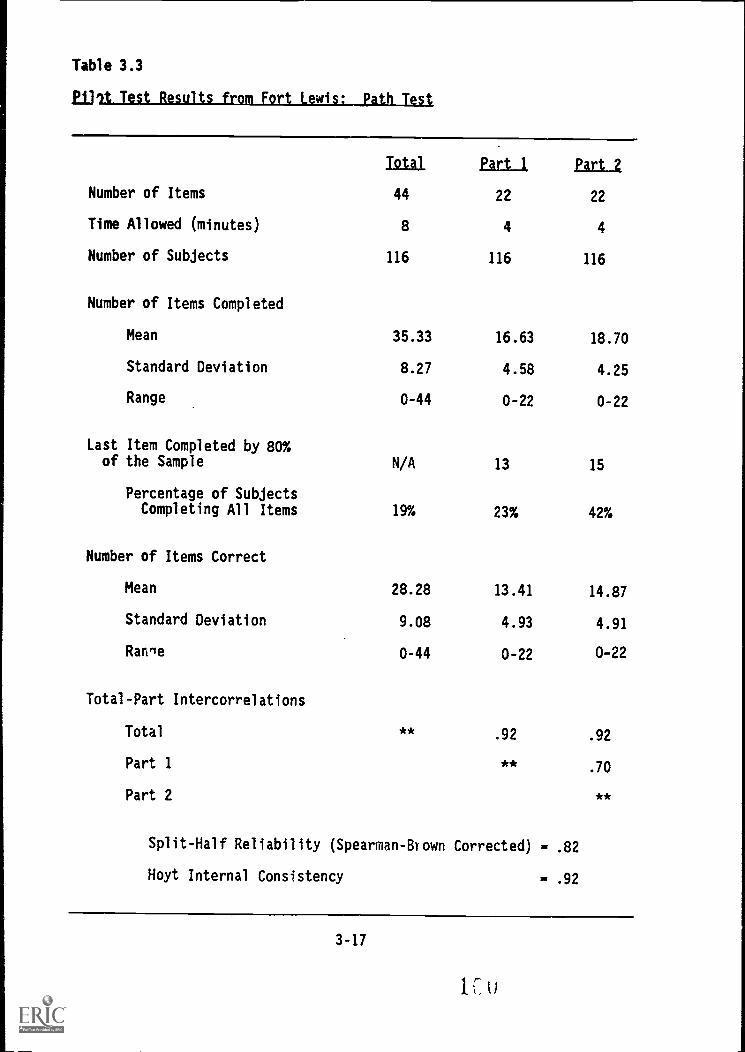
Table 3.3
Ejjlt Test Results from Fort Lewis: Path Test
Total Part 1 Part 2
Number of Items 44 22 22
Time Allowed (minutes) 8 4 4
Number of Subjects 116 116 116
Number of Items Completed
Mean
Standard Deviation
Range
Last Item Completed by 80%
35.33
8.27
0-44
16.63
4.58
0-22
18.70
4.25
0-22
of the Sample N/A 13 15
Percentage of SubjectsCompleting All Items 19% 23% 42%
Number of Items Correct
Mean 28.28 13.41 14.87
Standard Deviation 9.08 4.93 4.91
Range 0-44 0-22 0-22
Total-Part Intercorrelations
Total * * .92 .92
Part 1 * *.70
Part 2 * *
Split-Half Reliability (Spearman -Brown Corrected) - .82
Hoyt Internal Consistency .92
3-17
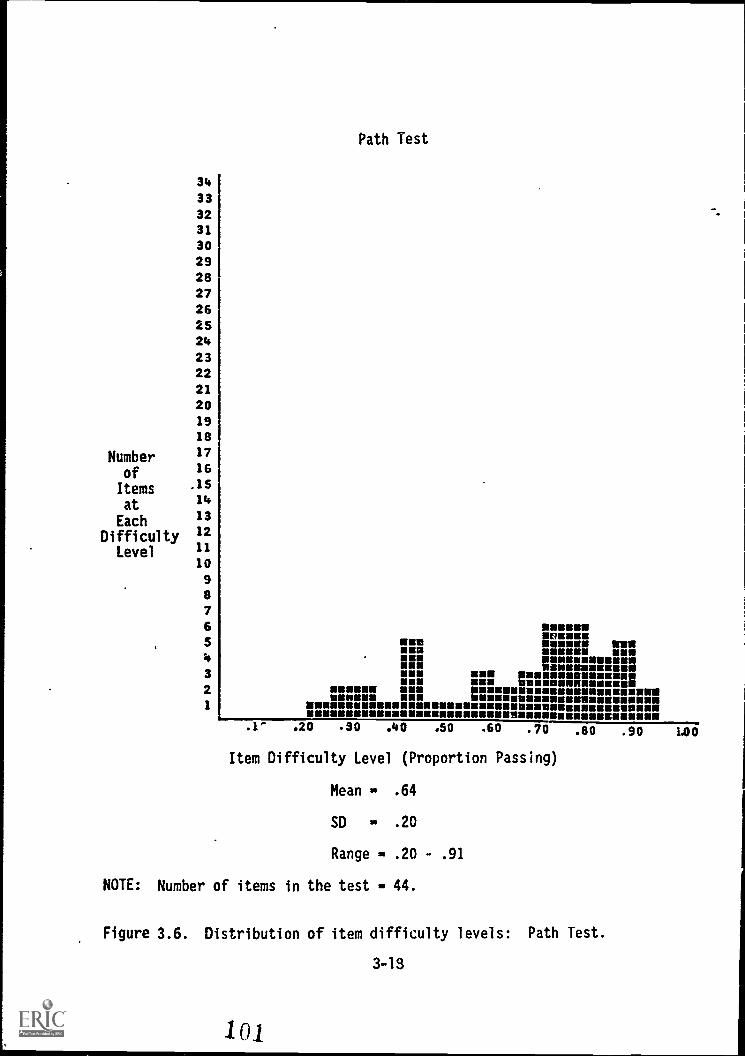
Path Test
34
33
3231
30292827262524
232221
2019
18
Number 17
of 16
Items -15
at 14
Each 13
Difficulty 12
Level109
8
7
6 IMMOMUUMUU
5 MUMUMWMUM
MUUMUU ONOMEOW UMWammummummlMUM RUMMUMMUMMUm3 MUM
RueUMW RUMMUMUMMUMIM*MU UUUMMIMMMUMSOMMO2 MMS RUM mmumemmummmmummemonsm01MMOM M ENSIONOMMUMMUMMEMMUMMOMMO
1 UMMUSOMUOUUMMOUUMUMUMUMMOMMUMMUUMMUMUMMOMUMOMMO NIMMUMMUMMUMWOMMIONMUMMUOMIUMMEMIMMIO.1' .20 .30 .40 .50 .60 .70 .80 .90 1.00
Item Difficulty Level (Proportion Passing)
Mean .64
SD .20
Range - .20 - .91
NOTE: Number of items in the test - 44.
Figure 3.6. Distribution of item difficulty levels: Path Test.
3-13
101
a Path. As with the Path Test, this test was designed to include itemsgeared more toward the ability level of the Project A target populationthan populations for the two marker tests, that is, somewhat easier itemswere appropriate for the Maze Test.
However, the Maze Test differs from the Path Test in several ways.The task required in the Maze Test involves finding the one pathway thatallows exit from a maze. Items for the Maze Test were constructed to bemuch easier under nonspeeded conditions than in the Path Test, and greateremphasis was placed on speed. The Maze Test, then, was designed to measurevisualization/scanning ability under highly speeded conditions.
Test Development. For the first tryout the Maze Test contained 24rectangular mazes. Each included four entrance points labeled A, B, C, andD, and three exit points indicated by an asterisk (*). The task is todetermine which of the four entrances leads to a pathway through the mazeand to one of the exit points. A 9-minute time limit was established forthis test.
Results from the first tryout, at Fort Carson, indicate that theoriginal version of the Maze Test suffered from ceiling effects. Subjectscompleted on average 23.3 (SD - 1.79) of the 24 items and obtained a meanscore of 22.6 (SD - 2.75).
To increase test score variance, the test was modified in two ways.First, an additional exit was added to each test maze; Figure 3.7 shows asample item from the original test and the same item modicied for the FortCampbell tryout. Second, the time limit was reduced from 9 to 8 minutes.
At the second tryout, completion rates were again high (mean - 22.5,SD - 2.49, N = 56). Consequently, for the third tryout, the time limit forcompleting the 24 maze items was dropped to 6 minutes.
Pilot Test Results. Results from the Fort Lewis administration arereported in Table 3.4. These data indicate that the reduced time limitproduced a drop in the completion rate for the Fort Lewis sample (mean =20.7. Test scores, computed by the total number correct, ranged from 8 to24 with a mean of 19.3.
Item difficulty levels (see Figure 3.8) range from .41 to .98 with amean of .80. Item-total correlations average .48 (SD - .22) with a rangeof -.04 to .80. Parts 1 and 2 correlate .64 with each other. The split-half reliability estimate corrected for test length is .78 and the Hoytreliability estimate for this test is .88. Taken as a whole, these resultsindicate that the test is in good shape.
One or both of the marker tests, ETS Choosing a Path and EIS MapPlanning, were administered at the three pilot test sites. Results fromFort Carson indicate that the Maze Test correlates .24 (N = 29) withChoosing a Path, and .36 (N = 30) with Map Planning. These values must beviewed with caution because of the small sample size and because of modifi-cations made to the Maze Test following this tryout. Map Planning was alsoadministered at the Fort Campbell and Fort Lewis tryouts. Data collected
3-19
1
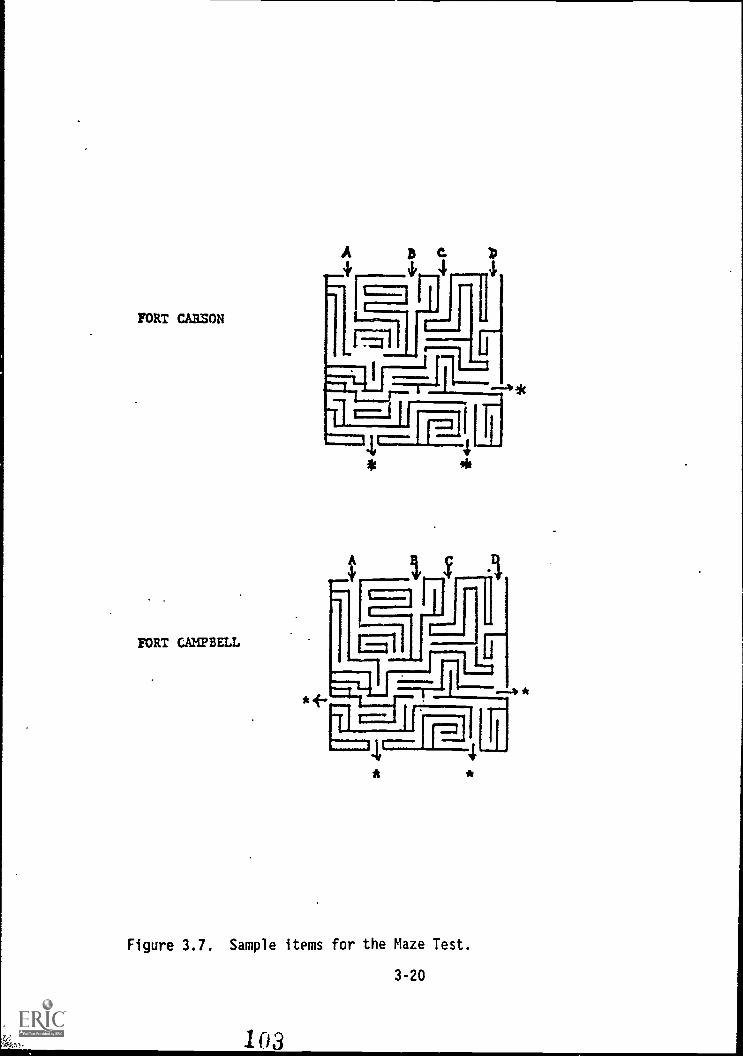
FORT CARSON
FORT CAMPBELL
Figure 3.7. Sample items for the Maze Test.
3-20
103
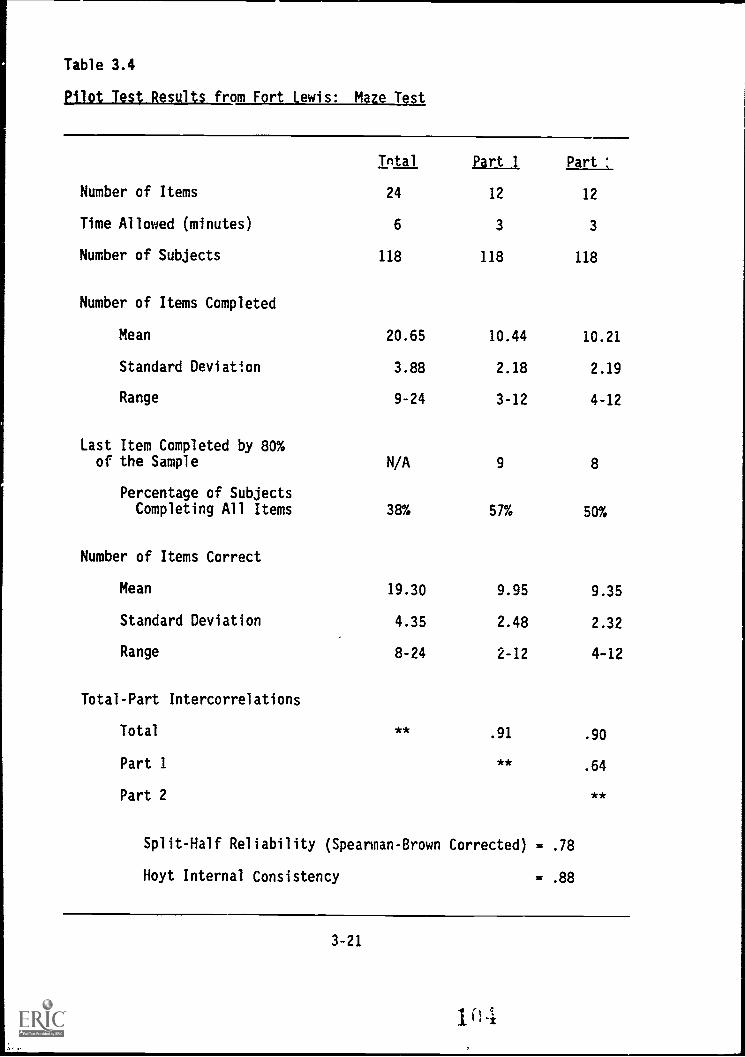
Table 3.4
Pilot Test Results from Fort Lewis: Maze Test
Iptal Part 1 Part :
Number of Items 24 12 12
Time Allowed (minutes) 6 3 3
Number of Subjects 118 118 118
Number of Items Completed
Mean 20.65 10.44 10.21
Standard Deviation 3.88 2.18 2.19
Range 9-24 3-12 4-12
Last Item Completed by 80%of the Sample N/A 9 8
Percentage of SubjectsCompleting All Items
Number of Items Correct
38% 57% 50%
Mean 19.30 9.95 9.35
Standard Deviation 4.35 2.48 2.32
Range 8-24 2-12 4-12
Total-Part Intercorrelations
Total * * .91 .90
Part 1 * *.64
Part 2 * *
Split-Half Reliability (Spearman-Brown Corrected) = .78
Hoyt Internal Consistency = .88
3-21
104
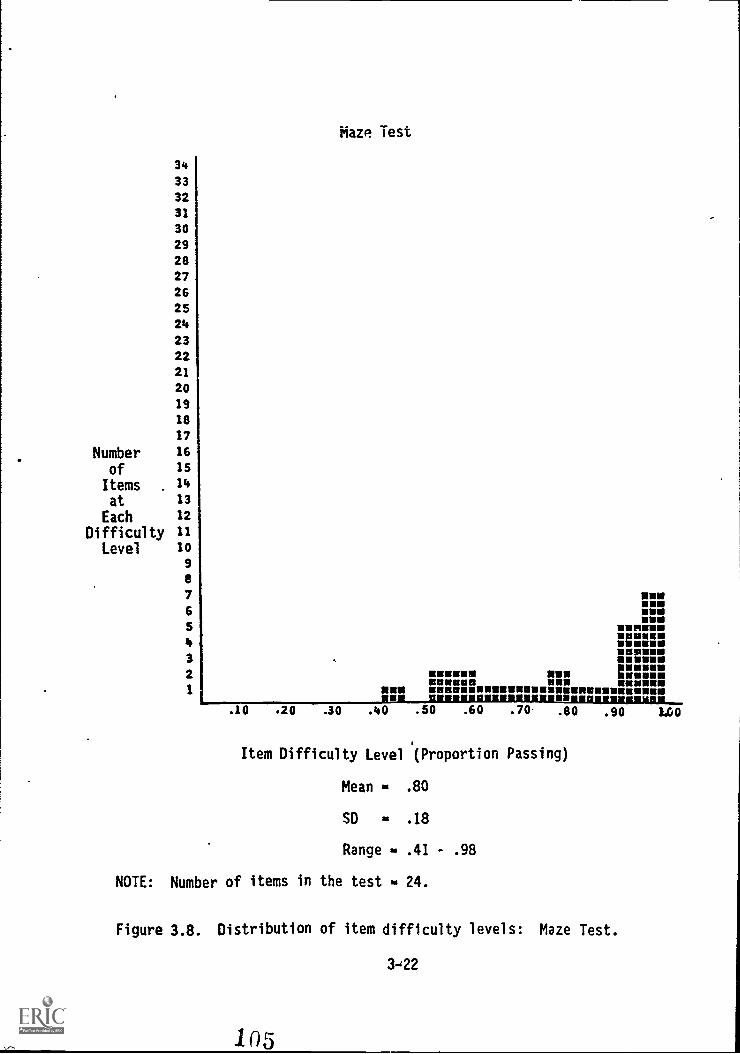
34
33
32
31
30
29
28
27
26
25
24
23
22
21
20
19
18
17
Number 16
of ls
Items 14
at 13
Each 12
Difficulty 11Level 10
9
a
7
6
5
4
3
2
1
Maze Test
NNWIMOMUMUMW
UMMOIMMOUNEMMIMEMM.U NOMM
UMMUMNI RUM :NMMUNORIO UMW NUMMIN
NUR 1118MONMENUOUVOINIUMMUMMUUMONUMMIN1111
.10 .20 .30 .40 .50 .60 .70- .80
Item Difficulty Level '(Proportion Passing)
Mean - .80
SD - .18
Range - .41 - .98
NOTE: Number of items in the test = 24.
.90
Figure 3.8. Distribution of item difficulty levels: Maze Test.
342
1 05
1.00
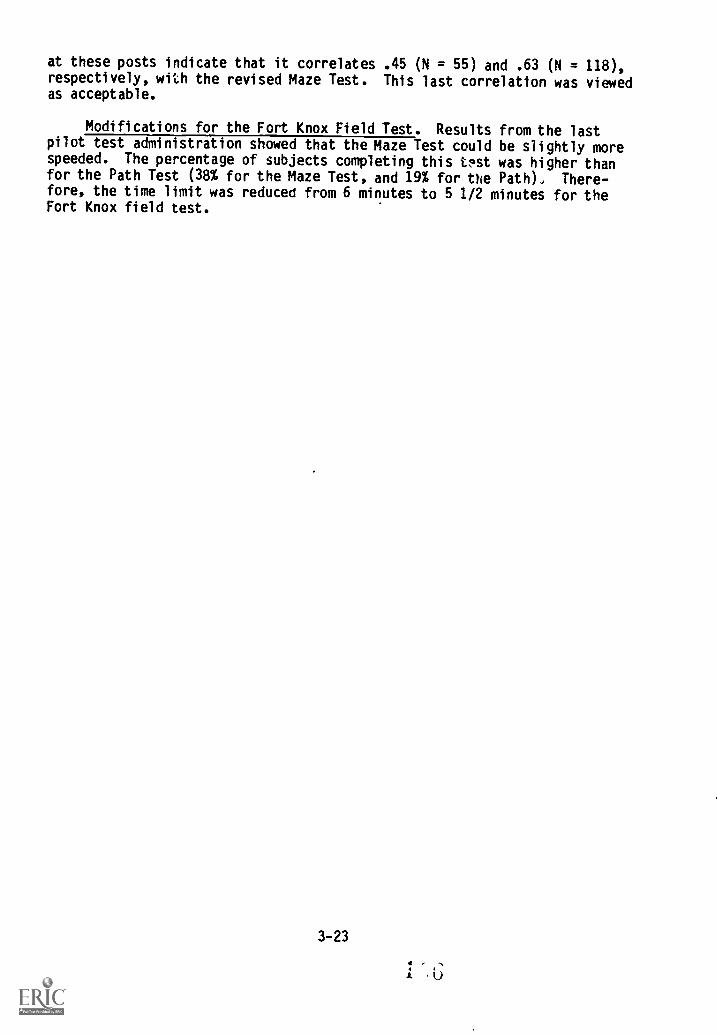
at these posts indicate that it correlates .45 (N = 55) and .63 (N = 118),respectively, with the revised Maze Test. This last correlation was viewedas acceptable.
Modifications for the Fort Knox Field Test. Results from the lastpilot test administration showed that the Maze Test could be slightly morespeeded. The percentage of subjects completing this test was higher thanfor the Path Test (38% for the Maze Test, and 19% for the Path) , There-fore, the time limit was reduced from 6 minutes to 5 1/2 minutes for theFort Knox field test.
3-23
4 - -N
' 01

FIELD INDEPENDENCE
This construct involves the ability to find a simple form when it ishidden in a complex pattern. Given a visual percept or configuration,field independence refers to the ability to hold the percept or configura-tion in mind so as to disembed it from other well-defined perceptualmaterial.
This construct received a mean validity estimate of .30 from the panelof expert judges-, with the highest estimate of .37 appearing for MOS thatinvolve detecting and identifying targets. Field Independence received apriority rating of two for inclusion in the battery.
Shapes Test
Development Strategy. According to the expert panel of judges, ameasure of field independence most effectively predicts success for MOSthat involve detecting and identifying targets, using maps in the field,planning placement of tactical position, controlling air traffic, andtroubleshooting operating systems such as mechanical, electrical, fluid,and electronic systems.
The marker.test for the Shapes Test is the Educational Testing Ser-vice's Hidden Figures Test, a measure included in the Preliminary Battery(Hough, "t al., 19841. In this test, subjects are asked to find one offive simple figures locatri in a more complex pattern. Initial analyses ofthe Preliminary Battery indicated that for the target population of first-term enlisted soldiers, the Hidden Figures Test suffers from limited testscore variance, and possibly floor effects. For example, the initial dataindicate that 80 percent of the sample completed fewer than 4 of the 16test items. The mean test score was, therefore, very low (mean = 5.16, SD= 3.35).
Our strategy for constructing the Shapes Test, then, was to use a tasksimilar to that in the Hidden Figures Test while ensuring that the diffi-culty level of test itrAs was geared more toward the Project A targetpopulation. Further, we decided to include more types of items than appearin the Hidden Figures Test and to construct items that reflect varyingdifficulty levels ranging from easy to moderately difficult. We wanted thetest to be speeded, but not nearly so much so as the ETS Hidden FiguresTest.
IePt Development. At the top of each test page are five simpleshapes; below these shapes are six complex figures. Subjects are instructed toexamine the simple shapes and then to find the one simple shape located ineach complex figure. (See Figure 3.9.)
In the first tryout, at Fort Carson, the Shapes Test contained 54items with a 16-minute time limit. Results from this tryout indicated thatmost subjects were able to complete the entire test (e.g., mean completed53.4, SD = 1.53), and most subjects obtained very high scores (mean score49.3, SD = 4.17). Item difficulty levels also suggested that this test wasvery easy and suffered from.ceiling effects (mean item difficulty lev-el = .91, SD = .13, median = .97).
3-24
ITj
Ft. Carson
Ft. Campbell
p 1>C
Complex Figures
ASCII
A 1CD2
I
A 1 C 1
Figure 3.9. Sample items from the Shapes Test.
3-25
ASCU'S
To prepare for the Fort Campbell tryout, nearly all test ites weremodified to increase item difficulty levels. Examples of item modifica-tions are provided in Figure 3.9. As is shown, by adding a few lines toeach complex pattern, the test items administered at Fort Campbell tryoutwere made more difficult than the items administered at Fort Carson.
Results from Fort Campbell indicate that test item modifications were-lccessful. Subjects, on the average, completed 43.5 (SD = 3.79) of the 54ams within the 16-minute time limit, and obtained a mean score of 30.7
OD 23.5, and median difficulty level .67).
This test was modified only slightly for the Fort Lewic administra-tion. For example, a few complex figures inadvertently contained more thanone simple figure. (This was revealed in the item analyses.) These itemswere revised to ensure that no more than one simple figure could be locatedin each complex figure. The Shapes Test administered to the Fort Lewissample contained 54 items with a 6-minute time limit.
Pilot Test Results. Table 3.5 contains Fort Lewis results from theShapes Test. Mean number completed is 42.4. The mean number correct forthis simple is 29.3 with a range of 12 to 51, indicating that the measuredoes not suffer from ceiling effects.
Item diffiCulty levels (see Figure 3.10) range from .10 to .97 with amean of 54.2 (SD 24.55). (See Figure 3.10.) Item-total correlationsrange from .07 to .57 with a mean of .39 (SD - .13). Reliability estimatesindicate that-Parts 1 and 2 correlate .69; with the Spearman-Brown correc-tion, this value is .82. The Hoyt reliability estimate for this testis .89. As a whole, these results show the test to be in good shape.
The marker test, ETS Hidden Figures Test, was administered at thefirst two tryouts. Results from Fort Carson indicate that the originalversion of the Shapes Test correlated .35 with the Hidden Figures Test (N29). Data from Fort Campbell indicate that the revised Shapes Test cor-relates .50 with its marker (N 56). Although a bit lower than desirable,this was not unexpected because of the planned differences in difficultiesof the two tests.
Modifications for the Fort Knox Field Test. The Shapes Test neededonly minor revisions for the field test. For example, item-total correla-tions for a few it ms indicated that more than one shape could still belocated in a complex figure test item, so these figures were modified.
3-26
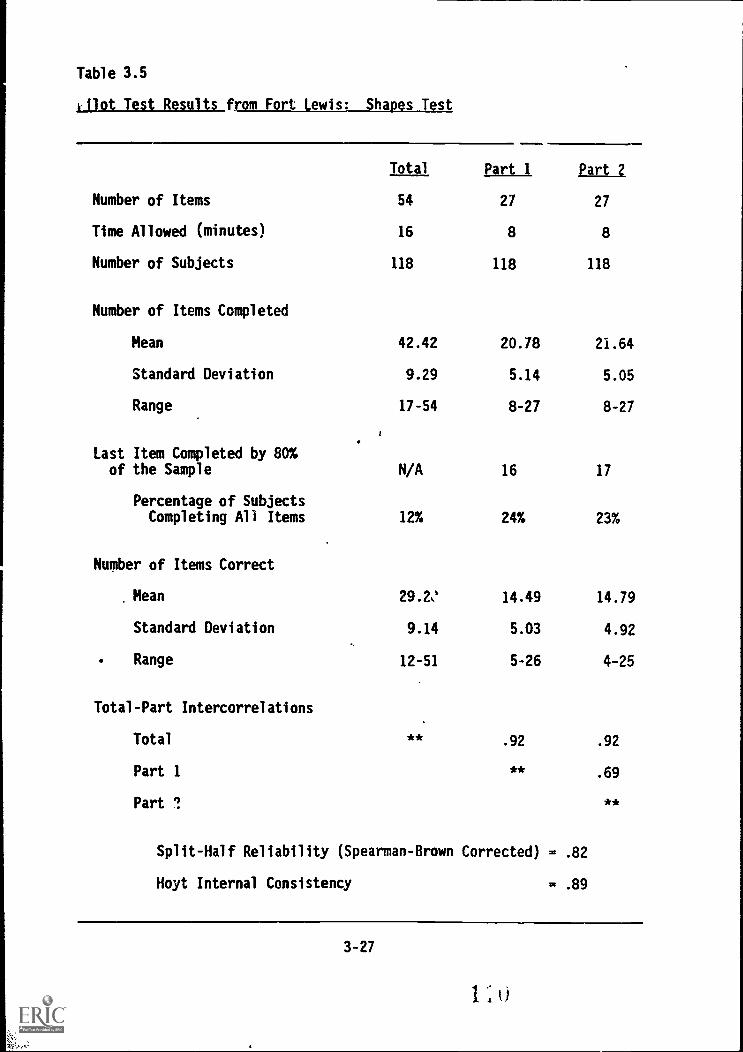
Table 3.5
.1lot Test Results from Fort Lewis: Shapes Test
Total Part 1 EAtt_Z
Number of Items 54 27 27
Time Allowed (minutes) 16 8 8
Number of Subjects 118 118 118
Number of Items Completed
Mean
Standard Deviation
Range
Last Item Completed by 80X
42.42
9.29
17-54
20.78
5.14
8-27
21.64
5.05
8-27
of the Sample N/A 16 17
Percentage of SubjectsCompleting All Items 12% 24% 23%
Number of Items Correct
Mean 29.2: 14.49 14.79
Standard Deviation 9.14 5.03 4.92
Range 12-51 5-26 4-25
Total-Part Intercorrelations
Total * * .92 .92
Part 1 ** .69
Part 1 * *
Split-Half Reliability (Spearman-Brown Corrected) = .82
Hoyt Internal Consistency - .89
3-27
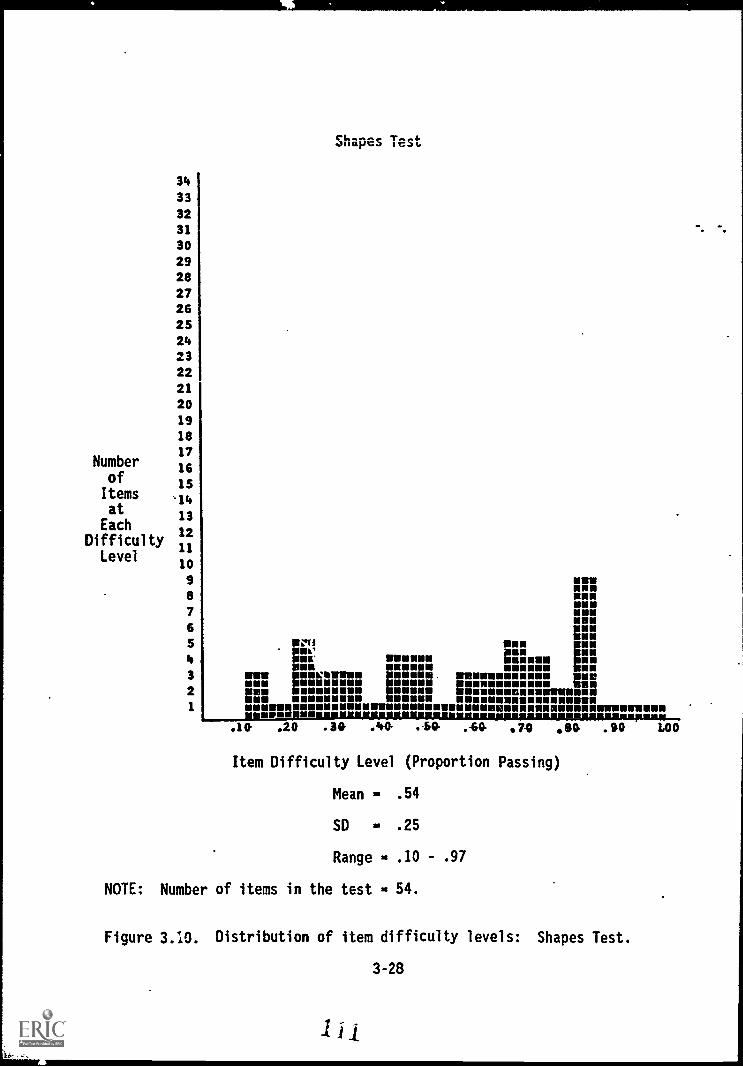
34
33
32
31
30
292827262524232221
201918
17Number 16of isItems . 14
at13
Each 12Difficulty
Level10
98
7
Shapes Test
UMMINMUMIMOU RNU SN
6 p.mROO
4111VO KN a
MOMMUUMOM
momnommos ..MEOW UM
MN5 gni mum Iss
3 MUU IMMMISO UMUUM. UUSUUSSOURS UWEmg. MOOMMUM MUUM uummusummom mem2 pew INNENIIN MOM EINUMENOMMOWOOMENN NW VIENNIONIIN MIOU IOUNIONONNUMMINUOVUM
OINWOMOMMUMW RUMMUUMMUSUUMOOMUUMUUMSMOOSUUSUUMMUU.10 .20 .30 .40 .40 .40 .70 600 .90 L00
a
Item Difficulty Level (Proportion Passing)
Mean .. .54
SD - .25
Range - .10 - .97
NOTE: Number of items in the test . 54.
Figure 3.10. Distribution of item difficulty levels: Shapes Test.
3-28
111
SPATIAL ORIENTATION
This construct involves the ability to maintain one's bearings withrespect to points on a compass and to maintain appreciation of one's loca-tion relative to landmarks in the environment.
This particrlar construct was not included in the list of predictorconstructs evaluated by the expert panel. The rationale for developingmeasures of spatial orientation for inclusion in the Pilot Trial Battery isdescribed below.
Conceptualization and measurement of this ability construct firstappeared during World War II, when researchers for the Army Air Force (AAF)Aviation Psychology Program explored a variety of constructs to aid in theselection of air crew personnel. Spatial orientation measures were de-signed to predict success in air crew positions that required familiaritywith points on a compass, the ability to apprehend directions quickly andaccurately, and the ability to remain directionally oriented in spite ofsudden and frequent changes in direction. Results from the AAF Programindicated that measures of spatial orientation were useful in selectingpilots and navigators (Guilford & Lacey, 1947).
During the.second year of Project A, several Task 2 personnel fromPDRI had the opportunity to observe recruits performing on the jolP. Thesejob observations included soldiers from a variety of MOS, such as adminis-trative specialists, cannon crewmen, armor crewmen, radio and teletypeoperators, light wheel vehicle/power generator equipment mechanics, in-fantrymen, military pike, and MANPADS personnel. Information collectedduring these job observations suggested that some MOS involve critical jobrequirements of maintaining directional orientation and establishing loca-tion using features or landmarks in the environment. For example, armor ortank crewmen when performing in the field must be able to reorient them-selves quickly as the tank turret turns or rotates; MANPADS personnel needto establish their location in the field, relative to the location offriendly and enemy troops, using features or landmarks in the environment.
Information obtained from these job observations was reported, inpart, at the March 1984 Task 2 IPR.. Participants in this meeting agreedthat measures of spatial orientation would be useful in predicting perfor-mance in Army MOS that require orientation abilities if a soldier is to besuccessful on the job. Three measures were developed for this construct.
Qrjentation_Test 1
Development Strategv. As reported above, information collected during
3 Dr. Lloyd Humphreys, of theScientific Advisory Group for Project A,particularly emphasized the usefulness of this construct to us.
4 Dr. Jay Uhlaner, also of SAG, originally suggested that job observationsessions would be especially helpful at this stage of the research, whichindeed proved to be the case.
3-29
4 2
job observations suggested that a measure of spatial orientation would bemost effective in predicting success for MOS that include such critical jobrequirements as identifying tactical positions, determining location offriendly and enemy troops, and using features or landmarks in the environ-ment to establish and maintain one's bearings.
Paper-and-pencil measures that tap this ability were developed by re-searchers in the U.S. Army Air Force's Aviation Psychology Program. Di-rection Orientation Form B (CP515B) served as the marker for OrientationTest 1. The strategy for developing Orientation 1 involved generatingitems that duplicated the task in the Army Air Force's test. Each itemcontained six circles. The first, the standard compass or "given" circle,indicates the direction of North and usually is rotated out of the conven-tional position. The remaining circles are test compasses that also havedirections marked on them.
For this test, item construction was limited to one of seven possibledirections: South, East, West, Southwest, Northwest, Southeast, and North-east. Thus, item difficulty levels were not expected to vary greatly.(Off-quadrant directional items such as Northwest or Southeast were, how-ever, viewed as more difficult than South, East, or West directionalitems.) Our plan for this test was to ask subjects to complete numerouscompass directional items within a short period of time. Orientation 1,then, was designed as a highly speeded test of spatial orientation.
Test Development. In its original form, each test item presentedsubjects with.six circles. The first, the Given Circle, indicated thecompass direction for North. For most items, North was rotated out of itsconventional position (i.e., the top of the circle did not necessarilyrepresent North). Compass directions also appeared on the remaining fivecircles. The subject's task was to determine, for each circle, whether ornot the direction indicated was correctly positioned by comparing it to thedirection of North :n the Given Circle. (See Example 1 in Figure 3.11.)
When administered to the Fort Carson sample, this test contained 20item sets requiring 100 responses (i.e., for every item, compass directionson five circles must be evaluated). Subjects were given 8 minutes tocomplete the test. Test scores were determined by the total number cor-rect; the maximum possible was 100.
Results from this first tryout showed that nearly all subjects com-pleted the items within the time allotted (mean completed was 18.6 out ofthe 20 sets of items); they obtained a mean score of 82.7 (SD = 17.9).Item difficulty levels indicate that most items were moderately easy(mean = 82.7, SD = 11.1).
Thus, for the Fort Campbell tryout, we attempted to create more dif-ficult items by modifying directional information provided in the GivenCircle. That is, rather than indicating the direction for North, compassdirections for South, East, or West were provided. These directions werealso rotated out of conventional compass position. (See Example 2, Figure3.11.)
3-30
1 i 3
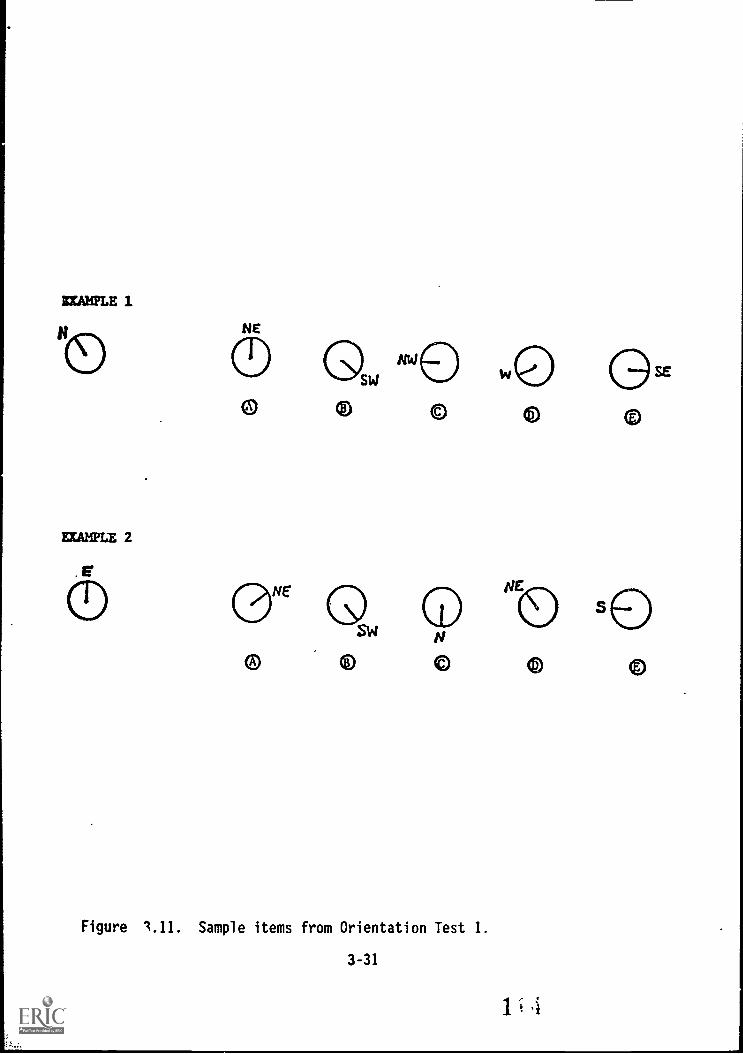
ELAHPLE 1
EXAMPLE 2
0
NE
MOw e WO G® ® © ® ®
0 Q seN
® 0 © 0 o
Figure 1.11. Sample items from Orientation Test 1.
3-31
1 4
Orientation Test 1, as administered at the Fort Campbell tryout,contained 30 item sets (150 items). It was administered in three separate-ly timed parts. Parts One and Two included the original test items, where-as Part Three included the new (non-North) items. This last part of thetest was preceded by additional test instructions that informed subjectsabout the change in Given Circle directions. Subjects were given 3 minutesto complete each part, for a total of 9 minutes.
Results from this second tryout indicate that for the total test,subjects completed 23.5 of the 30 item sets (or 117.10 items) and obtaineda mean score of 100.8 (SD = 24.0). Scores on Part Three yielded lowercorrelations with Parts One and Two (both are .44); Parts One and Twocorrelated .87. From this information we reasoned that the new items wereassessing additional information about subjects' abilities to maintainorientation.
We then mixed item sets from Part Three with item sets from Parts Oneand Two to create a test with 30 item sets (150 items) for the Fort Lewistryout. The time limit was increased to a total of 10 minutes, and testinstructions were modified to explain that items vary throughout the testwith respect to information provided in the Given Circle. Again, testscore was determined by the number of items correct (maximum score is 150).
Pilot Test Results. Results from the Fort Lewis pilot test are re-ported in Table 3.6. Completion rates/for the total test indicated that,on the average, subjects attempted 25 of the 30 item sets (or 125.7 of 150items) and obtained a mean score of 117.9 (SD = 24.2).
Item difficulty levels (see Figure 3.12) ranged from .21 to .97 with amean of .79. Item-total correlations are at acceptable levels (mean = .43,SD = .14). The correlation between Parts One and Two is .86. Reliability .
estimates are as follows: Split-half Spearman-Brown corrected = .92,Hoyt .97. These results indicate that the test was performing asintended.
No marker tests for this construct were included in any of the threepilot test administrations. However, two other new measures of spatialorientation (Orientation 2 and Orientation 3) were developed for the PilotTrial Battery and correlations between Orientation 1 and these other newtests were obtained. (These new tests are described below.) From the FortCarson data, Orientation 1 correlated .40 with Orientation 2 (N = 30)and .66 with Orientation 3 (N = 25). Results from Fort Campbell indicatethat Orientation 1 correlated .45 with Orientation 2 and .72 with Orienta-tion 3 (N = 56). Finally, for the Fort Lewis sample, these same measurescorrelated .53 and .68, respectively (N = 118). These results were viewedas indicating that Orientation 1 was tapping the appropriate constructs,but was not redundant with the other new tests.
Modifications for the Fort Knox Field Test. Very few changes weremade on this test; for example, one item was "cleaned up" to avoid cenfu-sion about the compass direction provided on the Given Circle. The fieldtest version of Orientation Test 1 contained 30 item sets (150 items) witha 10-minute time limit.
115
3-32
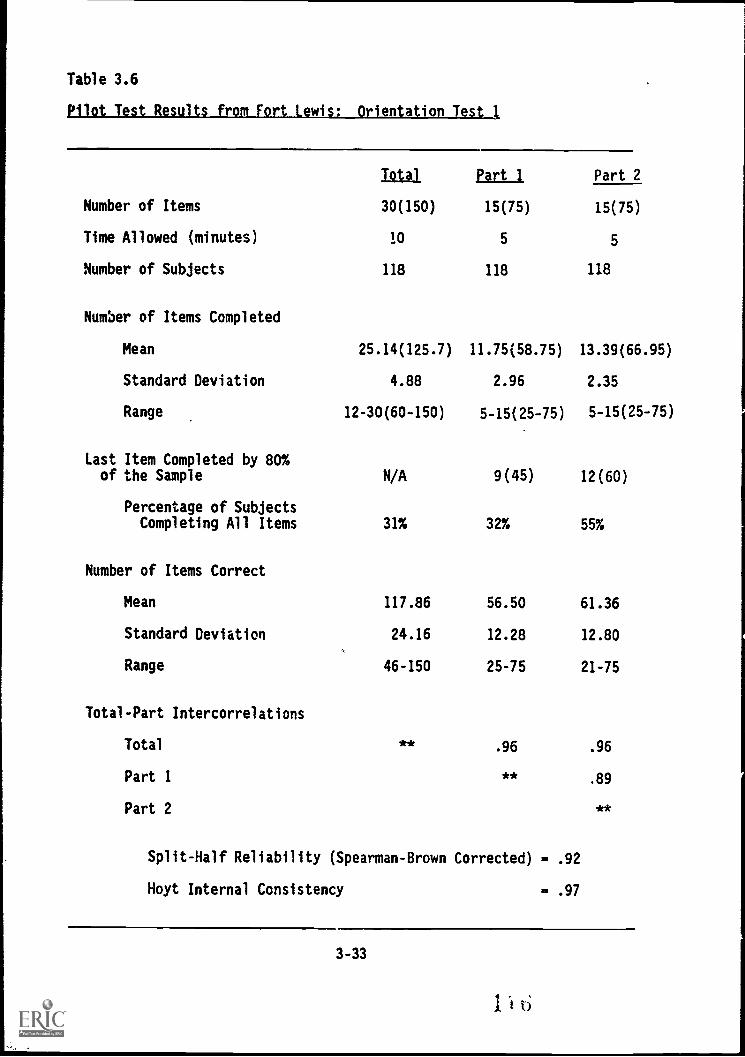
Table 3.6
n a
Total Part 1 Part 2
Number of Items 30(150) 15(75) 15(75)
Time Allowed (minutes) 10 5 5
Number of Subjects 118 118 118
Number of Items Completed
Mean 25.14(125.7) 11.75(58.75) 13.39(66.95)
Standard Deviation 4.88 2.96 2.35
Range 12-30(60-150) 5-15(25-75) 5-15(25-75)
Last Item Completed by 80%of the Sample N/A 9(45) 12(60)
Percentage of SubjectsCompleting All Items 31% 32% 55%
Number of Items Correct
Mean 117.86 56.50 61.36
Standard Deviation 24.16 12.28 12.80
Range 46-150 25-75 21-75
Total-Part Intercorrelations
Total
Part 1
Part 2
* * .96
**
.96
.89
* *
Split-Half Reliability (Spearman-Brown Corrected) - .92
Hoyt Internal Consistency - .97
3-33
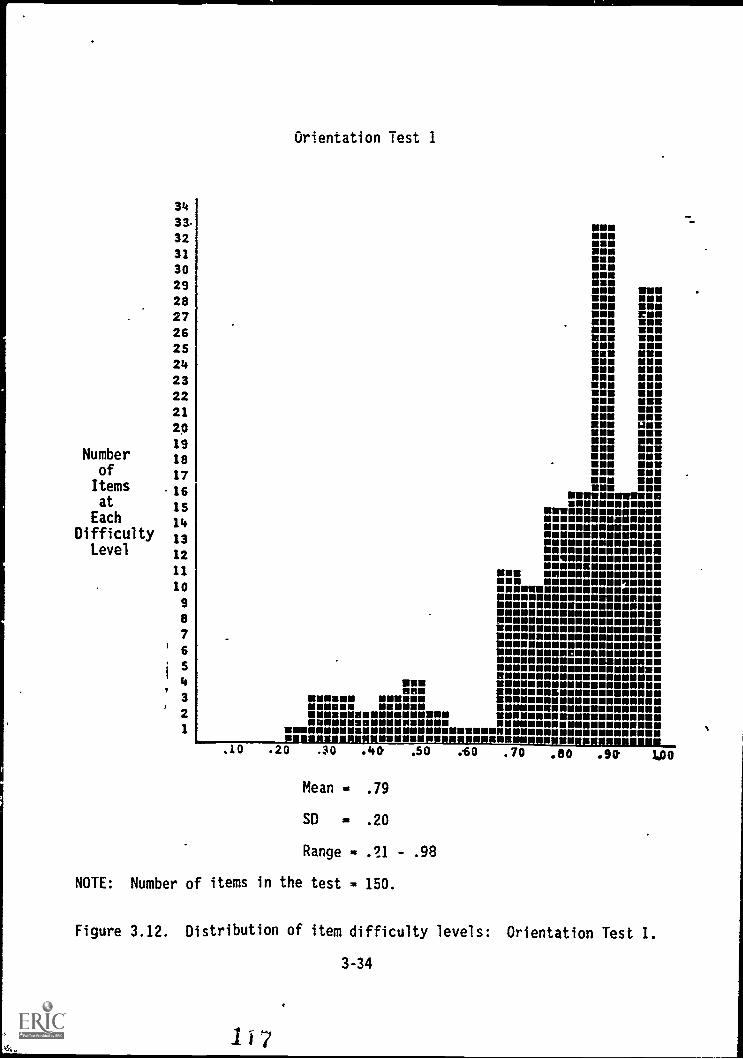
34
33-
3231
30
2928
272625242322212019
Number 18of 17Items . 16
at 15Each 14
Difficulty 13
Level 12
11
10
9
7
6
54
3
Orientation Test 1
N UM
mumMENMINMUMMINN NW muMUMO CNNMIN MumUMW
ENEN MIMIME MENMINMIN MMIN MUMMIN MUM
MOH mumMUMMI ENEM ENEMUM U
N MI NNWmom pNEoemMUM EMINMIN MEMU MINMUM ENE
NNEOMMMMMMMMMMM MMM MMMMOMMinsIMUMMMMMMMMEMmum amum mmM MMIMmumemmumeIIMMUMMUMINUMUMMINNENNIMMMOMMMMMIMMMMMMMMMIMMMOMMMMIMNMMMSMMMMM OUMMMMMMMMMM
NONmusmm IMMSMUMM MMIN
si MMM MMENE EMO Moe MMMOMMMMMM MMMMICMM NMMMMUM MMMMIN MO M.10 .20 .30 .4 .50 .60 .70
Mean - .79
SD - .20
Range .21 - .98
NOTE: Number of items in the test - 150.
.80 .90 2.00
Figure 3.12. Distribution of item difficulty levels: Orientation Test 1.
3-34
1a7
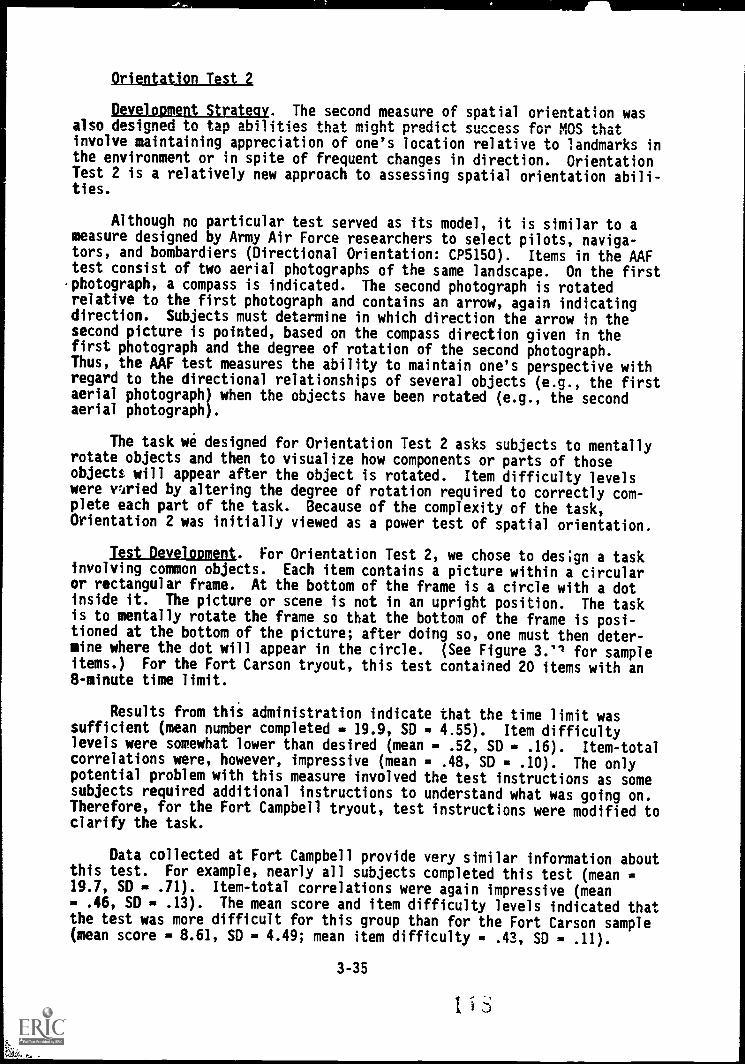
Vs
Orientation Test 2
Development Strategy. The second measure of spatial orientation wasalso designed to tap abilities that might predict success for MOS thatinvolve maintaining appreciation of one's location relative to landmarks inthe environment or in spite of frequent changes in direction. OrientationTest 2 is a relatively new approach to assessing spatial orientation abili-ties.
Although no particular test served as its model, it is similar to ameasure designed by Army Air Force researchers to select pilots, naviga-tors, and bombardiers (Directional Orientation: CP5150). Items in the AAFtest consist of two aerial photographs of the same landscape. On the firstphotograph, a compass is indicated. The second photograph is rotatedrelative to the first photograph and contains an arrow, again indicatingdirection. Subjects must determine in which direction the arrow in thesecond picture is pointed, based on the compass direction given in thefirst photograph and the degree of rotation of the second photograph.Thus, the AAF test measures the ability to maintain one's perspective withregard to the directional relationships of several objects (e.g., the firstaerial photograph) when the objects have been rotated (e.g., the secondaerial photograph).
The task we designed for Orientation Test 2 asks subjects to mentallyrotate objects and then to visualize how components or parts of thoseobjects will appear after the object is rotated. Item difficulty levelswere varied by altering the degree of rotation required to correctly com-plete each part of the task. Because of the complexity of the task,Orientation 2 was initially viewed as a power test of spatial orientation.
Test Development. For Orientation Test 2, we chose to des;gn a taskinvolving common objects. Each item contains a picture within a circularor rectangular frame. At the bottom of the frame is a circle with a dotinside it. The picture or scene is not in an upright position. The taskis to mentally rotate the frame so that the bottom of the frame is posi-tioned at the bottom of the picture; after doing so, one must then deter-mine where the dot will appear in the circle. (See Figure 3.'1 for sampleitems.) For the Fort Carson tryout, this test contained 20 items with an8-minute time limit.
Results from this administration indicate that the time limit wassufficient (mean number completed - 19.9, SD - 4.55). Item difficultylevels were somewhat lower than desired (mean - .52, SD - .16). Item-totalcorrelations were, however, impressive (mean = .48, SD = .10). The onlypotential problem with this measure involved the test instructions as somesubjects required additional instructions to understand what was going on.Therefore, for the Fort Campbell tryout, test instructions were modified toclarify the task.
Data collected at Fort Campbell provide very similar information aboutthis test. For example, nearly all subjects completed this test (mean19.7, SD is .71). Item-total correlations were again impressive (mean= .46, SD = .13). The mean score and item difficulty levels indicated thatthe test was more difficult for this group than for the Fort Carson sample(mean score = 8.61, SD - 4.49; mean item difficulty = .43, SD - .11).
3-35
1 iv
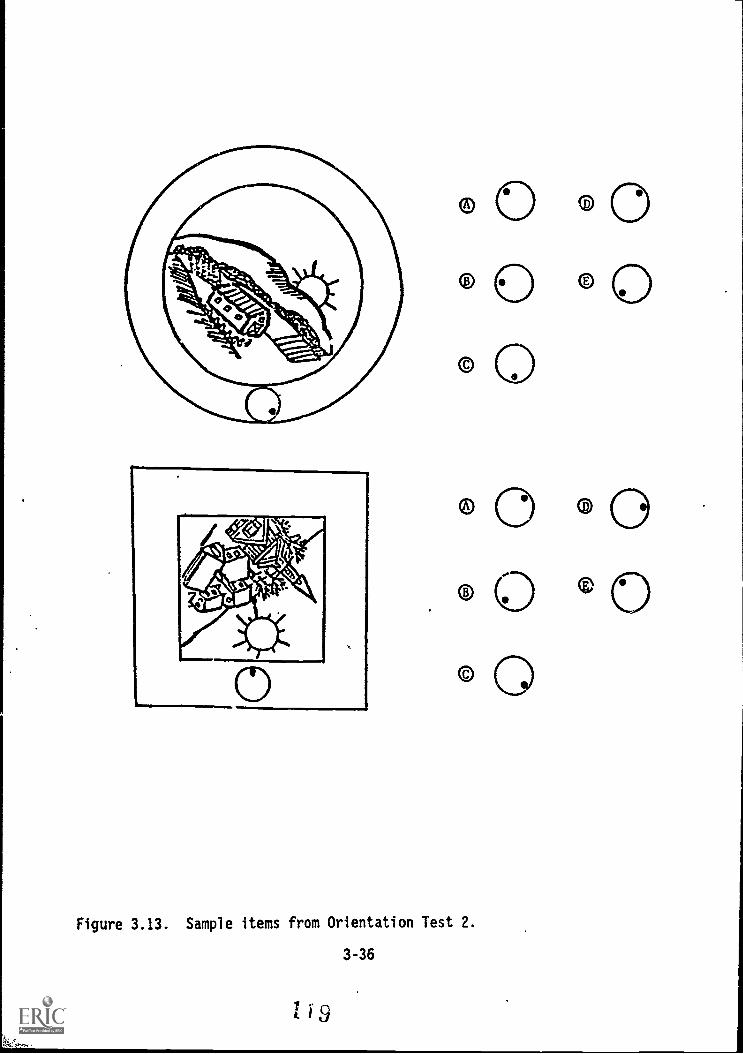
o
©
Figure 3.13. Sample items from Orientation Test 2.
3-36
119
aa
0 0
Because of these item difficulty levels, we decided to add four newtest items, constructed using item difficulty information obtained for theFort Campbell sample. That is, items were examined to identify what ap-peared to make them more or less difficult, and new, easier items werewritten using this information. Primarily, this involved constructingitems so that rotations of 90, 180, or 270 degrees were correct.
Orientation Test 2, as administered to the Fort Lewis sample, con-
tained 24 items. A 10-minute time limit was established to correspond tothe increase in the number of items. Test scores on this measure aredetermined by the total number correct.
LewisPilot Test Results. Table 3.7 contains the results from the Fort
e test. These data indicate that Orientation 2 is a power test (meannumber completed = 23.7, SD = 1.04). Subjects obtained a mean score of11.5 (SD - 6.20).
Item difficulty levels (see Figure 3.14) ranged from .19 to .71 with amean of .48. This represents a slight increase from the Fort Campbelltryout, indicating the test was somewhat easier. Item-total correlationsremained high, ranging from .22 to .74 with a mean of .53. Scores fromParts 1 and 2 correlate .80. Correcting this value for test length yieldsa split-half reliability estimate of .89. The Hoyt internal consistencyvalue is also .89. Thus, this test has excellent reliability and distribu-tional properties and met its goal of being a power test.
As noted-above, no marker tests for this test were administered in anyof the three tryouts. Correlations with the other newly developed measuresof spatial orientation were obtained at each tryout. Data from Fort Carsonindicate that Orientation 2 correlates .40 with Orientation 1 (N = 29)and .42 with Orientation 3. Results from Fort Campbell indicate that thesesame measures correlate .45 and .54 (N - 56). Finally, the Fort Lewis dataindicate the measures correlate .53 and .65 (N - 118). These correlationswere viewed as about right, that is Orientation Test 2 did correlatemoderately with other Orientation tests but not so high as to be redundant.
Modifications for the Fort Knox Field Test. For the Fort Knox admin-istration, this measure was unchanged except for the usual modification ofthe response format.
Orientation Test
Development Strategy. This test was also designed to measure spatialorientation. As with the other two measures of this construct, OrientationTest 3 is expected to be useful in predicting success for MOS that involveestablishing and maintaining one's bearing using features or landmarks inthe environment.
Orientation Test 3 was modeled after another spatial orientation test,Compass Directions, developed by researchers in the Army Air Force's Avia-tion Psychology Program. The AAF measure was designed to assess the abili-ty to reorient oneself to a particular ground pattern quickly and accurate-ly when compass directions are shifted about. Orientation 3 was designedto assess the same ability, using a similar test format.
3-372. ki
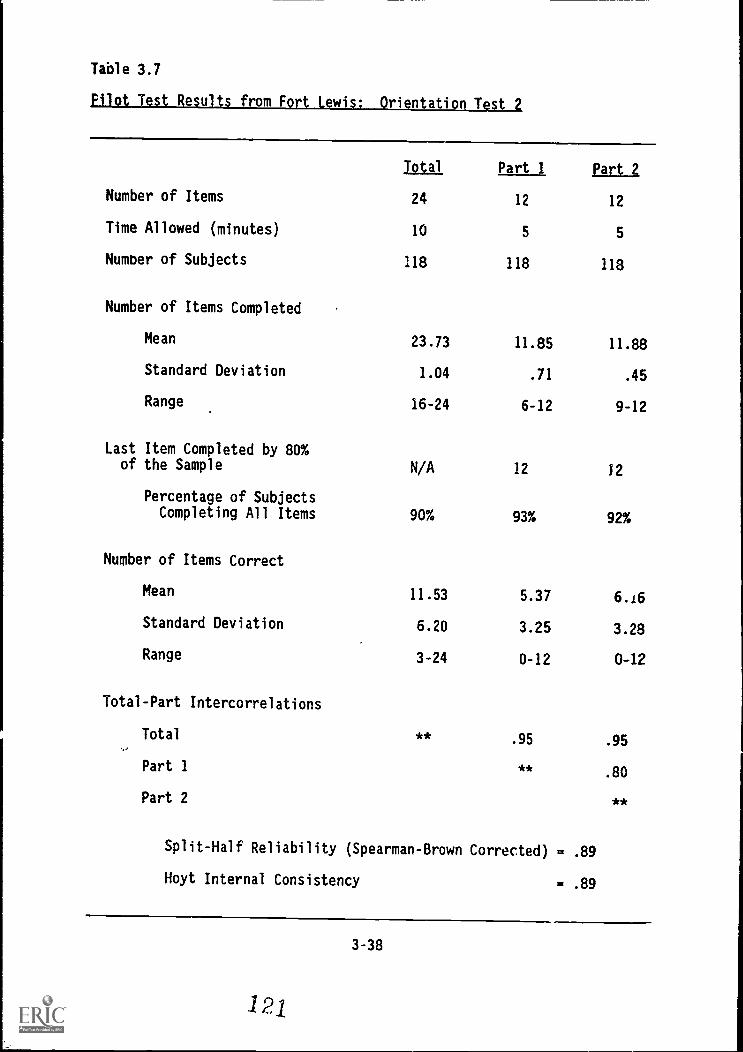
Table 3.7
pilot est Results from Fort Lewis: Orientation Te.t 2
Total Part Part 2
Number of Items 24 12 12
Time Allowed (minutes) 10 5 5
Number of Subjects 118 118 118
Number of Items Completed
Mean 23.73 11.85 11.88
Standard Deviation 1.04 .71 .45
Range 16-24 6-12 9-12
Last Item Completed by 80%of the Sample N/A 12 12
Percentage of SubjectsCompleting All Items 90% 93% 92%
Number of Items Correct
Mean 11.53 5.37 6.16
Standard Deviation 6.20 3.25 3.28
Range 3-24 0-12 0-12
Total-Part Intercorrelations
Total * *.95 .95
Part 1 * *.80
Part 2 * *
Split-Half Reliability (Spearman-Brown Corrected) = .89
Hoyt Internal Consistency = .89
3-38
121
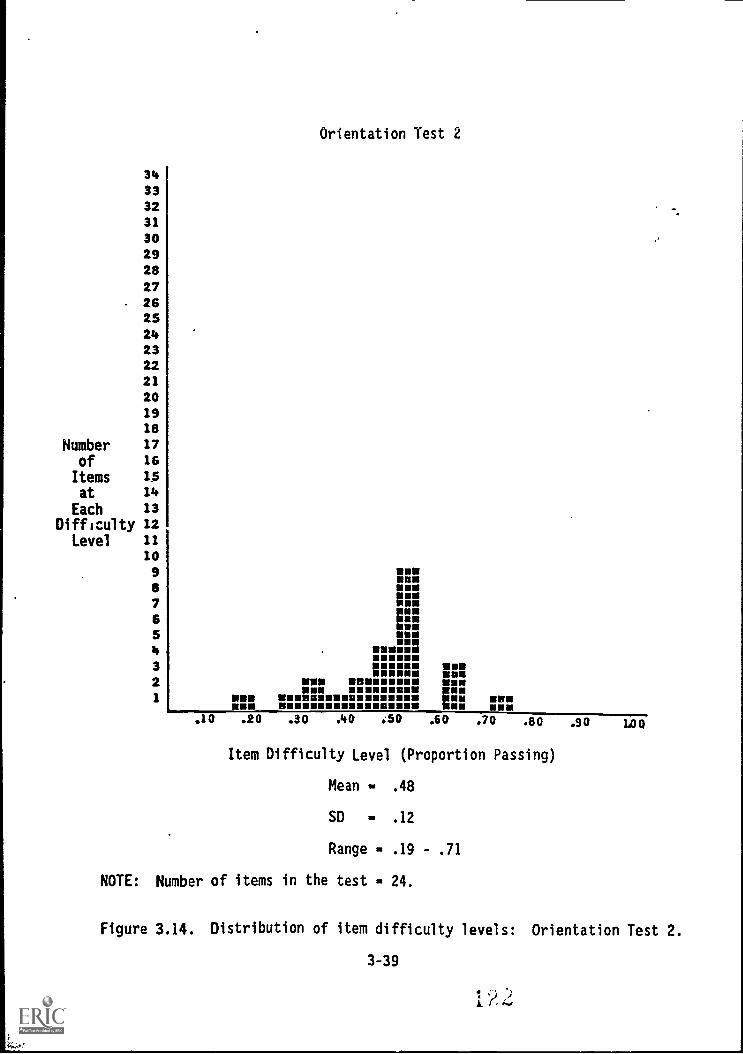
Orientation Test 2
34333231
30292827262524232221201918
Number 17of 16
Items 15at 14
Each 13
Difficulty 12
Level 1110
9 SUSMON
8 MMUMEN
7 SM.
6 1::5 S UN
111.10
4 SMONMSWUM.3 MEW S
SOSUMW...2 III Sum
1 MSSMUM
MU MSSUMW ONNOW.........MONM MN UMW
.10 .20 .30 .40 :50 .60 .70 .80 .90 1400
Item Difficulty Level (Proportion Passing)
Mean .48
SD - .12
Range = .19 - .71
NOTE: Number of items in the test = 24.
Figure 3.14. Distribution of item difficulty levels: Orientation Test 2.
3-39
Items for Orientation 3 were constructed to yield varying difficultylevels from moderately easy to moderately difficult. This test was de-signed to place somewhat more emphasis on speed than on power.
Test Development. In its original form, Orientation 3 presentedsubjects with a map that includes various landmarks such as a barracks, acampsite, a forest, a lake, and so on. Within each item, subjects are pro-vided with compass directions by information on the direction of one land-mark with respect to another, such as the forest is north of the camp-site." Subjects are also informed of their present location relative toanother landmark. Given this information, the subject must determine whichdirection to go to reach yet another structure or landmark. Figure 3.15contains one test map and two sample items. Note that for each item, newor differInt compass directions are given.
For the Fort Carson tryout, the test contained two maps with 10 ques-tions about each map, for a total of 20 items. Subjects were given 12minutes to complete tke test. Results from this first tryout revealed veryfew problems with the test (e.g., test instructions were clear, the timewas sufficient, no floor nor ceiling effects appeared). Thus, this measureremained unchanged for the Fort Campbell pilot test.
Results from the second tryout yielded similar information (e.g., noceiling nor floor effects, acceptable completion rates). These data,however, indicated that for a few items, two responses might be correct dueto a lack of precision in drawing the two maps. Accordingly, landmarks oneach map were. repositioned to ensure that me and only one correct answerexisted for each item. In addition, one item was rewritten to make itswording uniform with other test items. When administered to the Fort Lewissample, Orientation , contained 20 test items with a 12-minute time limit.Test scores are determined by the total number correct.
Pilot Test Results. Results from the Fort Lewis administration arereported in Table 3.8. On the average, subjects completed 18 items. Themean score of 8.7 Indic, that subjects correctly answered about one-halfof the items attempted.
Item difficulty levels (see Figure 3.16) range from .24 to .63 with amean of .44. Item-total correlations range from .48 to .72 with a meanof .59 (SD .07). Part 1 and Part 2 correlate .79. The split-half reli-ability estimate corrected for test length is .88, while the Hoyt internalconsistency estimate is .90. These results indicate that the test ishighly reliable, had Acceptable distributional properties, and was ap-proprtately speeded.
Data from Fort Carson indicate that Orientation Test 3 correlates .66with Orientation 1 (N - 29) and .42 with Orientation 2 (N - 31). Valuesfor these same measures administered at Fort Campbell are .72 and .54
- 56). Data from Fort Lewis indicate that these measures correlate .68and .65 (N - 118). As with the other two Orientation tests, these resultswere viewed as acceptable.
Modifications for the Fort Knox Field Test. This test was unchangedfor the `:at Knox field test except for the response format modifications.
3-40
123
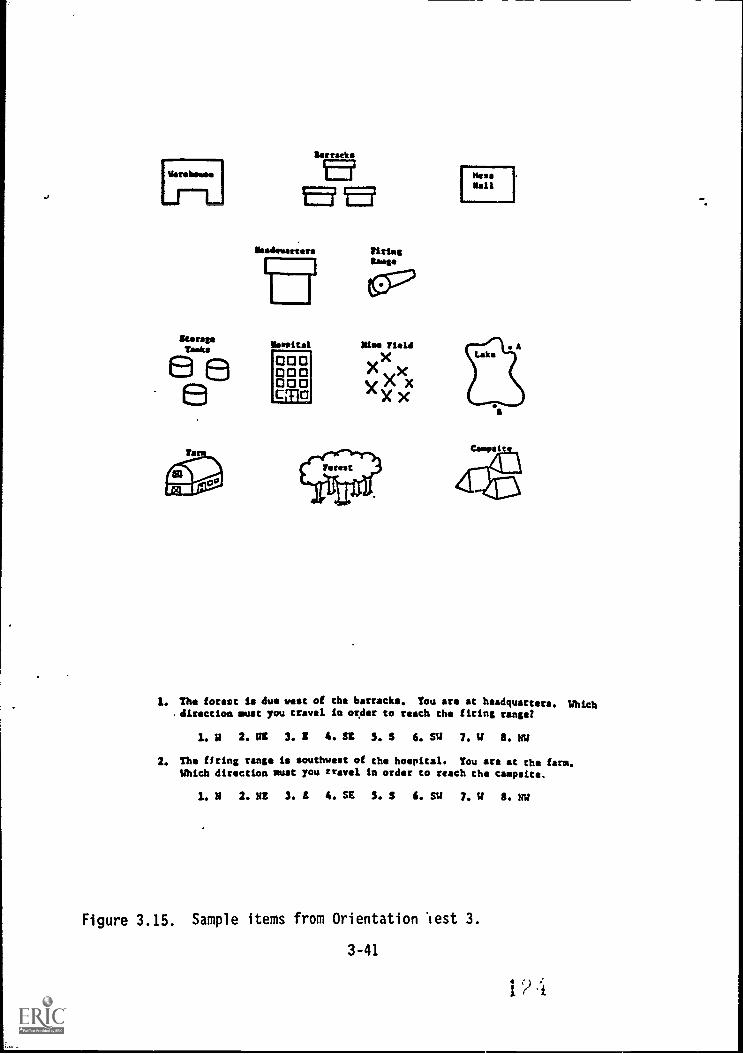
[....TLllarses
StorageTaskse e
Ilarraeks
15'
Oassital
000000000,CM0
nriasBaste
Was That
XX
X XX X
I NessNall
1. The forest is due west of the barracks. You are at headquarters. Which.dlrection must you travel in order to reach the firing range?
1. V 2. VS 3. t 4. SE 5. S 6. SW 7. W 8. NW
2. The firing range is southwest of the hospital. You are at the farm.Which direction must you travel in order to reach the campsite.
1. H 2. HE 3. L 4. SS 3. S 6. SW 7. W 8. NW
Figure 3.15. Sample items from Orientation lest 3.
3-41
4
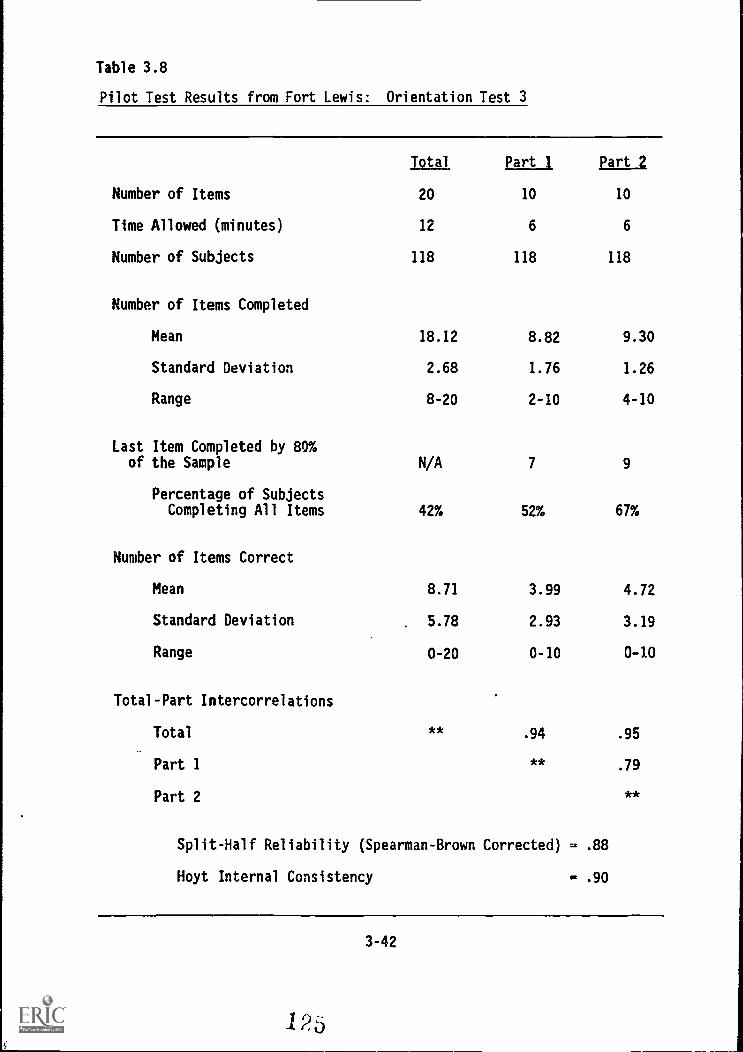
Table 3.8
Pilot Test Results from Fort Lewis: Orientation Test 3
Total Eart 1 Part 2
Number of Items 20 10 10
Time Allowed (minutes) 12 6 6
Number of Subjects 118 118 118
Number of Items Completed
Mean 18.12 8.82 9.30
Standard Deviation 2.68 1.76 1.26
Range 8-20 2-10 4-10
Last Item Completed by 80%of the Sample N/A 7 9
Percentage of SubjectsCompleting All Items
Number of Items Correct
42% 52% 67%
Mean 8.71 3.99 4.72
Standard Deviation . 5.78 2.93 3.19
Range 0-20 0-10 0-10
Total-Part Intercorrelations
Total ** .94 .95
Part 1 ** .79
Part 2 **
Split-Half Reliability (Spearman-Brown Corrected) = .88
Hoyt Internal Consistency = .90
3-42
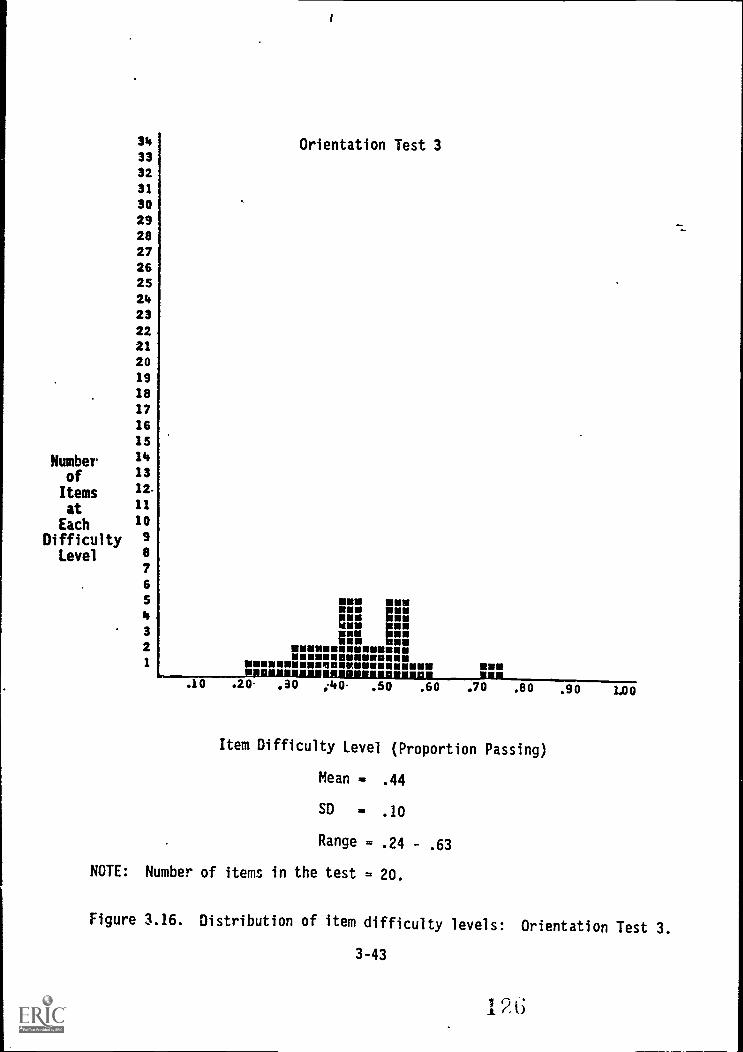
3433
32
31
30
292827262524232221
201918
1716
15
Number 24
of 13
Items 12.
at 11
Each 10
Difficulty 9
Level7
6
S
3
2
Orientation Test 3
SUM
NU NEN1::
immummimmimmu11111111111111N1MERNI
NNWIMINNOINUMMINNIMIMUNIMU1111211AMBURRAS
.10 .20- .30 ;40 .50 .60 .70 .80 .90 1.00
Item Difficulty Level (Proportion Passing)
Mean - .44
SD - .10
Range = .24 - .63
NOTE: Number of items in the test = 20.
Figure 3.16. Distribution of item difficulty levels: Orientation Test 3.
3-43
126
INDUCTION - FIGURAL REASONING
This construct involves the ability to generate hypotheses aboutprinciples governing relationships among several objects.
Example measures of induction include the Employee Aptitude Survey
Test 6 - Numerical Reasoning (EAS-6), Educational Testing Service's Figure
Classification, Differential Aptitude Test (DAT) Abstract Reasoning,Science Research Associates (SRA) Word Grouping, and Raven's Progressive
Matrices. These paper-and-pencil measures present subjects with a series
of objects such as figures, numbers, or words. To complete the task,
subjects must first determine the rule governing the relationship among theobjects and then apply the rule to identify the next object in the series.
The panel of expert judges indicated that a measure of inductivereasoning would be useful for predicting success in numerous Army MOS.Specifically, for figural reasoning these judges estimated the mean validi-ty at .25. The Army's current selection and classification system measuresreasoning ability using word problems, but lacks a general measure of
hypothesis generation and application. Two measures of reasoning were
developed.
Reasoning Test 1
Development Strateov. According to the panel of experts, a measure offigural reasoning should effectively predict success in a wide variety of
MOS, especially those that involve troubleshooting, inspecting and re-pairing operations systems, analyzing intelligence data, controlling airtraffic, and detecting and identifying targets.
Published tests selected as markers for the induction construct in-cluded EAS-6 Numerical Reasoning and ETS Figure Classification. In the
Numerical Reasoning Test, subjects are asked to examine a series of numbersto determine the pattern or the principle governing the relationship amongthe numbers in the series; subjects must then apply the principle to iden-
tify the number appearing next in the series. In the ETS Figure Classifi-cation Test, subjects are asked to examine two (or three) groups of figuresto determine how the figures in one. group are alike and how the groupsdiffer; subjects must then classify test figures into one of the two (or
three) groups.
Our plan for developing Reasoning Test 1 was to construct a test that
was similar to the task appearing in EAS-6 Numerical Reasoning, but with
one major difference: items would be composed of illustrations rather than
number's. Test items were constructed to represent varying degrees ofdifficulty ranginc from very easy to very difficult. Following item de-
velopment, time liAits were established to allow sufficient time for sub-jects to complete all or nearly all items. Thus, Reasoning 1 was designed
as a power measure of induction.
Test Development. Reasoning Test 1 items present subjects with a
series of four figures. The task is to identify the pattern or relation-ship among the figures and then to identify from among five possibleanswers the one figure that appears next in the series. In the original
test, subjects were asked to complete 30 items in 14 minutes. Sample
items are provided in Figure 3.17.
3-44
12?
Results from the first tryout, conducted at Fort Carson, indicate thatsubjects, on the average, completed 29.5 (SD = 1.39) items and obtained amean score of 20.8 (SD = 3.54). Inspection of difficulty levels indicated
that items were unevenly distributed between the two test parts. Items
were therefore reordered to ensure that easy and difficult items wereequally distributed throughout both test parts. Only minor modifications
were made to test items; for example, one particularly difficult item was
redrawn to reduce the difficulty level.
Data collected at Fort Campbell indicate that again nearly all sub-jects completed the test (mean = 29.7, SD = 1.50). Further, test adminis-
trators reported that those who completed the test finished early. Thus,
the 14-minute time limit was reduced to 12 minutes. Further, two items
were revised because distractors yielded higher item-total correlations
than the correct respnse.
Pilot Test Results. Data collected at the third tryout, conducted atFort Lewis, are reported in Table 3.9. Subjects, on the average, completed29.4 items with about 84 percent o- the subjects completing the entiretest. Test scores, computed as the total number correct, ranged from 4to 29 with a mean of 19.6.
Item difficulty levels ranged from ..26 to .92 with a mean of .66.Item-total correlations averaged .45 (SD = .10) with a range of .24 to .60.
Part 1 and Part 2 correlate .64. The split-half reliability estimatecorrected for test length is .78, while the Hoyt value is .86. Theseresults indicated the test was in good shape; it was a reliable power testwith acceptable distributional properties.
One of the marker tests, ETS Figure Classification, was administeredat the first two tryout sites. The Fort Carson data indicate ReasoningTest 1 correlates .34 (N = 22) with this measure, while the Fort Campbelldata indicate that the two correlate .25 (N = 56). Because the taskinvolved in Reasoning 1 differs from that in ETS Figure Classification, thelow value of these correlations is not alarming.
Two other marker measures of induction, SRA Word Grouping and DATAbstract Reasoning, were administered at the Fort Lewis tryout. These data
indicate that Reasoning 1 correlates .47 with Word Grouping and .74 with
Abstract Reasoning. These data are compatible with our understanding of
these two marker measures of induction. Word Grouping contains a verbalcomponent while Abstract Reasoning measures induction via figural reason-ing, similar to Reasoning Test 1.
Modifications for the Fort Knox Field test. For the Fort Knox fieldtest, instructions for Reasoning Test 1 were revised slightly.
Reasoning Test 2
Development Strategy. This measure was also designed to assess induc-
tion using items that require figural reasoning.
3-45
1 23
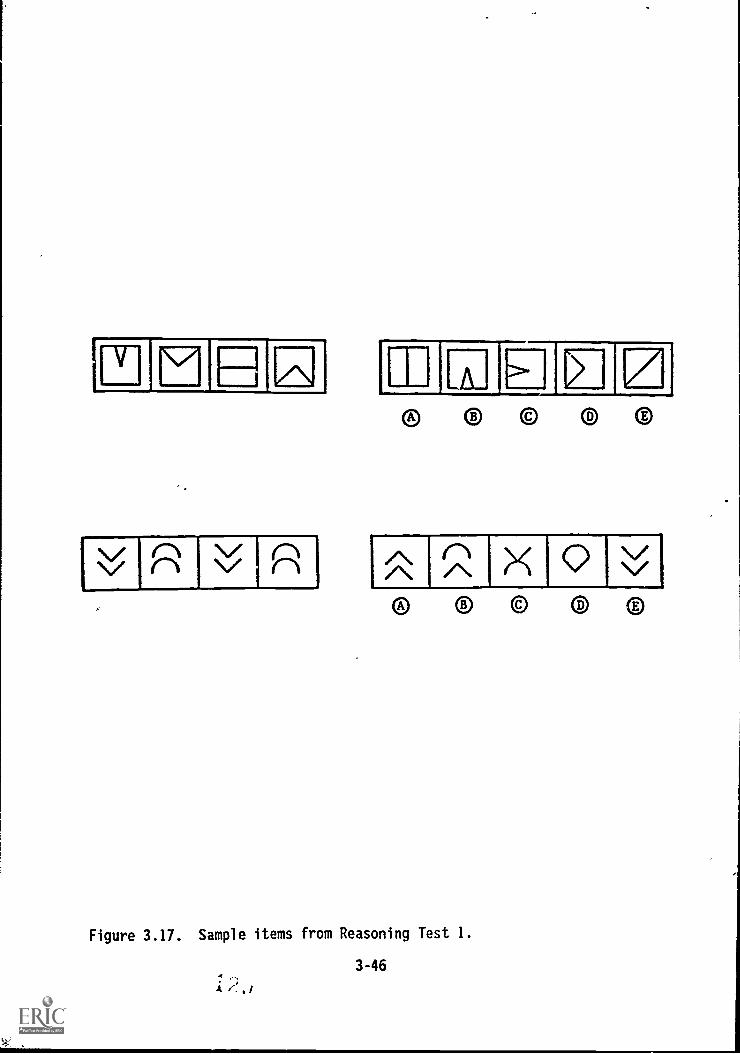
V
/Th NVe 1 rN
®
/ \/ \ n/..® 0 0 ®
Figure 3.17. Sample items from Reasoning Test 1.
3-46A r,,
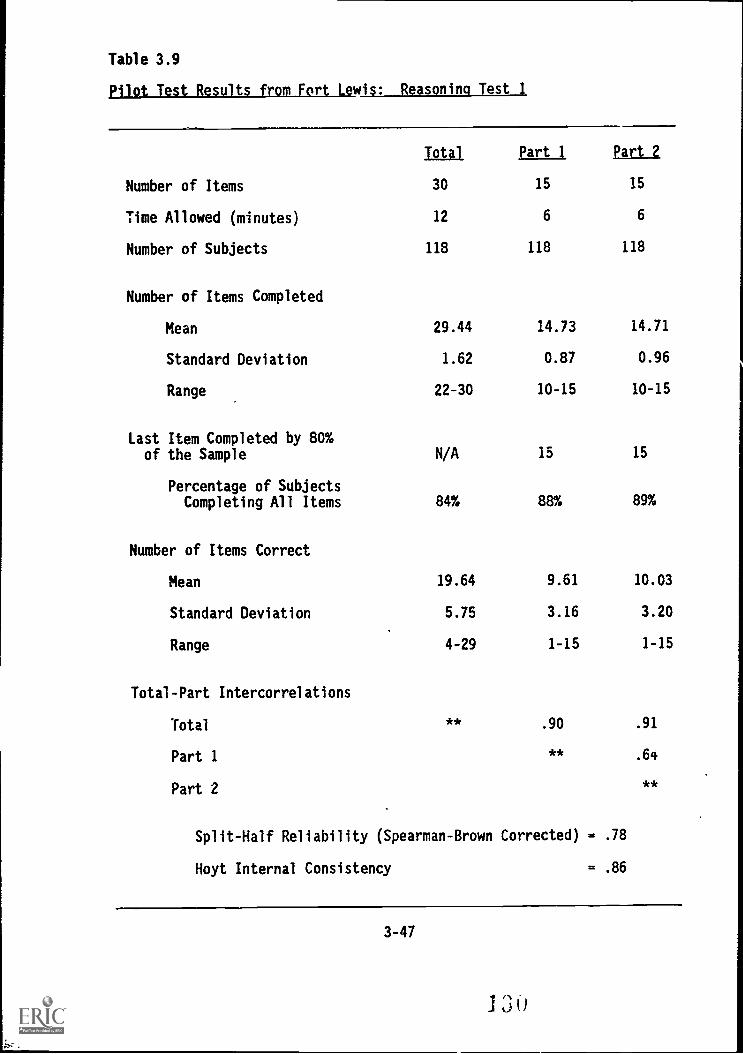
Table 3.9
pilot Test Results from Fort Lewis: Reasoning Test 1
Total Part i Part 2
Number of Items 30 15 15
Time Allowed (minutes) 12 6 6
Number of Subjects 118 118 118
Number of Items Completed
Mean 29.44 14.73 14.71
Standard Deviation 1.62 0.87 0.96
Range 22-30 10-15 10-15
Last Item Completed by 80%of the Sample N/A 15 15
Percentage of SubjectsCompleting All Items 84% 88% 89%
Number of Items Correct
Mean 19.64 9.61 10.03
Standard Deviation 5.75 3.16 3.20
Range 4-29 1-15 1-15
Total-Part Intercorrelations
Total * * .90 .91
Part 1 * * .64
Part 2* *
Split-Half Reliability (Spearman-Brown Corrected) - .78
Hoyt Internal Consistency = .86
3-47
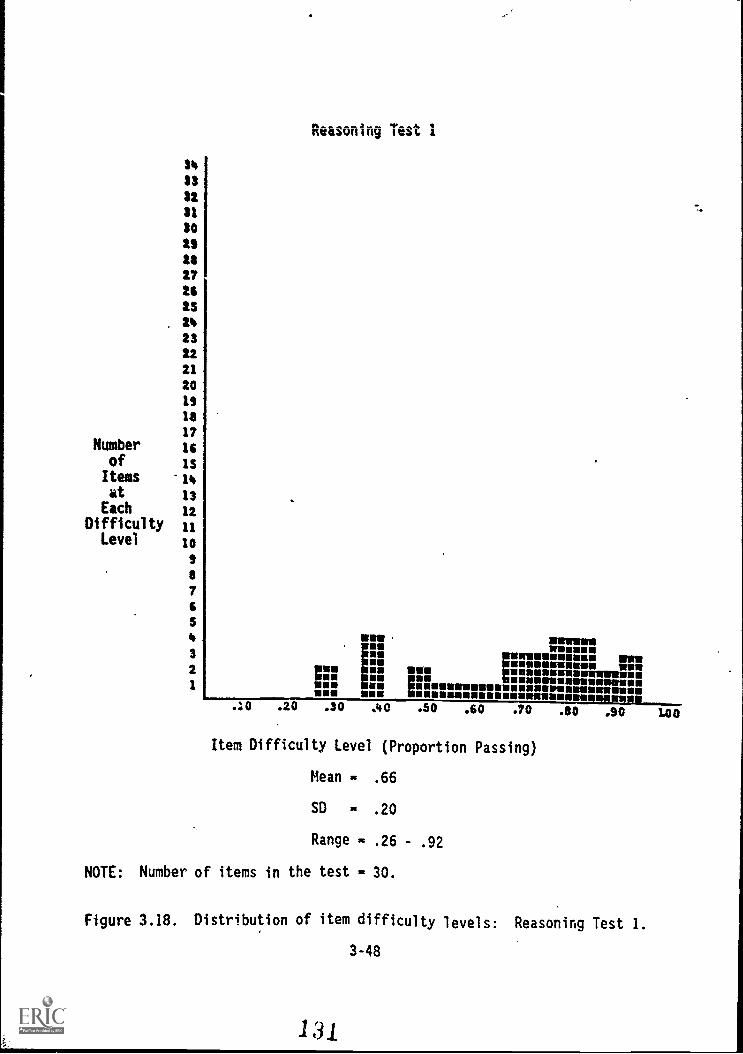
Reasefiing Test 1
NumberofItemskt
EachDifficulty
Level
34
$3
32
Ii
30
192$2726IS22322
21
20
19
1$
17
is
is
iM
la
1211
10
0
7
6
S
4
3
2
1usMO
IMO
NeumeUMonUm
USW
wilmmompumenummusam muIIIMUNIMIUMU011 UMWmr. pnomiummuum mumm11111111MMUUMMUOUVOQUOMINIUMMUMBUIM U VU MMOKROVISO
SUUSSISUURIM NROURUMUMO ._ _L _.:0 .20 .30 .40 .50 .60 .70 .80 .90 L00
Item Difficulty Level (Proportion Passing)
Mean - .66
SD - .20
Range - .26 - .92
NOTE: Number of items in the test - 30.
Figure 3.18. Distribution of item difficulty levels: Reasoning Test 1.
3-48
131
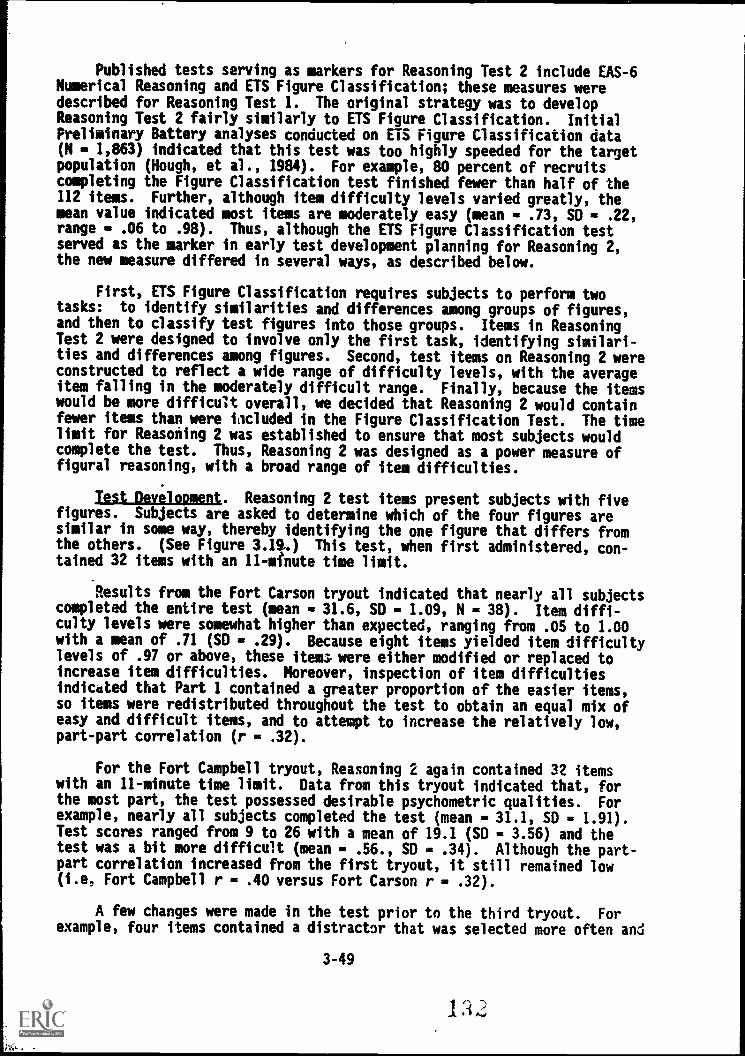
Published tests serving as markers for Reasoning Test 2 include EAS-6Numerical Reasoning and ETS Figure Classification; these measures weredescribed for Reasoning Test 1. The original strategy was to developReasoning Test 2 fairly similarly to ETS Figure Classification. InitialPreliminary Battery analyses conducted on ETS Figure Classification data(N 1,863) indicated that this test was too highly speeded for the targetpopulation (Hough, et al., 1984). For example, 80 percent of recruitscompleting the Figure Classification test finished fewer than half of the112 items. Further, although item difficulty levels varied greatly, themean value indicated most items are moderately easy (mean = .73, SD = .22,range .06 to .98). Thus, although the ETS Figure Classification testserved as the marker in early test development planning for Reasoning 2,the new measure differed in several ways, as described below.
First, ETS Figure Classification requires subjects to perform twotasks: to identify similarities and differences among groups of figures,and then to classify test figures into those groups. Items in ReasoningTest 2 were designed to involve only the first task, identifying similari-ties and differences among figures. Second, test items on Reasoning 2 wereconstructed to reflect a wide range of difficulty levels, with the averageitem falling in the moderately difficult range. Finally, because the itemswould be more difficult overall, we decided that Reasoning 2 would containfewer items than were iacluded in the Figure Classification Test. The timelimit for Reasoning 2 was established to ensure that most subjects wouldcomplete the test. Thus, Reasoning 2 was designed as a power measure offigural reasoning, with a broad range of item difficulties.
Test Development. Reasoning 2 test items present subjects with fivefigures. Subjects are asked to determine which of the four figures aresimilar in some way, thereby identifying the one figure that differs fromthe others. (See Figure 3.19.) This test, when first administered, con-tained 32 items with an 11-minute time limit.
Results from the Fort Carson tryout indicated that nearly all subjectscompleted the entire test (mean 31.6, SD = 1.09, N = 38). Item diffi-culty levels were somewhat higher than expected, ranging from .05 to 1.00with a mean of .71 (SD = .29). Because eight items yielded item difficultylevels of .97 or above, these items were either modified or replaced toincrease item difficulties. Moreover, inspection of item difficultiesindicated that Part 1 contained a greater proportion of the easier items,so items were redistributed throughout the test to obtain an equal mix ofeasy and difficult items, and to attempt to increase the relatively low,part-part correlation (r - .32).
For the Fort Campbell tryout, Reasoning 2 again contained 32 itemswith an 11-minute time limit. Data from this tryout indicated that, forthe most part, the test possessed desirable psychometric qualities. Forexample, nearly all subjects completed the test (mean = 31.1, SD = 1.91).Test scores ranged from 9 to 26 with a mean of 19.1 (SD = 3.56) and thetest was a bit more difficult (mean = .56., SD = .34). Although the part-part correlation increased from the first tryout, it still remained low(i.e, Fort Campbell r = .40 versus Fort Carson r = .32).
A few changes were made in the test prior to the third tryout. Forexample, four items contained a distractor that was selected more often and
3-49
1.j
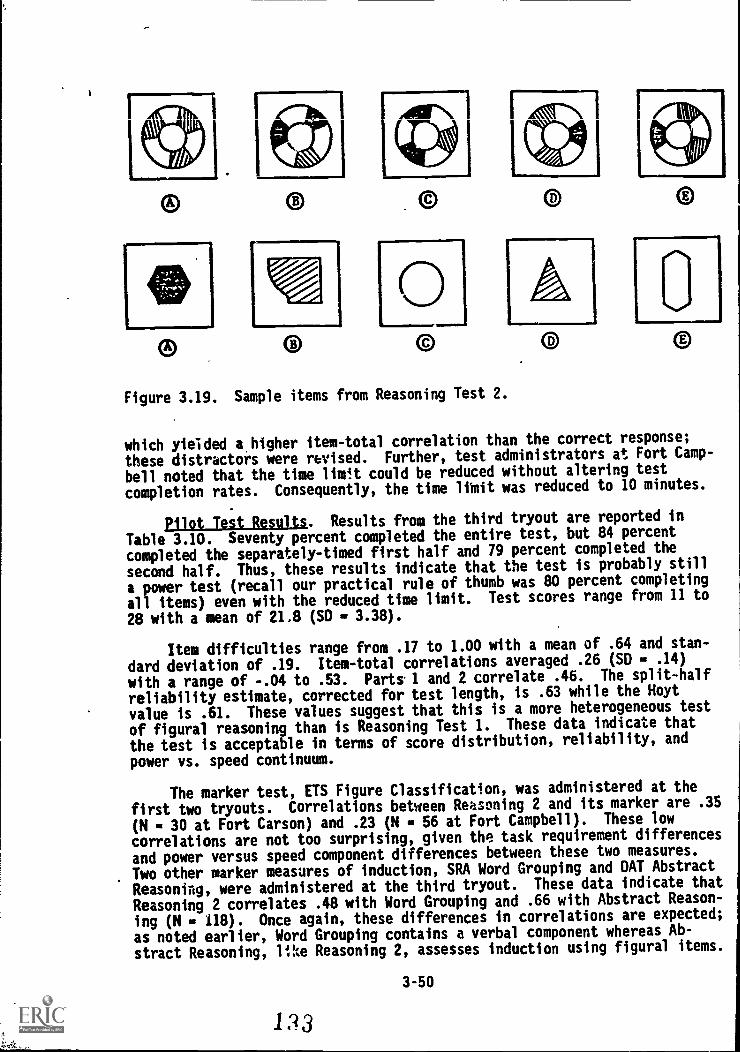
411.1111=11111M1.
0Figure 3.19. Sample items from Reasoning Test 2.
400.,.
which yielded a.higher item-total correlation than the correct response;
these distractors were revised. Further, test administrators at Fort Camp-
bell noted that the time limit could be reduced without altering test
completion rates. Consequently, the time limit was reduced to 10 minutes.
pilot Test Results from the third tryout are reported in
Table 3.10. Seventy percent completed the entire test, but 84 percent
completed the separately-timed first half and 79 percent completed the
second half. Thus, these results indicate that the test is probably still
a power test (recall our practical rule of thumb was 80 percent completing
all items) even with the reduced time limit. Test scores range from 11 to
28 with a mean of 21.8 (SD 3.38).
Item difficulties range from .17 to 1.00 with a mean of .64 and stan-
dard deviation of .19. Item-total correlations averaged .26 (SD - .14)
with a range of -.04 to .53. Parts.1 and 2 correlate .46. The split-half
reliability estimate, corrected for test length, is .63 while the Hoyt
value is .61. These values suggest that this is a more heterogeneous test
of figural reasoning than is Reasoning Test 1. These data indicate that
the test is acceptable in terms of score distribution, reliability, and
power vs. speed continuum.
The marker test, ETS Figure Classification, was administered at the
first two tryouts. Correlations between Reasoning 2 and its marker are .35
(N 30 at Fort Carson) and .23 (N 56 at Fort Campbell). These low
correlations are not too surprising, given the task requirement differences
and power versus speed component differences between these two measures.
Two other marker measures of induction, SRA Word Grouping and DAT Abstract
Reasoning, were administered at the third tryout. These data indicate that
Reasoning 2 correlates .48 with Word Grouping and .66 with Abstract Reason-
ing (N 118). Once again, these differences in correlations are expected;
as noted earlier, Word Grouping contains a verbal component whereas Ab-
stract Reasoning, Me Reasoning 2, assesses induction using figural items.
3-50
1 .13
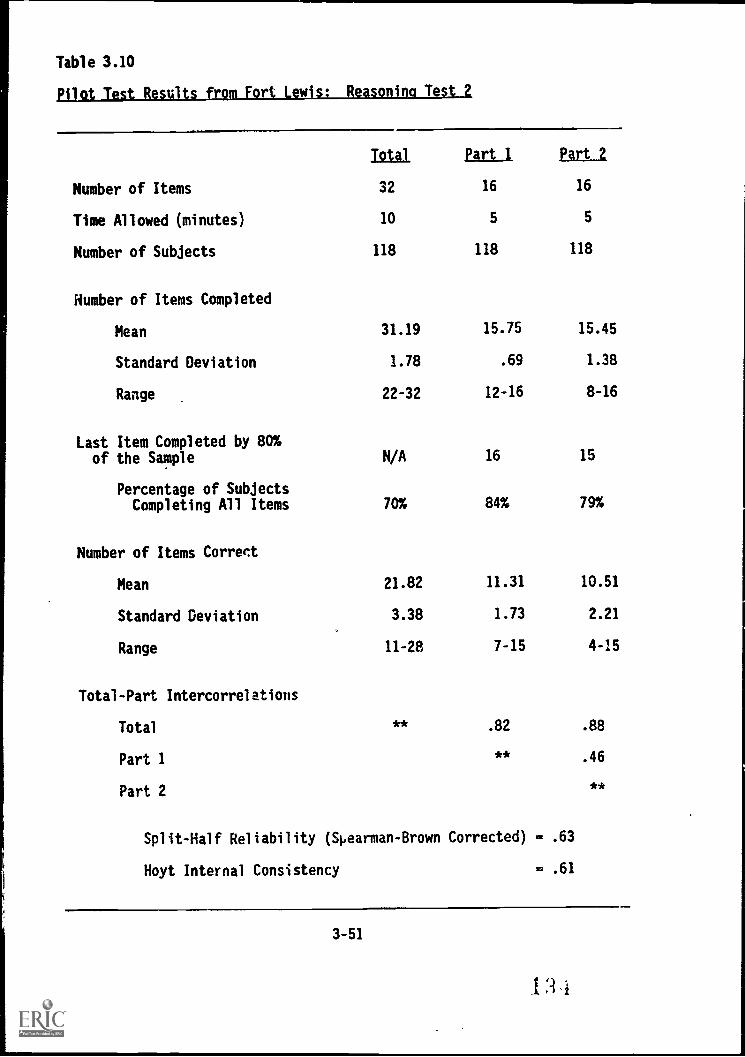
Table 3.10
1 *1
Total bill Part 2
Number of Items 32 16 16
Time Allowed (minutes) 10 5 5
Number of Subjects 118 118 118
Humber of Items Completed
Mean 31.19 15.75 15.45
Standard Deviation 1.78 .69 1.38
Range 22-32 12-16 8-16
Last Item Completed by 80%of the Sample N/A 16 15
Percentage of SubjectsCompleting All Items 70% 84% 79%
Number of Items Correct
Mean 21.82 11.31 10.51
Standard Deviation 3.38 1.73 2.21
Range 11-28 7-15 4-15
Total-Part Intercorrelations
Total ** .82 .88
Part 1* * .46
Part 2* *
Split-Half Reliability (4earman-Brown Corrected) - .63
Hoyt Internal Consistency = .61
3-51
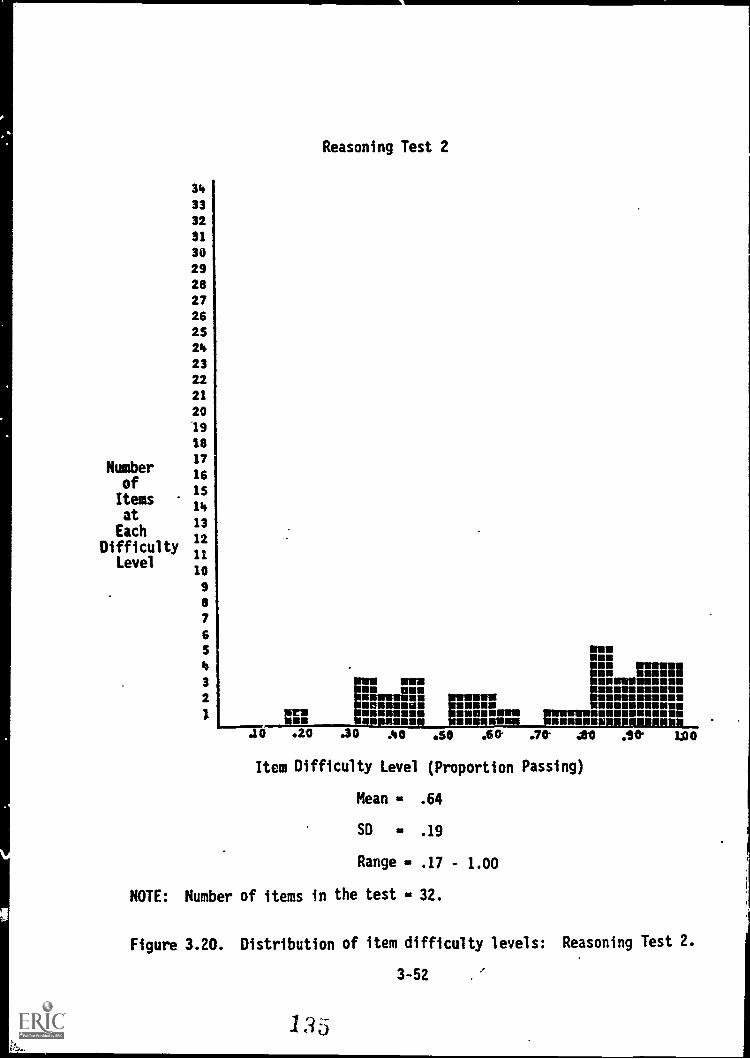
34
33
32
31
30
2928
2726
25
24
2322
21
20
1918
Number17
1of
16
Items15
14at
Each13
12Difficulty
Level10
98
7
6
5
3
2
1
Reasoning Test 2
MUVONMN MIMSMN
NMI MNIMMINIMMEMN MU IIIMMUUMEMUUM11111111111 II NUOMMEOMINIU MOW MUMOUMMIIIM11111 INM MUU MENUMM
MIME UM OM.10 .20 .30 AO .50 AO
Item Difficulty Level (Proportion Passing)
Mean = .64
SD = .19
Range = .17 - 1.00
NOTE: Number of items in the test = 32.
.1/0 ..99* 1.00
Figure 3.20. Distribution of item difficulty levels: Reasoning Test 2.
3-52
1 :45
Modifications for the Fort Knox Field Test. The only change made was
in the response format. Reasoning Test 2 contained 32 items with a 10-minute time limit for the Fort Knox field test.
3-53 130
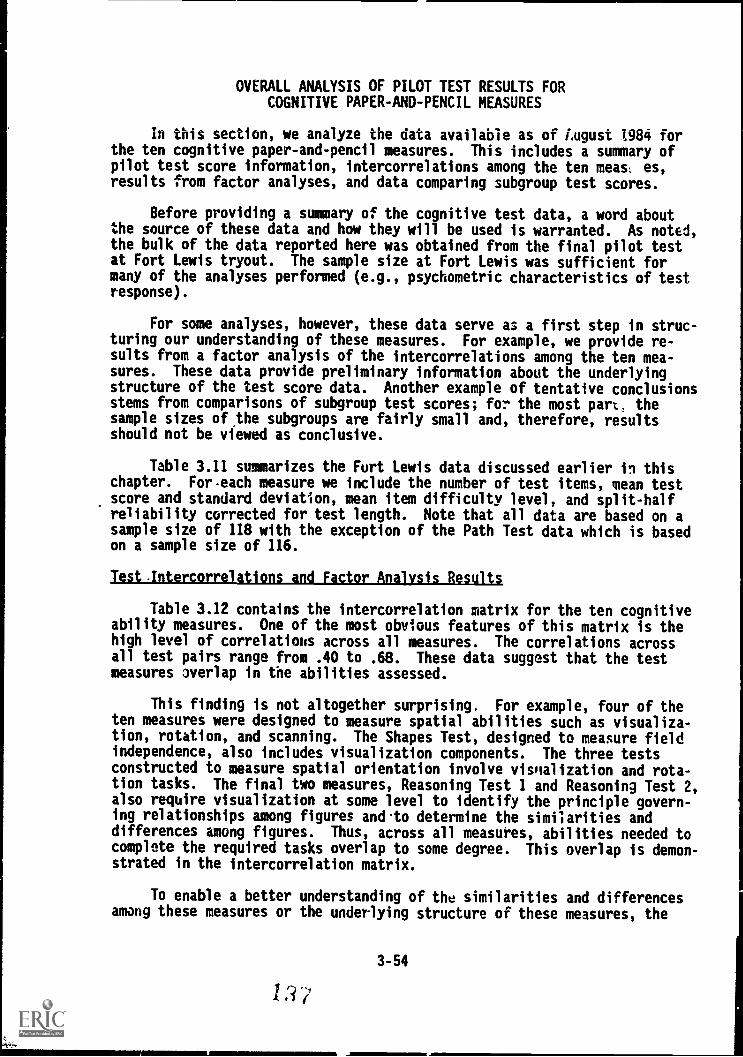
OVERALL ANALYSIS OF PILOT TEST RESULTS FORCOGNITIVE PAPER-AND-PENCIL MEASURES
In this section, we analyze the data available as of Lugust 1984 forthe ten cognitive paper-and-pencil measures. This includes a summary ofpilot test score information, intercorrelations among the ten meas: es,results from factor analyses, and data comparing subgroup test scores.
Before providing a summary of the cognitive test data, a word aboutthe source of these data and how they will be used is warranted. As noted,the bulk of the data reported here was obtained from the final pilot testat Fort Lewis tryout. The sample size at Fort Lewis was sufficient formany of the analyses performed (e.g., psychometric characteristics of testresponse).
For some analyses, however, these data serve as a first step in struc-turing our understanding of these measures. For example, we provide re-sults from a factor analysis of the intercorrelations among the ten mea-sures. These data provide preliminary information about the underlyingstructure of the test score data. Another example of tentative conclusionsstems from comparisons of subgroup test scores; for the most part. thesample sizes of the subgroups are fairly small and, therefore, resultsshould not be viewed as conclusive.
Table 3.11 summarizes the Fort Lewis data discussed earlier in thischapter. Foreach measure we include the number of test items, mean testscore and standard deviation, mean item difficulty level, and split-halfreliability corrected for test length. Note that all data are based on asample size of 118 with the exception of the Path Test data which is basedon a sample size of 116.
Test -Intercorrelations and Factor Analysis Results
Table 3.12 contains the intercorrelation matrix for the ten cognitiveability measures. One of the most obvious features of this matrix is thehigh level of correlations across all measures. The correlations acrossall test pairs range from .40 to .68. These data suggest that the testmeasures overlap in the abilities assessed.
This finding is not altogether surprising. For example, four of theten measures were designed to measure spatial abilities such as visualiza-tion, rotation, and scanning. The Shapes Test, designed to measure fieldindependence, also includes visualization components. The three testsconstructed to measure spatial orientation involve visolalization and rota-tion tasks. The final two measures, Reasoning Test 1 and Reasoning Test 2,also require visualization at some level to identify the principle govern-ing relationships among figures and-to determine the similarities anddifferences among figures. Thus, across all measures, abilities needed tocomplete the required tasks overlap to some degree. This overlap is demon-strated in the intercorrelation matrix.
To enable a better understanding of the similarities and differencesamong these measures or the underlying structure of these measures, the
3-54
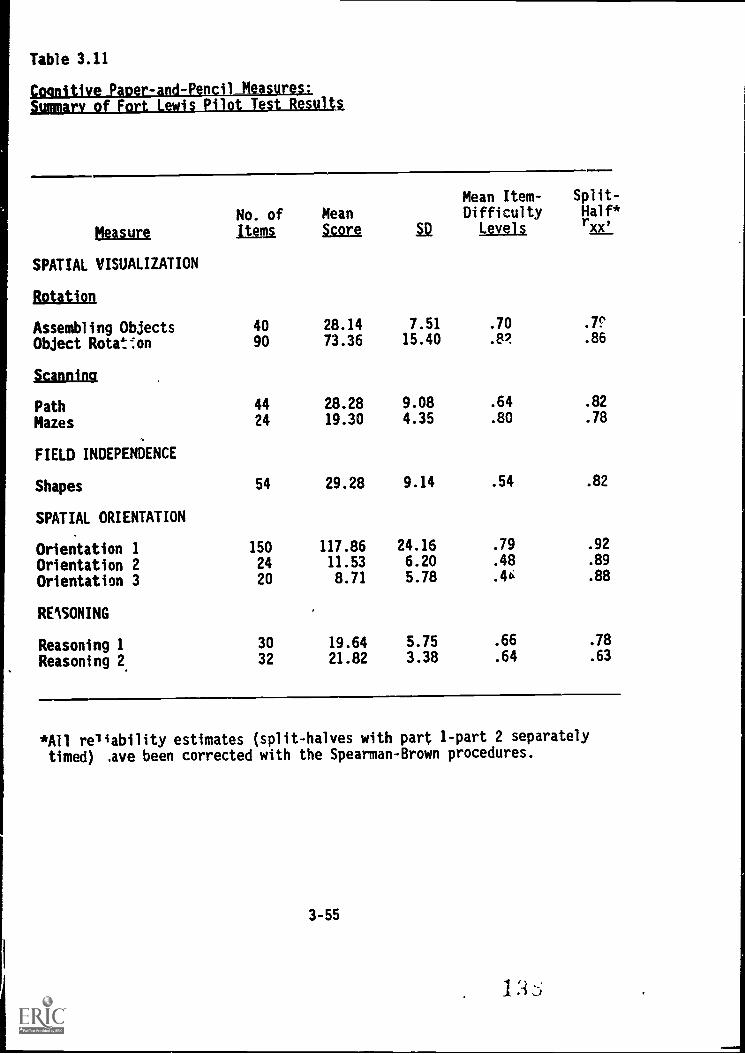
Table 3.11
Cognitive Paper-and-Pencil Measures:§ummary of Fort Lewis Pilot Test Results
Measure
No. ofItems
MeanScore 52
Mean Item-Difficulty
Levels
Split-Half*rxxi
SPATIAL VISUALIZATION
Rotation
Assembling Objects 40 28.14 7.51 .70 .7P
Object Rotat:on 90 73.36 15.40 .8? .86
Scanning
Path 44 28.28 9.08 .64 .82
Mazes 24 19.30 4.35 .80 .78
FIELD INDEPENDENCE
Shapes 54 29.28 9.14 .54 .82
SPATIAL ORIENTATION
Orientation 1 150 117.86 24.16 .79 .92
Orientation 2 24 11.53 6.20 .48 .89
Orientation 3 20 8.71 5.78 .4a .88
RE1SONING
Reasoning 1 30 19.64 5.75 .66 .78
Reasoning 2 32 21.82 3.38 .64 .63
*All reliability estimates (split-halves with part 1-part 2 separately
timed) .ave been corrected with the Spearman-Brown procedures.
3-55
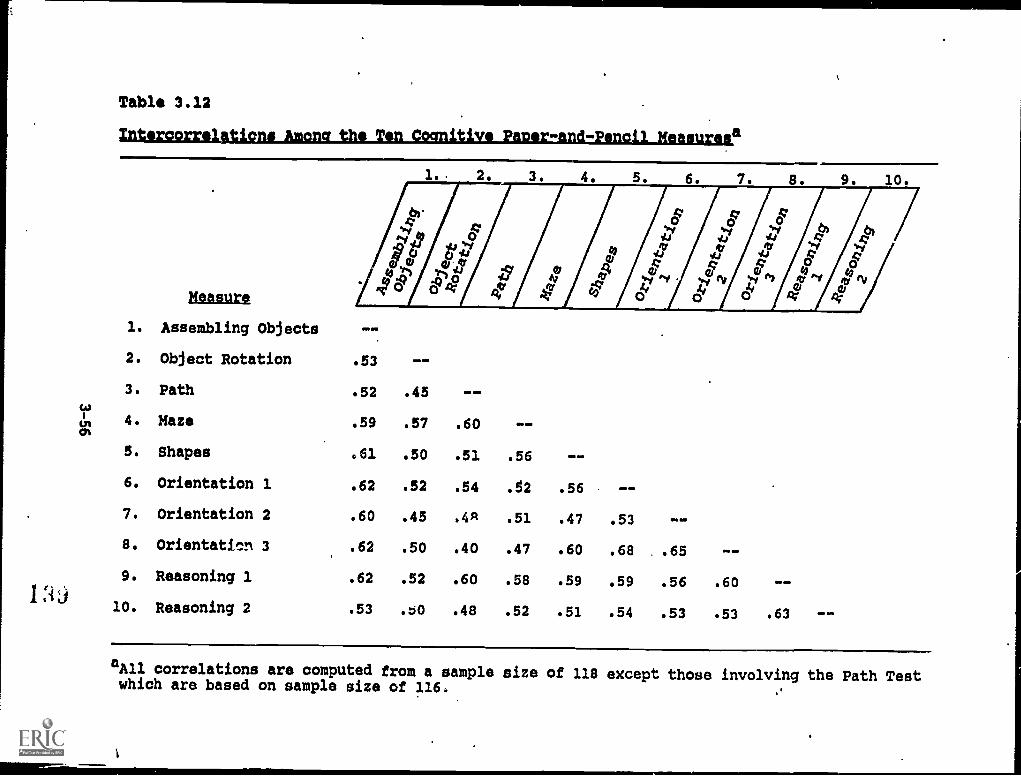
Table 3.12
of
Measure
f .f fit I v
1. Assembling Objects MI OM
2. Object Rotation .53 O.=
3. Path .52 .45 OM OM
4. Maze .59 .57 .60 --
5. Shapes .61 .50 .51 .56 --
6. Orientation 1 .62 .52 .54 .S2 .56 --
7. orientation 2 .60 .45 .4A .51 .47 .53 --
8. Orientation 3 .62 .50 .40 .47 .60 .68 ..65 OW AM
9. Reasoning 1 .62 .52 .60 .58 .59 .59 .56 .60 a/ 0111.
10. Reasoning 2 .53 .b0 .48 .52 .51 .54 .53 .53 .63 OM SOD
aAll correlations are computed from a sample size of 118 except those involving the Path Testwhich are based on sample size of 116:
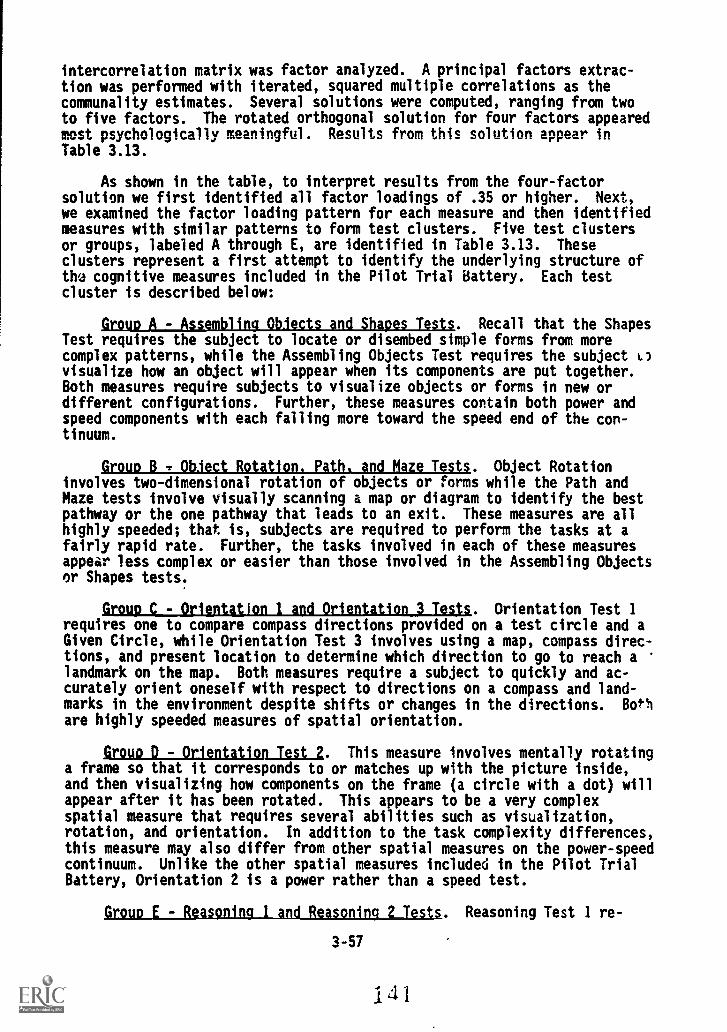
intercorrelation matrix was factor analyzed. A principal factors extrac-tion was performed with iterated, squared multiple correlations as thecommunality estimates. Several solutions were computed, ranging from twoto five factors. The rotated orthogonal solution for four factors appearedmost psychologically meaningful. Results from this solution appear inTable 3.13.
As shown in the table, to interpret results from the four-factorsolution we first identified all factor loadings of .35 or higher. Next,we examined the factor loading pattern for each measure and then identifiedmeasures with similar patterns to form test clusters. Five test clustersor groups, labeled A through E, are identified in Table 3.13. Theseclusters represent a first attempt to identify the underlying structure ofthe cognitive measures included in the Pilot Trial Battery. Each testcluster is described below:
Group A - Assembling (Weds and Shapes Tests. Recall that the ShapesTest requires the subject to locate or disembed simple forms from morecomplex patterns, while the Assembling Objects Test requires the subject L)visualize how an object will appear when its components are put together.Both measures require subjects to visualize objects or forms in new ordifferent configurations. Further, these measures contain both power andspeed components with each falling more toward the speed end of the con-tinuum.
Group B = ObJect Rotation. Path. and Maze Tests. Object Rotationinvolves two-dimensional rotation of objects or Forms while the Path andMaze tests involve visually scanning a map or diagram to identify the bestpathway or the one pathway that leads to an exit. These measures are allhighly speeded; that is, subjects are required to perform the tasks at afairly rapid rate. Further, the tasks involved in each of these measuresappear less complex or easier than those involved in the Assembling Objectsor Shapes tests.
Group C - Orientation 1 and Orientation 3 Tests. Orientation Test 1requires one to compare compass directions provided on a test circle and aGiven Circle, while Orientation Test 3 involves using a map, compass direc-tions, and present location to determine which direction to go to reach alandmark on the map. Both measures require a subject to quickly and ac-curately orient oneself with respect to directions on a compass and land-marks in the environment despite shifts or changes in the directions. Bothare highly speeded measures of spatial orientation.
imp D - Orientation Test 2. This measure involves mentally rotatinga frame so that it corresponds to or matches up with the picture inside,and then visualizing how components on the frame (a circle with a dot) willappear after it has been rotated. This appears to be a very complexspatial measure that requires several abilities such as visualization,rotation, and orientation. In addition to the task complexity differences,this measure may also differ from other spatial measures on the power-speedcontinuum. Unlike the other spatial measures included in the Pilot TrialBattery, Orientation 2 is a power rather than a speed test.
Group E - Reasoning 1 and Reasoning _2 Tests. Reasoning Test 1 re-
3-57
141
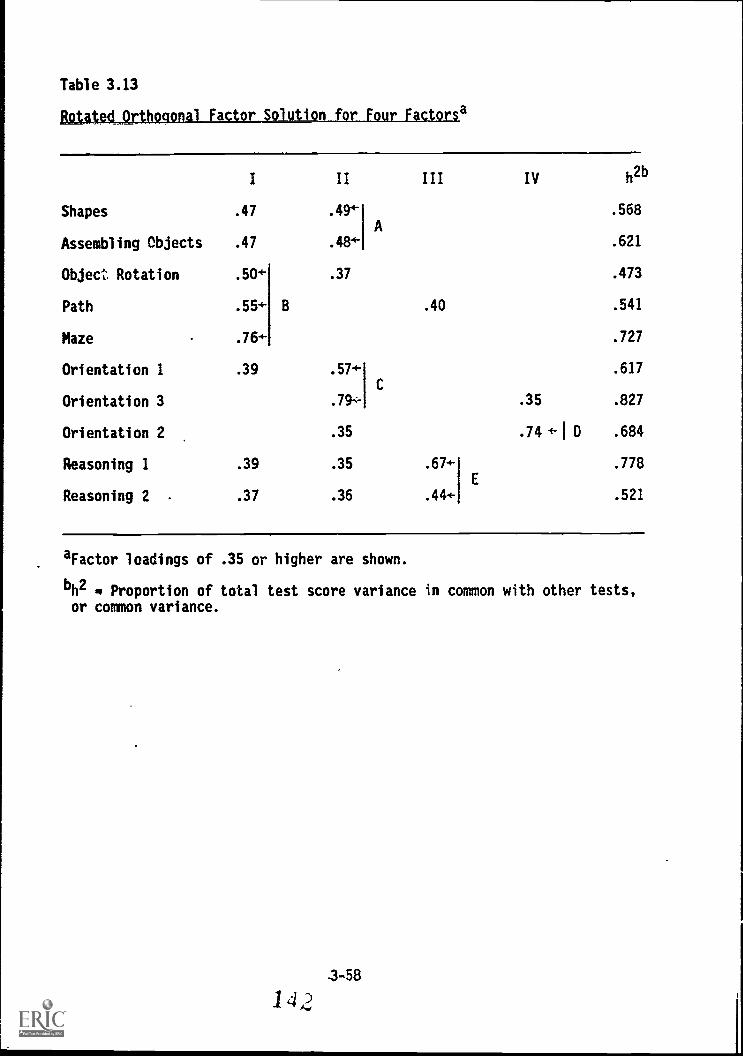
Table 3.13
Bot4tedArthoctonaliactor Solution for Four Factorsa
Shapes
Assembling Objects
I
.47
.47
II
.49]A
.48+
III IVh2b
.568
.621
Object Rotation .504- .37 .473
Path .554- B .40 .541
Maze .764- .727
Orientation 1 .39 .574- .617
C
Orientation 3 .79+ .35 .827
Orientation 2 .35 .74 D .684
Reasoning 1 .39 .35 .67+ .778
E
Reasoning 2 - .37 .36 .44+ .521
aFactor loadings of .35 or higher are shown.
bh2 Proportion of total test score variance in common with other tests,or common variance.
-3-58
142
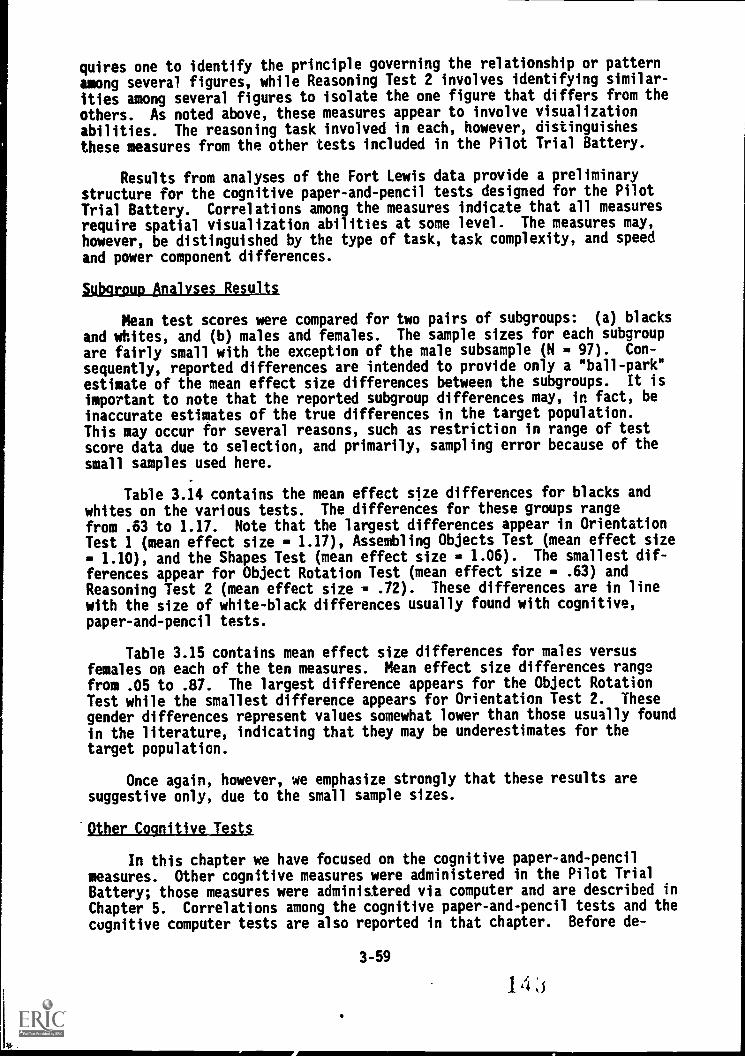
quires one to identify the principle governing the relationship or pattern
among several figures, while Reasoning Test 2 involves identifying similar-
ities among several figures to isolate the one figure that differs from the
others. As noted above, these measures appear to involve visualization
abilities. The reasoning task involved in each, however, distinguishesthese measures from the other tests included in the Pilot Trial Battery.
Results from analyses of the Fort Lewis data provide a preliminarystructure for the cognitive paper-and-pencil tests designed for the Pilot
Trial Battery. Correlations among the measures indicate that all measuresrequire spatial visualization abilities at some level. The measures may,
however, be distinguished by the type of task, task complexity, and speed
and power component differences.
Subgroup Analyses Results
Mean test scores were compared for two pairs of subgroups: (a) blacks
and whites, and (b) males and females. The sample sizes for each subgroup
are fairly small with the exception of the male subsample (N = 97). Con-
sequently, reported differences are intended to provide only a "ball-park"estimate of the mean effect size differences between the subgroups. It is
important to note that the reported subgroup differences may, in fact, beinaccurate estimates of the true differences in the target population.This may occur for several reasons, such as restriction in range of test
score data due to selection, and primarily, sampling error because of the
small samples used here.
Table 3.14 contains the mean effect size differences for blacks and
whites on the various tests. The differences for these groups range
from .63 to 1.17. Note that the largest differences appear in OrientationTest 1 (mean effect size - 1.17), Assembling Objects Test (mean effect size= 1.10), and the Shapes Test (mean effect size = 1.06). The smallest dif-ferences appear for Object Rotation Test (mean effect size - .63) andReasoning Test 2 (mean effect size = .72). These differences are in line
with the size of white-black differences usually found with cognitive,paper-and-pencil tests.
Table 3.15 contains mean effect size differences for males versusfemales on each of the ten measures. Mean effect size differences range
from .05 to .87. The largest difference appears for the Object RotationTest while the smallest difference appears for Orientation Test 2. Thesegender differences represent values somewhat lower than those usually foundin the literature, indicating that they may be underestimates for thetarget population.
Once again, however, we emphasize strongly that these results aresuggestive only, due to the small sample sizes.
'Other Cognitive Tests
In this chapter we have focused on the cognitive paper-and-pencil
measures. Other cognitive measures were administered in the Pilot TrialBattery; those measures were administered via computer and are described in
Chapter 5. Correlations among the cognitive paper-and-pencil tests and thecognitive computer tests are also reported in that chapter. Before de-
3-59
14s
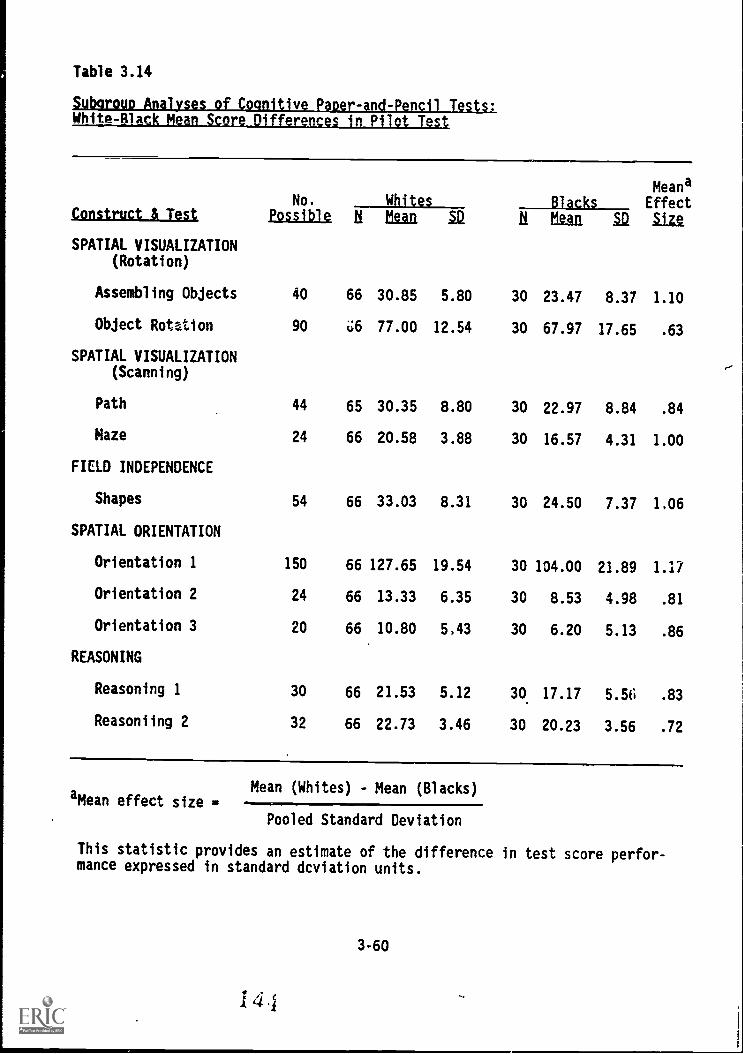
Table 3.14
5uborouo Analvses_of_Counitive Paper-and-Pencil TestsWhite-Black Mean Score Differences in Pilot Test
Construct & TestNo.
PossibleWhites Blacks
MeanaEffectSizeff bin Q If Ma
SPATIAL VISUALIZATION(Rotation)
Assembling Objects 40 66 30.85 5.80 30 23.47 8.37 1.10
Object Rotation 90 a 77.00 12.54 30 67.97 17.65 .63
SPATIAL VISUALIZATION(Scanning)
Path 44 65 30.35 8.80 30 22.97 8.84 .84
Naze 24 66 20.58 3.88 30 16.57 4.31 1.00
FIELD INDEPENDENCE
Shapes 54 66 33.03 8.31 30 24.50 7.37 1.06
SPATIAL ORIENTATION
Orientation 1 150 66 127.65 19.54 30 104.00 21.89 1.17
Orientation 2 24 66 13.33 6.35 30 8.53 4.98 .81
Orientation 3 20 66 10.80 5.43 30 6.20 5.13 .86
REASONING
Reasoning 1 30 66 21.53 5.12 30. 17.17 5.56 .83
Reasoniing 2 32 66 22.73 3.46 30 20.23 3.56 .72
Mean (Whites) - Mean (Blacks)aMean effect size -
Pooled Standard Deviation
This statistic provides an estimate of the difference in test score perfor-mance expressed in standard deviation units.
3-60
144
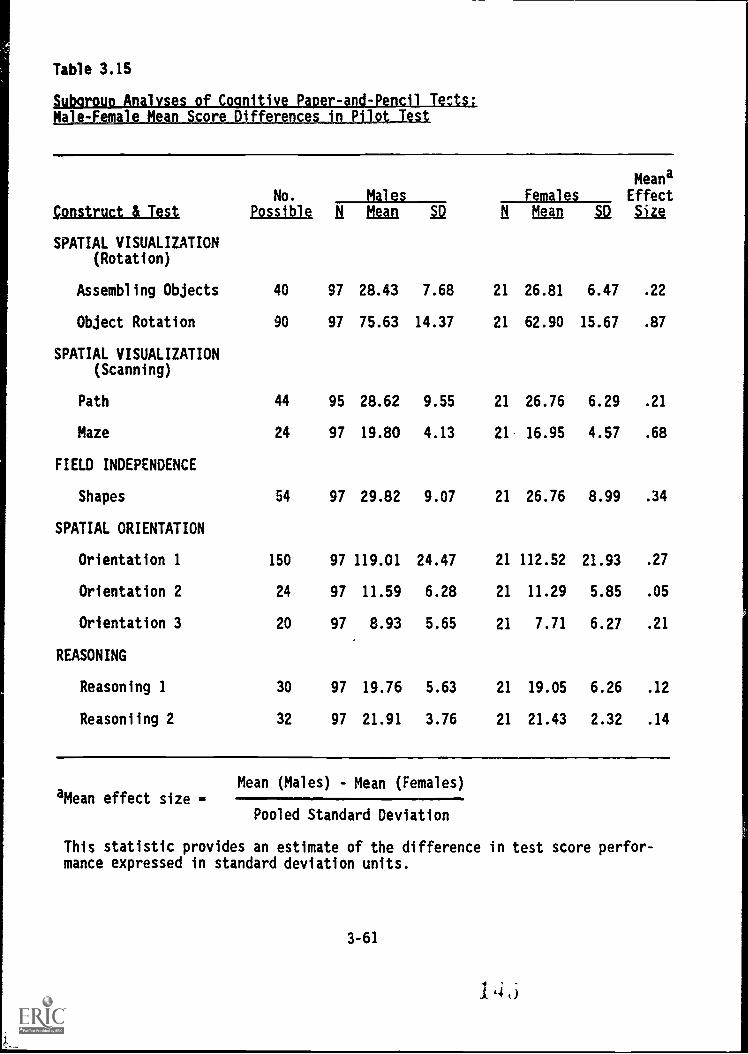
Table 3.15
Subgroup Analyses of Cognitive Paoer-and-Pencil Tects:Male&11110tinitatenSglalaidatst
construct & TestNo. Males Females
MeanaEffectSizePossible L{ Mean 12 N Mlan 512
SPATIAL VISUALIZATION(Rotation)
Assembling Objects 40 97 28.43 7.68 21 26.81 6.47 .22
Object Rotation 90 97 75.63 14.37 21 62.90 15.67 .87
SPATIAL VISUALIZATION(Scanning)
Path 44 95 28.62 9.55 21 26.76 6.29 .21
Maze 24 97 19.80 4.13 21 16.95 4.57 .68
FIELD INDEPENDENCE
Shapes 54 97 29.82 9.07 21 26.76 8.99 .34
SPATIAL ORIENTATION
Orientation 1 150 97 119.01 24.47 21 112.52 21.93 .27
Orientation 2 24 97 11.59 6.28 21 11.29 5.85 .05
Orientation 3 20 97 8.93 5.65 21 7.71 6.27 .21
REASONING
Reasoning 1 30 97 19.76 5.63 21 19.05 6.26 .12
Reasoniing 2 32 97 21.91 3.76 21 21.43 2.32 .14
Mean (Males) - Mean (Females)aMean effect size -
Pooled Standard Deviation
This statistic provides an estimate of the difference in test score perfor-mance expressed in standard deviation units.
3-61
14,j

scribing the computer-administered tests, we provide results from the fieldtest analyses of the paper-and-pencil cognitive measures in Chapter 4.
3-62
Chapter 3 References
Guilford, J. P., & Lacey, J. I. (Eds.) (1947). Printed classification
tests. Array Air Forces Aviation Psychology ;research Program Reports,
5, Washington, DC: Government Printing Office.
Hough, L. M., Dunnette, M. D., Wing, H., Houston, J. S., & Peterson, N. G.
(1984). Covariance analyses of cognitive and non-cognitive measures
of Army recruits: An initial sample of Preliminary Battery Data.Paper presented at the 92nd Annual Convention of the American
Psychological Association, Toronto, Canada. In Eaton, N. K. et al.
(Eds.) (1984), ARI Technical Report 660.
Wing, H., Peterson, N. G., & Hoffman, E. G. (1984). Expert judgments of
predictor-criterion validity relationships. Paper presented at the
92nd Annual Convention of the American Psychological Assocation,
Toronto, Canada. In Eaton, N. K. et al. (Eds.) (1984), ARI
Technical Report 660.
3-63
1 4 /
CHAPTER 4
COGNITIVE PAPER-AND-PENCIL MEASURES: FIELD TEST
Marvin D. Durnette, VyVy A. Corpe, and Jody L. Toquam
In this chapter we describe analyses of the field test of the cogni-tive paper-and-pencil tests in the Pilot Trial Battery, administered atFort Knox in September 1984. The procedures and sample for this field testwere described in Chapter 2. In this chapter we present descriptive sta-tistics for the tests, internal consistency and test-retest reliabilities,an analysis of gains in scores when the tests are taken a second time, andanalyses of the relationships between the ASVAB subtests and the PilotTrial Battery cognitive tests. Later chapters of this report will extendanalysis of the data from the field tests to cover the relationships of thecognitive paper-and-pencil measures with the other measures--computer-administered perceptual/psychomotor, and non-cognitive paper- and - pencil --which were also part of the Pilot Trial Battery. We note here that partsof this chapter are drawn from Toquam et al. (1985).
A concise description of each of the ten tests, along with a sampleitem or items from each test, is contained in Figure 4.1. Copies of thefull Pilot Trial Battery as administered at Fort Knox are contained inAppendix G.
4-1
14
ANALYSES OF DATA FROM FIELD TEST ADMINISTRATION
Mean Scores and Reliability Estimates
Table 4.1 shows the means, standard deviations, and three estimates ofthe reliabilities of the cognitive tests administered in the field test of
the Pilot Trial Battery. The means and standard deviations are similar tothe results obtained at the last pilot test at Fort Lewis (see Table 3.11),except for two tests. The mean score for Object Rotation is about 14points lower for the field test (59.62 vs. 73.36), but this was expectedand intended since we had decreased the time allowed on this test from 8minutes to 7.5 minutes--in order to avoid a possible ceiling effect. Ori-
entation Test 1 also showed a mean score decrease, from 117.86 to 88.65.No changes had been made in the test so it is not clear why this occurred.The decrease is not alarming, however, since the examinees still answeredabout .59 of the items correctly which is in the range of test difficultywe desired (about .50 to .70) for this set of tests.
Difficulty levels for the other tests are also in this .50 to .70range, except for Orientation 3. (The test difficulties are not shown inTable 4.1 but can be obtained by dividing the mean score by the totalnumber of items.) This test appears to be a bit more difficult thandesired (difficulty - .39), but this appears not to adversely affect thetest score variance (standard deviation - 5.68) or its reliability (splithalf reliability - .88 and test-retest reliability - .84).
Three estimates of reliability ,re shown in Table 4.1. The firstone, labeled split-half, is actually computed on the Fort Lewis pilot testdata, not on the Fort Knox field test data. Separately timed halves wereadministered at Fort Lewis, but time limitations did not allow this at Fort
Knox. We have included these estimates because they are more appropriatethan coefficient Alpha for those tests that are moderately or highly
speeded. All of the PTB cognitive tests are at least moderately speeded,except Orientation 2, Reasoning 1, and Reasoning 2.
Examination of these reliability estimates shows that all of the testsare acceptably reliable, with the possible exception of Reasoning 2. Theestimates of internal consistency (split half and coefficient Alpha)are .78 or higher, except for Reasoning 2 and the test-retest reliabilityestimates (two-week interval) are .64 or higher, except for this test.
Gain Score Analysis
The collection of retest data allowed us the opportunity to examinethe extent to which test score distributions might change when the testsare taken a second time. Generally speaking, prior exposure to a testleads to an increase in test scores, especially if the exposure is veryclose to the time the test is taken. In this case, the soldiers completedall the cognitive tests twice, with a two-week interval between administra-tions.
Our concern was that taking the test a second time might lead to alarge increase in scores. If so, this would need to he taken into accountif the tests were used in an operational setting. (Retest opportunitiescould be controlled or limited, or parallel forms could be developed.)
4-2
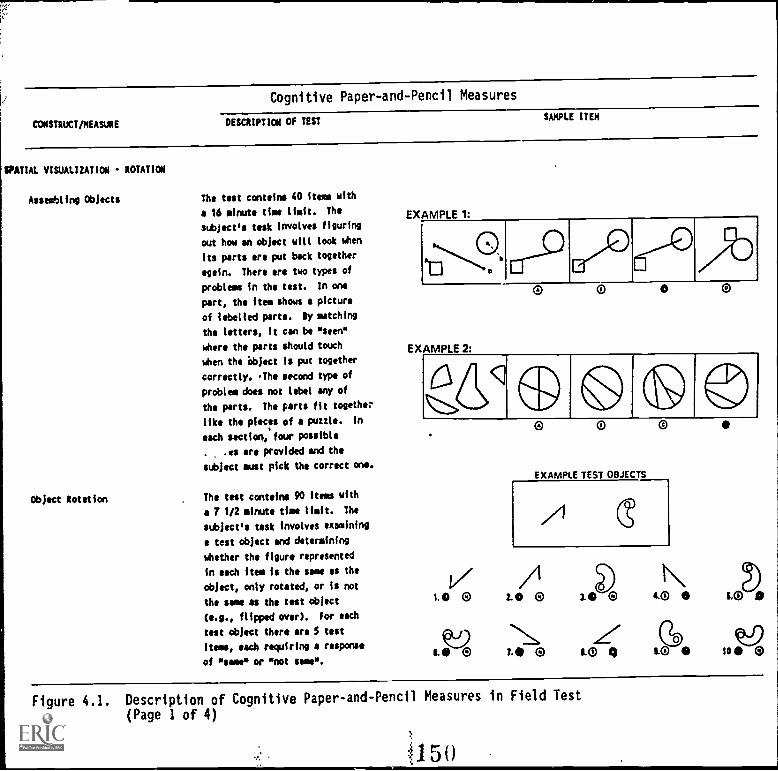
CONSTRUCT/MEASURE
Cognitive Paper-and-Pencil Measures
DESCRIPTION Of TESTSAMPLE !TEN
SPATIAL VISUALIZATION ROTATION
Assembling Objects
Object Rotation
The test contains 40 items with
s 16 minute time limit. The
subject's task involves figuring
out how an object will look when
its parts are put back together
again. There are two types of
problems in the test. In one
part, the item shows a picture
of labelled parts. Sy matching
the letters, it can be "seen"
where the parts should touch
when the object is put together
correctly. The second type of
problem does not label any of
the parts. The parts fit together
like the pieces of a puzzle. In
each section, four possible
. .es are provided and the
subject must pick the correct one.
The test contains 90 items with
a 7 1/2 minute time limit. The
subject's task involves examining
a test object and determining
whether the figure represented
in each item is the same as the
object, only rotated, or is not
the same as the test object
(e.g., flipped over). For each
test object there are S test
items, each requiring a response
of "same" or "not same".
EXAMPLE 1:
0
EXAMPLE 2:
0 0
oaa0 0
EXAMPLE TEST OBJECTS
0
///11.0 0 10 O 10 to 1.0
CZIO10 0 2.0 0 10 10 104)
Figure 4.1. Description of Cognitive Paper-and-Pencil Measures in Field Test
(Page 1 of 4)
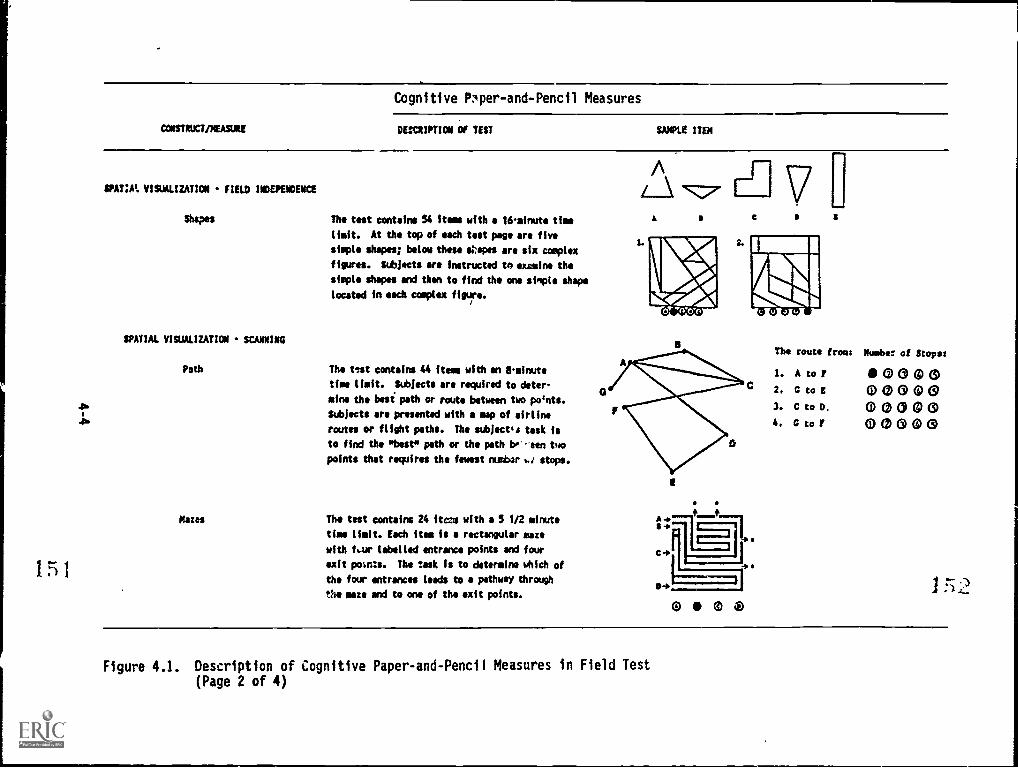
CONSTRUCT/MEASURE
Cognitive Pner-and-Pencil Measures
DESCRIPTION Of TEST SAMPLE ITEM
SPAT:AL VISUALIZATION FIELD INDEPENDENCE
SPATIAL VISUALIZATION SCANNING
Path
Mazes
The test contains 54 Items with a 16minute thee
limit. At the top of each test page are five
simple shapes; below these e:apes are six complex
figures. Subjects are Instructed to examine the
simple shapes and then to find the one simple shape
located in each complex figure.
The test contains 44 Items with an 3minute
time limit. Subjects are required to deter-
mine the best path or route between two points.
Subjects are presented with a map of airline
routes or flight paths. The subject's task is
to find the *best" path or the path be' -aen too
points that requires the fewest numbur r stops.
The test contains 24 items with a 5 1/2 minute
time limit. Each item Is a rectangular sue
with f.ur labelled entrance points and four
exit po$n:e. The task is to determine which of
the four entrances Weds to a pathway through
the maze and to one of the exit points.
$
tOIMMt
0 o 0
The route from Number of Stow
1. A to Y 0 (DO2. C toE 000403. C to D. (2) 0 Go ED4. C to 00040
Figure 4.1. Description of Cognitive Paper-and-Pencil Measures in Field Test(Page 2 of 4)
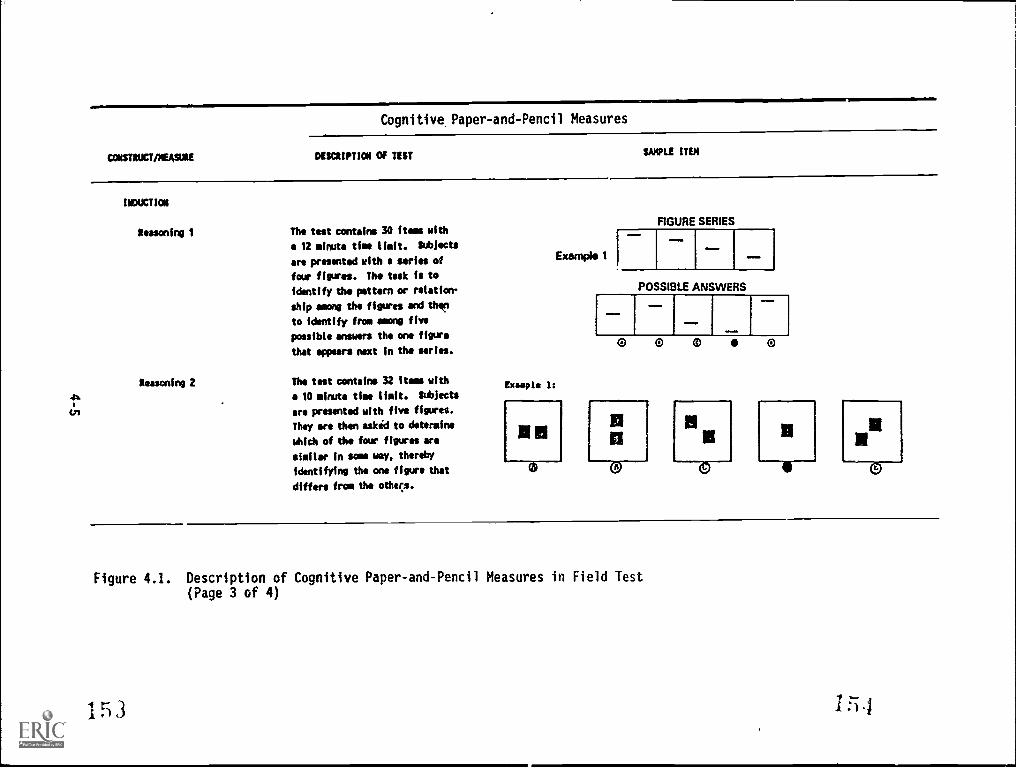
Cognitive. Paper-and-Pencil Measures
CONSTRUCT/NEASURE DESCRIPTION Of TEST SAMPLE ITEM
INDUCTION
Reasoning 1 The test contains 30 items with
12 minute time limit. &Objects
are presented with a series ofExam* 1
four figures. TM, task is to
FIGURE SERIES
INNEN@
VIEW&
Reasoning 2
identify the pattern or relation-
ship among the figures and then
to identify from Among five
possible answers the one figure
that appears next in the series.
The test contains 32 Items with
a 10 minute time limit. Subjects
are presented with five figures.
They are then asked to determine
which of tits four figures are
similar in use way, thereby
identifying the one figure that
differs from the others.
POSSIBLE ANSWERS
0
El
0 0 0
a a
Figure 4.1. Description of Cognitive Paper-and-Pencil Measures in Field Test
(Page 3 of 4)
I5 1 :4 4
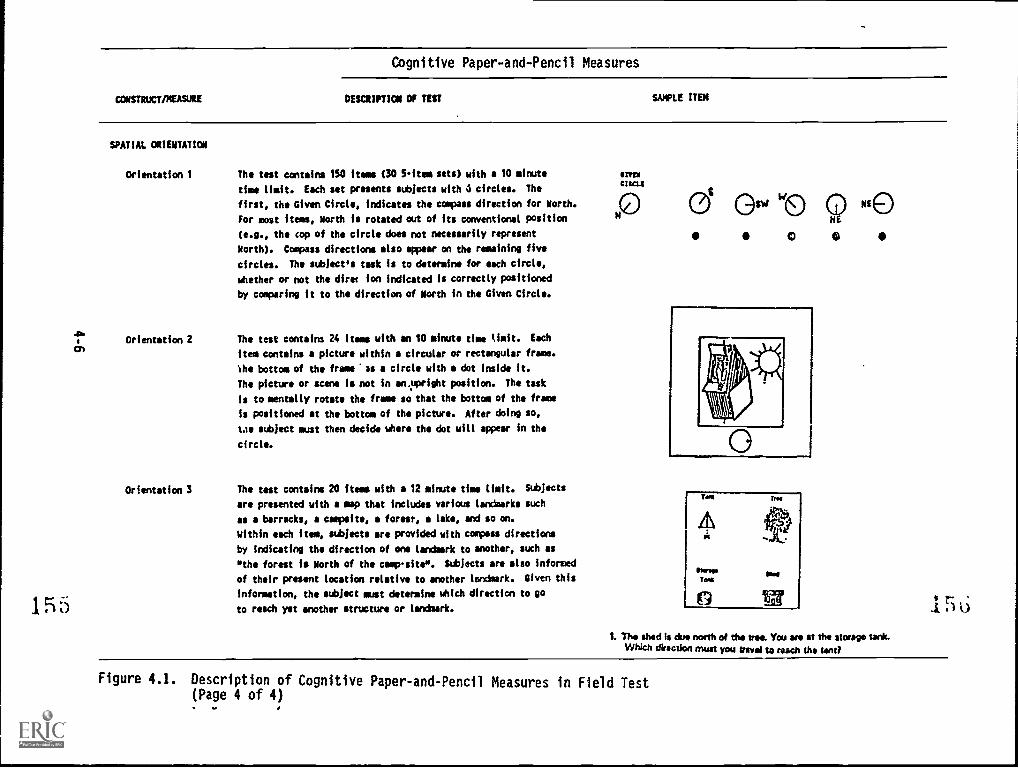
CONSTRIXT/MEASLIRE
Cognitive Paper-and-Pencil Measures
OESCRIPTICM Of TEST SAMPLE ITEM
SPATIAL ORIENTATION
Orientation 1
Orientation 2
Orientation 3
The test contains 150 items (30 S-item sets) with a 10 minute
time limit. Each set presents subjects with 6 circles. The
first, the Given Circle, indicates the compass direction for Worth.
For most items, North is rotated out of its conventional position
(e.g., the cop of the circle does not necessarily represent
North). Compass directions also appear on the remaining five
circles. The subject*, task is to determine for each circle,
whether or not the direr ion indicated is correctly positioned
by comparing it to the direction of North in the Given Circle.
The test contains 24 items with an 10 minute time (Wt. Each
item contains a picture within a circular or rectangular frame.
the bottom of the frame'ss a circle with a dot inside it.
The picture or scene is not in an.upright position. The task
is to mentally rotate the frame so that the bottom of the frame
is positioned at the bottom of the picture. After doing so,
tae subject must then decide where the dot will appear in the
circle.
The test contains 20 items with a 12 minute time limit. Subjects
are presented with a map that includes various landmarks such
as a barracks, a campsite, a forest, a lake, and so on.
Within each item, subjects are provided with compass directions
by indicating the direction of one landmark to another, such as
*the forest Is North of the camp-site*. Subjects are also informed
of their present location relative to another landmark. Given this
information, the subject must determine which direction to go
to reach yet another structure or landmark.
almc's=
Gsw we 0 NteHE
0
1. The shed Is due north of the tree. You are at the storage tank.
Which direction must you Mei to reach the tent?
Figure 4.1. Description of Cognitive Paper-and-Pencil Measures in Field Test(Page 4 of 4)
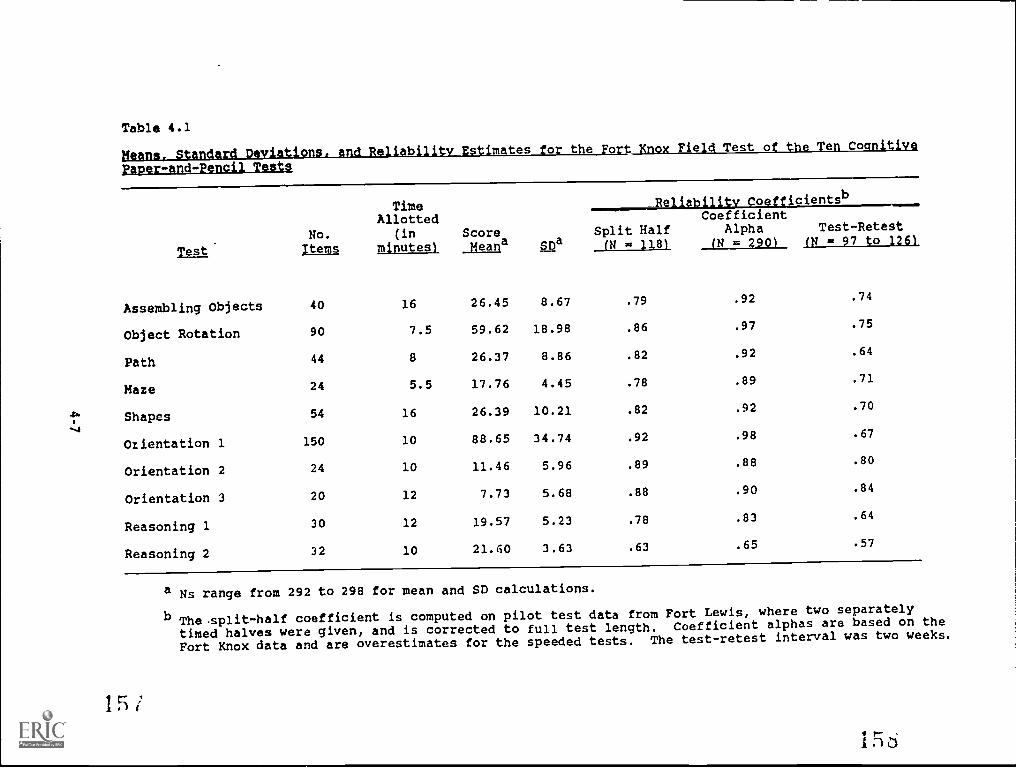
Table 4.1
Means. Standard Deviations and Reliability Estimates for thejort Knox Field Test of the Ten Cognitive
Paper-and-Pencil Tests
Time __Reliability Coefficientsb--kCoefficientAllotted
No. (in Score Split Half Alpha Test-Retest
Test. items, )minutes) Meana SDa (N u 118) (N = 290) (N = 97 to 126)
Assembling Objects 40 16 26.45 8.67 .79 .92 .74
Object Rotation 90 7.5 59.62 18.98 .86 .97 .75
Path 44 8 26.37 8.86 .82 .92 .64
Maze 24 5.5 17.76 4.45 .78 .89 .71
1" Shapes 54 16 26.39 10.21 .82 .92 .70
+.4
Orientation 1 150 10 88.65 34.74 .92 .98 .67
Orientation 2 24 10 11.46 5.96 .89 .88 .80
Orientation 3 20 12 7.73 5.68 .88 .90 .84
Reasoning 1 30 12 19.57 5.23 .78 .83 .64
Reasoning 2 32 10 21.60 3.63 .63 .65 .57
15
a Ns range from 292 to 298 for mean and SD calculations.
b The split -half coefficient is computed on pilot test data from Fort Lewis, where two separately
timed halves were given, and is corrected to full test length. Coefficient alphas are based on the
Fort Knox data and are overestimates for the speeded tests. The test-retest interval was two weeks.
11 3
Table 4.2 shows the gain scores for persons in the retest sample.Four of these tests showed gain scores that appeared to be higher than wethought desirable: Shapes, Orientation 1, Path, and Object Rotation. Inorder to estimate the seriousness of this concern we located gain scoresfor a number of other cognitive tests that measured similar constructs. Wefound that gain scores of similar magnitude occurred on those tests as well(e.g., on General Aptitude Test Battery tests of spatial aptitude and formperception, gain scores ranged from .46 to .62, U.S. Department of Labor,1970) ). Although this finding did not solve the concern with these rela-tively large, undesirable gain scores, it did indicate that gain scores ofthis magnitude are not uncommon for tests of this type.
Inspection of the last two columns in Table 4.2 indicated that much ofthe gain probably occurred because the soldiers attempted more items thesecond time they took the test. This is certainly to be expected since theretested soldiers would be more familiar with item types and instructions.
The gain score analysis showed that persons could, on the average,increase their scores on several of the PTB cognitive tests to a degreethat seems to be cause for some concern in an operational setting. How-ever, a brief review of the literature showed that gain scores of themagnitude we found were also found for commonly used, published tests ofthe same type. This indicates that our evaluation of the need for concernmay be unduly high.
Covariance with ASVAB Subtests
One of the primary goals, and criteria for evaluation of our success,was the development of new predictor measures that would complement theASVAB rather than measure the same things (see Chapter 1 for a discussionof the overall strategy of predictor development). In order to evaluateour progress toward that goa:, we analyzed the covariance of the PilotTrial Battery with the ASVAB. In this section we report the correlationsbetween these measures and a statistic, called uniqueness, that indicatesthe amount of overlap between one test and a set of other tests.
We take up the correlations first. If we had achieved our goal ofcomplementing the ASVAB, then the PTB cognitive tests should correlate lowto moderately with the ASVAB subtests.
Table 4.3 contains the intercorrelations for the ASVAB subtests andthe cognitive paper-and-pencil measures. Note that we have also includedscores on the Armed Forces Qualification Test (AFQT). These correlationsare based on the Fort Knox field test sample, but include only thosesubjects with test scores available on all variables (N 168).
In examining these relationships, IT first looked at the correlationsbetween tests within the same battery. Correlations between ASVAB subtestscores range from .02 to .74 (absolute values). The range of intercorrela-tions is a bit more restricted when examining the relationships between thecognitive paper-and-pencil test scores (.27 to .67). This range of valuesreflects the fact that the Pilot Trial Battery measures were designed totap fairly similar cognitive constructs.
4-8
15.1
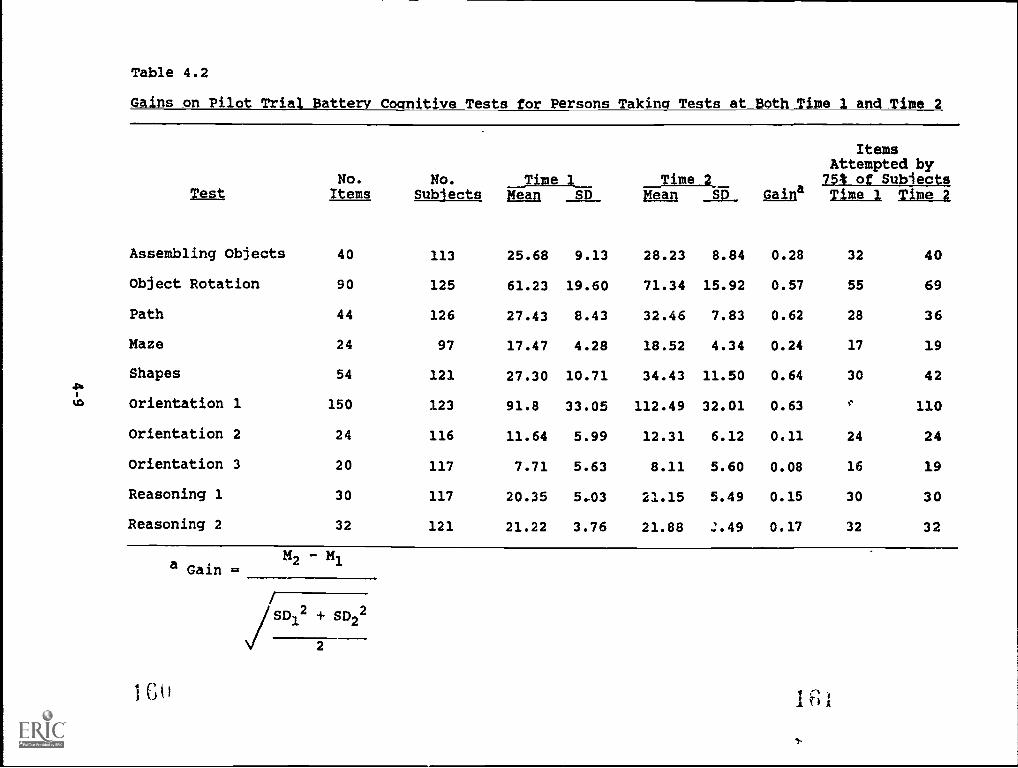
Table 4.2
Gains o Pilot Tr a Battery C11 ye Tests o erso s Taki.n T s at
TestNo.Items
No.Sub ects
Time 1 __TIMI2._Mean SD Gaina
ItemsAttempted by75% of Subiects
Mean SD Time 1 Time 2
Assembling Objects 40 113 25.68 9.13 28.23 8.84 0.28 32 40
Object Rotation 90 125 61.23 19.60 71.34 15.92 0.57 55 69
Path 44 126 27.43 8.43 32.46 7.83 0.62 28 36
Maze 24 97 17.47 4.28 18.52 4.34 0.24 17 19
.pShapes 54 121 27.30 10.71 34.43 11.50 0.64 30 42
to Orientation 1 150 123 91.8 33.05 112.49 32.01 0.63 110
Orientation 2 24 116 11.64 5.99 12.31 6.12 0.11 24 24
Orientation 3 20 117 7.71 5.63 8.11 5.60 0.08 16 19
Reasoning 1 30 117 20.35 5.03 21.15 5.49 0.15 30 30
Reasoning 2 32 121 21.22 3.76 21.88 .:.49 0.17 32 32
a Gain
Go
M2
2SD1 + SD2 2
2
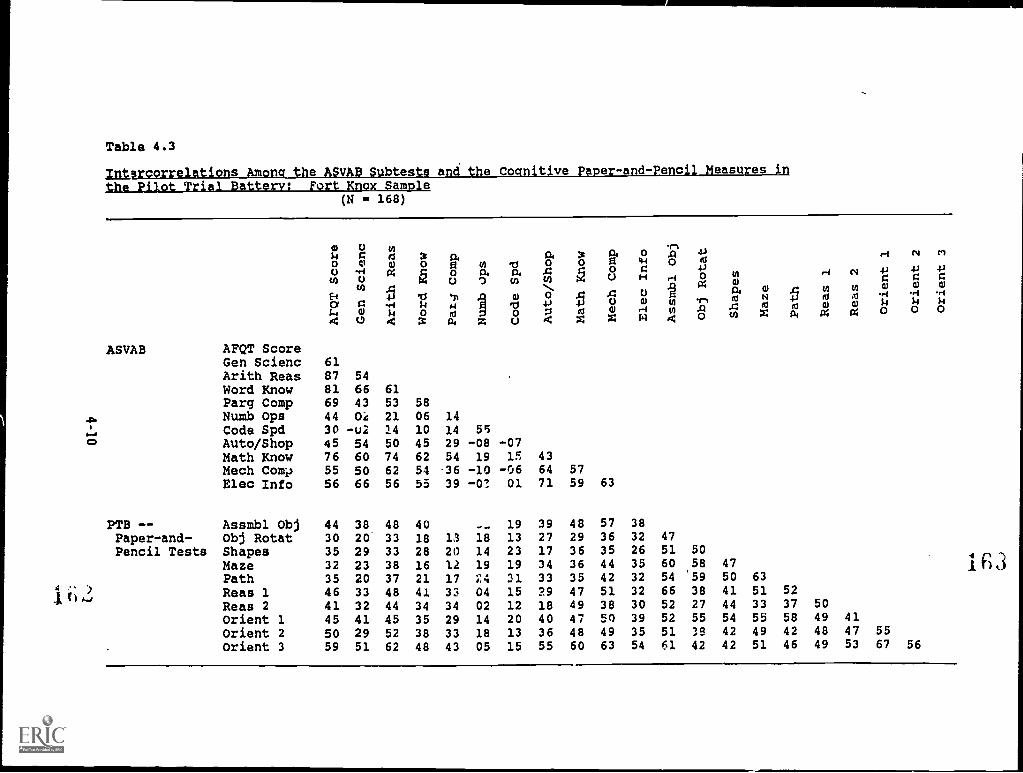
Table 4.3
Intarcorrelations Among the ASVAB Subtests and the Cognitive Paper-and-Pencil Measures inthe Pilot Trial Battery: Fort Knox Sample
(N g. 168)
O inO 0 3 ia,CI a) 0 fi in ml
-ri a O 0. 0.O 0 ,) in
U)
OMI1.4
IIm
.9 WMI
0)Pi1.4 0 0 9 o
O 4 3 al z o
O
T1.si0P
7i
og
mw
/-1 N
12) A in in0 i4 4-) 0 10
NA1-1
0 A 4 0 0 w w4 0 ta Z a, c4 C4
ASVAB AFQT ScoreGen Scienc 61Arith Reas 87 54Word Know 81 66 61Parg Comp 69 43 53 58Numb Ops 44 Oa 21 06 14
Code Spd 30 -u2 14 10 14 55Auto/Shop 45 54 50 45 29 -08 -07Math Know 76 60 74 62 54 19 15 43Meech Comp 55 50 62 54 -36 -10 -06 64 57
Elec Info 56 66 56 55 39 -01 01 71 59 63
PTB Assmbl Obj 44 38 48 40 19 39 48 57 38
Paper-and- Obj Rotat 30 20' 33 18 13 18 13 27 29 36 32 47
Pencil Tests Shapes 35 29 33 28 20 14 23 17 36 35 26 51 50
Maze 32 23 38 16 12 19 19 34 36 44 35 60 58 47
Path 35 20 37 21 17 24 31 33 35 42 32 54 59 50 63
Reas 1 46 33 48 41 33 04 15 29 47 51 32 66 38 41 51 52
Reas 2 41 32 44 34 34 02 12 18 49 38 30 52 27 44 33 37 50
Orient 1 45 41 45 35 29 14 20 40 47 50 39 52 55 54 55 58 49 41
Orient 2 50 29 52 38 33 18 13 36 48 49 35 51 19 42 49 42 48 47 55
Orient 3 59 51 62 48 43 05 15 55 60 63 54 61 42 42 51 46 49 53 67 56
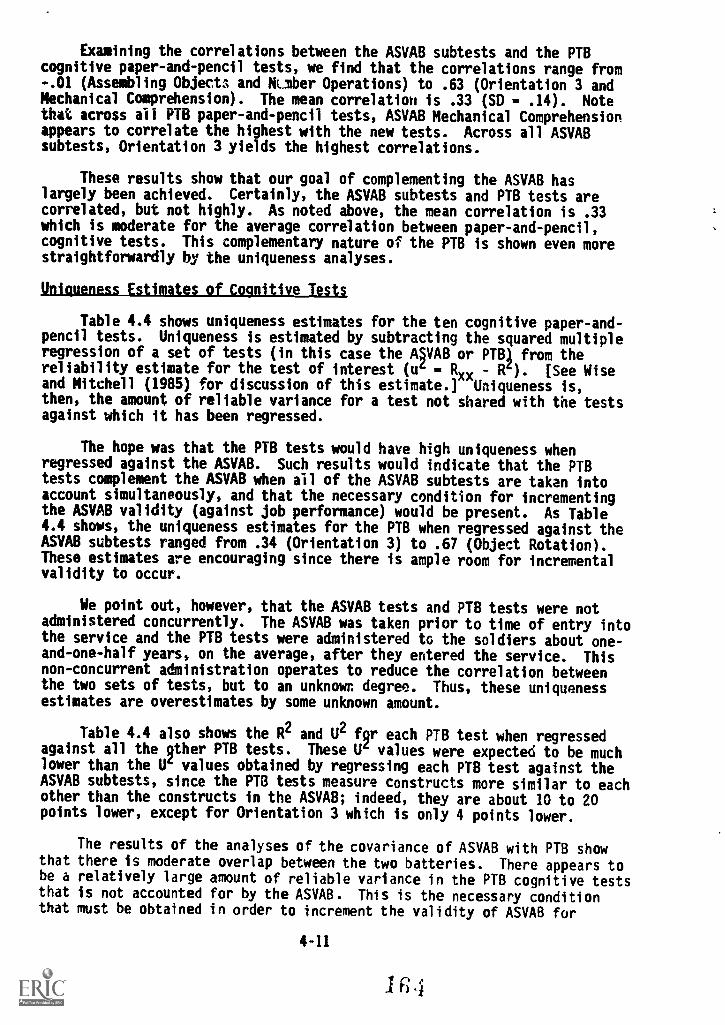
Examining the correlations between the ASVAB subtests and the PTBcognitive paper-and-pencil tests, we find that the correlations range from-.01 (Assembling Objects and NLmber Operations) to .63 (Orientation 3 andMechanical Comprehension). The mean correlation is .33 (SO - .14). Notethat across all PTB paper-and-pencil tests, ASVAB Mechanical Comprehensionappears to correlate the highest with the new tests. Across all ASVABsubtests, Orientation 3 yields the highest correlations.
These results show that our goal of complementing the ASVAB haslargely been achieved. Certainly, the ASVAB subtests and PTB tests arecorrelated, but not highly. As noted above, the mean correlation is .33which is moderate for the average correlation between paper-and-pencil,cognitive tests. This complementary nature of the PTB is shown even morestraightforwardly by the uniqueness analyses.
Uniqueness Estimates of Cognitive Tests
Table 4.4 shows uniqueness estimates for the ten cognitive paper-and-pencil tests. Uniqueness is estimated by subtracting the squared multipleregression of a set of tests (in this case the ASVAB or PTB from thereliability estimate for the test of interest (u
Rxx R 4 ). [See Wiseand Mitchell (1985) for discussion of this estimate.] Uniqueness is,then, the amount of reliable variance for a test not shared with the testsagainst which it has been regressed.
The hope was that the PTB tests would have high uniqueness whenregressed against the ASVAB. Such results would indicate that the PTBtests complement the ASVAB when ail of the ASVAB subtests are taken intoaccount simultaneously, and that the necessary condition for incrementingthe ASVAB validity (against job performance) would be present. As Table4.4 shows, the uniqueness estimates for the PTB when regressed against theASVAB subtests ranged from .34 (Orientation 3) to .67 (Object Rotation).These estimates are encouraging since there is ample room for incrementalvalidity to occur.
We point out, however, that the ASVAB tests and PTB tests were notadministered concurrently. The ASVAB was taken prior to time of entry intothe service and the PTB tests were administered to the soldiers about one-and-one-half years, on the average, after they entered the service. Thisnon-concurrent administration operates to reduce the correlation betweenthe two sets of tests, but to an unknown degree. Thus, these uniquenessestimates are overestimates by some unknown amount.
Table 4.4 also shows the R2 and U2 fqr each PTB test when regressedagainst all the qther PTB tests. These U values were expected to be muchlower than the U4 values obtained by regressing each PTB test against theASVAB subtests, since the PTB tests measure constructs more similar to eachother than the constructs in the ASVAB; indeed, they are about 10 to 20points lower, except for Orientation 3 which is only 4 points lower.
The results of the analyses of the covariance of ASVAB with PTB showthat there is moderate overlap between the two batteries. There appears tobe a relatively large amount of reliable variance in the PTB cognitive teststhat is not accounted for by the ASVAB. This is the necessary conditionthat must be obtained in order to increment the validity of ASVAB for
4-11
1E4
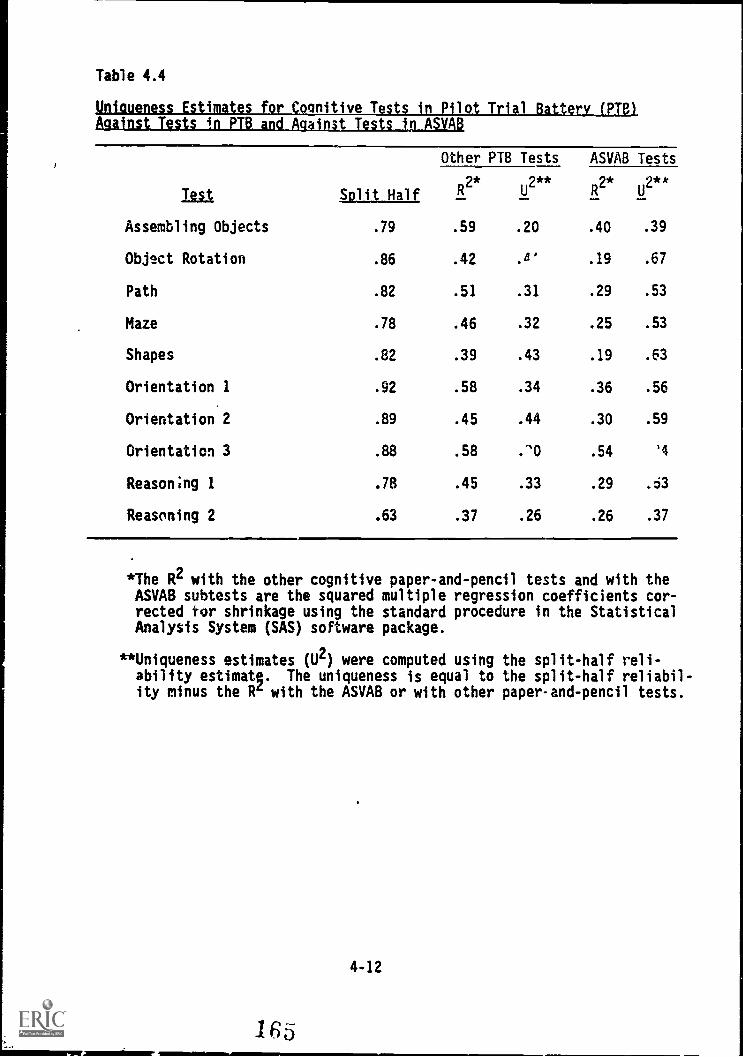
Table 4.4
' '1* s_f onitive T i of
AgiiRILIRIDLARIakiltgIRAd-sSM
Test Split Half
Other PTB Tests ASVAB Tests
R2* U2** R2*
U2**
Assembling Objects .79 .59 .20 .40 .39
Object Rotation .86 .42 .6' .19 .67
Path .82 .51 .31 .29 .53
Maze .78 .46 .32 .25 .53
Shapes .82 .39 .43 .19 .63
Orientation 1 .92 .58 .34 .36 .56
Orientation 2 .89 .45 .44 .30 .59
Orientation 3 .88 .58 ."0 .54 '4
Reasoning 1 .78 .45 .33 .29 .63
Reasoning 2 .63 .37 .26 .26 .37
*The R2 with the other cognitive paper-and-pencil tests and with theASVAB subtests are the squared multiple regression coefficients cor-rected for shrinkage using the standard procedure in the StatisticalAnalysis System (SAS) software package.
**Uniqueness estimates (U2) were computed using the split-half reli-ability estimate. The uniqueness is equal to the split-half reliabil-ity minus the R with the ASVAB or with other paper-and-pencil tests.
4-12
165
job ,lerformance.
Summary of Analyses
The field test analyses showed that the PTEI cognitive tests were, forthe most part, in excellent shape. The tests ha I adequate to excellentscore distributions and reliabilities, with one test having ma-ginal reli-ability (Reasoning 2). Four of the ten tests appeared to be susceptible tolarge increases in test scores when they are taken a second time, butapparently no more so than commonly used published tests. Finally, the PTBcognitive tests do appear to complement the ASVAB, and possess enoughreliable score variance that is uncorrelated with ASVAB to allow the possi-bility of substantial incremental validity for job performance.
As we noted in the opening of this chapter, the relationships of thePTB cognitive, paper-and-pencil tests to other parts of the Pilot Trialbattery are covered in later chapters of this report.
4-13
f1ki
CHAPTER 5
PERCEPTUAL/PSYCHOMOTOR COMPUTER-ADMINISTERED MEASURES:PILOT TESTING
Rodney L. Rosso, Norman G. Peterson, Jeffrey J. McHenry,Jody L. Toquam, Janis S. Houston, and Teresa L. Russell
GENERA'.
In Chapter 1 (see Computer Battery Development), we provided a de-scription of the early development of the computer-administered measures.We focused on site visits to military laboratories to investigate otherefforts to develop computer-administered tests, choice of appropriate hard-ware, acquisition of appropriate hardware, choice of appropriate computerlanguages, and a strategy for melding the efforts of programming the com-puter with the input of staff scientists responsible for developing thevarious tests.
In that chapter we briefly described early tryouts of the computer-administered measures at the Minneapolis Military Entranre Processing Sta-tion and at the Fort Carson pilot test. We add here that these earlytryouts focused primarily on (1) making sure the computer programming wasworking correctly, (2) the general reactions of soldiers to a computer-administered battery, especially the test instruction!. and (3) the generaleffectiveness of commercially available equipment (key,oards and "computergame" joysticks) for acquiring examinee responses. Actual analysis of thetest responses themselves was secondary during that phase of the research,however, we learned much that shaped the way the tests were programmed, theinstructions and items that were presented, and the way responses wereacquired. Most notably, we decided it was necessary to develop a custom-made response pedestal to acquire responses.
This chapter, thrn, focuses on the tests that were developed forcomputer administration and the constructs they were designed to measure.We developed tests to measure three cognitive ability constructs: ReactionTime (or Processing Efficiency), Perceptual Speed and Accuracy, and Memory,as well as three psychomotor constructs: Precision/Steadiness, MultilimbCoordination, and Movement Judgment. All but two tuts were developed intime for the Fort Lewis pilot test. These two tests were included in thefield test at Fort Knox (they were Number Memory and Cannon Shoot, intendedas measures of the Memory and Movement Judgment constructs, respectively).
We turn now to the discussion of the development of the tests and theresults of the pilot test at Fort Lewis. (Chapter 6 presents the analysisof the Fort Knox field test data).
Test Develop en
our discussion of constructs, we first provide the definition andrationale for including each. Following this, the source or model used todevelop each test 1? described, along with changes or modifications madeprior to the Fort Lewis pilot test, if any. Results from the Fort Lewis
5-1

pilot test are then described in detail. For example, we describe parame-ters used to develop test items and results from analyses of parameterdata. Further, test characteristics, such as time reqtitred to read in-structions and to complete the test, and test score information are pro-vided along with recommended scoring procedures. For each test, we alsohighlight correlations with other computer measures and with cognitivepaper-and-pencil measures. Finally, modifications or test revisions madeon the basis of Fort Lewis pilot data are described.
We conclude this chapter by summarizing computer test results obtainedfrom the Fort Lewis pilot test.
Before describing the tests designed to measure target constructs, webriefly describe a critical piece of equipment designed especially forpilot administrations of the computerized tests in the Pilot Trial Battery.
Oeveloomen of Reponse Pedestal
The microprocessor selected for use, the COMPAQ, contains a standardkeyboard. As reported in Chapter 1 and mentioned above, in early tryoutsof the computer battery subjects were asked to make their responses on thiskeyboard. From these preliminary administrations, we determined that thekeyboard may provide an unfair advantage to subjects with typing or dataentry experience. Furthermore, use of a standard keyboard did not provideadequate experimental control during the testing process. Therefore, aseparate response pedestal was designed and built.
This response pedestal is depicted in Figure 5.1. The pedestal isapproximately 21 inches from side to side and 10 inches from front to back.Note that it contains two joy sticks (one for left-handed subjects and onefor right-handed subjects), "HORIZONTAL" and "VERTICAL" controls, a dialfor entering demographic data such as age and social security number, twored buttons, three response buttons--blue, yellow, and white--and fourgreen "home" buttons. (One of the "home" buttons is not visible in thediagram; it is located on the left side of the pedestal.) The "SELECTOR"control was not used by the examinee to make responses, but was necessaryto properly connect the appropriate controls to the computer for each test.
The "homey buttons play a key role in capturing subjects' reactiontime scores. They control the onset of each test item or trial whenreaction time is being measured. To begin a trial, the subject must placehis/her hands on the four green buttons. After the stimulus appears on thescreen and the subject has determined the correct response, he/she mustremove his/her preferred hand from the "home" buttons and press the correctresponse button.
The procedure involving the "home" buttons serves two purposes.First, control is added over the locatioh of the subjects' hands while thestimulus item is presented. In this way, hand movement distance is thesame for all subjects and variation in reaction time aue to position ofsubjects' hands is reduced to nearly zero.
Second, procedures involving these buttons are designed to assess twotheoretically important components of reaction time measures--decision timeand movement time. Decision time includes the period between stimulus
5-2
1Id
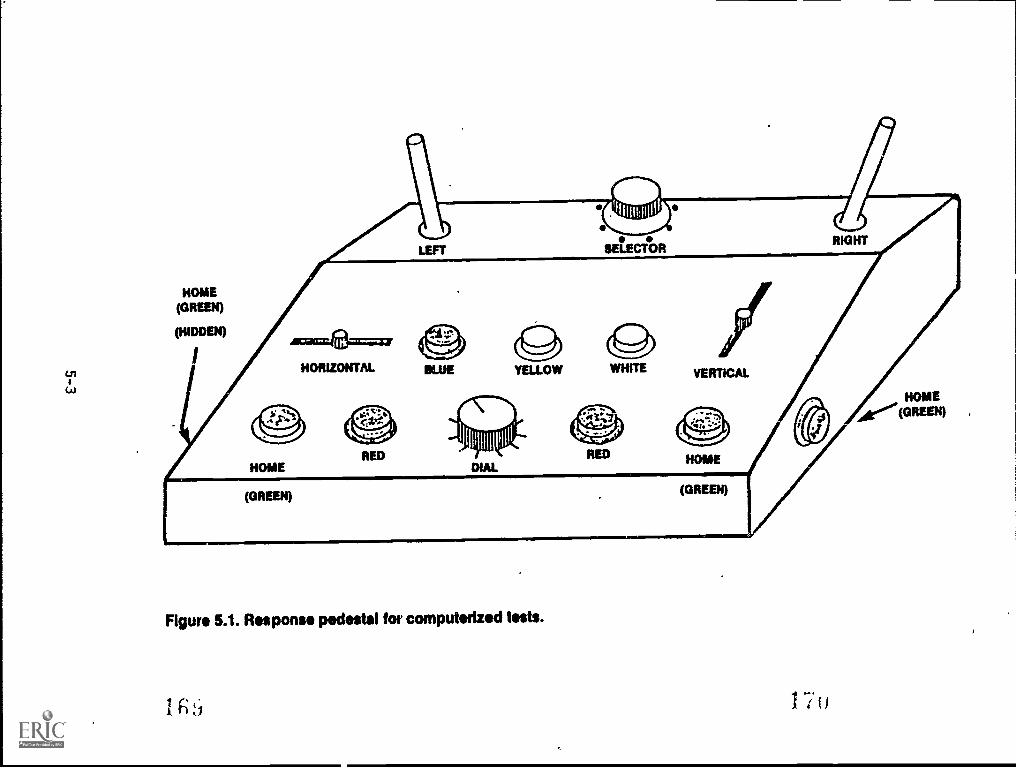
HOME(GREEN)
(HIDDEN)
(GREEN)(GREEN)
Figure 5.1. Response pedestal for computerized tests.
1 7 u
onset and the point at which the subject removes his/her hands to make aresponse. This interval reflects the time required to process the informa-tion to determine the correct response. Movement time involves the periodbetween removing one's hands from the "home" buttons and striking a re-sponse key. The "home" buttons on the response pedestal, then, are de-signed to investigate the two theoretically independent components of reac-tion time. Results from an investigation of these measures appear through-out the following sections.
For each test described, we provide a schematic diagram depicting theimportant components of each test. A key to these schematic diagrams isprovided in Figure 5.2. As noted on the key, the diagram is used toidentify test components such as delay periods, operations such as dec)siontime or movement time, and responses recorded such as correct or incorrectresponse, reaction time, or distance measures. These diagrams are designedto provide a more graphic picture of the activities involved in each test.
5-4
17.1
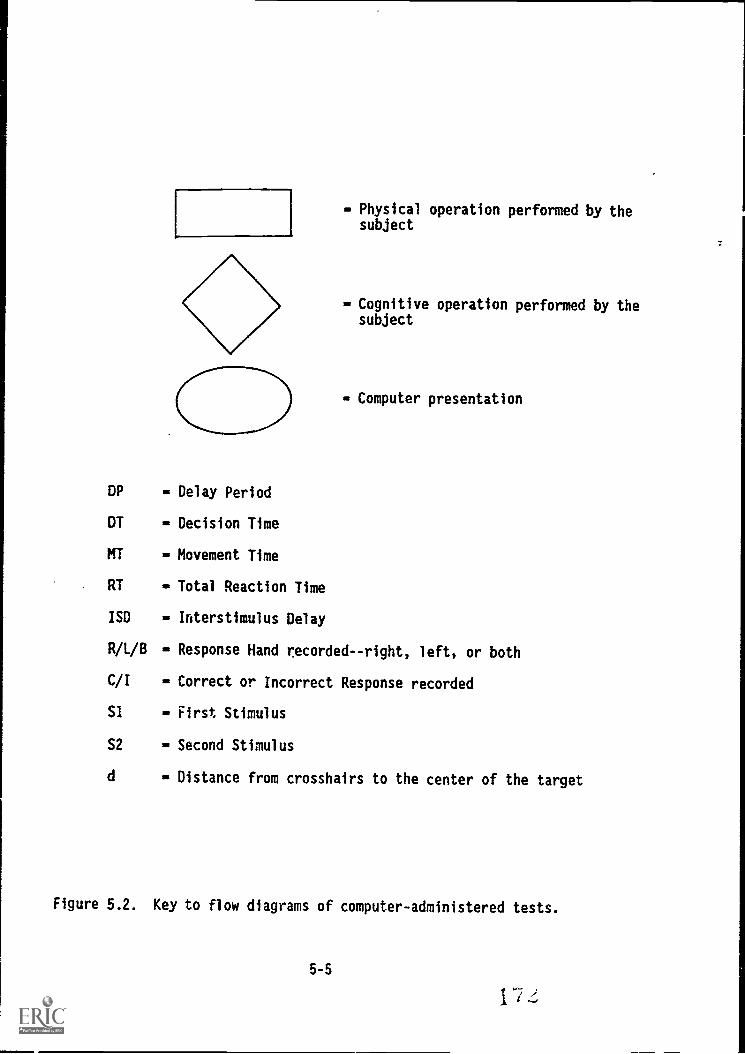
OPhysical operation performed by thesubject
Cognitive operation performed by thesubject
- Computer presentation
DP - Delay Period
DT = Decision Time
MT - Movement Time
RT ut Total Reaction Time
ISO Interstimulus Delay
R/L/B - Response Hand recorded--right, left, or both
C/I - Correct or Incorrect Response recorded
SI = First Stimulus
S2 - Second Stimulus
d - Distance from crosshairs to the center of the target
Figure 5.2. Key to flow diagrams of computer-administered tests.
5-5
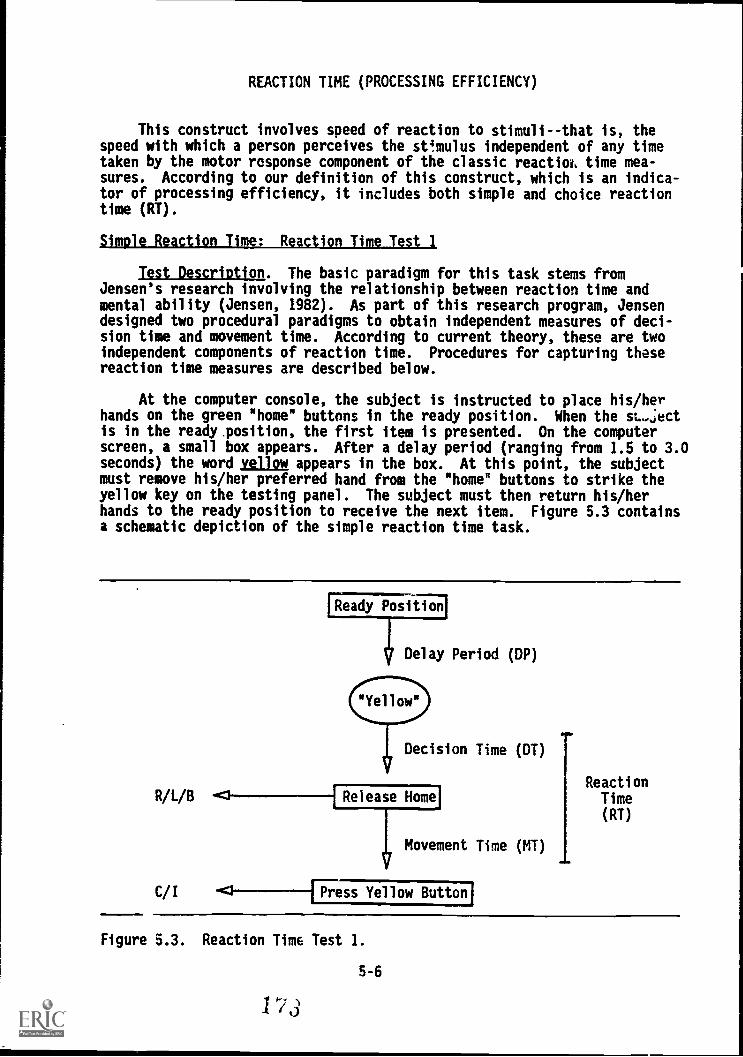
REACTION TIME (PROCESSING EFFICIENCY)
This construct involves speed of reaction to stimuli--that is, thespeed with which a person perceives the st!mulus independent of any timetaken by the motor response component of the classic reactioh time mea-sures. According to our definition of this construct, which is an indica-tor of processing efficiency, it includes both simple and choice reactiontime (RT).
Simple Reaction Time_: Reaction Time Test 1
Test Description. The basic paradigm for this task stems fromJensen's research involving the relationship between reaction time andmental ability (Jensen, 1982). As part of this research program, Jensendesigned two procedural paradigms to obtain independent measures of deci-sion time and movement time. According to current theory, these are twoindependent components of reaction time. Procedures for capturing thesereaction time measures are described below.
At the computer console, the subject is instructed to place his/herhands on the green "home" buttons in the ready position. When the si...jectis in the ready. position, the first item is presented. On the computerscreen, a small box appears. After a delay period (ranging from 1.5 to 3.0seconds) the word yellow appears in the box. At this point, the subjectmust remove his/her preferred hand from the "home' buttons to strike theyellow key on the testing panel. The subject must then return his/herhands to the ready position to receive the next item. Figure 5.3 containsa schematic depiction of the simple reaction time task.
Ready Position
ill Delay Period (DP)
1-Decision Time (DT)
R/L/B -<1 I Release Home]
Movement Time (MT)
C/I -0 ---ricess Yellow Button'
ReactionTime(RT)
Figure 5.3. Reaction Time Test 1.
5-6
173
This test contains 15 items. Although it is self-paced, on each itemsubjects are given 10 seconds to respond before the computer time -outs andprepares to present the next item.
Test Characteristics. Table 5.1 contains data on the test character-istics from the Fort Lewis pilot test. Variables appearing in the upperportion of the table provide descriptive information about test perfor-mance Note that, on the average, subjects read the test instructions in2.5 minutes, although this ranged from about half a minute to 5 minutes.Further, subjects completed the test in an average of 1.2 minutes; thistime ranged from three-quarters of a minute to over 5 minutes. Total testtime ranged from 1.6 to 7.1 minutes with a mean of 3.7 minutes.
Also note that very few subjects timed-out or provided invalid re-sponses. The maximum number of time-outs for any subject was three, themaximum number of invalid responses was one. Finally, Percent Correctvalues indicate nearly all subjects understood the task and performed itcorrectly.
Dependent Measures2. To klentlfy variables of interest, we reviewedthe literature in this area. (See Keyes, A review of the relationshipbetween reaction time and mental ability, 1985.) Results from this reviewindicated that reaction time is often calculated for decision time, move-ment time, and total time. See Figure 5.3 for points at which thesemeasures are obtained. In addition, intra-individual variation measures(the standard deviation of total reaction time scores) calculated for eachsubject appear to provide useful information. We began isolating dependentmeasures of interest by calculating these four variables.
When we examined reaction times for each item on this test, we dis-covered that these times were very high for the first few items (up to thefifth item). Observation of the subjects when they were taking the testhad alerted us to this possibility. Since this was the first test adminis-tered, the subjects were still somewhat unfamiliar with the response pedes-tal and the general nature of taking computer-administered tests. Accord-ingly, we decided to view the first five items as warm-up or practice itemsand to include only the last ten responses in calculating mean reactionscores.
Further, because subtle events (e.g., subject stretching or effec-tively guessing when the next item will appear) may produce extreme reac-tion time scores for a single item, we decided to use trimmed mean scoresfor decision, movement, and total time. These trimmed scores includeresponses to items six through 15 with the highest and lowest reaction timevalues removed.
1 Time-outs occur if a subject fails to respond within a specified periodof time. Invalid responses occur when a subject strikes the wrong key. In
both cases, the item disappears from the computer screen and, after thesubject resumes the ready position, the next item appears on the screen.
2 Dependent variables mean scores (e.g., Decision Time) on the tests.Throughout this chapter the terms "dependent variable" and "test score"can be viewed as interchangeable.
5-7
17
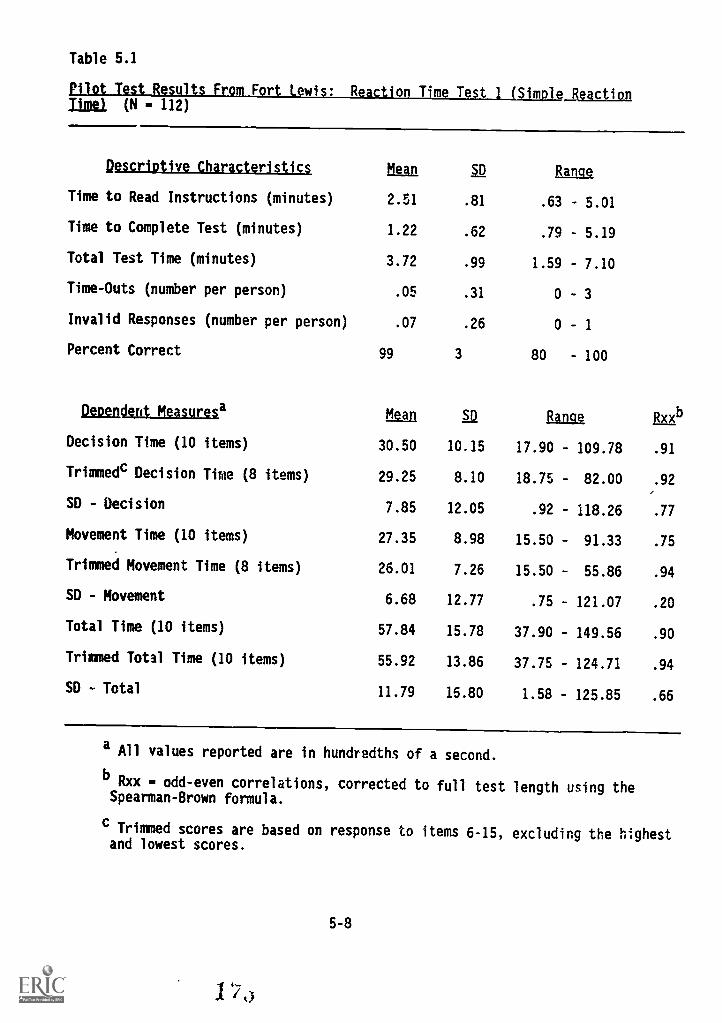
Table 5.1
Blot Test Results From Fort Lewis: Reaction Time Test 1 (Simple ReactionTime) (N - 112)
Descriptive Characteristics Mean 2 Range
Time to Read Instructions (minutes) 2.51 .81 .63 - 5.01
Time to Complete Test (minutes) 1.22 .62 .79 - 5.19
Total Test Time (minutes) 3.72 .99 1.59 - 7.10
Time-Outs (number per person) .05 .31 0 - 3
Invalid Responses (number per person) .07 .26 0 - 1
Percent Correct 99 3 80 - 100
Dependent Measuresa Mean SD Range Rxxb
Decision Time (10 items) 30.50 10.15 17.90 - 109.78 .91
Trimmedc Decision Time (8 items) 29.25 8.10 18.75 - 82.00 .92
SD - Decision 7.85 12.05 .92 118.26 .77
Movement Time (10 items) 27.35 8.98 15.50 - 91.33 .75
Trimmed Movement Time (8 items) 26.01 7.26 15.50 - 55.86 .94
SD - Movement 6.68 12.77 .75 - 121.07 .20
Total Time (10 items) 57.84 15.78 37.90 - 149.56 .90
Trimmed Total Time (10 items) 55.92 13.86 37.75 - 124.71 .94
SD - Total 11.79 15.80 1.58 - 125.85 .66
a All values reported are in hundredths of a second.
b Rxx = odd-even correlations, corrected to full testSpearman-Brown formula.
c Trimmed scores are based on response to items 6-15,and lowest scores.
5-8
length using the
excluding the highest
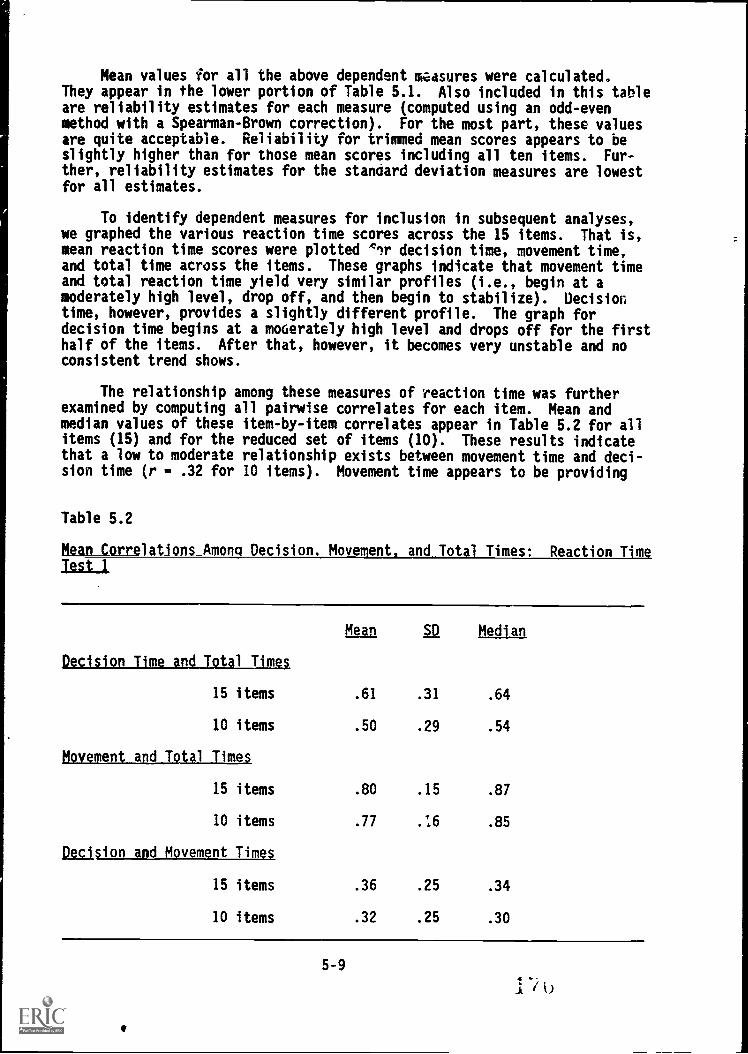
Mean values for all the above dependent masures were calculated.They appear in the lower portion of Table 5.1. Also included in this tableare reliability estimates for each measure (computed using an odd-evenmethod with a Spearman-Brown correction). For the most part, these valuesare quite acceptable. Reliability for trimmed mean scores appears to beslightly higher than for those mean scores including all ten items. Fur-ther, reliability estimates for the standard deviation measures are lowestfor all estimates.
To identify dependent measures for inclusion in subsequent analyses,we graphed the various reaction time scores across the 15 items. That is,mean reaction time scores were plotted '1r decision time, movement time,and total time across the items. These graphs indicate that movement timeand total reaction time yield very similar profiles (i.e., begin at amoderately high level, drop off, and then begin to stabilize). Decisiontime, however, provides a slightly different profile. The graph fordecision time begins at a moderately high level and drops off for the firsthalf of the items. After that, however, it becomes very unstable and noconsistent trend shows.
The relationship among these measures of reaction time was furtherexamined by computing all pairwise correlates for each item. Mean andmedian values of these item-by-item correlates appear in Table 5.2 for allitems (15) and for the reduced set of items (10). These results indicatethat a low to moderate relationship exists between movement time and deci-sion time (r .32 for 10 items). Movement time appears to be providing
Table 5.2
Mean Correlations Among Decisions Movement. and Total Times: Reaction TimeTest 1
Decision Time and TotaLTimes
Mean 52 Median
15 items .61 .31 .64
10 items .50 .29 .54
Movement and Total Times
15 items .80 .15 .87
10 items .77 .16 .85
Decision and Movement Times
15 items .36 .25 .34
10 items .32 .25 .30
5-9
kinds of information similar to total time (r = .77 for 10 items). Deci-sion time, however, provides additional information (r - .50 for 10items).
On the basis of these data, we made the following decisions:
Subjects' scores to be analyzed should include decision time, totalrime, and total within-person variation score (an individual'sstandard deviation computed with the total score).
For reaction time measures, the trimming procedure would be used incomputing decision and total mean reaction times.
Percent Correct scores' would be computed. Although no subjectswere being omitted because of incorrect or invalid responses, thiscould become necessary for future samples.
Practice effects (repeating the same measure several times in asingle session) should be examined, along with test-retest effects.This was planned for the Fort Knox field test.
Correlations With Other Measures. Correlations of simple reactiontimes with measures derived from all computer-administered tests (which aredescribed in the sections that follow) are provided in Table 5.3.
Note that correlations among Simple Reaction Time measures (PercentCorrect omitted from this analysis) indicate that the three correlate veryhighly with one another (Decision with Total = .85; Total SD with Total= .67; and Decision with Total SD - .71). Decision and Total times forsimple reaction time correlate moderately with their Choice Reaction Timecounterparts (range .36 to .57) which are described in the next section.
.Correlations of Simple Reaction Time measures with computer testdependent measures from constructs other than processing efficiency, indi-cate that for Decision Time the highest correlations appear with PerceptualSpeed and Accuracy (PS & A) Intercept (.30), Grand Mean (.29), and MemoryIntercept (.30). Total time also correlates highest with PS & A Intercept(.45). Total Standard Deviation correlates highest with Memory Intercept(.29). These correlations are about as expected since the correlatedscores are all reaction times to intercepts based on reaction times forperceptual kinds of tests. (Memory involves a perceptual component eventhough it is primarily a measure of the Memory construct.)
Correlations of the various computer-administered measures with thecognitive paper-and-pencil measures described in Chapters 3 3rd 4 are shownin Table 5.4. These correlations indicate that Decision TILA, Total Stan-dard Deviation, and Percent Correct are virtually unrelated to scores onthe paper-and-pencil measures. Total reaction time, however, correlateshighest with the Maze (-.39), Path (-.23), and Orientation 1 (-.23) Tests.These negative correlations indicate that "better" (faster) total reactiontime scores are associated with better (higher) paper-and-pencil testscores.
Finally, scores on these measures were correlated with video experi-
5-10
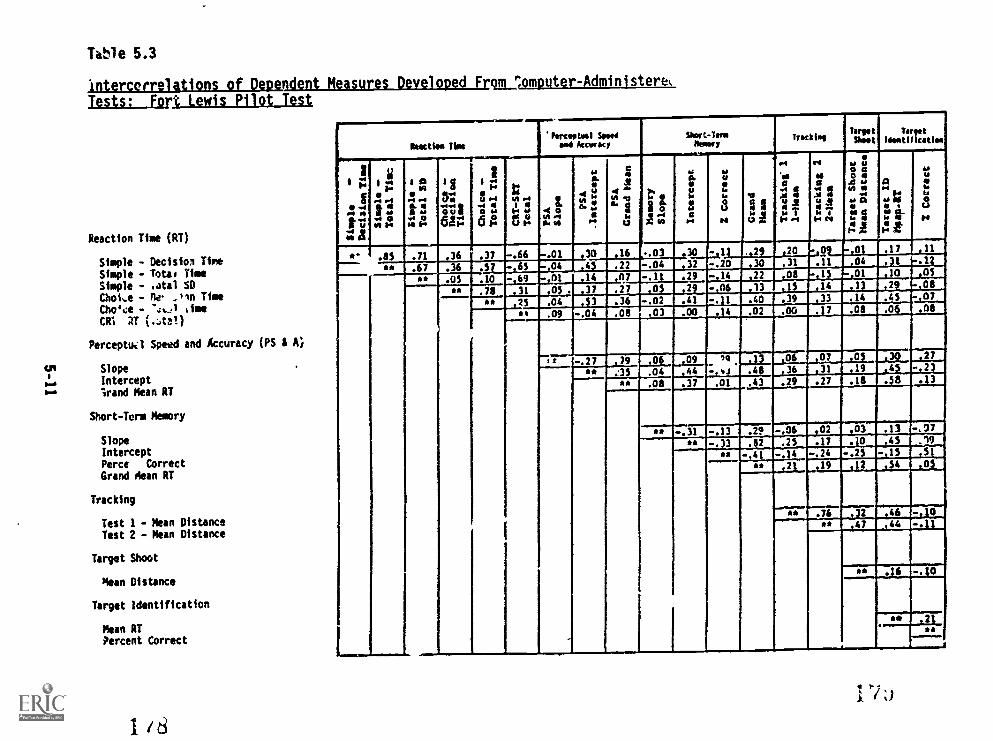
Table 5.3
Intercerrelations of Dependent Measures Developed Frqm2Ipmputer-Administerek
Tests: Fort Lewis Pilot Test
Reaction Time (RT)
Simple - Decision TimeSimple - Totao TimeSimple - (otal SDChoi,e - n4. .dln TimeChola - "J.11 ,imeCR1 AT (.tat)
Perceptuil Speed and Accuracy (PS A;
cm Slope1
Intercept'Wand Mean RT
Short-Term Memory
SlopeIntercept
Perce CorrectGrand Aeon RT
Tracking
Test 1 - Mean DistanceTest 2 - Mean Distance
Target Shoot
Mean Distance
Target Identification
Mean RTPercent Correct
118
Reactlie TimePerceptual Speed
wed AcawscyShert-Tera
IlessyTresting
Urge tSleet
To letWall Icatles
1 F.:
g213i -a
I ".1.4
itI 2
.44 -e3at':
I S`5-.."2-u''tIsar.'
I g: -itl
5.g42et':
41'22
460.0
43ti1
.31
as'i e.102 .o
laa.
e3.1
eau0e
3302
.4'Mba:.4 :XsAY.
MIa1 3tA.th
0Y u0 a0 01 40"'I'
t"rot''.2
a"F.e$ri-AZ
4.0u0
8.All' .85 .71 36 .37 -.66 .01
.04
30.45
16
.22
..03
-.04
30
.32
- 1
-.20
. 2
.30
20
.31
0
.11
0.04
IFE111111111.31 .12
hit .67 .36 .S7 -.65
* .05 .10 -.69 01 14 07 -.1 .29 - 14 22 08 1 01 10 OS
*0 .78 31 0 . 37 27 .05 .29 -.96 .13 .14 .13 .29 .08
0* 25 .04 .53 .36 -.02 .41 -.11 .40
_,15.39 .33 .14 .45 .07
.09 -.04 .08 i .03 .00 .14 .02 .00 1.17 .08 .06 .08
1 -.27 79 06 ap2_ 19 1 06 07 0
.48 .36 .31 .19 .450 '35 .04 .44 -,4..s
ifigi .08 .37 .01 .43 .29 .27 .18 .58
"I ,-.31 -.13 .2, -.06 ,02 .03 .13
110 -. 3 .82 .25 . 7 . 0 .45
ith - 41 - 14 - 24 -.25 121131111311154 02 19 1
0* .76 -.101 0* -,
a* c21
44
I
I 7J
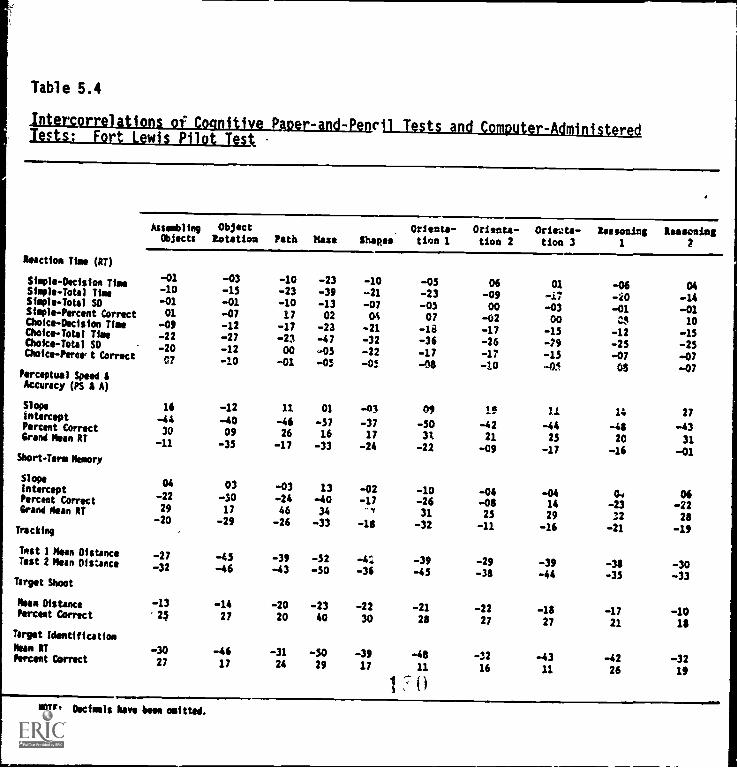
Table 5.4
hittazurglatignisisonitimhpgrAngumcil Tests and Computer-AdministeredTests: Fort Lewis Pilot Test
Reaction Time (RT)
AssemblingObjects
Object?station Path Mese Shapes
Oriente-tion 1
Oriente-tion 2
Oric2ta-tion 3
begonias1
lessening2
Miry le-Decision Time -01 -03 -10 -23 -10 -05 06 01 -06 04Simple-Total Time -10 -15 -23 -39 -21 -23 -09 -17 -20 -14Simple-Total SD -01 -01 -10 -13 -07 -03 00 -03 -01 -01Simple-Percent Correct 01 -07 17 02 04 07 -02 00 CS 10Choice-Decision Time -09 -12 -17 -23 -21 -la -17 -15 -12 -15Choice-Total Time -22 -27 -23 -47 -32 -36 -26 -79 -25 -25Choice-Total SO -20 -12 00 -05 -22 -17 -17 -15 -07 -07Choice-Peres: t Correct 07 -10 -01 -05 -05 -03 -is -45 os -07
Perceptual Speed 6Accuracy (PS A A)
Slope 16 -12 11 01 -03 09 19 li 1:. 27intercept -44 -40 -46 -57 -37 -50 -42 -44 -46 -43Percent Correct 30 09 26 16 17 3i 21 25 20 31;rand Hun RT -11 -35 -17 -33 -24 -22 -09 -1.7 -16 -01Short-Term Memory
SlopeInterceptPercent Correctgrand Sean RT
04
-2229
03-30
17
-03-2446
13-40
34
-02-17--
-10-26
31
-04-08
25
-041429
04-23
32
06-2228-20 -29 -26 -33 -18 -32 -11 -16 -21 -19Tracking
Tout 1 Mean Distance -27 -43 -39 -52 -4: -39 -29 -39 -38 -30Test 2 Mean Distance -32 -46 -43 -50 -36 -45 -33 -44 -35 -33Target Shoot
Mean Distance -13 -14 -20 -23 -22 -21 -22 -18 -17 -10Percent Correct 24 27 20 40 30 23 27 27 21 111
Target Identification
Mean AT -30 -46 -31 -50 -39 -48 -32 -43 -42 -32Percent Correct 27 17 24 29 17 11 16 11 26 19
MOTE: Decimals have been omitted.
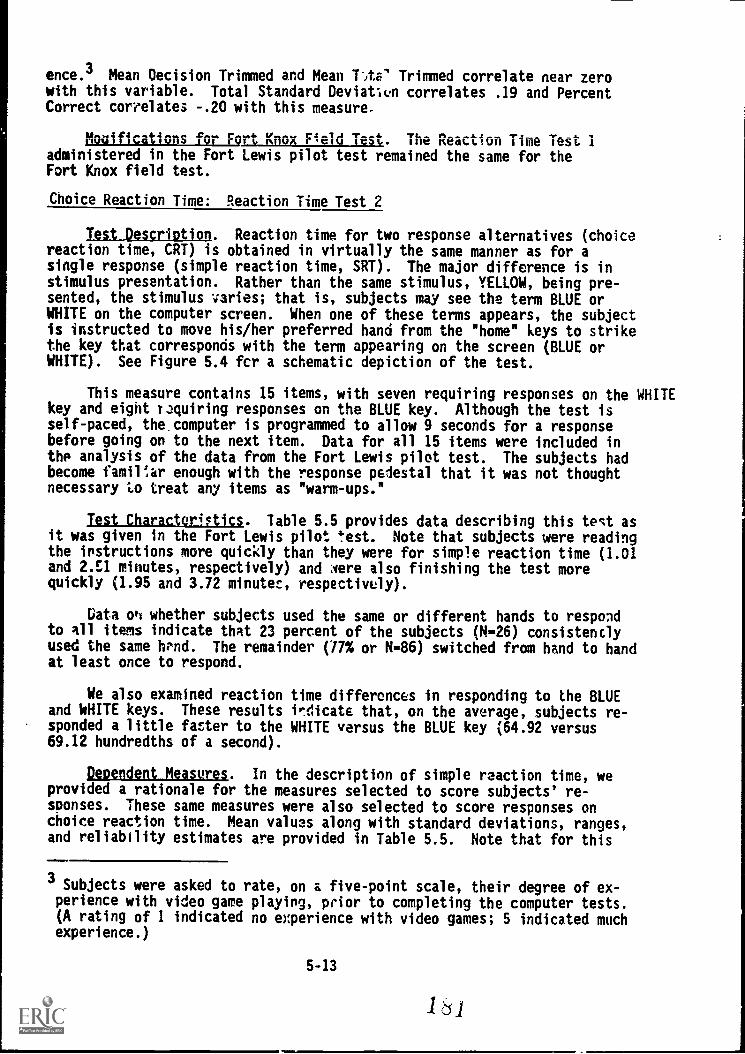
ence. 3 Mean Decision Trimmed and Mean lite Trimmed correlate near zerowith this variable. Total Standard Deviatlen correlates .19 and PercentCorrect correlates -.20 with this measure.
Mouifications for Feyt Knox Field Test. The Reaction Time Test 1administered in the Fort Lewis pilot test remained the same for theFort Knox field test.
Choice Reaction Time: Reaction Time Test 2
121I Description. Reaction time for two response alternatives (choicereaction time, CRT) is obtained in virtually the same manner as for asingle response (simple reaction time, SRT). The major difference is instimulus presentation. Rather than the same stimulus, YELLOW, being pre-sented, the stimulus varies; that is, subjects may see the term BLUE orWHITE on the computer screen. When one of these terms appears, the subjectis instructed to move his/her preferred hand from the "home" keys to strikethe key that corresponds with the term appearing on the screen (BLUE orWHITE). See Figure 5.4 fcr a schematic depiction of the test.
This measure contains 15 items, with seven requiring responses on the WHITEkey and eight requiring responses on the BLUE key. Although the test isself-paced, the. computer is programmed to allow 9 seconds for a responsebefore going on to the next item. Data for all 15 items were included inthe analysis of the data from the Fort Lewis pilot test. The subjects hadbecome familiar enough with the response pedestal that it was not thoughtnecessary to treat any items as "warm-ups."
Test CharacteriFtics. Table 5.5 provides data describing this test asit was given in the Fort Lewis pilot test. Note that subjects were readingthe instructions more quickly than they were for simple reaction time (1.01and 2.E1 minutes, respectively) and eere also finishing the test morequickly (1.95 and 3.72 minutes, respectively).
Data o'i whether subjects used the same or different hands to respondto all items indicate that 23 percent of the subjects (N-26) consistentlyused the same h?nd. The remainder (77% or Ne86) switched from hand to handat least once to respond.
We also examined reaction time differences in responding to the BLUEand WHITE keys. These results indicate that, on the average, subjects re-sponded a little fatter to the WHITE versus the BLUE key (64.92 versus69.12 hundredths of a second).
Dependent Measures. In the description of simple reaction time, weprovided a rationale for the measures selected to score subjects' re-sponses. These same measures were also selected to score responses onchoice reaction time. Mean values along with standard deviations, ranges,and reliability estimates are provided in Table 5.5. Note that for this
3Subjects were asked to rate, on a five-point scale, their degree of ex-
perience with video game playing, prior to completing the computer tests.(A rating of 1 indicated no experience with video games; 5 indicated muchexperience.)
5-13
161
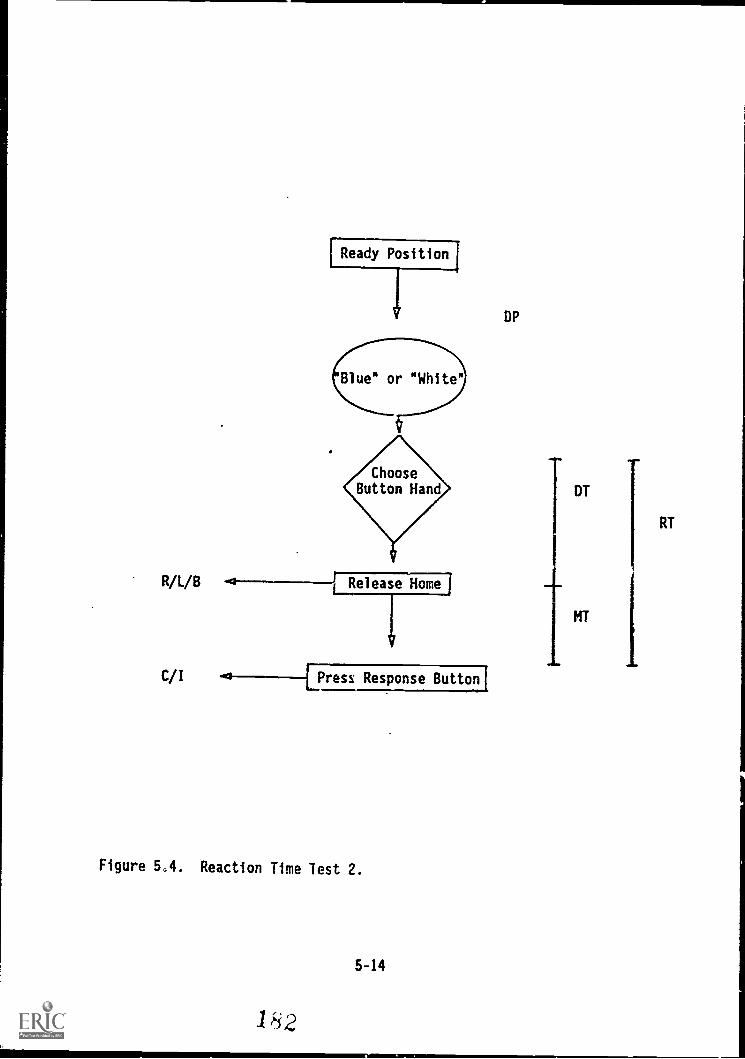
Ril/B .*
IReady Position'
/
J Release Home
C/1 ./ [press Response Button'
Figure 5.4. Reaction Time lest 2.
5-14
182
DP
DT
MT
RT
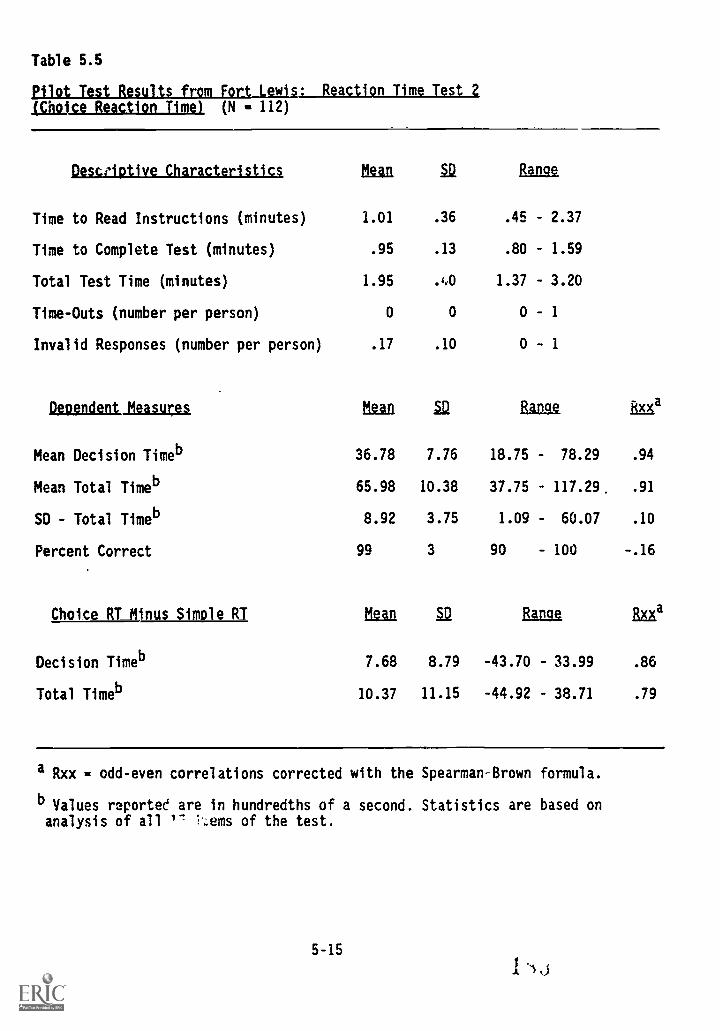
Table 5.5
Pilot Test Results from Fort Lewis: Reaction Time Test 2(Choice Reaction Time) (N = 112)
Desceiptive Characteristics Man 5.12Range
Time to Read Instructions (minutes) 1.01 .36 .45 - 2.37
Time to Complete Test (minutes) .95 .13 .80 - 1.59
Total Test Time (minutes) 1.95 .0 1.37 - 3.20
Time-Outs (number per person) 0 0 0 - 1
Invalid Responses (number per person) .17 .10 0 - 1
Dependent Measures an Range End
Mean Decision Timeb 36.78 7.76 18.75 - 78.29 .94
Mean Total Timeb 65.98 10.38 37.75 - 117.29. .91
SD - Total Timeb 8.92 3.75 1.09 - 60.07 .10
Percent Correct 99 3 90 - 100 -.16
Choice RTAinus Simple RI Mean 52 Range Baia
Decision Timeb 7.68 8.79 -43.70 - 33.99 .86
Total Timeb 10.37 11.15 -44.92 - 38.71 .79
a Rxx = odd-even correlations corrected with the Spearman-Brown formula.
b values reported are in hundredths of a second. Statistics are based onanalysis of all '1 :',.ems of the test.
5-15
I 1
measure, only the two reaction time scores provide reliable information.
Another measure we looked at is the difference between mean choicereaction time scores and simple reaction time scores--a value that is in-tended to capture a speed-v%processing component. The typical choice re-action time paradigm includes two, four, and eight response alternatives,and processing efficiency is computed by regru sing mean reaction timescore against the number of response alternatives (i.e., one, two, four,and eight). The slope of this regression equation is interpreted as theprocessing speed, or the time required to process additional information.Because our testing pedestal does not allow for four or eight responsechoices, we cannot calculzta this value. Instead, we used a score showingthe difference between choice and simple reaction times. Note that reli-ability estimates suggest these values are internally consistent.
farielitimiittktberMiugiiiar. Correlations with measures derivedfrom other computer-administered tests are reported in Table 5.3. Thesevalues indicate that choice decision and choice total times are highlycorrelated (r = .78). (Standard deviation total and percent correct wereomitted from these analyses due to low reliability.) Choice decision andchoice total times correlate moderately with their simple reaction timecounterparts. Also note that the experimental variable, Choice Total Timeminus Simple Total Time, correlates highly with Simple Reaction Time mea-sures, but only moderately with Choice Reaction Time measures.
Choice Decision and Choice Total yield fairly similar correlationpatterns with scores from other computer tests. These measures correlatehighest with PS & A Intercept (r - .37 and r = .53, respectively), TargetIdentification Mean RT (r .29 and r = .45), and Memory Intercept (r .29and r = .41) and Grand Mean (r = .33 and r = .40). In addition, choicetotal yields moderate correlations with Tracking 1 Mean (r = .39), Tracking2 Mean (r .33), and PS & A Grand Mean (r .36). Again, just as forSimple Reaction Time, these correlations show an association between reac-tion times for the perceptual tasks--except for the moderate correlationswith Tracking 1 and 2, which are somewhat unexpected. but may indicateassociation based on movement speed.
Correlations of choice reaction time measures with cognitive paper-and-pencil measures appear in Table 5.A. These data indicate that choicedecision and total time correlate highest with the Maze Test (r = -.28 and-.47, respectively). Total time, in fact, yields moderate correlationsacross all paper-and-pencil cognitive measures. As noted before, thesenegative correlations actually indicate that "better' scores are asso-ciated since lower scores on reaction time indicate better performance andhigher scores on the paper-and-pencil tests indicate better performance.
Modifications for Fort Knox Field Test. No changes were made to thistest for the Fort Knox field test.
5-16
'-11.11
1
SHORT-TERM MEMORY
This construct is defined as the rate at which one observes, searches,and recalls information contained in short-term memory.
Memory Search Test
The marker used for this test is a short-term memory search taskintroduced by S. Sternberg (1966, 1969). In this test, the subject ispresented with a set of one to five familiar items (e.g., letters); theseare withdrawn and then the subject is presented with a probe item. Thesubject is to indicate, as rapidly and as accurately as possible, whetheror not the probe was contained in the original set of items, now held inshort-term memory. Generally, mean reaction time is regressed against thenumber of objects in the item or stimulus set. The slope of this functioncan be interpreted as the average increase in reaction time with an in-crease of one object in the memory set, or the rate at which one can accessinformation in short-term memory.
Test Description. The measure developed for computer-administeredtesting is very similar to that designed by Sternberg. At the computerconsole, the subject is instructed to place his/her hands on the green homebuttons. The first stimulus set then appears on the screen. A stimuluscontains one, two, three, four, or five objects (letters). Following a .5-or 1-second display period, the stimulus set disappears and, after a delay,the probe item appears. Presentation of the probe item is delayed byeither 2.5 or 3 seconds. When the probe appears, the subject must decidewhether or not it appeared in the stimulus set. If the item was present inthe stimulus set, the subject removes his/her hands from the home buttonsand strikes the white key. If the probe item was not present, the subjectstrikes the blue key. (See Ftiure 5.5 for schematic depiction of thememory search task.) Fifty items were included on this test for the FortLewis administration.
Parameters of interest include, first, stimulus set length, or numberof letters in the stimulus set. Values for this p. ameter range from oneto five. The second parameter, observation period Ad probe delay period,includes two levels. The first is described as long observation and shortprobe delay; time periods are 1 second and 2.5 seconds, respectively. Thesecond level, short observation and long probe delay, includes periodsof .5 second and 3 seconds, respectively. The final parameter, probestatus, indicates that the probe is either in the stimulus set or not inthe stimulus set. These parameters will be discussed in more detail below.
Test Characteristics. Table 6.6 provides descriptive informatior forthe Memory Search Test from the pilot test at Fort Lewis. These dataindicate that subjects, on the average, read the teet instructions in 3minutes (range, 1.6 - 5.8) and completed the test in 9 minutes (range, 8.4- 11.7). Thus, total testing time for the average subject is 12 minutes(range, 10.4 - 17.5). Further, subjects allowed very few timeouts (mean- .17, SD - .80) and provided about five invalid responses (range 0 - 28).Over all, total percent correct is 90. However, the range of PercentCorrect values, 44 to 100, indicates that at least one subject was perform-ing at a lower than chance level.
5-17CS cl
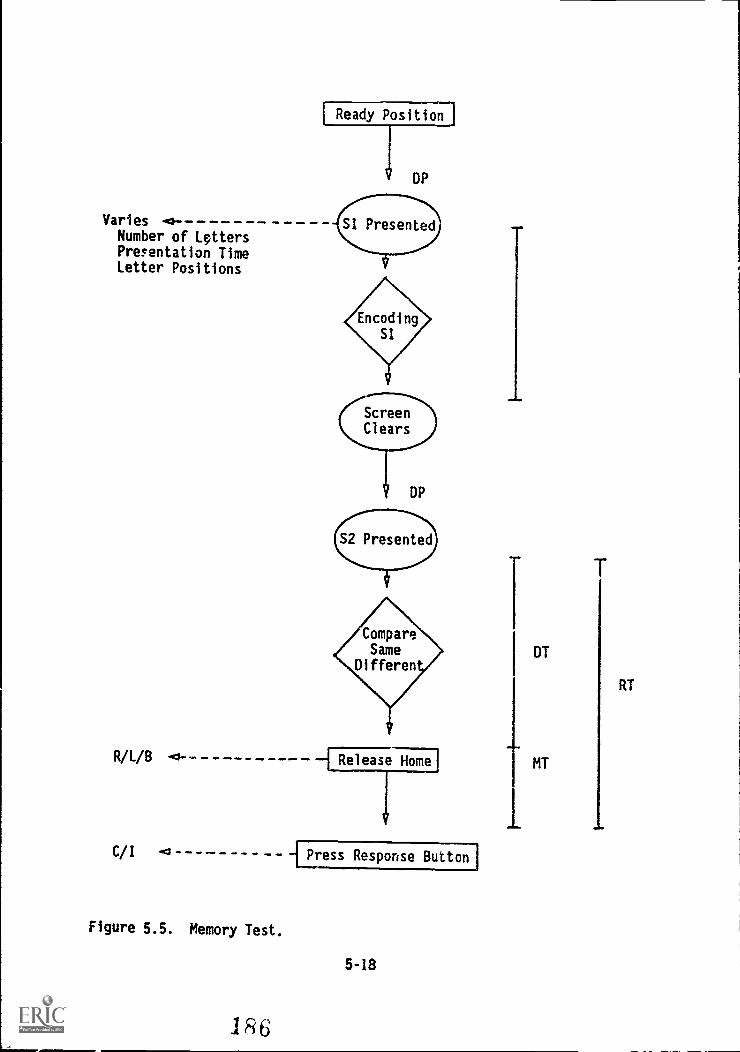
Varies -*-
Number of LpttersPresentation TimeLetter Positions
R/L/8 -0-- -
C/I 411:3 No
Figure 5.5. Memory Test.
1F6
FlReady Position I
DP
ScreenClears
DP
S2 Presented
4
Release Home
{press Response Button]
5-18
DT
MT
400
RT
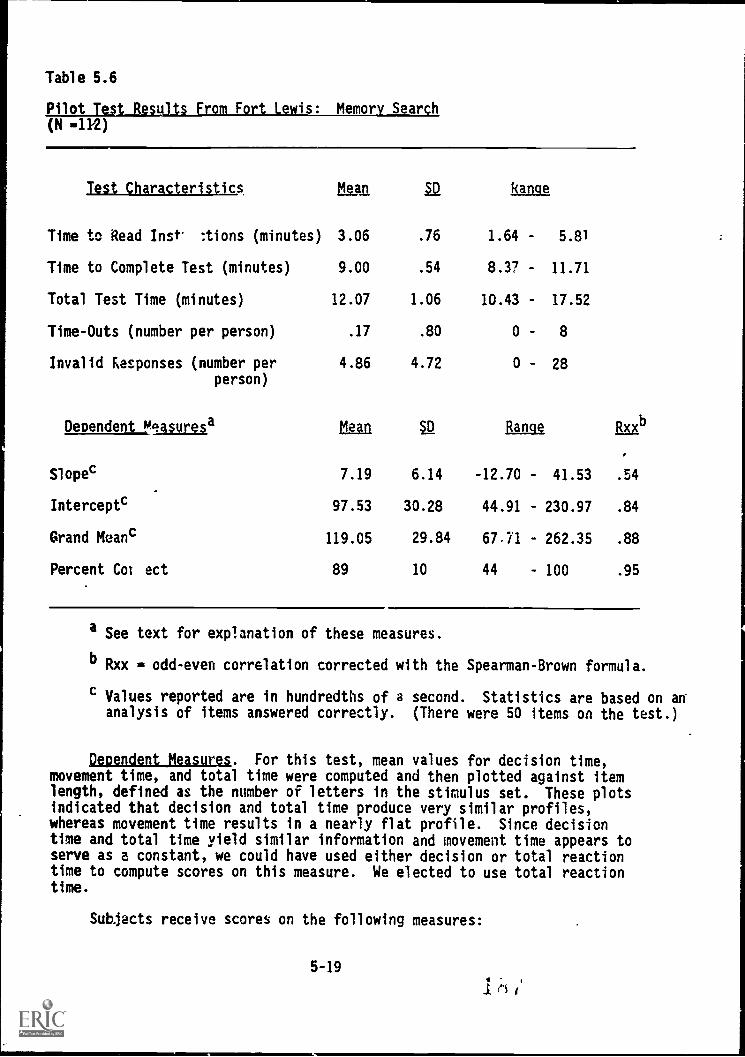
Table 5.6
Pilot TesLResuits From Fort Lewis: Memorv_5earch(N
Test Characteristics, MOD. 12 kange
Time to Read Insi- :tions (minutes) 3.06 .76 1.64 - 5.81
Time to Complete Test (minutes) 9.00 .54 8.37 - 11.71
Total Test Time (minutes) 12.07 1.06 10.43 - 17.52
Time-Outs (number per person) .17 .80 0 - 8
Invalid Responses (number perperson)
4.86 4.72 0 28
Dependent measuresa Mean aD Range Bub
Slopec 7.19 6.14 -12.70 41.53 .54
Interceptc 97.53 30.28 44.91 230.97 .84
Grand Meanc 119.05 29.84 67.71 - 262.35 .88
Percent Cot ect 89 10 44 - 100 .95
a See text for explanation of these measures.
b Rxx odd-even correlation corrected with the Spearman-Brown formula.
c Values reported are in hundredths of a second. Statistics are based on ananalysis of items answered correctly. (There were 50 items on the test.)
Dependent Measures. For this test, mean values for decision time,movement time, and total time were computed and then plotted against itemlength, defined as the number of letters in the stimulus set. These plotsindicated that decision and total time produce very similar profiles,whereas movement time results in a nearly flat profile. Since decisiontime and total time yield similar information and movement time appears toserve as a constant, we could have used either decision or total reactiontime to compute scores on this measure. We elected to use total reactiontime.
Subjects receive scores on the following measures:
5-19
Slope and Intercept. These values are obtained by regressing meantotal reaction time (correct responses only) against item length.In terms of processing efficiency, Slope represents the averageincrease in reaction time with an increase of one object in thestimulus set. Thus, the lower the value, the faster the access.Intercept represents all other processes not involved in memorysearch, such as encoding the probe, determining whether or not amatch has been found, and executing the response.
Percent Correct. This value is used to screen subjects completingthe test. ror example, recall that in Table 5.6 we indicated thatone subject correctly answered 44 percent of the items. Computingthe above scores (e.g., Slope and Intercept) for this subject wouldresult in meaningless information. Thus, Percent Correct scoresare used to identify subjects performing at very low levels, there-by precluding computation of the above scores.
Grand Mean. This value is calculated by first computing the meanreaction time (correct responses only) for each level of stimulusset length (i.e., one to five). The mean of these means is thencomputed.
Table 5.6 contains the mean, standard deviation, range, and reliabil-ity estimates for each of the dependent measures. Note that these valuesindicate that all measures except the Slope yield fairly high internalconsistency values.
Correlations With Other Measures. The four dependent measures com-puted for the Short-Term Memory Test were correlated with scores generatedfrom the other computer-administered tests of the battery and with scoreson the cognitive paper-and-pencil tests (Tables 5.3 and 5.4, respectively).Results for these four dependent measures varied, and are discussed sepa-rately.
Short -Term Memory Slope yielded correlations ranging from -.31 to .29with other computer measures. Lowest values were with Choice Reaction TimeTotal ( -.02) and Target Tracking 2 (r = .02), while highest values werewith Memory Intercept (r a -.31) and Grand Mean (r - .29). Dependentmeasures from other computer tests correlating moderately with Memory Slopeinclude Simple Reaction Time Total SD (r = -.11) and Target IdentificationMean Reaction Time (r - .13). When correlated with cognitive paper-and-pencil tests, Short-Term Memory Slope yielded generally low relationships.The highest correlation was .13 with the Maze Test.
Short-Term Memory Intercept correlated highest with the Memory GrandMean (r = .82), Target Identification Mean Reaction Tire (r = .4F), Percep-tual Speed and Accuracy Intercept (r a .44), and Choice Reaction Time Total(r = .41). Low relationships were found with the difference between choiceand simple reaction times (r = .00), Perceptual Speed anc Accuracy Slope (r. .09), Target Shoot Mean Distance (r = .10), and Target IdentificationPercent Correct (r a .09). With the cognitive paper-and-pencil measures,Memory Intercept showed generally moderate relationships, for example, withMaze (r - -.40), Object Rotation (r -.30), and Orientation 1 (r - -.26).
Short-Term Memory Percent Correct correlated most strongly with Per-
5-20
1R
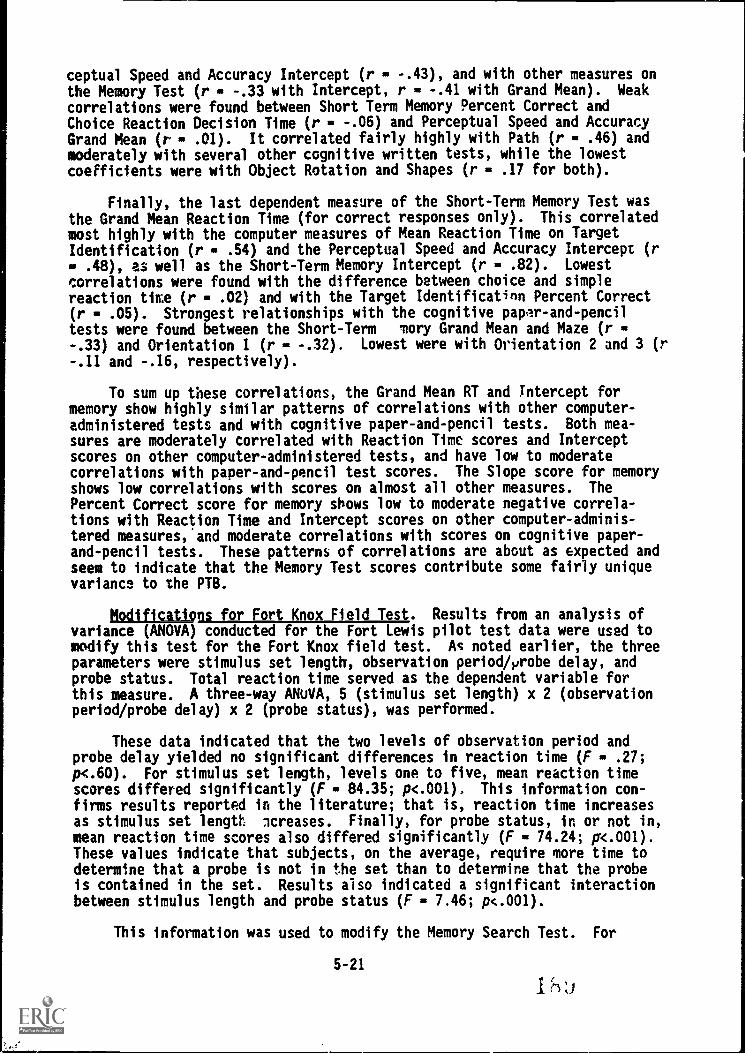
ceptual Speed and Accuracy Intercept (r - -.43), and with other measures onthe Memory Test (r = -.33 with Intercept, r - -.41 with Grand Mean). Weak
correlations were found between Short Term Memory Percent Correct andChoice Reaction Decision Time (r - -.06) and Perceptual Speed and Accuracy
Grand Mean (r - .01). It correlated fairly highly with Path (r - .46) andmoderately with several other cognitive written tests, while the lowestcoefficients were with Object Rotation and Shapes (r - .17 for both).
Finally, the last dependent measure of the Short-Term Memory Test wasthe Grand Mean Reaction Time (for correct responses only). This correlatedmost highly with the computer measures of Mean Reaction Time on TargetIdentification (r = .54) and the Perceptual Speed and Accuracy Intercept (r
.48), as well as the Short-Term Memory Intercept (r = .82). Lowestcorrelations were found with the difference between choice and simplereaction time (r = .02) and with the Target Identification Percent Correct(r = .05). Strongest relationships with the cognitive paper-and-penciltests were found between the Short-Term mory Grand Mean and Maze (r --.33) and Orientation 1 (r - -.32). Lowest were with Orientation 2 and 3 (r
-.11 and -.16, respectively).
To sum up these correlations, the Grand Mean RT and intercept formemory show highly similar patterns of correlations with other computer-administered tests and with cognitive paper-and-pencil tests. Both mea-sures are moderately correlated with Reaction Time scores and Interceptscores on other computer-administered tests, and have low to moderatecorrelations with paper-and-pencil test scores. The Slope score for memoryshows low correlations with scores on almost all other measures. ThePercent Correct score for memory shows low to moderate negative correla-tions with Reaction Time and Intercept scores on other computer-adminis-tered measures, and moderate correlations with scores on cognitive paper-and-pencil tests. These patterns of correlations are about as expected andseem to indicate that the Memory Test scores contribute some fairly uniquevariance to the PTB.
Modifications for Fort Knox_Field_Iest. Results from an analysis ofvariance (ANOVA) conducted for the Fort Lewis pilot test data were used tomodify this test for the Fort Knox field test. As noted earlier, the threeparameters were stimulus set length, observation period/yrobe delay, andprobe status. Total reaction time served as the dependent variable forthis measure. A three-way ANOVA, 5 (stimulus set length) x 2 (observationperiod/probe delay) x 2 (probe status), was performed.
These data indicated that the two levels of observation period andprobe delay yielded no significant differences in reaction time (F = .27;p<.60). For stimulus set length, levels one to five, mean reaction timescores differed significantly (F = 84.35; pc001). This information con-firms results reported in the literature; that is, reaction time increasesas stimulus set length :creases. Finally, for probe status, in or not in,mean reaction time scores also differed significantly (F = 74.24; p <.001).These values indicate that subjects, on the average, require more time todetermine that a probe is not in the set than to determine that the probeis contained in the set. Results also indicated a significant interactionbetween stimulus length and probe status (F = 7.46; pc.001).
This information was used to modify the Memory Search Test. For
5-21
I
example, stimulus set length had yielded significant mean reaction timescore differences for the five levels; mean reaction time for levels twoand four, however, differed little from levels three and five, respec-tively. Therefore, items containing stimulus sets with two and four let-ters were deleted from the test file.
Although the observation period/probe delay parameter produced non-significant results, we concluded that different values for probe delay mayprovide additional information about processing and memory. For example,in literature in this area researchers suggest that subjects begin with avisual memory of the stimulus objects, which begins to decay after a verybrief period, .5 second. To retain a memory of the object set, subjectsshift to an acoustic memory; that is, subjects rehearse the sounds of theobject set and recall its contents acoustically (Thorson, Hochhaus, &Stanners, 1976). Therefore, we changed the two probe delay periods to .5seconds and 2.5 seconds. These periods are designed to assess the twohypothesized types of short-term memory--visual and acoustic.
Finally, consideration of the probe status parameter led us to modifyone-half of the items in the test to include unusual or unfamiliar ob-jects--symbols, rather than letters. In part, rationale for using lettersor digits in a problem involves using overlearned stimuli so that noveltyof the stimulus does not affect processing of the material. We elected,however, to add a measure of processing and recalling unusual material,primarily because Army recruits do encounter and are 'equired to recallstimuli that are novel to them, especially during their initial training.Consequently,-one-half of the revised test items ask subjects to observeand recall unfamiliar symbols rather than letters.
The test then, as modified, contained 48 items--one half consisting ofletters and the other half of symbols. Within each item type, three levelsof stimulus length are included. That is, for items with letter stimulussets, there are eight items with a single letter, eight with three, andeight with five letters; the same is done for items containing symbols.Within each of tne stimulus length sets, four items include a .5-secondprobe delay and four contain a 2.5-second probe delay period. Across allitems (N - 48), probe status is equally mixed between "in" and "not in" thestimulus set. With the test .A.) constructed, the effects of stimulus type,stimulus set length, probe delay period, and probe status can be examined.
5-22
13 u
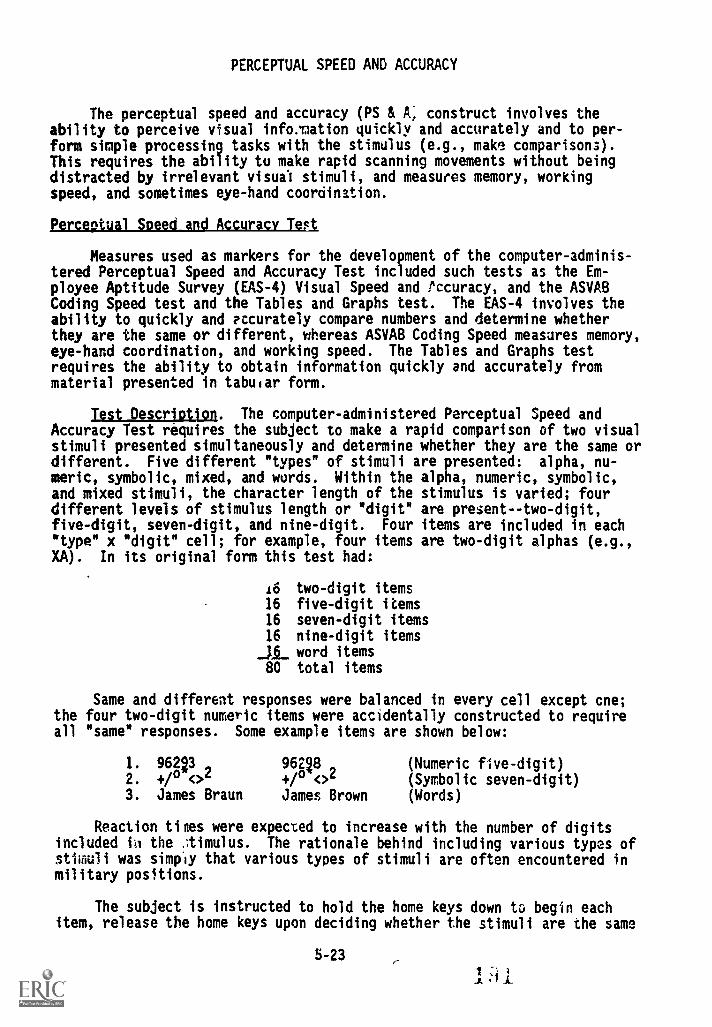
PERCEPTUAL SPEED AND ACCURACY
The perceptual speed and accuracy (PS & A; construct involves theability to perceive visual info.'nation quickly and accurately and to per-form simple processing tasks with the stimulus (e.g., make comparisons).This requires the ability to make rapid scanning movements without beingdistracted by irrelevant visual stimuli, and measures memory, workingspeed, and sometimes eye-hand coordination.
Perceptual Speed and Accuracy Test
Measures used as markers for the development of the computer-adminis-tered Perceptual Speed and Accuracy Test included such tests as the Em-ployee Aptitude Survey (EAS-4) Visual Speed and Pccuracy, and the ASVABCoding Speed test and the Tables and Graphs test. The EAS-4 involves theability to quickly and ?ccurately compare numbers and determine whetherthey are the same or different, whereas ASVAB Coding Speed measures memory,eye-hand coordination, and working speed. The Tables and Graphs testrequires the ability to obtain information quickly and accurately frommaterial presented in tabular form.
Test Descriott2n. The computer-administered Perceptual Speed andAccuracy Test requires the subject to make a rapid comparison of two visualstimuli presented simultaneously and determine whether they are the same ordifferent. Five different "types" of stimuli are presented: alpha, nu-meric, symbolic, mixed, and words. Within the alpha, numeric, symbolic,and mixed stimuli, the character length of the stimulus is varied; fourdifferent levels of stimulus length or "digit" are present--two-digit,five-digit, seven-digit, and nine-digit. Four items are included in each"type" x "digit" cell; for example, four items are two-digit alphas (e.g.,XA). In its original form this test had:
lb two-digit items16 five-digit items16 seven-digit items16 nine-digit items
_lf_ word items80 total items
Same and different responses were balanced in every cell except cne;the four two-digit numeric items were accidentally constructed to requireall "same" responses. Some example items are shown below:
1.
2.
3.
962234./
o <>2
James Braun
96298+1 <>2
James Brown
(Numeric five-digit)(Symbolic seven-digit)(Words)
Reaction tines were expected to increase with the number of digitsincluded iar the Aimulus. The rationale behind including various types of
was simply that various types of stimuli are often encountered inmilitary positions.
The subject is instructed to hold the home keys down to begin eachitem, release the home keys upon deciding whether the stimuli are the same
5-23;Th
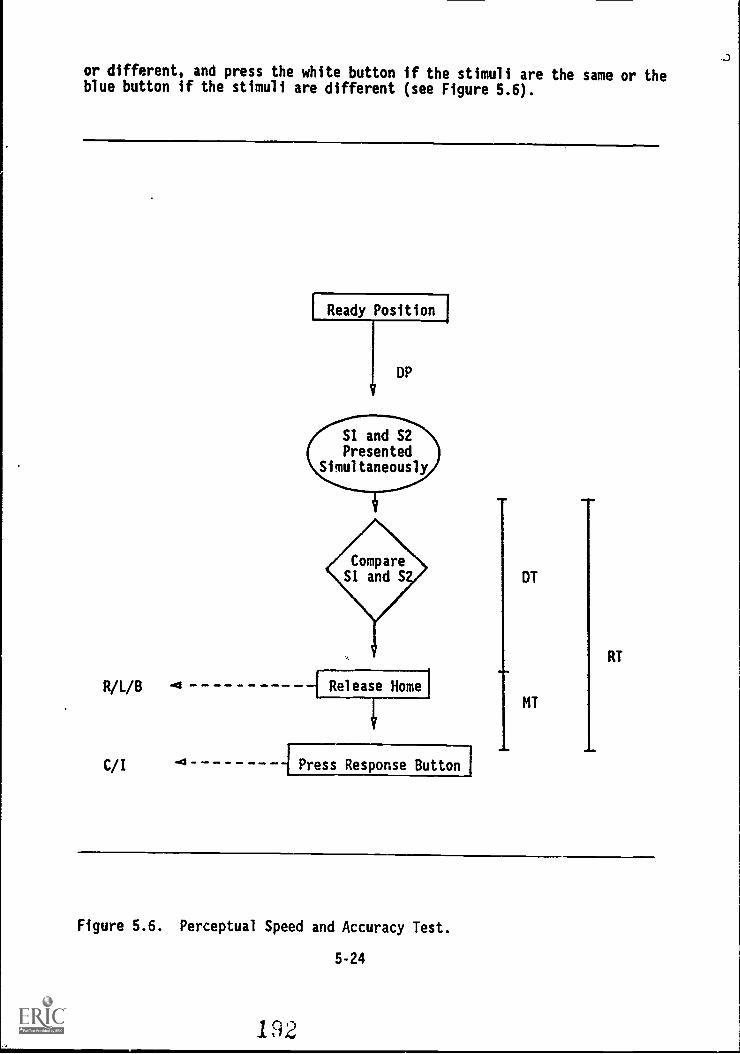
or different, and press the white button if the stimuli are the same or theblue button if the stimuli are different (see Figure 5.6).
I Ready Position
DP
S1 and S2Presented
Simultaneously
R/L/B A* -.1 Release Home
i
C/I "13------.- j Press Response Button
WM&
DT
MT
OEM NII/I
RT
Figure 5.6. Perceptual Speed and Accuracy Test.
5-24
12
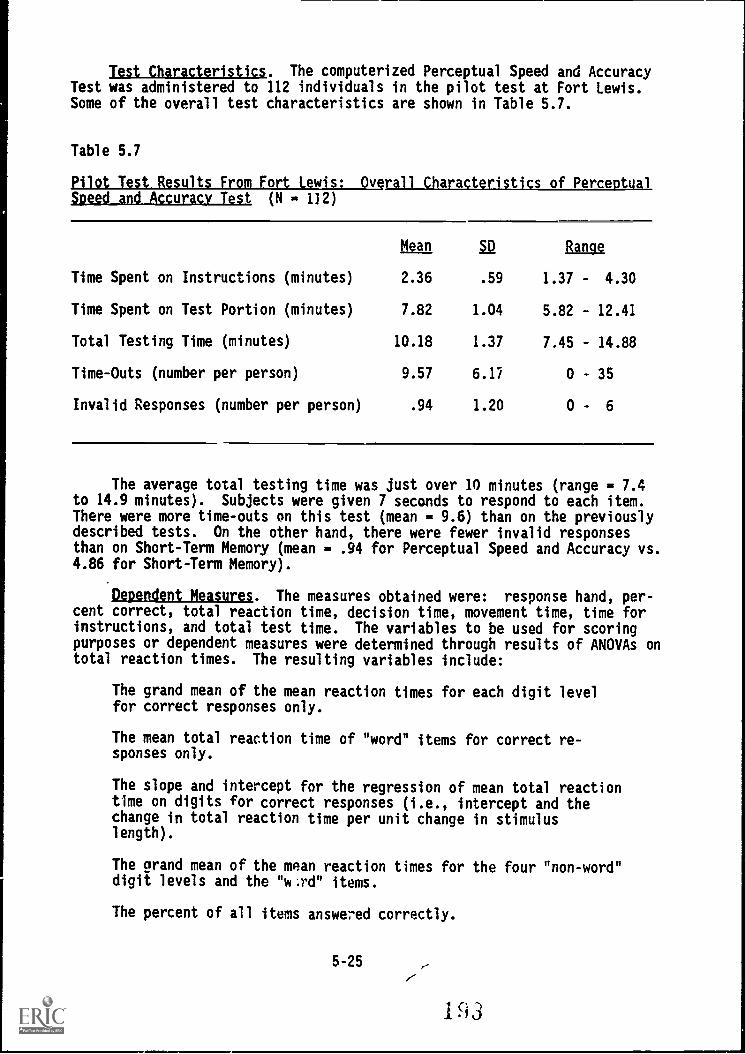
Test Characteristics. The computerized Perceptual Speed and AccuracyTest was administered to 112 individuals in the pilot test at Fort Lewis.Some of the overall test characteristics are shown in Table 5.7.
Table 5.7
Pilot Test Results From_Fort Lewis: Overall Characteristics of PerceptualSpeed and Accuracy Test (N 132)
Mean, ID an
Time Spent on Instructions (minutes) 2.36 .59 1.37 - 4.30
Time Spent on Test Portion (minutes) 7.82 1.04 5.82 - 12.41
Total Testing Time (minutes) 10.18 1.37 7.45 - 14.88
Time-Outs (number per person) 9.57 6.17 0 - 35
Invalid Responses (number per person) .94 1.20 0 - 6
The average total testing time was just over 10 minutes (range - 7.4to 14.9 minutes). Subjects were given 7 seconds to respond to each item.There were more time-outs on this test (mean - 9.6) than on the previouslydescribed tests. On the other hand, there were fewer invalid responsesthan on Short-Term Memory (mean - .94 for Perceptual Speed and Accuracy vs.4.86 for Short-Term Memory).
Dependent Measures. The measures obtained were: response hand, per-cent correct, total reaction time, decision time, movement time, time forinstructions, and total test time. The variables to be used for scoringpurposes or dependent measures were determined through results of ANOVAs ontotal reaction times. The resulting variables include:
The grand mean of the mean reaction times for each digit levelfor correct responses only.
The mean total reaction time of "word" items for correct re-sponses only.
The slope and intercept for the regression of mean total reactiontime on digits for correct responses (i.e., intercept and thechange in total reaction time per unit change in stimuluslength).
The grand mean of the mean reaction times for the four "non-word"digit levels and the "v4 .rd" items.
The percent of all items answered correctly.
5-25
The rationale behind the selection of these variables will be providedin the discussion of the ANOVA results.
Two two-way ANOVAs were performed on reaction times for correct re-sponses. The first was a Type (4 levels) x Digit (4 levels) ANOVA of totalreaction times. The results showed significant main effects for Type[F (3,333) = 11.99, p<.001], Digits [F (3,333) = 871.46, p<.001], and theirinteraction [F (9,999) = 44.14, p<.001] (see Figure 5.7).
The second ANOVA conducted was on movement times. Pure movement timeshould be a constant when response hands are balanced. The results sug-gested that subjects were still making their decision about the stimuliafter releasing the home keys (see Figure 5.8). That is, the movement timeANOVA for Type X Digits yielded a significant main effect for Digits[F (3,333) = 19.94, p<.001]. The interaction of Digits and Type was alsosignificant (F (9,999) = 7.22, p<.001].
The implications of these results are:
Scores should be formed on total reaction times (for correct re-sponses) instead of decision times because subjects appear tocontinue making a decision after releasing the home keys. Thus,use of decision time would not include time that subjects wereusing to process items.
Means should be computed separately for each set of items with aparticular digit level (i.e., two, five, seven, and nine). Num-ber of digits had a greater effect on mean reaction time than didtype of stimuli. Since only correct response reaction times arebeing used, subjects could raise their scores on a pooled reac-tion time by simply not responding to the nine-digit items.Thus, the mean reaction times to correct responses for each digit.level should be equally weighted. The grand mean of the meanreaction times for each digit level was computed.
The nine-digit symbolic items were probably too easy. Meanreaction times for the nine-digit symbolic items were substan-tially less than those for the other nine-digit items. Furtherinspection of the items showed that some were probably beingprocessed in "chunks" because symbols were grouped (e.g.,«++++*//).
Total reaction times for correct responses could be regressed ondigit. Interceots and slopes could be computed for individualsby means of a repeated measures regression (i.e., the trendappeared to be linear).
As a whole, the scores on the computerized Perceptual Speed and Ac-curacy Test were quite reliable (see Table 5.8). Reliability coefficientsranged from .85 for the Intercept of the regression of total reaction timeon digits to .97 for the Grand Mean of the mean reaction times for the fournon-words categories and for all categories.
5-26
194
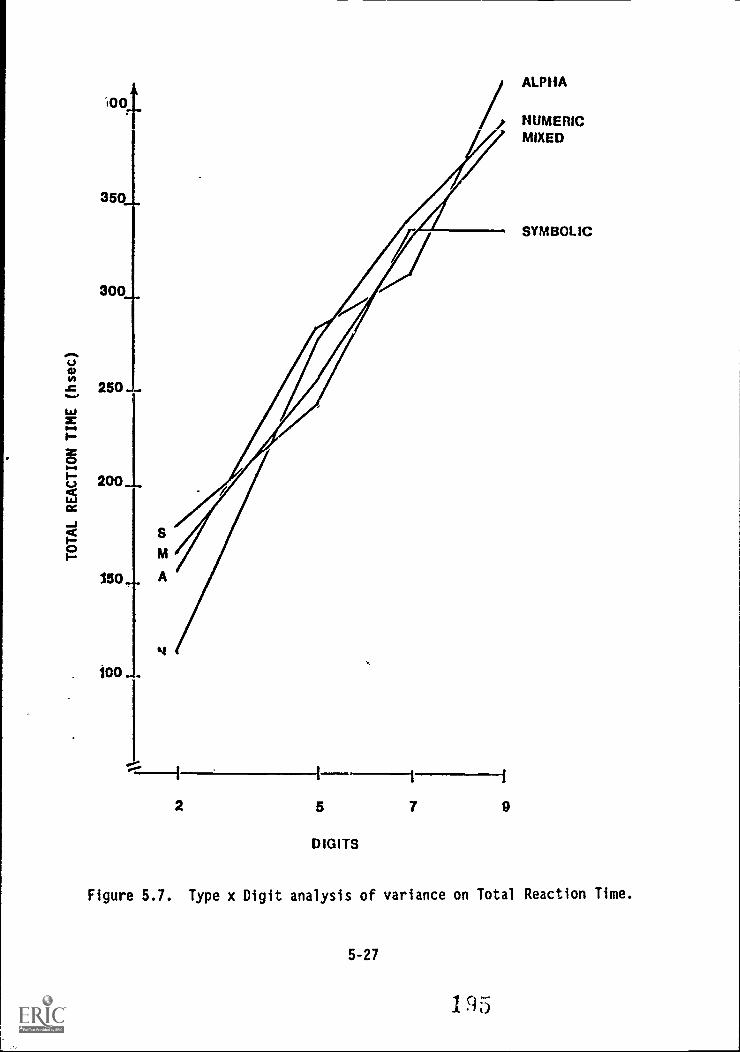
1001.ALPHA
NUMERICMIXED
I-1
SYMBOLIC
2 5 7 9
DIGITS
Figure 5.7. Type x Digit analysis of variance on Total Reaction Time.
5-27
195
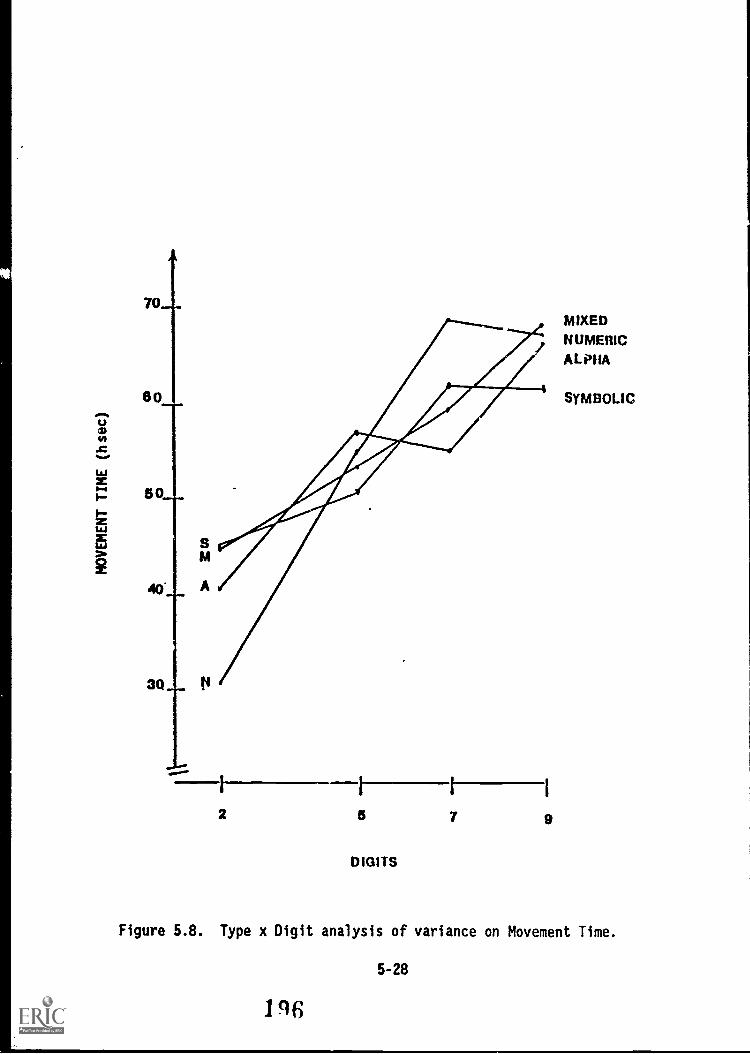
2 5
DIGITS
MIXEDNUMERICALPHA
SyMBOLIC
1..m....17 9
Figure 5.8. Type x Digit analysis of variance on Movement Time.
5-28
1%
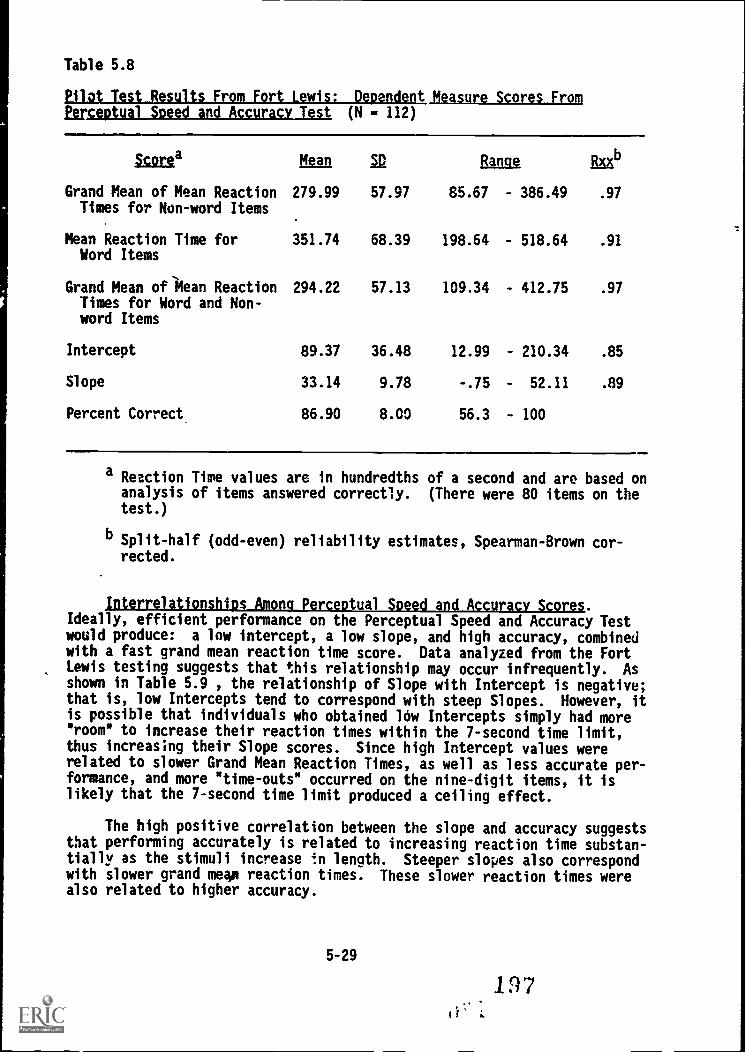
Table 5.8
1-. id- t
pirgeguiLuggsLiatikaimIllit - 112)
Scorea Mean la Range Rub
Grand Mean of Mean Reaction 279.99 57.97 85.67 - 386.49 .97
Times for Non-word Items
Mean Reaction Time for 351.74 68.39 198.64 - 518.64 .91Word Items
Grand Mean ofilean Reaction 294.22 57.13 109.34 - 412.75 .97
Times for Word and Non-word Items
Intercept 89.37 36.48 12.99 - 210.34 .85
Slope 33.14 9.78 -.75 - 52.11 .89
Percent Correct 86.90 8.00 56.3 - 100
a Reaction Time values are in hundredths of a second and are based onanalysis of items answered correctly. (There were 80 items on thetest.)
b Split-half (odd-even) reliability estimates, Spearman-Brown cor-rected.
Interrelationships Among Perceptual Speed and Accuracy Scores.Ideally, efficient performance on the Perceptual Speed and Accuracy Testwould produce: a law intercept, a low slope, and high accuracy, combinedwith a fast grand mean reaction time score. Data analyzed from the FortLewis testing suggests that this relationship may occur infrequently. Asshown in Table 5.9 , the relationship of Slope with Intercept is negative;that is, low Intercepts tend to correspond with steep Slopes. However, itis possible that individuals who obtained low Intercepts simply had more"room" to increase their reaction times within the 7-second time limit,thus increasing their Slope scores. Since high Intercept values wererelated to slower Grand Mean Reaction Times, as well as less accurate per-formance, and more "time-outs" occurred on the nine-digit items, it islikely that the 7-second time limit produced a ceiling effect.
The high positive correlation between the slope and accuracy suggeststhat performing accurately is related to increasing reaction time substan-tially as the stimuli increase in length. Steeper slopes also correspondwith slower grand mead reaction times. These slower reaction times werealso related to higher accuracy.
5-29
i;'197
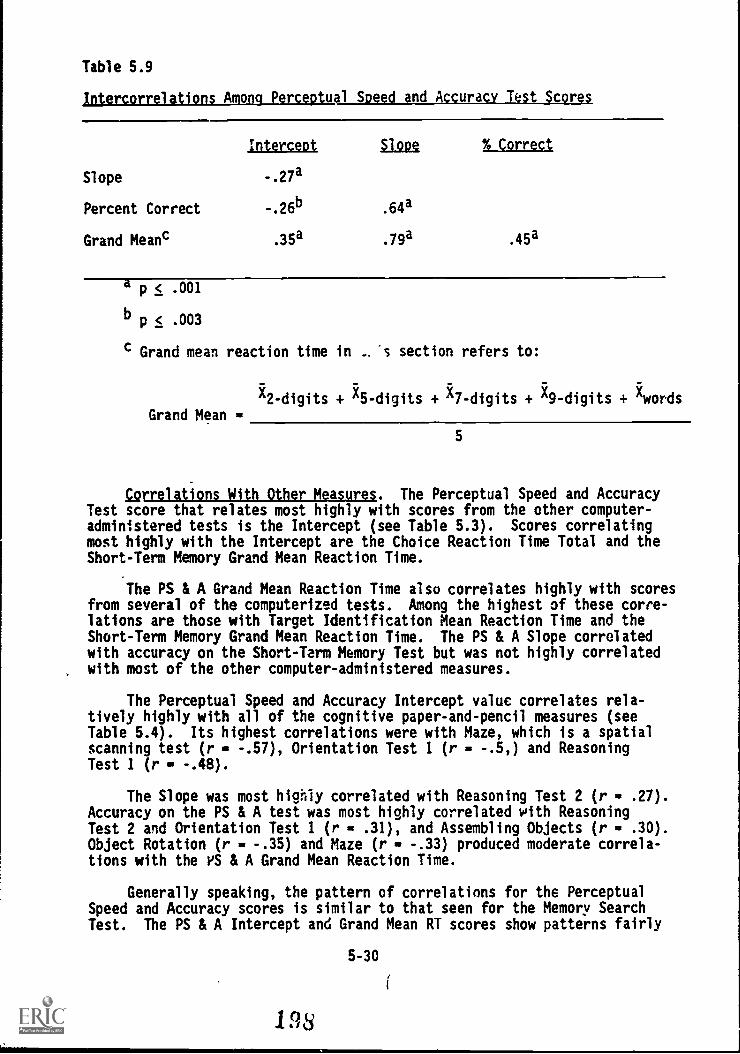
Table 5.9
Intercorrelations Among Perceptual Speed and Accuracy Test Scores
Slope
Percent Correct
Grand Meanc
Intercept Slope % Correct
-.27a
-.26b
.35a
.64a
.79a .45a
a p < .001
b p < .003
c Grand mean reaction time in - "s section refers to:
X2- digits + )15-digits + )17-digits + X9- digits + Xwords
Grand Mean =
5
Orrelations With Other Measures. The Perceptual Speed and AccuracyTest score that relates most highly with scores from the other computer-administered tests is the Intercept (see Table 5.3). Scores correlatingmost highly with the Intercept are the Choice Reaction Time Total and theShort-Term Memory Grand Mean Reaction Time.
The PS & A Grand Mean Reaction Time also correlates highly with scoresfrom several of the computerized tests. Among the highest of these corre-lations are those with Target Identification Mean Reaction Time and theShort-Term Memory Grand Mean Reaction Time. The PS & A Slope correlatedwith accuracy on the Short-Term Memory Test but was not highly correlatedwith most of the other computer-administered measures.
The Perceptual Speed and Accuracy Intercept value correlates rela-tively highly with all of the cognitive paper-and-pencil measures (seeTable 5.4). Its highest correlations were with Maze, which is a spatialscanning test (r - -.57), Orientation Test 1 (r - -.5,) and ReasoningTest 1 (r - -.48).
The Slope was most highly correlated with Reasoning Test 2 (r - .27).Accuracy on the PS & A test was most highly correlated with ReasoningTest 2 and Orientation Test 1 (r = .31), and Assembling Objects (r = .30).Object Rotation (r - -.35) and Maze (r = -.33) produced moderate correla-tions with the PS & A Grand Mean Reaction Time.
Generally speaking, the pattern of correlations for the PerceptualSpeed and Accuracy scores is similar to that seen for the Memory SearchTest. The PS & A Intercept and Grand Mean RT scores show patterns fairly
5-30
198
i
similar to those for the same scores oncept shows a much stronger relationshippencil test scores than does the memorygenerally shows lower correlations withmemory Slope.
the Memory Test, but PS & A Inter-with the cognitive, paper-and-Intercept. Also, PS & A Slopeall other measures as does the
Modifications for Fort Knox Field Test. Several changes were mau. ,othis test following the Fort Lewis pilot test. A reduction in the numberof items was considered desirable in order to cut down the testing time,and the reliability of the test scores (see Table 5.8) indicated that thetest length could be considerably reduced without causing the reliabilitiesto fall below acceptable levels. Item deletion was accomplished in twoways. First, all the seven-digit items were deleted (16 items). Examina-tion of Figure 5.7 shows that such deletions should have little effect onthe test scores, since the relationship between number of digits and reac-tion time is linear, and the items containing two, five, end nine digitsshould provide sufficient data points. Second, 16 more items were deletedby deleting four items from each of the remaining three digit categories(two, five, and nine) and from the "word" items. The following factorswere considered in selecting items for deletion:
Item intercorrelations within stimulus type and digit sizewere examined. In many cases, one item did not correlatehighly with the others. Items that produced the lowest inter-correlations were deleted. Use of this criterion resulted in13 item deletions.
When item intercorrelations did not differ substantially,accuracy rates and variances were reviewed but did not indi-cate any clear candidates for deletion.
When all the above were approximately equal, the decision toretain an item was based on its correct response (i.e., "same"or "different"). If retaining the item would have caused animbalance between the responses, it was deleted. This was, ineffect, a random selection.
Deletion of the 32 items lefta 48 item test.
Several other changes were made, either to correct perceived short-comings or to otherwise improve the test. The symbolic nine-digit itemswere modified to make them more difficult. As previously noted, theseitems had originally been developed in such a way that the symbols were in"chunks," thus making the items, in effect, much shorter than the intendednine digits; these groups were broken up. Five items were changed so thatthe correct response was "different" rather than "same" in order to balancetype of correct response within digit level. Finally, the time allowed tomake a response to an item was increased from 7 seconds to 9 seconds inorder to give subjects sufficient time to respond, especially for the moredifficult items.
The revised test, then, contained 48 items; 36 were divided into12 Type (alpha, numeric, symbolic, mixed) by Numbe- of Digits (two, five,nine) cells, and 12 were word items.
5-31
199
We also changed the presentation of the items so that they disappearedfrom the display screen as soon as the subject released the 'home" button.This was intended to correct the problem of confounding decision rime withmovement time that was discussed above.
Target Identification Test
I4st Description. The Target Identification Test is a measure ofperceptual speed and z-curacy. The objects perceived are meaningful fig-ures, however, rather than a series of numbers, letters, or symbols as inthe the preceding test.
In this test, each item shows a target object near the top of thescreen and three labeled stimuli in a row near the bottom of the screen.Examples are shown in Figure 5.9. The subject is to identify which of thethree stimuli repres2rts the same object as the target and to press asquickly as possible the button (blue, yellow, or white) that corresponds tothat object. A flow chart indicating the series of events in this test ispresented in Figure 5.10.
Five parameters were varied in depicting objects for the test. Thefirst was type of object. The objects shown on the screen are based onmilitary vehicles and aircraft as shown on the standard set of flashcardsused to train soldiers to recognize equipment presently being used byvarious nations. We sorted these.cards into four basic types.: tanks andother tracked vehicles, fixed-wing aircraft, helicopters, and "wheeled"vehicles. Then we prepared computerized drawings of representative objectsin each type. These drawings were rot intended to be completely accuraterenditions but rather to depict the figures in a less complex drawing whileretaining the basic distinguishing features. Twenty-two drawings of ob-jects were prepared.
.The second parameter was the position of the correct response--thatis, on the left, middle, or right side of the screen. The third parameterwas. the orientation of the target object--whether it is "facing" in thesame direction as the stimuli (the objects to be matched with the target)or in the opposite direction. This reduces to the target object "facing"left (one's left as one looks at the screen) or "facing" right.
The fourth parameter was the angle of rotation (from horizontal) ofthe target object. Seven different angular rotations were used for theFort Lewis administration of this test: 0°, 20°, 25°, 30°, 35°, 40°, and4E°. Example 1 in Figure 5.9 shows a rotated target object and Example 2shows an unrotated object (00).
The fifth parameter was the size of the target object. Ten differentlevels of size reduction were used in the Fort Lewis administration: 40%,50%, 55%, 60%, 65%, 75%, 80%, 8:1, 90%, and 100%. Forty percent reductionmeans that the target object was 40 percent of the size of the stimulusobjects at the bottom of the screen.
We had no intention of creating a test that had items tapping eachcell of a crossed design for these five parameters. Instead, we viewedthis tryout of the test as an opportunity to explore a number of differentfactors that could conceivably affect test performance. A total of 44
2
5-32
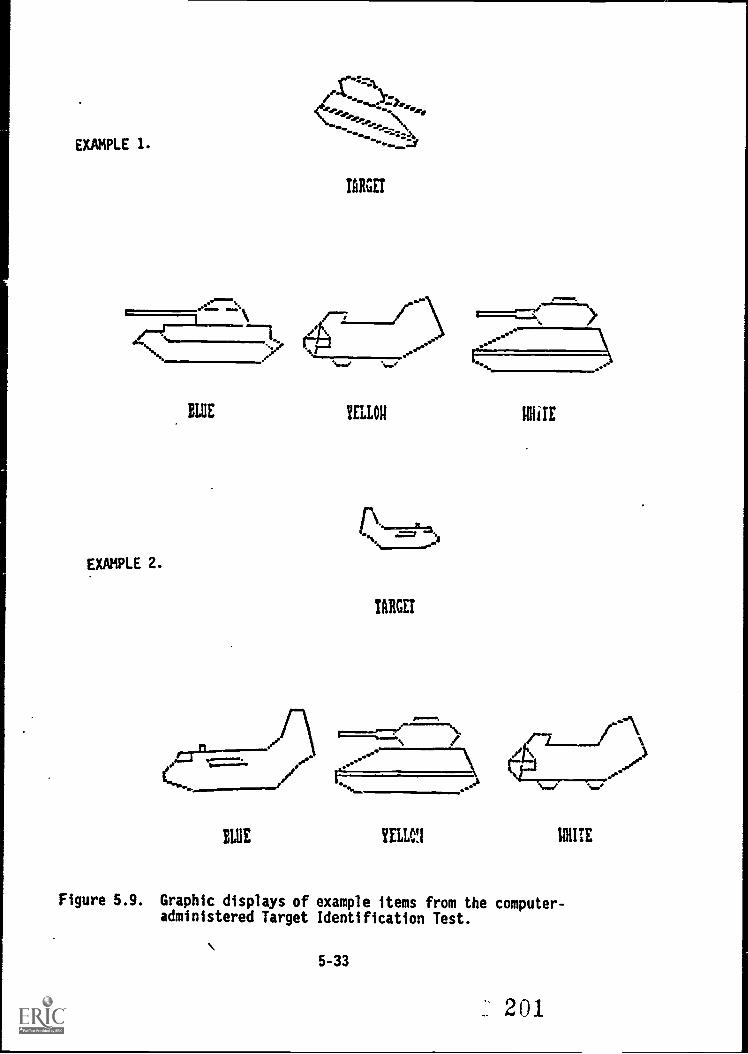
EXAMPLE 1.
r'-,., --.. ..,z,-t.... ..,,,,,
,...
<--,---,:\..................k.,
TARGET
EXAMPLE 2.
BLUE
_),...--*
Traou RI liTE
1\....1.=N ..4
\--...0"
TARGET
"A 1.-......::.0...A.....e- \ /
t". t. /P. ....-
"""*"........./ (..
BLUE YELLC!1
Ism°
MITE
Figure 5.9. Graphic displays of example items from the computer-administered Target Identification Test.
5-33
:, 201
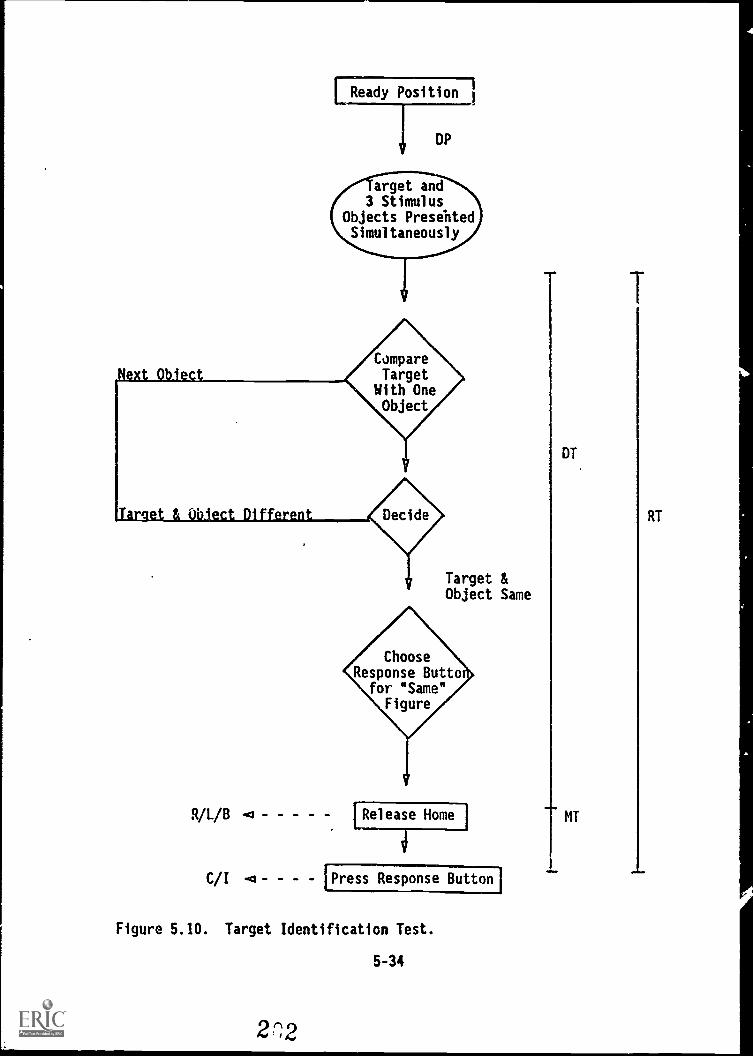
LReady Position 1
I
DP
arget and3 Stimulus
Objects PresebtedSimultaneously
Target &Object Same
R/L/B a
ChooseResponse Butto
for "Same"Figure
1Release Home I
4
'Press Response Button'
Figure 5.10. Target Identification Test.
5-34
2r2
T
DT
MT
RT
items were included on the test.
Test Characteristics. Table 5.10 shows data from the Fort Lewis pilottest of the Target Identification Test. With reference to the first partof the table, we see that the average time to read the instructions wasabout 2 minutes, with a range of 1.1 to 9.2 minutes. The time required totake the actual test averaged 3.6 minutes, and ranged from 3 to 5.5.Hence, the total test time (instruction plus actual test) ranged from 4.1to 12.8 minutes and averaged 5.6.
The subject has 9.99 seconds to make a response on this test. Veryfew time-outs occurred, much less than one per person on the average, andwith a maximum of two. The number of invalid responses was fairly high forthis test, 3.2 on the average.
Dependent Variables. The primary dependent variables or scores forthis test were Total Reaction Time (includes both decision and movementtimes) for correct responses, and the percent of responses that were cor-rect. Total Reaction Time was used rather than decision time because itseems to be more ecologically valid (i.e., the Army is interested in howquickly a soldier can perceive, decide, and take some action and not justin the decision time). Also, various analyses of variance, discussedbelow, showed similar results for the two measures.
The second part of Table 5.10 shows data from the two dependent mea-sures of concern: Total Reaction Time and Percent Correct. The test wasconceived as a speeded test, in the sense that each item could be answeredcorrectly if the subject took sufficient time to study the items and,therefore, the reaction time measure was intended to show the most vari-ance. The data show that these intentions were achieved, since the meanPercent Correct was 92.6 with a standard deviation of 8.3, while the Reac-tion Time mean was 218 hundredths of a second with a standard deviation of68.8. The reliability estimates show that the Reaction Time measure washighly reliable (.97), and it was about 20 points higher than the relia-
ity for Percent Correct.
We performed a number of analyses of variance in order to investigatethe effects of the five parameters described above on the most importantdependent variable, Mean Taal Reaction Time. Because of the number ofparameters and levels within each paraieter, a completely crossed designwas not feasible. Insteau, we carried out several one-way and two-wayANOVAs. Basically, the analyses showed that all the parameters had signif-icant effects (well beyond the .01 level) on the mean reaction time score,but that many parameters included too many levels in the sense that therewas little difference between scores for adjacent levels of a parameter.The results of these analyses were used to guide the revision of this test,described below.
Correlations With Other Measures. Correlations between Mean ReactionTime and Percent Correct on the Target Identification Test and scores onother Pilot Trial Battery tests were computed. Correlations of Mean Reac-tion Time with other computer tests ranged from .06 to .58 (see Table 5.3).The strongest relationships were with Perceptual Speed and Accuracy andShort-Term Memory, while the weakest were with several Simple and ChoiceReaction Time measures. Percent correct correlated most highly with Short-
5-35
2,(3
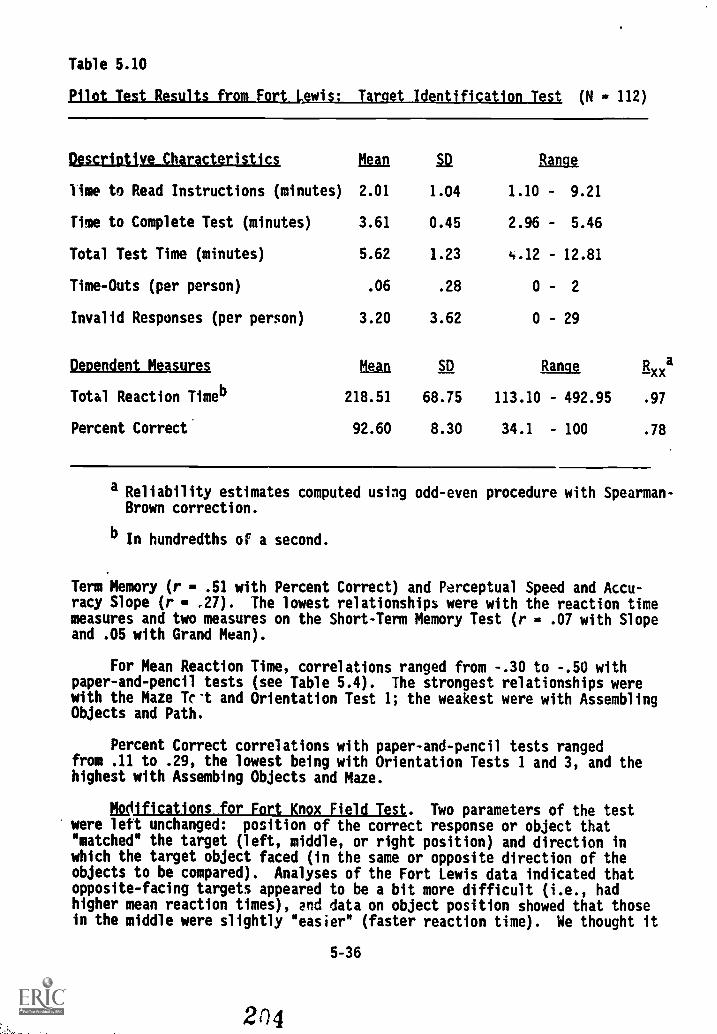
Table 5.10
Pilot Test Results from Fort Lewis: Target Identification Test (N - 112)
Descriptive_Cbaracteristics Mean 50 Range
lime to Read Instructions (minutes) 2.01 1.04 1.10 - 9.21
Time to Complete Test (minutes) 3.61 0.45 2.96 5.46
Total Test Time (minutes) 5.62 1.23 4.12 - 12.81
Time-Outs (per person) .06 .28 0 - 2
Invalid Responses (per person) 3.20 3.62 0 - 29
Dependent Measures Mean 12 Range, R axx
Total Reaction Timeb 218.51 68.75 113.10 - 492.95 .97
Percent Correct 92.60 8.30 34.1 - 100 .78
a Reliability estimates computed using odd-even procedure with Spearman-Brown correction.
b In hundredths of a second.
Term Memory (r = .51 with Percent Correct) and Perceptual Speed and Accu-racy Slope (r - .27). The lowest relationships were with the reaction timemeasures and two measures on the Short-Term Memory Test (r at .07 with Slopeand .05 with Grand Mean).
For Mean Reaction Time, correlations ranged from -.30 to -.50 withpaper-and-pencil tests (see Table 5.4). The strongest relationships werewith the Maze Tr't and Orientation Test 1; the weakest were with AssemblingObjects and Path.
Percent Correct correlations with paper-and-pencil tests rangedfrom .11 to .29, the lowest being with Orientation Tests 1 and 3, and thehighest with Assembing Objects and Maze.
Wifications for Fort Knox Field Test. Two parameters of the testwere left unchanged: position of the correct response or object that"matched" the target (left, middle, or right position) and direction inwhich the target object faced (in the same or opposite direction of theobjects to be compared). Analyses of the Fort Lewis data indicated thatopposite-facing targets appeared to be a bit more difficult (i.e., hadhigher mean reaction times), and data on object position showed that thosein the middle were slightly "easier" (faster reaction time). We thought it
5-36
204
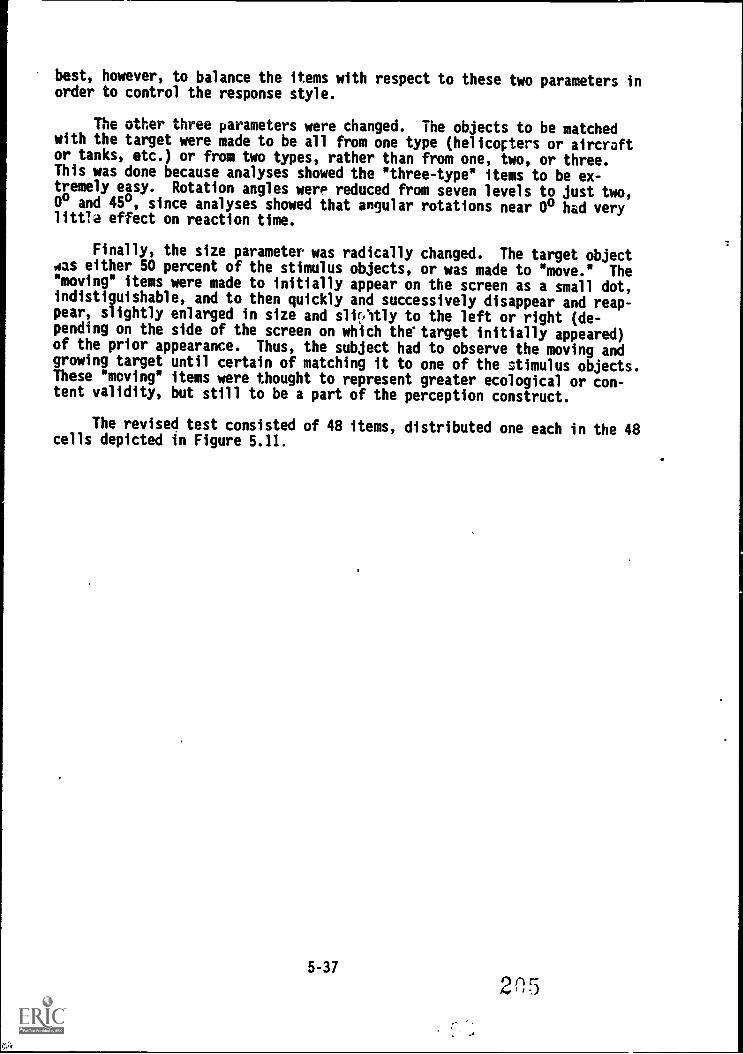
best, however, to balance the items with respect to these two parameters inorder to control the response style.
The other three parameters were changed. The objects to be matchedwith the target were made to be all from one type (helicopters or aircraftor tanks, etc.) or from two types, rather than from one, two, or three.This was done because analyses showed the "three-type" items to be ex-tremely easy. Rotation angles were reduced from seven levels to just two,0° and 45°, since analyses showed that angular rotations near 0° had verylittla effect on reaction time.
Finally, the size parameter was radically changed. The target object4as either 50 percent of the stimulus objects, or was made to "move." The"moving" items were made to initially appear on the screen as a small dot,indistiguishable, and to then quickly and successively disappear and reap-pear, slightly enlarged in size and sliOtly to the left or right (de-pending on the side of the screen on which the'target initially appeared)of the prior appearance. Thus, the subject had to observe the moving andgrowing target until certain of matching it to one of the stimulus objects.These "moving" items were thought to represent greater ecological or con-tent validity, but still to be a part of the perception construct.
The revised test consisted of 48 items, distributed one each in the 48cells depicted in Figure 5.11.
5-37
2n5
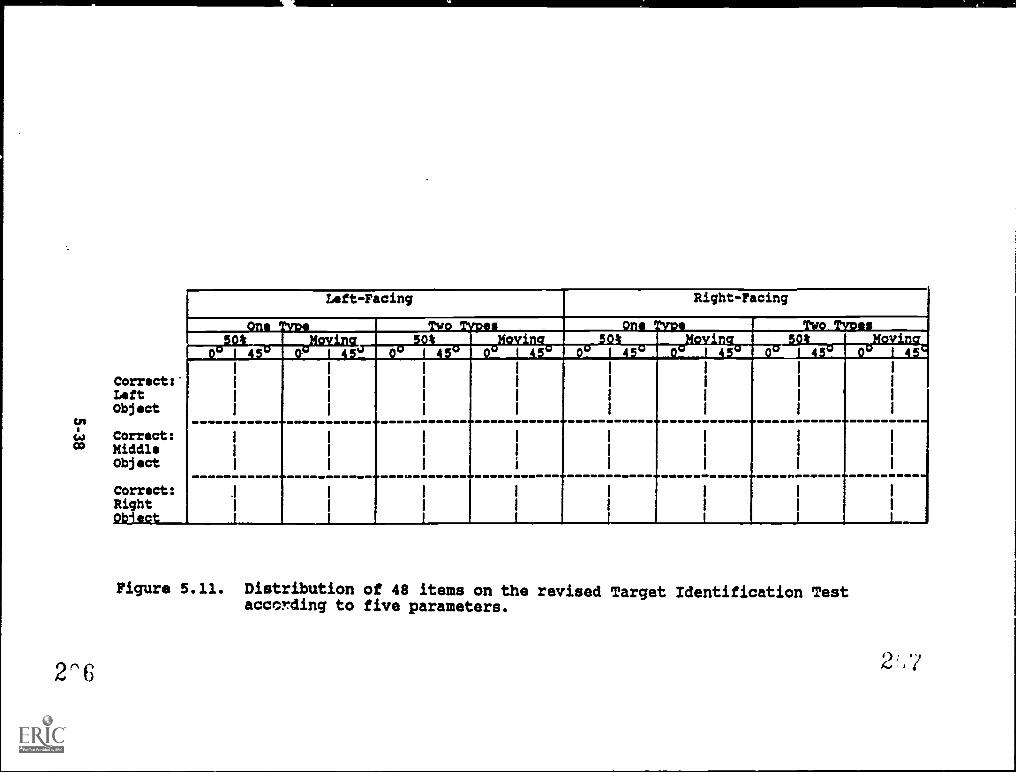
Corrects'LeftObject
QM
Correct:OD Middle
Object
Correct:Rightgblect
Left-Facing Right- Facing
One TM! Two ZwpOS One Type Two Twee50% 50% 001filyiT511; 5045_
''' 068°1_ rap 04251445° 04/11511141gc0
"ovis41:0
I
I
I
I
I
I
I
I
-
I
I
I
I
I
I
I
I
I
I
I
i
I
I
I
I
I
I
I
I
I
I
I
I
I
I
I
II
I
I
I
I
I
I
I
I
I
I
I
I
I
Figure 5.11. Distribution of 48 items on the revised Target Identification Testaccording to five parameters.
2'6
PSYCHOMOTOR PRECISION
This construct is the ability to make muscular movements necessary toadjust or position a machine control mechanism. This ability applies toboth anticipatory movements (i.e., where the subject must respond to astimulus condition which is continuously changing in an unpredictablemanner) and controlled movements (i.e., where the subject must respond to astimulus condition which is changing in a predictable fashion, or makingonly a relatively few discrete, unpredictable changes). Psychomotor preci-sion thus encompasses two of the ability constructs identified by Fleishmanand his associates, control precision and rate control (Fleishman, 1967).
Performance on tracking tasks is very likely related to psychomotorprecision. Since tracking tasks are an important part of many Army MOS,development of psychomotor precision tests was given a high priority. TheFort Lewis computer-administered battery included two measures for pilottesting this ability.
Target Tracking Test 1
The Target Tracking Test 1 was designed to measure subjects' abilityto make fine, highly controlled movements to adjust a machine control mech-anism in response to a stimulus whose speed and direction of movement areperfectly predictable. Fleishman labeled this ability control precision.
During World War II, Army Air Force researchers working in the Avia-tion Psychology Program used several control precision tests in an attemptto predict performance for several aircrew jobs (Melton, 1947). The testwhich proved to be the most valid predictor was the Rotary Pursuit Test.In this test the subject is presented with a round metal target whichrevolves near the edge of a phonograph-like disk. The subject is given ametal stylus and told to maintain contact with the target as it rotates.The Rotary Pursuit Test served as a model for Target Tracking Test 1.
Test Description. For each trial of this pursuit tracking test,subjects are shown a path consisting entirely of vertical and horizontalline segments. At the beginning of the path is a target box, and centeredin ti,e box is a crosshair. As the trial begins, the target starts to movealong the path at a constant rate of speed. The subject's task is to keepthe crosshairs centered within the target at all times. The subject uses ajoy stick, controlled with one hand, to control movement of the crosshairs.Figure 5.12 presents a schematic representation of this task.
Several item parameters were varied from trial to trial. These in-clude the speed of the crosshairs, the maximum speed of the target, thedifference between crosshairs and target speeds, the total length of thepath, the number of line segments comprising the path, and the averageamount of time the target spends traveling along each segment. Obviously,these parameters are not all independent; for example, crosshairs speed andmaximum target speed determine the difference between crosshairs and targetspeeds.
5-39
208
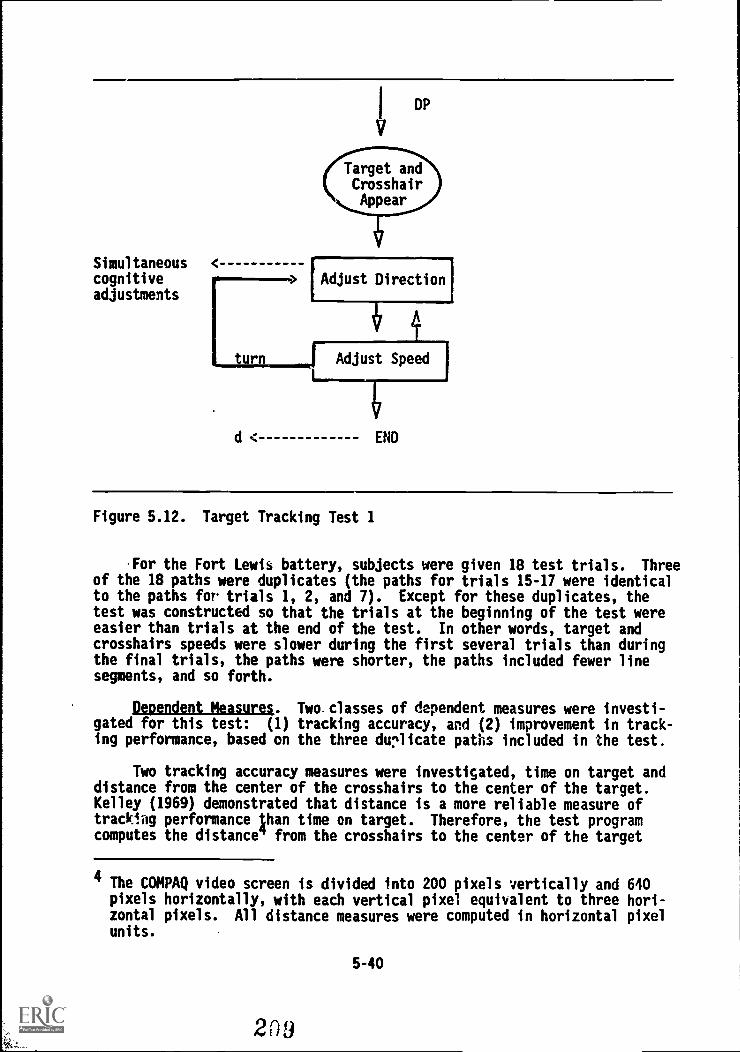
IDP
V
Target andCrosshairAppear
Simultaneouscognitiveadjustments
<
DirectionIAdjust
turn
il
Adjust Speed
d < END
Figure 5.12. Target Tracking Test 1
For the Fort Lewis battery, subjects were given 18 test trials. Threeof the 18 paths were duplicates (the paths for trials 15-17 were identicalto the paths for trials 1, 2, and 7). Except for these duplicates, thetest was constructed so that the trials at the beginning of the test wereeasier than trials at the end of the test. In other words, target andcrosshairs speeds were slower during the first several trials than duringthe final trials, the paths were shorter, the paths included fewer linesegments, and so forth.
Dependent Measures. Two. classes of dependent measures were investi-gated for this test: (1) tracking accuracy, and (2) improvement in track-ing performance, based on the three drlicate paths included in the test.
Two tracking accuracy measures were investigated, time on target anddistance from the center of the crosshairs to the center of the target.Kelley (1969) demonstrated that distance is a more reliable measure oftracking performance than time on target. Therefore, the test programcomputes the distance from the crosshairs to the center of the target
4The COMPAQ video screen is divided into 200 pixels vertically and 640pixels horizontally, with each vertical pixel equivalent to three hori-zontal pixels. All distance measures were computed in horizontal pixelunits.
5-40
209
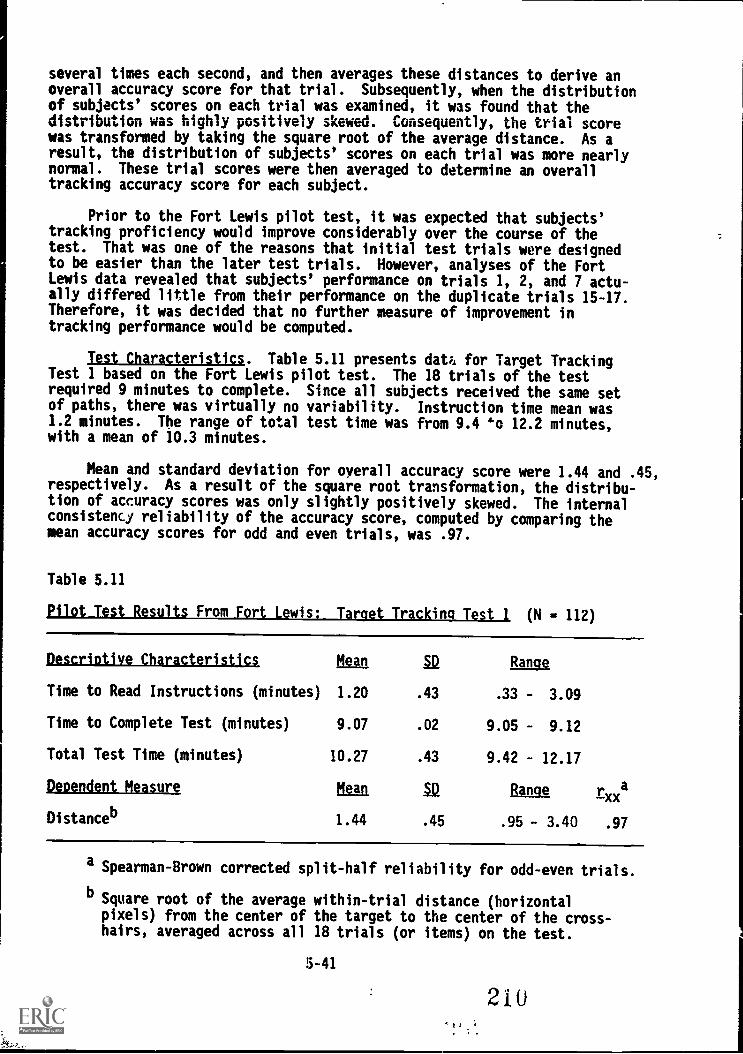
several times each second, and then averages these distances to derive anoverall accuracy score for that trial. Subsequently, when the distributionof subjects' scores on each trial was examined, it was found that thedistribution was highly positively skewed. Consequently, the trial scorewas transformed by taking the square root of the average distance. As aresult, the distribution of subjects' scores on each trial was more nearlynormal. These trial scores were then averaged to determine an overalltracking accuracy score for each subject.
Prior to the Fort Lewis pilot test, it was expected that subjects'tracking proficiency would improve considerably over the course of thetest. That was one of the reasons that initial test trials were designedto be easier than the later test trials. However, analyses of the FortLewis data revealed that subjects' performance on trials 1, 2, and 7 actu-ally differed little from their performance on the duplicate trials 15-17.Therefore, it was decided that no further measure of improvement intracking performance would be computed.
Test Characteristics. Table 5.11 presents data. for Target TrackingTest 1 based on the Fort Lewis pilot test. The 18 trials of the testrequired 9 minutes to complete. Since all subjects received the same setof paths, there was virtually no variability. Instruction time mean was1.2 minutes. The range of total test time was from 9.4 40 12.2 minutes,with a mean of 10.3 minutes.
Mean and standard deviation for overall accuracy score were 1.44 and .45,respectively. As a result of the square root transformation, the distribu-tion of accuracy scores was only slightly positively skewed. The internalconsistency reliability of the accuracy score, computed by comparing themean accuracy scores for odd and even trials, was .97.
Table 5.11
Pilot Test Resultsirom Fort Lewis: Target Tracking Test 1 (N - 112)
Descriptive Characteristics Mean 5a Range
Time to Read Instructions (minutes) 1.20 .43 .33 - 3.09
Time to Complete Test (minutes) 9.07 .02 9.05 - 9.12
Total Test Time (minutes) 10.27 .43 9.42 - 12.17
Dependent Measure kill IQ Rangerxxa
Distanceb 1.44 .45 .95 - 3.40 .97
a Spearman-Brown corrected split-half reliability for odd-even trials.
bSquare root of the average within-trial distance (horizontalpixels) from the center of the target to the center of the cross-hairs, averaged across all 18 trials (or items) on the test.
5-41
210
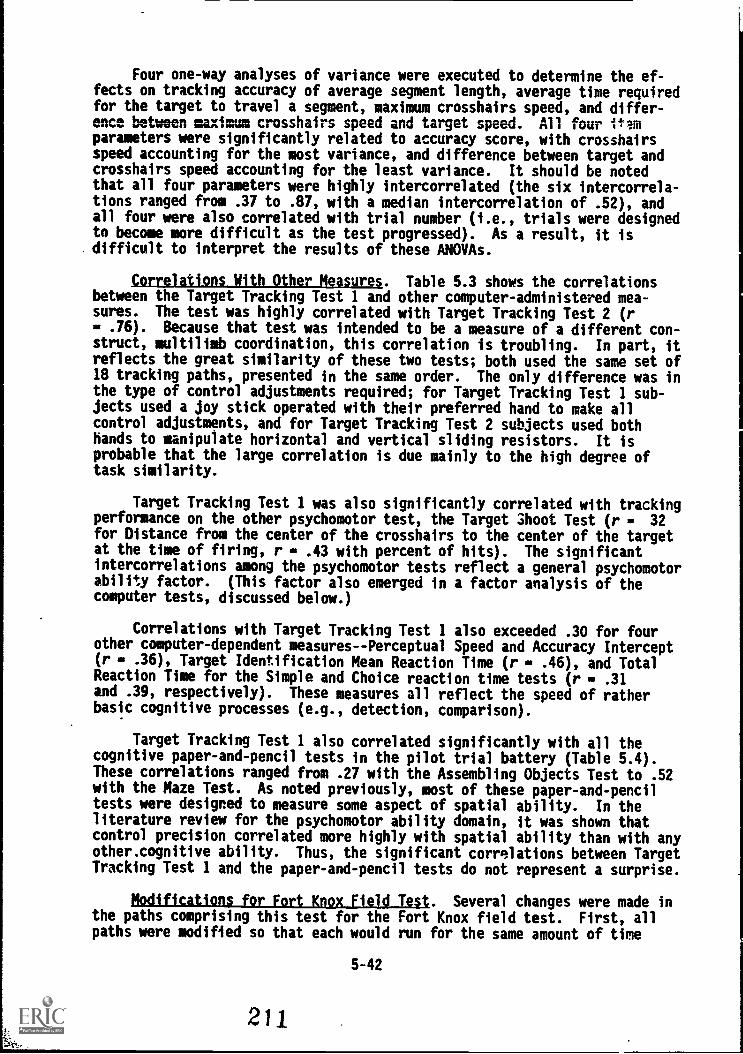
Four one-way analyses of variance were executed to determine the ef-fects on tracking accuracy of average segment length, average time requiredfor the target to travel a segment, maximum crosshairs speed, and differ-ence between maximum crosshairs speed and target speed. All four itiaparameters were significantly related to accuracy score, with crosshairsspeed accounting for the most variance, and difference between target andcrosshairs speed accounting for the least variance. It should be notedthat all four parameters were highly intercorrelated (the six intercorrela-tions ranged from .37 to .87, with a median intercorrelation of .52), andall four were also correlated with trial number (i.e., trials were designedto become more difficult as the test progressed). As a result, it isdifficult to interpret the results of these ANOVAs.
Correlations With Other Measures. Table 5.3 shows the correlationsbetween the Target Tracking Test 1 and other computer-administered mea-sures. The test was highly correlated with Target Tracking Test 2 (r= .76). Because that test was intended to be a measure of a different con-struct, multilimb coordination, this correlation is troubling. In part, itreflects the great similarity of these two tests; both used the same set of18 tracking paths, presented in the same order. The only difference was inthe type of control adjustments required; for Target Tracking Test 1 sub-jects used a joy stick operated with their preferred hand to make allcontrol adjustments, and for Target Tracking Test 2 subjects used bothhands to manipulate horizontal and vertical sliding resistors. It isprobable that the large correlation is due mainly to the high degree oftask similarity.
Target Tracking Test 1 was also significantly correlated with trackingperformance on the other psychomotor test, the Target Shoot Test (r = 32for Distance from the center of the crosshairs to the center of the targetat the time of firing, r - .43 with percent of hits). The significantintercorrelations among the psychomotor tests reflect a general psychomotorability factor. (This factor also emerged in a factor analysis of thecomputer tests, discussed below.)
Correlations with Target Tracking Test 1 also exceeded .30 for fourother computer-dependent measures--Perceptual Speed and Accuracy Intercept(r = .36), Target Identification Mean Reaction Time (r - .46), and TotalReaction Time for the Simple and Choice reaction time tests (r = .31and .39, respectively). These measures all reflect the speed of ratherbasic cognitive processes (e.g., detection, comparison).
Target Tracking Test 1 also correlated significantly with all thecognitive paper-and-pencil tests in the pilot trial battery (Table 5.4).These correlations ranged from .27 with the Assembling Objects Test to .52with the Maze Test. As noted previously, most of these paper-and-penciltests were designed to measure some aspect of spatial ability. In theliterature review for the psychomotor ability domain, it was shown thatcontrol precision correlated more highly with spatial ability than with anyother.cognitive ability. Thus, the significant correlations between TargetTracking Test 1 and the paper-and-pencil tests do not represent a surprise.
Modifications for Fort Knox Field Test. Several changes were made inthe paths comprising this test for the Fort Knox field test. First, allpaths were modified so that each would run for the same amount of time
5-42
211
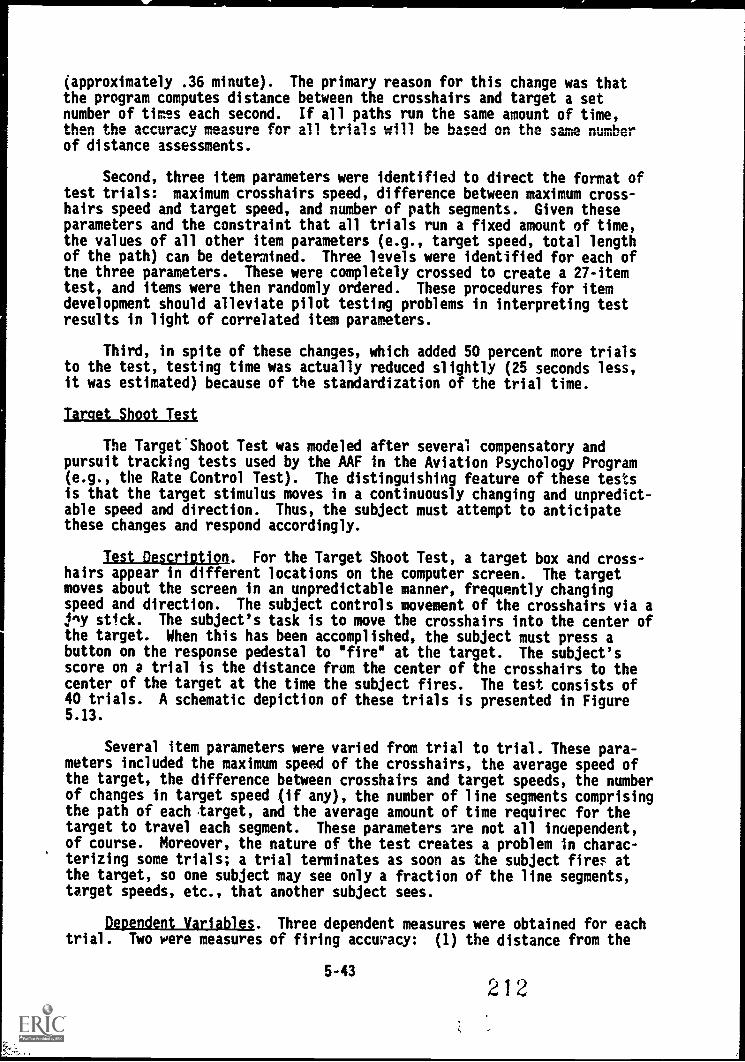
(approximately .36 minute). The primary reason for this change was thatthe program computes distance between the crosshairs and target a setnumber of times each second. If all paths run the same amount of time,then the accuracy measure for all trials will be based on the same numberof distance assessments.
Second, three item parameters were identified to direct the format oftest trials: maximum crosshairs speed, difference between maximum cross-hairs speed and target speed, and number of path segments. Given theseparameters and the constraint that all trials run a fixed amount of time,the values of all other item parameters (e.g., target speed, total lengthof the path) can be determined. Three levels were identified for each oftne three parameters. These were completely crossed to create a 27-itemtest, and items were then randomly ordered. These procedures for itemdevelopment should alleviate pilot testing problems in interpreting testresults in light of correlated item parameters.
Third, in spite of these changes, which added 50 percent more trialsto the test, testing time was actually reduced slightly (25 seconds less,it was estimated) because of the standardization of the trial time.
Target Shoot Test
The Target Shoot Test was modeled after several compensatory andpursuit tracking tests used by the AAF in the Aviation Psychology Program(e.g., the Rate Control Test). The distinguishing feature of these testsis that the target stimulus moves in a continuously changing and unpredict-able speed and direction. Thus, the subject must attempt to anticipatethese changes and respond accordingly.
Test Description. For the Target Shoot Test, a target box and cross-hairs appear in different locations on the computer screen. The targetmoves about the screen in an unpredictable manner, frequently changingspeed and direction. The subject controls movement of the crosshairs via ajny stick. The subject's task is to move the crosshairs into the center ofthe target. When this has been accomplished, the subject must press abutton on the response pedestal to "fire" at the target. The subject'sscore on a trial is the distance from the center of the crosshairs to thecenter of the target at the time the subject fires. The test consists of40 trials. A schematic depiction of these trials is presented in Figure5.13.
Several item parameters were varied from trial to trial. These para-meters included the maximum speed of the crosshairs, the average speed ofthe target, the difference between crosshairs and target speeds, the numberof changes in target speed (if any), the number of line segments comprisingthe path of each target, and the average amount of time requirec for thetarget to travel each segment. These parameters are not all inaependent,of course. Moreover, the nature of the test creates a problem in charac-terizing some trials; a trial terminates as soon as the subject fires atthe target, so one subject may see only a fraction of the line segments,target speeds, etc., that another subject sees.
Dependent Variables. Three dependent measures were obtained for eachtrial. Two were measures of firing accuracy: (1) the distance from the
5-43
212

'Adjust Direction
Adjust Speed
ries
1Ne
No Shoot
d
Yes
[Press Response Button
d
Hit/Miss
Figure 5.13. Target Shoot Test.
5-44
213
RT
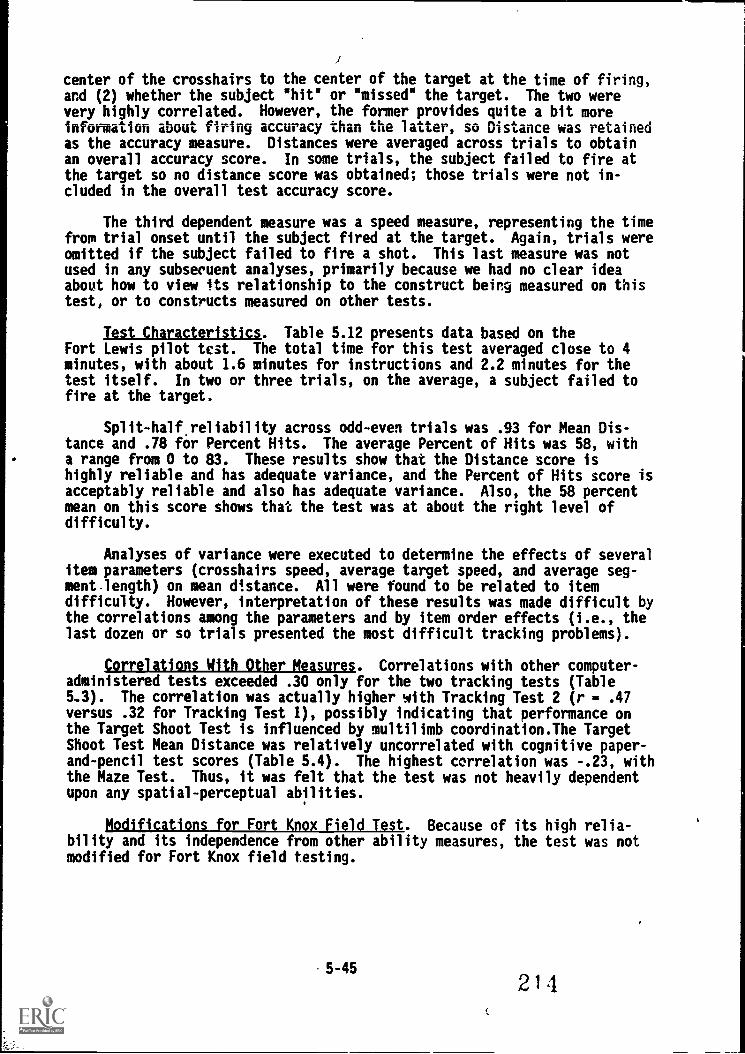
center of the crosshairs to the center of the target at the time of firing,and (2) whether the subject "hit" or "missed" the target. The two werevery highly correlated. However, the former provides quite a bit moreinformation about firing accuracy than the latter, so Distance was retainedas the accuracy measure. Distances were averaged across trials to obtainan overall accuracy score. In some trials, the subject failed to fire atthe target so no distance score was obtained; those trials were not in-cluded in the overall test accuracy score.
The third dependent measure was a speed measure, representing the timefrom trial onset until the subject fired at the target. Again, trials wereomitted if the subject failed to fire a shot. This last measure was notused in any subsenuent analyses, primarily because we had no clear ideaabout how to view its relationship to the construct being measured on thistest, or to constructs measured on other tests.
Test Characteristics. Table 5.12 presents data based on theFort Lewis pilot test. The total time for this test averaged close to 4minutes, with about 1.6 minutes for instructions and 2.2 minutes for thetest itself. In two or three trials, on the average, a subject failed tofire at the target.
Split -half reliability across odd-even trials was .93 for Mean Dis-tance and .78 for Percent Hits. The average Percent of Hits was 58, witha range from 0 to 83. These results show that the Distance score ishighly reliable and has adequate variance, and the Percent of Hits score isacceptably reliable and also has adequate variance. Also, the 58 percentmean on this score shows that the test was at about the right level ofdifficulty.
Analyses of variance were executed to determine the effects of severalitem parameters (crosshairs speed, average target speed, and average seg-ment.length) on mean distance. All were found to be related to itemdifficulty. However, interpretation of these results was made difficult bythe correlations among the parameters and by item order effects (i.e., thelast dozen or so trials presented the most difficult tracking problems).
Correlations With Other Measures. Correlations with other computer-administered tests exceeded .30 only for the two tracking tests (Table5..3). The correlation was actually higher with Tracking Test 2 (r - .47versus .32 for Tracking Test 1), possibly indicating that performance onthe Target Shoot Test is influenced by multilimb coordination.The TargetShoot Test Mean Distance was relatively uncorrelated with cognitive paper-and-pencil test scores (Table 5.4). The highest correlation was -.23, withthe Maze Test. Thus, it was felt that the test was not heavily dependentupon any spatial-perceptual abilities.
Modifications for Fort Knox Field Test. Because of its high relia-bility and its independence from other ability measures, the test was notmodified for Fort Knox field testing.
5 -45
214
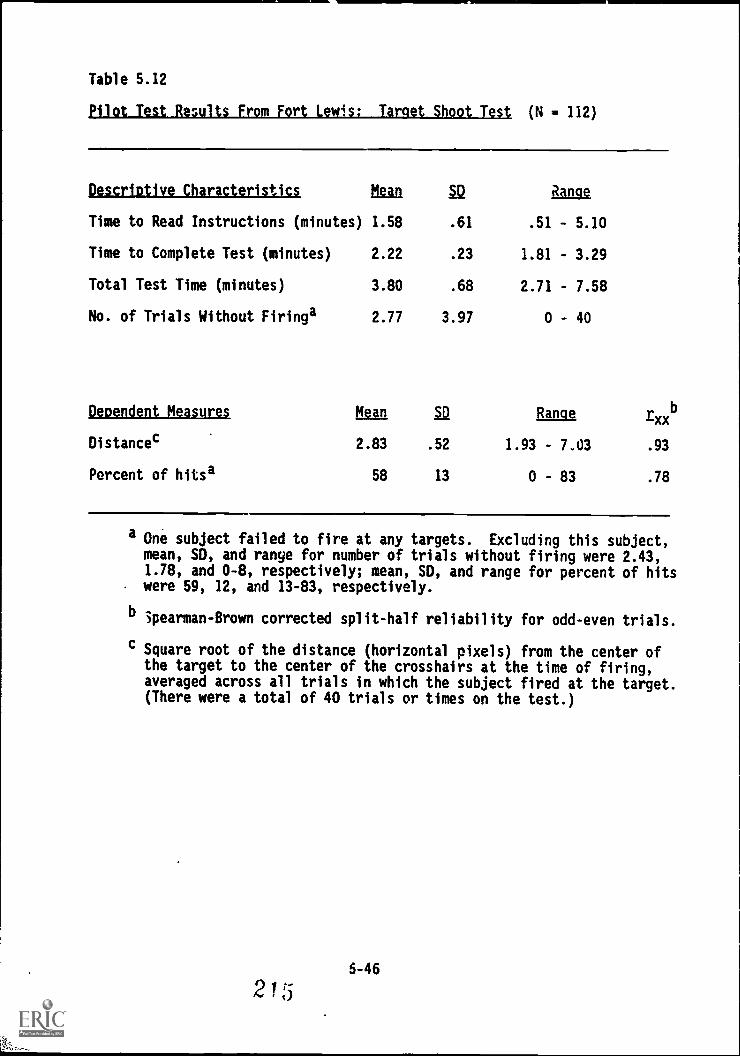
Table 5.12
Pilot Test Results From Fort Lewis: Target Shoot Test (N - 112)
Descriptive Characteristics Mean IQ Range
Time to Read Instructions (minutes) 1.58 .61 .51 5.10
Time to Complete Test (minutes) 2.22 .23 1.81 3.29
Total Test Time (minutes) 3.80 .68 2.71 7.58
No. of Trials Without Firinga 2.77 3.97 0 - 40
Dependent Measures Mean
.52
13
Range rxxb
.93
.78
Distances
Percent of hitsa
:::
58
1.93 - 7.03
0 - 83
a One subject failed to fire at any targets. Excluding this subject,mean, SD, and range for number of trials without firing were 2.43,1.78, and 0-8, respectively; mean, SD, and range for percent of hitswere 59, 12, and 13-83, respectively.
b Spearman -Brown corrected split-half reliability for odd-even trials.
c Square root of the distance (horizontal pixels) from the center ofthe target to the center of the crosshairs at the time of firing,averaged across all trials in which the subject fired at the target.(There were a total of 40 trials or times on the test.)
5-46
MULTILIMB COORDINATION
The multilimb coordination construct reflects the ability to coor-dinate the simultaneous movement of two or more limbs. This ability isgeneral to tasks requiring coordination of any two limbs (e.g., two hands,two feet, one hand and one foot). The ability does not apply to tasks inwhich trunk movement must be integrated with limb movements. It is mostcommon in tasks where the body is at rest (e.g., seated or rtanding) whiletwo or more limbs are in motion.
In the past, measures of multilimb coordination have shown quite highvalidity for predicting job and training performance, especially for pilots(Melton, 1947).
Target Track'lo Test a
Target Tracking Test 2 is modeled after a test of multilimb coordina-tion developed by the AAF, the Two-Hand Coordination Test. This testrequired subjects to perform a pursuit tracking task in which horizontaland vertical movements of the target-follower were controlled by two han-dles. Validities of this test for predicting AAF pilot training successwere mostly in the .30s (Melton, 1947).
Test Description. Target Tracking Test 2 is very similar to the Two-Hand Coordination Test. For each trial of Target Tracking Test 2, subjectsare shown a path consisting entirely of vertical and horizontal lines. Atthe beginning of the path is a target box, and centered in the target boxis a crosshairs. As the trial begins, the target starts to move along thepath at a constant rate of speed. The subject manipulates two slidingresistors to control movement of the crosshairs; one resistor controlsmovement in the horizontal plane, and the other in the vertical plane. Thesubject's task is to keep the crosshairs centered within the target at alltimes. Figure 5.14 contains a schematic depiction of the test.
This test and Target Tracking Test 1 are identical except for thenature of the required control manipulations. For Target Tracking Test 1crosshairs movement is controlled via a joy stick, while for Target Track-ing Test 2 crosshairs movement is controlled via the two sliding resistors.For the Fort Lewis battery, the same 18 paths were used in both tests, andthe value of the crosshairs and target speed parameters was the same. Theonly other difference between the two tests was that subjects were per-mitted three practice trials for Target Tracking Test 2.
Dependent Variable. The same dependent measure or score was used forthis test as for Tracking Test 1 (i.e, the square root of the averagewithin-trial distance from the center of the crosshairs to the center ofthe target, averaged across all trials).
Test Characteristics. The 18 trials of the test (Table 5.13) required9 minutes to complete. Since all subjects received the same set of paths,there was yirtually no variability. Instruction time mean was 3.6. Therange of total test time was from 11.5 to 15.5 minutes. with a mean of 12.7minutes.
5-47
216
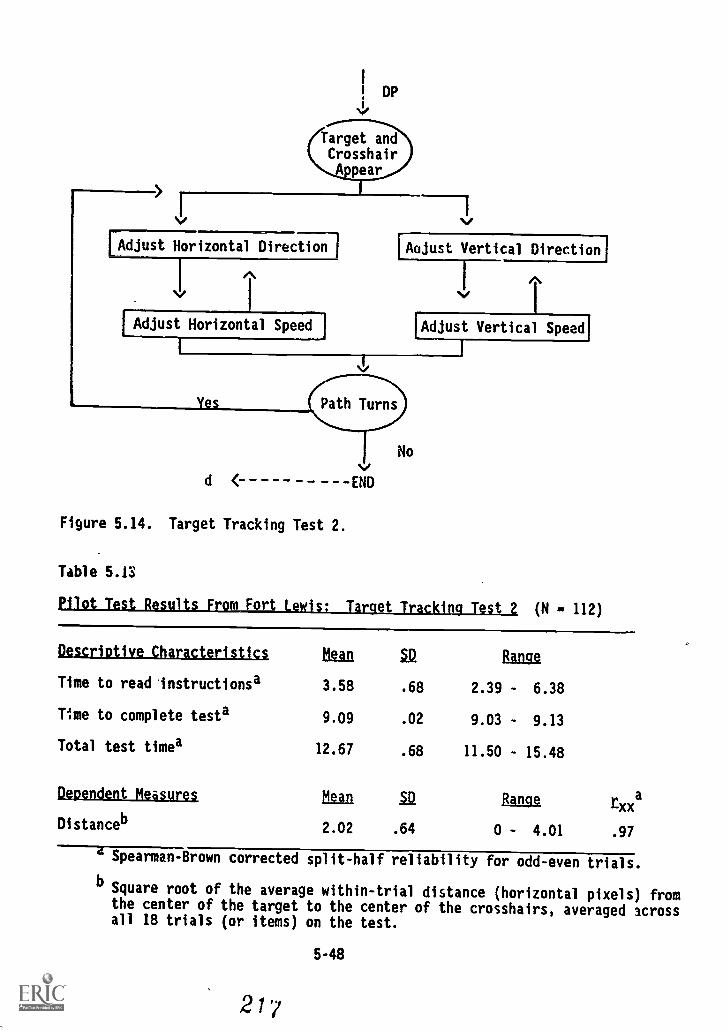
DP
vi
Target andCrosshairA. pear
(Adjust Horizontal Direction LAIdust Vertical Direction'
./
[Adjust, Horizontal Speed 1 [Adjust Vertical Speed'
Path Turns
d <
Figure 5.14. Target Tracking Test 2.
Table 5.13
VEND
No
Pilot Test Results FromLekaijirgjrickinglisliet (N - 112)
Descriptive Characteristics Mean 12 Range
Time to read instructionsa 3.58 .68 2.39 - 6.38
Time to complete testa 9.09 .02 9.03 - 9.13
Total test timea 12.67 .68 11.50 - 15.48
Dependent Measures Mean la Rangerxxa
Distanceb 2.02 .64 0 - 4.01 .97
4 Spearman-Brown corrected split-half reliability for odd-even trials.
bSquare root of the average within-trial distance (horizontal pixels) fromthe center of the target to the center of the crosshairs, averaged acrossall 18 trials (or items) on the test.
5-48
2 1 7
Mean and standard deviation for overall accuracy score were 2.02and .64, respectively. As a result of the square root transformation, thedistribution of accuracy scores was only slightly positively skewed. Theinternal consistency reliability of the accuracy score was .97. Theseresults indicate that Target Tracking Test 2 is highly reliable as isTarget Tracking Test 1, and that it is more difficult than is TargetTracking Test 1 (mean Distance score for Target Tracking Test 2 - 2.02versus 1.44 for Target Tracking Test 1--a difference of about one standarddeviation).
Four one-way analyses of variance were executed to determine theeffecis on tracking accuracy of average segment length, average time re-quired fol the target to travel a segment, maximum crosshairs speed, anddifference between maximum crosshairs speed and target speed. All fouritem parameters were significantly related to accuracy score, with cross-hairs speed accounting for the most variance and average segment length forthe least. It should be noted again that all four parameters were highlyintercorrelated (the six intercorrelations ranged from .37 to .87, with amedian intercorrelation of .52), and all four were also correlated withtrial number (i.e., items became more difficult as the test progressed).As a result, interpreting the results of these ANOVAs is difficult.
Correlations With Other Measures. Table 5.3 shows the correlationsbetween the Target Tracking Test 2 and other computer-administered mea-sures. The test was highly correlated with Target Tracking Test 1 (r. .76). Possible reasons for this correlation were discussed above (seeTarget Tracking Test 1).
Given the high crelation with Target Tracking Test 1, it would beexpected that Target tracking Test 2 would show a similar pattern of corre-lations with other computerized and paper-and-pencil ability measures. AsTables 5.3 and 5.4 show, this is essentially true. The only major dif-ference is that Target Tracking Test 2 failed to correlate significantlywith mean Total Response Time from the Simple Reaction Time Test (r - .11versus r .31 for Target (racking Test 1).
Modifications for Fort Knox Field Test. Changes in Target TrackingTest 2 for the Fort Knox mirrored those made for Target Tracking Test 1.Test trials were changed completely. Test development was directed bythree item parameters--number of segments, crosshairs speed, and differencebetween target and crosshairs speeds. The revised test includes 27 items.However, the items are no longer the same as those presented for TargetTracking Test 1, which should reduce the correlation between these tests.
5-49
218
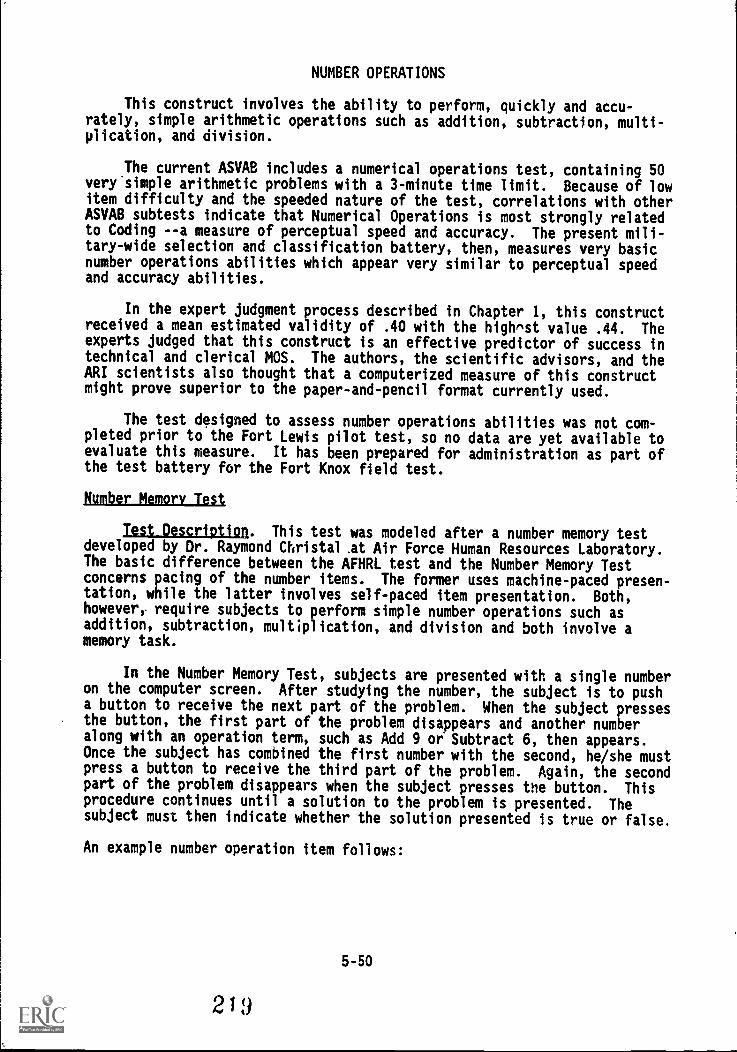
NUMBER OPERATIONS
This construct involves the ability to perform, quickly and accu-rately, simple arithmetic operations such as addition, subtraction, multi-plication, and division.
The current ASVAB includes a numerical operations test, containing 50very'simple arithmetic problems with a 3-minute time limit. Because of lowitem difficulty and the speeded nature of the test, correlations with otherASVAB subtests indicate that Numerical Operations is most strongly relatedto Coding --a measure of perceptual speed and accuracy. The present mili-tary-wide selection and classification battery, then, measures very basicnumber operations abilities which appear very similar to perceptual speedand accuracy abilities.
In the expert judgment process described in Chapter 1, this constructreceived a mean estimated validity of .40 with the highrst value .44. Theexperts judged that this construct is an effective predictor of success intechnical and clerical MOS. The authors, the scientific advisors, and theARI scientists also thought that a computerized measure of this constructmight prove superior to the paper-and-pencil format currently used.
The test designed to assess number operations abilities was not com-pleted prior to the Fort Lewis pilot test, so no data are yet available toevaluate this measure. It has been prepared for administration as part ofthe test battery for the Fort Knox field test.
number Memory Test,
lelLNILli2ii2/1. This test was modeled after a number memory testdeveloped by Dr. Raymond Christal .at Air Force Human Resources Laboratory.The basic difference between the AFHRL test and the Number Memory Testconcerns pacing of the number items. The former uses machine-paced presen-tation, while the latter involves self-paced item presentation. Both,however, require subjects to perform simple number operations such asaddition, subtraction, multiplication, and division and both involve amemory task.
In the Number Memory Test, subjects are presented with a single numberon the computer screen. After studying the number, the subject is to pusha button to receive the next part of the problem. When the subject pressesthe button, the first part of the problem disappears and another numberalong with an operation term, such as Add 9 or Subtract 6, then appears.Once the subject has combined the first number with the second, he/she mustpress a button to receive the third part of the problem. Again, the secondpart of the problem disappears when the subject presses the button. Thisprocedure continues until a solution to the problem is presented. Thesubject must then indicate whether the solution presented is true or false.
An example number operation item follows:
5-50
219
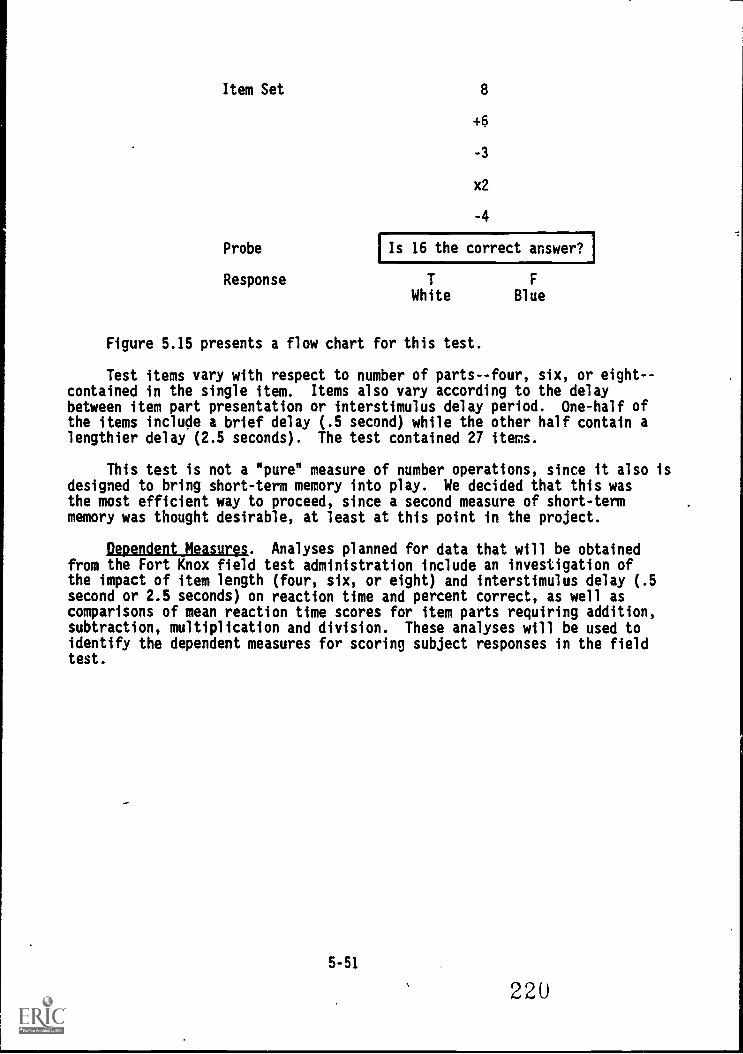
Item Set
Probe
Response
8
+6
-3
x2
-4
Is 16 the correct answer?
TWhite
F
Blue
Figure 5.15 presents a flow chart for this test.
Test items vary with respect to number of parts--four, six, or eight- -contained in the single item. Items also vary according to the delaybetween item part presentation or interstimulus delay period. One-half ofthe items include a brief delay (.5 second) while the other half contain alengthier delay (2.5 seconds). The test contained 27 items.
This test is not a "pure" measure of number operations, since it also isdesigned to bring short-term memory into play. We decided that this wasthe most efficient way to proceed, since a second measure of short-termmemory was thought desirable, at least at this point in the project.
Dependent Measures. Analyses planned for data that will be obtainedfrom the Fort Knox field test administration include an investigation ofthe impact of item length (four, six, or eight) and interstimulus delay (.5second or 2.5 seconds) on reaction time and percent correct, as well ascomparisons of mean reaction time scores for item parts requiring addition,subtraction, multiplication and division. These analyses will be used toidentify the dependent measures for scoring subject responses in the fieldtest.
5-51
220
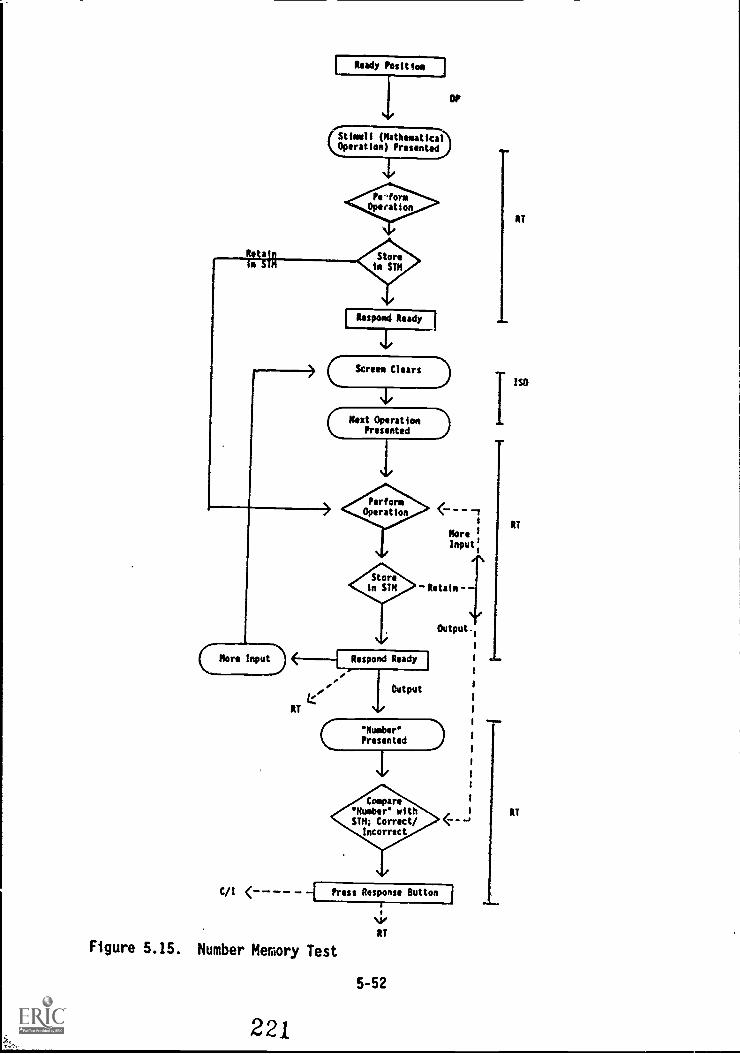
Stimuli (MathematicalOperation) Presented
PerformOperation
IRespond Ready I
OP
2111111(:: Next Operation
Presented
COIRT
PollensOperation
Storein SIN
1
Nor. !Input;
Retain
Output
Respond Ready
Output
OEM
C/1 I Press Response Button I<
NYAT
Figure 5.15. Number Memory Test
5-52
221
AT
ISO
RT
RT
MOVEMENT JUDGMENT
Movement judgment is the ability to judge the relative speed anddirection of one or more moving objects in order to determine where thoseobjects will be at a given point in time and/or when those objects mightintersect.
Movement judgment was not one of the constructs identified and tar-geted for test development by the literature review or expert judgmentsdescribed in Chapter 1. However, a suggestion by Lloyd Humphreys, one ofour scientific advisors, and the job observations we conducted at FortStewart, Ft. Bragg, Ft. Bliss, Ft. Sill, and Ft. Knox, led us to concludethat movement judgment was likely to be related to job performance in anumber of combat MOS (e.g., 16S, 11B, 19D). Therefore, we decided todevelop a movement judgment measure to be included in the Fort Knox fieldtest.
Cannon Shoot Test
The Cannon Shoot Test measures subjects' ability to fire at a movingtarget in such a way that the shell that is fired hits the target when thetarget crosses the cannon's line of fire.
As part of:its Aviation Psychology Program, the Army Air Force becameinterested in motion, distance, and orientation judgment and instituteddevelopment of a battery of motion picture and photograph tests (Gibson,1947). One of the AAF measures was called the Estimate of Relative Velo-cities Test, a paper-and-pencil test. Each trial consisted of four frames.In each frame, two objects (airplanes) were shown flying along the samepath in the same direction. In each subsequent frame, the trailing planeedged nearer the lead plane. The subject's task was to indicate on thefinal frame where the planes would intersect. Validities of this test forpredicting pilot training success averaged approximately .18 (Gibson,1947).
The present test was designed to test the construct that seems tounderly the Estimate of Relative Velocities Test.
Test Description. At the beginning of each trial, a stationary cannonappears on the video screen, with the position of this cannon varying fromtrial to trial. The cannon is "capable" of firing a shell, which travelsat a constant speed on each trial. Shortly after the cannon appears, acircular target moves onto the screen. This target moves in a constantdirection at a constant rate of speed throughout the trial, though thespeed and direction vary from trial to trial. The subject's task is topush a response buttol, to fire the shell in such a way that the shellintersects the target when the target crosses the cannon's line of fire.Figure 5.16 shows a flow chart for this test.
Three parameters determine the nature of each test trial. The firstis the angle of the target movement relative to the position of the cannon;12 different angles were used. The second is the distance from the cannonto the impact point (i.e., the point at which the target crosses thecannon's line of fire); four different distance values were used. Finally,
the third parameter is the distance from the impact point to the fire point
5-53
222
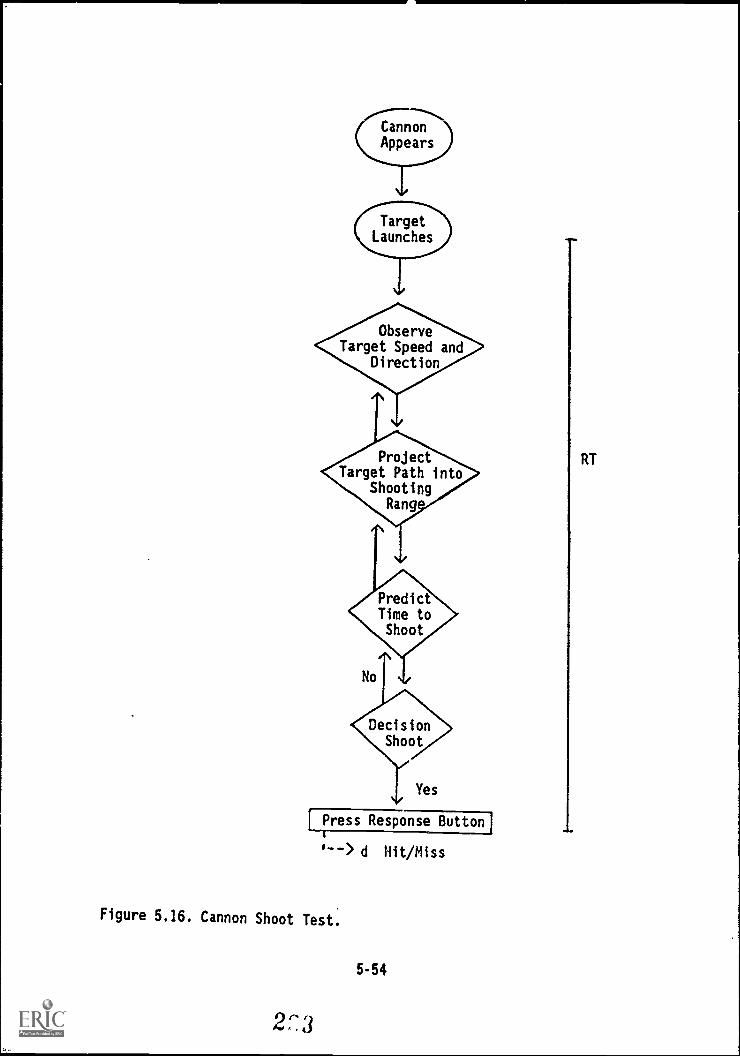
Th.Appears
Yes
IPress Response Button'4
'--> d Hit/Miss
Figure 5.16. Cannon Shoot Test.
5-54
2c' 3
RT
1
(i.e., the point at which the subject must fire the shell in order to hitthe center of the target); there were also four values for this distance
parameter.
If a completely crossed design were used, it would necessitate aminimum of 192 trials (i.e., 12 x 4 x 4 - 192). Instead, a Latin squaredesign was employed, so that the version of the test for the Fort Knoxfield test includes only 48 trials.
Dependent Measures. Three dependent measures are assessed on each
trial. These include: (1) whether the shell hits or misses the target;(2) the distance from the shell to the center of the target at the time thetarget crosses the impact point; and (3) the distance from the center ofthe target to the fire point at the time the shell is fired. The Fort Knoxdata will be analyzed to determine which of these three measures is mostreliable. Since the three will be highly intercorrelated, in the end it islikely that only one of the three will be retained as a dependent measure.
Test Characteristics. Prior to the Fort Knox Field Test, only minimalpreliminary data are available for this test since it was not part of theFort Lewis pilot test. It appears that the test will take approximately 12minutes to complete, including instructions. It also appears that allthree item parameters are related to item difficulty. That is, targets aremore difficult to hit if the angle of the target is greater than 90% (i.e.,the target is moving away from, rather than toward, the cannon), the impactpoint is far from the cannon, or the fire point is far from the impactpoint. Thus, targets that move rapidly are more difficult to hit thantho:e that move slowly. However, all of these findings are based onobservations of only a few subjects and are therefore tentative.
5-55
224
SUMMARY
Table 5.14 shows the means, standard deviations, and split-half reli-abilities for 24 scores computed from the eight computer-administered testswhich were pilot tested at Fort Lewis. As referred to throughout thischapter, Tables 5.3 and 5.4 show the intercorrelations between computertest scores, and the correlations between computer test scores and cogni-tive test scores. We make no further comment here since these data havebeen thoroughly discussed throughout the chapter.
Investigation of Machine Effects
One concern we had prior to the Fort Lewis pilot test was the extentto which computer measure scores would be affected by differences betweentesting stations. A testing station is one Compaq computer and the asso-ciated response pedestal; six such testing stations were used at Fort Le-wis. As we mentioned in Chapter 1, differences across testing apparatusand unreliability of testing apparatus had been a problem in World War IIpsychomotor testing and thereafter. The recent advent of microprocessortechnology was viewed as alleviating such problems, at least to some de-gree.
We ran some analyses of variance to provide an initial look at theextent of this problem with our testing stations. Thirteen one-way ANOVAswere run with testing stations as levels and computer test scores as thedepmndent variables. We ran separate ANOVAs for white males and non-whitemales in order to avoid confounding the results with possible subgroupdifferences. Also, only five testing stations were used since one stationdid not have enough subjects assigned to it. These results are shown inTable 5.15.
Of the 26 ANOVAs, only one reached significance at .05 level, aboutwhat would be expected by chance. These results were heartening. (Notethat the distance measures in Table 5.15 have not been converted to themean square root units; these are the sums of the mean distances across allitems.).
One reason for these results was the use of calibration software.This software adjusted for the idiosyncratic differences of each responsepedestal, insuring a more standardized test administration across testingstations.
Pilot Test Results: Comments
The results of the Fort Lewis pilot test of the computer-administeredmeasures in the Pilot Trial Battery were extremely useful. The resultsshowed very high promise for these measures in several ways:
1. The battery proved to be basically self administering. Thetesting stations and battery software were successful in thatalmost every soldier could complete the entire battery with noassistance from the test monitor.
2. Only one testing station experienced equipment problems duringthe week of testing, showing that fairly large-scale testing
5-56
225
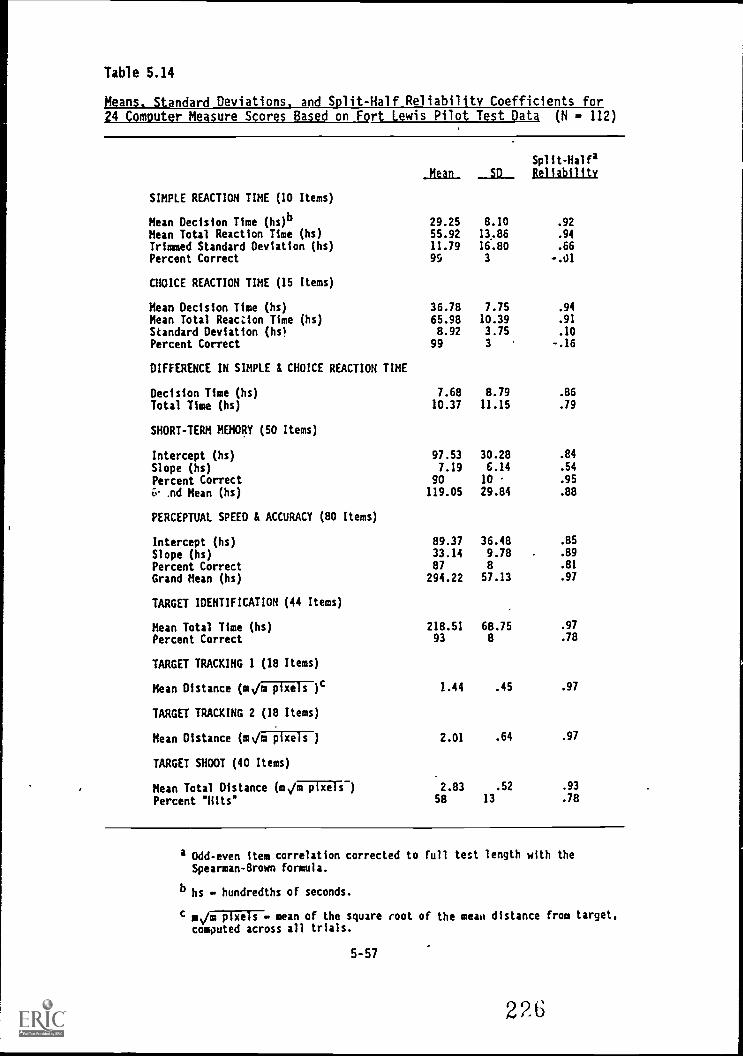
Table 5.14
Means. Standard Deviations, and Split-Half Reliability Coefficients for24 Computer Measure Scores Based on FQrt Lewis Pilot Test Data (N 112)
SIMPLE REACTION TIME (10 Items)
Mean Decision Time (hs)bMean Total Reaction Time (hs)Trimmed Standard Deviation (hs)Percent Correct
CHOICE REACTION TIME (15 Items)
mean SD_Split -Haifa
Reliability
29.2555.9211.7999
8.1013.8616.803
.92
.94
.66
-.01
Mean Decision Time (hs) 36.78 7.75 .94
Mean Total Reaction Time (hs) 65.98 10.39 .91
Standard Deviation (hsl 8.92 3.75 .10
Percent Correct 99 3 -.16
DIFFERENCE IN SIMPLE & CHOICE REACTION TIME
Decision Time (hs) 7.68 8.79 .86
Total Time (hs) 10.37 11.15 .79
SHORT-TERM MEMORY (50 Items)
Intercept (hs) 97.53 30.28 .84
Slope (hs) 7.19 6.14 .54
Percent Correct 90 10 .95
i', .nd Mean (hs) 119.05 29.84 .88
PERCEPTUAL SPEED & ACCURACY (80 Items)
Intercept (hs) 89.37 36.48 .85
Slope (hs) 33.14 9.78 . .89
Percent Correct 87 8 .81
Grand Mean (hs) 294.22 57.13 .97
TARGET IDENTIFICATION (44 Items)
Mean Total Time (hs) 218.51 68.75 .97
Percent Correct 93 8 .78
TARGET TRACKING 1 (18 Items)
Mean Distance (m,/m p xels )c 1.44 .45 .97
TARGET TRACKING 2 (18 Items)
Mean Distance (nViiiiRiiii-) 2.01 .64 .97
TARGET SHOOT (40 Items)
Mean Total Distance (m,/arpces ) 2.83 .52 .93
Percent 'Hits' 58 13 .78
a Odd-even item correlation corrected to full test length with theSpearman-Brown formula.
b hs - hundredths of seconds.
c mOilrrnes- mean of the square root of the mean distance from target,computed across all trials.
5-57
226
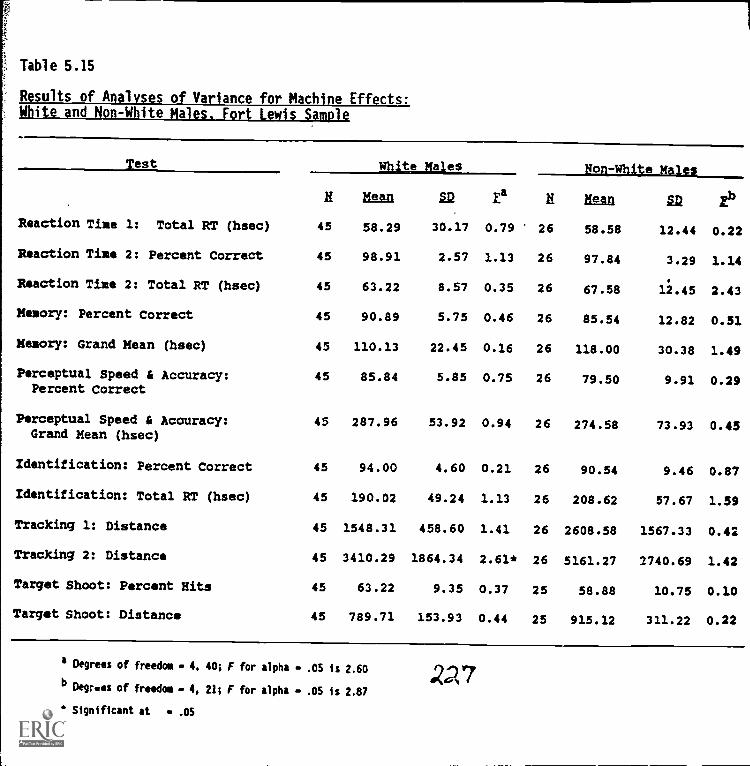
Table 5.15
Results of Analyses of Variance for Machine Effects:White and Non-White Males. Fort Lewis Sample
Test 111±AMilt2 lion -White Males
K Mean 22 EaK Klan KR rb
Reaction Time 1: Total RT (hsec) 45 58.29 30.17 0.79 26 58.58 12.44 0.22
Reaction Time 2: Percent Correct 45 98.91 2.57 1.13 26 97.84 3.29 1.14
Reaction Time 2: Total RT (hsec) 45 63.22 8.57 0.35 26 67.58 12.45 2.43
Mowry: Percent Correct 45 90.89 5.75 0.46 26 85.54 12.82 0.51
Memory: Grand Mean (hsec) 45 110.13 22.45 0.16 26 118.00 30.38 1.49
Perceptual Speed St Accuracy: 45 85.84 5.85 0.75 26 79.50 9.91 0.29Percent Correct
Perceptual Speed St Accuracy: 45 287.96 53.92 0.94 26 274.58 73.93 0.45Grand Mean (hsec)
Identification: Percent Correct 45 94.00 4.60 0.21 26 90.54 9.46 0.87
Identification: Total RT (hsec) 45 190.02 49.24 1.13 26 208.62 57.67 1.59
Tracking 1: Distance 45 1548.31 458.60 1.41 26 2608.58 1567.33 0.42
Tracking 2: Distance 45 3410.29 1864.34 2.61* 26 5161.27 2740.69 1.42
Target Shoot: Percent Hits 45 63.22 9.35 0.37 25 58.88 10.75 0.10
Target Shoot: Distance 45 789.71 153.93 0.44 25 915.12 311.22 0.22
4 Degrees of freedom - 4, 40; F for alpha .05 is 2.60
b Degrwes of freedom - 4, 21; F for alpha .05 is 2.87
* Significant at .05
.20,7
with portable computer equipment is feasible.
3. The measures showed acceptable psychometric properties, al-though there was definitely room for improvement in severalcases. The analyses were instructive for making thesechanges.
4. The soldiers liked the test battery. Virtually every soldierexpressed a preference for the computer-administered testscompared to the paper-and-pencil tests. We thought there wereseveral reasons for this attitude: novelty; the game-likenature of several tests; and the fact that the battery was, inlarge part, self-paced, allowing each soldier to thoroughlyunderstand the instructions and to work through the battery athis/her own speed.
5-59
22s
Chapter 5 References
Fleishman, E. A. (1967). Performance assessment based on an empiricallyderived task taxonomy. Human Factors, 9, 1017-1032.
Gibson, J. J. (Ed.) (1947). Motion picture testing and research. Army AirForces Aviation Psychology Research Program Reports, 7, Washington,D.C.: Government Printing Office.
Jensen, A. R. (1982). Reaction time and psychometric g. In M. J. Eysenck(Ed.); A model for intelligence, Springer-Verlag.
Kelley, Charles R. (1969). The Measurement of Tracking Proficiency.Human Factors, 11, 43-64.
Keyes, M. A. (1985, in press). A review of the relationship betweenreaction time and mental ability. Minneapolis, MN: Personnel Deci-sions Research Institute.
Melton, A. W. (Ed.) (1947). Apparatus tests (Army Air Forces AviationPsychology Program Research Report No. 4). Washington, D.C.: U.S.Government. Printing Office.
Sternberg, S. (1966). High speed scanning in human memory. Science, 153,652-654.
Sternberg, S. (1969). The discovery of processing stages: Extensions ofDonder's method. Acta Psychologica, 30, 276-315.
Thorson, G., Hochhaus, L., & Stanners, R. F. (1976). Temporal changes invisual and acoustic codes in a letter-matching task. Perception andPsychophysics, 19, 346-348.
5-60
229
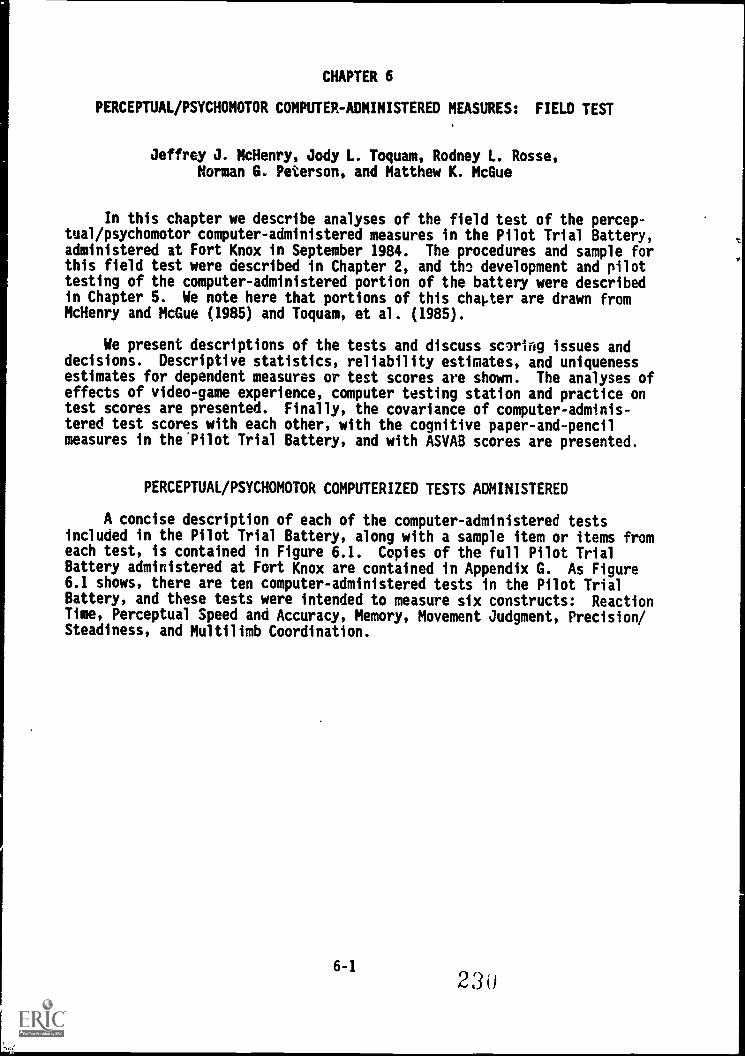
CHAPTER 6
PERCEPTUAL/PSYCHOMOTOR COMPUTER-ADMINISTERED MEASURES: FIELD TEST
Jeffrey J. McHenry, Jody L. Toquam, Rodney L. Rosse,Norman G. Peterson, and Matthew K. McGue
In this chapter we describe analyses of the field test of the percep-tual/psychomotor computer-administered measures in the Pilot Trial Battery,administered at Fort Knox in September 1984. The procedures and sample forthis field test were described in Chapter 2, and th3 development and pilottesting of the computer-administered portion of the battery were describedin Chapter 5. We note here that portions of this chapter are drawn fromMcHenry and McGue (1985) and Toquam, et al. (1985).
We present descriptions of the tests and discuss scoring issues anddecisions. Descriptive statistics, reliability estimates, and uniquenessestimates for dependent measures or test scores are shown. The analyses ofeffects of video-game experience, computer testing station and practice ontest scores are presented. Finally, the covariance of computer-adminis-tered test scores with each other, with the cognitive paper-and-pencilmeasures in the.Pilot Trial Battery, and with ASVAB scores are presented.
PERCEPTUAL/PSYCHOMOTOR COMPUTERIZED TESTS ADMINISTERED
A concise description of each of the computer-administered testsincluded in the Pilot Trial Battery, along with a sample item or items fromeach test, is contained in Figure 6.1. Copies of the full Pilot TrialBattery administered at Fort Knox are contained in Appendix G. As Figure6.1 shows, there are ten computer-administered tests in the Pilot TrialBattery, and these tests were intended to measure six constructs: ReactionTime, Perceptual Speed and Accuracy, Memory, Movement Judgment, Precision/Steadiness, and Multilimb Coordination.
6-1
23(1
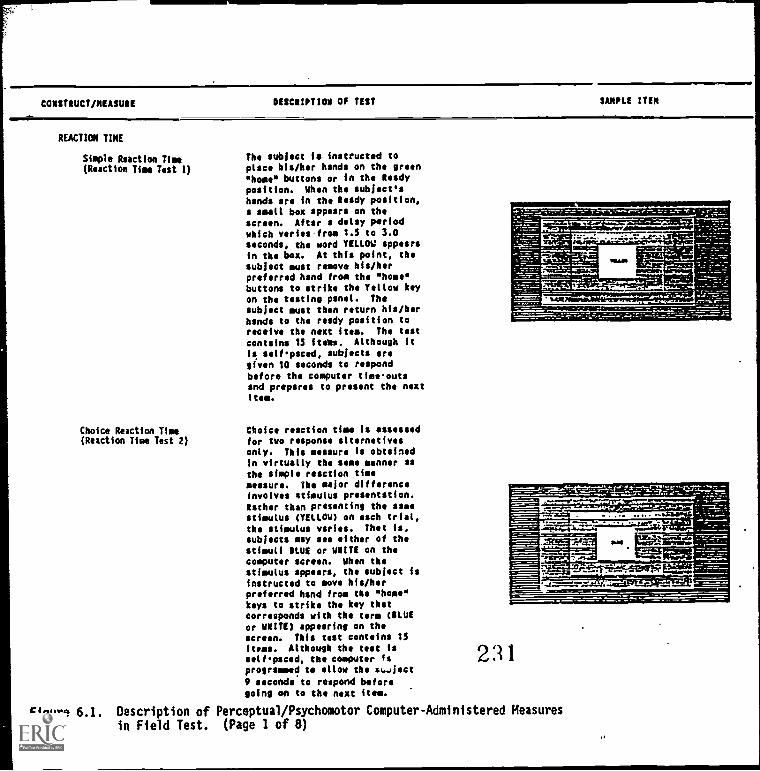
CONSTRUCT/ERASURE DESCRIPTION OF TEST SAMPLE ITEM
REACTION TINE
Simple Reaction Time(Reaction Time Test 1)
Choice Reaction Time(Reaction Time Test 2)
The subject is instructed toplace his/her hands on the greenhome" buttons or in the Readyposition. When the subjectsshands are in the Ready position,a small box appears on thescreen. After a delay periodwhich variesfrom 1.5 to 3.0seconds, the word YELLOW appearsin the box. At this point, thesubject must remove his/herpreferred hand from the "home*buttons to strike the Yellow keyon the testing panel. Thesubject must then return his/herhands to the ready position toreceive the next item. The testcontains 15 items. Although itis selfpaced, subjects aregiven 10 seconds to respondbefore the computer timsoutsand prepares to present the nextitem.
Choice reaction time is assessedfor two response alternativesonly. This measure is obtainedIn virtually the same manner asthe simple reaction timemeasure. The major differenceinvolves stimulus presentation.lather than presenting the samestimulus (YELLOW) on each trial,
the stimulus varies. That is.subjects may see either of thestimuli SLUE or WRITE on thecomputer screen. When thestimulus appears, the subject isInstructed to move his/herpreferred hand from the "home*keys to strike the key thatcorresponds with the term (SLUEor WRITE) appearing on thescreen. This test contains 15items. Although the test isselfpaced, the computer fsprogrammed to allow the u..Jject
9 seconds to respond beforegoing on to the next item.
231
Figure 6.1. Description of Perceptual/Psychomotor Computer-Administered Measuresin Field Test. (Page 1 of 8)
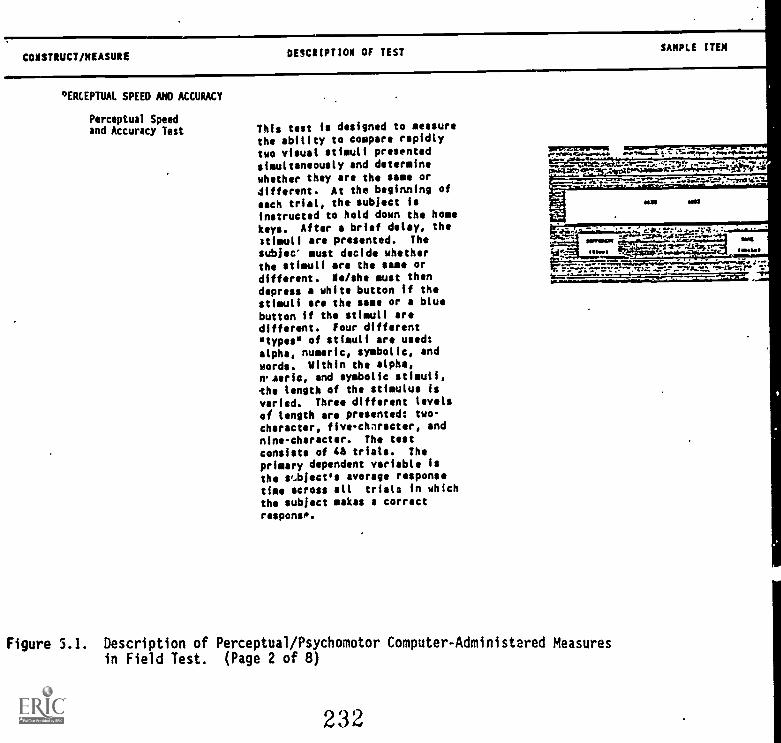
CONSTRUCT/MEASURE DESCRIPTION OF TEST SAMPLE ITEM
0ERCEPTUAL SPEED AND ACCURACY
Perceptual Speedand Accuracy Test This test is designed to measure
the ability to compare rapidlytwo visual stimuli presentedsimultaneously and determinewhether they are the same or
different. At the beginning ofeach trial, th subject isinstructed to hold down the hone
keys. After a brief delay, thestimuli are presented. The
subjec' must decide whetherthe stimuli are the same or
different. Ne/she must thendepress a white button if thestimuli are the same or a bluebutton If the stimuli aredifferent. Four different"types* of stimuli are used:alpha, numeric, symbolic, and
words. Within the alpha,n..aeric, and symbolic stimuli,the length of the stimulus is
varied. Three different levelsof length are presented: two-character, five - character, and
nine-character. The testconsists of 46 trials. Theprimary dependent variable isthe st.bjectis average responsetime across all trials in whichthe subject makes a correctresponsP.
WITtIMMNOMM
Eaminar,Lvsze.,mem*,..r.r14411,$Is: -A- "7 "7--- - ..:r -'', r-nlre sit
114211 GIP
Tmpop...tr.14"4"Mee .. Usti*,
.7-11.-r4r
Figure 5.1. Description of Perceptual/Psychomotor Computer-Administered Measuresin Field Test. (Page 2 of 8)
232
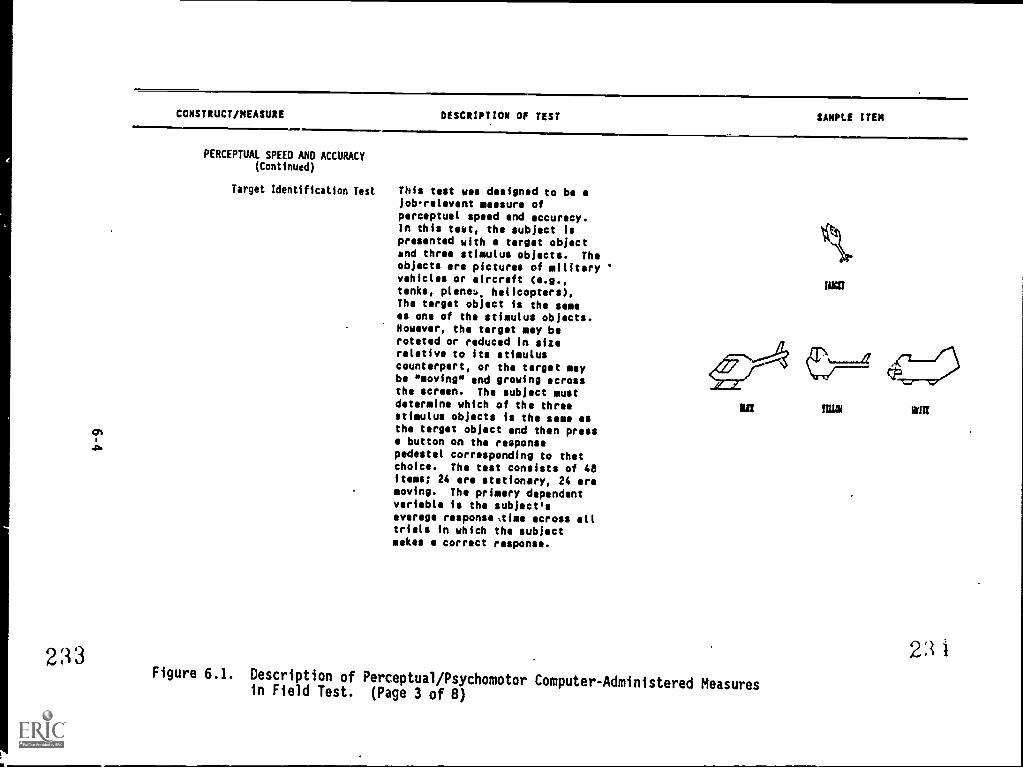
CONSTRUCT/MEASURE DESCRIPTION OF TEST SAMPLE ITEM
PERCEPTUAL SPEED AND ACCURACY(Continued)
Target Identification Test This test was designed to be ajobrelevant measure ofperceptual speed and accuracy.In this test, the subject ispresented with a target objectand three stimulus objects. Theobjects are pictures of military 'vehicles or aircraft (e.g.,tanks, planet,. helicopters),The target object is the sameas one of the stimulus objects.However, the target may berotated or reduced in sizerelative to its stimuluscounterpart, or the target maybe "moving" and growing acrossthe screen. The subject mustdetermine which of the threestimulus objects is the same asthe target object and then pressa button on the response
pedestal corresponding to thatchoice. The test consists of 48items; 24 are stationary, 24 aremoving. The primary dependentvariable is the subject'saverage response,time across alltrials in which the subjectmakes a correct response.
TOM
WI !n181
Figure 6.1. Description of Perceptual/PsychomotorComputer-Administered Measures
in Field Test. (Page 3 of 8)
WM
2: i
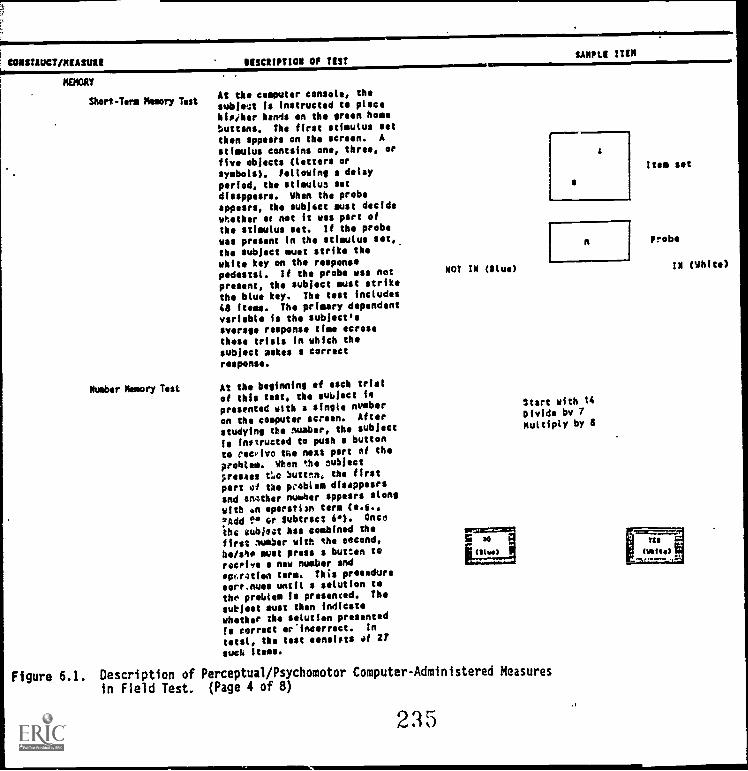
CONSTRUCT/MEASURE DESCRIPTION Of TESTSAMPLE ITEM
MEMORY
Short-Tern Memory TestAt the computer console, thesubject Is instructed to placehisiher hands en the green home
buttons. The first stimulus setthen appears on the screen. A
stimulus contsins one, three, or
five objects (letters orsymbols). following a delay
period, the stimulus setdisappears. Vhen the probeappears, the subject must decidewhether et not it was port of
the stimulus set. If the probewas present in the stimulus set,the subject must strike thewhite key on the responsepedestal. If the probe was notpresent, the subject must strike
the blue key. The test includes
48 items. The primary dependentvariable is the subject's*verses response time acrossthose trials in which thesubject makes a correctresponse.
Number Memory Test At the beginning of each trial
of this test, the subject Io
presented with a single weber
on the computer screen. After
studying the nuaber, the subject
Is instructed to push a button
to recrivo me next part of the
problem. When the subject
;ruses tLo button, the first
part of the problem disappearsand another nusber appears along
with en sperstisn term (e.s.,!Add Pe Or Subtract 10). Once
the subject has combined thefirst number with the second,ke/sho must press s button torocive s new number endopGrction term. This procedureeorr.nues until s solution tothe problem is presented. The
subtlest must then indicatewhether the solution presented
is correct a-incorrect. in
total, the test consists of 27
suck items.
Figure 6.1. Description of Perceptual/Psychomotor Computer-Administered Measures
in Field Test. (Page 4 of 8)
NOT IN (Slue)
Start with 14Divide by 7Multiply by 3
235
Item set
Probe
IN (White)
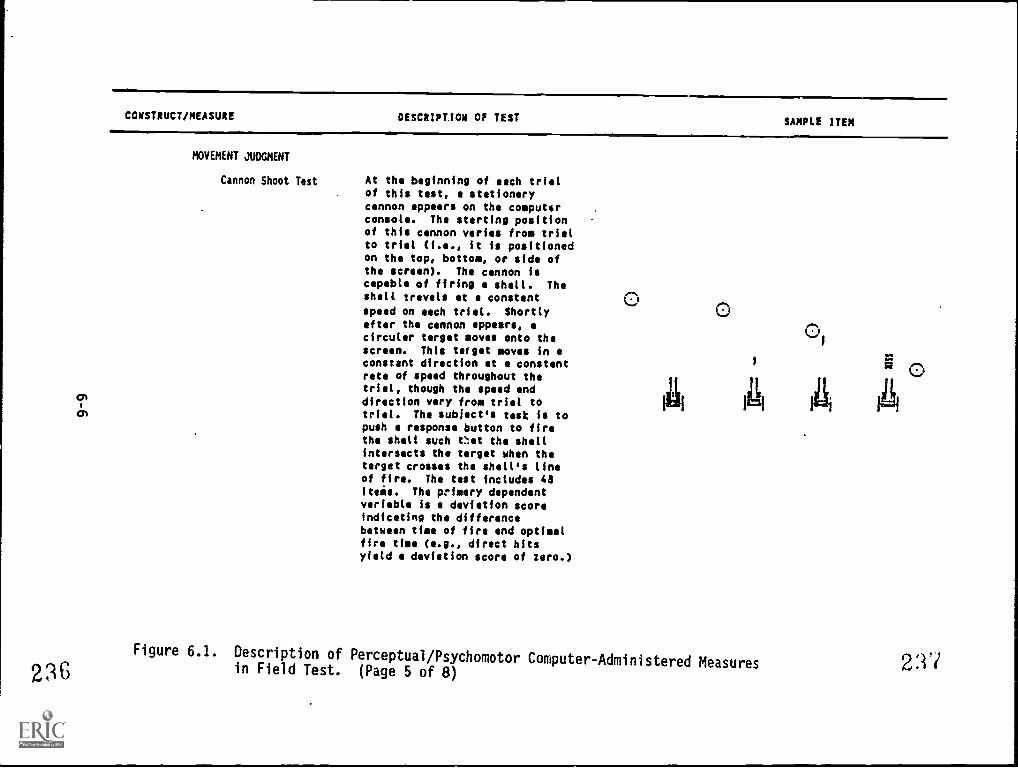
1
cn
236
CONSTRUCT/MEASURE DESCRIPTION OF TEST SAMPLE ITEM
MOVEMENT JUDGMENT
Cannon Shoot Test At the beginning of each trialof this test, a stationarycannon appears on the computerconsole. The starting positionof this cannon varies from trialto trial (i.e., it is positionedon the top, bottom, or side ofthe screen). The cannon iscapable of firing a shill. Theshell travels at a constant
speed on each triel. Shortlyafter the cannon appears, acircular target moves onto thescreen. This target moves in aconstant direction at a constantrate of speed throughout thetrial, though the speed anddirection vary from trial totrial. The subject's task is topush a response button to firethe shell such that the shellintersects the target when thetarget crosses the shell's lineof fire. The test includes 48items. The primary dependentvariable is a deviation scoreindicating the differencebetween time of fire and optimalfire time (e.g., direct hitsyield a deviation score of zero.)
CI
I
0,
Figure 6.1. Description of Perceptual/PsychomotorComputer-Administered Measures
in Field Test. (Page 5 of 8)
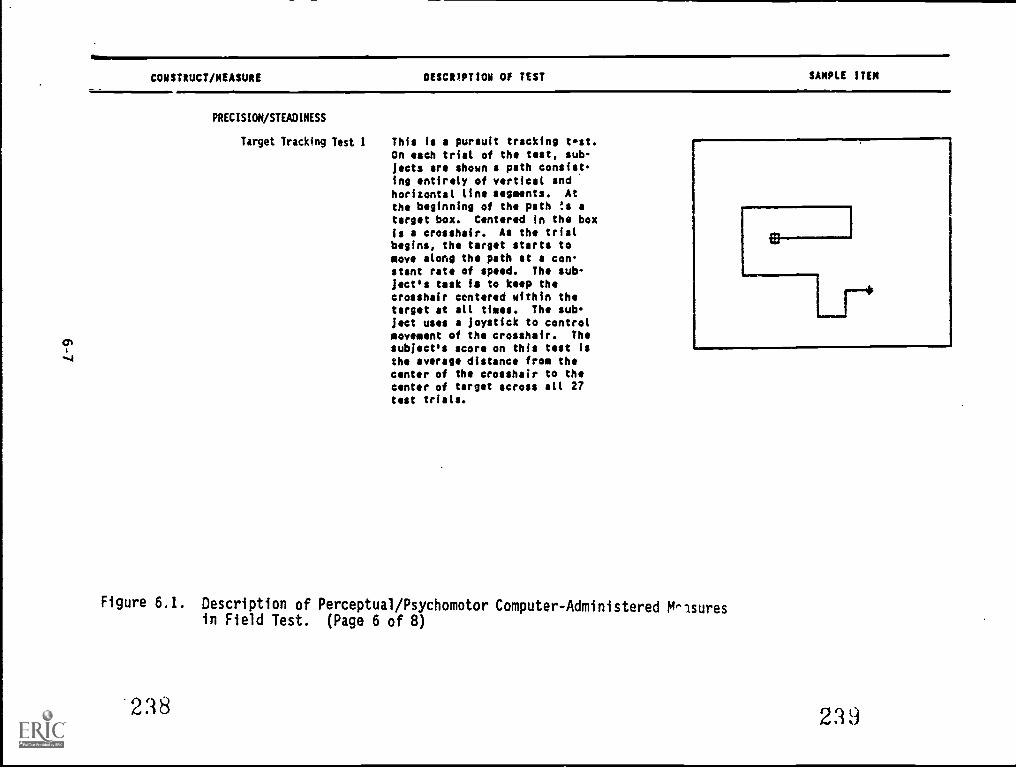
CONSTRUCT/MEASURE DESCRIPTION OF TEST SAMPLE ITEM
PRECISION/STEADINESS
Target Tracking Test 1 This is e pursuit tracking test.On each trial of the test, sub-jects are shown a path consist-ing entirely of vertical andhorizontal line segments. At
the beginning of the path f.s atarget box. Centered in the boxis a crosshair. As the trialbegins, the target starts tomove along the path at a con-stant rate of speed. The sub-ject's task is to keep thecrosshair centered within thetarget at all times. The sub-ject uses a joystick to controlmovement of the crossheir. Thesubject's score on this test isthe average distance from thecenter of the crosshair to thecenter of target across all 27test trials.
Figure 6.1. Description of Perceptual/Psychomotor Computer-Administered M-lsuresin Field Test. (Page 6 of 8)
238 239
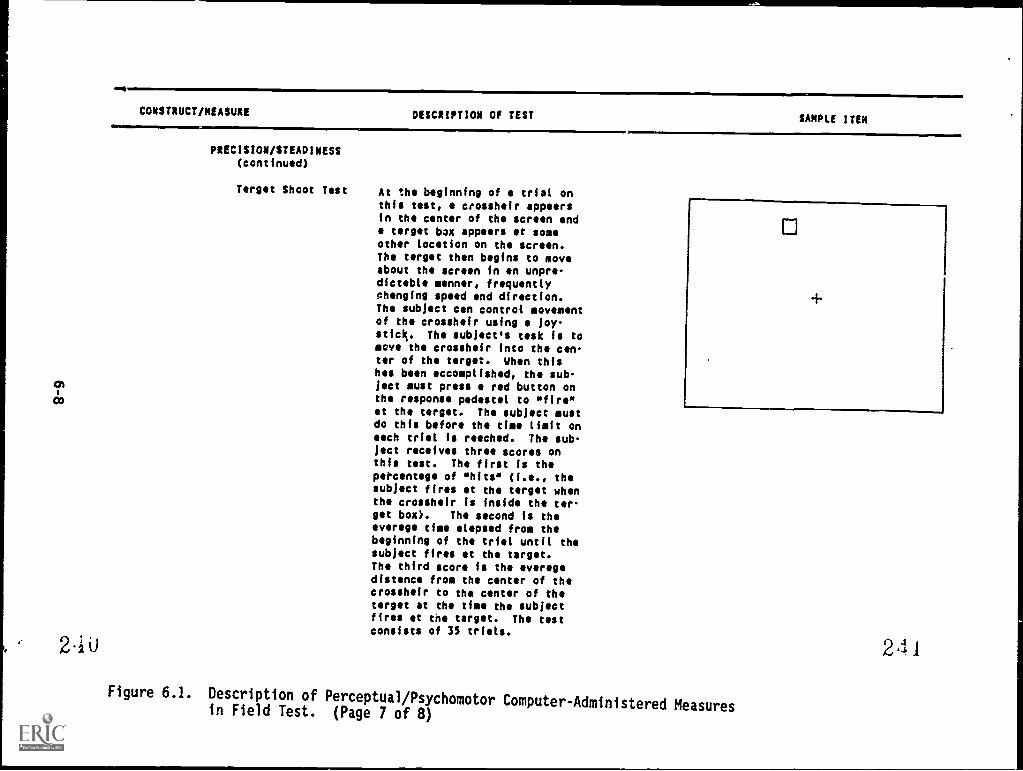
.4
CONSTRUCT/MEASURE DESCRIPTION OF TEST SAMPLE ITEM
PRECISION/STEADINESS(continued)
Target Shoot Test At the beginning of a trial onthis test, a crosshair appearsin the center of the screen anda wait box appears at someother location on the screen.The target then begins to moveabout the screen in an unpre-dictable manner, frequentlychanging speed and direction.The subject can control movementof the crosshair using i joystick. The subject's task is tomove the crosshair into the center of the target. When thishas been accomplished, the sub-ject must press a rid button onthe response pedestal to "fire"at the target. The subject mustdo this before the time limit oneach trial is reached. The subject receives three scores onthis test. The first is theWcentagt of "hits" (i.e., thesubject fires at the target whenthe crosshair is inside the tar-get box). The second is theaverage time elapsed from thebeginning of the trial until thesubject fires at the target.The third score is the averagedistance from the center of thecrosshair to the center of thetarget at the time the subjectfires at the target. The testconsists of 35 trials.
a
+
Figure 6.1. Description of Perceptual/Psychomotor Computer-Administered Measuresin Field Test. (Page 7 of 8)
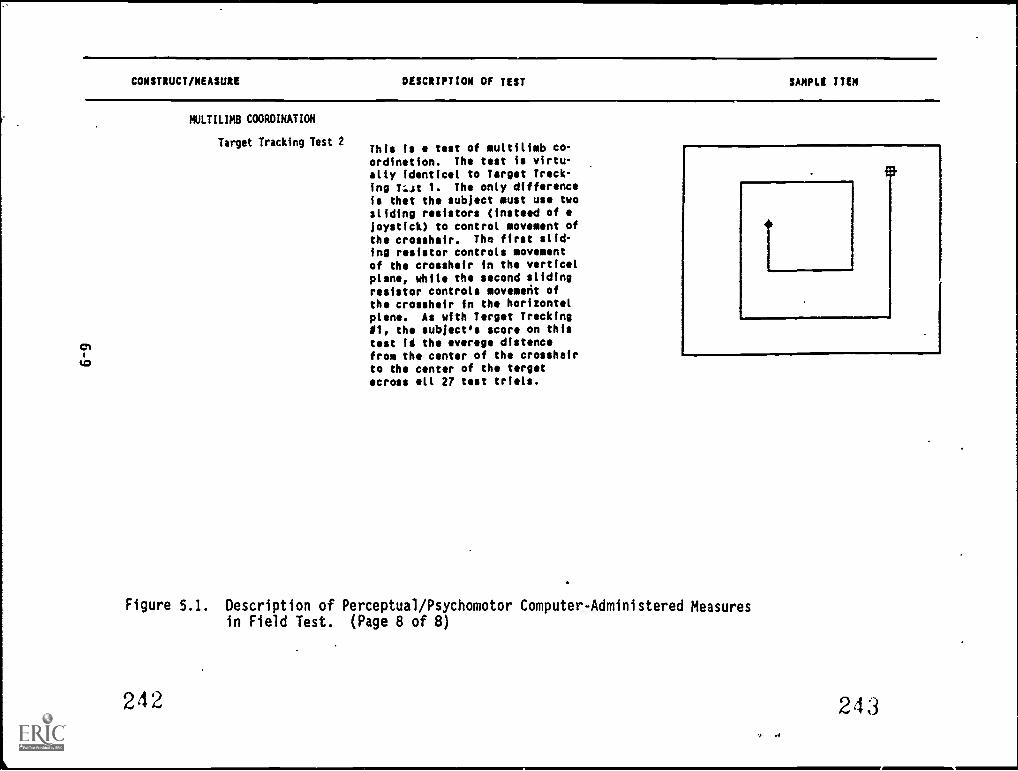
CONSTRUCT/MEASURE DESCRIPTION OF TEST SAMPLE ITEM
NULTILINB COORDINATION
Target Tracking Test 2This is a test of muttilimb co-ordination. The test is virtu-ally identical to Target Track-ing T...st 1. The only differenceIs that the subject must use twosliding resistors (instead of ajoystick) to control movement ofthe crosshair. The first slid-ing resistor controls movementof the crosshair in the verticalplane, white the second slidingresistor controls movement ofthe crosshair in the horizontalplane. As with Target TrackingSi, the subject's score on thistest is the average distancefrom the center of the crosshairto the center of the targetacross all 27 test trials.
Figure S.I. Description of Perceptual/Psychomotor Computer-Administered Measuresin Field Test. (Page 8 of 8)
242 243
ANALYSIS OF DATA FROM FIELD TEST ADMINISTRATION
Table 6.1 shows means, standard deviations, and reliability estimatesfor 19 scores or dependent measures for the 10 computer-administered tests.Before discussing this table and other aspects of the field test dataanalysis, we make a few remarks about the methods used to score thesetests. In general, the methods employed were similar to those used at FortLewis (described in Chapter 5), but analyses of the Fort Knox field testdata occasionally indicated a change was desirable.
Field Test Scoring Procedures
The perceptual computer-administered tests (see Table 6.1) generallyyield one or both of two types of scores: accuracy and speed (except forthe Cannon Shoot Test, discussed later)--for example, percent of itemscorrect (accuracy) and mean reaction time (speed) on Perceptual Speed andAccuracy.
In addition, two derived measures can be computed for the perceptualtests: the slope and the intercept obtained when reaction times are re-gressed against an impoetant defining characteristic of test items (whichwe called a "parameter"). For Perceptual Speed and Accuracy, this charac-teristic was the number of stimuli or characters being compared in an item(i.e., 2, 5, or.9 characters). In terms of speed of processing, the sloperepresents the average increase in reaction time with an increase of onecharacter in the stimulus set; thus, the lower the value, the faster thecomparison. The intercept rr)resents all other processes not involved incomparing stimuli, such as encoding the stimuli and executing the response.Of course, these two measures can be used only when the test is well enoughunderstood to allow the appropriate construction of items to tap a definingcharacteristic or parameter.
.Reaction times on all tests were computed only for correct responsesbecause it seemed to make very little sense to include incorrect responses.Subjects could simply respond at random and receive an excellent reactiontime score if incorrect responses were included. This strategy means thatitems on most tests should be constructed so that subjects could answerevery item correctly if given enough time, and that enough time is given.We did follow this strategy. Consequently, the speed measures (reactiontime) were expected, in general, to have more variance and be more mean-ingful than the accuracy measures.
Several issues revolved around the choice of the particular way tomeasure reaction time. As noted in Chapter 5, total reaction time is madeup of two components, decision time and movement time. Analyses of FortKnox field test data indicated that total reaction time and decision timewere very highly correlated and, since movement time is conceptually unin-teresting, we elected to use total reaction time for all reaction timetests.
Means or medians across items could be used to compute the totalreaction time scores. These could be trimmed (i.e., highest and lowestitems not included in the calculation) or untrimmed ;all items included).We locked at score distributions, intercorrelations of the various scores,and reliabilities of the scores in order to decide which method to use.
6-10
24.E
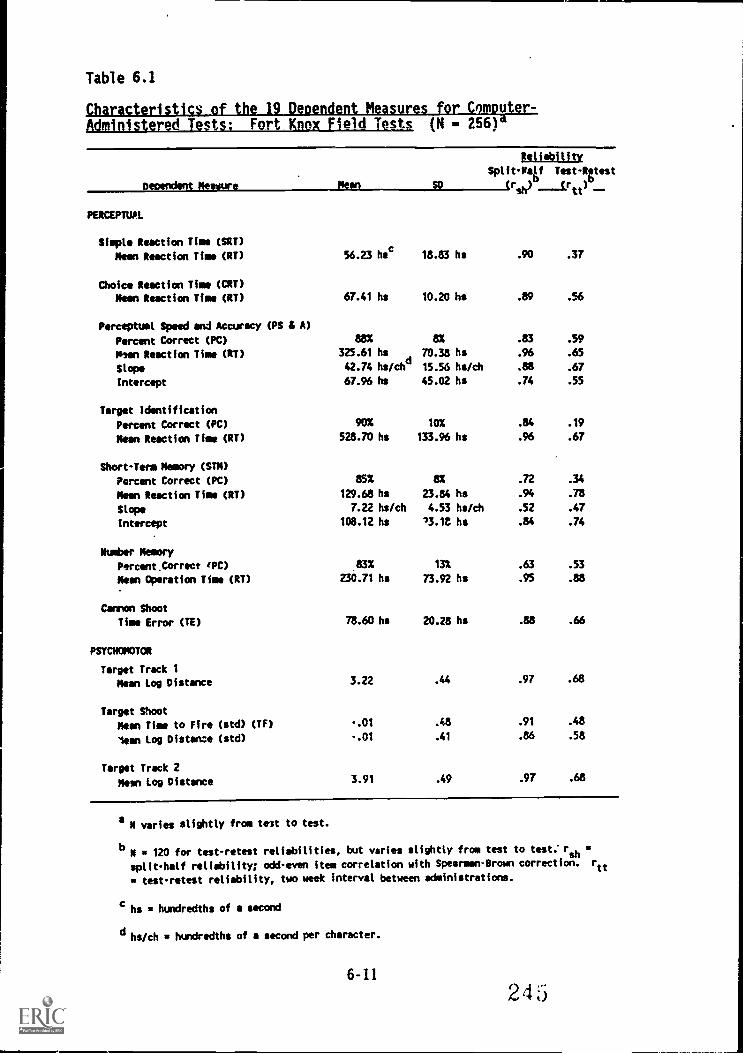
Table 6.1
Characteristics of the 19 Dependent Measures for Computer-Administered Tests: ForLKnox Field Tests (N 25614
Reliability
Split-Pelf Test-Retest
PERCEPTUAL
Simple Reaction Time (SRT)
Moen Reaction Time (RT) 56.23 hec 18.83 hs .90 .37
Choice Reaction Time (CRT)
Moen Reaction Time (RT) 67.41 hs 10.20 hs .89 .56
Perceptual Speed and Accuracy (PS 8 A)
Percent Correct (PC) 88% ax .83 .59
Often Reaction Time (RT) 325.61 hs 70.38 hs .96 .65
Slope 42.74 hs/chd
15.56 hs/ch .88 .67
Intercept 67.96 hs 45.02 hs .74 .55
Target Identification
Percent Correct (PC) 90% lax .84 .19
Mean Reaction Time (RT) 528.70 hs 133.96 hs .96 .67
Short-Term Memory (STM)
Percent Correct (PC) 65% ax .72 .34
Mean Reaction Time (RT) 129.68 hs 23.84 hs .94 .78
Slope 7.22 hs/ch 4.53 hs/ch .52 .47
Intercept 108.12 hs '3.1t hs .84 .74
Number Memory
Percent.Correct 'PC) 83% 13% .63 .53
Mean Operation Time (RT) 230.71 hs 73.92 hs .95 .86
Cannon Shoot
Time Error (TE) 78.60 hs 20.28 hs .88 .66
PSYCHOMOTOR
Target Track 1
Mean Log Distance 3.22 .44 .97 .68
Target Shoot
Mean Time to Fire (std) (TF) -.01 .48 .91 .48
lean Log Distance (std) -.01 .41 .86 .58
Target Track 2
Mean Log Distance 3.91 .49 .97 .68
a N varies slightly from test to test.
b N = 120 for test-retest reliabilities, but varies slightly from test to test. rsh
split-half reliability; odd-even item correlation with Spearman-Brown correction. rtt
2 test-retest reliability, two week interval between administrations.
hs = hundredths of a second
d hs/ch = hundredths of a second per character.
6-11
245
Generally, there were no striking differences between the methods. Wedecided to use untrimmed means for all tests except Simple and ChoiceReaction Times; single extreme scores could affect the mean much more forthese two tests than for the others because they had a much smaller numberof items. Means were selected over zAians because they had slightlyhigher reliabilities.
A final scoring issue concerns missing data. Since a subject may notget all items correct on a particular test, some information is missingwhen the mean total reaction time, slope, and intercept are being computedfor that subject. Therefore, we established a maximum number of missingitems Oat would be permitted for each test. This limit for all tests,with the exception of Number Memory, was set at 10 percent. Hence, forSimple and Choice Reaction Time, subjects could miss up to two items; forShort-Term Memory, Perceptual Speed and Accuracy, and Target Ident'fica-tion, the limit was set at five items. Because Number Memory requiressubjects to pr.:aide several responses for a single item, the possibility ofmissing data is higher. To ensure that sufficient numbers of subjects wereavailable for analysis, we permitted subjects to miss up to seven of the 27items in this test.
The Percent Correr-. and Mean Operation Time scores For the NumberMemory Test require e.,ianation since this test was -'ot administered atFort Lewis and,therefore, these scores were not discussed in :hapter 5.Percent Correct is simply the percentage of items th., the subject answeredcorrectly. Mean Operation Time is the mean of the mean reaction times tothe four arithmetic operations (multiply, divide, add, and subtract). Thatis, for each subject, a mean reaction time for processing all the multipli-cation operations was computed; a separate mean for all the division opera-tions, and so on for the two other operations. The mean of these fouroperation reaction time means wa_ then computed and labeled Mean OperationTime.
As we noted above, procedures for scoring the Cannon Shoot Test dif-fered from those used to score the other cognitive/perceptual tests. Areaction time score for this test is inappropriate because the task re-quires the subject to ascertain the optimal time to fire to ensure a directhit on the target. (See description of Cannon Shoot Test, Figure 6.1.)Therefore, responses on this measure were scored by computing a deviationscore that is composed of the difference between tha time the subject firedand the optimal time to fire. These scores are summed across all items foreach subject and a mean deviation time score is computed.
Scoring of two of the three psychomotortests, Target Tracking Tests 1
and 2, was relatively straightforward. During each trial, the distancefrom the center of the crosshair to the center of the target was computedapproximately 16 times per second, or almost 350 times per trial. Thesedistances were then averaged by the computer, which Atput- or'y the meandistance for each trial.
However, the frequency distribution of these mean distance scoresproved to be highly posit'vely skewed, the skewness coefficient for sometrials being in excess of 6 and 6. Therefore, subjects' mean distancescores for each trial were transformed, using the natural logarithm trans-f3rmation. The overall test score for each subject was then the mean of
6-12
246
the log (mean distance) scores across the 27 trials of each test.
Scoring of the Target Shoot Test was a bit more complicated. Threeoverall test scores were generated for each subject: (1) the percentage ofhits; (2) the mean distance from the center of the crosshair to the centerof the target at the time of firing (the distance score); and (3) the meantime elapsed from the start of the trial until firing (the time-to-firescore). Percentage of hits was a less desirable measure because it con-tains relatively little information compared to the distance measure.Complications arose because subjects received no distance or time-to-firescore2 on trials where they failed to fire at the target before the timelimit for the trial elapsed. This scoring procedure resulted in consider-able missing data; moreover, the missing data occurred primarily on themost difficult items of the test, where only the adept subjects were ableto maneuver the crosshair close enough to the target to fire.
Therefore, as a first step in computing overall distance and time-to-fire scores for the Target Shoot Test, the distance and time-to-fire scoresfor each trial were standardized. That is, the mean and standard deviationof the distance score was computed for each item or trial on the test.Then, each subject was assigned a standard score on each trial by sub-tracting the item mean from his/her obtained distance score and dividing bythe item standard deviation. For each subject, the overall distance andtime score was then computed by averaging these standardized scores acrossall trials in which the subject fired at the target.
Mean Scores and Reliability Estimates
The means and standard deviations in Table 6.1 provide informationabout the score distributions. Note that the Percent Correct scores forPerceptual Speed and Accuracy, Target Identification, and Short-Term Memoryare high, and the standard deviations are not large as had been expected.The Reaction Time scores for these tests do have sufficient variance.
The split-half reliabilities range from .52 (Short-Term Memory Slope)to .96 (for two scores). Besides the Short-Term Memory Slope, only theNumber Memory Percent Correct score is undesirably low (.63). All othersare .74 or higher. These split-half reliabilities are odd-even correla-tions corrected to full test length, but note that they do not suffer fromthe artifactual inflation that speeded paper-and-pencil measures do. Thisis because 211 items are attempted by every subject.
The test-retest reliabilities are lower than the split-half reliabili-ties, as is typically the case. Three are so low as to cast doubt on theusefulness of the score: Simple Reaction Time Mean Reaction Time (.37),Target Identification Percent Correct (.19), and Short-Term Memory PercentCorrect (.34). However, the two Percent Correct scores are not viewed asthe primary score for their tests, and Simple Reaction Time is viewedlargely as a "warm up" test. Although seven of the other scores have test-retest reliabilities below .60, there appears to be sufficient stability inthese scores to warrant their possible use as predictors.
6-13
2 4 /
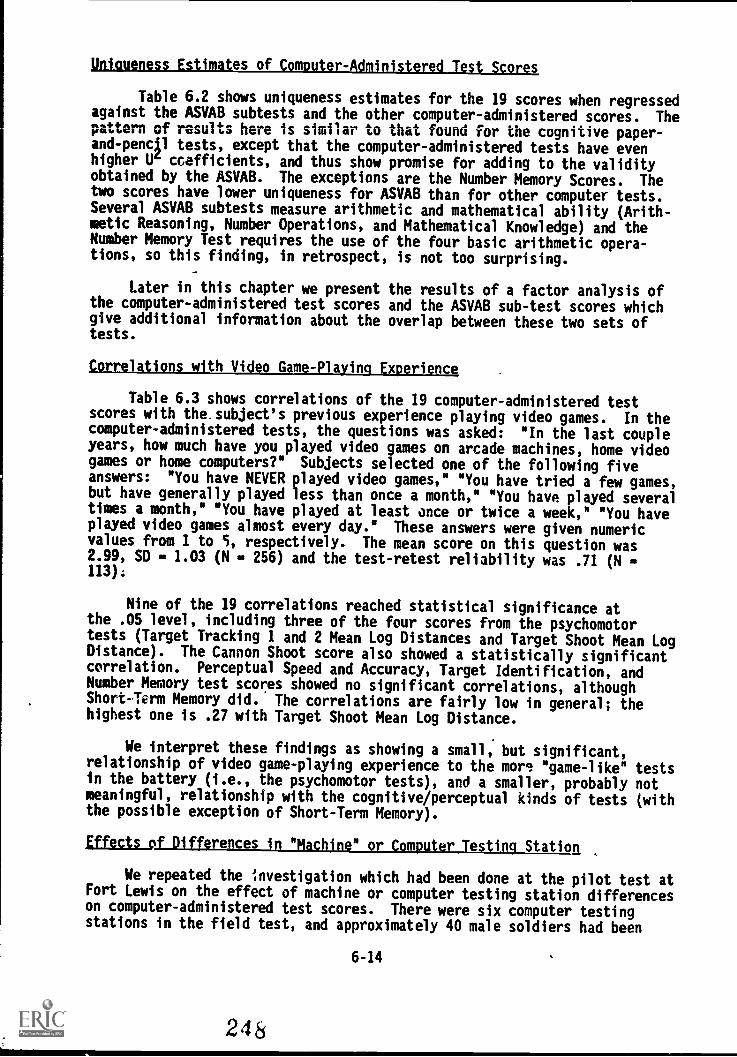
Uniaueness Estimates of Computer-Administered Test Scores
Table 6.2 shows uniqueness estimates for the 19 scores when regressedagainst the ASVAB subtests and the other computer-administered scores. Thepattern of results here is similar to that found for the cognitive paper -and- pencil tests, except that the computer-administered tests have evenhigher U ccafficients, and thus show promise for adding to the validityobtained by the ASVAB. The exceptions are the Number Memory Scores. Thetwo scores have lower uniqueness for ASVAB than for other computer tests.Several ASVAB subtests measure arithmetic and mathematical ability (Arith-metic Reasoning, Number Operations, and Mathematical Knowledge) and theNumber Memory Test requires the use of the four basic arithmetic opera-tions, so this finding, in retrospect, is not too surprising.
Later in this chapter we present the results of a factor analysis ofthe computer-administered test scores and the ASVAB sub-test scores whichgive additional information about the overlap between these two sets oftests.
Correlations with_Video Game - Playing Experience
Table 6.3 shows correlations of the 19 computer-administered testscores with the. subject's previous experience playing video games. In thecomputer-administered tests, the questions was asked: "In the last coupleyears, how much have you played video games on arcade machines, home videogames or home computers?" Subjects selected one of the following fiveanswers: "You have NEVER played video games," "You have tried a few games,but have generally played less than once a month," "You have played severaltimes a month," "You have played at least once or twice a week," "You haveplayed video games almost every day." These answers were given numericvalues from 1 to 5, respectively. The mean score on this question was2.99, SD 1.03 (N - 256) and the test-retest reliability was .71 (N113);
Nine of the 19 correlations reached statistical significance atthe .05 level, including three of the four scores from the psychomotortests (Target Tracking 1 and 2 Mean Log Distances and Target Shoot Mean LogDistance). The Cannon Shoot score also showed a statistically significantcorrelation. Perceptual Speed and Accuracy, Target Identification, andNumber Memory test scores showed no significant correlations, althoughShort-Term Memory did. The correlations are fairly low in general; thehighest one is .27 with Target Shoot Mean Log Distance.
We interpret these findings as showing a small, but significant,relationship of video game-playing experience to the more "game-like" testsin the battery (i.e., the psychomotor tests), and a smaller, probably notmeaningful, relationship with the cognitive/perceptual kinds of tests (withthe possible exception of Short-Term Memory).
Effects of Differences in "Machine" or Computer Testing Station
We repeated the Investigation which had been done at the pilot test atFort Lewis on the effect of machine or computer testing station differenceson computer-administered test scores. There were six computer testingstations in the field test, and approximately 40 male soldiers had been
6-14
24&
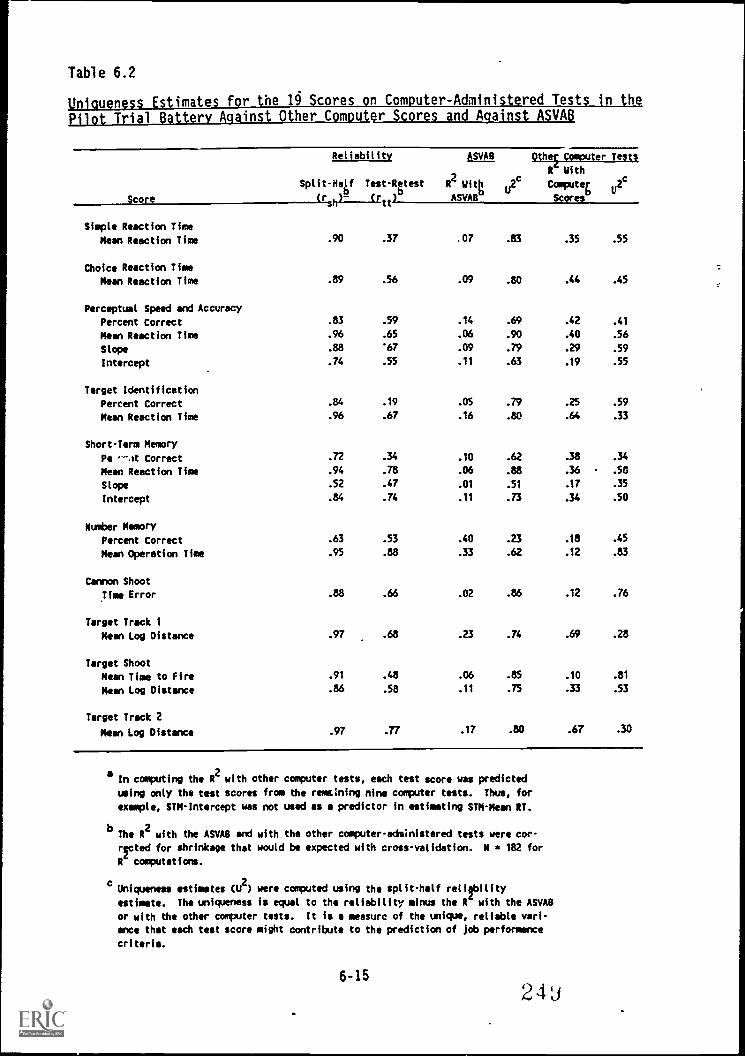
Table 6.2
Uniqueness Estimates for the 19 Scores on Computer-Administered Tests in thePilot Trial Battery Against Other Computer Scores and Against ASVAB
Score
Reliability ASVAB Othel Computer Tests
It With
Split-Nag Test-Rgtest R2Witt u2c Comiouter
b
,c
ASVAB Scores
Simple Reaction Time
Mean Reaction Time .90 .37 .07 .83 .35 .55
Choice Reaction Time
Mean Reaction Time .89 .56 .09 .80 .44 .45
Perceptual Speed and Accuracy
Percent Correct .83 .59 .14 .69 .42 .41
Mean Reaction Time .96 .65 .06 .90 .40 .56
Slope .88 '67 .09 .79 .29 .59
Intercept .74 .55 .11 .63 .19 .55
Target Identification
Percent Correct .84 .19 .05 .79 .25 .59
Mean Reaction Time .96 .67 .16 .80 .64 .33
Short -Term Memory
Pe --At Correct .72 .34 .10 .62 .38 .34
Mean Reaction Time .94 .78 .06 .88 .36 .58
Slope .52 .47 .01 .51 .17 .35
Intercept .84 .74 .11 .73 .34 .50
Number Memory
Percent Correct .63 .53 .40 .23 .18 .45
Mean Operation Time .95 .88 .33 .62 .12 .83
Cannon Shoot
Time Error .88 .66 .02 .86 .12 .76
Target Track 1
Mean Log Distance .97 .68 .23 .74 .69 .28
Target Shoot
Mean Time to Fire .91 .48 .06 .85 .10 .81
Mean Log Distance .86 .58 .11 .75 .33 .53
Target Track 2
Mean Log Distance .97 .77 .17 .80 .67 .30
aIn computing the R
2with other computer tests, each test score was predicted
using only the test scores from the reme:ning nine computer tests. Thus, for
example, STM-Intercept was not used as a predictor in estimating SIM-Mean RT.
bThe R
2with the ASVAB and with the other computer - administered tests were cor-
riteted for shrinkage that would be expected with cross-validation. N 182 for
R computations.
cUniqueness estimates (U
2) were computed using the split-half reliability
estimate. The uniqueness is equal to the reliability minus the R with the ASVAB
or with the other computer tests. It is a measure of the unique, reliable vari-
ance that each test score might contribute to the prediction of job performance
criteria.
6-15
24J
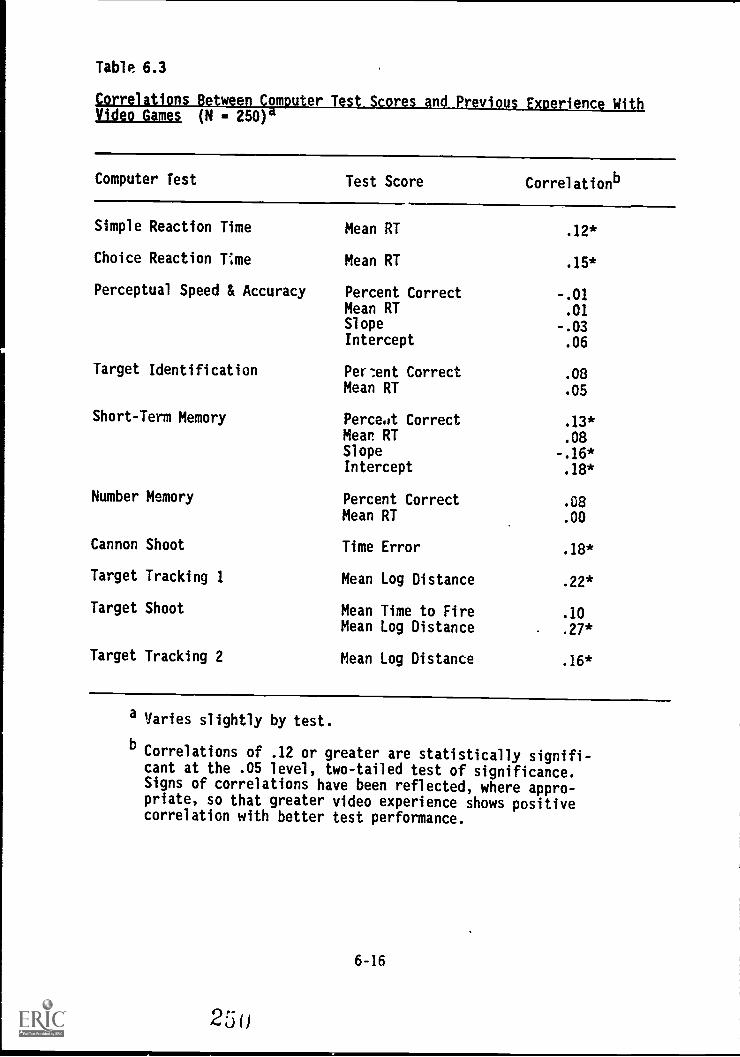
Table 6.3
n wVideo Games (N - 250)
ter tenc W h
Computer Test Test Score Correlationb
Simple Reaction Time Mean RT
Choice Reaction Time Mean RT
Perceptual Speed & Accuracy Percent Correct -.01Mean RT .01Slope -.03Intercept .06
Target Identification Per:ent Correct .08Mean RT .05
.12*
.15*
Short-Term Memory
Number Memory
Cannon Shoot
Target Tracking 1
Target Shoot
Target Tracking 2
Perce.zt Correct .13*Mean. RT .08Slope -.16*Intercept .18*
Percent CorrectMean RI
Time Error
Mean Log Distance
Mean Time to FireMean Log Distance
Mean Log Distance
.08
.00
.18*
.22*
.10
.27*
.16*
a Varies slightly by test.
bCorrelations of .12 or greater are statistically signifi-cant at the .05 level, two-tailed test of significance.Signs of correlations have been reflected, where appro-priate, so that greater video experience shows positivecorrelation with better test performance.
6-16
25()
tested at each station. (We used only males in this analysis to avoidconfounding the results with gender differences, since the 47 femalestested were not evenly balanced across the six testing stations. Also,only males with complete sets of computer tent scores were used so theanalyses would have the same sample fcr each test score.)
We ran a one-way multivariate analysis of variance (MANOVA) for the 19computer test scores, with six "machine" levels. As Table 6.4 shows,machine differences has no effect on test scores. The MANOVA likelihoodratio was .99 (p value .50). Table 6.4 also shows the univariate F ratioand p values for each of the 19 scores. None of them reached statisticalsignificance at the .05 level, again indicating that the testing stationhad no significant effect on these 19 scores.
These results were especially encouraging because they replicated asimilar set of results from the earlier Fort Lewis pilot test (see Chap-ter 5). The results showed that the hardware and software used in thecomputer-administered battery had, indeed, resulted in a standardizedtesting situation across the six machines and testing stations. We thinkthis is due in large part to the calibration software used to make thehardware equivalent across stations, as described in Chapter 1.
6-17
2 5_t
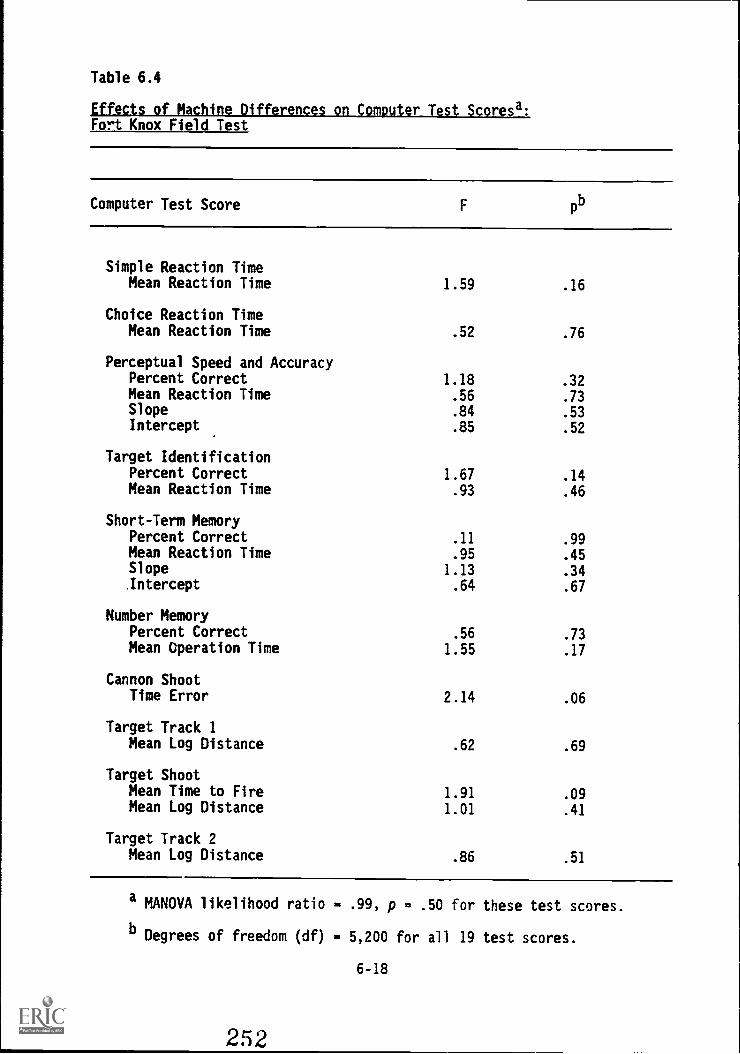
Table 6.4
Effects of Machine Differences on Computer Test Scoresa:Fort Knox Field Test
Computer Test Score Fpb
Simple Reaction TimeMean Reaction Time 1.59 .16
Choice Reaction TimeMean Reaction Time .52 .76
Perceptual Speed and AccuracyPercent Correct 1.18 .32Mean Reaction Time .56 .73Slope .84 .53Intercept .85 .52
Target IdentificationPercent Correct 1.67 .14Mean Reaction Time .93 .46
Short-Term MemoryPercent Correct .11 .99Mean Reaction Time .95 .45Slope 1.13 .34Intercept .64 .67
Number MemoryPercent Correct .56 .73Mean Operation Time 1.55 .17
Cannon ShootTime Error 2.14 .06
Target Track 1Mean Log Distance .62 .69
Target ShootMean Time to Fire 1.91 .09Mean Log Distance 1.01 .41
Target Track 2Mean Log Distance .86 .51
a MANOVA likelihood ratio - .99, p - .50 for these test scores.
bDegrees of freedom Of) - 5,200 for all 19 test scores.
6-18
252
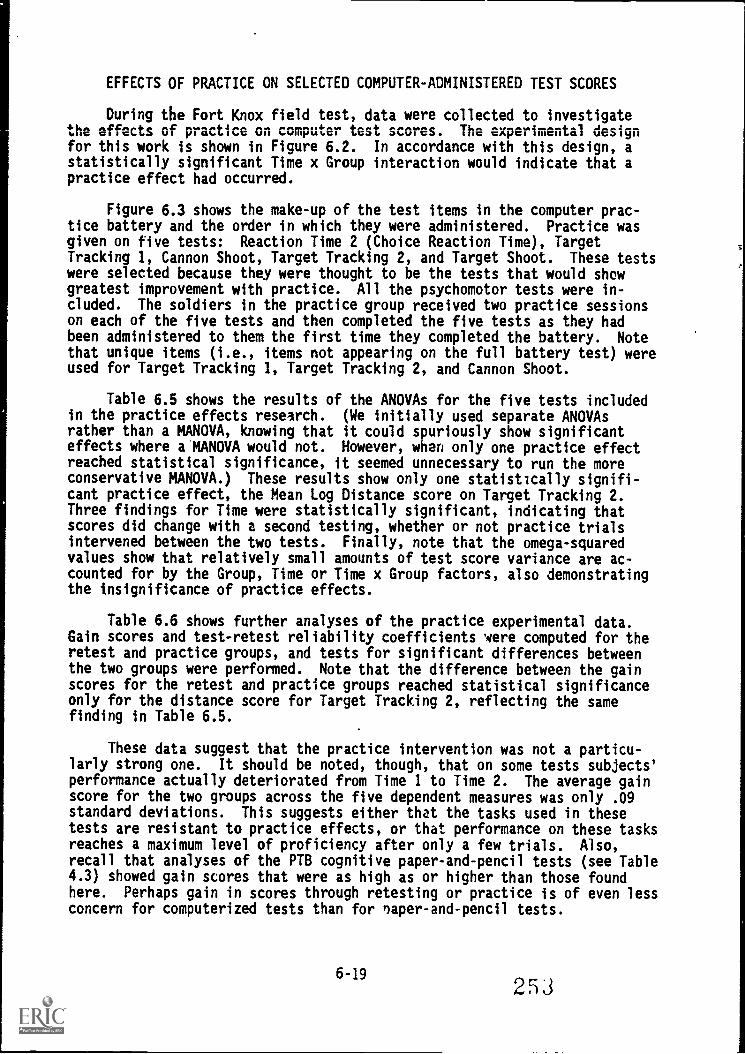
EFFECTS OF PRACTICE ON SELECTED COMPUTER-ADMINISTERED TEST SCORES
During the Fort Knox field test, data were collected to investigatethe effects of practice on computer test scores. The ..pc,imental designfor this work is shown in Figure 6.2. In accordance with this design, astatistically significant Time x Group interaction would indicate that apractice effect had occurred.
Figure 6.3 shows the make-up of the test items in the computer prac-tice battery and the order in which they were administered. Practice wasgiven on five tests: Reaction Time 2 (Choice Reaction Time), TargetTracking 1, Cannon Shoot, Target Tracking 2, and Target Shoot. These testswere selected because they were thought to be the tests that would showgreatest improvement with practice. All the psychomotor tests were in-cluded. The soldiers in the practice group received two practice sessionson each of the five tests and then completed the five tests as they hadbeen administered to them the first time they completed the battery. Notethat unique items (i.e., items not appearing on the full battery test) wereused for Target Tracking 1, Target Tracking 2, and Cannon Shoot.
Table 6.5 shows the results of the ANOVAs for the five tests includedin the practice effects research. (We initially used separate ANOVAsrather than a MANOVA, knowing that it could spuriously show significanteffects where a MANOVA would not. However, when only one practice effectreached statistical significance, it seemed unnecessary to run the moreconservative MANOVA.) These results show only one statistically signifi-cant practice effect, the Mean Log Distance score on Target Tracking 2.Three findings for Time were statistically significant, indicating thatscores did change with a second testing, whether or not practice trialsintervened between the two tests. Finally, note that the omega-squaredvalues show that relatively small amounts of test score variance are ac-counted for by the Group, Time or Time x Group factors, also demonstratingthe insignificance of practice effects.
Table 6.6 shows further analyses of the practice experimental data.Gain scores and test-retest reliability coefficients were computed for theretest and practice groups, and tests for significant differences betweenthe two groups were performed. Note that the difference between the gainscores for the retest and practice groups reached statistical significanceonly for the distance score for Target Tracking 2, reflecting the samefinding in Table 6.5.
These data suggest that the practice intervention was not a particu-larly strong one. It should be noted, though, that on some tests subjects'performance actually deteriorated from Time 1 to Time 2. The average gainscore for the two groups across the five dependent measures was only .09standard deviations. This suggests either that the tasks used in thesetests are resistant to practice effects, or that performance on these tasksreaches a maximum level of proficiency after only a few trials. Also,recall that analyses of the PTB cognitive paper-and-pencil tests (see Table4.3) showed gain scores that were as high as or higher than those foundhere. Perhaps gain in scores through retesting or practice is of even lessconcern for computerized tests than for 'aper- and - pencil tests.
6-1925J
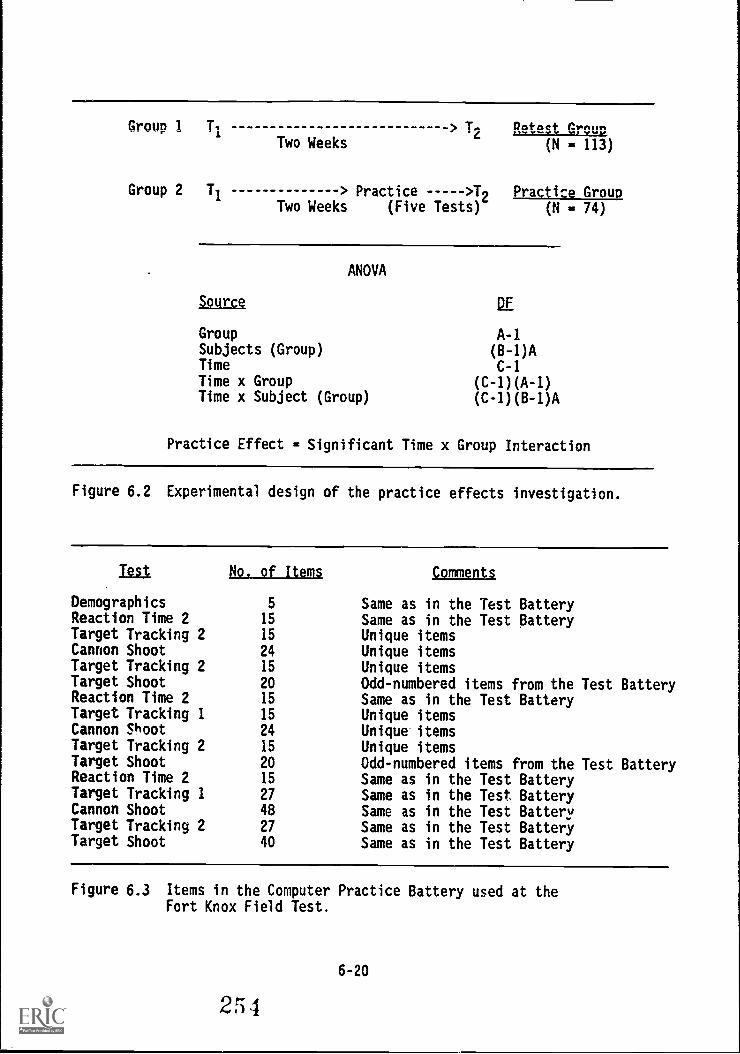
Group 1 T1
Group 2 T1
> T Retest Gm!)Two Weeks (N - 113)
> Practice >T2 Practice GroupTwo Weeks (Five Tests) (N - 74)
ANOVA
Source
Group A-1Subjects (Group) (B-1)ATime C-1Time x Group (C-1)(A-1)Time x Subject (Group) (C-1)(8-1)A
Practice Effect - Significant Time x Group Interaction
Figure 6.2 Experimental design of the practice effects investigation.
Test Po. of Items Comments
Demographics 5 Same as in the Test BatteryReaction Time 2 15 Same as in the Test BatteryTarget Tracking 2 15 Unique itemsCannon Shoot 24 Unique itemsTarget Tracking 2 15 Unique itemsTarget Shoot 20 Odd-numbered items from the Test BatteryReaction Time 2 15 Same as in the Test BatteryTarget Tracking 1 15 Unique itemsCannon Shoot 24 Unique itemsTarget Tracking 2 15 Unique itemsTarget Shoot 20 Odd-numbered items from the Test BatteryReaction Time 2 15 Same as in the Test BatteryTarget Tracking 1 27 Same as in the Test BatteryCannon Shoot 48 Same as in the Test BatteryTarget Tracking 2 27 Same as in the Test BatteryTarget Shoot 40 Same as in the Test Battery
Figure 6.3 Items in the Computer Practice Battery used at theFort Knox Field Test.
6-20
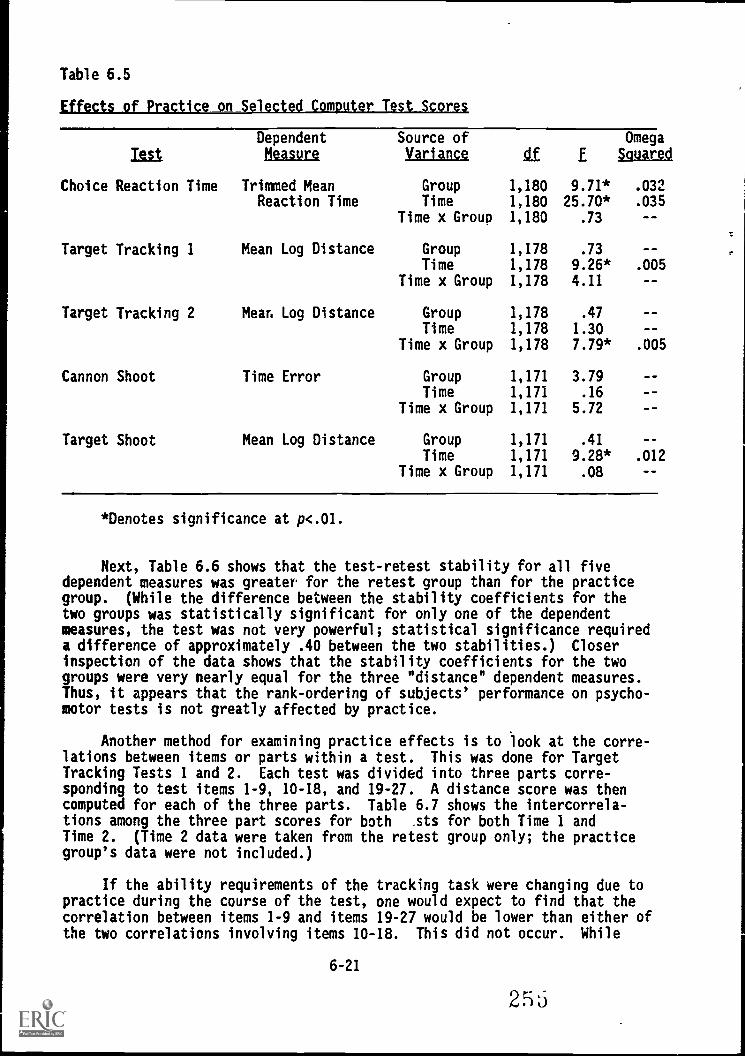
Table 6.5
Effects of Practice on _Selected Computer Test Scores
1211
DependentMeasure
Source ofVariance 4f f
OmegaSquared
Choice Reaction Time Trimmed Mean Group 1,180 9.71* .032Reaction Time Time 1,180 25.70* .035
Time x Group 1,180 .73
Target Tracking 1 Mean Log Distance Group 1,178 .73 - -Time 1,178 9.26* .005
Time x Group 1,178 4.11
Target Tracking 2 Mean Log Distance Group 1,178 .47
Time 1,178 1.30Time x Group 1,178 7.79* .005
Cannon Shoot Time Error Group 1,171 3.79Time 1,171 .16 --
Time x Group 1,171 5.72
Target Shoot Mean Log Distance Group 1,171 .41
Time 1,171 9.28* .012Time x Group 1,171 .08
*Denotes significance at p<.01.
Next, Table 6.6 shows that the test-retest stability for all fivedependent measures was greater for the retest group than for the practicegroup. (While the difference between the stability coefficients for thetwo groups was statistically significant for only one of the dependentmeasures, the test was not very powerful; statistical significance requireda difference of approximately .40 between the two stabilities.) Closerinspection of the data shows that the stability coefficients for the twogroups were very nearly equal for the three "distance" dependent measures.Thus, it appears that the rank-ordering of subjects' performance on psycho-motor tests is not greatly affected by practice.
Another method for examining practice effects is to look at the corre-lations between items or parts within a test. This was done for TargetTracking Tests 1 and 2. Each test was divided into three parts corre-sponding to test items 1-9, 10-18, and 19-27. A distance score was thencomputed for each of the three parts. Table 6.7 shows the intercorrela-tions among the three part scores for both .sts for both Time 1 andTime 2. (Time 2 data were taken from the retest group only; the practicegroup's data were not included.)
If the ability requirements of the tracking task were changing due topractice during the course of the test, one would expect to find that thecorrelation between items 1-9 and items 19-27 would be lower than either ofthe two correlations involving items 10-18. This did not occur. While
6-21
25
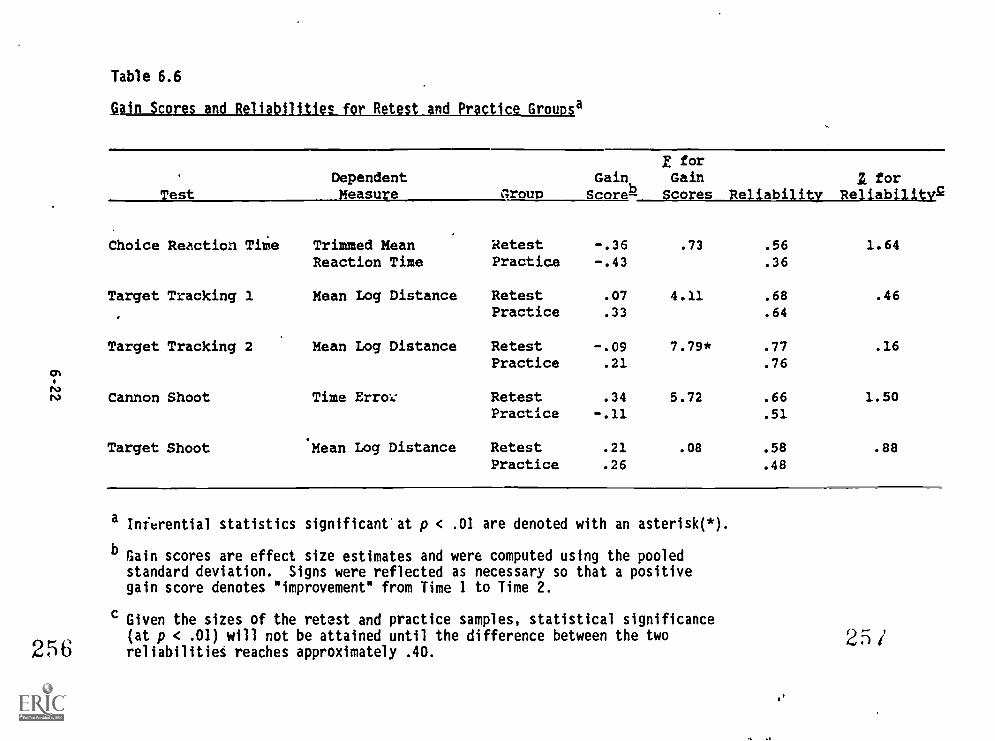
Table 6.6
ain S i b R t e Grou
TestDependentMeasure Group
GainScore
E forGainScores Reliability
forReliabilitv2
Choice Reaction Tillie Trimmed Mean Retest -.36 .73 .56 1.64Reaction Time Practice -.43 .36
Target Tracking 1 Mean Log Distance Retest .07 4.11 .68 .46
Practice .33 .64
Target Tracking 2 Mean Log Distance Retest -.09 7.79* .77 .16
Practice .21 .7601
N.N.11 Cannon Shoot Time Errol: Retest .34 5.72 .66 1.50Practice -.11 .51
Target Shoot Mean Log Distance Retest .21 .08 .58 .88
Practice .26 .48
a Inferential statistics significant'at p < .01 are denoted with an asterisk(*).
b Gain scores are effect size estimates and were computed using the pooledstandard deviation. Signs were reflected as necessary so that a positivegain score denotes "improvement" from Time 1 to Time 2.
Given the sizes of the retest and practice samples, statistical significance(at p < .01) will not be attained until the difference between the two
256 reliabilities reaches approximately .40.25 /
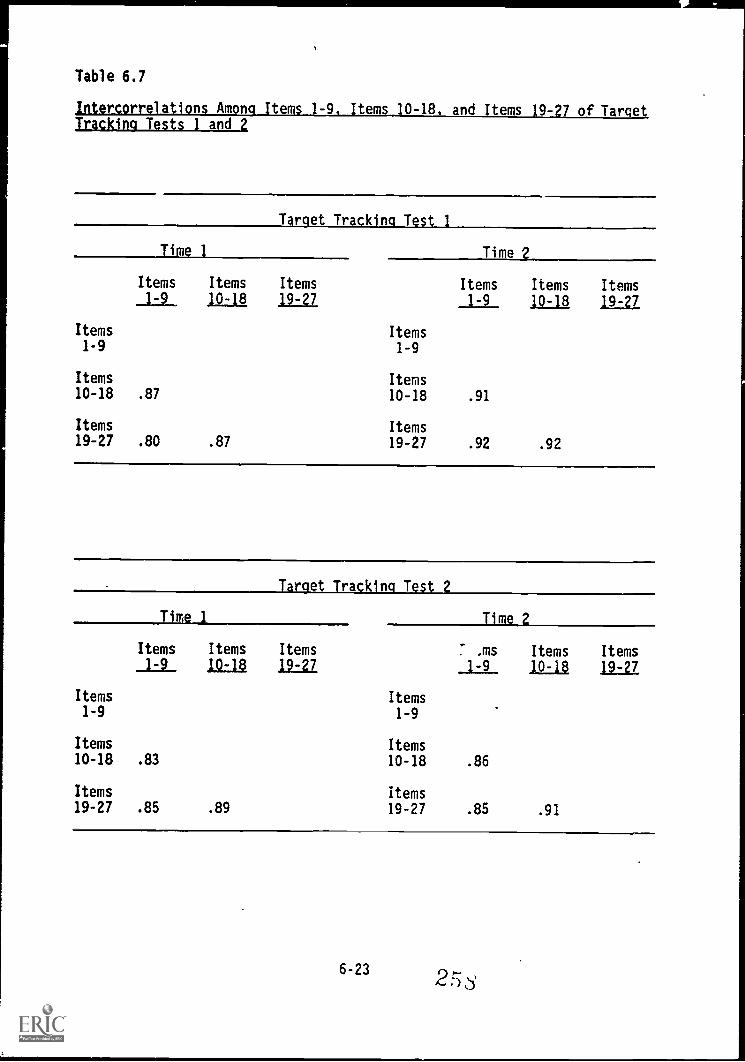
Table 6.7
1 a n Amon tern tern 0 -18, and tems f TargeTracking Tests 1 and 2
Target Tracking Test 1
Time 1 Time 2
Items1-9
Items10-18
Items19-27
Items_1:2_
.87
.80
Items
10-18Items
19-27Items
-9
Items
10-18Items19-27
.87
Items1-9
Items10-18
Items19-27
_1
.91
.92 .92
Target Tracking Test 2
Time 1 Time 2
Items1-9
Items10-18
Items19-27
Items
_1:2_
.83
.85
Items
10-18
Items
19-27. .ms Items
10-11
.91
Items
19-27
.89
Items1-9
Items10-18
items19-27
.86
.85
6-23 253
there is a slight tendency for the correlation between items 10-18 anditems 19-27 to be the highest of the three intercorrelations, the differ-ence between the highest a.d lowest correlation within each test averagesonly .05. Data in Table 6.1 show that the Spearman-Brown corrected spli'c,-half reliability of both tests is .97, suggesting that all of the itemswithin each test are measuring the same underlying ability.
In summary, data from the practice experiment indicate that scoresfrom computerized psychomotor tests appear to be quite stable over a two-week period. Practice does have some effect on test scores, but it appearsto be relatively small. Certainly it does not seem strong enough to war-rant serious concern about the usefulness of the tests.
,
2 5 li
6-24
COVARIANCE ANALYSES WITH ASVAB SUBTESTS AND COGNITIVE PAPER -AND- PENCIL TESTS
Table 6.8 contains the intercorrelations for the ASVAB subtests,paper-and-pencil cognitive measures, and the computer-administered tests;which include both perceptual and psychomotor measures. Scores on the AFQTare also included. These correlations are based on the Fort Knox fieldtest sample but include only those subjects with test scores available onall variables (N 168).
In examining these relationships, we first looked at the correlationsbetween tests within the same battery. As was discussed in Chapter 4,correlations between ASVAB subtest scores range from .02 to .74 (absolutevalues), and correlations between the cognitive paper-and-pencil testscores range from .27 to .67. For the perceptual computer-administeredtest scores, correlations range from .00 to .83 (absolute terms). Notethat the highest values appear for correlations between scores computedfrom the same test; for example, the correlation between Short-Term Memoryreaction time and intercept is .83, and the correlation between PerceptualSpeed and Accuracy slope and react ,n time is .82. Correlations betweenthe psychomotor computer-administered variables range from .15 to .81 (ab-solute terms). Note that scores on the two tracking tests correlate thehighest.
Perhaps the most important question to consider is the overlap be -enthe different groups of measures. Do the paper- and -pent I measurescomputer-administer 4 tests correlate highly with the ASVAB and wiltother or are they uring unique or different abilities? To address thisquestion, in part, examined the intercorrelations between the ASVAB,including AFQT, and other groups of tests.
As noted in Chapter 4, for the cognitive paper-and-pencil tests thesecorrelations range from .01 (Assembling Objects and Number Operations)to .63 (Orientation 3 and Mechanical Comprehension), with a mean correla-tion of .33 (sre Table 6.9 for a summary of the correlation statistics).Across all PTB paper-and-pencil tests, ASVAB Mechanical Comprehension ap-pears to correlate the highest with the new tests; across all ASVAB sub-tests, PTB Orientation 3 yields Ulu .iighest correlations.
The correlations between the ASVAB subtests and the computer-adminis-ter21 perceptual tests, in absolute terms, range from .00 (Paragraph Com-preh.a.sion with Perceptual Speed and Accuracy Reaction Time and with Short-Term Memory Intercept, and General Science with Perceptual Speed and Ac-curacy Slope) A .58 (Arithmetic Reasoning ant, Number Memory Percent Cor-rect). The mean of these 165 correlations is .1- (SD .12). Across allASVAB subtests, scores on the Short-Term Memory Reaction Time and Slopeyield the lowest correlations. The highest values appear for Number MemoryPercent Correct and Plaction Time.
The correlations between ASVAB subtests and psychomotor scores rangeprom .00 (Coding Speed with Target Shoot Time and T. get Shoot Distance) to.44 (Mechanical Comprehension and Tracking 1). .ae mean of these 44
correlations iabsolute values) is .17 (SD .12). Note that for the mostpart, these four PTB variables yield the hignest correlations with ASVABMechanical Comprehension and Electronics Information. The lowest correla-tions appear for Paragraph Comprehension, Number Operations, and CodingSpeed.
6-25
2 6 (i
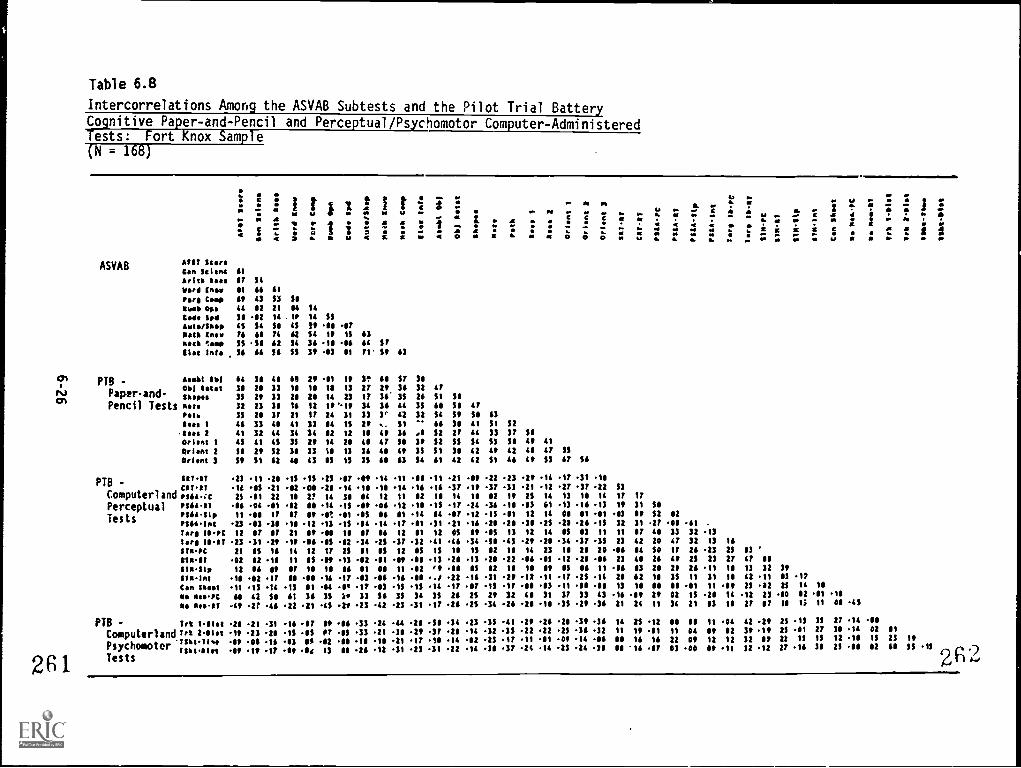
261
Table 6.8
Intercorrelations Among the ASVAB Subtests and the Pilot Trial BatteryCognitive Paper-and-Pencil and Perceptual/Psychomotor Computer-AdministeredTests: Fort Knox Sample(N = 168)
ASVAB AMIT Scoreton SclencA.10 00Vord KnowP ore Come
4.0 000.0 fdAmloOkopN an Coo.N oel tomfloc Info
PTB - Amol Obi00 Cotot
Paper-and- SksuPencil Tests nsts
' Sib
less 1101 20.1ent 1Cprlont 2
Orient 3
PTB -010
Computerl and :::.!1:c
Perceptual 'swatTests
01140410 23'oft 10 t 12lore 11.11 23114PC 21
11481 .02
0411, 12
S1NInt 14Con 11No Noo CNo Newer -40
4
61
81
81
If44
45
76
55
1L
35
32
35
4641
45
ft
66
0ft60066
31
20
23
333241
20
51
61
21
14
74
62
56
3333
37Le
44
45
52
62
23 -11 0It -05 2121 11 220 .04 1111 0 10
.03 300 031 2985 16
82 1116 09
12 1713 .1441 0
2r 46
PTB 1rt 1.1111 0 -21 .31Computerl and Ink 2.010 10 23 28
.".i".. " 01 "100.41or1 40 .10 .0
Tests
I
I43:
111
A
Is .2
3 ; .
7 AA
S
r N AtJ
45 w
1 A
a.
0C
51
1LIL 55
Lf. ft 0 .062 54 It 15 13
36 11 16 64 5755 30 13 71 ft 63
49 20.01 3t 3818 IS 14 13 20 29 36 32 5228 20 14 23 36' 35 26 $1 581 12 It 34 36 44 35 S 51 4021 17 24 31 33 3' 42 32 54 St 54 63
41 33 IS 19 51 66 34 0 51 52
34 34 12 12 18 49 31 52 zr 44 33 30
35 20 14 41 30 $2 $$ $5 $2 $5 4 41
38 33 SO 13 36 41 40 51 31 0 49 42 48 40 55
48 43 Of 35 61 63 54 61 L2 L2 51 46 40 53 67 56
15 5 0 .47 81 .14 11 -0 11 11 10 22 23 29 14 10 31 1112 81 28 14 111 11 14 16 16 30 10 30 .33 21 12 20 30 22 53
18 2! 14 0 0 12 11 02 IS IL IS 12 It 25 IL 13 0 IL 10 10
-0 00 .14 15 0 -06 .12 18 15 10 24 36 11 0 0 .13 16 .13 It 31 $507 0 0 11 85 16 el .14 .11 12 15 11 12 14 0 el 11 .13 Of 52 $2
111 12 13 15 .84 .14 10 11 31 21 16 28 0 .31 .25 21 -26 15 32 31 27 08 6121 It 0 IS 87 16 12 0 12 05 Of 0 13 12 14 0 13 11 11 80 LO 33 32 .13
10 86 0 42 .34 25 30 32 41 46 .34 .51 .LS .29 0 .34 30 35 23 42 20 40 32 13 16
14 12 17 25 81 0 12 0 If 18 If 12 IS 14 23 to 0 20 .16 84 $0 10 26 23 25 13
11 85 0 13 -12 41 .10 13 0 .13 28 22 16 15 12 0 06 23 26 4 25 23 20 47 18
0 14 10 16 81 08 11 -12 ft .0 Of 12 0 Of 0 0 11 16 43 28 26 11 IS 13 32 30
55 48 16 10 .13 86 16 .55 22 16 31 29 12 11 10 .25 .14 28 42 I 35 11 31 18 42 11 83 l,.13 81 84 01 .17 03 15 .15 .14 -0 .0 15 .10 .08 0 .11 .18 13 IS 41 11 10 25 12 25 IL 18
41 36 35 le 33 56 35 34 35 26 25 20 32 48 31 37 33 43 16 .49 29 02 15 21 IL 12 23 80 12 11 .18
22 21 45 0 3 42 23 31 .10 26 .25 34 -26 21 11 .35 20 36 21 24 11 34 21 83 IS 20 18 11 11 08 45
-16
.1543S
.0 Of -0683 or .1580 128d 13
.33 24
.33 21-le 1026 12
.44
.38
2131
211
201023
31 34-30 -211
.11 .1431 22
23140214
353223.31
41.351030
2922-11
24
262211.14
28.25
0023
30361424
.363216.28
14
11
25 12It 1116 1616 .0
18
11
22
03
040900
II
Of12
80
041212
11
42
30
32
32
-29.10Of12
21
21
22
20
1501IS
.16
35
20IS
38
27
3812
25
.14
1411.18
.8102IS
12
81
2361
It
0 15 9A./
The intercorrelations between the PTB cognitive paper-and-pencil testsand the computerized tests in general range from .00 to .46 (in absolute
terms). The mean of the 40 psychomotor/cognitive paper-add-pencil testscore correlations is .24 (SD = .11). The mean of the 150 perceptualcomputer score/cognitive paper-and-pencil test score correlations is .19
(SD = .1). Tne computerized test variables that correlate consistentlyhighly with the paper-and-pencil tests include Target Identification Reac-tion Time, Number Memory Percent Correct and Reaction Time, Tracking 1, and
Tracking 2.
Intercorrelations between the cognitive/perceptual computer tests andthe psychomotor computer tests range from .00 to .42 (mean = .15 and SD
= .11). The highest values appear for the correlations between the fourpsychomotor measures and Target Identification Percent Correct and Short-
Term Memory Slope.
Table 6.9 summarizes the correlational data in Table 6.8 that wediscussed just above. The values in the two tables and the discussion leadto the conclusion that the various types of measures do not overlap exces-sively, and, therefore, do appear to each make separate contributions toability measurement.
6-27
263
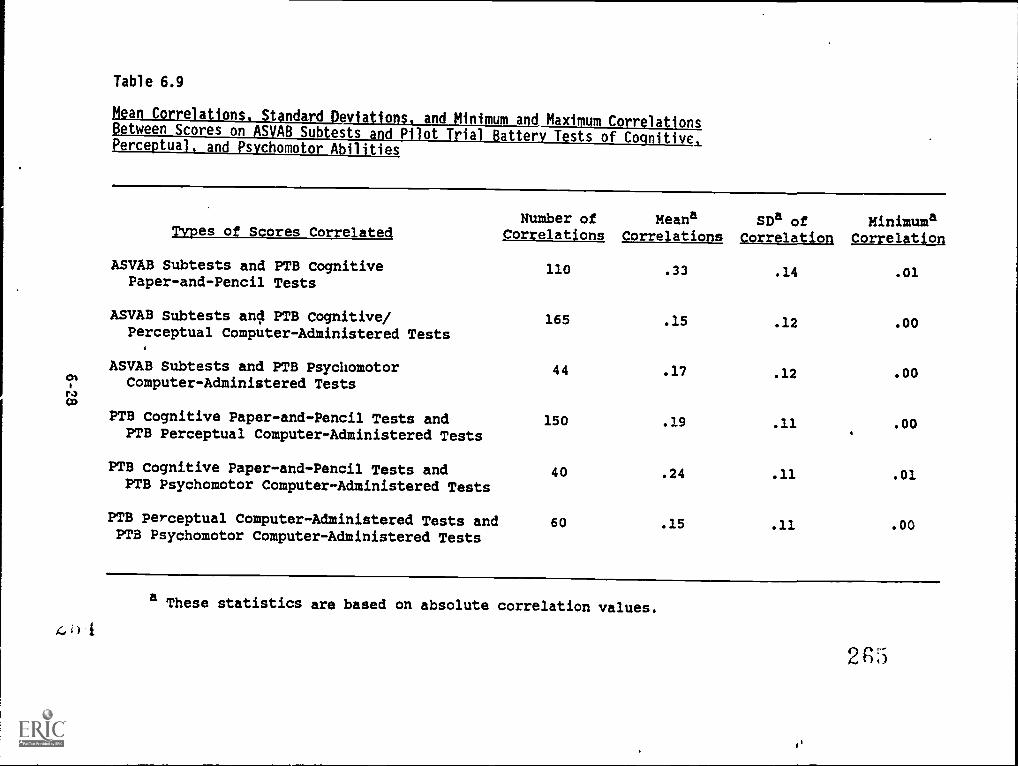
ro
Table 6.9
Mean Correlations. Standard Deviations, and Minimum and Maximum CorrelationsBetween Scores on ASVAB Subtests and Pilot Trial Battery Tests of Cognitive,Perceptual, and Psychomotor Abilities
Types of Scores CorrelatedNumber of
CorrelationsMeana
CorrelationsSDa of
CorrelationMinimuma
Correlation
ASVAB Subtests and PTB Cognitive 110 .33 .14 .01Paper-and-Pencil Tests
ASVAB Subtests and PTB Cognitive/ 165 .15 .12 .00Perceptual Computer-Administered Tests
ASVAB Subtests and PTB Psychomotor 44 .17 .12 .00Computer-Administered Tests
PTB Cognitive Paper-and-Pencil Tests and 150 .19 .11 .00PTB Perceptual Computer-Administered Tests
PTB Cognitive Paper-and-Pencil Tests and 40 .24 .11 .01PTB Psychomotor Computer-Administered Tests
PTB Perceptual Computer-Administered Tests and 60 .15 .11 .00PTB Psychomotor Computer-Administered Tests
a These statistics are based on absolute correlation values.
21;5
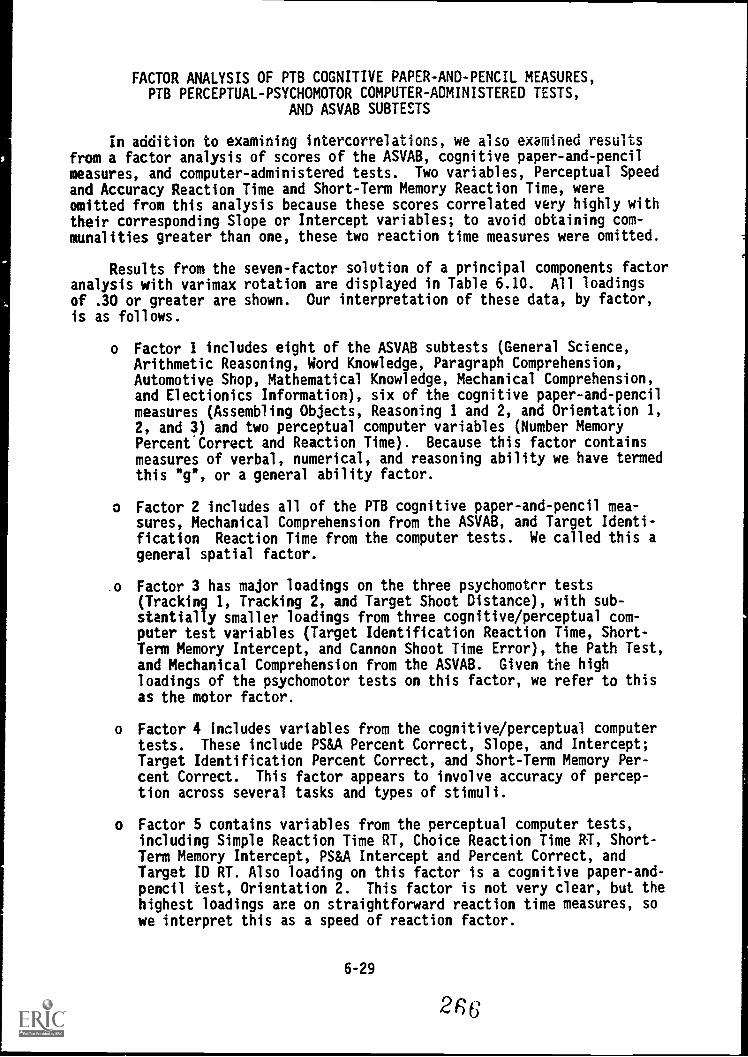
FACTOR ANALYSIS OF PTB COGNITIVE PAPER-AND-PENCIL MEASURES,PTB PERCEPTUAL-PSYCHOMOTOR COMPUTER-ADMINISTERED TESTS,
AND ASVAB SUBTESTS
In addition to examining intercorrelations, we also examined resultsfrom a factor analysis of scores of the ASVAB, cognitive paper-and-pencilmeasures, and computer-administered tests. Two variables, Perceptual Speedand Accuracy Reaction Time and Short-Term Memory Reaction Time, wereomitted from this analysis because these scores correlated very highly withtheir corresponding Slope or Intercept variables; to avoid obtaining com-munalities greater than one, these two reaction time measures were omitted.
Results from the seven-factor solution of a principal components factoranalysis with varimax rotation are displayed in Table 6.10. All loadings
of .30 or greater are shown. Our interpretation of these data, by factor,
is as follows.
o Factor 1 includes eight of the ASVAB subtests (General Science,Arithmetic Reasoning, Word Knowledge, Paragraph Comprehension,Automotive Shop, Mathematical Knowledge, Mechanical Comprehension,and Electionics Information), six of the cognitive paper-and-pencilmeasures (Assembling Objects, Reasoning 1 and 2, and Orientation 1,2, and 3) and two perceptual computer variables (Number MemoryPercent Correct and Reaction Time). Because this factor containsmeasures of verbal, numerical, and reasoning ability we have termedthis "g", or a general ability factor.
o Factor 2 includes all of the PTB cognitive paper-and-pencil mea-sures, Mechanical Comprehension from the ASVAB, and Target Identi-fication Reaction Time from the computer tests. We called this ageneral spatial factor.
.o Factor 3 has major loadings on the three psychomotor tests(Tracking 1, Tracking 2, and Target Shoot Distance), with sub-stantially smaller loadings from three cognitive/perceptual com-puter test variables (Target Identification Reaction Time, Short-Term Memory Intercept, and Cannon Shoot Time Error), the Path Test,and Mechanical Comprehension from the ASVAB. Given the highloadings of the psychomotor tests on this factor, we refer to thisas the motor factor.
o Factor 4 Includes variables from the cognitive/perceptual computertests. These include PS&A Percent Correct, Slope, and Intercept;Target Identification Percent Correct, and Short-Term Memory Per-cent Correct. This factor appears to involve accuracy of percep-tion across several tasks and types of stimuli.
o Factor 5 contains variables from the perceptual computer tests,including Simple Reaction Time RT, Choice Reaction Time RT, Short-Term Memory Intercept, PS&A Intercept and Percent Correct, andTarget ID RT. Also loading on this factor is a cognitive paper-and-pencil test, Orientation 2. This factor is not very clear, but thehighest loadings are on straightforward reaction time measures, sowe interpret this as a speed of reaction factor.
6-29
266
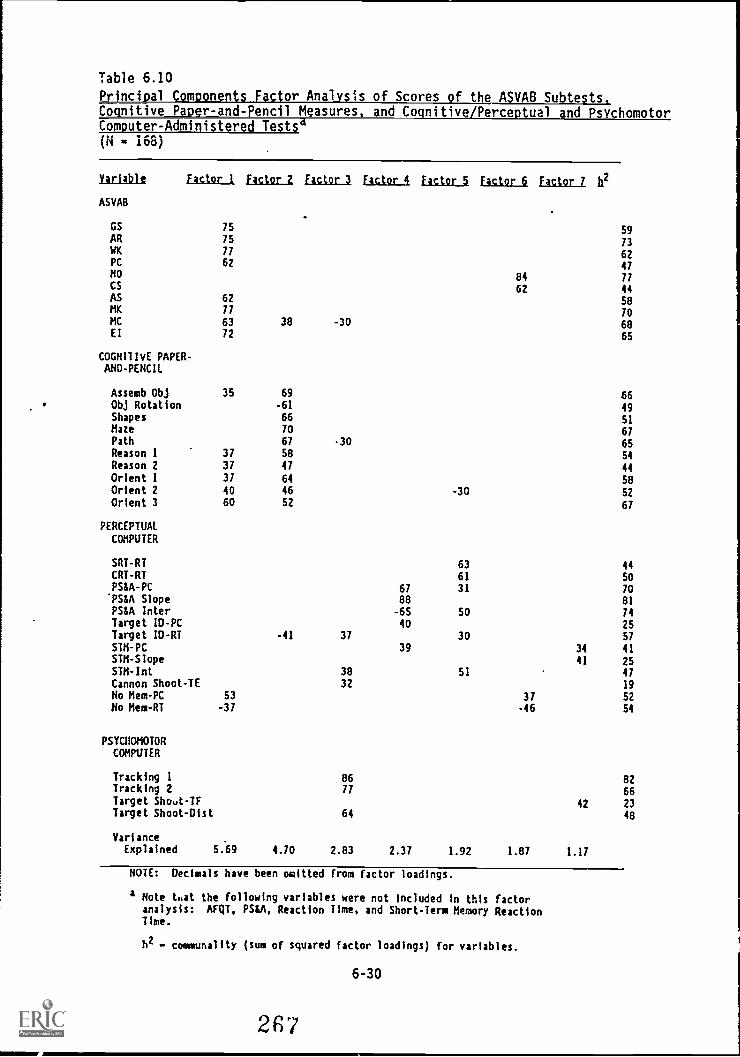
Table 6.10
Principal Comments Factor Analysis of Scores of the ASVAB Subtests,Cognitive Paper-and-Pencil Measures, and Cognitive/Perceptual and PsychomotorComputer-Add nistered Testsd(N - 168)
Variablt Factor 1 factor Z Factor 3 factor 4 Factor 5 factor 6 factor 7 h2
59
73
62
47
77
ASVAB
GSARWXPCNO
75
75
77
62
84CS 62 44AS 62 58MK 77 70MC 63 38 -30 68El 72 65
COGNITIVE PAPER-AND-PENCIL
Assemb Obj 35 69 66Obj Rotation -61 49Shapes 66 51Maze 70 67Path 67 -30 65Reason 1 37 58 54Reason 2 37 47 44Orient 1 31 64 58Orient 2 40 46 -30 52Orient 3 60 52 67
PERCEPTUALCOMPUTER
SRT-RT 63 44CRT-RT 61 50PS&A-PC 67 31 70PM Slope 88 81PSEA Inter -65 50 74Target 1D-PC 40 25Target ID-RT -41 37 30 57STM-PC 39 34 41STM-Slope 41 25STM-Int 38 51 47Cannon Shoot-TE 32 19
No Mem-PC 53 37 52No Hem -RT -37 -46 54
PSYCHOMOTORCOMPUTER
Tracking 1 86 82Tracking 2 77 66Target Shout-TF 42 23Target Shoot-Dist 64 48
VarianceExplained 5:69 4.70 2.83 2.37 1.92 1.87 1.17
NOTE: Decimals have been omitted from factor loadings.
a Note that the following variables were not included in this factoranalysis: AFQT, PS&A, Reaction Time, and Short-Term Memory ReactionTime.
h2 communality (sum of squared factor loadings) for variables.
6-30
267
o Factor 6 contains four variables, two from the ASVAB (Number Opera-tions and Coding Speed) and two from the perceptual computer tests(Number Memory Percent Correct and Reaction Time). This factorappears to represent both speed of reaction and arithmetic ability.
o Factor 7 contains three variables from the computer-admini:teredtests: Short-Term Memory Percent Correct and Slope, and TargetShoot Time to Fire. This factor is difficult to interpret, but webelieve it may represent a response style factor. That is, thisfactor suggests that those individuals who take a longer time tofire on the Target Shoot Test also tend to have higher slopes onthe Short-Term Memory Test (lower processing speeds with increasedbits of information) but are more accurate or obtain higher percentcorrect values on Short-Term Memory.
Note that several variables--Target Identification Percent Correct,Short-Term Memory Percent Correct, Cannon Shoot Time Error, and TargetShoot Time to Fire--have fairly low communalities. These may be due torelatively low score variance or reliability, but it could also be due tothose variables having unique variance, at least when factor analyzed withthis set of tests. We think this latter explanation is highly plausiblefor the Cannon Shoot score.
This concludes the discussion of the pilot testing and the Fort Knoxfield test of the cognitive paper-and-pencil tests and the computer-administered tests in the Pilot Trial Battery. We turn now to a discussionof the non-cognitive measures in Chapters 7 and 8.
6-31
268
Chapter 6 References
McHenry, J. J., & McGue, M. K. (1985). Problems, issues, and results inthe development of computerized psychomotor measures. Paper presentedat the 93rd Annual Convention of the American Psychological Associa-tion, Los Angeles.
Toquam, J. L., Dunnette, M. D., Corpe, V., McHenry, J. J., Keyes, M. A.,McGue, M. K., Houston, J. S., Russell, T. L., & Hanson, M. A. (1985).Development of cognitive/perceptual measures: Supplementing the ASVAB.Paper presented at the 93rd Annual Convention of the American Psycho-logical Association, Los Angeles.
6-32
26!)
CHAPTER 7
NON-COGNITIVE MEASURES: PILOT TESTING
Leaetta N. Hough, Bruce H. Barge, and John O. Kamp
GENERAL
In this chapter, we describe the development and pilot testing of thenon-cognitive measures prepared for inc "ision in the Pilot Trial Battery.All are paper-and-pencil Aeasures. The inventories developed tap con-structs in the temperament, interest, and life history (biodata) domains.Field testing of these measures is covered in Chapter 8.
The non-cognitive measures were pilot tested at Fort Campbell and FortLewis in the spring of 1984. In addition to the newly developed measures,four published, marker measures of temperament were utilized in the pilottests. Chapter 2 contains a detailed description of the pilot test proce-dures and samples and we do not repeat that discussion here. The pilottest results are discussed later in this chapter; we first discuss thedesired characteristics of these measures.
Desired Characteristics
As described in Chapter 1, the Task 2 research team extensively re-viewed the literature and the existing tests and constructs available inthe non-cognitive area as well as in the cognitive and psychomotor areas.The literature review served to identify non-cognitive constructs mostrelevant and important for the prediction of success in a variety of ArmyMOS (Hough, Kamp, & Barge, 1985).
.In the non-cognitive area, there was particular interest in predicting"adjustment" criteria, such as attrition, job satisfaction, and unfavorabledischarge/disciplinary action, as well as job and training performance.Attention to adjustment criteria was important in the development of non-cognitive predictors because these criteria are typically not highly re-lated to scores on cognitive or perceptual/psychomotor tests. Non-cog-nitive measures were also seen as valuable for use in classification. Theexpert judgment research (see Chapter 1) indicated the importance of in-cluding measures of several non-cognitive constructs. Following theseexplorations, the IPR meeting in March 1984 resulted in the identificationof a set of non-cognitive constructs to be developed for the Pilot TrialBattery. (See Figure 1.5.)
Development of the non-cognitive measures was guided by several impor-tant, yet sometimes conflicting, goals. First, it was desired that thescales have construct validity. Item content of each scale should a heter-ogeneous enough to cover all important aspects of the targeted construct,yet homogeneous enough to be interpretable and distinct from other con-structs. In addition, the scales should be a valid assessment of therespondent's standing on the construct, rather than merely a reflection ofsocial desirability.
Other important considerations during the development of the inven-
7-1
270
tories included reliability and stability. The scales were to be bothinternally consistent and stable over time (test-retest). The measuresshould also be stable over situations, so that faking or differing responsesets would not greatly distort the scores obtained. Items and scalesshould elicit sufficient variance in responses that the scores could beused to differentiate ,,espondents. It was important that the item contentbe non-objectionable. Finally, it was extremely important that the mea-sures be able to demonstrate validity in predicting the respondent'sstanding on various job performance and other important criteria.
ABLE and AVOICE
The above set of desired characteristics formed the basis for thedevelopment of the scales to be described in this chapter. Our discussionof these scales is divided into two areas that correspond to the twoinventories that were employed. The ABLE (Assessment of Background andLife Experiences) contains items that assess the important constructs ofthe temperament and life history (biodata) domains. The items on the ABLEare all new items written by PDRI researchers. Each item was written totap one of the constructs identified via the literature review and otherearlier phases of the project (see above and Chapter 1). Many candidateitems were written. These were reviewed by the entire non-cognitive teamand the best appearing items were selected for initial inclusion on theABLE. The main criteria for item selection were: the item was clearlyrelevant for measuring a targeted construct; it was clearly written, andcontent was non-objectionable. The AVOICE (Army Vocational Interest CareerExamination) measures the relevant constructs of the interest domain. TheAVOICE is a significantly modified version of the VOICE (Vocational In-terest Career Examination) which had been developed and researched by theU.S. Air Force (Alley & Matthews, 1982). In general, items were modifiedto measure interests that seemed more appropriate to Army occupations.Items were also written to tap interests that were not included on theVOICE. We describe the constructs, scales, and pilot test results of theABLE first, and then do the same for the AVOICE.
The constructs chosen for the battery are described with examples ofthe item content for each construct scale; any revisions made on the basisof the pilot tests are discussed. Data obtained during the pilot testingare reported, including means, standard deviations, reliabilities, scaleintercorrelations, factor analyses results, gender and race differences,and, when available, correlations with marker tests. Finally, the non-cognitive measures and the results obtained with them are summarized.
271
7-2
TEMPERAMENT/BIODATA CONSTRUCTS
Before discussing constructs that underlie the development of theABLE, we need to explain how and why the inventory combines the two domainsof temperament and biodata. Primarily, this action was taken to capitalizeon the complementary strengths and weaknesses of each domain. The differ-ences that exist between them allow each to contribute unique informationto an assessment, and yet are not so large as to preclude a unified inven-tory, as described in Chapter 1.
Temperament and biodata differ from each other along the sign/samplecontinuum proposed by Wernimont and Campbell (1968). Biodata items arebest viewed as a sample of past behavior that may predict future behaviorin a similar situation. Temperament measures are most often a sign, or anindicator, of a predisposition to behave in certain ways. Thus, each typeof information is geared toward predicting future behavior, but each doesit from a somewhat different perspective along the sign/sample continuum.
Temperament and biodata may also differ in the emphasis placed onconceptual understanding. The study of temperament has, over the years,attached importance to the measurement of constructs and the understandingassociated with such measurement. Biodata, by contrast, has typically beenemployed in situations requiring maximal criterion-related validity butlittle resulting understanding.
In short, temperament and biodata both are used to predict an indivi-dual's future-behavior, but from different viewpoints and perhaps fordiffering reasons. The distinctions between items frc'' the two ,wmains arenot sharp, so merging of the two sets is feasible. Yet their rr_pectivestrengths complement each other when combined in a unified fashion, as inthe ABLE.
in this section, we discuss the six temperament/biodata constructs as-sessed by the ABLE, the physical condition constructs and the responsevalidity scales that were developed. Table 7.1 shows these eight cate-gories and the 15 scales that fall under them.
Strictly speaking, the physical condition construct does not fit intothe temperament/biodata domain in the same way that the other constructsdo. It is a highly specific construct that does not have the relativelyextensive, prior research history that the other constructs have. It wasincluded, however, because the construct was seen as important for Armyoccupations and because we could not measure physical condition directly aspart of this research project. The ABLE seemed the best instrument forcollecting the physical condition measure, and so it was included as one ofthe target constructs.
When used in the initial pilot testing at Fort Campbell, the ABLEincluded a total of 291 items. It was shortened to 268 items for the laterFort Lewis pilot test. (See Chapter 2 for detailed information on theprocedures and samples for these pilot tests.) Most of these items havethree response options that reflect a continuum of the construct in ques-tion. The response o,Lion that reflects the highest level of the construct
7-3
2 7 2
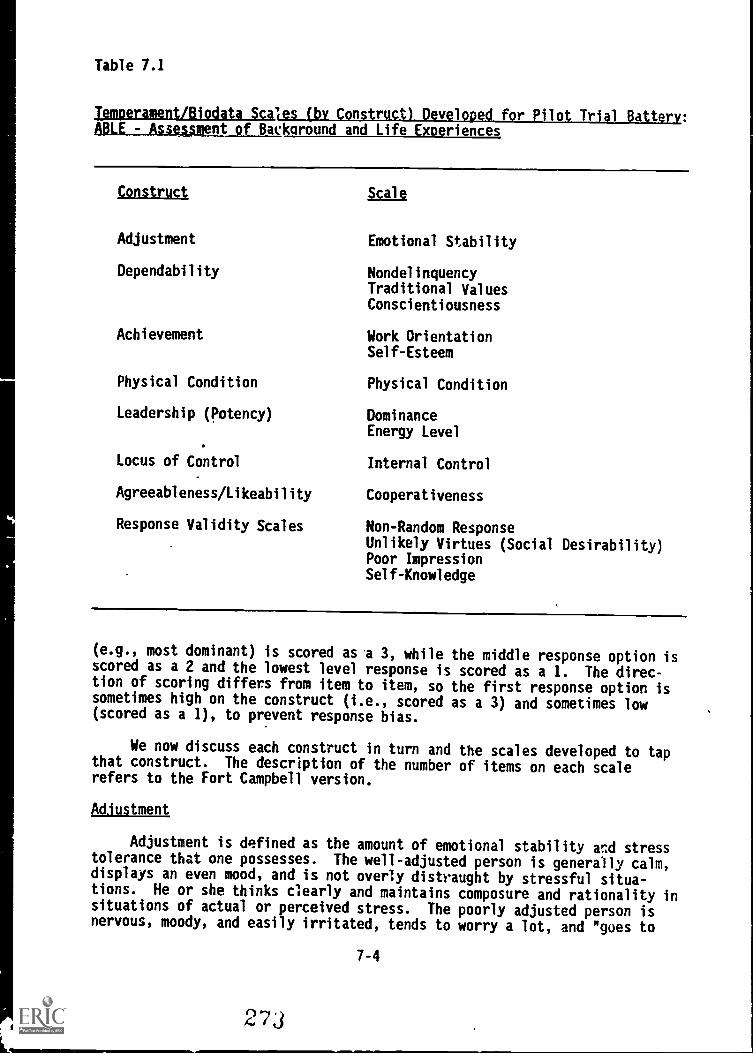
Table 7.1
Temoerament/Biodata Scales (bv Construct) Developed for Pilot Trial Battery:ABLE - and Life Exoeriences
Construct
Adjustment
Dependability
Achievement
Physical Condition
Leadership (Potency)
Locus of Control
Agreeableness/Likeability
Response Validity Scales
Scale
Emotional Stability
NondelinquencyTraditional ValuesConscientiousness
Work OrientationSelf-Esteem
Physical Condition
DominanceEnergy Level
Internal Control
Cooperativeness
Non-Random ResponseUnlikely Virtues (Social Desirability)Poor ImpressionSelf-Knowledge
(e.g., most dominant) is scored as a 3, while the middle response option isscored as a 2 and the lowest level response is scored as a 1. The direc-tion of scoring differs from item to item, so the first response option issometimes high on the construct (i.e., scored as a 3) and sometimes low(scored as a 1), to prevent response bias.
We now discuss each construct in turn and the scales developed to tapthat construct. The description of the number of items on each scalerefers to the Fort Campbell version.
Adjustment
Adjustment is defined as the amount of emotional stability and stresstolerance that one possesses. The well-adjusted person is generally calm,displays an even mood, and is not overly distraught by stressful situa-tions. He or she thinks clearly and maintains composure and rationality insituations of actual or perceived stress. The poorly adjusted person isnervous, moody, and easily irritated, tends to worry a lot, and "goes to
7-4
273
pieces" in times of stress.
The scale ;ncluded under the Adjustment construct is called EmotionalStability. It is a 31-item scale that contains items such as:
Have you ever felt sick to your stomach when you thought aboutsomething you had to do?"
s Do you handle pressure better than most other people?
The scale is designed to assess a person's characteristic affect andability to cope effectively with stress.
Dependability
The Dep4ndability construct refers to a person's characteristic degreeof consclenIA o$less. The dependable person is disciplined, well-organiz-4, Yr!anful, respectful of lzws and regulations, honest, trust-worthy, wholesome, and accepting of authority. Suct a person prefers orderand thinks before acting. The less dependable person is unreliable, actson the spur of the m,ment, and is rebellious and contemptuous of laws andregulations. Three ABLE scales fall under the Dependability construct:inc ,ling Nondelinguency, Traditional Values, and Conscientiousness.
Ncndelinquen'y is a 24-item scale that assesses how often a person hasviolated rules, laws, or social norms. It includes items such as:
how often have you gotten into fights?
Before joining the Amy, how hard did you think learning to takeorders would be?
. How many times were you suspended or expelled from high school?
Traditional Values, a 19-item scale under the Dependability construct,contains items such as the following:
Are you more strict about right and wrong than most people yourage?
People should have greater respect for authority. Do you agree?
These 'tems assess how conventional or strict a person's value systemis, and how mucn Flexibility he/she has in this value system.
Conscientiousness, the third scale falling under the Dependabilityconstruct, contains 24 items. This scale assesses the respondent's degreeof dependability, as well as the tendency to be organized and planful.Items include:
How often do you keep the promises you make?
o How often do you ac.. on the spur of the moment?
7-5
274
Achievement
The Achievement construct is defined as the tendency to strive forcompetence in one's work. The achievement/work-oriented person works hard,sets high standards, tries to do a good job, endorses the work ethic, andconcentrates on and persists in completion of the task at hand. Thisperson is also confident, feels success from past undertakings, and expectsto succeed in the future. The less achievement-oriented person has littleego involvement in his or her work, feels incapable and self-doubting, doesnot expend much effort, and does not feel that hard work is desirable.Two scales fall under the Achievement construct.
The 31-item scale entitled Work Orientation addresses how long, hard,and well the respondent typically works and also how he/she feels aboutwork. Among the scale items are these:
How often do you give up on a difficult problem?
How hard were you willing to work for good grades in high school?
How important is your work to you?
The other scale pertaining to Achievement is called Self-Esteem, a 16-item scale that measures how much a person believes in himself/herself andhow successful he/she expects to be in life. Items from this scale in-clude:
Do you believe you have a lot to offer the Army?
Has your life so far been pretty much a failure?
Phvsical Condition
The optimal way to establish physical condition is, of course, toadminister physical conditioning tests. Since such a program could not bea part of the Trial Battery, however, it was decided to ask self-reportquestions through which soldiers could indicate their perceived physicalfitness levels. As noted earlier, the construct of physical condition wasincluded in the ABLE because it was the best tool available to collect suchself-report data.
The Physical Condition construct refers to one's frequency and degreeof participation in sports, exercise, and physical activity. Individualshigh on this dimension participate in individual and team sportsand/or exercise vigorously several times per week. Those low on thisdim'sion have participated only minimally in athletics, exercise infre-quently, and prefer the elevator to the stairs.
The scale developed to tap this construct is also called PhysicalCondition, and includes 14 items. The items assess how vigorously, regu-larly, and well the respondent engages in physical activity. These itemsare included on the scale:
4 Prior to joining the Army, how did your physical activity (work anurecreation) compare to most people your age?
7-6
Before joining the Army, how would you have rated your performancein physical activities?
Leadershio &tem!'
This construct is defined as the degree of impact, influence, andenergy that one displays in relation to other people. The Person high onthis characteristic is appropriately forceful and persuasiv_, is optimisticand vital, and has the energy to get things done. The person low on thischaracteristic is timid about offering opinions or providing direction andis likely to be lethargic and pessimistic.
Two ABLE scales are associated with the Leadership construct: Domi-nance and Energy Level. Dominance is a 17-item scale that include: suchitems as:
How confident are you when you tell others what to do?
How often do people turn to you when decisions have to be made?
The scale assesses the respondent's tendency to take charge or toassume a central and public role.
The other Leadership scale, entitled Energy Level, is designed tomeasure to what degree one is energetic, alert, and enthusiastic. Thisscale includes 27 items, such as these:
Do you get tired pretty easily?
At what speed do you like to work?
. Do you enjoy just about everything you do?
Locus of Control
The Locus of Control construct refers to one's characteristic beliefin the amount of control he/she has or people have over rewards and pun-ishments. :he person with an internal locus of control expects that thereare consequences associated with behavior and that people control whathappens to them by what they do. The person with an external locus ofcontrol believes that what happens to people is beyond thdr personalcontrol.
The Internal Control scale is the only ABLE scale that taps the Locusof Control construct. It is a 21-item scale that assesses both internaland external control, primarily as they pertain to reaching success on thejob and in life. The following are example items:
Getting a raise or a promotion is usually a matter of luck. Do youagree?
Do you believe you can get most of the things you want if you workhard enough for them?
7-7 27t
Agraaljoness/Likeabilitv
Tie Agreeableness/Likeability construct is defined as the degree of plea-santness versus unpleasantness a persoG exhibits in interpersonal rela-
tiwis. The agreeable and likeable person is pleasant, tolerant, tactful,helpful, not defensive, and generally easy to get along with. His/her
participation in a group adds cohesiveness rather than friction. The
relatively disagreeable and unlikeable person is critical, fault-finding,touchy, defensive, alienated, and generally contrary.
The Cooperativeness scale is the only measure of this construct in theABLE, and is composed of 28 items. These items assess how easy it is toget along with the person making the responses. Items from this scale
include:
e How often do you lose your temper?
Would most people descrite you as pleasant?
How well do you accept criticism?
Response "aliditv Scales
The purpose of the validity scales is to provide additional informa-tion about the way in which resposidents have completed the ABLE. The
primary purpose of these scales is to determine the validity of the re-spoh.ls, that-is, the degree to which ne responses are accurate depictionsof the person completing the inventory. Those who are responding in aninaccurate way can be identified, and appropriate action taken. (For
example, scores on content scales could be adjusted or the subject could berequired to retake the inventory.; For those who appear to be respondinga:curately, the responses can Se analyzed with greater confidence.
Four validity scales are included on the ABLE: Non-Random Response,Unlikely Virtues (Social Desirability), Poor Impression, and Self-Knowledge. These validity scales are modeled on similar kinds o: scalesthat are routinely used in many measures of temperament, for example on theMinnesota Multiphasic Psychological Inventory ( Dahlstrom, Welsh, &Dahlstrom, 1975) and the California Psychological Inventory (Gough, 1975).Each scale .s discussed below.
The Non-Random Response scale is very different in content and scoringfrom other scales in the ABLE. The response options for an item do ngform a continuum that indicates more or less random responding. Rather,
there is one right answer which is scored as a 1, while the other tworesponse options are both wrong and are both scored zero. Also, the con-
tent does not ask about oneself; instead, it asks about information thatIny person is virtually certain to know.
next:
Two of the eight items from the Non-Random Response scale are shown
7-8
The branch of the military that deals most with airplanes is the:
1. Military police2. Coast Guard3. Air Force
Groups of soldiers are called:
1. Tribes2. Troops3. Weapons
The intent of this scale is to detect those respondents who cannot orare not reading the questions, and are instead randomly filling in thecircles on the answer sheet. Responses from those with a low score on thisscale may be eliminated from the analyses since their responses appear tobe random.
The second validity scale, entitled Unlikely Virtues, is aimed atdetecting those who respond in a socially desirable manner (i.e., "fakegoel") rather than an honest manner. There are 12 items on this scale, ofwhich these are a sample:
Do you sometimes wish you had more money?
Have you always helped people without even the slightest bit ofhesitation?
Scoring on this scale uses the continuum of response options as de-scribed earlier, and those with a high score appear to be responding asthey think a person should rather than honestly.
Poor Impression is the third of the ABLE validity scales, and reflectsattempts to simulate psychopathology. Persons who attempt to "fake bad"receive the most deviant :cores on scales such as this, while psychiatricpatients score average or slightly higher than average. Thus, this scale isdesigned to detect those respondents who wish to make themselves appearemotionally unstable when in fact they are not unstable.
The Poor Impression scale has 23 items, most of which are also scoredon another substantive ABLE scale. Items from this scale include thefollowing:
How much resentment do you feel when you don't get your way?
Did your high school classmates consider you easy to get. along with?
How often do you keep the premises that you make?
Scoring on the scale is similar to that of the Non-Random Responsescala, in which only one of the response options is scored as a I and theother two response options are scored zero. The response option scored 1 isthe option that indicates the least social desirability.
7-9 27j
The final validity scale is the Self-Knowledge scale, which has 13items. This scale is intended to identify people who are more self -away ,
more insightful, and more i,kely to have accurate perceptions about them-selves. The responses of persons high on this scale may have more validityfor predicting job criteria. The following are items from the Self-Knowledge scale:
Do other people know ye.: better than you know yourself?
How often du you think about who you are?
All three of these scales (Unlikely Virtures, Poor Impression, andSelf-Knowledge) could be used to identify suspect inventories in order toeither drop the inventory from further analysis or adjust the contentscales to take account of the scores on these scales. It was part of theresearch task to collect and analyze data to inform the best way to usethese scales. In particular, the faking/fakability research, reported inChapter 8, was intended to fulfill this purpose.
?79
7-10

ABLE REVISIONS BASED ON PILOT TESTING
The non-cognitive inventories were pilot tested at two of the three
pilot test sites: Fort Campbell and Fort Lewis. Data from these pilot
tests are presented in the following section. First, however, in the
following paragraphs we discuss the changes made in the ABLE on the basis
of the two pilot tests to prepare the ABLE inventc-y for field testing.
The changes are discussed for the ABLE as a whole rather than by scale,
since the changes made were highly similar across scales.
Revision of the ABLE took place in three steps. The first was edi-
torial revision prior to pilot testing, the second was based on Fort
Campbell results, and the thJrd was based ors Fort Lewis findirgs. The
editorial changes prior to pilot testing were made by PDRI, acting on
suggestions from both ARI aad PDRI reviews of the instrument.
The first editorial review resulted in the deletion of 17 items and
the revision of 158 items. These actions were made to improve the apparent
quality of the inventory, and largely consisted of minor changes in
wording. Many of the changes resulted in more consistency across items in
format, phrasing, and response options, and made the inventory easier and
faster to take.
When the inventory was initially administered at Fort Campbell on 16
May 1984, the respondents raised very few criticisms or cuncerns about the
ABLE. Several subjects did note the redundancy of the items on the Phys-
ical Condition scale, and this 14-item scale was shortened to nine items.
One additional item characterized as irrelevant was revised.
.Item analyses were based on data from 52 Fort Campbell subjects who
completed the ABLE. The two statistics that were examined far each ABLE
item were its correlation with the total scale on which it is scored and
the endorsement frequencies for all of its response options.
Items that failed to correlate at least .15 in tht appropriate direc-
tion with their respective scales were considered potentially weak. Items,
other than validity scale items, for which one or more of the response
options were endorsed by fewer than two subjects (i.e., < 4% of the sample)
were also identified. Six items fell into the former category, 63 items
fell into the latter, and an additional 1 fell into both. All of them were
examined for revision or deletion, as approptiate.
In summary, a total of 23 items were deleted and 173 items revised on
the basis of the editorial review and Fort Campbell findings. Items de-
leted were those that did not "fit well" either conceptually or statis-
tically, or both, with the other items in the scale and with the construct
in question. If the item appeared to have a "good fit" but was not clear
or did not elicit sufficient variance, it was revised rather than deleted.
The ABLE, which had begun at 291 items, was now a revised 268-item inven-
tory ready to be administered at Fort Lewis.
The ABLE inventory was completed by 118 soldiers during the 11-15 June
pilot testing at Fort Lewis. Item response frequency distributions wereexamined to detect items with relatively little discriminator" power.
There were only three items where two of the three response .voices were
enJorsed by less than 10% of the sample not including validity scale
7-1123o
items). lifter examining the content of these three items, it was decidedto leave two of them intact, and delete one. Twenty items were revisedbecause one of the three response choices was endorsed by less than 10percent of the sample.
Overall, the inventory appeared to be functioning well and only minorrevisions were required prior to field test. On the following pages, thepsychometric data obtained during the two pilot tests are presented.
7-12
PILOT TEST DATA FOR THE ABLE
Fort Campbell
We begin the presentation of Fort Campbell pilot test data with the
results of data screening for the ABLE. The responses of four soldiers were
eliminated from analyses--two because more than 10 percent of the data was
missing, and two because their Non-Random Response scale scores suggested pos-
sible random responding (scores 1LJs than 7, out of 8). The total N remaining
was .52.
Table 7.2 presents means, standard deviations, mean item -total correla-
tions, and Hoyt internal consistency reliabilities for each ABLE scale. The
Poor Impression scale is not shown in this table because it was not scored for
this sample. This scale is made up almost entirely from items appearing on
other scales and, as described earlier, was intended to detect respondents
trying to simulate psychopathology--usually for purposes of avoiding entry
into the military. Since these subjects were volunteers currently on active
duty, the sample size was small, and we had invoked no experimental conditions
designed to elicit a range of scores on this scale. We, therefore, did not
score or analyze this scale on this sample.
The reliabilities of the ABLE scales are excellent. In Table 7.3, the
scale intercorrelations are shown. It is interesting to note the low correla-
tions between the Unlikely Virtues scale, which is an indicator of Social
Desirability, and the other scales. This finding, although based on a small
sample, suggests that soldiers were not responding only in a socially desir-
able fashion, but instead were responding honestly.
The matrix of 10 A3LE scale intercorrelations (Physical Condition and the
validity scales were not included) was factor analyzed (principal factor anal-
ysis)-and rotated to a simple structure (varimax rotation). The four-factor
solution that appeared most meaningful is shown in Table 7.4. We labeled the
four factors Potency, Soc'alization, Dependability, and Likeability.
The scales loading highest on Factor I, Potency, are Dominance, Energy
Level, and Self-Esteem; the scales loading highest on Factor II, Socializa-
tion, are Locus of Control, Traditional Values, and Nondelinquency; the scales
loading highest on Factor III, Dependability, are Conscientiousness and Work
Orientation; the scales loading highest on Factor IV, Likeability, are
Emotional Stability and Cooperativeness. These results are, however, viewed
as extremely tentative, given the small sample size upon which the factor
analysis was based.
In addition to the ABLE, four well-established measures of temperament
had been administered to 46 Fort Campbell soldiers to serve as marker vari-
ables: the Socialization scale of the California Psychological Inventory,
Rotter's Locus of Control scale, and the Stress Reaction scale and Social
Potency scale of the Differential Personality Questionnaire. The four scales
(known as the Personal Opinion Inventory, POI) had also been used earlier in
this project as part of the Preliminary Battery.
Dat' screening for this joint administration of the ABLE and the POI
marker variables results in elimination of three inventories (two on the ABLE
and one on the POI) because more than 10 percent of the data was missing, and
7-13 2R2
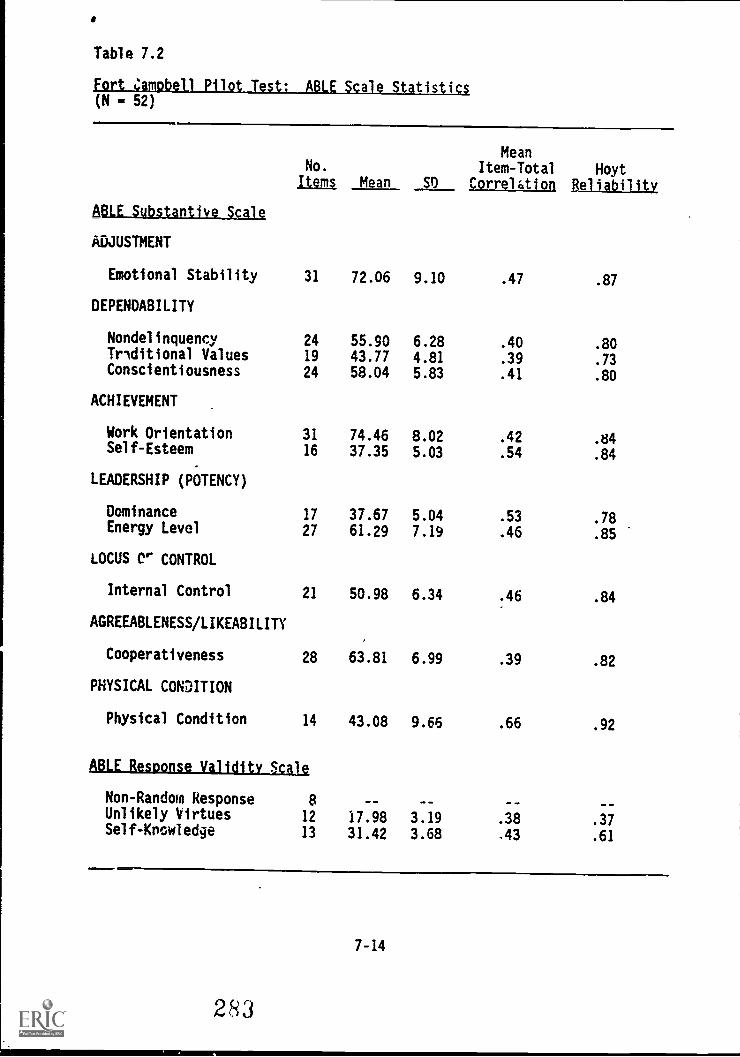
Table 7.2
Fort amDbetl Pilot Test: ABLE Scale Statistics(N 52)
ABLE Substantive Scale
No.
Items Mean SD
MeanItem-Total
CorrelationHoyt
Beliability
ADJUSTMENT
Emotional Stability 31 72.06 9.10 .47 .87
DEPENDABILITY
Nondelinquency 24 55.90 6.28 .40 .80Trlditional Values 19 43.77 4.81 .39 .73Conscientiousness 24 58.04 5.83 .41 .80
ACHIEVEMENT
Work Orientation 31 74.46 8.02 .42 .84Self-Esteem 16 37.35 5.03 .54 .84
LEADERSHIP (POTENCY)
Dominance 17 37.67 5.04 .53 .78Energy Level 27 61.29 7.19 .46 .85
LOCUS Cr CONTROL
Internal Control 21 50.98 6.34 .46 .84
AGREEABLENESS/LIKEABILITY
Cooperativeness 28 63.81 6.99 .39 .82
PHYSICAL CONDITION
Physical Condition 14 43.08 9.66 .66 .92
ABLEksiagnmailislAYicatNon-Random Response 8 --Unlikely Virtues 12 17.98 3.19 .38 .37Self-Knowledge 13 31.42 3.68 .43 .61
7-14
283
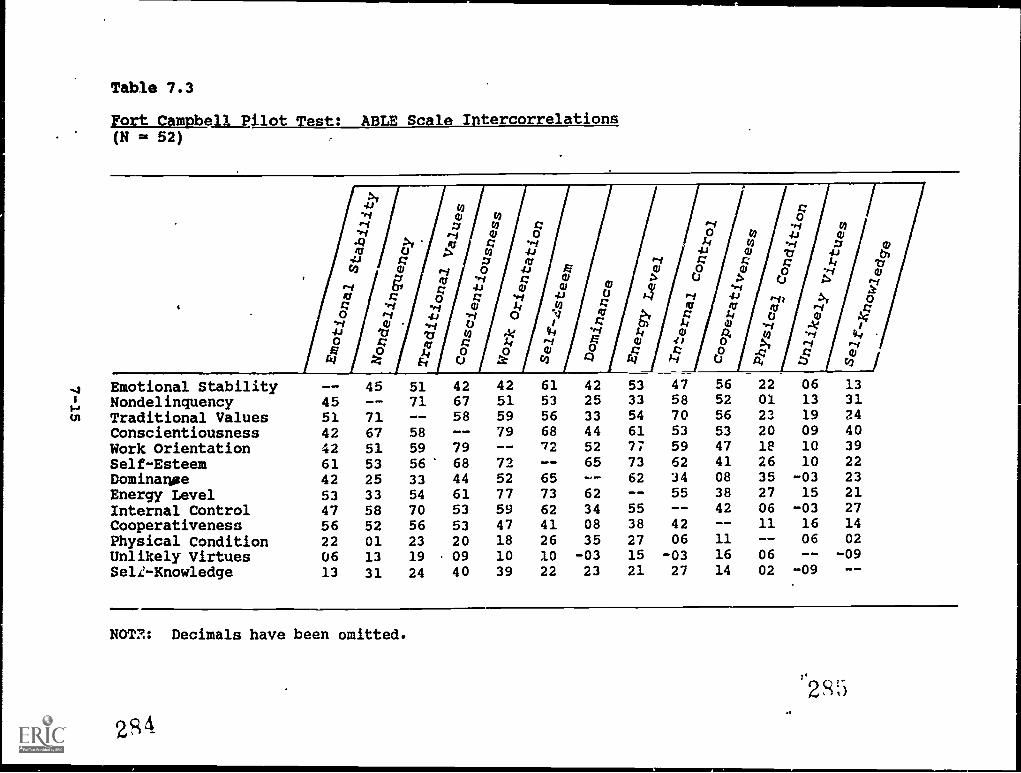
co
01 ri .0 CD CM 03 el ri es1 CM 1
r4 01 C9 V 01 01 C4 C4 C4 r4 C7 C7 1
us el Cl CM C7 C7 el u) el U3 V3 1 CMo ririOr4r40r40r40 1 C71
N r4MOa UD U/ 0. 43 r4 1 VD 03N ON 03 ri 03 el 01 C7 ri 1 00
up eq up 01 0. ri 03 03 03 1 ri VD .0ul u) u) u) cs el .0 1 ri ri ri
rs 03 C7 r, CM 0,1 nr U3 1 03 U3 el is.0 to rs u) into VI cs cs cy
N1 el ri Cs el es1 1 U% CO N Ul riUl Cl U/ UD c- N VO 1 Ul Cl 03 r4 03
cy Ul Cl 03 Ul I cY .0 03 Ul CI el.003 el .0 u) us i us ol cs el CD 03
ri cl U 3 0 3 0 1 1 U l el 03 ri U3 CD 03to U3 in U3 0. 1 U3 N %0 .40 03 rq
iNS r4 CM 0% 1 01 01 es 01 es CO C7 CRst'UlUlt\ I rs rs to .0 ri ri el
0. CO 1 CM 03 oce ri 01 01 C7 CM CDu) I rs 1/40 .0 us to to cY c
ri r4 I co cn VD el .0 cs us el ClUl rs 1 Ul u) u) el u) N u) cy ei
to 1 ri rs ri ul rl co rY ri el ries vs u) u) el Ul Ul C7 el el
1 Ul ei cg ri cy el rs us 03 VD elvs to gr U3 u) Ul cy O ri
>i43 U3 g..P4 W W 0
4 0 0 g r4 .4 iti.ri ri 0 0 0 CI 4J 0A >I 0 g ri 34 0 .ri 0 a)as 0 0 V4J =
>o es rimer. g g 34 '0
U) 0 1 0 4J 0 a) 0 a) 0 ri a)p_ to ....I g el > C.) P.
I-1 V C 4.3 0 011 el 02 -elIII = og-.44.3 g-.1 ri .3) r4 0R ..4 .+4 0 34 0 R OS CI Id .-0 ri 4.) rl 0 43 0 >4 g 14 0 0
AK..4 0 4 0 I g 0 % 34 0 ri .. I
4.1 1:1 '0 0 .54 414 r4 3.1 a) RI 0 *4 -.40 g 0 g 34 ri 0 0 4J OHri r400140000g g0=01:13 Z E4 C.) M U3 CI 313 1-4 C.) C14 Z U3
7 15
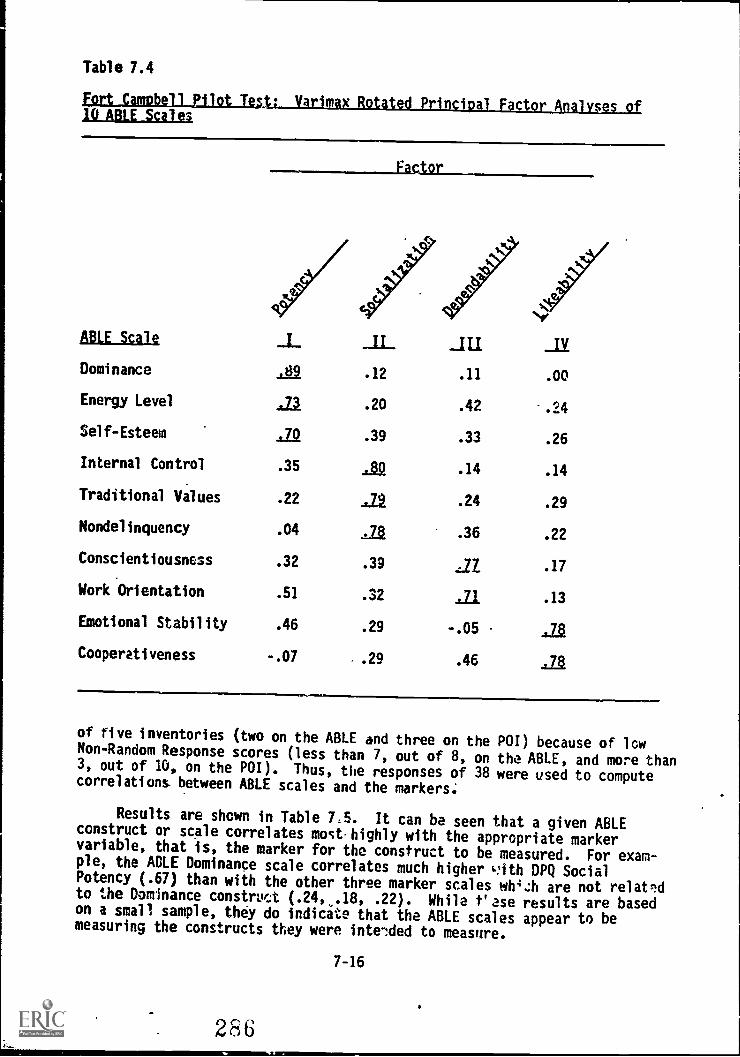
Table 7.4
EittagimpalLabLitth_ Varimax Rotated Principal Factorinalvses of10 ABLE Scales
Factor
ABLE Scale _I UDominance
_L,g2
_IL.12 .11 .00
Energy Level Ala .20 .42 -.24
Self-Esteem 4.za .39 .33 .26
Internal Control .35 tgla .14 .14
Traditional Values .22 ./.9. .24 .29
Nondelinquency .04 .tili .36 .22
Conscientiousness .32 .39 21 .17
Work Orientation .51 .32 ...Z1 .13
Emotional Stability .46 .29 -.05 .siaCooperativeness -.07 ..29 .46 Ala
of five inventories (two on the ABLE and three on the POI) because of lcwNon-Random Response scores (less than 7, out of 8, on the ABLE, and more than3, out of 10, on the POI). Thus, the responses of 38 were used to computecorrelations between ABLE scales and the markers;
Results are shown in Table 7,5. It can be seen that a given ABLEconstruct or scale correlates molt- highly with the appropriate markervariable, that is, the marker for the construct to be measured. For exam-ple, the ABLE Dominance scale correlates much higher c%ith DPQ SocialPotency (.67) than with the other three marker scales wh4zh are not relatdto the Dominance construct (.24,,.18, .22). While t'ase results are basedon a small sample, they do indicate that the ABLE scales appear to bemeasuring the constructs they were intended to measure.
286'
7-16
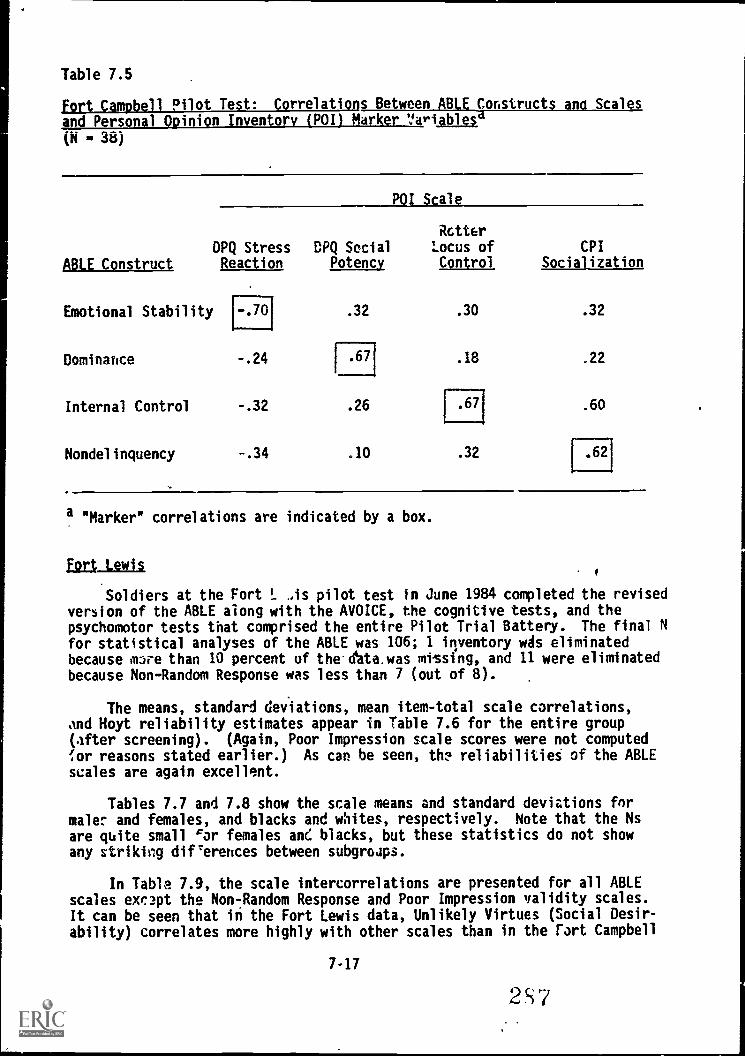
Table 7.5
Fort Campbell Pilot Test: CorrelationructanaScalstweeiand_Personal Opinion Inventory (POI) Marker 1!ariables
(N 38)
ABLE Construct
Emotional Stability
POI Scale
DPQ Stress DPQ SocialReaction Potency
Dominance -.24
Internal Control -.32
Nondelinquency -.34
.32
1.671
.26
.10
RaterLocus of CPIControl Socialization
.30 .32
.18 .22
.67 .60
.32 .62
a "Marker" correlations are indicated by a box.
ad Lewis
Soldiers at the Fort ! As pilot test in June 1984 completed the revisedversion of the ABLE along with the AVOICE, the cognitive tests, and thepsychomotor tests that comprised the entire Pilot Trial Battery. The final Nfor statistical analyses of the ABLE was 106; 1 inventory was eliminatedbecause wire than 10 percent of the.data.was missing, and 11 were eliminatedbecause Non-Random Response was less than 7 (out of 8).
The means, standard deviations, mean item-total scale correlations,and Hoyt reliability estimates appear in Table 7.6 for the entire group(after screening). (Again, Poor Impression scale scores were not computedfor reasons stated earlier.) As can be seen, the reliabilitieS of the ABLEscales are again excellent.
Tables 7.7 and 7.8 show the scale means and standard deviations fnrmale:* and females, and blacks and whites, respectively. Note that the Nsare quite small or females and blacks, but these statistics do not showany striking direrences between subgroups.
In Table 7.9, the scale intercorrelations are presented for all ABLEscales exc3pt the Non - Random Response and Poor Impression validity scales.It can be seen that in the Fort Lewis data, Unlikely Virtues (Social Desir-ability) correlates more highly with other scales than in the Fart Campbell
7-17
2S7
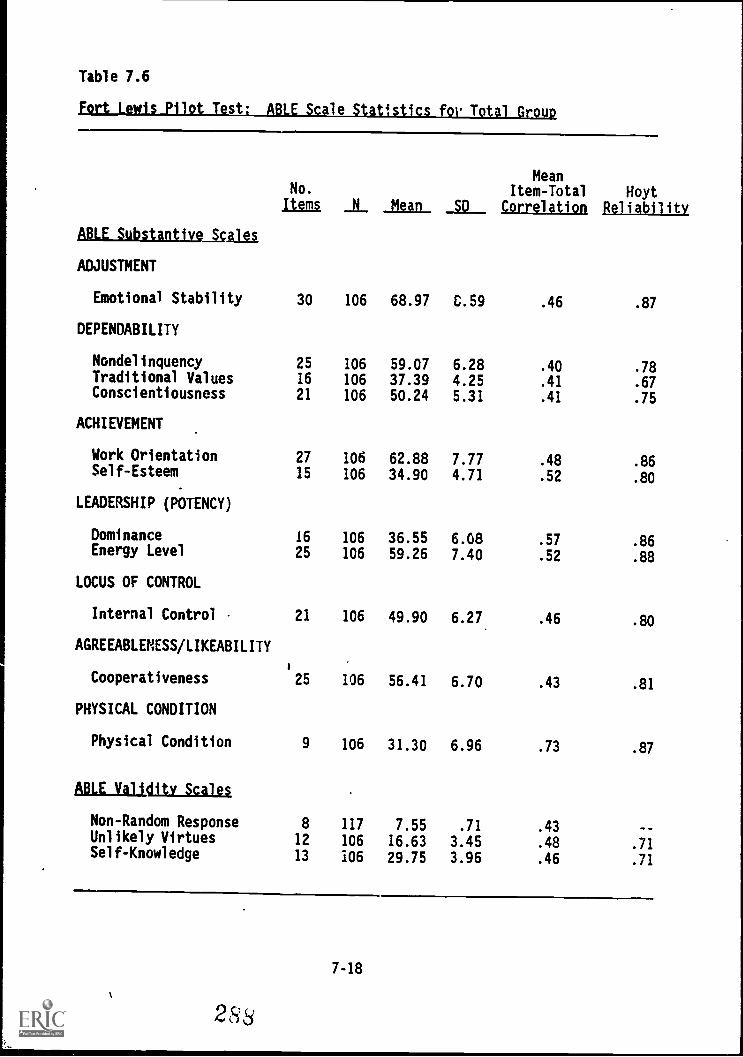
Table 7.6
fort Lewis Pilot Test; ABLE-Scale Statistics for Total Group
ABLE Substantive
ADJUSTMENT
No.
Items _ff_ Mean IQ
MeanItem-Total
CorrelationHoyt
Reliability
Emotional Stability 30 106 68.97 C.59 .46 .87
DEPENDABILITY
Nondelinquency 25 106 59.07 6.28 .40 .78Traditional Values 16 106 37.39 4.25 .41 .67Conscientiousness 21 106 50.24 5.31 .41 .75
ACHIEVEMENT
Work Orientation 27 106 62.88 7.77 .48 .86Self-Esteem 15 106 34.90 4.71 .52 .80
LEADERSHIP (POTENCY)
Dominance 16 106 36.55 6.08 .57 .86Energy Level 25 106 59.26 7.40 .52 .88
LOCUS OF CONTROL
Internal Control 21 106 49.90 6.27 .46 .80
AGREEABLEMESS/LIKEABILITY
Cooperativeness 25 106 56.41 6.70 .43 .81
PHYSICAL CONDITION
Physical Condition 9 106 31.30 6.96 .73 .87
ABLE Validity Scales
Non-Random Response 8 117 7.55 .71 .43Unlikely Virtues 12 106 16.63 3.45 .48 .71Self-Knowledge 13 106 29.75 3.96 .46 .71
7-18
2Ss
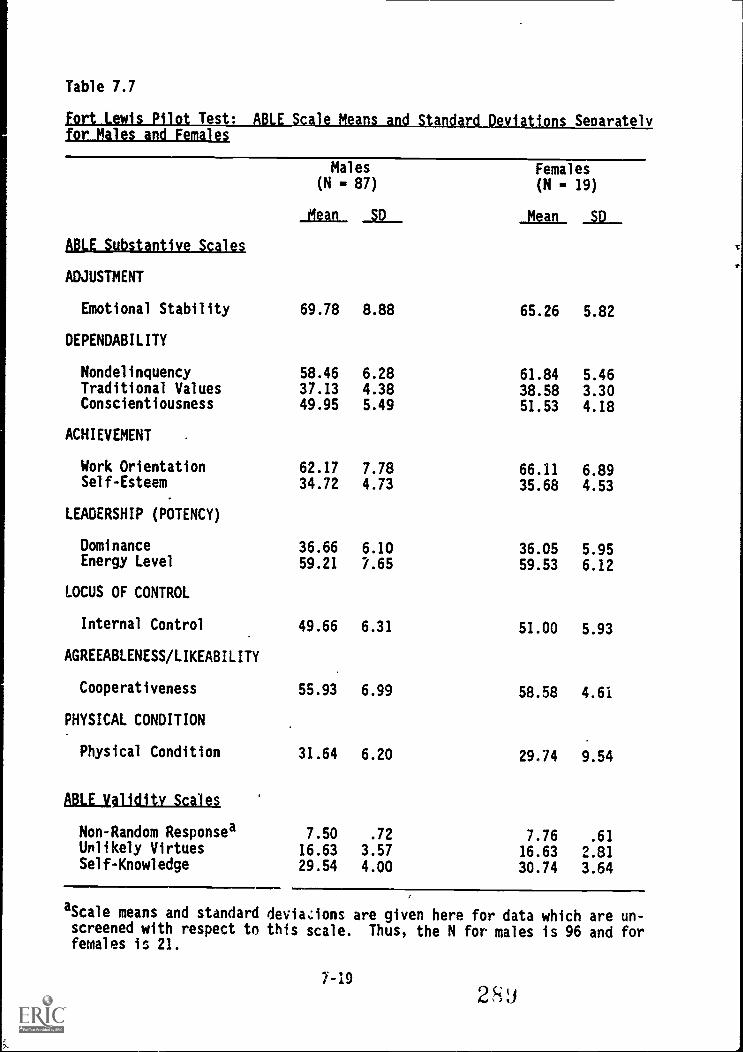
Table 7.7
tie.. ations Separatelyfor Males and Females
ABLE Substantive Scales
Males(N 87)
Mean SD
Females(N - 19)
Mean SD
ADJUSTMENT
Emotional Stability 69.78 8.88 65.26 5.82
DEPENDABILITY
Nondelinquency 58.46 6.28 61.84 5.46Traditional Values 37.13 4.38 38.58 3.30Conscientiousness 49.95 5.49 51.53 4.18
ACHIEVEMENT .
Work Orientation 62.17 7.78 66.11 6.89Self-Esteem 34.72 4.73 35.68 4.53
LEADERSHIP (POTENCY)
Dominance 36.66 6.10 36.05 5.95Energy Level 59.21 7.65 59.53 6.12
LOCUS OF CONTROL
Internal Control 49.66 6.31 51.00 5.93
AGREEABLENESS/LIKEABILITY
Cooperativeness 55.93 6.99 58.58 4.61
PHYSICAL CONDITION
Physical Condition 31.64 6.20 29.74 9.54
ABLE ialiditv Scales
Non-Random Responsea 7.50 .72 7.76 .61Unlikely Virtues 16.63 3.57 16.63 2.81Self-Knowledge 29.54 4.00 30.74 3.64
aScale means and standard deviazions are given here for data which are un-screened with respect to this scale. Thus, the N for males is 96 and forfemales is 21.
7-19
2SJ
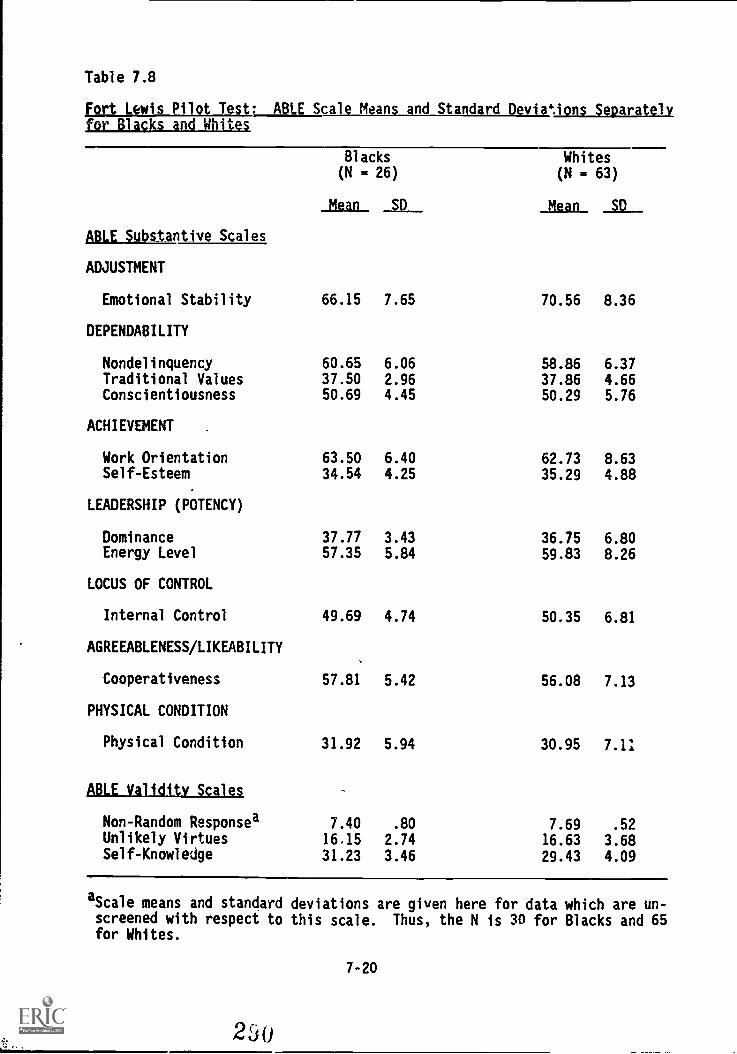
Table 7.8
fort Lewis Pilot Test* BLE Scale Means and Standard Deviations Separatelyfor Blacks and Whites
ABLE Substantive Scales
Blacks(N = 26)
Mean SD
Whites(N - 63)
Mean SD
ADJUSTMENT
Emotional Stability 66.15 7.65 70.56 8.36
DEPENDABILITY
Nondelinquency 60.65 6.06 58.86 6.37Traditional Values 37.50 2.96 37.86 4.66Conscientiousness 50.69 4.45 50.29 5.76
ACHIEVEMENT .
Work Orientation 63.50 6.40 62.73 8.63Self-Esteem 34.54 4.25 35.29 4.88
LEADERSHIP (POTENCY)
Dominance 37.77 3.43 36.75 6.80Energy Level 57.35 5.84 59.83 8.26
LOCUS OF CONTROL
Internal Control 49.69 4.74 50.35 6.81
AGREEABLENESS/LIKEABILITY
Cooperativeness 57.81 5.42 56.08 7.13
PHYSICAL CONDITION
Physical Condition 31.92 5.94 30.95 7.11
ABLE Validity Scales
Non-Random Responsea 7.40 .80 7.69 .52Unlikely Virtues 16.15 2.74 16.63 3.68Self-Knowledge 31.23 3.46 29.43 4.09
aScale means and standard deviations are given here for data which are un-screened with respect to this scale. Thus, the N is 30 for Blacks and 65for Whites.
7-20
2'30
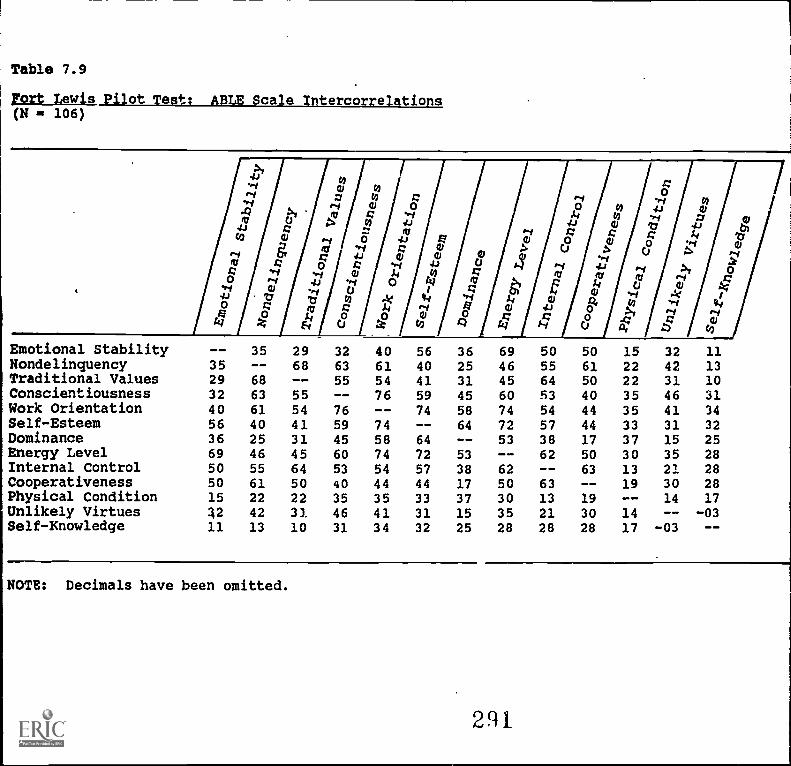
0
saO
RS
l
z
seer Eta
ri CI CD ri sr cy un OD OD CO r CI I
eq el el cy CV C4 C4 ri CD I
CV CV ri 10 rg to to ri 0 sr I CICI sr el sr sr el ri CI CV CI ri I 0
WI CV ey un un r- CD el CIN I sr esri CV c CI CI CI CI CI ri ri I el ri
CD ri CD CD sr Kr r CD CI 1 CA CD COto VD to sr sr sr to UD I ri M C4
CD un sr el sr r- OD C4 I MM ri ODUl totOt to to M10 I VD F4 eV cy
cm U0 ul CD sr 04 CI I NOOtf c0ID Kr Kr 10 N r- to I 10 to el el cy
uD un rl to OD sr I el OD r r- to to01 01 el sr ul U) I un 01 ri ri CV
VD CD ri cn sr 1 sr C4 r sr r, ri C4un sr sr un I UD un sr el el el
CD ri sr VD I sr 03 cr sr mr un risrnP UD ul Ps I Cs ul mr sr el
C4 M un I UD cn to cD M O to UDr, VD un I r- un sr VD un cr el sr el
CA 00 I to er r 4 ri to sr CD C4 rq 0CV UD I to tIl sr CI sr UD tIl 01 el F4
to 1 OD r, ri CD to UD un C4 CV r,CI I UD UD %ID sr cy sr un uD ( ri
I inc1csi0 upwc100inc4,1I ri 01 Cyl 10 to to c-1 (r e-1
>i4J in 0«-i 0 N 0r"4 Z in 0 r-I ri tr)«A ri 43) 0 0 tfl 4.) 43).4 >1 6:1 0 4 $4 th ....4 0 ascs3 0 > Ca .i.s .as CD TS 4.) las4.) 0 0 al r-I 0 0 0 14 TScna),-10.Pla asoasoias0. as 4-4 la, 0 4
0 D()
> C4
rRI 0 0 0 -el 4.) 0 7 .-4 4) r.4 >I 0= .-t -1.4 49 )4 tr) RI RI 6:1 ri0 r4 4.1 'el 0 Ca RI >i 4 4 0 4:1) X.-4 tl) ri 0 I = tr% 14 #3) ri ..%44.) TS TS In ...%4 44 ...c 1.4 as la, ta -rs 44o f.. its = 14 .-4 13 o 4.) o >i,-.4 ri0 $4 0 0000g0400;a Z E4 C.) 3 tn A ta tt 0 Oa Cil
GO
E0
data. Table 7.10 presents the scale intercorrelations for the ten ABLEsubstantive scales (excluding the validity aid Physical Condition scales)with Social Desirability variance partialed out. As would be expectedgiven the correlation between Unlikely Virtues and the other ABLE scales,the values in Table 7.10 are from 3 to 10 points lower than in Table 7.9.There is no readily apparent explanation for the differences in findingsbetween the Fort Campbell and Fort Lewis samples except for sampling error,since both sample sizes are relatively small.
Correlation matrices for the ten ABLE substantive scales from FortLewis were factor analyzed, both with and without the Social Desirabilityvariance. Principal factor analyses were used, with rotation to simplestructure by varimax rotation. Both factor matrices appear in Table 7.11.Though neither structure is the same as was obtained when we factor ana-lyzed the Fort Campbell correlation matrix, the factor solution resultingwhen Social Desirability is partialed out is quite similar to the solutionobtained with the Fort Campbell data. The differences are that in the FortLewis solution, Energy Level loads on a factor with Emotional Stability,whereas in the Fort Campbell solution, Energy Level loads with Dominanceand Self-Esteem. The other difference is that in the five-factor FortLewis solution, Cooperativeness forms a factor by itself, whereas in thefour-factor Fort Campbell solution, Cooperativeness forms a factor withEmotional Stability.
The structure'of the temperament and biodata domain, as measured bythe ABLE during the pilot tests, could not be specified with certainty dueto the relatively small pilot test sample upon which the correlational andfactor analyses were run. The scales do, however, appear to be measuringthe same content as the corresponding marker variables that were a part ofthe Preliminary Battery. The internal consistency reliabilities and scoredistributions of the ABLE scales are more than acceptable.
7-22
2R2
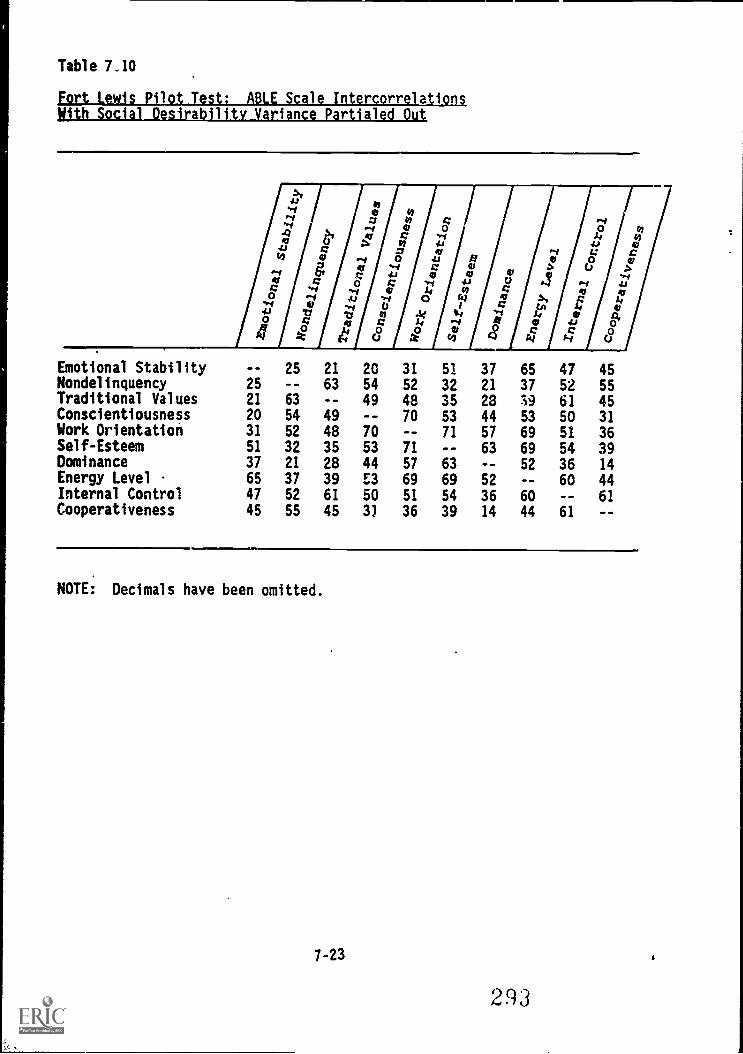
Table 7_10
err- a i
Kith Social Desirability Variance Partialed Out
Emotional Stability -- 25 21 20 31 51 37 65 47 45Nondelinquency 25 -- 63 54 52 32 21 37 52 55Traditional Values 21 63 -- 49 48 35 28 39 61 45Conscientiousness 20 54 49 -- 70 53 44 53 50 31Work Orientation 31 52 48 70 -- 71 57 69 51 36Self-Esteem 51 32 35 53 71 -- 63 69 54 39Dominance 37 21 28 44 57 63 -- 52 36 14Energy Level 65 37 39 E3 69 69 52 -- 60 44Internal Control 47 52 61 50 51 54 36 60 -- 61Cooperativeness 45 55 45 31 36 39 14 44 61 --
NOTE: Decimals have been omitted.
7-23
293
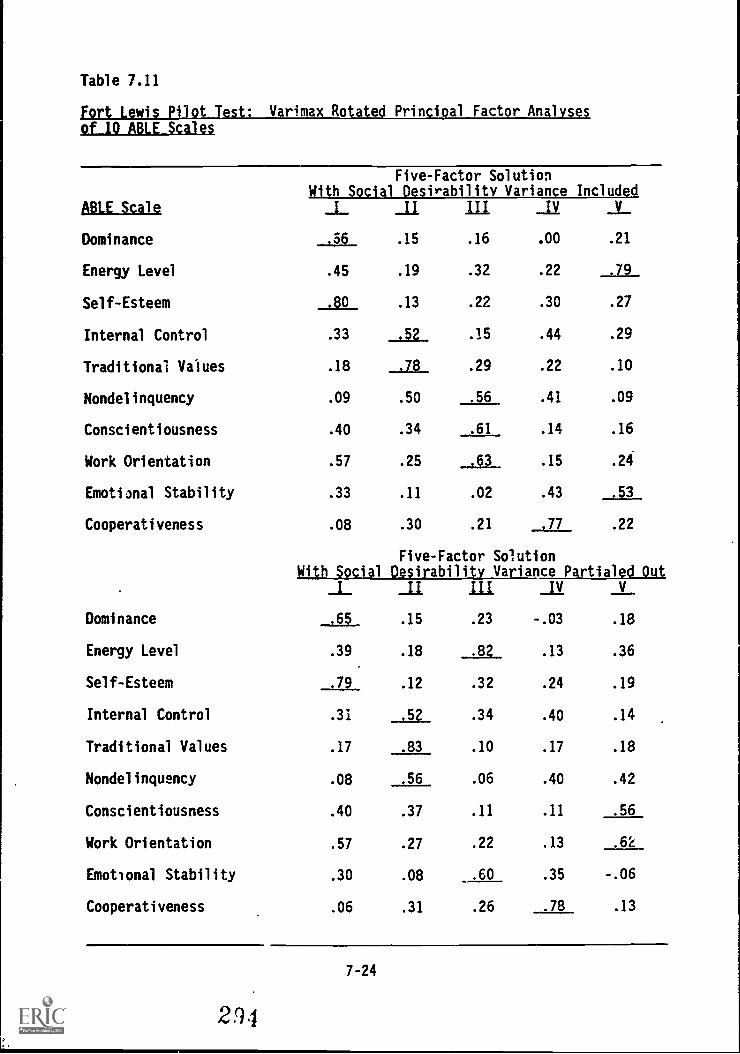
Table 7.11
Fort Lewis Pilot Test: Varimax Rotated Principal Factor Analysespf 10 ABLE Scales
Five-Factor SolutionWith Social Desirability Variance Included
ABLE Scale _.1... _II III _IY v
Dominance AL .15 .16 .00 .21
Energy Level .45 .19 .32 .22 .79
Self-Esteem .80 .13 .22 .30 .27
Internal Control .33 _,52_ .15 .44 .29
Traditional Values .18 .78 .29 .22 .10
Nondelinquency .09 .50 .56 .41 .09
Conscientiousness .40 .34 .61 .14 .16
Work Orientation .57 .25 .63 .15 .24
Emotional Stability .33 .11 .02 .43 .53
Cooperativeness .08 .30 .21 .77 .22
Five-Factor SolutionWith Social Desirability Variance PartialedOut
_L _II III _IY_ v
Dominance .65 .15 .23 -.03 .18
Energy Level .39 .18 .82 .13 .36
Self-Esteem .79 .12 .32 .24 .19
Internal Control .31 52 .34 .40 .14
Traditional Values .17 .83 .10 .17 .18
Nondelinquency .08 .56 .06 .40 .42
Conscientiousness .40 .37 .11 .11 .56
Work Orientation .57 .27 .22 .13 .62
Emotional Stability .30 .08 .60 .35 -.06
Cooperativeness .06 .31 .26 .78 .13
7-24
2q.1
INTERESTS CONSTRUCTS
The seminal work of John Holland (1966) has resulted in widespreadacceptance of a six-construct, hexagonal model of interests. Our principalproblem in developing and testing an interests measure for Army testing wasnot which constructs to measure, but rather how much emphasis show hedevoted to the assessment of each.
As earlier stated, the interests inventory that had been used in thePreliminary Battery is called the VOICE (Vocational Interest Career Examin-ation), which had been developed and researched by the U.S. Air Force.This inventory served as the starting point for the AVOICE (Army VocationalInterest Career Examination).
When developing the AVOICE, we sought to ensure that it would measurewell all six of Holland's constructs, as well as provide sufficient cover-age of the vocational areas most important in the Army. We wanted theinventory's items to parallel the job tasks of soldiers in a variety ofMOS, while at the same time assessing a respondent's broad interests.Thus, each of the constructs to be discussed next is adequately measured bythe AVOICE; however, a greater degree of coverage is devoted to constructsjudged most important for Army jobs. Table 7.12 shows the six Hollandinterests constructs assessed by the AVOICE, together with their associatedscales.
In addition to the Holland constructs and associated scales, theAVOICE also included six constructs (20 scales) dealing with organizationalclimate and environment preferences and an expressed interests scale.Table 7.13 shows these variables and associated measures.
As used in the pilot testing, the AVOICE included 306 items. Nearlyall items were scored on a 5-point scale that ranged from "Like Very Much"(scored 5) to "Dislike Very Much"(scored 1). Items in the ExpressedInterests scale were scored on a 3-point scale in which the response op-tions were different for each item, yet one option aWays reflected themost interest, one moderate interest, and one the least interest.
We now discuss, in turn, each construct/category and the scales devel-oped for it.
Realistic Interests.
This construct is defined as a preference for concrete and tangibleactivities, characteristics, and tasks. Persons with realistic interestsenjoy and are skilled in the manipulation of tools, machines, and animals,but find social and educational activities and situations aversive. Real-istic interests are associated with occupations such as mechanic, engineer,and wildlife conservation officer, and negatively associated with suchoccupations as social work and artist.
The Realistic construct is by far the most thoroughly assessed of thesix constructs tapped by the AVOICE, reflecting the preponderance of workin the Army of a Realistic nature. Fourteen AVO10E scales fall under thisconstruct, in addition to a Basic Interest item.
7-25
295
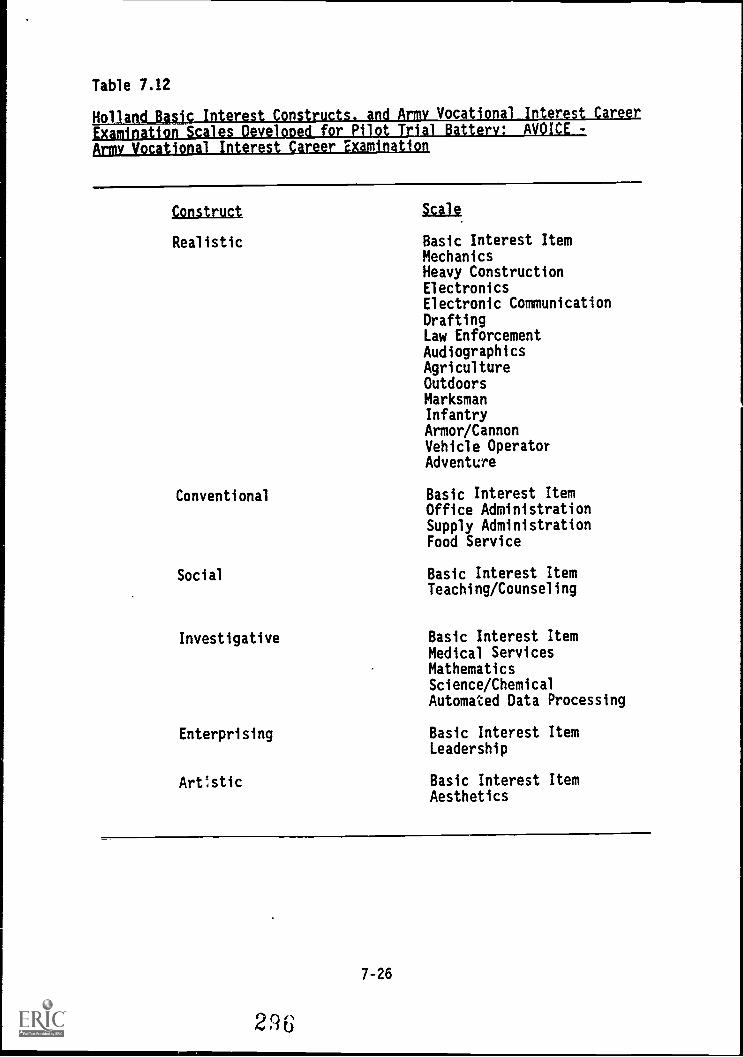
Table 7.12
Hol .1. - .1 Vocat -r-
gxamination Scales Developed for Pilot Trial Battery: AVOICE -
Army Vocational Interest Career Examination
Construct
Realistic
Conventional
Scale
Basic Interest ItemMechanicsHeavy ConstructionElectronicsElectronic CommunicationDraftingLaw EnforcementAudiographicsAgricultureOutdoorsMarksmanInfantryArmor/CannonVehicle OperatorAdventire
Basic Interest ItemOffice AdministrationSupply AdministrationFood Service
Social Basic Interest ItemTeaching/Counseling
Investigative Basic Interest ItemMedical ServicesMathematicsScience/ChemicalAutomated Data Processing
Enterprising Basic Interest ItemLeadership
Artistic Basic Interest ItemAesthetics
7-26
2R 6
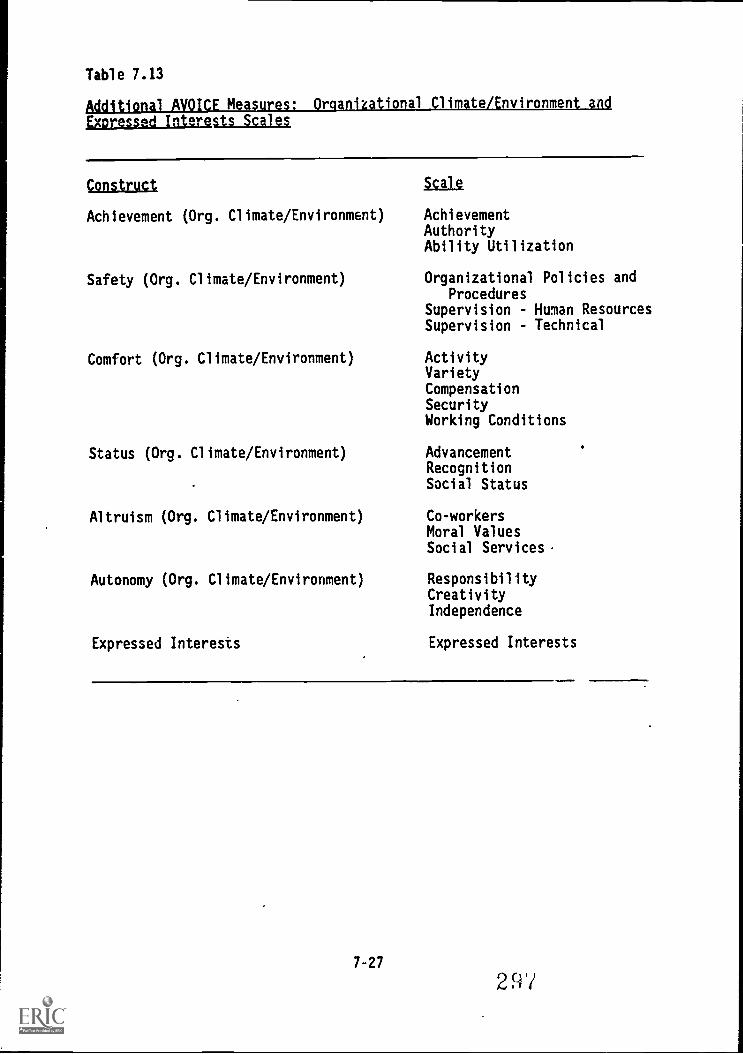
Table 7.13
Additional MICE Measures: Organizational Climate/Environment and
Expressed Interests Scales
Construct Scale
Achievement (Org. Climate/Environment) AchievementAuthorityAbility Utilization
Safety (Org. Climate/Environment) Organizational Policies andProcedures
Supervision - Human ResourcesSupervision - Technical
Comfort (Org. Climate/Environment) ActivityVarietyCompensationSecurityWorking Conditions
Status (Org. Climate/Environment) AdvancementRecognitionSocial Status
Altruism (Org. Climate/Environment) Co-workersMoral ValuesSocial Services.
Autonomy (Org. Climate/Environment) ResponsibilityCreativityIndependence
Expressed Interests Expressed Interests
7-27
2q7
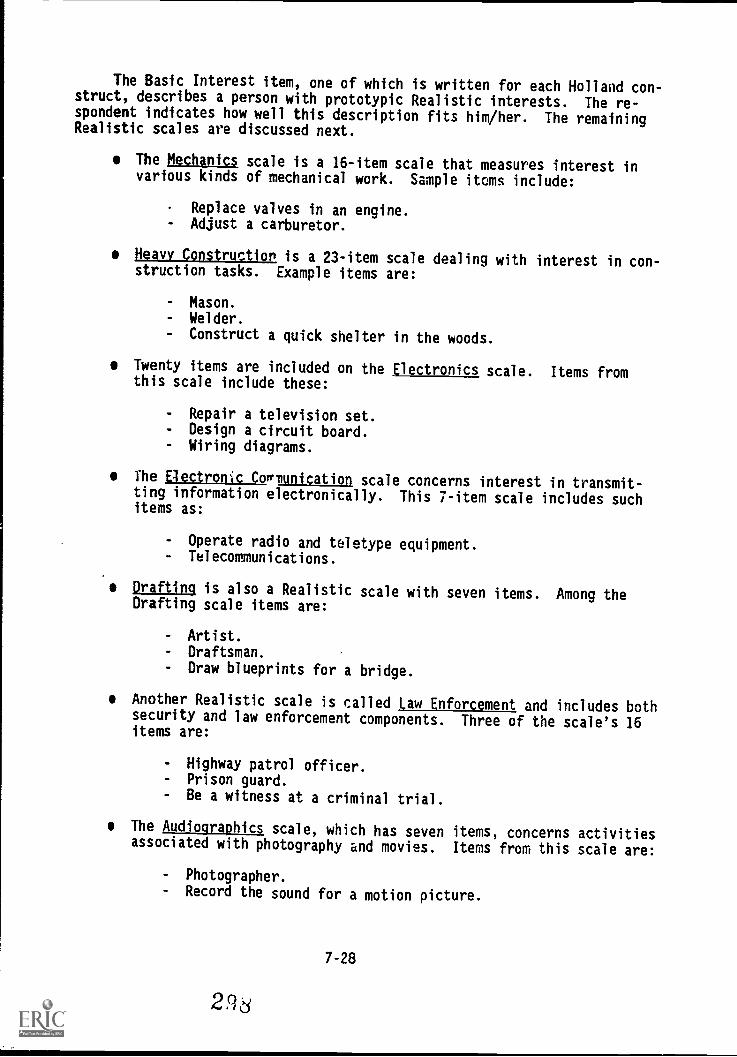
The Basic Interest item, one of which is written for each Holland con-struct, describes a person with prototypic Realistic interests. The re-spondent indicates how well this description fits him/her. The remainingRealistic scales are discussed next.
The Mechanics scale is a 16-item scale that measures interest invarious kinds of mechanical work. Sample items include:
Replace valves in an engine.- Adjust a carburetor.
Heavy Construction is a 23-item scale dealing with interest in con-struction tasks. Example items are:
- Mason.- Welder.- Construct a quick shelter in the woods.
Twenty items are included on the Electronics scale. Items fromthis scale include these:
- Repair a television set.- Design a circuit board.- Wiring diagrams.
The Electronic Cormunication scale concerns interest in transmit-ting information electronically. This 7-item scale includes suchitems as:
- Operate radio and teletype equipment.- Telecommunications.
Drafting is also a Realistic scale with seven items. Among theDrafting scale items are:
Artist.Draftsman.
Draw blueprints for a bridge.
Another Realistic scale is called Law Enforcement and includes bothsecurity and law enforcement components. Three of the scale's 16items are:
- Highway patrol officer.- Prison guard.- Be a witness at a criminal trial.
The Audiographics scale, which has seven items, concerns activitiesassociated with photography and movies. Items from this scale are:
- Photographer.- Record the sound for a motion picture.
7-28
298
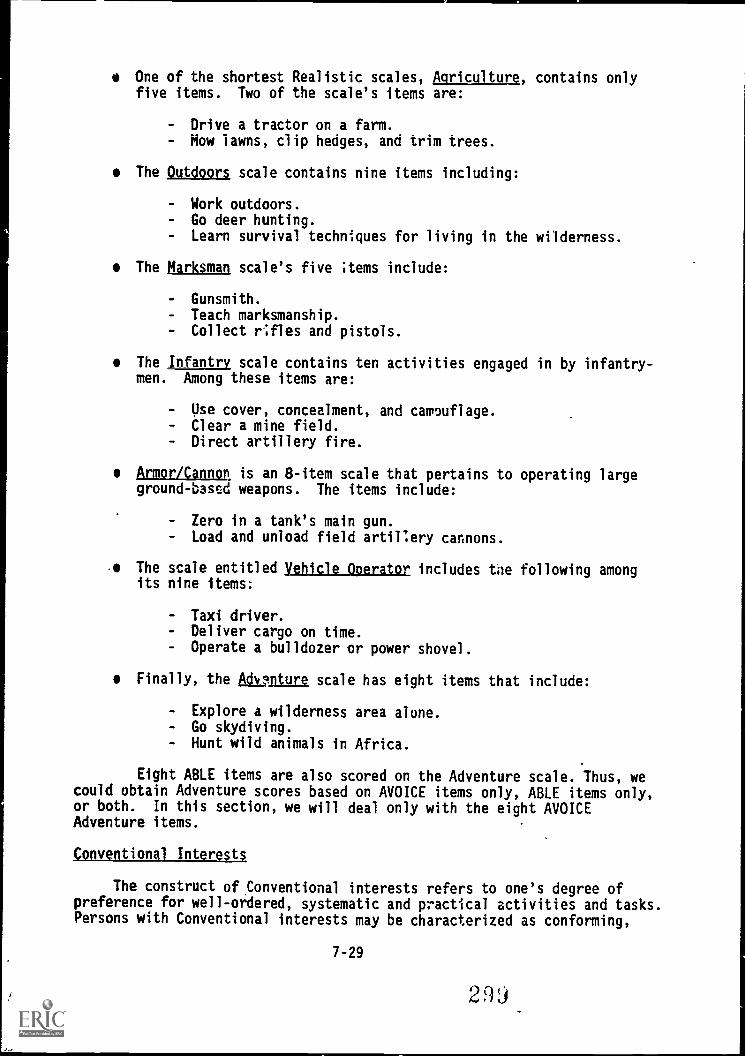
One of the shortest Realistic scales, Agriculturg, contains onlyfive items. Two of the scale's items are:
- Drive a tractor on a farm.- Mow lawns, clip hedges, and trim trees.
The Outdoors scale contains nine items including:
- Work outdoors.- Go deer hunting.- Learn survival techniques for living in the wilderness.
The Marksman scale's five ;terns include:
- Gunsmith.- Teach marksmanship.- Collect r;fles and pistols.
The Infantry scale contains ten activities engaged in by infantry-men. Among these items are:
- Use cover, concealment, and camouflage.- Clear a mine field.- Direct artillery fire.
Armor/Cannon is an 8-item scale that pertains to operating largeground-based weapons. The items include:
- Zero in a tank's main gun.- Load and unload field artillery cannons.
The scale entitled Vehicle Operator includes the following amongits nine items;
- Taxi driver.- Deliver cargo on time.- Operate a bulldozer or power shovel.
Finally, the Aiunture scale has eight items that include:
- Explore a wilderness area alone.- Go skydiving.- Hunt wild animals in Africa.
Eight ABLE items are also scored on the Adventure scale. Thus, wecould obtain Adventure scores based on AVOICE items only, ABLE items only,or both. In this section, we will deal only with the eight AVOICEAdventure items.
Conventional Interests
The construct of Conventional interests refers to one's degree ofpreference for well-ordered, systematic and practical activities and tasks.Persons with Conventional interests may be characterized as conforming,
7-29
2 99
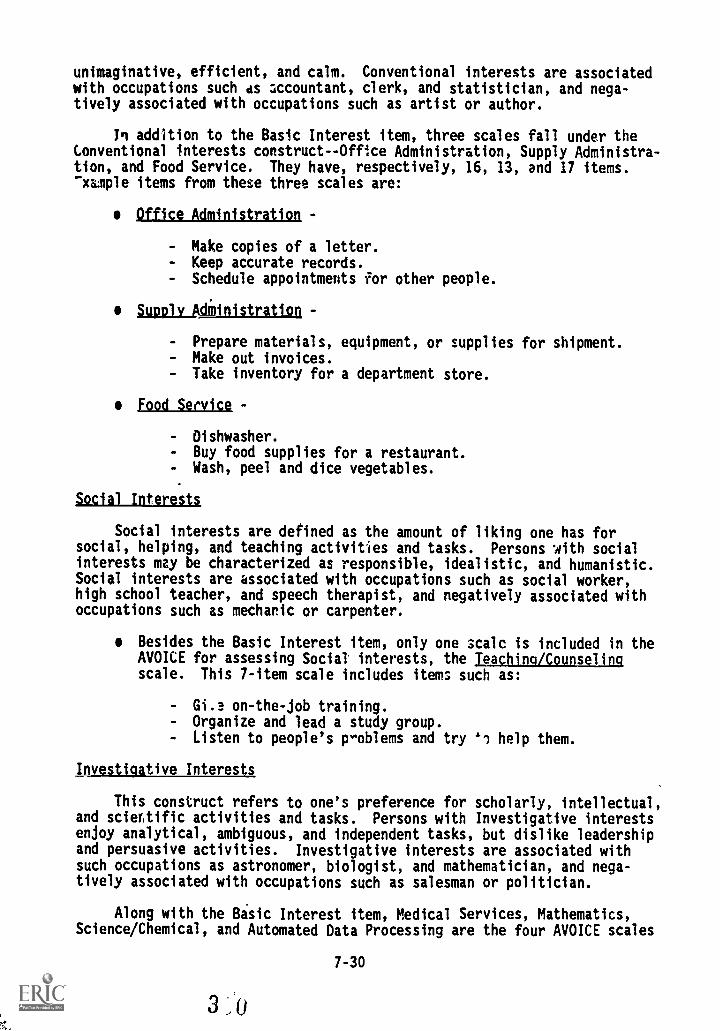
unimaginative, efficient, and calm. Conventional interests are associatedwith occupations such as accountant, clerk, and statistician, and nega-tively associated with occupations such as artist or author.
PI addition to the Basic Interest item, three scales fall under theConventional interests construct--Office Administration, Supply Administra-tion, and Food Service. They have, respectively, 16, 13, and 17 items.-xample items from these three scales are:
Office Administration -
- Make copies of a letter.- Keep accurate records.- Schedule appointments for other people.
5upolv Administration -
- Prepare materials, equipment, or supplies for shipment.- Make out invoices.- Take inventory for a department store.
food Service -
- Dishwasher.- Buy food supplies for a restaurant.- Wash, peel and dice vegetables.
Social Interests
Social interests are defined as the amount of liking one has forsocial, helping, and teaching activities and tasks. Persons with socialinterests may be characterized as responsible, idealistic, and humanistic.Social interests are associated with occupations such as social worker,high school teacher, and speech therapist, and negatively associated withoccupations such as mechanic or carpenter.
Besides the Basic Interest item, only one scalc is included in theAVOICE for assessing Social interests, the Teaching /Counselingscale. This 7-item scale includes items such as:
- Gi.3 on-the-job training.- Organize and lead a study group.- Listen to people's voblems and try 'I help them.
Investioative_Intarests
This construct refers to one's preference for scholarly, intellectual,and scientific activities and tasks. Persons with Investigative interestsenjoy analytical, ambiguous, and independent tasks, but dislike leadershipand persuasive activities. Investigative interests are associated withsuch occupations as astronomer, biologist, and mathematician, and nega-tively associated with occupations such as salesman or politician.
Along with the Basic Interest item, Medical Services, Mathematics,Science/Chemical, and Automated Data Processing are the four AVOICE scales
7-30
3:o
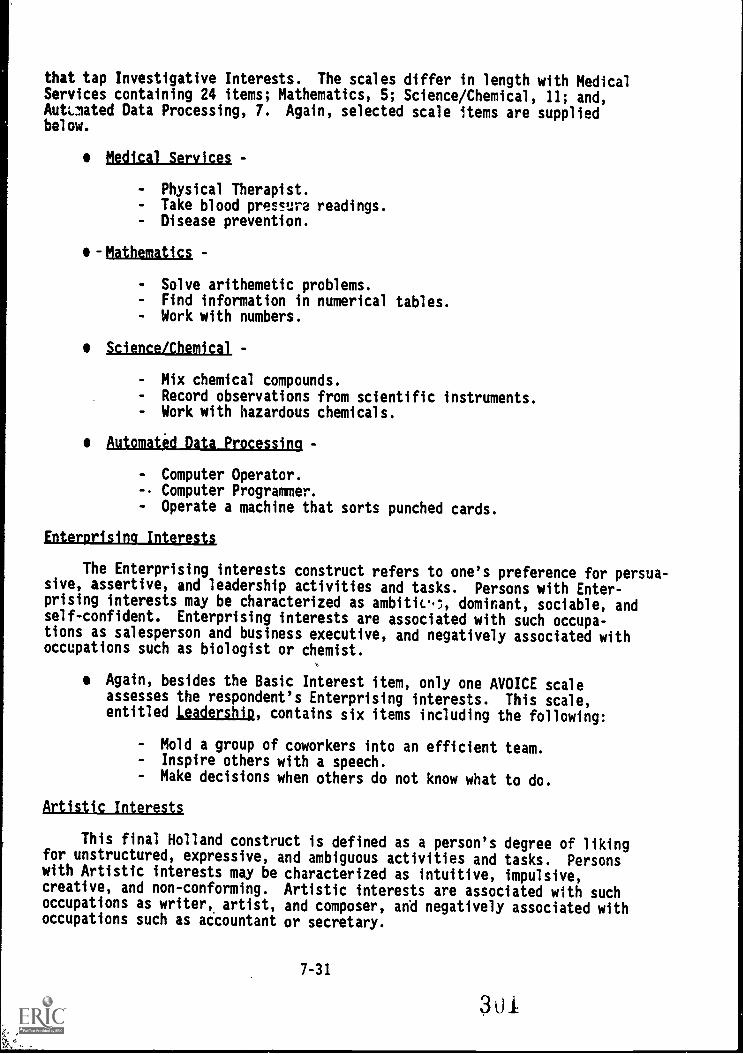
that tap Investigative Interests. The scales differ in length with MedicalServices containing 24 items; Mathematics, 5; Science/Chemical, 11; and,AutLmated Data Processing, 7. Again, selected scale items are suppliedbelow.
Medical Services -
- Physical Therapist.- Take blood pressure readings.- Disease prevention.
-Mathematics -
- Solve arithemetic problems.- Find information in numerical tables.- Work with numbers.
Science/Chemical -
- Mix chemical compounds.- Record observations from scientific instruments.- Work with hazardous chemicals.
Automated Data Processing -
- Computer Operator.-. Computer Programmer.- Operate a machine that sorts punched cards.
Enterprising Interests
The Enterprising interests construct refers to one's preference for persua-sive, assertive, and leadership activities and tasks. Persons with Enter-prising interests may be characterized as ambitic,';, dominant, sociable, andself-confident. Enterprising interests are associated with such occupa-tions as salesperson and business executive, and negatively associated withoccupations such as biologist or chemist.
Again, besides the Basic Interest item, only one AVOICE scaleassesses the respondent's Enterprising interests. This scale,entitled Leadership, contains six items including the following:
- Mold a group of coworkers into an efficient team.- Inspire others with a speech.- Make decisions when others do not know what to do.
Artistic Interests
This final Holland construct is defined as a person's degree of likingfor unstructured, expressive, and ambiguous activities and tasks. Personswith Artistic interests may be characterized as intuitive, impulsive,creative, and non-conforming. Artistic interests are associated with suchoccupations as writer, artist, and composer, and negatively associated withoccupations such as accountant or secretary.
7-31
au"
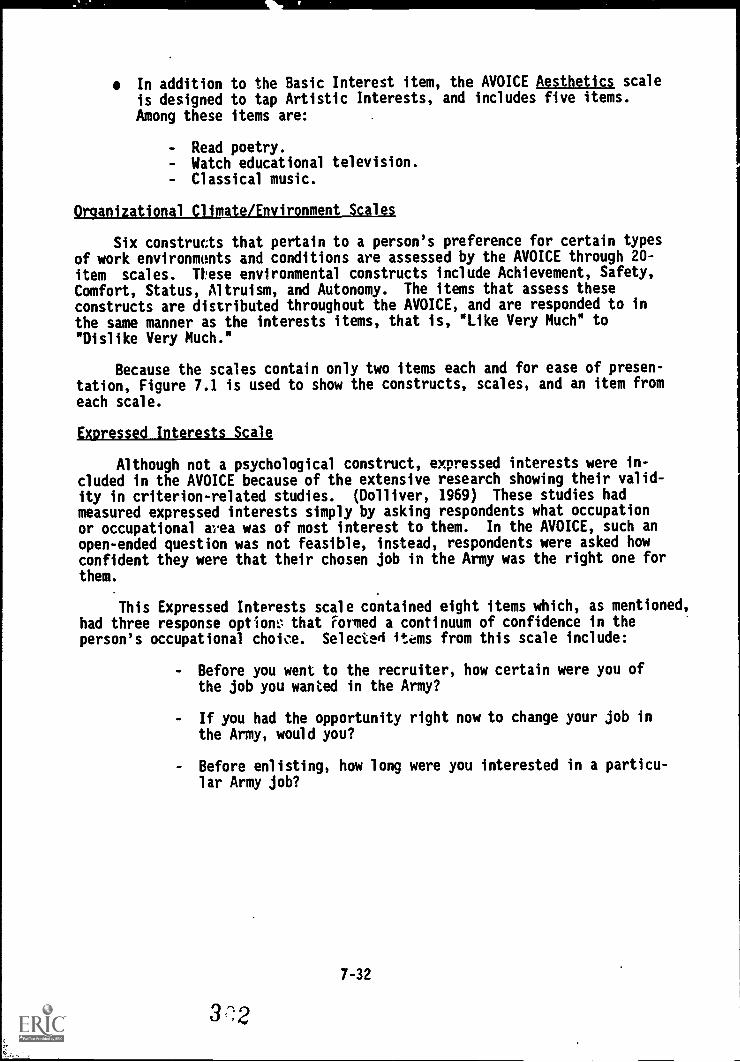
In addition to the Basic Interest item, the AVOICE Aesthetics scaleis designed to tap Artistic Interests, and includes five items.Among these items are:
- Read poetry.- Watch educational television.- Classical music.
Organizational Climate/Environment Scales
Six constructs that pertain to a person's preference for certain typesof work environments and conditions are assessed by the AVOICE through 20-
item scales. These environmental constructs include Achievement, Safety,Comfort, Status, Altruism, and Autonomy. The items that assess theseconstructs are distributed throughout the AVOICE, and are responded to inthe same manner as the interests items, that is, "Like Very Much" to"Dislike Very Much."
Because the scales contain only two items each and for ease of presen-tation, Figure 7.1 is used to show the constructs, scales, and an item from
each scale.
Exoressed Interests Scale
Although not a psychological construct, expressed interests were in-cluded in the AVOICE because of the extensive research showing their valid-ity in criterion-related studies. (Dolliver, 1969) These studies hadmeasured expressed interests simply by asking respondents what occupationor occupational area was of most interest to them. In the AVOICE, such an
open-ended question was not feasible, instead, respondents were asked howconfident they were that their chosen job in the Army was the right one forthem.
This Expressed Interests scale contained eight items which, as mentioned,had three response option:: that Formed a continuum of confidence in theperson's occupational choice. Selected items from this scale include:
- Before you went to the recruiter, how certain were you ofthe job you wanted in the Army?
- If you had the opportunity right now to change your job inthe Army, would you?
- Before enlisting, how long were you interested in a particu-lar Army job?
7-32
3":2
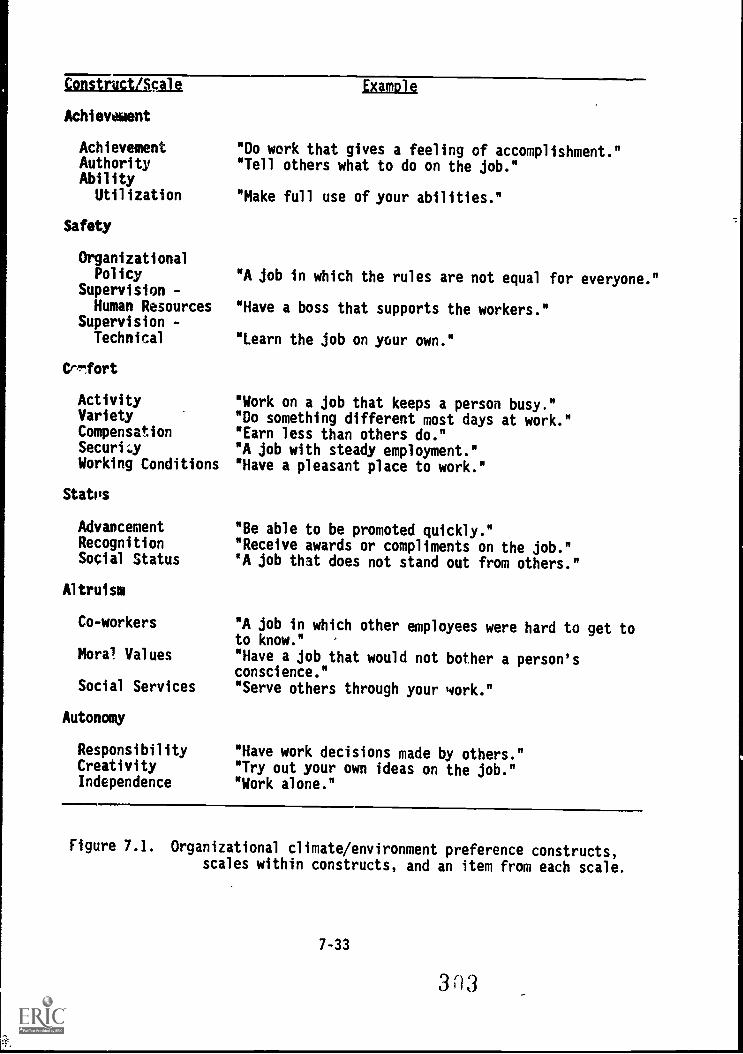
Construct/Scill
Achievement
AchievementAuthorityAbility
Utilization
Safety
OrganizationalPolicy
Supervision -Human Resources
Supervision -Technical
Cr,rfort
ActivityVarietyCompensationSecuri4Working Conditions
Stab's
AdvancementRecognitionSocial Status
Altruism
Co-workers
Moral Values
Social Services
Autonomy
ResponsibilityCreativityIndependence
Example
"Do work that gives a feeling of accomplishment.""Tell others what to do on the job."
"Make full use of your abilities."
"A job in which the rules are not equal for everyone."
"Have a boss that supports the workers."
"Learn the job on your own."
"Work on a job that keeps a person busy.""Do something different most days at work.""Earn less than others do.""A job with steady employment.""Have a pleasant place to work."
"Be able to be promoted quickly."
"Receive awards or compliments on the job."'A job that does not stand out from others."
"A job in which other employees were hard to get toto know.""Have a job that would not bother a person'sconscience.""Serve others through your work."
"Have work decisions made by others.""Try out your own ideas on the job.""Work alone."
Figure 7.1. Organizational climate/environment preference constructs,scales within constructs, and an item from each scale.
7-33
31i3
AVOICE REVISIONS BASED ON PILOT TESTING
As with the ABLE, before we present the data obtained from pilot test-
ing, we lascribe the revisions made in the AVOICE on the basis of pilot
test administration at Fort Campbell and Fort Lewis. Again, the changes
are discussed for the AVOICE as a whole, rather than scale by scale. These
changes resulted in the AVOICE version to be used in the field test.
Overall, the revisions made were far Tess substantial for the AVOICE
than for the ABLE. Editorial review of the inventory by PORI and ARI
staff, together with the verbal feedback from Fort Campbell soldiers,
resulted in revision of 15 items--primarily minor wording changes. An
additional five items were modified because of low item correlations with
the total scale score in the Fort Campbell data. No items were deleted
based on the editorial review, verbal feedback, or item analyses.
Following the Fort Lewis pilot test, no revisions or deletions were
made to the AVOICE items. Item response frequencies were examined to
detect items that had relatively little discriminatory power, that is,
three or more of the five response choices received less than 10 percent
endorsement. There proved to be only two such items, and, upon examination
of the item content, it was decided not to revise these. Both items
appeared well written and relevant to the targeted content, and we thought
the poor response distribution could be attributed to sampling error.
Thus, a total of only 20 AVOICE items were revised on the basis of
editorial review and pilot testing. Part of this low level of revision may
be due to the common response scale of the inventory, "Like Very Much" to
"Dislike Very Much." The response options appeared to be well-understood
and did not require the item-by-item review /revision that was necessary for
the ABLE items (which had differing response options by item).
3x14
7-34
PILOT TEST DATA FOR THE AVOICE
fort Campbell
In the Fort Campbell pilot test, a total of 57 soldiers completed theAVOICE, 55 of whom provided sufficient data for analyses. Scale statistics
for this sample are presented in Table 7.14. As can be seen in the table,the mean item-total correlations and Hoyt reliabilities are excellent,generally in the .60s to .80s for the former, and .70s to .90s for the
latter. In addition the means and SDs indicate acceptable scale scoredistributions in almost all cases.
Fort Lewis
The responses of four of 118 soldiers were eliminated for exceedingthe missing data criterion (10%), resulting in an analysis sample size of
114. Scale statistics for this sample are shown in Table 7.15. Reliabili-
ties are again excellent and are even slightly higher than the valuesobtained at Fort Campbell.
AVOICE scale means and standard deviations were also calculated sepa-rately for males and females and for blacks and whites (see Tables 7.16 and7.17), but -dote that sample sizes are very small for females and blacks.
These data are viewed as exploratory only. As would be expected on thebasis of previous research, there are marked differences between the sexesin mean score on certain interest scales. Scales such as Mechanics and '
Heavy Construction show far greater scores for males than females. On the
majority of the scales, however, the differences are less pronounced. Dif-
ferences are also relatively small between blacks and whites. Table 7.18presents the AVOICE scale intercorrelations for the Fort Lewis sample. We
performed no detailed analyses of these correlations, but did inspect thematrix to see if scales expected to correlate fairly highly did so (forexample, Infantry with Armor/Cannon) and scales not expected to correlatehighly, or even negatively, did so (for example, Aesthetics with Infantry).This pattern did indeed hold true, in most cases.
7-35
3n5
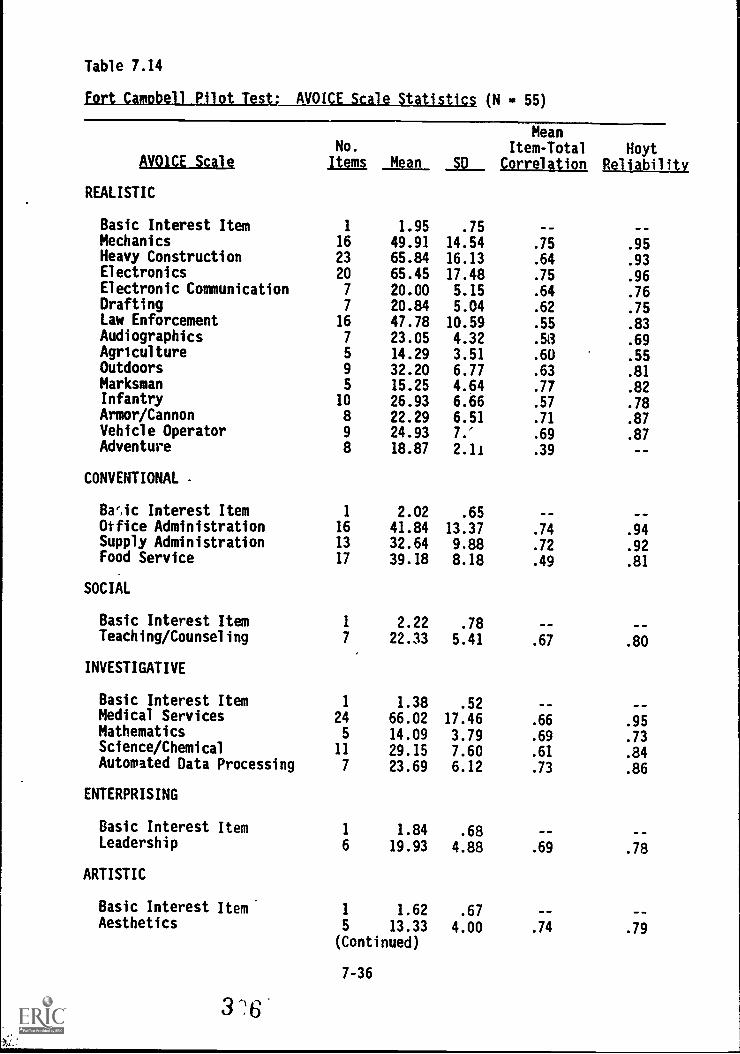
Table 7.14
EDrt Camobell Pilot Test;____AVOICE Scale Statistics (N - 55)
AVO10E ScaleNo.
Items Mean SO
MeanItem-Total
CorrelationHoyt
Reliability
REALISTIC
Basic Interest Item 1 1.95 .15 -- GO
Mechanics 16 49.91 14.54 .75 .95Heavy Construction 23 65.84 16.13 .64 .93Electronics 20 65.45 17.48 .75 .96Electronic Communication 7 20.00 5.15 .64 .76Drafting 7 20.84 5.04 .62 .75Law Enforcement 16 47.78 10.59 .55 .83Audiographics 7 23.05 4.32 .53 .69Agriculture 5 14.29 3.51 .60 .55Outdoors 9 32.20 6.77 .63 .81Marksman 5 15.25 4.64 .77 .82Infantry 10 26.93 6.66 .57 .78Armor/Cannon 8 22.29 6.51 .71 .87Vehicle Operator 9 24.93 7.' .69 .87Adventure 8 18.87 2.11 .39 --
CONVENTIONAL -
Bae,ic Interest Item 1 2.02 .65Otfice Administration 16 41.84 13.37 .74 .94Supply Administration 13 32.64 9.88 .72 .92Food Service 17 39.18 8.18 .49 .81
SOCIAL
Basic Interest Item 1 2.22 .78 - -Teaching/Counseling 7 22.33 5.41 .67 .80
INVESTIGATIVE
Basic Interest Item 1 1.38 .52 --Medical Services 24 66.02 17.46 .66 .95Mathematics 5 14.09 3.79 .69 .73Science/Chemical 11 29.15 7.60 .61 .84Automated Data Processing 7 23.69 6.12 .73 .86
ENTERPRISING
Basic Interest Item 1 1.84 .68Leadership 6 19.93 4.88 .69 .78
ARTISTIC
Basic Interest Item 1 1.62 .67Aesthetics 5 13.33 4.00 .74 .79
(Continued)
7-36
3 '6
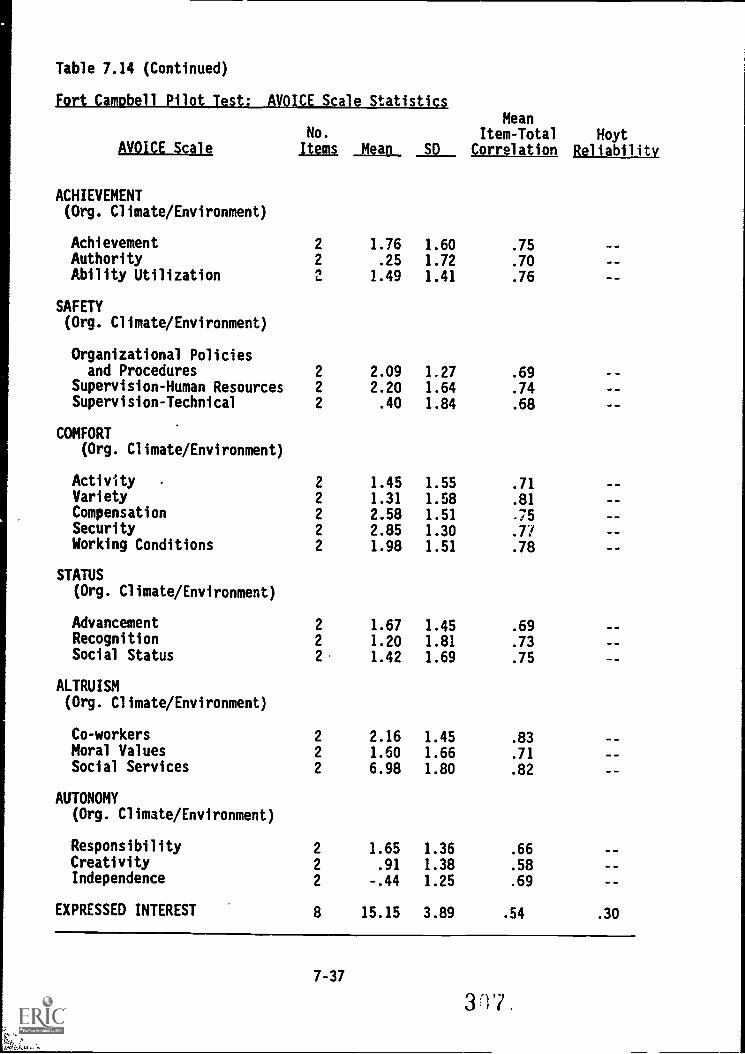
Table 7.14 (Continued)
Fort Campbell Pilot Test: AVOICE_Scale Statistics
AVOICE ScaleNo.
Items, Mean SD
MeanItem-Total
CorrelationHoyt
Reliability
ACHIEVEMENT(Org. Climate/Environment)
Achievement 2 1.76 1.60 .75Authority 2 .25 1.72 .70Ability Utilization 2 , 1.49 1.41 .76
SAFETY(Org. Climate/Environment)
Organizational Policiesand Procedures 2 2.09 1.27 .69
Supervision-Human Resources 2 2.20 1.64 .74Supervision-Technical 2 .40 1.84 .68
COMFORT(Org. Climate/Environment)
Activity - 2 1.45 1.55 .71Variety 2 1.31 1.58 .81Compensation 2 2.58 1.51 .75Security 2 2.85 1.30 .77Working Conditions 2 1.98 1.51 .78
STATUS(Org. Climate/Environment)
Advancement 2 1.67 1.45 .69Recognition 2 1.20 1.81 .73Social Status 2. 1.42 1.69 .75
ALTRUISM(Org. Climate/Environment)
Co-workers 2 2.16 1.45 .83Moral Values 2 1.60 1.66 .71Social Services 2 6.98 1.80 .82
AUTONOMY(Org. Climate/Environment)
Responsibility 2 1.65 1.36 .66Creativity 2 .91 1.38 .58Independence 2 -.44 1.25 .69
EXPRESSED INTEREST 8 15.15 3.89 .54 .30
7-37
3 11
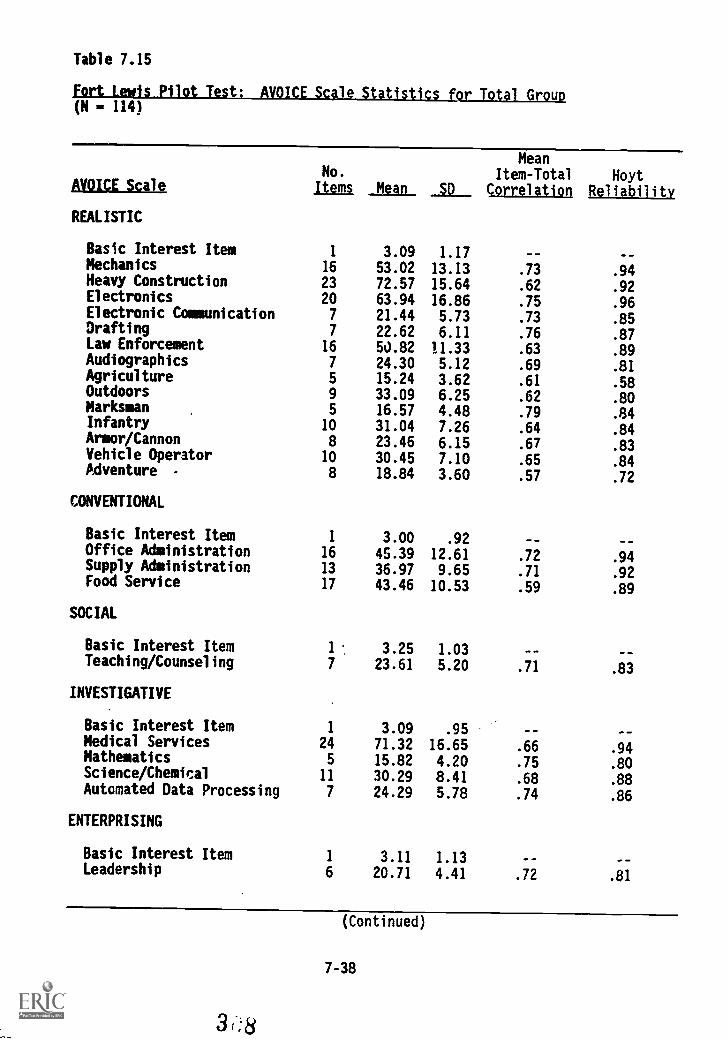
Table 7.15
Fort Lewis Pilot Test: AVOICE Scale Statistics for Total Group(N = 114)
AVOICE ScaleNo.
items Mean SD
MeanItem-Total
CorrelationHoyt
Reliability
REALISTIC
Basic Interest Item 1 3.09 1.17 --Mechanics 16 53.02 13.13 .73 .94Heavy Construction 23 72.57 15.64 .62 .92Electronics 20 63.94 16.86 .75 .96Electronic Communication 7 21.44 5.73 .73 .85Drafting 7 22.62 6.11 .76 .87Law Enforcement 16 50.82 11.33 .63 .89Audiographics 7 24.30 5.12 .69 .81Agriculture 5 15.24 3.62 .61 .58Outdoors 9 33.09 6.25 .62 .80Marksman 5 16.57 4.48 .79 .84Infantry 10 31.04 7.26 .64 .84Armor/Cannon 8 23.46 6.15 .67 .83Vehicle Operator 10 30.45 7.10 .65 .84Adventure - 8 18.84 3.60 .57 .72
CONVENTIONAL
Basic Interest Item 1 3.00 .92 -- --Office Administration 16 45.39 12.61 .72 .94Supply Administration 13 36.97 9.65 .71 .92Food Service 17 43.46 10.53 .59 .89
SOCIAL
Basic Interest Item 1 3.25 1.03 --Teaching/Counseling 7 23.61 5.20 .71 .83
INVESTIGATIVE
Basic Interest Item 1 3.09 .95 -- --Medical Services 24 71.32 16.65 .66 .94Mathematics 5 15.82 4.20 .75 .80Science/Chemical 11 30.29 8.41 .68 .88Automated Data Processing 7 24.29 5.78 .74 .86
ENTERPRISING
Basic Interest Item 1 3.11 1.13Leadership 6 20.71 4.41 .72 .81
(Continued)
7-38
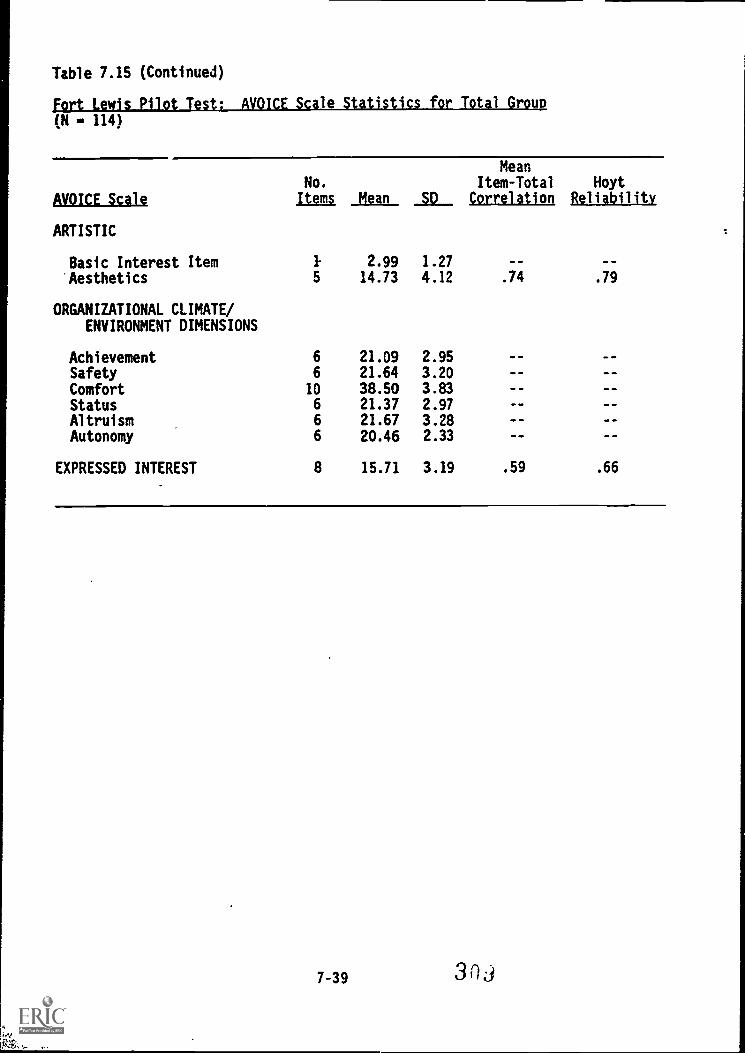
Table 7.15 (Continued)
fort Lewis Pilot Test: AVOICE Scale Statistics for Total Group(N = 114)
AVOICE Scale
No.
Items Mean SD
MeanItem-Total
CorrelationHoyt
Reliability
ARTISTIC
Basic Interest ItemAesthetics
ORGANIZATIONAL CLIMATE/ENVIRONMENT DIMENSIONS
AchievementSafetyComfortStatusAltruismAutonomy
EXPRESSED INTEREST
1-
5
6
6
10
6
6
6
8
2.9914.73
21.0921.6438.5021.3721.6720.46
15.71
1.274.12
2.953.203.832.973.282.33
3.19
.74
40 ON
40
40 ON
NO 40
.59
.79
40 40
40 40
.66
7-39 303
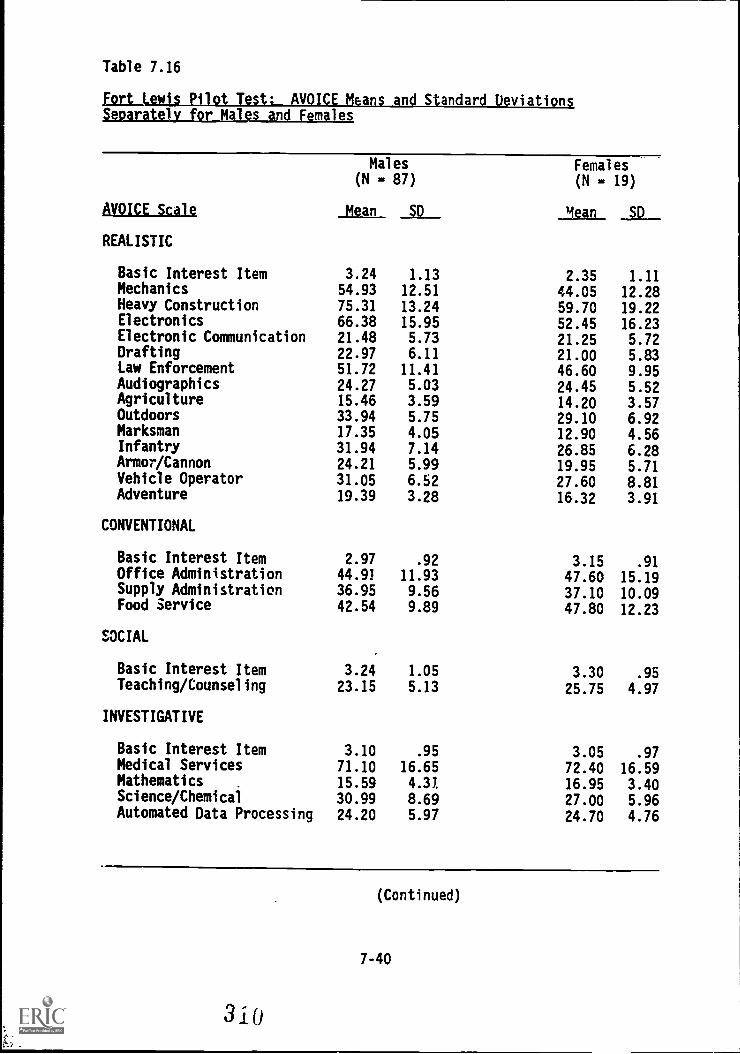
Table 7.16
M a andar. viati
AVOICE Scale
Males(N - 87)
Mean SD
Females(N - 19)
Mean SD
REALISTIC
Basic Interest Item 3.24 1.13 2.35 1.11Mechanics 54.93 12.51 44.05 12.28Heavy Construction 75.31 13.24 59.70 19.22Electronics 66.38 15.95 52.45 16.23Electronic Communication 21.48 5.73 21.25 5.72Drafting 22.97 6.11 21.00 5.83Law Enforcement 51.72 11.41 46.60 9.95Audiographics 24.27 5.03 24.45 5.52Agriculture 15.46 3.59 14.20 3.57Outdoors 33.94 5.75 29.10 6.92Marksman 17.35 4.05 12.90 4.56Infantry 31.94 7.14 26.85 6.28Armor/Cannon 24.21 5.99 19.95 5.71Vehicle Operator 31.05 6.52 27.60 8.81Adventure 19.39 3.28 16.32 3.91
CONVENTIONAL
Basic Interest Item 2.97 .92 3.15 .91Office Administration 44.91 11.93 47.60 15.19Supply Administration 36.95 9.56 37.10 10.09Food Service 42.54 9.89 47.80 12.23
SOCIAL
Basic Interest Item 3.24 1.05 3.30 .95Teaching/Counseling 23.15 5.13 25.75 4.97
INVESTIGATIVE
Basic Interest Item 3.10 .95 3.05 .97Medical Services 71.10 16.65 72.40 16.59Mathematics 15.59 4.31 16.95 3.40Science/Chemical 30.99 8.69 27.00 5.96Automated Data Processing 24.20 5.97 24.70 4.76
(Continued)
7-40
310
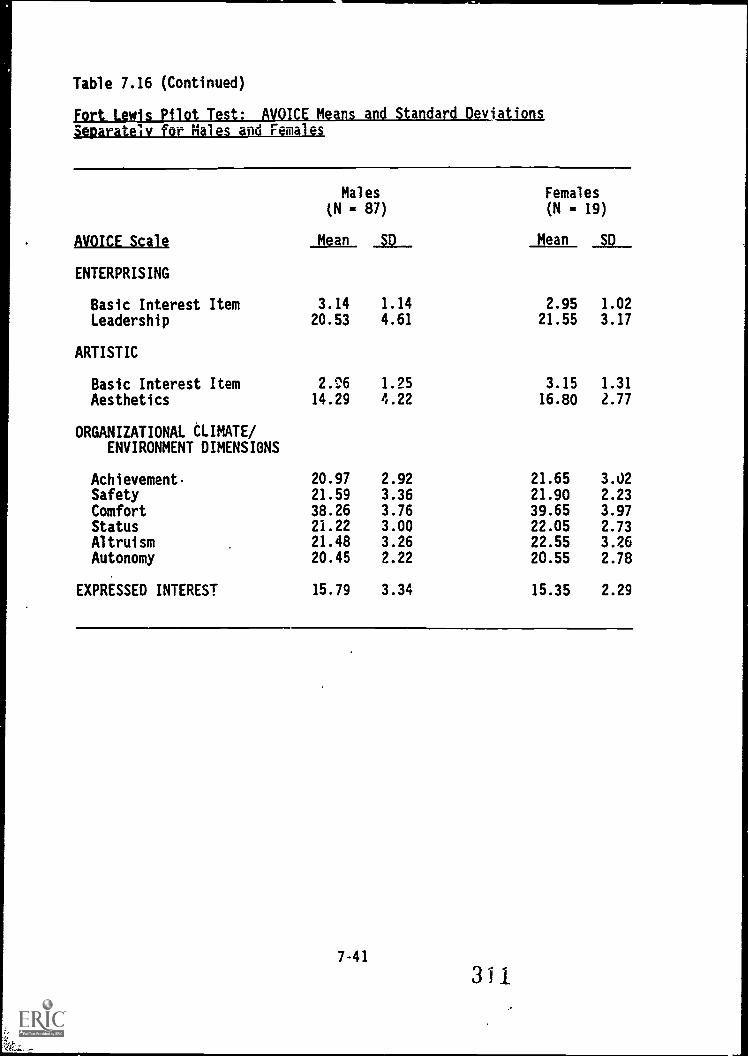
Table 7.16
Fort LewisSeparately
(Continued)
Pilot Test: AVOICE Means and Standard Deviationsfor Males and Females
AVOICE Scale
Males(N - 87)
Mean SD
Females(N - 19)
can SD
ENTERPRISING
Basic Interest Item 3.14 1.14 2.95 1.02
Leadership 20.53 4.61 21.55 3.17
ARTISTIC
Basic Interest Item 2.()6 1.25 3.15 1.31
Aesthetics 14.29 4.22 16.80 2.77
ORGANIZATIONAL CLIMATE/ENVIRONMENT DIMENSIONS
Achievement- 20.97 2.92 21.65 3.02Safety 21.59 3.36 21.90 2.23
Comfort 38.26 3.76 39.65 3.97Status 21.22 3.00 22.05 2.73Altruism 21.48 3.26 22.55 3.26Autonomy 20.45 2.22 20.55 2.78
EXPRESSED INTEREST 15.79 3.34 15.35 2.29
7-41
3 1 1
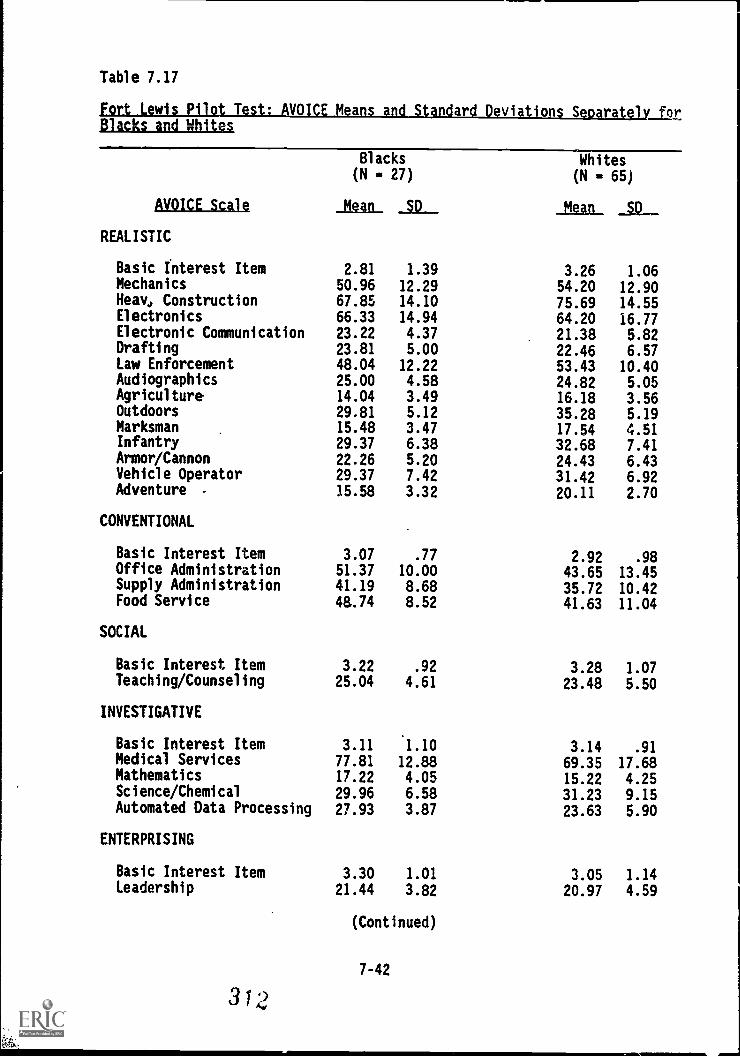
Table 7.17
Fort Lewis Pilot Test: AVOICE Means and Standard Deviations Separatelx_fprBlacks and Whites
AVOICE Scale
REALISTIC
Blacks(N - 27)
Mean SD
Whites(N 65)
Mean_
Basic Interest Item 2.81 1.39 3.26 1.06Mechanics 50.96 12.29 54.20 12.90Heav4 Construction 67.85 14.10 75.69 14.55Electronics 66.33 14.94 64.20 16.77Electronic Communication 23.22 4.37 21.38 5.82Drafting 23.81 5.00 22.46 6.57Law Enforcement 48.04 12.22 53.43 10.40Audiographics 25.00 4.58 24.82 5.05Agriculture 14.04 3.49 16.18 3.56Outdoors 29.81 5.12 35.28 5.19Marksman 15.48 3.47 17.54 4.51Infantry 29.37 6.38 32.68 7.41Armor/Cannon 22.26 5.20 24.43 6.43Vehicle Operator 29.37 7.42 31.42 6.92Adventure 15.58 3.32 20.11 2.70
CONVENTIONAL
Basic Interest Item 3.07 .77 2.92 .98Office Administration 51.37 10.00 43.65 13.45Supply Administration 41.19 8.68 35.72 10.42Food Service 48.74 8.52 41.63 11.04
SOCIAL
Basic Interest Item 3.22 .92 3.28 1.07Teaching/Counseling 25.04 4.61 23.48 5.50
INVESTIGATIVE
Basic Interest Item 3.11 1.10 3.14 .91Medical Services 77.81 12.88 69.35 17.68Mathematics 17.22 4.05 15.22 4.25Science/Chemical 29.96 6.58 31.23 9.15Automated Data Processing 27.93 3.87 23.63 5.90
ENTERPRISING
Basic Interest Item 3.30 1.01 3.05 1.14Leadership 21.44 3.82 20.97 4.59
(Continued)
7-42
31,2
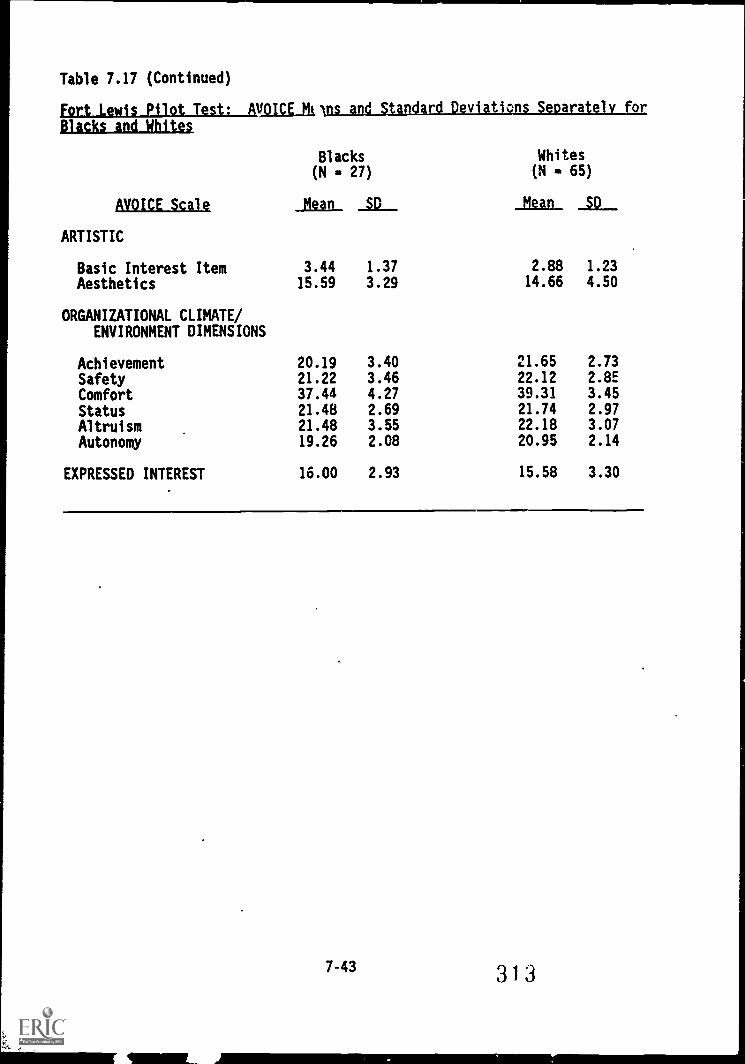
Table 7.17 (Continued)
fort Lewis Pilot Test: AVOICE Mkins and Standard Deviations Separately or
slacks and Whites
AVOICE Scale
Blacks(N 27)
Mean SD
Whites(N - 65)
Mean SD
ARTISTIC
Basic Interest Item 3.44 1.37 2.88 1.23
Aesthetics 15.59 3.29 14.66 4.50
ORGANIZATIONAL CLIMATE/ENVIRONMENT DIMENSIONS
Achievement 20.19 3.40 21.65 2.73
Safety 21.22 3.46 22.12 2.8E
Comfort 37.44 4.27 39.31 3.45
Status 21.48 2.69 21.74 2.97
Altruism 21.48 3.55 22.18 3.07
Autonomy 19.26 2.08 20.95 2.14
EXPRESSED INTEREST 16.00 2.93 15.58 3.30
7-43 313
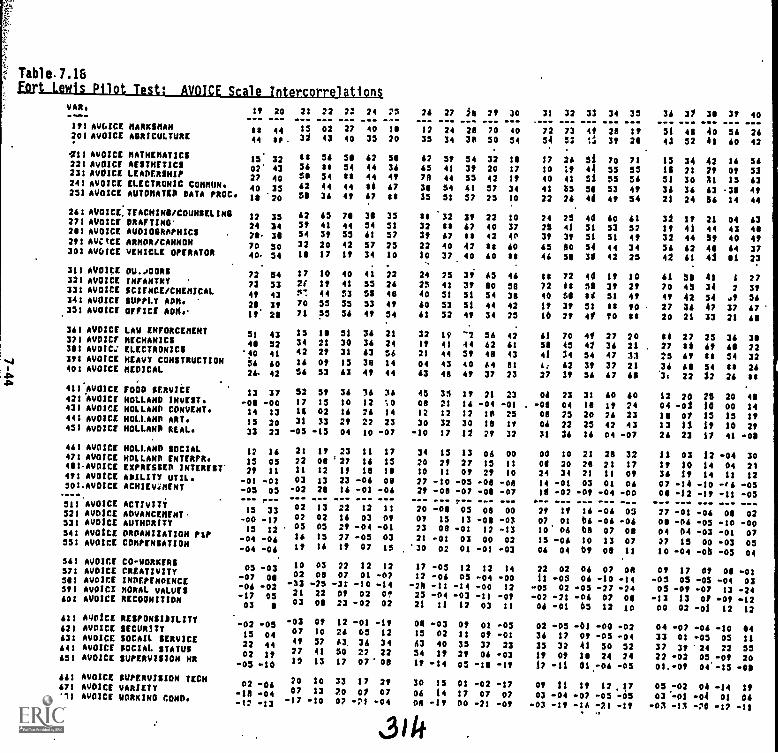
Table. 7.18EreLLIAL211dant;amuuuluntaro
s
.tb
VAR,
111 AVGICE MARKSMAN201 AVOICE AGRICULTURE
In AVOICE MATHEMATICS221 AVOICE AESTHETICS231 AVOICE LEADERSHIP241 AVOICE ELECTRONIC COMMUN.251 AVOICE AUTOMATED DATA PROC.
261AVOICE.TEACHINS/COUNSELING271 AVOICE DRAFTING'28: AVOICE AUDIOGRAHICS
.
211 AVOCE ARMOR/CANNON301 AVOICE VEHICLE OPERATOR
311 AVOICE OU..O0RS321 AVOICE INFANTRY321 AVOICE SCIENCE /CHEMICAL341 AVOICE SUPPLY ADM.351 AVOICE emu Mon.
361 AVOICE LAW ENFORCEMENT371 AVOICF MECHANICS381 AVOIC: ELECTRONICS311 WIC( HEAVY CONSTRUCTION401 AVOICE MEDICAL
411 AVOICE FOOD SERVICE42I'AVOICE HOLLAND INVEST.421 WICK HOLLAND CONVENT.441 AVOICE HOLLAND ART.451 AVOICE HOLLAND REAL.
461 AVOICE HOLLAND SOCIAL471 AVOICE HOLLAND ENTERPR.411AVOICE EXPRESSED INTEREST'411 AVOICE ABILITY UTIL.50I.AVOICE ACHIEViMENT
511 AVOICE ACTIVITY521 AVOICE ADVANCEMENT.531 AVOICE AUTHORITY541 AVOICE ORGANIZATION PIP551 AVOICE COMPENSATION
361 AVOICE CO-WORKERS571 AVOICE CREATIVITY381 AVOICE INDEPENDENCE311 AVOICI MORAL VALUES101 AVOICE RECOGNITION
111 44010E RESPONSIBILITY621 AVOICE SECURITY631 AVOICE SOCAAL SERVICE141 AVOICE SOCIAL STATUS151 AVOICE SUPERVISION HR
641 AVOICE SUPERVISION TECH171 Avotcr VARIETY611 AVOICE WORKING COND.
If 20
Al 4444 *8
.
15 3202' 4327 4040 35is .20
12 35
24 3428. 2870 5040 54
72 5473 5341 4321. 1111 2$
51 434$ 52
'40 41
6 6026. 42
13 37..08 -0014 13
15 2033 23
12 IA12 0322 11
-01 1-03 05
15 33
-00 -1715 12
-04 -06-04 -06
05 -03-07 00
-06 -02-17 0303 0
-02 ..0513 04
22 4402 11
-05 -10
02 -0610 04.I2 -13
21
1532
$.8
56SD625$
6251543218
17211r.!
7071
1534421656
521716
31
-05
21
2211
03-02
0202
. 05
1611
1002
-332103
-0307472712
2007
-17
22
0243
56$11
544436
6541312017
10If4455ps
112127
Of53
51150233
-15
11
0812
1328
130205
1516
0301
-752208
Of10
5741
13
10
13
2: 24
27 4040 35
58 6254 44t$ 4444 $441 67
78 3144 5455 61
42 5711 34
40 4141 5553 5855 5356 41
51 3630 3631 6315 2863 47
36 3610 1216 2621 2204 10
23 11'27 IA11 1823 -OAIA -01
22 1216 0327 -04
77 -05If 07
22 1207 01
-31 -10Of 0223 -02
12 -0126 0563. 3650 2217 07'
33 1720 0707 -71
25
18
20
513641
67If
3551572510
2226484754
2124
561444
36;014
23
-07
1715II
08-06
11
Of-010315
12-07-14Of02
-1112342208
2107
-04
21
12
35
62657R1835
11$
32312210
24
25406061
32If
21
0463
450812
30-10
342010
2727
20012321
'20
1712
-262521
0815
6354If
3006OR
27
2434
5141
44
5451
'22$$674027
2541
51
5352
1941
44
4348
2521
12
32
17
1521II
-10-08
-081508
-0102
-05-06-II-0411
-030240If
-14
15
14.-11
21
2828
5421554157
3167*14240
372151
5141
-144514041
If16123012
1327Of
-05-07
0513
-0103Os
1205
-14-0312
01II
3527
03
011700
21
7050
3220425725
224042it60
65BO544434
5662486437
21
-041818
21
061527
-08-08
08-0112
00-01
12-04-00II03
01
Of370618
-0207
-21
30
4054
1817If
3410
103740
1011
46
58314225
4261
43
8123
23-0125II
32
00II
10
-04-07
00-03-1302
-03
14
-0012
II
-05-0123
-If
-1707
-07
31
72s4
171040
41
22
242531,
1546
$1724011
10
61
5841
L:27
01-080801
31
00Of2414
IS
2/0710'15
06
2211
*03-02OA
02363518
17
01
03-03
32
735:
26If41
8526
2541
31
8058
72t$
5831
21
704534
8231
2304252231
10
2034
-01-02
If
01
06-0604
02-0502
-21
-0517
32Of
-11
11
-04-11
33 34
41 28t; 21
51 7044 55s3 5558 5340 41
40 6051 5351 51
54 4438 42
40 If51 31$6 5151 55
41 TO
4/ 2747 3654 4731 3756 67
31 AO18 1120 2625 4216 04
21 2828 2121 11
03 01-Of -04
IA -OA06 -06oe 0710 1301 08
06 0706 10
-05 -27-06 0705 12
-01 -00Of -0541 5011 2401..-06
11 12-07 -05-16 -21
35
If28
7155564154
6152413425
102747108$
2021332168
60242343
-07
3217010600
05
oe0711
OA-14-74OS10
-02-045224
-05
.17.45-If
31 31
51 4143 52
15 34IS 2151 3031 3621 24
32 1111 4132 4456 6242 61
61 511
70 4547 4227 3620 21
St 2727 8425 6136 68
22
12 2004 -01If 0713 1326 23
11 03If 1036 If07 14OS -12
77 -0101 -OA04 0407 1510 -04
01 17-05 0505 -01
1300 02
04 -0733 0137 3122 -0201.01
05 -0202 ...Of
-03 -13
31 37
40 5645 60
42 Id2, 0131 15
63 31DA 14
21 0444 4351 4048 6441 11
41 L
34 2
s4 of47 3733 21
25 36Af 18If 54
54 $$32 26
25 2010 0015 15If 1011 41
12 -0414 0414 II
-10 -'6-11 -11
-06 08-05 -10-03 -0100 -03
-OD -05
01 Of-05 -04..07 1307 01
-01 12
-06 10-05 05'24 2205 ..01
04.-15
04 -14-04 01-20 I7
40
2642
5653634144
6341413723
27315667
38223226118
48141121-OS
302112
-05
02-00070504
-0103
-24
12
8411
5520
011
1706
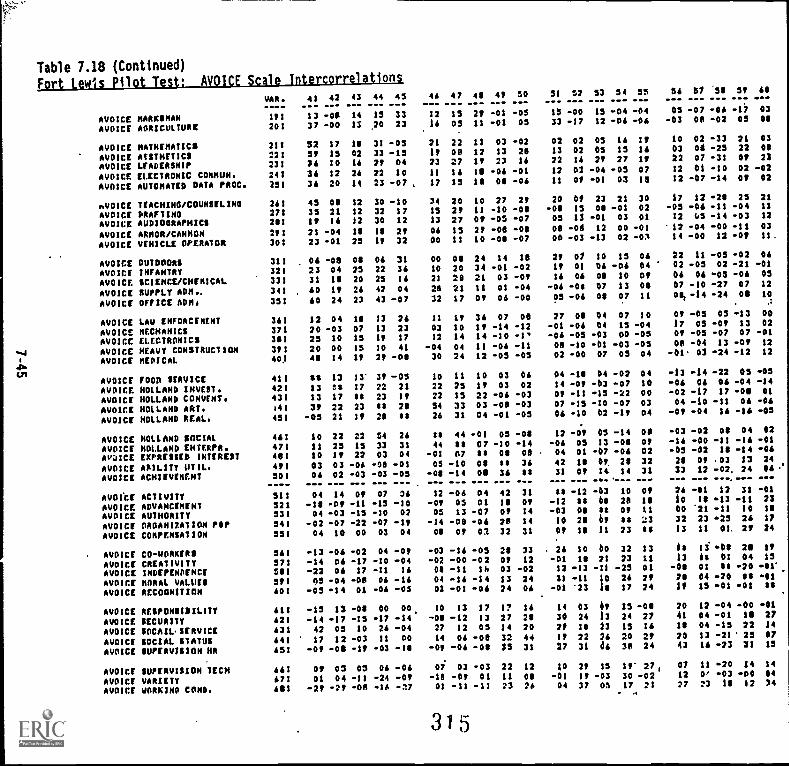
Table 7.18 (Continued)fort Lewis Pilot Test: AVOICE Scale Intercorrelations
VAR. 41 42 43 44 45 44 47 41 41 50 51 52111 11"
53.1-
54-1-
55111
36 SE '50 SP 60
AVOICE MARKSMAN 111 33 40 14 15 33 12 15 2/ -01 -05 13 -00 15 -04 -04 05 -07 -06 -17 03
AVOICE AGRICULTURE 201 37 -00 IS 20 23 IA 05 11 -01 05 33 .17 12 -04 -04 -03 OP -02 05 OS
AVOICE MATHEMATICS 211 52 17 IS 31 -05 21 22 11 03 -02 02 02 03 Id If 10 02 -33 21 03
AVOICE A/STK/ICS 221 5/ 15 02 33 .15 If 00 12 13 20 13 02 05 15 16 03 00 .25 22 OS
AVOICE LEADERSHIP 231 74 10 14 21 04 23 27 11 23 14 22 IA 21 27 11 22 01 -31 0/ 23
AVOICE ELECTRONIC COMMUN. 241 34 12 24 22 10 11 14 11 44 -01 12 03 -04 -05 07 12 01 -10 02 -02
AVOICE AUTOMATED DATA PROC. 231 34 20 14 23 -07 17 15 10 08 -OA 11 08 41 03 15 12 -07 -14 0/ 02
..VOICE TFACHINO/COUNSELING 261 45 OS 12 30 -10 34 20 10 27 21 20 01 23 21 30 17 12 41 25 21
AVOICE DRAFTING 271 35 21 12 32 17 13 21 11 40 -Of 41 15 01 41 02 45 44 -11 -04 11
AVOICE AUDIOGRAPHICS 211 1/ 14 12 30 12 13 27 Of -05 -07 05 13 -01 03 01 12 45 -14 -03 12
AVOICE ARMOR/CANNON 211 21 -04 11 18 21 OA 15 21 40 -OS 01 41 12 00 -01 '12 -04 -00 -11 03
AVOICE VEHICLE OPERATOR 301 23 -01 25 11 32 00 11 10 -OS -07 00 -03 -13 02 :4 14 -00 12 .0/ 11.
AVOICE OUTDOORS 311 04 -OS OS OA 31 00 Of 24 14 18 21 01 10 13 06 22 11 45 -02 04
AVOICE INFANTRY 321 23 04 25 22 34 10 20 34 -01 -02 11 01 OA 44 04 02 -05 02 -21 -01
AVOICE SCIENCE /CHEMICAL 331 31 IS 20 25 IA 21 29 21 03 -01 14 04 09 10 01 OA 04 05 44 05
AVOICE SUPPLY ADM.. 341 40 1/ 24 42 04 21 21 11 01 -04 -OA -06 07 13 00 07 -10 -27 07 12
AVOICE OFFICE AOM6 351 40 24 23 43 -07 32 17 01 06 -00 OS -04 08 07 11 01,-44 .24 OS 10
AVOICE LAY ENFORCEMENT 361 12 04 10 13 24 11 11 34 07 00 27 OS 04 07 10 01 -05 05 13 00
AVOICE MECHANICS 371 20 -03 07 13 23 03 10 If -14 -12 -01 .46 04 13 -04 17 OS 41 13 02
AVOICE ELECTRONICS 301 25 10 15 11 17 12 14 14 -10 -11 -04 -05 -03 00 -05 Of -05 -07 07 -01
AVOICE HEAVY CONSTRUCTION 3/1 20 00 15 10 41 -04 04 II -04 -11 OR -.10 -01 -03 -05 OR -04 13 4/ 12
AVOICE MEDICAL 401 41 14 11 21 41 30 24 12 -05 -05 02 -00 07 05 04 41' 03 44 -12 12
AVOICE F000 SERVICE 411 IS 13 13' 31 -05 10 11 10 03 OA 04 15 04 42 04 ..13 .14 -22 05 45
AVOICE HOLLAND INVEST. 421 13 IS 17 22 21 22 25 1? 03 02 14 1 -03 -07 10 44 06 04 -04 .14
AVOICE HOLLAND CONVENT. 431 13 17 $$ 23 If 22 13 22 46 -03 Of -11 .15 -22 00 -02 -17 17 41 01
AVOICE HOLLAND ART. 141 3/ 22 23 $t 21 54 33 03 41 -03 07 .0.15 -10 -07 03 04 -.10 ..11 04 -04
AVOICE HOLLAND REAL. 451 -05 21 11 20 St 26 31 04 41 45 04 0.10 02 ..11 04 41 -04 14 -14 -05
AVOICE HOLLAND SOCIAL 441 10 22 22 54 24 44 44 .01 05 -OS 12 41 05 -14 00 -03 42 OS 04 02
AVOICE HOLLAND EHTERPR. 471 11 25 15 33 31 44 $4 07 ..10 -14 -06 05 13 -08 01 -14 -00 .11 ..16 41
Ava10E EXPRESSED INTEREST 401 10 1/ 22 03 04 41 07 St OS OS 04 01 -07 44 02 -05 -02 15 -14 44
AVOICE ABILITY OTIL. 411 03 03 44 -08 41 03 -10 01 4$ 34 42 28 01. 21 32 21 010 .03 17 24
AVOICE ACHIEVEMENT 501 OA 02 -03 -03 -05 -OS -14 OS 34 $t 31 01 14 14 31 33 12 -02. 24 04 .
---- --- -.. -- -.. °---
AVOI.CE ACTIVITY 511 04 14 Of 07 34 12 46 04 42 31 44 0..12 -03 10 01 24 -01 12 31 -01
AVOICE ADVANCEMENT 521 -10 -0/ 11 -15 10 -Of 03 01 11 Of -12 41 be 25 IS 10 IS .13 -11 23
AVOICE AUTHORITY 531 04 -03 -15 10 02 OS 13 -07 01 14 -03 Of 88 01 11 00 '21 -11 10 IS
AVOICE OROANUATION POP 541 -02 -07 -22 -07 .-11 .14 -08 46 21 14 10 21 is ss .13 32 23 .25 24 17
AVOICE COMPENSATION 551 04 10 00 03 04 OS Of 01 32 31 01 IS 11 23 St 13 11 OL 21 24
AVOICE CO- WORKERS 541 -13 44 -02 04 49 -03 -16 45 20 33 26 10 Do 32 13 it 13. .01 28 I/
AVOICE CREATIVITY 571 -14 04 -17 -10 -04 -02 -00 -02 031 12 -01 IS 21 23 11 13 it 01 04 15
AVOICE INDEPENDENCE 511 -22 04 17 -II 16 04 -11 IN 03 -02 12 ..13 .11 -25 01 .41 01 88 40 -01'
AVOICE MORAL VALUES 5/1 95 -04 418 Od Id 04 -14 044 13 24 31 .11 10 24 21 21 04 -20 SS 41AVOICE RECOGNITION 601 -05 .14 01 -OA -05 02 41 .06 24 04 -01 '23 11 17 24 11 15 -01 -01 SS
AVOICE RESPONSIDILITY 611 -15 13 41 00 00. 10 13 37 I? 14 14 03 0/1 15 0.011 20 12 -04 -00 -01
AVOICE SECURITY 421 -14 0.17 -IS -17 -14 -OS -12 13 27 21 30 24 13 24 27 41 04 .01 10 27
AVOICE SOCAILSERVICE 431 42 05 10 24 -04 27 12 05 14 20 21 10 23 15 16 IS 04 .015 22 14
AVOICE SOCIAL STATUS 441 17 12 -03 II 00 14 06 40 32 44 11 22 24 20 21 20 13 41 25 07
AVOICE SUPERVISION 1411 451 4? -00 -If -03 *IS -01 -OA 41 35 31 27 31 54 38 24 43 14 -23 31 15
AVOICE SUPERVISION TECH 441 01 05 03 OA -04 07 03 -03 22 12 10 21 15 11' 27, 07 11 0 14 14
AVOICE VARIETY 671 01 04 .11 -24 -01 -10 411 01 11 00 41 31 -03 30 -02 12 01 -03 -00 54
AVOICE WORKINO COND. 401 ...21 -21 -OR -44 -'7 03 -13 13 23 24 04 37 03 17 21 27 23 11 12 34
315
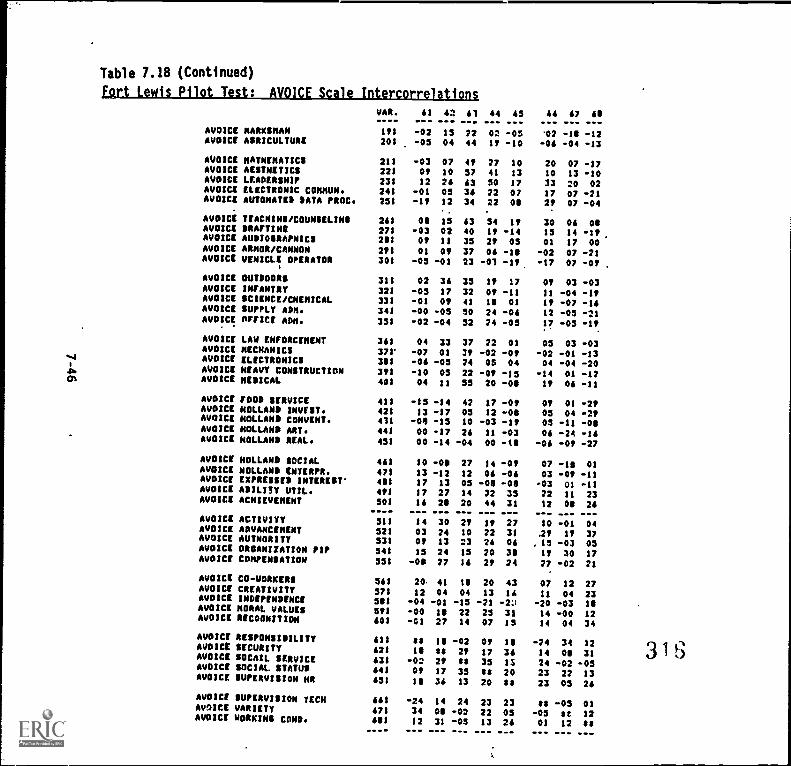
Table 7.18 (Continued)Fort Lewis Pilot Test L AVOICE Scale Intercorrelations
VAR. 61 42 61 64 45 44 67 AS.... ... ... ... ... ..... ... ... ...AVOICE MARKSMAN 111 -02 13 22 02 -05 17 -10 -12*VOICE ASRICULTURE 201 -05 04 44 11 -10 16 -04 -13
AVOICE MATHEMATICS 211 -03 07 41 27 10 20 07 ..17*VOICE AESTHETICS 221 01 10 57 41 13 10 13 -10*VOICE LEAPERSH1P 231 12 24 63 50 17 33 20 02AVOICE ELECTRONIC COMMUN. 241 .11 05 26 22 07 17 07 -21AVOICE AUTOMATED DATA PROC. 251 .11 12 34 22 OS 21 07 -04
AVOICE TEACNINO/COUNSELINS 261 08 15 63 54 11 30 06 OSAVOICE SRAFTINO 271 -03 02 40 11 -14 15 14 -I/AVOW' AUDIOGRAPHICS 201 Of 11 35 21 05 01 17 00AVOICE ARMOR/CANNON 211 01 01 37 04 .10 -02 07 -21AVOICE VEHICLE OPERATOR 301 -05 -01 23 .41 11 .17 07 .11
AVOICE OUTDOORS 111 02 34 35 11 17 01 03 -03AVOICE INFANTRY 321 -05 17 32 01 -11 11 -04 .11AVOICE SCIENCE/CHEMICAL 331 -01 01 41 I0 01 11 -07 -14AVOICE SUPPLY ADM. 341 -00 -05 30 24 -04 12 -05 -21AVOICE Airier Alm. 351 -02 -04 52 24 .15 17 .15 .11
AVOICE LAG ENFORCEMENT 361 04 33 37 22 01 05 03 -03AVOICE MECHANICS 371' -07 01 31 -02 .01 .12 -01 -13.1 AVOICE ELECTRONICS 311 -04 -05 24 05 04 04 -04 -20o
.12. *VOICE HEAVY CONSTRUCTION 311 -10 05 22 .41 .15 -14 01 -1201 AVOICE MEDICAL 401 04 11 55 20 .10 11 04 -11
AVOICE FOOD SERVICE 411 .15 .44 42 17 .41 Olt 01 ..21AVOICE HOLLAND mat. 421 13 .47 05 12 .40 05 04 ..21AVOICE HOLLAND CONVENT. 411 -04 -15 10 -03 .11 03 ..11 -00AVOICE HOLLAND ART. 441 00 .47 24 11 -03 04 -24 -14*VOICE HOLLAND REAL. 451 00 -14 -04 00 ..10 .16 .40 -27
AVOICE HOLLAND SOCIAL 461 10 .411 27 14 ..01 07 .111 01AVOICE NOLLAND CNTERPR. 471 13 -12 12 06 .46 03 .41 -11AVOICE EXPRESSES INTEREST' 401 17 13 05 ..40 -OS .03 01 ..11AVOICE MLITT UTIL. 411 17 27 14 32 35 22 11 23AVOICE ACNIEVEMENT 501 16 20 20 44 31 12 OS 26
.........-. ....... ........
AVOICE ACTIVITY 511 14 30 21 If 27 10 .41 04AVOICE ADVANCEMENT 521 03 24 10 22 31 21 11 37AVOICE AUTNORITY 531 01 13 23 24 06 .13 -03 05AVOICE ORGANIZATION PSP 541 15 24 15 20 30 11 30 17AVOICE COMPENSATION 551 -411 27 16 21 74 27 -02 21
AVOICE CO- YORKERS 561 20. 41 10 20 43 07 12 27AVOICE CREATIVITY 571 12 04 04 13 14 11 04 23AVOICE INDEPENDENCE 5S1 -04 -01 .15 -21 ..2:1 -20 -03 111AVOICE MORAL VALUES*VOICE RECOGNITION
511601
-0001
1$27
2214
2507
3115
14 -0014 04
1234
AVOICE RESPONSISILITY 611 ii 10 -02 01 II -24 34 12AVOICE SECURITY 621 IS ii 21 17 36 14 OS 31AVOICE SOCAIL SERVICE 631 -02 21 tt 35 11 24 -02 -05AVOICE SOCIAL. STATUS 641 01 17 35 it 20 23 22 13AVOICE SUPERVISION MR 651 IS 36 13 20 ti 23 05 26
AVOICE SUPERVISION TECH 661 .14 14 24 23 23 ti .45 01*yam VARIETY 471 34 OS -02 22 05 -05 it 12AVOICE MORKINS COND. 601 12 31 .45 13 26 01 12 Si.... ... ... ... ... ... ... ... ...
3 1 6
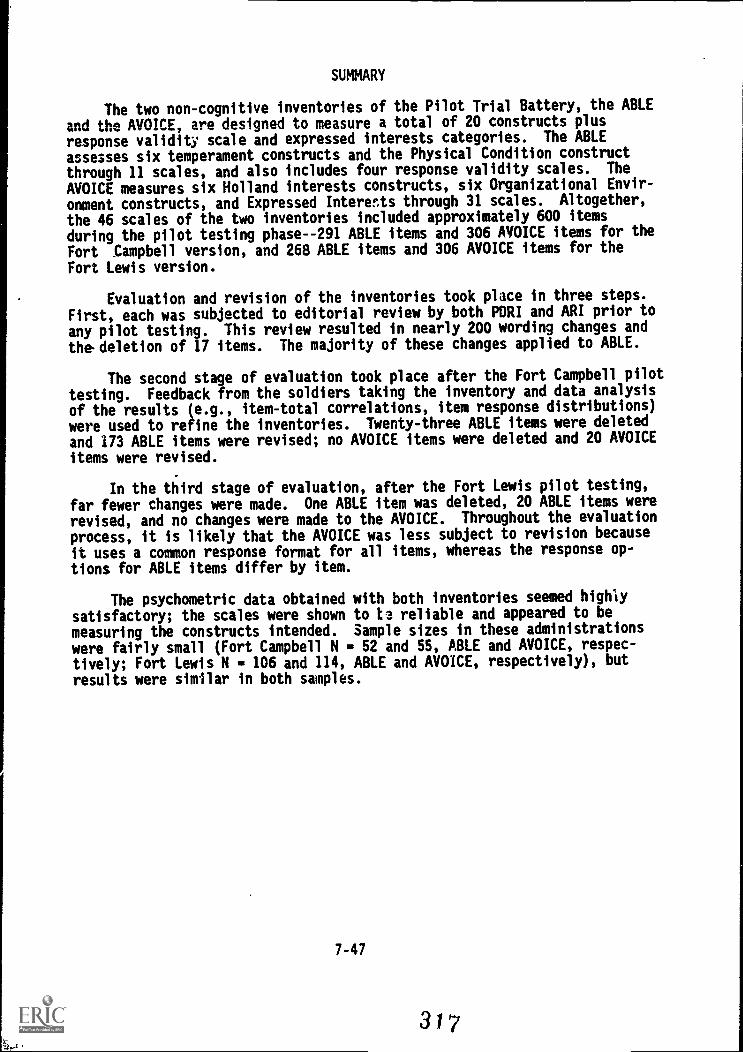
SUMMARY
The two non-cognitive inventories of the Pilot Trial Battery, the ABLE
and the AVOICE, are designed to measure a total of 20 constructs plus
response validity scale and expressed interests categories. The ABLE
assesses six temperament constructs and the Physical Condition construct
through 11 scales, and also includes four response validity scales. The
AVOICE measures six Holland interests constructs, six Organizational Envir-
onment constructs, and Expressed Interests through 31 scales. Altogether,
the 46 scales of the two inventories included approximately 600 items
during the pilot testing phase--291 ABLE items and 306 AVOICE items for the
Fort Campbell version, and 268 ABLE items and 306 AVOICE items for the
Fort Lewis version.
Evaluation and revision of the inventories took place in three steps.
First, each was subjected to editorial review by both PDRI and ARI prior to
any pilot testing. This review resulted in nearly 200 wording changes and
the deletion of 17 items. The majority of these changes applied to ABLE.
The second stage of evaluation took place after the Fort Campbell pilot
testing. Feedback from the soldiers taking the inventory and data analysis
of the results (e.g., item-total correlations, item response distributions)
were used to refine the inventories. Twenty-three ABLE items were deleted
and 173 ABLE items were revised; no AVOICE items were deleted and 20 AVOICE
items were revised.
In the third stage of evaluation, after the Fort Lewis pilot testing,
far fewer changes were made. One ABLE item was deleted, 20 ABLE items wererevised, and no changes were made to the AVOICE. Throughout the evaluation
process, it is likely that the AVOICE was less subject to revision because
it uses a common response format for all items, whereas the response op-tions for ABLE items differ by item.
The psychometric data obtained with both inventories seemed highly
satisfactory; the scales were shown to to reliable and appeared to bemeasuring the constructs intended. Sample sizes in these administrations
were fairly small (Fort Campbell N 52 and 55, ABLE and AVOICE, respec-
tively; Fort Lewis N 106 and 114, ABLE and AVOICE, respectively), butresults were similar in both samples.
7-47
317
Chapter 7 References
Alley, W. E., & Matthews, M. D. (1982). The Vocational Interest CareerExamination: A description of the instrument and possible applica-tions. The Journal of Psychology, 112, 169-193.
Dahlstrom, W. G., Welsh, G. S., & Dahlstrom, L. E. (1975). An MMPIhandbook, Volume II: Research applications. Minneapolis: Universityof Minnesota Press.
Dolliver, R. H. (1969). Strong Vocational Interest Blank versus expressedvocational interests: A review. Psychological Bulletin, 72, 95-107.
Gough, H. G. (1975). Manual for the California Psychological Inventory.Palo Alto, CA: Consulting Psychologists Press.
Holland, J. L. (1966). The psychology of vocational choice. Waltham, MA:Blaisdell.
Hough, L. M., et al. Literature review: Utility of temperament,biodata, and interest assessment for predicting job performance.ARI Research Note in preparation.
,
Wernimont, P. F., & Campbell, J. P. (1968). Signs, samples, and criteria.Journal of Applied Psychology, 52, 372-376.
318
7-48
CHAPTER 8
NON-COGNITIVE MEASURES: FIELD TESTS
Leaetta N. Hough, Natthdw K. McGue, Janis S. Houston,and Elaine D. Pulakos
In this chapter we ',scribe the field tests of the non-cognitivemeasures in the Pilot Trial Battery, the ABLE and the AVOICE, whose devel-
opment was described in Chapter 7. Portions of this chapter are drawn from
Hough, Barge, Houston, McGue, and Kamp (1985).
We first discuss the results of the Fort Knox field test in September1984, the generol procedures for which were described in Chapter 2. Wealso discuss here the procedures and results of the field testing done atFort Bragg, where the ABLE and AVOICE were administered to soldiers underseveral experimental conditions, in order to estimate the extent to whichscores on these inventories could be "faked" when individuals are in-
structed to do so. We also describe, in the context of this "fakability"study, the procedures and results of the ABLE and AVOICE administration torecruits at the Military Entrance Processing Station (MEPS) at
Minneapolis.
Figures 8.1 and 8.2 list the entire set of scales, by construct,contained in the Fort Knox version of the ABLE and AVOICE, respectively.Chapter 7 presented a complete description of each of these constructs andscales, with sample items, and the two inventories themselves in the formadministered at Fort Knox, may be found in Appendix G.
8-1
3
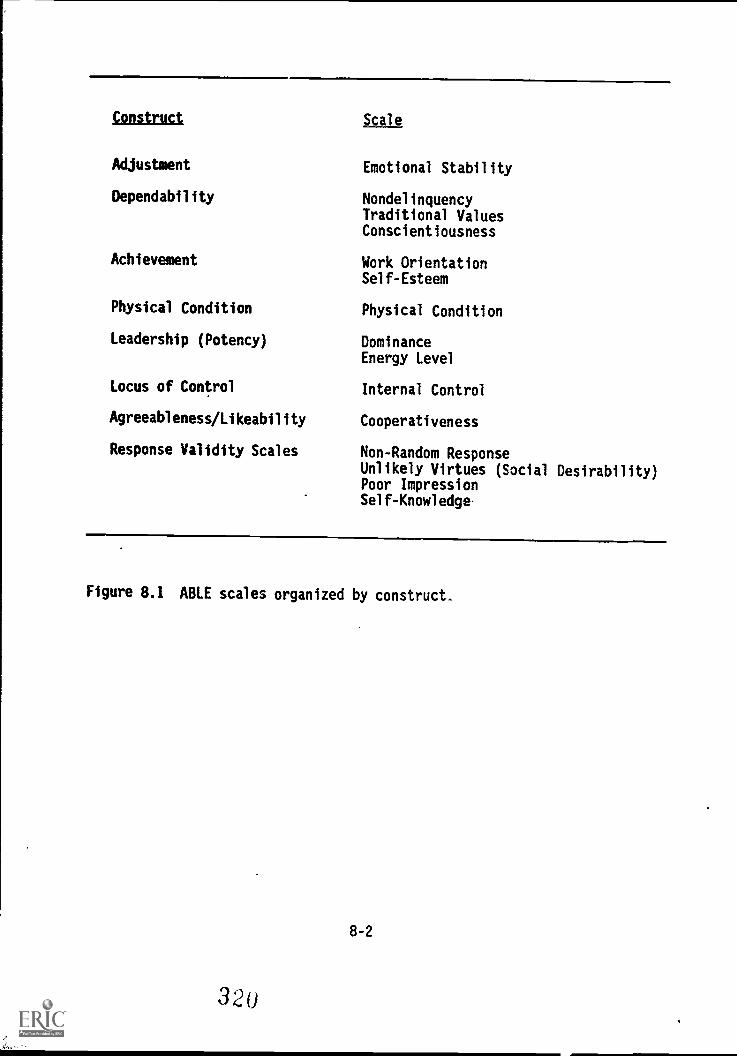
Construct Scale.
Adjustment
Dependability
Achievement
Physical Condition
Leadership (Potency)
Locus of Control
Agreeableness/Likeability
Response Validity Scales
Emotional Stability
NondelinquencyTraditional ValuesConscientiousness
Work OrientationSelf-Esteem
Physical Condition
DominanceEnergy Level
Internal Control
Cooperativeness
Non-Random ResponseUnlikely Virtues (Social Desirability)Poor ImpressionSelf-Knowledge.
Figure 8.1 ABLE scales organized by construct.
8-2
32
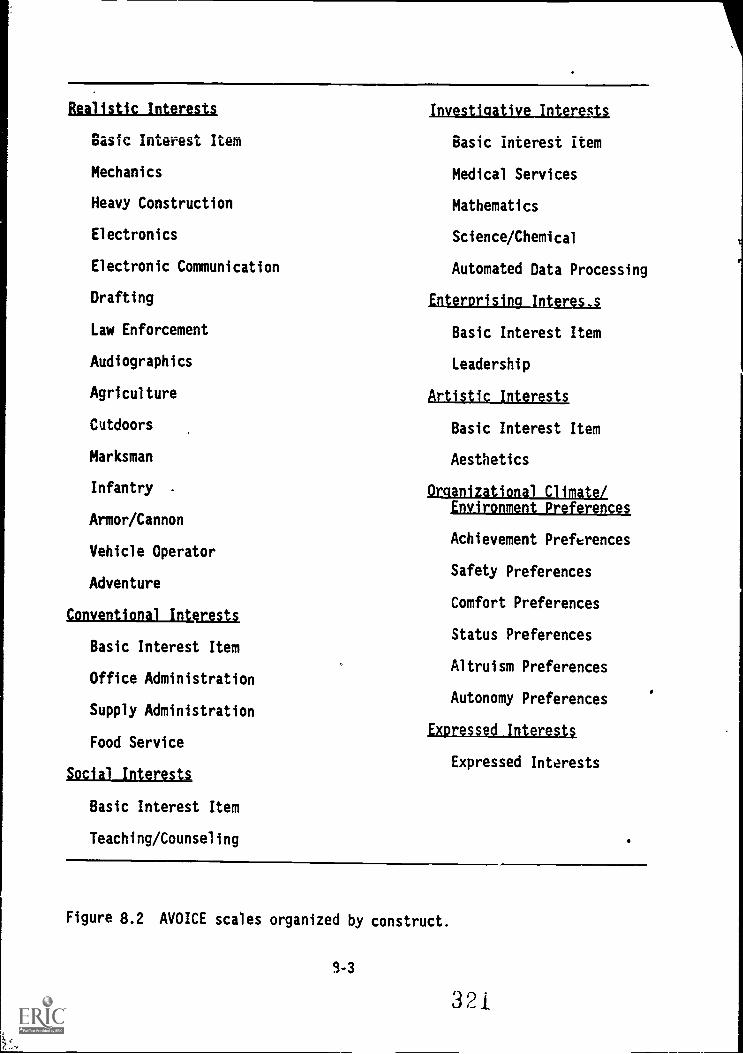
Realistic Interests
Basic Interest Item
Mechanics
Heavy Construction
Electronics
Electronic Communication
Drafting
Law Enforcement
Audiographics
Agriculture
Cutdoors
Marksman
Infantry
Armor/Cannon
Vehicle Operator
Adventure
Conventional Interests
Basic Interest Item
Office Administration
Supply Administration
Food Service
Social Interests
Basic Interest Item
Teaching/Counseling
Investigative Interests
Basic interest Item
Medical Services
Mathematics
Science/Chemical
Automated Data Processing
Enterprising Interests
Basic Interest Item
Leadership
Artistic Interests
Basic Interest Item
Aesthetics
Organizational_Climate/Environment Preferences
Achievement Preferences
Safety Preferences
Comfort Preferences
Status Preferences
Altruism Preferences
Autonomy Preferences
Expressed Interests
Expressed Interests
Figure 8.2 AVOICE scales organized by construct.
3-3
321
ANALYSIS OF DATA FROM FIELD TEST ADMINISTRATION
Results of Data Quality Screening
In Table 8.1, the data screening results are presented for the FortKnox field test. A total of 290 soldiers completed the ABLE and 287soldiers completed the AVOICE. After deletion of inventories with greaterthan 10 percent missing data for both inventories, and deletion of thoseABLEs where scores on the Non-Random Response Scale (NRRS) were less thansix, a total of 276 ABLEs and 270 AVOICEs were available for analysis.
Recall from Chapter 2 that portions of the Pilot Trial Battery werere-administered to soldiers two weeks after the first administration. Ascan be seen in Table 8.1, the tota! number of "Time 2" ABLE and AVOICEinventories, after the data quality screens had been applied, was 109 and127, respectively.
Mean Scores and Reliability Estimates
Summary statistics for the non-cognitive measures are presented inTables 8.2, 8.3, and 8.4. Several things are noteworthy in Table 8.2. Allthe ABLE content scales show adequate score variances (SD ranges from 5.25to 8.27) and the alpha coefficients are acceptable to excellent in value(median = .84, range = .70 to .87). In passing, we point out that therewas no particular technical reason for computing alpha coefficients on thefield test data rather than Hoyt coefficients as was done for the pilotdata test (see Chapter 7). Both procedures provide conceptually identicalestimates of intern l consistency reliability and provide nearly identicalmathematical results. Other work on Project A was using the alpha coeffi-cient procedure, so we decided to use the same procedure for the sake ofgreater project-wide consistency. The test-retest coefficients are all ator greater than acceptable levels (median - .79, range = .68 to .83), andin most cases are near the same value as the alphas, indicating excellentstability for these scale scores.
The response validity scales have score variances as expected. Un-likely Virtues and Self-Knowledge scores are nearly normally distributedwith somewhat less variance than the content scales, but still on an ac-ceptable level. The Non-Random Response and Poor Impression scales showmarkedly skewed distributions as would be expected for subjects respondingattentively and honestly. The alphas for these scales are a bit lower thanfor the content scales, again as expected. The test-retest coefficientsare also a bit lower, especially for Non-Random Response. However, thevariance is small on this scale (again, as it should be) and the distribu-tion is skewed, so even small changes in responses can have a la,ge effecton this coefficient.
Table 8.3 shows more detail about the test-retest results for theABLE. The results for the content scales, which are the most importantscales in terms of predicting job performance and other criteria, areremarkable for their consistency. There was virtually no change in meanscores between the two administrations, and the effect sizes are verysmall.
The response validity scales appear to be more sensitive to changes
8-4
322
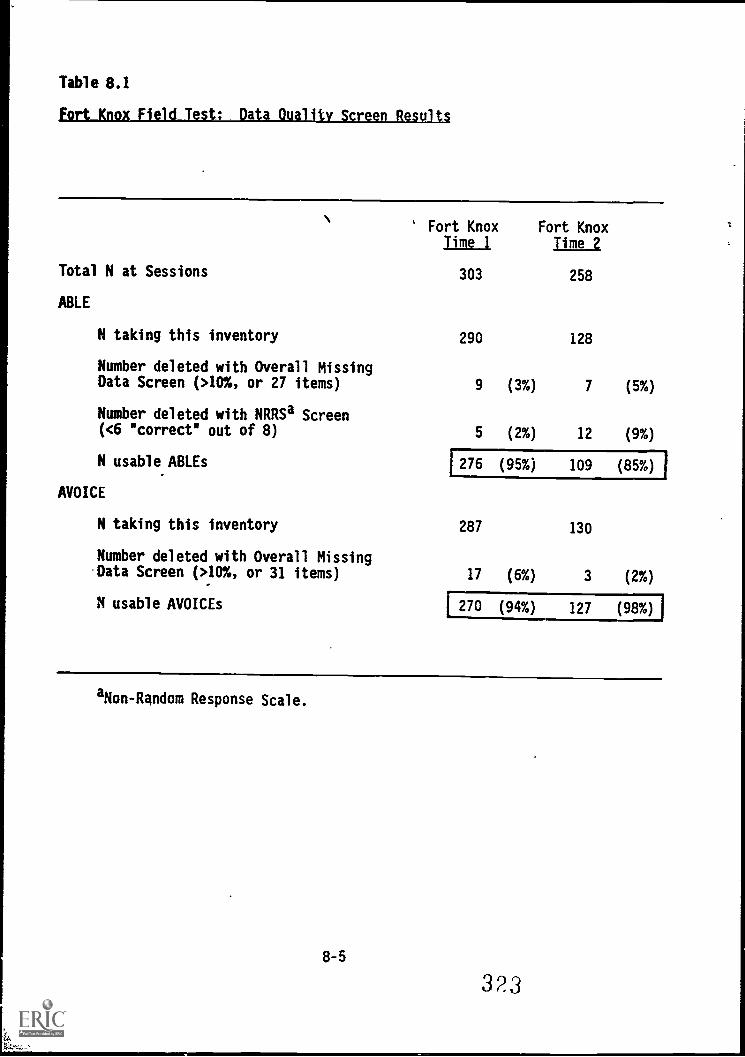
Table 8.1
it .1. es I. I . --I 1-
Total N at Sessions
ABLE
N taking this inventory
Number deleted with Overall MissingData Screen (>10%, or 27 items)
Number deleted with NRRSa Screen(<6 "correct" out of 8)
N usable ABLEs
AVOICE
N taking this inventory
Number deleted with Overall MissingData Screen (>10%, or 31 items)
N usable AVOICEs
Fort KnoxTime 1
303
290
9
5
276
287
17
F270
Fort Knoxime
258
128
(3%) 7
(2%) 12
(95%) 109
130
(6%) 3
(94%) 127
(85%)
(2%)
allon-Random Response Scale.
Ik
8-5
323
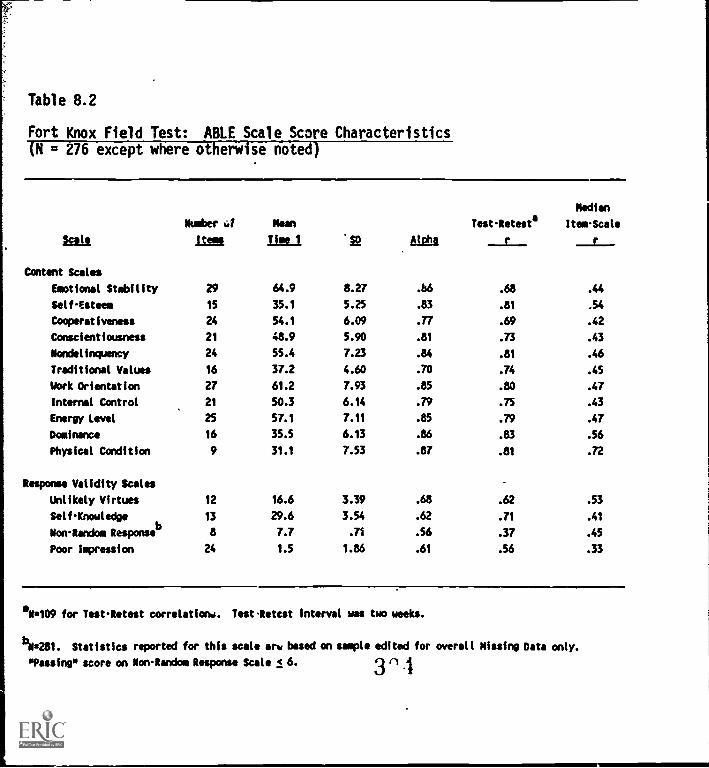
Table 8.2
Fort Knox Field Test: ABLE Scale Scare Characteristics(N = 276 except where otherwise noted)
Rik
Content Scales
Number J
JIMNean
ripe t Aloha
Test-Retesta
Median
Item-Scale
Emotional Stability 29 64.9 8.27 .b6 .68 .44
Self-Esteem 15 35.1 5.25 .83 .81 .54
Cooperativeness 24 54.1 6.09 .77 .69 .42
Conscientiousness 21 48.9 5.90 .81 .73 .43
Nondelinquency 24 55.4 7.23 .84 .81 .46
Traditional Values 16 37.2 4.60 .70 .74 .45
Work Orientation 27 61.2 7.93 .85 .80 .47
Internal Control 21 50.3 6.14 .79 .75 .43
Energy Level 25 57.1 7.11 .85 .79 .47
Dominance 16 35.5 6.13 .86 .843 .56
Physical Condition 9 31.1 7.53 .87 .81 .72
Response Validity Scales
Unlikely Virtues 12 16.6 3.39 .68 .62 .53
Self-Knowledge 13 29.6 3.54 .62 .71 .41
Non-Random Responseb
8 7.7 .71 .56 .37 .45
Poor Impression 24 1.5 1.86 .61 .56 .33
aN=109 for Test-Retest correlation. TestRetcst interval was two weeks.
bN=281. Statistics reported for this scale ary based on sample edited for overall Missing Data only.
"Passing" score on Non-Random Response Scale < 6. 3(1 4
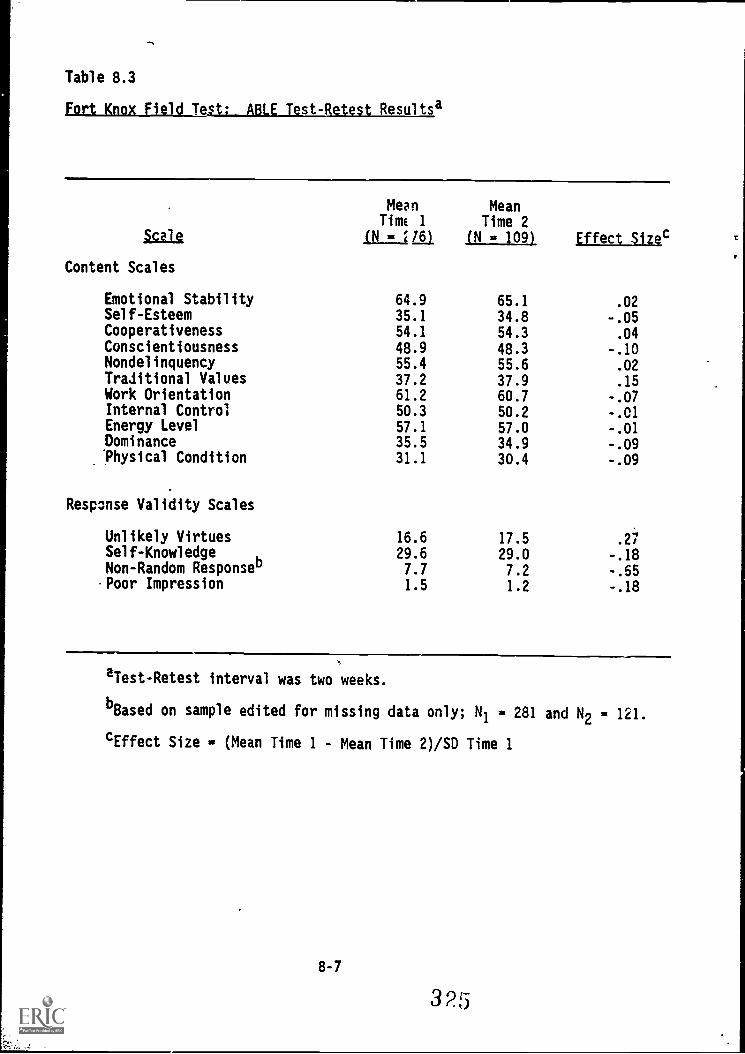
Table 8.3
Fort Knox Field Testes ABLE TestAletest Resultsa
MeanTime 1
MeanTime 2
kale (N E16 (N - 109) Effect Sizec
Content Scales
Emotional Stability 64.9 65.1 .02Self-Esteem 35.1 34.8 -.05Cooperativeness 54.1 54.3 .04Conscientiousness 48.9 48.3 -.10Nondelinquency 55.4 55.6 .02Traditional Values 37.2 37.9 .15Work Orientation 61.2 60.7 -.07Internal Control 50.3 50.2 -.01Energy Level 57.1 57.0 -.01Dominance 35.5 34.9 -.09Physical Condition 31.1 30.4 -.09
Response Validity Scales
Unlikely Virtues 16.6 17.5 .27Self-Knowledge 29.6 29.0 -.18Non-Random Responseb 7.7 7.2 -.65.Poor Impression 1.5 1.2 -.18
aTest-Retest interval was two weeks.
bBased on sample edited for missing data only; N1 - 281 and N2 - 121.
cEffect Size - (Mean Time 1 - Mean Time 2)/S0 Time 1
8-7
325
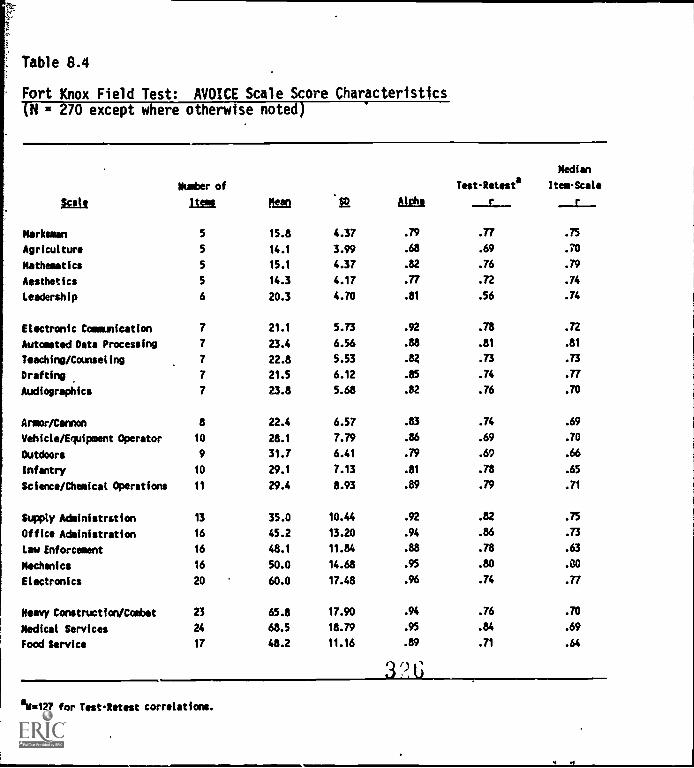
Table 8.4
Fort Knox Field Test: AVOICE Scale Score Characteristics
(N = 270 except where otherwise noted)
201.!
Number of
112MI ft.20
TestRetesta
Median
ItemScale
Marksman 5 15.8 4.37 .79 .77 .75
Agriculture 5 14.1 3.99 .68 .69 .70
Mathematics 5 15.1 4.37 .82 .76 .79
Aesthetics 5 14.3 4.17 .77 .72 .74
leadership 6 20.3 4.70 .81 .56 .74
Electronic Communication 7 21.1 5.73 .92 .78 .72
Automated Data Processing 7 23.4 6.56 .88 .81 .81
Teaching/Counseling 7 22.8 5.53 .82 .73 .73
Drafting 7 21.5 6.12 .85 .74 .77
Audiographics 7 23.8 5.68 .82 .76 .70
Armor/Cannon 8 22.4 6.57 .83 .74 .69
Vehicle/Equipment Operator 10 28.1 7.79 .86 .69 .70
Outdoors 9 31.7 6.41 .79 .69 .66
Infantry 10 29.1 7.13 .81 .78 .65
Science/Chemical Operations 11 29.4 8.93 .89 .79 .71
Supply Administration 13 35.0 10.44 .92 .82 .75
Office Administration 16 45.2 13.20 .94 .86 .73
taw Enforcement 16 48.1 11.84 .88 .78 .63
Mechanics 16 50.0 14.68 .95 .80 .80
Electronics 20 60.0 17.48 .96 .74 .77
Heavy Constructfon/Combet 23 65.8 17.90 .94 .76 .70
Medical Services 24 68.5 18.79 .95 .84 .69
food Service 17 48.2 11.16 .89 .71 .64
3 2 G
aN127 for TestRetest correlations.
rl
due to time or due to a second administration. The change in mean scoresis greater than for the content scales and the effect sizes are somewhatlarger. Still, the changes are not large except for the Non-Random Re-sponse score. The change in this mean score indicates that more subjectsresponded less attentively the second time around, which is perhaps notsurprising. We point out that the Non-Random Response Scale did "catch"this phenomenon, exactly as it was supposed to, and roughly four times asmany subjects "failed" this scale on the second administration as did onthe first (2 percent vs. 9 percent, see Table 8.1). Overall we find theseresults reassuring with respect to the way the content and response validi-ty scales were designed to function.
Table 8.4 shows that the AVOICE scales are also functioning well.Scale score statistics show adequate variance (SD ranges from 3.99, for ascale with a possible score range of 5-25, to 18.79, for a scale with apossible score range from 24-12). Alpha coefficients vary from .68 to .96with a median of .86, with the lower values occurring for the scales withfewer items, as would be expected. The median item-total scale scorecorrelations are all very high (.60s to .70s), also indicating good inter-nal consistency. Finally, the test-retest coefficients are also accept-able to excellent in value (median value - .76, range from .56 to .86).
The results shown in Tables 8.2, 8.3, and 8.4 and discussed above leadto the conclusion that the non-cognitive scales are very sound with regardto basic psychometric criteria of sufficient score variance and distribu-tion, internal consistency, and stability.
JJgueness Estimates for Non-Cognitive Measures
Scales on both the ABLE and the AVOICE were examined for their poten-tial for providing incremental validity to the predictor battery. Unique-ness estimates were computed identically to those described for the cogni-tivemeasures in Chapter 4, by subtracting the squared multiple regressionof a set of tests (e.g., the ASVAB) from the reliability estimate for thetest of interest (V Ryx-RL). Uniqueness is, then, the amount of reli-able variance for a test not shared with the tests against which it hasbeen regressed.
Tables 8.5 and 8.6 present the uniqueness estimates for the ABLE andMICE scales, respectively, when regressed against the ASVAB. The medianU for the ABLE is .80, and ranges from .69 to .87, indicating that theABLE overlaps very little with the ASVAB. The median estimate of unique-ness for the AVOICE is .81 and ranges from .59 to .95, indicating that theAVOICE also overlaps very little with the ASVAB.
Table 8.7 contains a summary of the rwrelations between the ABLE andthe AVOICE, and the other measures in the 'Pilot Trial Battery. As can beseen here, the ABLE and AVOICE share very little variance with the cogni-tive and psychomotor tests in the Pilot Trial Battery.
Factor Analysis of ABLE and AVOICE Scales
The ABLE content scales and the AVOICE scales were separately factoranalyzed, and, in both cases, a two-factor solution appeared to best sum-marize the data. Table 8.8 shows the factor loading matrix for the ABLE
8-9
327
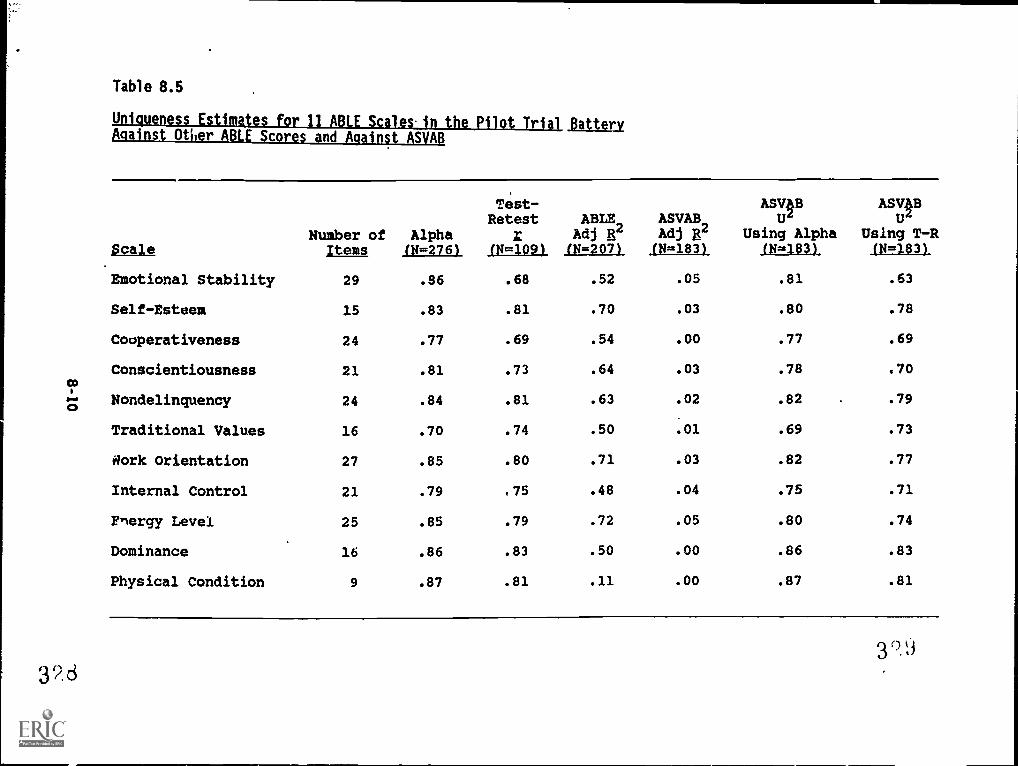
Table 8.5
Uniqueness Estimates for II ABLE ScalesAn the Pilot Trial BatteryAgainst Other ABLE Scores and Against ASVAB
ScaleNumber ofItem
Alpha(N=276)
Test-Retest
X(N=109)
ABLEAdj g2
(N=207)
ASVABAdj R4(N=183)
ASVaBU
Using Alpha(N=183)
ASVPU
Using T-R(N=183)
Emotional Stability 29 .86 .68 .52 .05 .81 .63
Self-Esteem 15 .83 .81 .70 .03 .80 .78
Cooperativeness 24 .77 .69 .54 .00 .77 .69
Conscientiousness 21 .81 .73 .64 .03 .78 .70co
*...o$
Nondelinquency 24 .84 .81 .63 .02 .82 .79
Traditional Values 16 .70 .74 .50 .01 .69 .73
Work Orientation 27 .85 .80 .71 .03 .82 .77
Internal Control 21 .79 .75 .48 .04 .75 .71
Energy Level 25 .85 .79 .72 .05 .80 .74
Dominance 16 .86 .83 .50 .00 .86 .83
Physical Condition 9 .87 .81 .11 .00 .87 .81
326
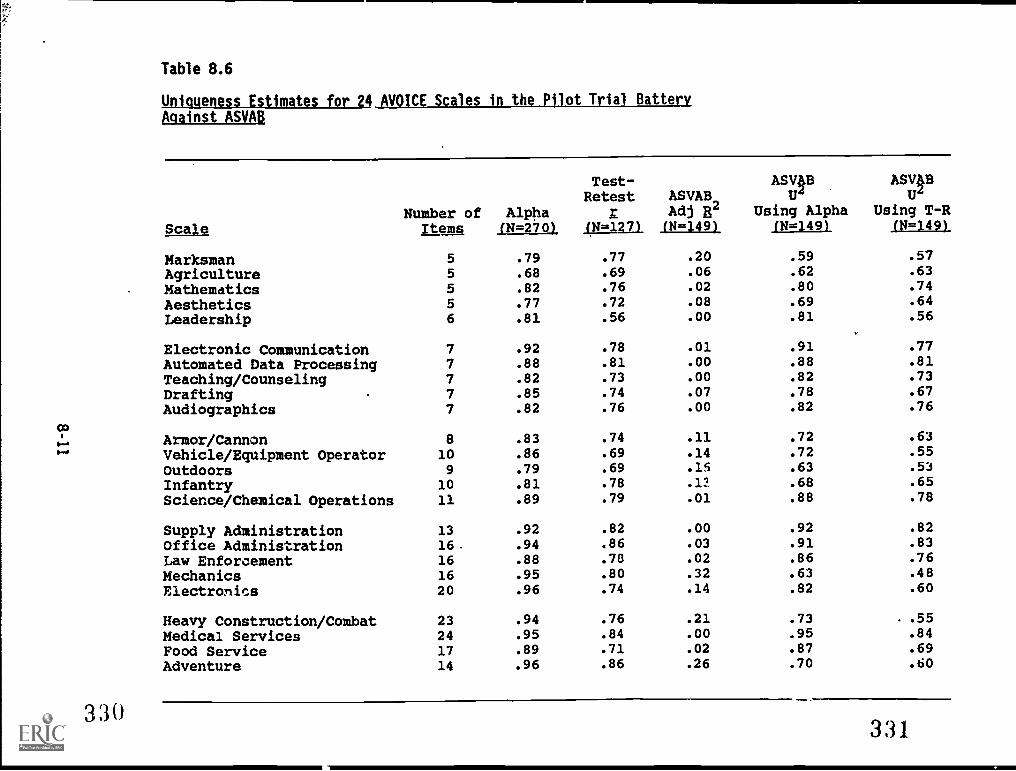
330
Table 8.6
Uniqueness Estimates for 24 AVOICE Scales in the Pilot Trial BatteryAgainst ASVAB
ScaleNumber ofItems
Alpha(N=2701
Test-Retest
(N=127)
ASVAB2Adj
(N=149)
ASVBU
Using Alpha(N=149)
ASVABU
Using T-R(N=149i
Marksman 5 .79 .77 .20 .59 .57
Agriculture 5 .68 .69 .06 .62 .63
Mathematics 5 .82 .76 .02 .80 .74
Aesthetics 5 .77 .72 .08 .69 .64
Leadership 6 .81 .56 .00 .81 .56
Electronic Communication 7 .92 .78 .01 .91 .77
Automated Data Processing 7 .88 .81 .00 .88 .81
Teaching/Counseling 7 .82 .73 .00 .82 .73
Drafting 7 .85 .74 .07 .78 .67
Audiographics 7 .82 .76 .00 .82 .76
Armor/Cannon 8 .83 .74 .11 .72 .63
Vehicle/Equipment Operator 10 .86 .69 .14 .72 .55
Outdoors 9 .79 .69 .15 .63 .53
Infantry 10 .81 .78 .17 .68 .65
Science/Chemical Operations 11 .89 .79 .01 .88 .78
Supply Administration 13 .92 .82 .00 .92 .82
Office Administration 16 .94 .86 .03 .91 .83
Law Enforcement 16 .88 .78 .02 .86 .76
Mechanics 16 .95 .80 .32 .63 .48
Electronics 20 .96 .74 .14 .82 .60
Heavy Construction/Combat 23 .94 .76 .21 .73 .55
Medical Services 24 .95 .84 .00 .95 .84
Food Service 17 .89 .71 .02 .87 .69
Adventure 14 .96 .86 .26 .70 .60
331
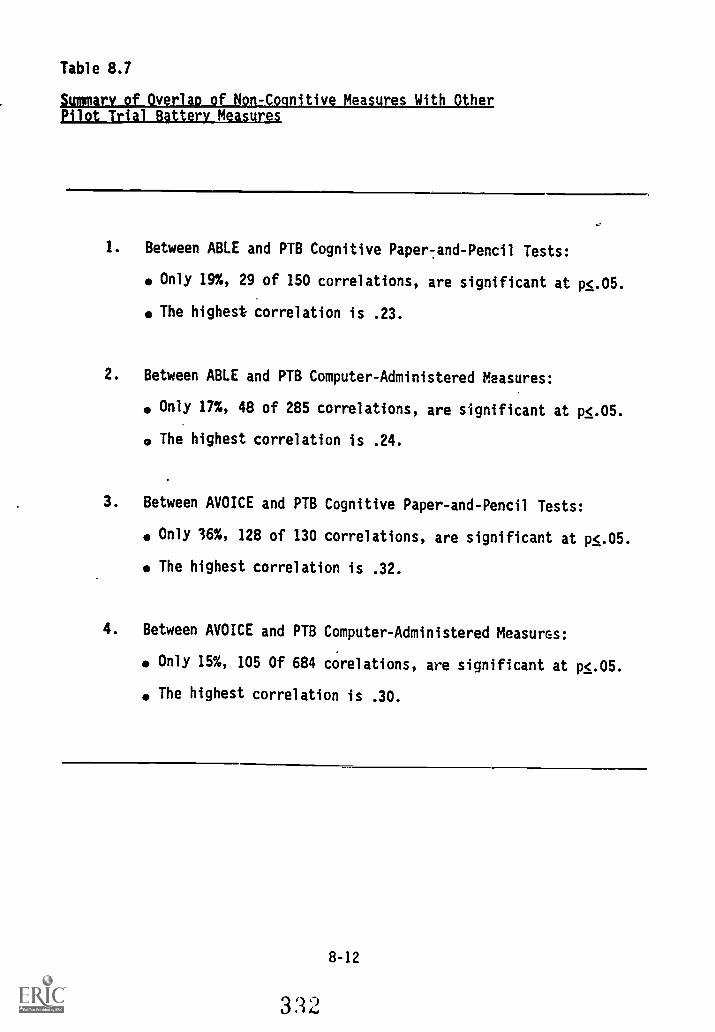
Table 8.1
Summary of Overlao of Non-Cognitive Measures With OtherPilot Trial Battery Measures
1. Between ABLE and PTB Cognitive Paper7and-Pencil Tests:
Only 19%, 29 of 150 correlations, are significant at p<.05.
The highest correlation is .23.
2. Between ABLE and PTB Computer-Administered Measures:
Only 17%, 48 of 285 correlations, are significant at p<.05.
The highest correlation is .24.
3. Between AVOICE and PTB Cognitive Paper-and-Pencil Tests:
Only 36%, 128 of 130 correlations, are significant at p<.05.
The highest correlation is .32.
4. Between AVOICE and PTB Computer-Administered Measures:
Only 15%, 105 Of 684 corelations, are significant at p<.05.
The highest correlation is .30.
8-12
332
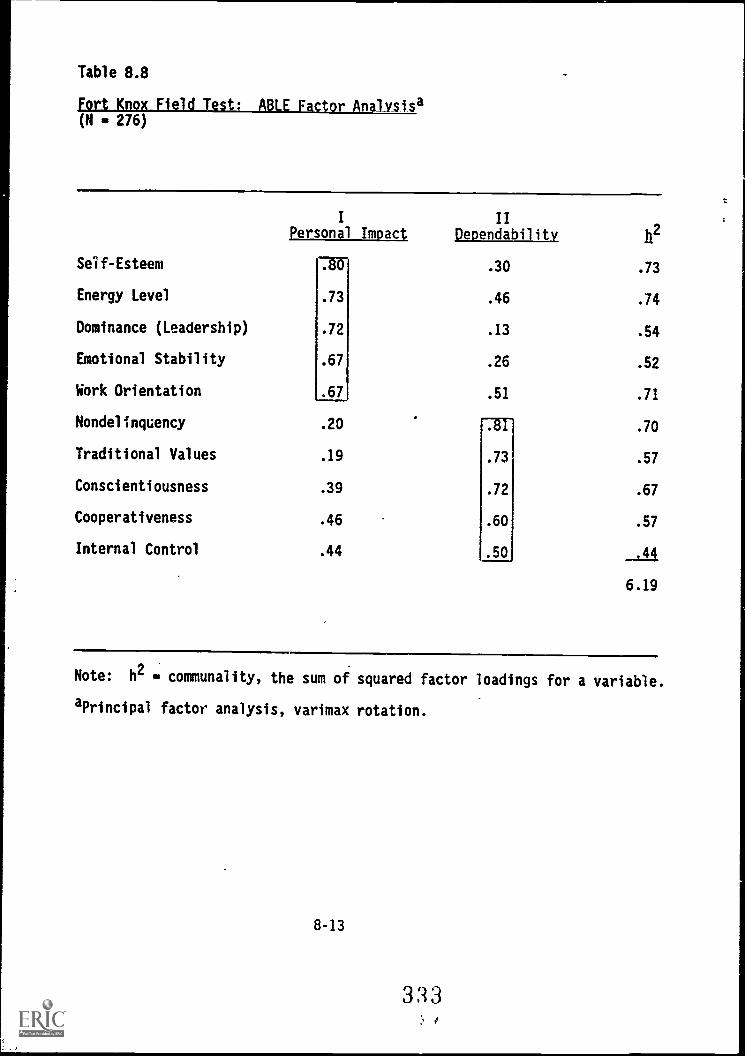
Table 8.8
Fort Knox field Test: ABLE Factor Analvsi_sa(N 276)
I
Personal Impact
Self- Esteem 7T0-
Energy Level .73
Dominance (Leadership) .72
Emotional Stability .67
Work Orientation .67
Nondelinquency .20
Traditional Values .19
Conscientiousness .39
Cooperativeness .46
Internal Control .44
II
Dependability
.30
.46
.13
.26
.51
h2
.73
.74
.54
.52
.71
. 70
. 57
.67
. 57
6.19
Note: h2
communality, the sum of squared factor loadings for a variable.
aPrincipal factor analysis, varimax rotation.
8-13
333
content scales. Note first that the communalities for the scales arefairly high, indicating that the scales do share substantial common vari-ance.
The first factor was labeled Personal Impact since the scales loadingon the factor, in concert, suggest that persons scoring high on the factorwould have high self-esteem, exhibit a high level of energy, could exertleadership, would appear emotionally stable, and would be work oriented.Note that two of the scales loading highest on this factor do have substan-tial loadings on the second factor--Energy Level (.46) and Work Orientation(.51). Also, three of the scales loading highest on the second factor hadsubstantial loadings here-Cooperativeness (.46), Internal Control (.44),and Conscientiousness (.39).
The second factor was named Dependability. Scale loadings for thisfactor suggest that a high scorer on this factor would be a strong ruleabider, a believer in traditional societal values, show conscientiousness,be cooperative, and believe that life's circumstances were largely under anindividual's control. Again, keep in mind the scales that show highloadings on both factors (as noted in the above paragraph).
This two-factor solution seems to us to make good intuitive sense forcharacterizing soldiers as well as possessing a fair amount of practicalappeal. Being able to identify soldiers with high personal impact orleadership potential and a high degree of dependability would seem to be apotentially valuable contribution.
The solution found in these field test data differs from the pilottest solution primarily in the number of factors that characterize the bestsolution. Two factors were viewed as best here, whereas a larger number offactors were viewed as best in those solutions (see Table 7.11). The mostprobable reason for this difference is the difference in the two samples.The field test results are based on a sample roughly two and one-half timesas large and is probably a more representative sample in terms of diversityof MOS as well. Therefore, we think the field test data are "better" datato interpret.
Table 8.9 shows the results for the factor analysis of the AVOICE.The scale communalities for this AVOICE solution are a bit lower than thosefor the ABLE, but still do indicate a substantial amount of common variancefor the set of scales. (Sixty-two percent of the total ABLE scale varianceis in common compared to 54 percent for the AVOICE).
The two factors found here were named Combat Support and Combat-Related. The former is defined largely by scales that have to do with jobsor services that support the actual combat specialties, while the latter isdefined by scales that, for the most part, are much more related to spe-cialties that engage directly in combat.
Also, as found with the ABLE, several scales show substantial loadingson both factors. Most of these occur for scales loading highest on thefirst factor, and include Science/Chemical Operations (.43 on second fac-tor), Electronic Communication (.36), Leadership (.35), and Drafting (.34).Only one scale loading highest on the second factor has a substantialloading on the first factor, Electronics (.45).
8-14
3 efi
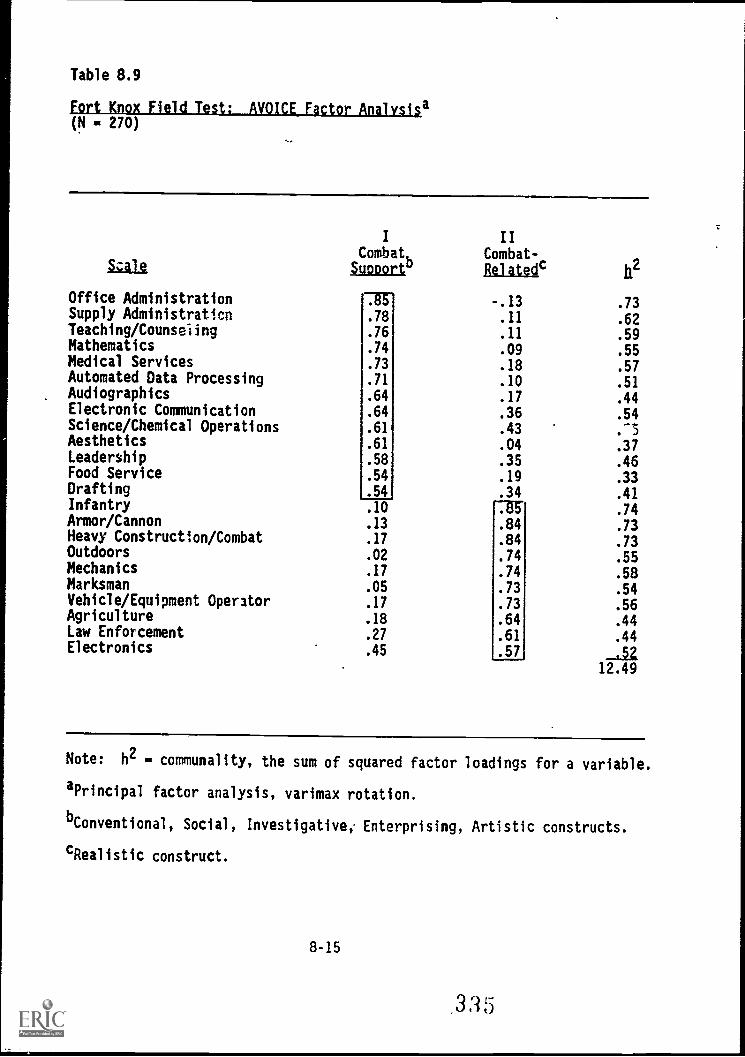
Table 8.9
Fort Knox Field Test: AVOICE Factor Analvsisa(N = 270)
Scale
Office AdministrationSupply AdministrationTeaching/CounselingMathematicsMedical ServicesAutomated Data ProcessingAudiographicsElectronic CommunicationScience/Chemical OperationsAestheticsLeadershipFood ServiceDraftingInfantryArmor/CannonHeavy Construction/CombatOutdoorsMechanicsMarksmanVehicle/Equipment OperatorAgricultureLaw EnforcementElectronics
I
Combat,Sumoortu
.78
.76
.74
.73
.71
.64
.64
.61
.61
.58
.54
.54
.10
. 13
.17
.02
.17
.05
.17
. 18
.27
.45
II
Combat-Relatedc
-.13 .73.11 .62
.11 .59
.09 .55
.18 .57
.10 .51
.17 .44
.36 .54
.43 .-3
.04 .37
.35 .46
.19 .33
.34 .41
.74.84 .73.84 .73.74 .55.74 .58.73 .54.73 .56.64 .44.61 .44.57
12.49
Note: h2 - communality, the sum of squared factor loadings for a variable.
aPrincipal factor analysis, varimax rotation.
bConventional, Social, Investigative; Enterprising, Artistic constructs.
cRealistic construct.
8-15
33!5
The remarks made above about the comparison of ABLE factor analyses of
the pilot and field test data apply equally here. Again, we think the
field test data are probably the better set of results in terms of therepresentativeness of the samples.
Finally, as with the ABLE, we think the two-factor AVOICE solutionmakes goad intuitive sense and has practical appeal. It would seem to be
helpful to be able to characterize applicants as having interests primarilyin the combat MOS or in MOS supporting combat specialties, perhaps even atthe point of recruitment as opposed to the selection or in-processingpoint.
8-16
316
FAKABILITY INVESTIGATIONS
As discussed previously, in addition to the content scales, there werefour response validity scales on the ABLE: Non-Random Response, UnlikelyVirtues (Social Desirability), Poor Impression, and Self-Knowledge. Aninvestigation was undertaken, including an experiment, on intentional dis-tortion (faking) of responses. Data were gathered for this study from (1)soldiers instructed, at different times, to distort their responses and tobe honest (experimental data gathered at Fort Bragg); (2) soldiers who weresimply responding to the ABLE and AVOICE with no particular directions(data gathered at Fort Knox, in another type of "honest" condition); and(3) recently sworn-in Army recruits at the Minneapolis Military EntranceProcessing Station (MEPS).
purposes of the Faking Study
The purposes of the faking study were to determine:
The extent to which soldiers can distort their responses to tem-perament and interest inventories when instructed to do so. (Com-pare data from Fort Bragg faking conditions with Fort Bragg andFort Knox honest conditions.)
The extent to which the ABLE response validity scales detect suchintentional distortion. (Compare response validity scales in FortBragg honest and faking conditions.)
The extent to which ABLE validity scales can be used to correct oradjust scores for intentional distortion.
The extent to which distortion might be a problem in an applicantsettings. (Compare MEPS data with Fort Bragg and Fort Knox data.)
The participants in the experimental group were 425 enlisted soldiersin the 82nd Airborne brigade at Fort Bragg in September 1984. Comparisonsamples were new recruits at a MEPS, in an approximation of an applicantsetting, (N = 126) and Fort Knox soldiers described earlier (N = 276),
Procedure and Design
Four faking conditions were created:
Fake Good on the ABLE
Fake Bad on the ABLE
Fake Combat on the AVOICE
s Fake Noncombat on the AVOICE
Two honest conditions were created:
Honest on the ABLE
Honest on the AVOICE
8-17
3 3 7
The significant parts of the instructions for the six conditions wereas follows:
ABLE - Fake Good
Imagine you are at the Military Entrance Processing Station(MEPS) and you want to join the Army. Describe yourself in a waythat you think will ensure that The Army selects you.
ABLE - Fake Bad
Imagine you are at the Military Entrance Processing Station (MEPS)and you do mt want to join the Army. Describe yourself in a waythat you think will ensure that the Army does not select you.
ABLE - Honest
You are to describe yourself as you really are.
AVOICE - Fake Combat
Imagine you are at the Military Entrance Processing Station (MEPS).Please describe yourself in a way that you think will ensure thatyou are placed in an occupation in which you are likely to beexposed to combat during a wartime situation.
AVOICE - Fake Noncombat
Imagine you are at the Military Entrance Processing Station (MEPS).Please describe yourself in a way you think will ensure that youare placed in an occupation in whia you are unlikely to be exposedto combat during a wartime situation.
AVOICE - Honest
You are to describe yourself as you really are.
The design was repeated measures with faking and honest conditionscounter-balanced. Thus, approximately half the experimental group, 124soldiers, completed the inventories honestly in the morning and faked inthe afternoon, while the other half (121) completed the inventories honestly in the afternoon and faked in the morning.
The experimental design and the numbers of soldiers from whom wegathered the intentional faking data appear in Table 8.10. In summary, a2 x 2 x 2 fixed-factor, completely crossed experimental design was used.The within-subjects factor, called "Fake," consisted of two levels (honestresponses and faked responses). The first between-subjects factor, called"Set," consisted of the following two levels: Fake Good (for the ABLE)/Want Combat (for the AVOICE) and Fake Bad (for the ABLE)/Do Not Want Combat(for the AVOICE). Order was manipulated in the second between-subjectsfactor such that the following two levels were produced: faked responsesbefore honest response's, and honest responses before faked responses.
8-18
33d
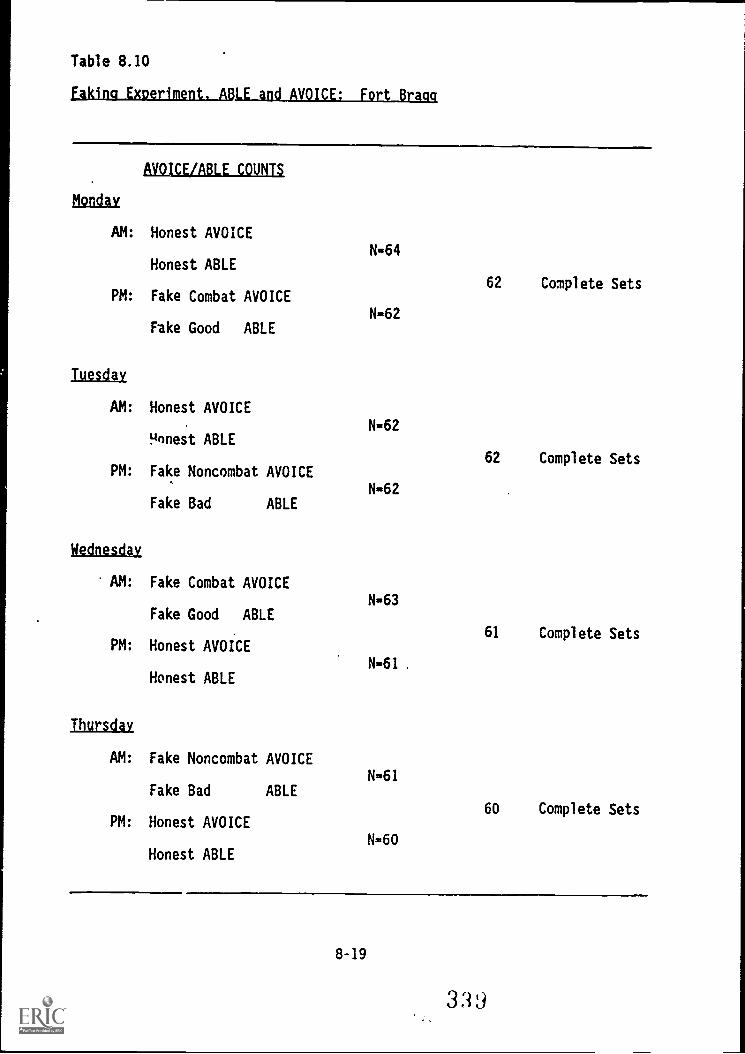
Table 8.10
Faking Experiment. ABLE and AVOICE: Fort Brawl
Monday
AVOICE/ABLE COUNTS
Honest AVOICEAM:
N-64Honest ABLE
62 Complete SetsPM: Fake Combat AVOICE
N.62Fake Good ABLE
Tuesday
Honest AVOICEAM:
N-629onest ABLE
62 Complete SetsPM: Fake Noncombat AVOICE
N.62Fake Bad ABLE
Wednesday
Fake Combat AVOICEAM:
N-63Fake Good ABLE
61 Complete SetsPM: Honest AVOICE
N-61 .
Honest ABLE
Thursday
AM: Fake Noncombat AVOICE
N-61Fake Bad ABLE
60 Complete SetsPM: Honest AVOICE
N-60Honest ABLE
8-19
339
Faking Study Results - Temperament Inventory
We performed a multivariate analysis of variance (MANOVA) on theexperimental data from Fort Bragg. Table 8.11 shows the findings for theinteractions, the sources of variance most relevant to the question ofwhether soldiers can or cannot intentionally distort their responses.
As can be seen, all the Fake x Set interactions are significant,indicating that soldiers can, when instructed to do so, distort theirresponses.
Table 8.11 also shows that, for the Fake x Set x Order interactioneffect, the overall test of significance is statistically significant forthe response validity scales and marginally significant for the contentscales. These results indicate that the order of experimental conditionsin which the participant completed the ABLE affected the results. Table8.12 shows in greater detail the effects of intentional distortion; itshows the mean scores for the various experimental conditions for thecontent scales. This table and the remaining tables showing Fort BraggABLE results report the values for the soldier responses on the firstadministration of the particular condition. For example, the mean value of66.1 for Emotional Stability in the Honest First column of Table 8.12 wascomputed on 120'soldiers who completed the ABLE under the Honest conditionbefore they completed the ABLE under a Fake condition (either Good or Bad).Similarly, the mean value of 70.3 for Emotional Stability in the Fake GoodFirst column of Table 8.12 was computed on 54 soldiers who completed theABLE under the Fake Good condition before they completed the ABLE under theHonest condition.
In general, Table 8.12 shows scores are higher on all the contentscales when subjects are instructed to fake good (about .5 SD on average),and,.to a much greater extent, scores are lower on the content scales whensubjects are instructed to fake bad (about 2 SDs on average).
Another research question was the extent to which our response valid-ity scales detected intentional distortion. As can be seen in Table 8.13,the response validity scale Unlikely Virtues (Social Desirability) detectsFaking Good on the ABLE; the response validity scales Hon-Random Response,Poor Impression, and Self-Knowledge detect Faking Bad. According to thesedata, the soldiers responded more randomly, created a poorer impression,and reported that they knew themselves less well when told to describethemselves in a way that would increase the likelihood that they would notbe accepted into the Army.
We also examined the extent to which we could use the response valid-ity scales Unlikely Virtues (Social Desirability) and Poor Impression toadjust ABLE content scale scores for Faking Good and Faking Bad. We re-gressed out Social Desirability from the content scales in the Fake Goodcondition and Poor Impression from the content scales in the Fake Badcondition. Table 8.14 shows the adjusted mean differences in contentscales after regressing out Social Desirability and Poor Impression. Com-paring these differences, to the unadjusted differences shown in Table 8.12clearly shows that these response :validity scales can be used to adjustcontent scales. However, two important unknowns remain: Do the adjustment
8-20
340
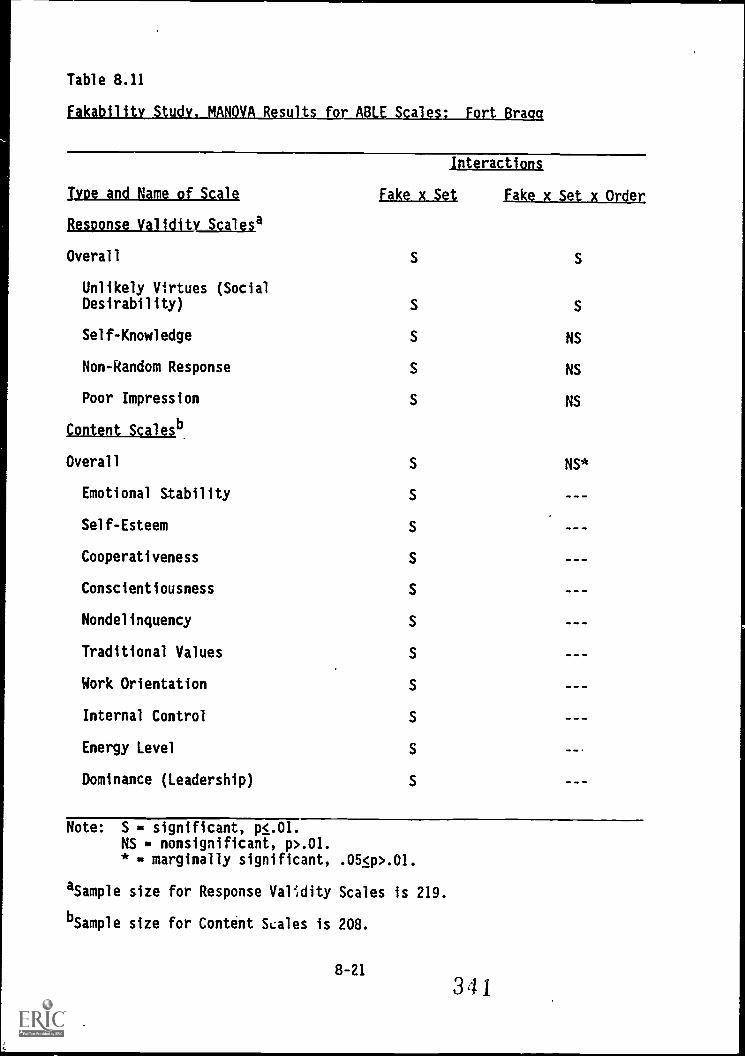
Table 8.11
fakabilitv Study. MANOVA Results for ABLE Scales: Fort Braaq
Interactions
Poe and Name of Scale fake x Set fake x Set x Order
Response Validitv_Scalesa
Overall
Unlikely Virtues (SocialDesirability)
Self-Knowledge S NS
Non-Random Response S NS
Poor Impression S NS
Content Scalesb.
Overall S NS*
Emotional Stability
Self-Esteem S - --
Cooperativeness
Conscientiousness
Nondelinquency
Traditional Values S --
Work Orientation
Internal Control
Energy Level
Dominance (Leadership) _ _ _
Note: S significant, p<.01.NS - nonsignificant, p>.01.* - marginally significant, .05<p>.01.
aSample size for Response Vall,dity Scales is 219.
bSample size for Content Scales is 208.
8-21
341
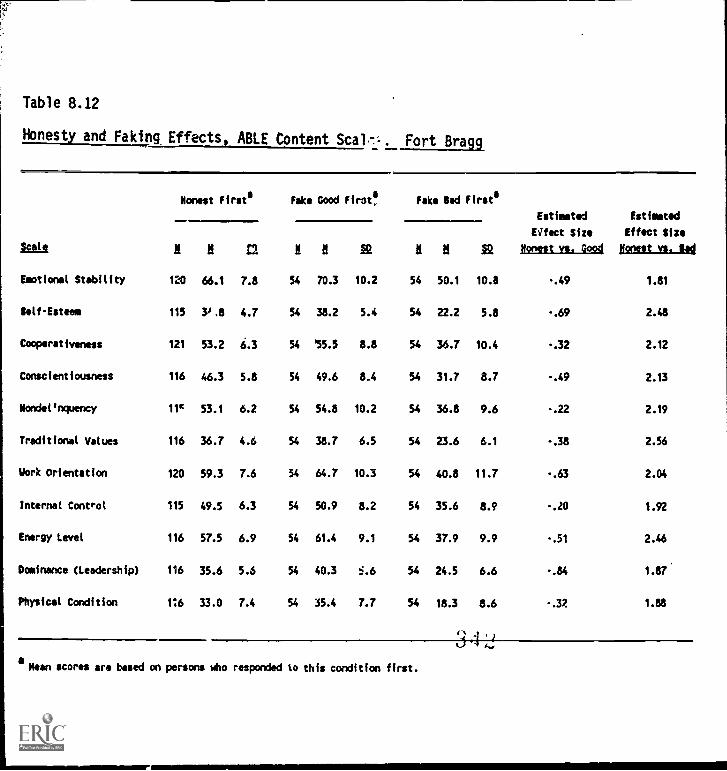
Table 8.12
Honesty and Faking Effects, ABLE Content Fort Bragg
Honest Firsts Fake Good First! Fake Sad firsts
Seale
Estimated
Effect Size
Honest vs. road
Estimated
Effect Size
Honest vs.C2 8 d 2R d IR
Emotional Stability 120 66.1 7.8 54 70.3 10.2 54 50.1 10.8 -.49 1.81
Self-Esteem 115 3'.8 4.7 54 38.2 5.4 54 22.2 5.8 -.69 2.48
Cooperativeness 121 53.2 6.3 54 '55.5 8.8 54 36.7 10.4 -.32 2.12
Conscientiousness 116 46.3 5.8 54 49.6 8.4 54 31.7 8.7 -.49 2.13
Mondelinquency 114 53.1 6.2 54 54.8 10.2 54 36.8 9.6 -.22 2.19
Traditional Values 116 36.7 4.6 54 38.7 6.5 54 23.6 6.1 -.38 2.56
Work Orientation 120 59.3 7.6 54 64.7 10.3 54 40.8 11.7 -.63 2.04
Internal Control 115 49.5 6.3 54 50.9 8.2 54 35.6 8.9 -.20 1.92
Energy Level 116 57.5 6.9 54 61.4 9.1 54 37.9 9.9 -.51 2.46
Dominance (Leadership) 116 35.6 5.6 54 40.3 s.6 54 24.5 6.6 -.84 1.87
Physical Condition 116 33.0 7.4 54 35.4 7.7 54 18.3 8.6 -.32 1.88
aMean scores are based on persons who responded to this condition first.
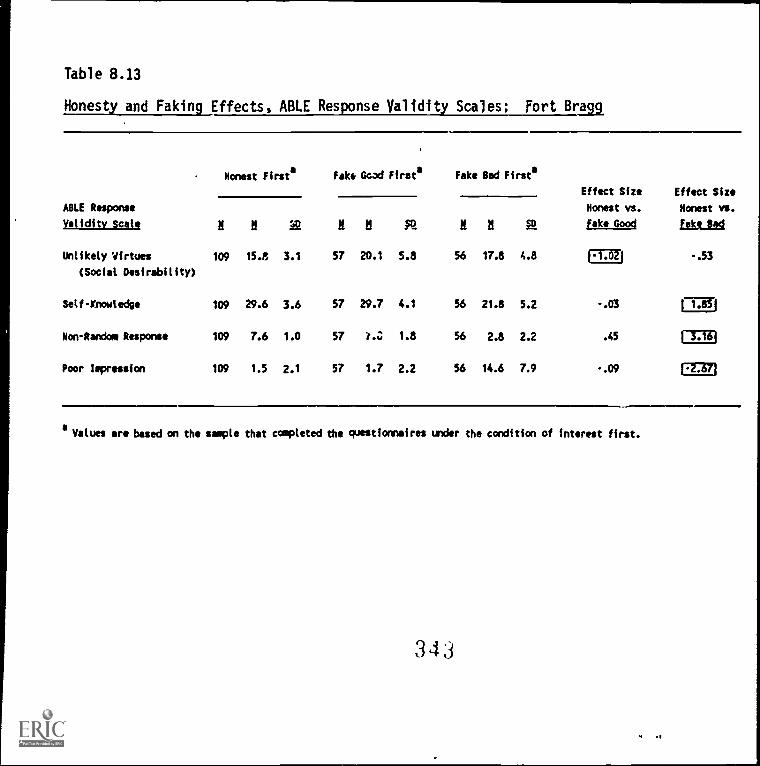
Table 8.13
Honesty and Faking Effects, ABLE Res If nse Yalidit Scales: Fort Bra
ABLE Response
Validity Scale
Honest Firsts
I !I f,D
Unlikely Virtues 109 15.8 3.1
(Social Desirability)
self - Knowledge 109 29.6 3.6
Non-Random Response 109 7.6 1.0
Poor Impression 109 1.5 2.1
Fake Goad Firsts Fake Bad Firsts
Effect Size Effect Size
Honest vs. Honest vs.
N I i2 2 fake Good Fake
57 20.1 5.8 56 17.8 4.8 1-1.021 -.53
57 29.7 4.1 56 21.8 5.2 -.03 1733-1
57 i.0 1.8 56 2.8 2.2 .45 17:131
57 1.7 2.2 56 14.6 7.9 -.09 F27371
Values are based on the sample that completed the questionnaires under the condition of interest first.
343
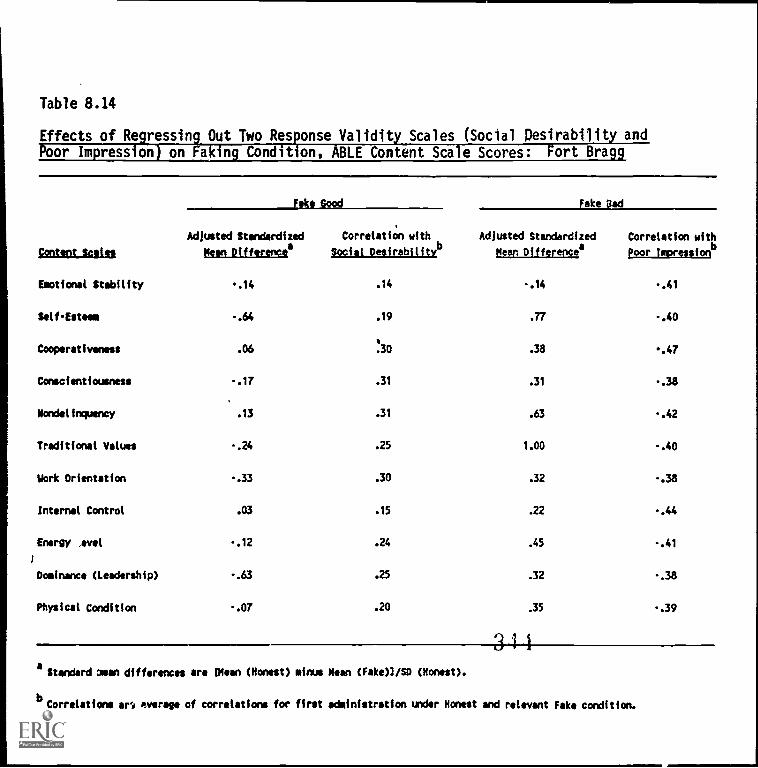
Table 8.14
Effects of Regressing Out Two Response Validity Scales (Social Desirability andPoor Impression) on Eakin Condition, ABLE Content Scale Scores: Fort Bragg
Fake Good Fake Dad
Adjusted Standardized Correlation with Adjusted Standardized Correlation with
Content Scales Peen Differences Social Desirabilityb
Sean Differencesb
poor Impression
Emotional Stability -.14 .14 -.14 -.41
Self-Esteem -.64 .19 .77 -.40
Cooperativeness .06 .30 .38 -.47
Conscientiousness .17 .31 .31 -.38
Nondelinquency .13 .31 .63 -.42
Traditional Values -.24 .25 1.00 -.40
Work Orientation -.33 .30 .32 -.38
Internal Control .03 .15 .22 -.44
Energy .evel -.12 .24 .45 -.41
Dominance (Leadership) -.63 .25 .32 -.38
Physical Condition -.07 .20 .35 -.39
aStandard mean differences are (Mean (Honest) minus Mean (Fake))/SD (Honest).
314
bCorrelations art enrage of correlations for first administration under Honest and relevant Fake condition.
formulas developed on these data cross validate and do they increase cr--terion-related validity?
Overall, the ABLE data frim the Frit Bragg faking study show that:
1. Soldiers can distort their responses when instructed to do so.
2. The response validity scales detect intentional faking; .ulikelyVirtues (Social Desirability) detects Faking Good and Non-Random Response, Poor Impression, and Self-Knowledge detectFaking Bad.
3. An individual's Unlikely Virtues (Social Desirability) scalescore can be used to adjust his or her content scale scores toreduce variance associated with faking good; an individual's PoorImpression scale score can be used to adjust his or her contentscale scores to reduce variance associated with faking bad.
Faking in An Applicant Setting
MEPS "Applicant" Sample. Another of the purposes of the fakabilitystudy was to determine the extent to which intentional distortion actuallyis a problem in an applicant setting. To investigate this question, theABLE and AVOICE were administered at the Minneapolis MEPS. However, thesample -F 126 recruits who completed the inventories were not true "appli-cants," in that they had just recently been sworn into the Army.
MEPS Procedure. To approximate the applicant response set as closelyas was possible with this sample, recruits were allowed to believe thattheir scores on these inventories might affect their Army careers. Thiswas accomplished by deleting all references in the standard Privacy ActStatement (given to all subjects at the beginning of a testing session) tothese data being collected for research purposes only, and not having anyeffect on the participant's career or status in the Army. Recruits werethen asked to complete the ABLE and AVOICE, after which they were de-briefed. In tae debriefing each recruit was asked to read the debriefingform displayed as Figure 8.3, and the administrator orally summarized theinformation on this form and answered any questions the recruit might have.
To examine the extent to which recruits actually believed their ABLEand AVOICE scores would have an effect on their Army career, each recruitfilled out the single-item form shown in Figue 8.4 prior to debriefing.Of the 126 recruits in this sample, 57 responded "yes" to this question, 61said "no," and 8 wrote in that they didn't know. Thus, while the MEPSsample; is not a true "applicant" sample, its make-up (recently sworn-inrecruits, close to half of whom believe their ABLE and AVOICE scores willaffect their Army career) is reasonably close. The response set for thissample is almost certainly more similar to that of the applicant populationthan is the Fort Knox sample.
MEPS Results Compared With Fort Knox and Fort Bragg Data. Table 8.15shows mean scores for MEPS recruits and the two "Henest" conditions of thisstudy at Fort Bragg and Fort Knox. Even though the recruits are probablytrying not to create a poor impression (MEPS Poor Impression mean is 1.05,
8-25
345
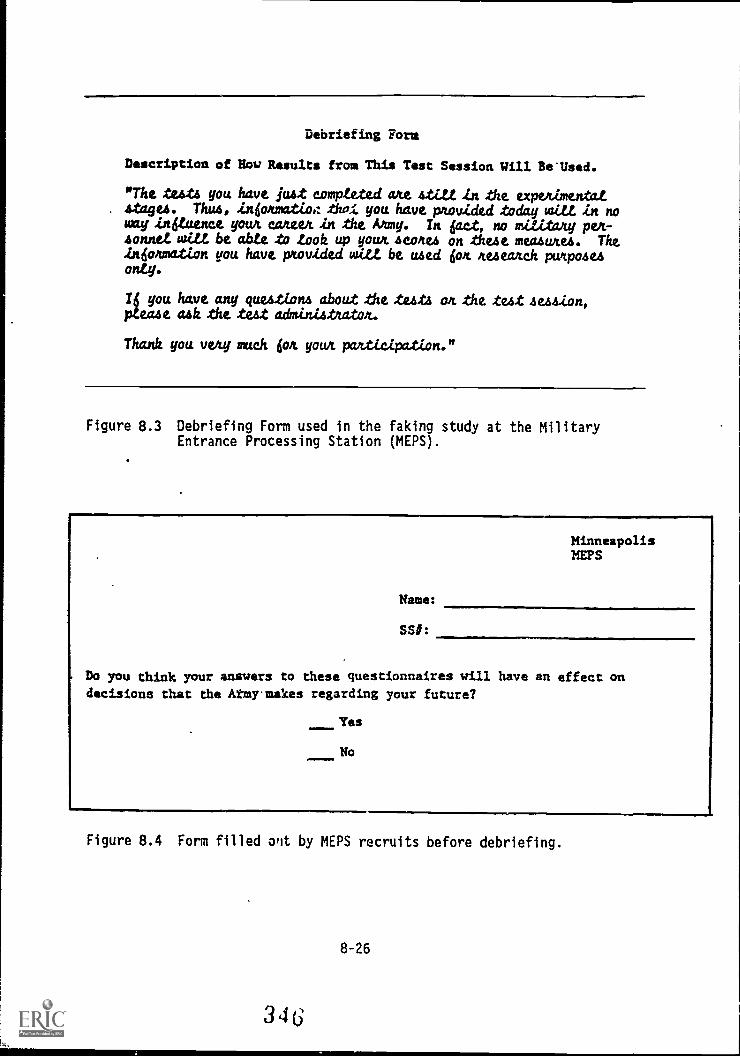
Debriefing Form
Description of How Results from This Test Session Will Be'Used.
The testa you have just ample-Led arm Atilt in the expeximentat4tage4. Thus, 24oamatiog tito,t you have puvided today taitt in noWay inguenee your eaneen Lit the Army. In 6mmt, no mititaky pen.-aonnet wal. be able to took up youn.4e04e4 on these meS4U,O.S. The2n6oxmation you have provided mitt be wed bon Aeaearteh putpo4e4only.
16 you have any queation4 about the testa on the te4t4e4diOn,plea4e ask the teat adrnimia4Aatort-
Thank you yew much 6on your participation."
Figure 8.3 Debriefing Form used in the faking study at the MilitaryEntrance Processing Station (MEPS).
Name:
SSD:
MinneapolisMEPS
Do you think your answers to these questionnaires will have an effect on
decisions that the Atmy makes regarding your future?
Yes
No
Figure 8.4 Form filled wit by MEPS recruits before debriefing.
8-26
3 4 (3
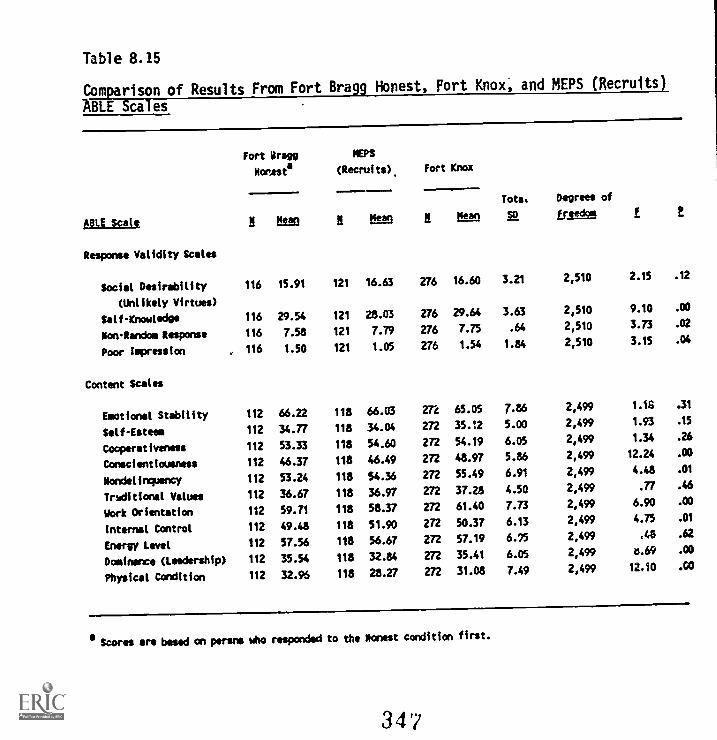
Table 8.15
Comparison of Results From Fort Bragg Honest, Fort Knox, and MEPS (Recruits)
ABLE Scales
Fort Bragg REPS
Monista
(Recruits) Fort Knox
ABLE Scale 1 k +M f tk_V
Tots.
2R
Digress of
flt f E
Response Validity Scales
Social Desirability 116 15.91 121 16.63 276 16.60 3.21 2,510 2.15 .12
(Unlikely Virtues)
Self-Knowledge 116 29.54 121 28.03 276 29.64 3.63 2,510 9.10 .00
NonRandom Response 116 7.58 121 7.79 276 7.75 .64 2,510 3.73 .02
Poor Impression 116 1.50 121 1.05 276 1.54 1.84 2,510 3.15 .04
Content Scales
Emotional Stability 112 66.22 118 66.03 272 65.05 7.86 2,499 1.18 .31
Self-Esteem 112 34.77 118 34.04 272 35.12 5.00 2,499 1.93 .15
Cooperativeness 112 53.33 118 54.60 272 54.19 6.05 2,499 1.34 .26
Conscientiousness 112 46.37 118 46.49 272 48.97 5.86 2,499 12.24 .00
Nondelinquency 112 53.24 118 54.36 272 55.49 6.91 2,499 4.48 .01
Treditional Values 112 36.67 118 36.97 272 37.28 4.50 2,499 .77 .46
Work Orientation 112 59.71 118 58.37 272 61.40 7.73 2,499 6.90 .00
Internal Control 112 49.48 118 51.90 272 50.37 6.13 2,499 4.75 .01
Energy Level 112 57.56 118 56.67 272 57.19 6.25 2,499 .48 .62
Dominance (leadership) 112 35.54 118 32.84 272 35.41 6.05 2,499 6.69 .00
Physical Condition 112 32.95 118 28.27 272 31.08 7.49 2,499 12.10 .00
Scores are based on perms who responded to the Honest condition first.
347
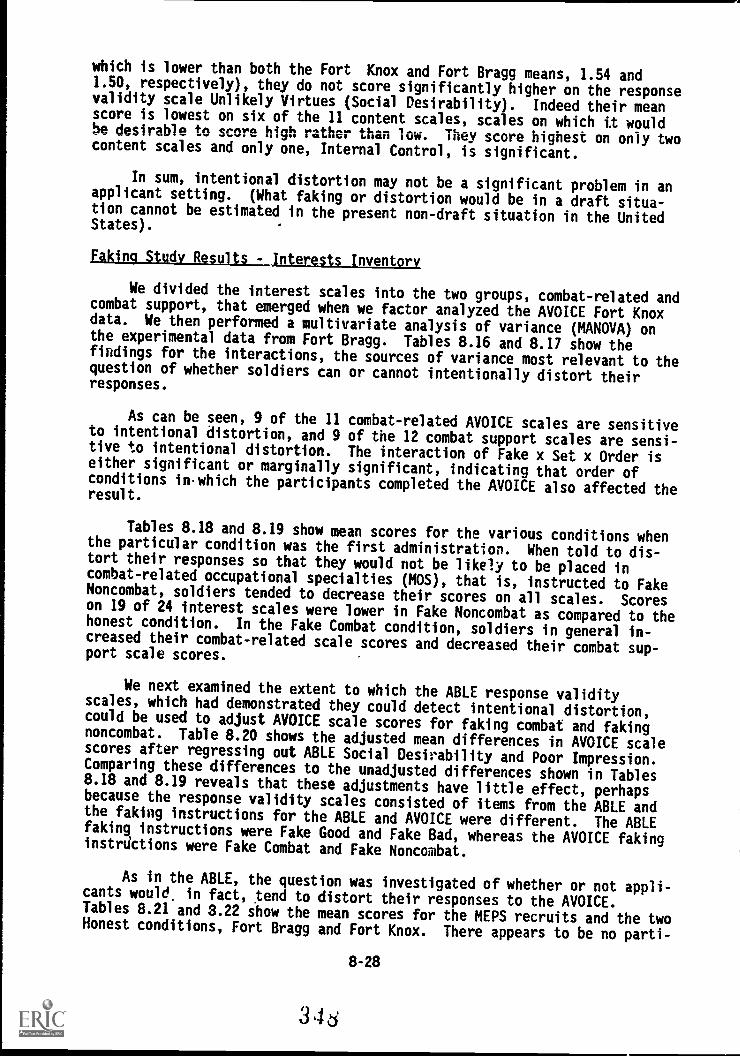
which is lower than both the Fort Knox and Fort Bragg means, 1.54 and1.50, respectively), they do not score significantly higher on the responsevalidity scale Unlikely Virtues (Social Desirability). Indeed their meanscore is lowest on six of the 11 content scales, scales on which it wouldbe desirable to score high rather than low. They score highest on only twocontent scales and only one, Internal Control, is significant.
In sum, intentional distortion may not be a significant problem in anapplicant setting. (What faking or distortion would be in a draft situa-tion cannot be estimated in the present non-draft situation in the UnitedStates).
Faking Study Results - Interests Inventory
We divided the interest scales into the two groups, combat-related andcombat support, that emerged when we factor analyzed the AVOICE Fort Knoxdata. We then performed a multivariate analysis of variance (MANOVA) onthe experimental data from Fort Bragg. Tables 8.16 and 8.17 show thefindings for the interactions, the sources of variance most relevant to thequestion of whether soldiers can or cannot intentionally distort theirresponses.
As can be seen, 9 of the 11 combat-related AVOICE scales are sensitiveto intentional distortion, and 9 of the 12 combat support scales are sensi-tive to intentional distortion. The interaction of Fake x Set x Order iseither significant or marginally significant, indicating that order ofconditions in-which the participants completed the AVOICE also affected theresult.
Tables 8.18 and 8.19 show mean scores for the various conditions whenthe particular condition was the first administration. When told to dis-tort their responses so that they would riot be likely to be placed incombat-related occupational specialties (MOS), that is, instructed to FakeNoncombat, soldiers tended to decrease their scores on all scales. Scoreson 19 of 24 interest scales were lower in Fake Noncombat as compared to thehonest condition. In the Fake Combat condition, soldiers in general in-creased their combat-related scale scores and decreased their combat sup-port scale scores.
We next examined the extent to which the ABLE response validityscales, which had demonstrated they could detect intentional distortion,could be used to adjust AVOICE scale scores for faking combat and fakingnoncombat. Table 8.20 shows the adjusted mean differences in AVOICE scalescores after regressing out ABLE Social Desirability and Poor Impression.Comparing these differences to the unadjusted differences shown in Tables8.18 and 8.19 reveals that these adjustments have little effect, perhapsbecause the response validity scales consisted of items from the ABLE andthe faking instructions for the ABLE and AVOICE were different. The ABLEfaking instructions were Fake Good and Fake Bad, whereas the AVOICE fakinginstructions were Fake Combat and Fake Noncombat.
As in the ABLE, the question was investigated of whether or not appli-cants would. in fact, tend to distort their responses to the AVOICE.Tables 8.21 and 3.22 show the mean scores for the MEPS recruits and the twoHonest conditions, Fort Bragg and Fort Knox. There appears to be no parti-
8-28
34 d
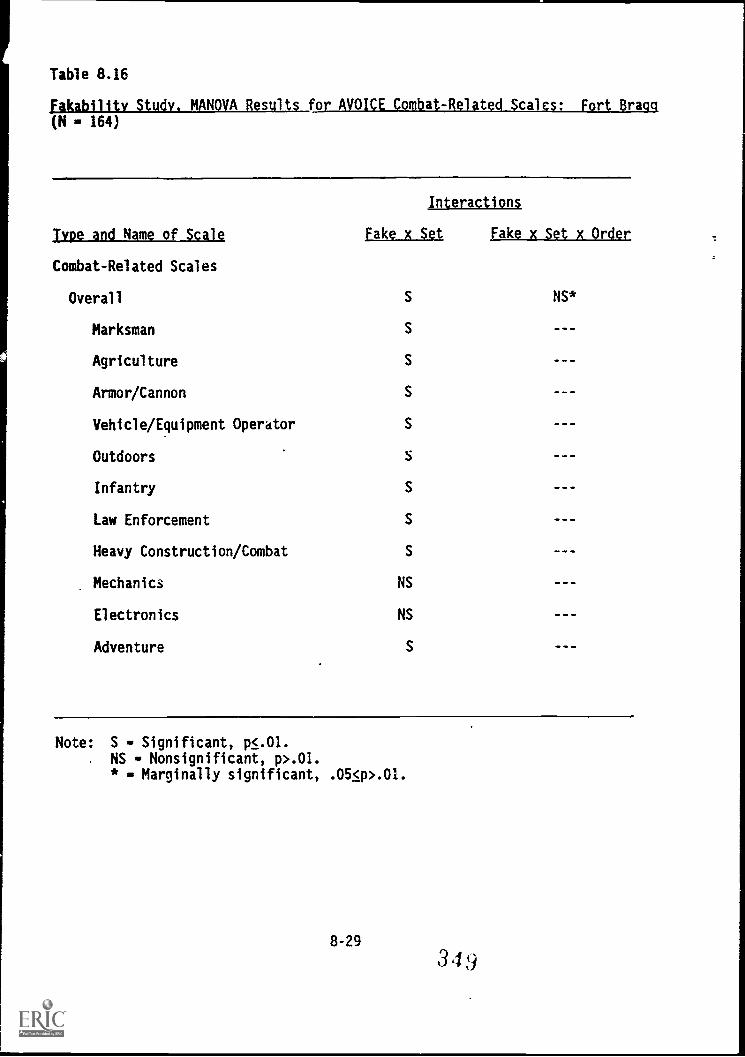
Table 8.16
fakabilitv Study. MANOVA Results for AYOICE Combat-Related Scales: Fort Bragg(N .. 164)
Interactions
Type and Name of Scale fake x Set Fake x Set x Order
Combat-Related Scales
Overall S NS*
Marksman S
Agriculture S
Armor/Cannon S
Vehicle/Equipment Operator S
Outdoors S
Infantry S
Law Enforcement S
Heavy Construction/Combat S
Mechanics NS
Electronics NS
Adventure S _ _ _
Note: S - Significant, p<.01.NS - Nonsignificant, p>.01.* - Marginally significant, .05.q>.01.
8-29
349
Table 8.17
Fakabilitv Studv, MANOVA Results for AVOICE Combat Support Scalesi_ Fort Bragg(N 201)
Interactions
Tvbe and Name of Scale fake x Set fikeLigtEArAgt
Combat Support Scales
Overall
Mathematics S NS
Aesthetics
Leadership
Electronic Communication
Automated Data Processing
Teaching/Counseling NS NS
Drafting NS NS
Audiographics NS NS
Science/Chemical Operations S NS
Supply Administration S NS
Office Administration S NS
Medical Services NS* NS
Food Service S NS*
Note: S Significant, p<.01.NS Nonsignificant, p>.01.* - Marginally significant, .05<i).01.
8-30
33u
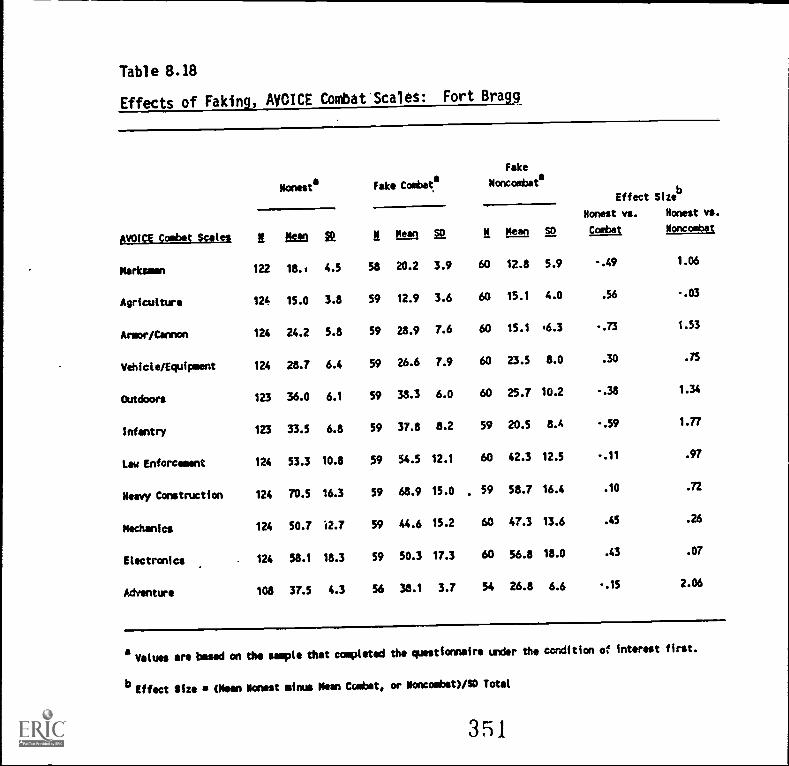
Table 8.18
Effects of Faking, AYOICE Combat Scales: Fort Bragg
AVOICE Combat Sole*
Sanesta
Fake Combats
Fake
Ncocosbata
Effect Sizeb
Honest vs. Honest vs.
combat YoncombetI 'kin a esm Esma
Marksmen 122 18.1 4.5 58 20.2 3.9 60 12.8 5.9 -.49 1.06
Agriculture 124 15.0 3.8 59 92.9 3.6 60 15.1 4.0 .56 -.03
Armor/Cannon 124 24.2 5.8 59 28.9 7.6 60 15.1 s6.3 -.73 1.53
Vehicle/Equipment 124 28.7 6.4 59 26.6 7.9 60 23.5 8.0 .30 .75
Outdoors 123 36.0 6.1 59 38.3 6.0 60 25.7 10.2 -.38 1.34
Infantry 123 33.5 6.8 59 37.8 8.2 59 20.5 8.4 -.59 1.77
Law Enforcement 124 53.3 10.8 59 54.5 12.1 60 42.3 12.5 -.11 .97
Heavy Construction 124 70.5 16.3 59 68.9 15.0 . 59 58.7 16.4 .10 .72
Mechanics 124 50.7 i2.7 59 44.6 15.2 60 47.3 13.6 .45 .26
Electronics . 124 58.1 18.3 59 50.3 17.3 60 56.8 18.0 .43 .07
Adventure 108 37.5 4.3 56 38.1 3.7 54 26.8 6.6 -.15 2.06
o Values are based on the sample that completedthe questionnaire under the condition of interest first.
b Effect Size s Mean Honest minus Mean Combat, or Noncombat) /S0 Total
351
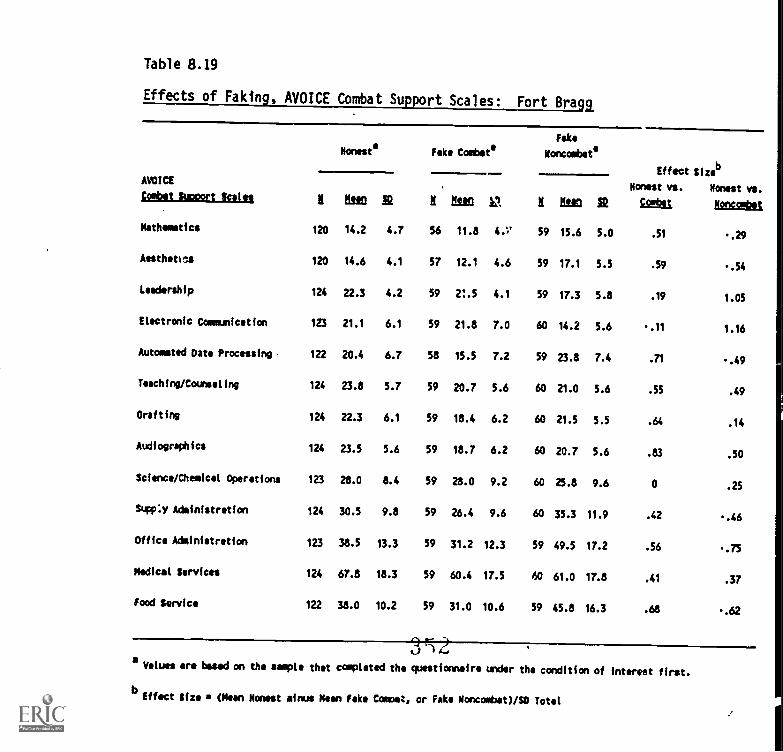
Table 8.19
Effects of Faking, AVOICE Combat Support Scales: Fort Braga
AVOICE
Pabst Succart toilet
Honest Fake Combat.
Fake
Noncombat.
Effect Sizeb
Honest vs. Honest vs.
gAzit ItmetaII Leo a 1 Ina M 1 Om 2Mathematics 120 14.2 4.7 56 11.8 4.v 59 15.6 5.0 .51 -.29
AssthetIcs 120 14.6 4.1 57 12.1 4.6 59 17.1 5.5 .59 -.54
Leadership 124 22.3 4.2 59 21.5 4.1 59 17.3 5.8 .19 1.05
Electronic Communication 123 21.1 6.1 59 21.8 7.0 60 14.2 5.6 -.11 1.16
Automated Oats Processing. 122 20.4 6.7 58 15.5 7.2 59 23.8 7.4 .71 -.49
Teaching/Counseling 124 23.8 5.7 59 20.7 5.6 60 21.0 5.6 .55 .49
Crafting 124 22.3 6.1 59 18.4 6.2 60 21.5 5.5 .64 .14
Audiogrephics 124 23.5 5.6 59 18.7 6.2 60 20.7 5.6 .83 .50
Science/Chemical Operations 123 28.0 8.4 59 28.0 9.2 60 25.8 9.6 0 .25
&cr.), Administration 124 30.5 9.8 59 26.4 9.6 60 35.3 11.9 .42 -.46
Office Administration 123 38.5 13.3 59 31.2 12.3 59 49.5 17.2 .56 -.75
Medical Services 124 67.8 18.3 59 60.4 17.5 60 61.0 17.8 .41 .37
Food Service 122 38.0 10.2 59 31.0 10.6 59 45.8 16.3 .68 -.62
0 A,aValues are bated on the sample that completed the questionnaire under the condition of interest first.
bEffect Size Man Monett minus Mean Fake Comps:, or Fake Noncombat) /SO Total
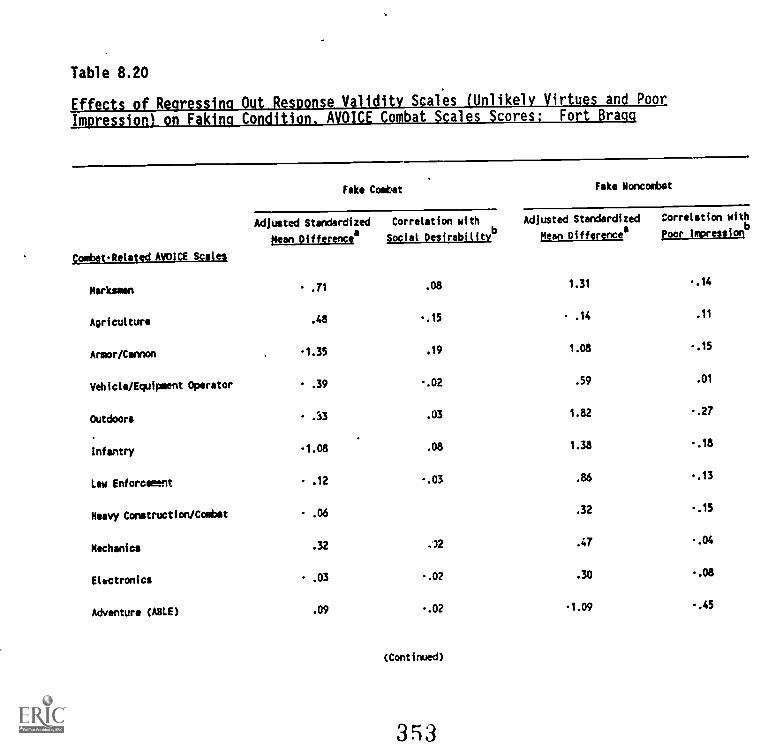
Table 8.20
Effects of Regressing Out Response Validity Scales (Unlikely Virtues and Poor
Impression' on Faking Condition. AVOICE Combat Scales Scores: Fort Bragg
Fake Combat Fake Noncombat
Combat-Related AVO10E Scales
Adjusted Standardized
Mean Differencea
Correlation with
Social Desirabititvb
Adjusted Standardized
Mean Difference'
Correlation with
poor learessionb
Marksmen - .71 .08 1.31 -.14
Agriculture .48 -.15 - .14 .11
Armor/Cannon -1.35 .19 1.08 -.15
Vehicle/Equipment Operator - .39 -.02 .59 .01
Outdoors .53 .03 1.82 -.27
Infantry -1.08 .08 1.38 .18
Law Enforceftrtt - .12 -.03 .86 -.13
Heavy Construction/Combat - .06 .32 -.15
Mechanics .32 .)2 .47 -.04
Electronics - .03 -.02 .30 -AZ
Adventure (ABLE) .09 -.02 -1.09 -.45
(Continued)
353
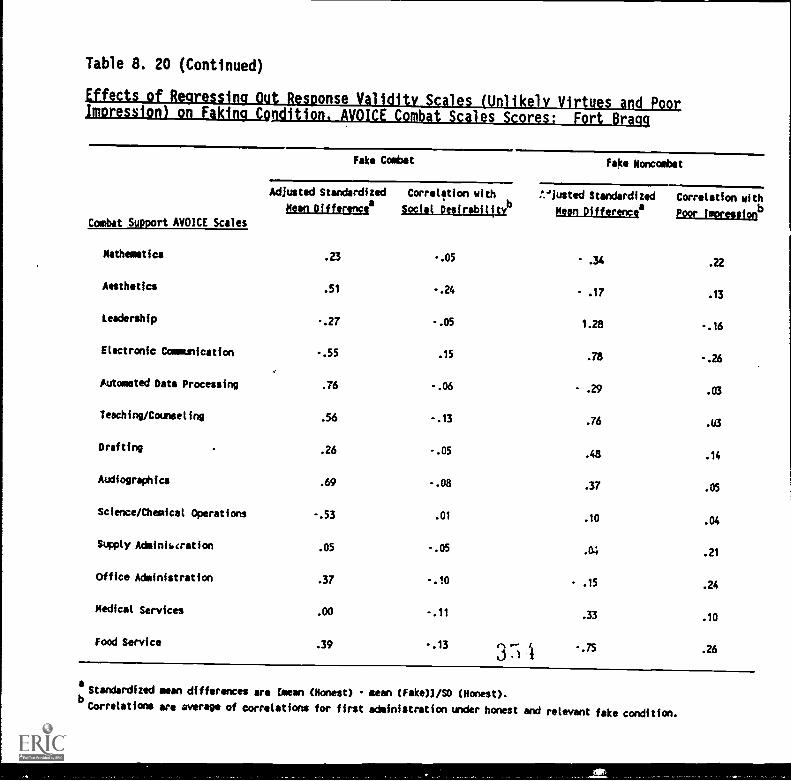
Table 8. 20 (Continued)
Effects of Regressing Out Response Validity Scales (Unlikely Virtues and PoorImpression) on Faking Condition. AVOICE Combat Scales Scores: Fort Bragg
Fake Combat Fake Noncombat
Adjusted Standardized Correlation with
Mean Differences Social Desirability')
Combat Support AVOICE Scales
Mathematics .23 -.05
Aesthetics .51 -.24
Leadership -.27 -.05
Electronic Communication -.55 .15
Automated Data Processing .76 -.06
Teaching/Counseling .56 -.13
Drafting .26 -.05
Audiographics .69 -.08
Science/Chemical Operations -.53 .01
Supply Administration .05 -.05
Office Administration .37 -.10
Medical Services .00 -.11
Food Service .39 -.133
!.Jjusted Standardized
Mean Differences
Correlation with
poor imoressiob
- .34 .22
.17 .13
1.28 -.16
.78 -.26
- .29 .03
.76 .U3
.48 .14
.37 .05
.10 .04
.04 .21
- .15 .24
.33 .10
-35.26
aStandardized mean differences are paean (Honest) - mean (Fake)3 /S0 (Honest).
bCorrelations are oven*, of correlations for first administration under honest and relevant fake condition.
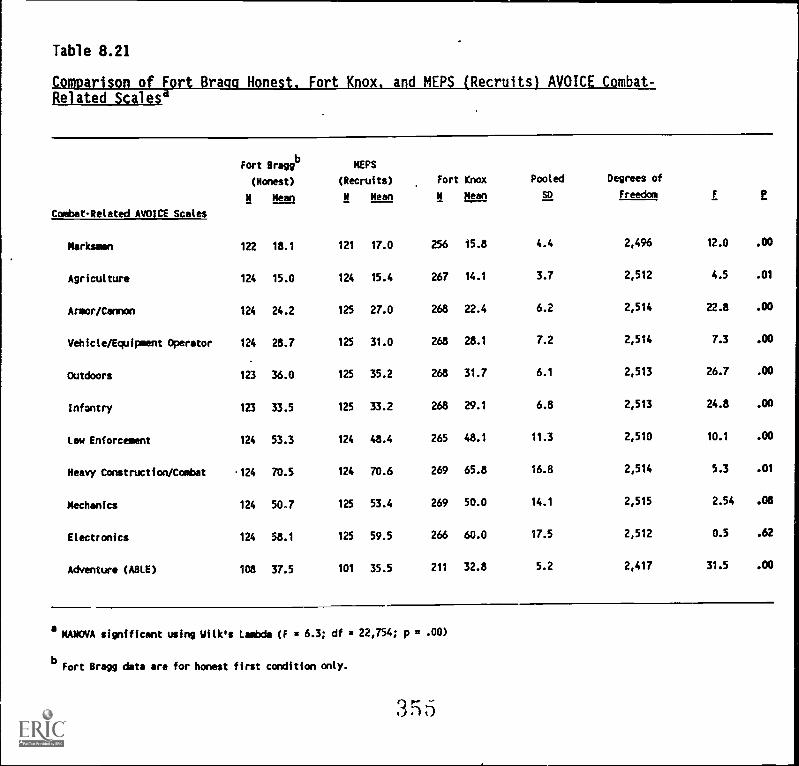
Table 8.21
Comparison of fort Bragg Honest. Fort Knox. and MEPS (Recruits) AVOICE Combat -Related Scales
Combat-Retated AVOICE Scatek
Fort Braggb
(Honest)
# M110
MEPS
(Recruits)
N Mean
Fort
#
Knox
Mcan
Pooled
SD
Degrees of
Freedom F f
Marksmen 122 18.1 121 17.0 256 15.8 4.4 2,496 12.0 .00
Agriculture 124 15.0 124 15.4 267 14.1 3.7 2,512 4.5 .01
Armor/Cannon 124 24.2 125 27.0 268 22.4 6.2 2,514 22.8 .00
Vehicte/Equipment Operator 124 28.7 125 31.0 268 28.1 7.2 2,514 7.3 .00
Outdoors 123 36.0 125 35.2 268 31.7 6.1 2,513 26.7 .00
Infantry 123 33.5 125 33.2 268 29.1 6.8 2,513 24.8 .00
Law Enforcement 124 53.3 124 48.4 265 48.1 11.3 2,510 10.1 .00
Heavy Construction/Combat 124 70.5 124 70.6 269 65.8 16.8 2,514 5.3 .01
Mechanics 124 50.7 125 53.4 269 50.0 14.1 2,515 2.54 .08
Electronics 124 58.1 125 59.5 266 60.0 17.5 2,512 0.5 .62
Adventure (ABLE) 108 37.5 101 35.5 211 32.8 5.2 2,417 31.5 .00
aMAMOVA significant using Vitk's lambda (F = 6.3; df = 22,754; p a .00)
bFort Bragg data are for honest first condition only.
355
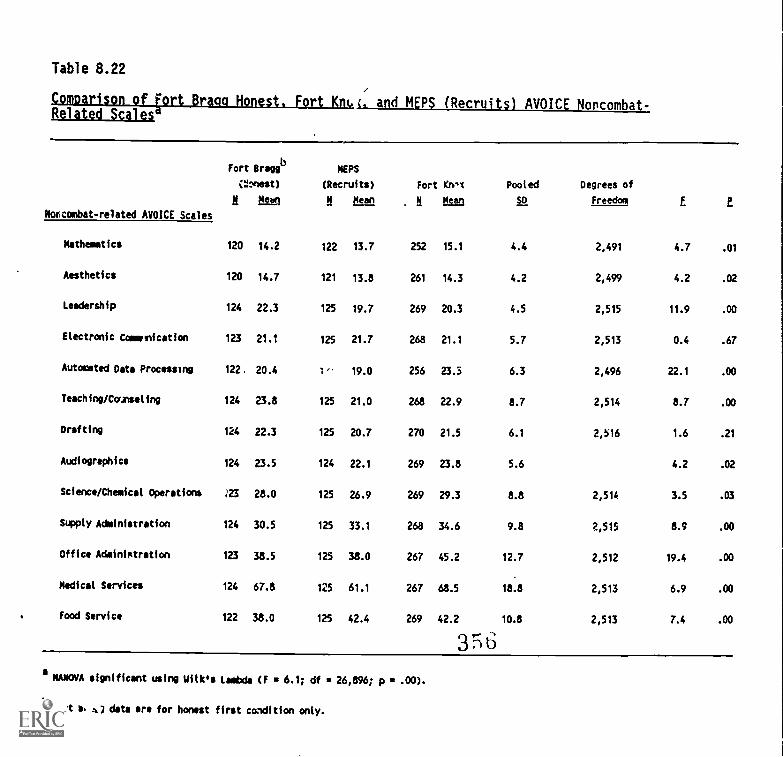
.
Table 8.22
Comparison of Eort Bragg Honest. Fort Kftc. and MEPS (Recruits) AVOICE Noncombat-Related Scales'
Nocombat-related AVOICE Scales
Fort Braggb
(2mest)
N Mtto
MEPS
(Recruits)
N Ecan
Mathematics 120 14.2 122 13.7
Aesthetics 120 14.7 121 13.8
Leadership 124 22.3 125 19.7
Electronic Commication 123 21.1 125 21.7
Automated Data Processing 122. 20.4 1- 19.0
Teaching/Counseling 124 23.8 125 21.0
Drafting 124 22.3 125 20.7
Audiographics 124 23.5 124 22.1
Science/Chemical Operation* 223 28.0 125 26.9
Supply Administration 124 30.5 125 33.1
Office Administration 123 38.5 125 38.0
Medical Services 124 67.8 125 61.1
food Service 122 38.0 125 42.4
Fort Krinx Pooled Degrees of
. N BM SD Freedom f E
252 15.1
261 14.3
269 20.3
268 21.1
256 23.3
268 22.9
270 21.5
269 23.8
269 29.3
268 34.6
267 45.2
267 68.5
269 42.2
4.4 2,491 4.7 .01
4.2 2,499 4.2 .02
4.5 2,515 11.9 .00
5.7 2,513 0.4 .67
6.3 2,496 22.1 .00
8.7 2,514 8.7 .00
6.1 2,516 1.6 .21
5.6 4.2 .02
8.8 2,514 3.5 .03
9.8 2,515 8.9 .00
12.7 2,512 19.4 .00
18.8 2,513 6.9 .00
10.8 2,513 7.4 .00
aNAMOVA significant using Wilicos lambda (F 6.1; df 26,896; p .00).
bFort II, 2 data are for honest first condition only.
cCar pattern to the mean score differences. The applicants score lowest,highest, and in the middle about an equal number of times.
Overall, the AVOICE data from the faking study show that:
1. Soldiers can distort their responses when instructed to do so.
2. The ABLE Social Desirability and Poor Impression scales are notas effective for adjusting AVOICE scale scores in the fakingconditions of Combat/Noncombat as they are for adjusting ABLEcontent scale scores in the Faking Good/Faking Bad conditions.
3. Faking or distortion may not be a significant problem in anapplicant setting.
8-37
3 57
CONCLUDING COMMENTS
The field tests of the non-cognitive measures indicate they are goodmeasures of the intended constructs and that they are likely to contributeunique, reliable variance to the predictor domain. Score distributions andreliabilities show the measures to be sound psychometrically. The unique-ness analyses showed that the ABLE and AVOICE scales are measuring indi-vidual differences largely independent from those measured via the ASVAB orother parts of the Pilot Trial Battery. Factor analyses of ABLE and AVOICEscales showed a relatively simple or.derlying structure that makes intuitivesense. Investigations of faking and fakability indicate scores can be in-tentionally distorted when persons are instructed to do so, kg distortiondoes not appear to occur in the present applicant setting, lnd the responsevalidity scales on the ABLE can probably be used to correct for distortionwhen it does occur. However, more research is needed on the methods ofapplying such corrections and the effects of such corrections on the va-lidity of the non-cognitive scales for predicting job performance or otherimportant criteria.
8-38
3 5d
Chapter 8 Reference
Hough, L. M., Barge, B. N., Houston, J. S., McGue, M. K., & Kamp, J. D.(1985). Problems, issues and results in the development oftemperament, biographical, and interest measures. Paper presented atthe 93rd Annual Convention of the American Psychological Association,Los Angeles.
CHAPTER 9
FORMULATION OF THE TRIAL BATTERY
Norman G. Peterson, Jeffrey J. McHenry, Marvin D. Dunnette,Jody L. Toquam, Leaetta M. Hough, Bruce N. Barge, Rodney L. Rosse,
Janis S. Houston, and VyVy A. Corpe
The way in which the Pilot Trial Battery was revised to produce theTrial Battery is described in this chapter. The previous chapters havepresented and discussed the development, pilot tests, and field tests ofthe Pilot Trial Battery. They show, we think, that the Pilot Trial Batterymeasures, as a whole, are psychometrically sound, measure relatively uniqueconstructs, and appear to hold considerable promise as predictors of var-ious important criteria of job performance for Army soldiers. The natureof the revisions described here focused on satisfying the pragmatic cri-teria of limited testing time available for future Project A research, aswell as improving the measures in the Pilot Trial Battery.
9-1 3G
REVISIONS TO THE PILOT TRIAL BATTERY
The full Pilot Trial Battery, as administered at the field tests,required approximately 6.5 hours of actual administration time. However,
the Trial Battery developed from the Pilot Trial Battery (see Figure 1.2)had to be administered in about 4 hours during the next phase of theproject (Concurrent Validation). Therefore, not only did the measures inthe Pilot Trial Battery need revision on the basis of field test experi-ence, but the total length of the battery had to be reduced by 33 percent.
We devised three general principles, which we called a strateg", to beused as a guide in making the revision and reduction decisions. Theseprinciples were consonant with the theoretical and practical orientationthat had been used since the inception of the project, as described inChapter 1. The principles were:
Maximize the heterogeneity of the battery by retaining measures ofas many different constructs as possible.
Maximize the chances of incremental validity and classificationefficiency as much as possible.
Retain measures with adequate reliability.
Five more concrete implications or guidelines for adopting this stra-tegy were developed. These are shown in Figure 9.1. With these guidelinesin mind, Task 2 staff prepared summaries and presentations of the informa-tion described in Chapters 2 through 8.
In March 1985, these presentations were made at an In Progress Review
(IPR) meeting held to consider the field test data and other relevantinformation, and decide on the methods and nature of revising the Pilot
Trial Battery. Generally speaking, the presentations were within the three
domains--cognitive (paper and pencil), perceptual/psychomotor (computer-
administered), and non-cognitive-- that had been used throughout the
research (point 1 in Figure 9.1). The psychometric characteristics of each
measure within a domain were reported, followed by a presentation of the
covariance (correlations and factor structure) of the measures within the
domain, across the domains, and with the ASVAB (uniqueness analyses).
Then, estimates of expected validities for training and job performancecriteria (based on the expert judgments, literature review, and Preliminary
Battery analyses) were presented. Finally, initial recommendations for
reduction and revisions were made.
Considerable discussion was generated by these presentations, but theIPR group reached a consensus on the reductions and revisions to be made to
the Pilot Trial Battery. This set of recommendations was the presented toand discussed at the meeting of the full Scientific Advisory Group. A few
changes were made at this meeting.
9-2
:3t) ')
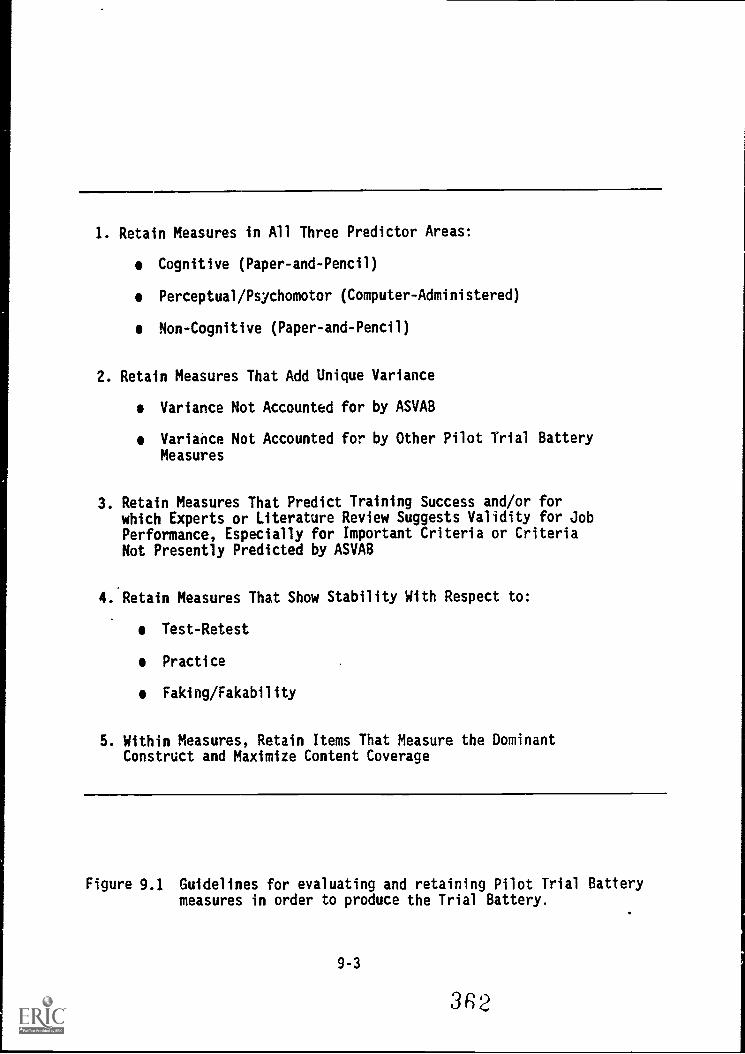
1. Retain Measures in All Three Predictor Areas:
Cognitive (Paper-and-Pencil)
Perceptual/Psychomotor (Computer-Administered)
Non-Cognitive (Paper-and-Pencil)
2. Retain Measures That Add Unique Variance
Variance Not Accounted for by ASVAB
Variahce Not Accounted for by Other Pilot Trial BatteryMeasures
3. Retain Measures That Predict Training Success and/or forwhich Experts or Literature Review Suggests Validity for JobPerformance, Especially for Important Criteria or CriteriaNot Presently Predicted by ASVAB
4. Retain Measures That Show Stability With Respect to:
Test-Retest
Practice
Faking/Fakability
5. Within Measures, Retain Items That Measure the DominantConstruct and Maximize Content Coverage
Figure 9.1 Guidelines for evaluating and retaining Pilot Trial Batterymeasures in order to produce the Trial Battery.
9-3
362
Tables 9.1, 9.2, and 9.3 summarize the change recommendations thatcame from these meetings. These recommendations were used to guide thedevelopment of the Trial Battery from the Pilot Trial Battery. In thefollowing sections, we describe these changes and their rationales, plusany internal improvements made to each measure.
Changes to Cognitive Paper-and-Pencil Tests,
Analyses of pilot and field tests of the cognitive paper-and-penciltests showed that the tests, as a group, measure various aspects of spatialability. When factor-analyzed with ASVAB subtests and the computer-administered tests from the Pilot Trial Battery, they formed a singlefactor of their own (see Table 6.10). Factor analysis of the tests bythemselves, however, tends to show four or five factors (see Table 3.13).These results are not surprising, but we point them out to illustrate thepoint that the identification of the number and type of constructs measuredby a set of tests depends very much on the level of analysis a researcherchooses. For purposes defined here, that is, reducing the number of teststo carry forward from the Pilot Trial Battery to the Trial Battery, wefocused on a more specific level (four-five factors), but kept in mind thatall the tests measure an underlying, more global spatial ability. Changesto the cognitive tests for use in the Trial Battery are described in thecontext of the constructs the tests were designed to measure: SpatialVisualization-Rotation and Field Independence, Spatial Visualization-Scanning, Figural Reasoning/Induction, and Spatial Orientation.
In the Pilot Trial Battery, the Spatial Visualization--Rotation andField Independence construct was measured by three tests: AssemblingObjects, Object Rotation, and Shapes. Although Shapes was originallydesigned to measure Field Independence, and pilot test results indicated itcorrelated .50 with a marker test of that ability, we considered testin concert with the two Rotation tests for purposes of reducing the size ofthe Pilot Trial Battery. This combination seemed justified because thethree tests had a similar pattern of factor loadings (see Table 3.13).The Shapes Test was dropped because the evidence of validity for job per-formance for tests of this type was judged to be less impressive than forthe other two tests. The Object Rotation Test was not changed. Eightitems were dropped from the Assembling Objects Test by eliminating thoseitems that were very difficult or very easy, or had low item-total correla-tions. The time limit for Assembling Objects was not changed. The effectwas to make Assembling Objects more a power test than it was prior to thechanges.
The Spatial Visualization-Scanning construct was measured by twoPilot Trial Battery tests, Mazes and Path. The Path Test was dropped andthe Mazes Test was retained with no changes. Mazes showed higher test-retest reliabilities than Path (.71 vs .64) and gain scores (.24 SDunits for Mazes vs .62 SD units for Path), which was desirable. In addi-tion, Mazes was a shorter test than Path (5.5 minutes vs 8 minutes).
The Figural Reasoning/Induction construct was measured by the Rea-soning 1 and Reasoning 2 tests. Reasoning 1 was evaluated as the better ofthe two tests because it had higher reliabilities for both internal consis-
9-4
3
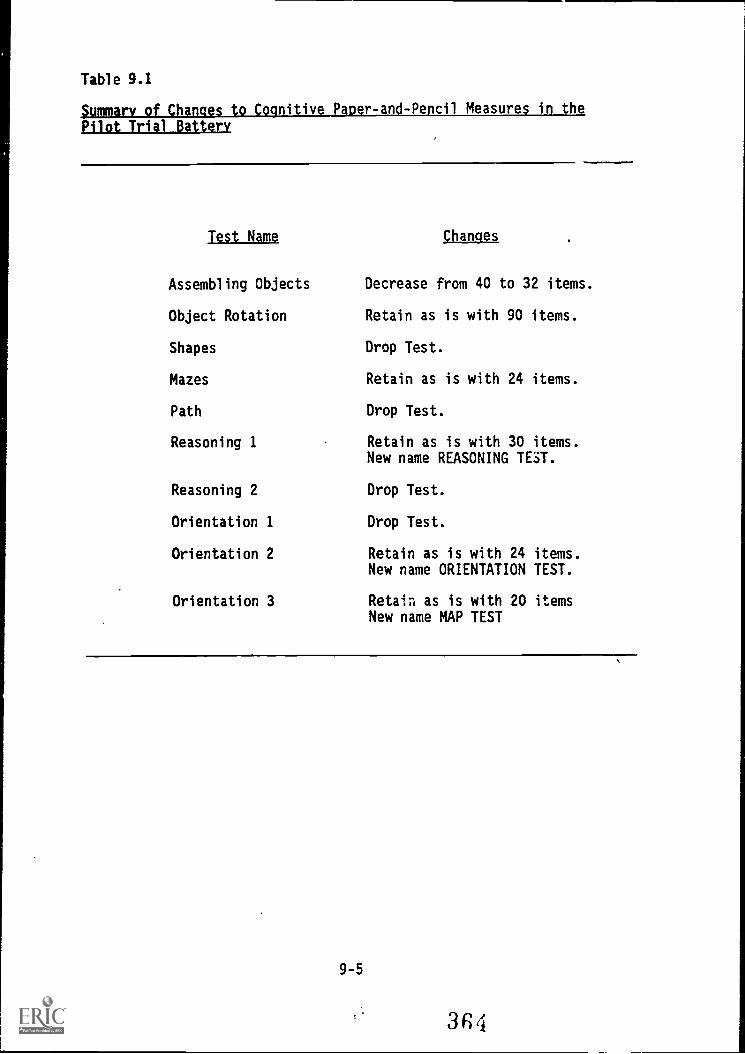
Table 9.1
Summary of Changes to Cognitive Paper-and-Pencil Measures in thePilot Trial Battery
Test Name
Assembling Objects
Object Rotation
Shapes
Mazes
Path
Reasoning 1
Reasoning 2
Orientation 1
Orientation 2
Orientation 3
Changes
Decrease from 40 to 32 items.
Retain as is with 90 items.
Drop Test.
Retain as is with 24 items.
Drop Test.
Retain as is with 30 items.New name REASONING TEST.
Drop Test.
Drop Test.
Retain as is with 24 items.New name ORIENTATION TEST.
Retain as is with 20 itemsNew name MAP TEST
9-5
3R 4
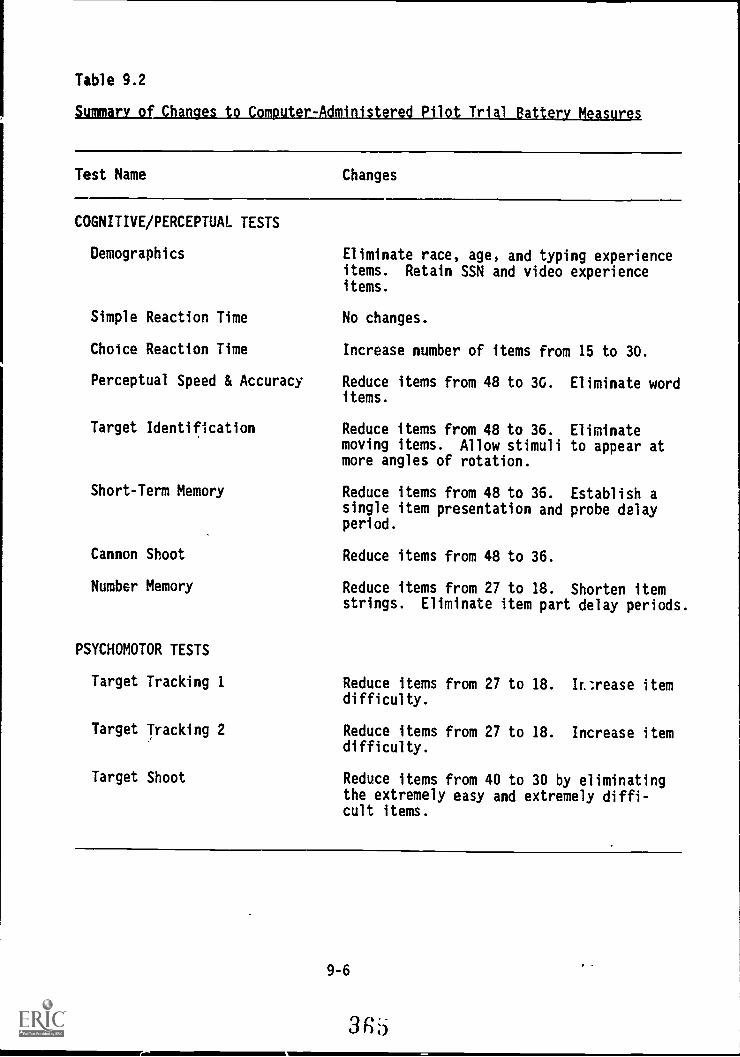
Table 9.2
UM. II_ 'SU i - -5
Test Name Changes
COGNITIVE/PERCEPTUAL TESTS
Demographics
Simple Reaction Time
Choice Reaction Time
Perceptual Speed & Accuracy
Target Identification
Short-Term Memory
Cannon Shoot
Eliminate race, age, and typing experienceitems. Retain SSN and video experienceitems.
No changes.
Increase number of items from 15 to 30.
Reduce items from 48 to 3G. Eliminate worditems.
Reduce items from 48 to 36. Eliminatemoving items. Allow stimuli to appear atmore angles of rotation.
Reduce items from 48 to 36. Establish asingle item presentation and probe delayperiod.
Reduce items from 48 to 36.
Number Memory Reduce items from 27 to 18. Shorten itemstrings. Eliminate item part delay periods.
PSYCHOMOTOR TESTS
Target Tracking 1
Target Tracking 2
Target Shoot
Reduce items from 27 to 18. IL:rease itemdifficulty.
Reduce items from 27 to 18. Increase itemdifficulty.
Reduce items from 40 to 30 by eliminatingthe extremely easy and extremely diffi-cult items.
9-6
3135
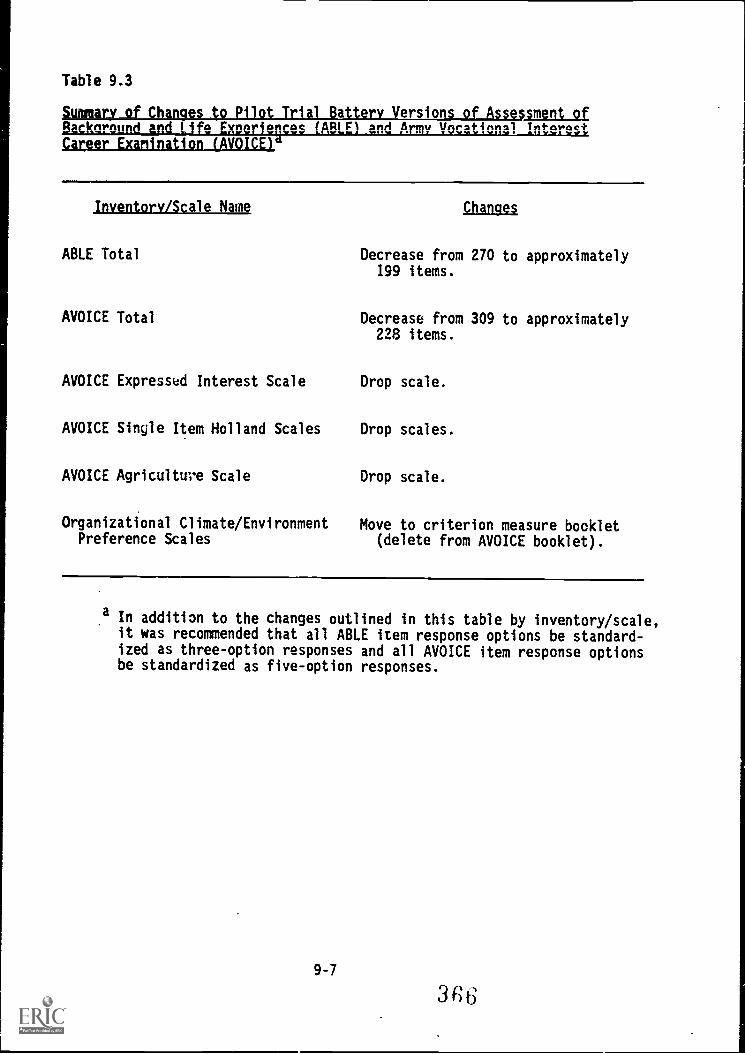
Table 9.3
SumarYofChanies_to Pilot Trial Battery Versions_of_Asseslment ofBackaround and life Experiences 'ABLE) and Arnw Vocational InterestLiver Examination LAVOICE1*
Inventory /Scale e Changes
ABLE Total
AVOICE Total
AVOICE Expressed Interest Scale
AVOICE Single Item Holland Scales
AVOICE Agriculture Scale
Organizational Climate/EnvironmentPreference Scales
Decrease from199 items.
Decrease from228 items.
Drop scale.
Drop scales.
Drop scale.
Move to criterion measure bocklet(delete from AVOICE booklet).
270 to approximately
309 to approximately
a In addition to the changes outlined in this table by inventory/scale,it was recommended that all ABLE item response options be standard-ized as three-option responses and all AVOICE item response optionsbe standardized as five-option responses.
9-7
3C6
tency (alpha n .83 vs .65 and separately timed, split-half coefficients.78 vs .63) and test-retest (.64 vs .57), as well as a higher uniqueness
estimate (.49 vs .37). Reasoning 1 was retained with no item or time limitchanges and Reasoning 2 was dropped. Reasoning 1 was renamed ReasoningTest.
Three tests measured the Spatial Orientation construct in the PilotTrial Battery. Orientation 1 was dropped because it showed lower test-retest reliabilities (.67 vs .80 and .84) and higher gain scores (.63 SDunits vs .11 and .08 SD units). In addition, we modified the instructionsfor Orientation 2 because field test experience had indicated that the PTBinstructions were not as clear as they should be. Orientation 2 was re-named Orientation Test. Orientation 3 was retained with no changes andrenamed Map Test.
Changes to Perceptual/Psychomotor Computer-Administered Tests
Before describing the changes made to specific perceptual/psychomotortests in the computer-administered battery, we describe several improve-ments to the computer battery as a whole.
Modifications in Computer Administration Procedures. The generalchanges included the following:
1. Virtually all test instructions were modified, in these ways:
Most instructions were shortened considerably.
Names of buttons, slides, and switches on the response pedestalswere written in capital letters whenever they appeared in theinstructions (e.g., BLUE, VERTICAL. RIGHT) to attract subjects'attention faster and more effectively.
Test terms and jargon were standardized. For example, in thePTB test instructions, the response pedestal was at varioustimes called the "testing panel," the "response panel," and the"response pedestal." In the Trial Battery instructions, thisapparatus was always referred to as the "response pedestal."
Where possible, the following standard outline was used in pre-paring the instructions:
-- Test name
-- One-sentence description of the purpose of the test-- Step-by-step test instructions-- One practice item-- Brief re-statement of test instructions-- Two or three additional practice items-- Instructions to cal, test administrator if there are questions
about the test
2. Whenever test items had a correct response, the subject was givenfeedback on the practice items to indicate whether he/she hadanswered the item correctly.
9-8
313
3. Rest periods were eliminated from the battery. (Previously, therewere rest periods between the first half and second half of theitems within several of the tests.) This was feasible because mosttests were shortened.
4. The computer programs controlling test administration were mergedinto one super-program, eliminating the time required to load theprograms between tests.
5. The format and parameters used in the software containing testitems were reworded, so that the software was more "self-documented."
6. The total time allowed for subjects to respond to a test item (or,in other words, response time limit) was set at 9 seconds for allreaction time tests (Simple and Choice Reaction Time, Short-TermMemory, Perceptual Speed and Accuracy, and Target Identification).In the PTB version the response time limit had varied from test totest, for no particular reason. The field test data showed that,on almost all tr4-ls of all reaction time tests, subjects were ableto respond within 9 seconds. Therefore, the 9-second time limitwas adopted as a standard.
7. Also, with regard to the reaction time tests, the software waschanged that the stimulus for an item disappeared when thesubject lifted his/her hand from the home button (in order to makea response). Subjects are instructed not to lift their hands fromthe home buttons until they have determined the correct response;in this manner, separate measures of decision and movement time canbe obtained. However, more than a few of the field test subjectscontinued to study the item stimulus to determine the correctresponse after leaving the home buttons. By causing the item todisappear, we hoped to eliminate that problem.
All of the changes to the overall computer-administered test batterydescribed above, and the individual test changes described below, weresubjected to a series of small sample tryouts (N < 6 in each tryout) at theMinneapolis Military Entrance Processing Station (MEPS). These tryouts werefor the purpose of inspecting and evaluating the software changes (in-cluding test items), eliciting feedback about instruction changes andinsuring that the time needed to take the computer-administered test bat-tery was within the time that would be available for the upcoming Concur-rent Validation phase of Project A. No data were analyzed as a result ofthese tryouts because the total N was too small (less than 40), but theyfulfilled the purpose of insuring that all changes were made correctly andwere achieving the end desired.
Changes to Content of Tests Administered by Computer. We turn now toa description of the specific changes made to the individual computer-administered tests for use in the Trial Battery.
In the demographic section of the computer battery, items asking aboutage, race, and typing e perience were deleted. Information on age and raceis available from other sources. Typing experience is no longer relevantsince subjects' responses are now obtained via the response pedestal in-
9-9
36d
stead of a standard keyboard.
No changes were recommended for Simple Reaction Time. However, we re-randomized the order of the pretrial intervals (the interval between thetime the subject depresses the home button keys and the appearance of thetrial stimulus). This was done because the pretrial intervals (the orderof these intervals had been randomly determined) tended to increase overtrials 7-14, then dropped precipitously for trial 15; as a result, meanresponse time for trial 15 was significantly higher than mean responsetimes for the previous several trials. Re-randomization was thereforeconsidered desirable, to remove this abnormality.
The number of items in Choice Reaction Time was increased from 15 to30 in an attempt to increase the test-retest reliability for mean reactiontime on this test.
Twelve items were eliminated from Perceptual Speed and Accuracy (re-duced from 48 to 36 items), primarily to save time. Internal consistencyestimates were high for scores on this test (.83, .96, .88, and .74 forPercent Correct, Mean Reaction Time, Slope, and intercept, respectively),so item reduction did not seem to be cause for concern in that regard.Test-retest reliabilities were lower than internal consistencies, but itwas not clear that item reduction would affect this greatly. The 12 itemseliminated were all the "word" items (see Chapter 5 for a description ofthe item types in this test) rather than any of the alpha, numeric, sym-bolic, or mixed items, because word items were not used to calculate two ofthe scores, Slope and Intercept.
Several changes were made to the Iirget.Identification Test. First,one of the two item types--the "moving" items--was eliminated. Field testdata showed that scores on the "moving" and stationary items corre-lated .78, and the moving items had lower test-retest reliabilities thanstationary items (.54 vs .74) and also had lower uniqueness estimates (.44vs .56). Also, two item parameters were modified. All target objectswere made the same size (50% of the size of the objects depicted as pos-sible answers) since field test analyses indicated size had had no appreci-able effect on reaction time. A third level of angular rotation was addedso the target objects were rotated either 0°, 45°, or 75°. Theoretically,and as found in past research, reaction time is expected to increase withgreater angular rotation. Two of the item parameters were not changed(position of correct response object and direction of target object).Finally, the number of items was reduced from 48 to 36 in order to savetime. Internal consistency and test-retest estimates indicated that thelevel of risk attached to this reduction would be acceptable. (For MeanReaction Time, the internal consistency estimate was .96 and the test-retest estimate was .67.) The reduction from 48 to 36 items was accomp-lished by retaining 12 of the 24 "moving" items (which were to be elimin-ated as an item type, see just above) as stationary items. That is, theitems had the same parameters they possessed as "moving" items, but werepresented as "stationary" items. The retained items were those that hadthe proper item parameters to allow a balanced number of items in each ofthe cells defined by crossing the item parameters. The test, as modified,had two items in each of 18 cells determined by crossing angular rotation(00,450,
io-.pc) ), position of correct response object (left, center, or middle
of screen), and direction of target object (left-facing or right-facingl.
One item parameter, probe delay period, was eliminated from the Ihmt,ISIEM_8111412_112I. while to others, item type (symbolic vs. letter) anditem length ;1, k, or 5 objects) were retained. Analyses of field testdata showed that probe delay period did not significantly affect MeanReaction Time scores. To save time, 12 items were eliminated. (Elimin-
ating the probe delay period did not result in any reduction in items.)Two of the three most important scores for phis test appeared to have highenough reliabilities to withstand such a reduction (internal consistencyand test-retest estimates were .94 and .78, respectively for Mean ReactionTime, .52 and .47 for Slope, and .84 and .74 for Intercept). Items wereeliminated by deleting those items that had the lowest item-total scorecorrelation, within the limitation of maintaining balance in the distribu-tion of items across the cells defined by item parameters.
Finally, the software controlling tr_ administration of this test wasrewritten in en attempt to reduce the amount of missing data occurring onthe test. Ft 4' .est data indicated that some subjects apparently did notcomplete' unszerstand the instructions, and complete6 items inappro-priately, causing missing data (specifically, they re"eased the home but-tons after the item's stimulus set disappeared but before the probe ap-peared). The rewritten software gave feedback to the subject if an itemwas inappropriately completed. If a subject completed three items inappro-pria 3 y, he/she was told (by a message on the screen) to call the testadmilistrator for '':ether instruction; also, the test c.ould not continueuntil the administrator made a secaence of button pushes (unknown to thesubject).
The number of items on the Cannon Shoot Test was reduced from 48 to36, again to save time. Internal consistency and test-retest reliabilitiesfor the Time Error Score were high enough (.88 and .66, respectively) towarrant such reduction without the expectation of a significant impact orreliability.
Also, the items were modified to eliminate two problems observedduring the field tests. First, on some items, the target was actually noton the screen as it began its movement toward the cannon's line of fire.Second, on some items, the subject had to fire at the target almost as soonas it appeared on screen in order to hit the target with the cannonshell. Such items provided subjects with little or no opportunity todetermine the speed and direction of the target, and thus to use movementjudgment, which was the construct we intended tc measure. Therefore, thetest was modified so that all targets are visible on the screen at thebeginning o the trial and so that the subject is given at least a coupleseconds to view the speed and direction of the target before the tarotreaches the optimal fire point.
Two modifications were made to Number Memory to reduce test adminis-tration time. The item part delay period was made a constant (1 second)rather than treated as a parameter with two levels (0.5 and 2.5 seconds),and the item string length (number of parts in a;-1 item) was charged from 4,6, or 8 parts to 2, 3, or 4 parts. These changes drastically reduced thetime required to complete the test. As a result, no reduction in thenumuer of items, as had.been recommended (see Table 9.2) was necessary.The Trial Battery version of this test hat 28 items, constructed so thatthere were 13 replications of the four ariametic operations (add, sub-
9-11
37
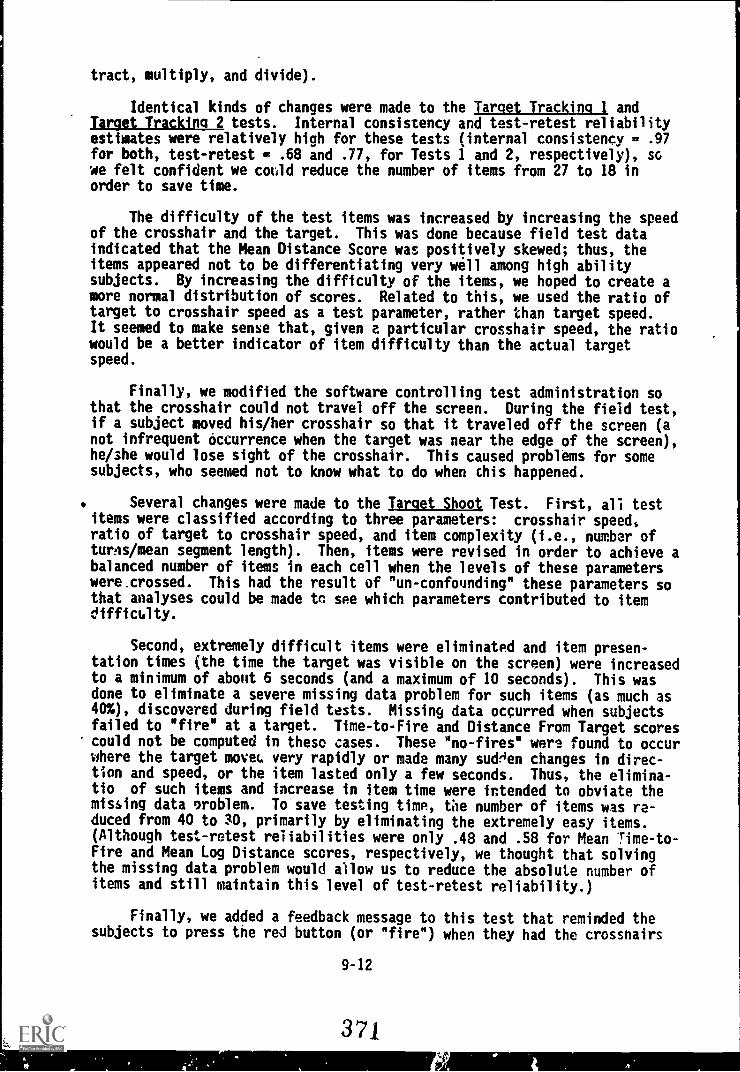
tract, multiply, and divide).
Identical kinds of changes were made to the Target Tracking 1 andTarget Tracking_2 tests. Internal consistency and test-retest reliabilityestimates were relatively high for these tests (internal consistency - .97for both, test-retest - .68 and .77, for Tests 1 and 2, respectively), sowe felt confident we could reduce the number of items from 27 to 18 inorder to save time.
The difficulty of the test items was increased by increasing the speedof the crosshair and the target. This was done because field test dataindicated that the Mean Distance Score was positively skewed; thus, theitems appeared not to be differentiating very well among high abilitysubjects. By increasing the difficulty of the items, we hoped to create amore normal distribution of scores. Related to this, we used the ratio oftarget to crosshair speed as a test parameter, rather than target speed.It seemed to make sense that, given a particular crosshair speed, the ratiowould be a better indicator of item difficulty than the actual targetspeed.
Finally, we modified the software controlling test administration sothat the crosshair could not travel off the screen. During the field test,if a subject moved his/her crosshair so that it traveled off the screen (anot infrequent occurrence when the target was near the edge of the screen),he/she would lose sight of the crosshair. This caused problems for somesubjects, who seemed not to know what to do when this happened.
Several changes were made to the Target Shoot Test. First, all testitems were classified according to three parameters: crosshair speed,ratio of target to crosshair speed, and item complexity (i.e., number ofturfs /mean segment length). Then, items were revised in order to achieve abalanced number of items in each cell when the levels of these parameterswere.crossed. This had the result of "un-confounding" these parameters sothat analyses could be made to see which parameters contributed to itemdifficulty.
Second, extremely difficult items were eliminated and item presen-tation times (the time the target was visible on the screen) were increasedto a minimum of about 6 seconds (and a maximum of 10 seconds). This wasdone to eliminate a severe missing data problem for such items (as much as40%), discovered during field tests. Missing data occurred when subjectsfailed to "fire" at a target. Time-to-Fire and Distance From Target scorescould not be computed in these cases. These "no-fires" were found to occurwhere the target moveu very rapidly or made many sudrien changes in direc-tion and speed, or the item lasted only a few seconds. Thus, the elimina-tio of such items and increase in item time were intended to obviate themissing data oroblem. To save testing time, the number of items was re-duced from 40 to 30, primarily by eliminating the extremely easy items.
(Although test-retest reliabilities were only .48 and .58 for Mean Time-to-Fire and Mean Log Distance scores, respectively, we thought that solvingthe missing data problem would allow us to reduce the absolute number ofitems and still maintain this level of test-retest reliability.)
Finally, we added a feedback message to this test that reminded thesubjects to press the red button (or "fire") when they had the crossnairs
9-12
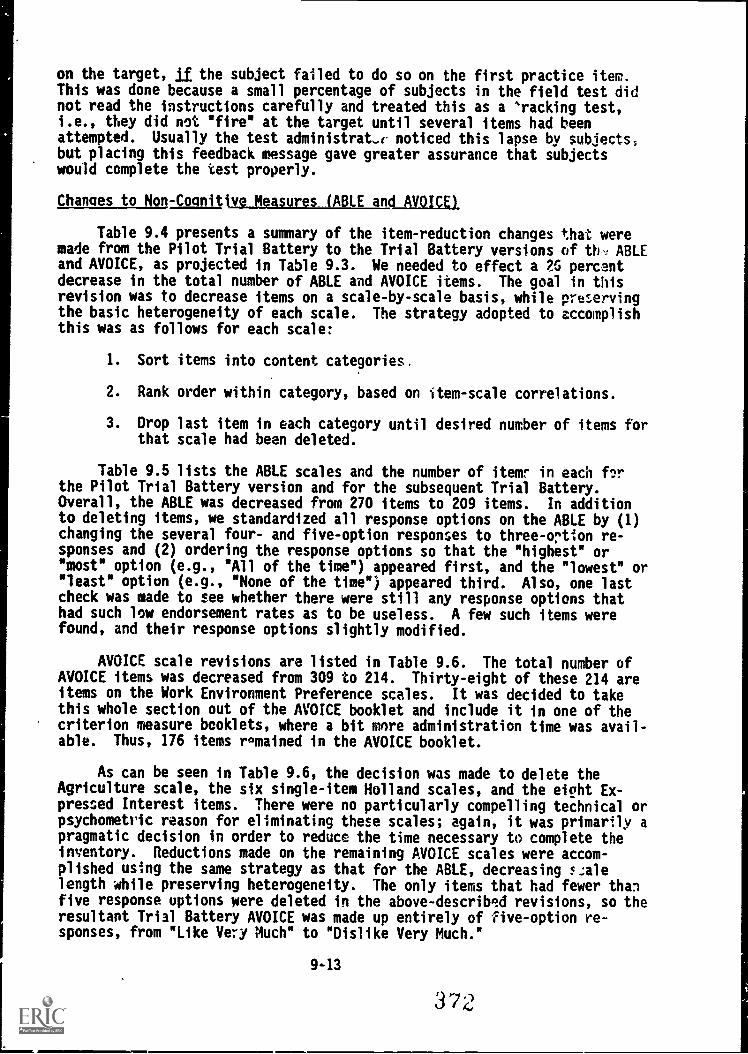
on the target, jj the subject failed to do so on the first practice item.This was done because a small percentage of subjects in the field test didnot read the instructions carefully and treated this as a "'racking test,i.e., they did not "fire" at the target until several items had beenattempted. Usually the test administrat_r noticed this lapse by subjects,but placing this feedback message gave greater assurance that subjectswould complete the test properly.
Changes to Non-Cognitive itenuresJAKLansi AVOICE)
Table 9.4 presents a summary of the item-reduction changes that weremade from the Pilot Trial Battery to the Trial Battery versions of th, ABLEand AVOICE, as projected in Table 9.3. We needed to effect a 25 percentdecrease in the total number of ABLE and AVOICE items. The goal in thisrevision was to decrease items on a scale-by-scale basis, while pre.servingthe basic heterogeneity of each scale. The strategy adopted to accomplishthis was as follows for each scale:
1. Sort items into content categories,
2. Rank order within category, based on item-scale correlations.
3. Drop last item in each category until desired number of items forthat scale had been deleted.
Table 9.5 lists the ABLE scales and the number of itemr in each f2rthe Pilot Trial Battery version and for the subsequent Trial Battery.Overall, the ABLE was decreased from 270 items to 209 items. In additionto deleting items, we standardized all response options on the ABLE by (1)changing the several four- and five-option responses to three-ortion re-sponses and (2) ordering the response options so that the "highest" or*most" option (e.g., "All of the time") appeared first, and the "lowest" or"least" option (e.g., "None of the time") appeared third. Also, one lastcheck was made to see whether there were still any response options thathad such low endorsement rates as to be useless. A few such items werefound, and their response options slightly modified.
AVOICE scale revisions are listed in Table 9.6. The total number ofAVOICE items was decreased from 309 to 214. Thirty-eight of these 214 areitems on the Work Environment Preference scales. It was decided to takethis whole section out of the AVOICE booklet and include it in one of thecriterion measure booklets, where a bit more administration time was avail-able. Thus, 176 items ramained in the AVOICE booklet.
As can be seen in Table 9.6, the decision was made to delete theAgriculture scale, the six single-item Holland scales, and the eight Ex-pressed Interest items. There were no particularly compelling technical orpsychometric reason for eliminating these scales; again, it was primarily apragmatic decision in order to reduce the time necessary to complete theinventory. Reductions made on the remaining AVOICE scales were accom-plished using the same strategy as that for the ABLE, decreasing $,:alelength while preserving heterogeneity. The only items that had fewer thanfive response options were deleted in the above-described revisions, so theresultant Trial Battery AVOICE was made up entirely of five-option re-sponses, from "Like Very Much" to "Dislike Very Much."
9-13
372
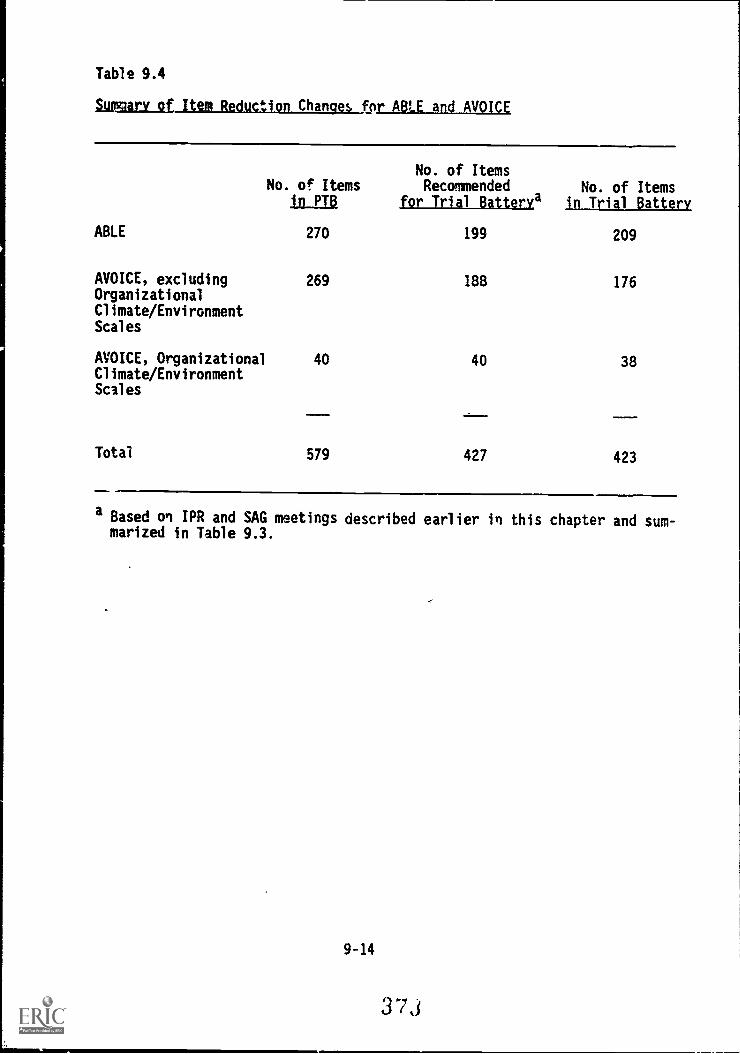
Table 9.4
enlyffaryititijaktistpr ABLE and AVOICE
No. of Itemsin PTB
No. of ItemsRecommended
for Trial BattervaNo. of Items
in Trial Battery
ABLE 270 199 209
AVOICE, excluding 269 188 176OrganizationalClimate/EnvironmentScales
AVOICE, Organizational 40 40 38Climate/EnvironmentScales
Total 579 427 423
a Based on IPR and SAG meetings described earlier in this chapter and sum-marized in Table 9.3.
9-14
373
-fr
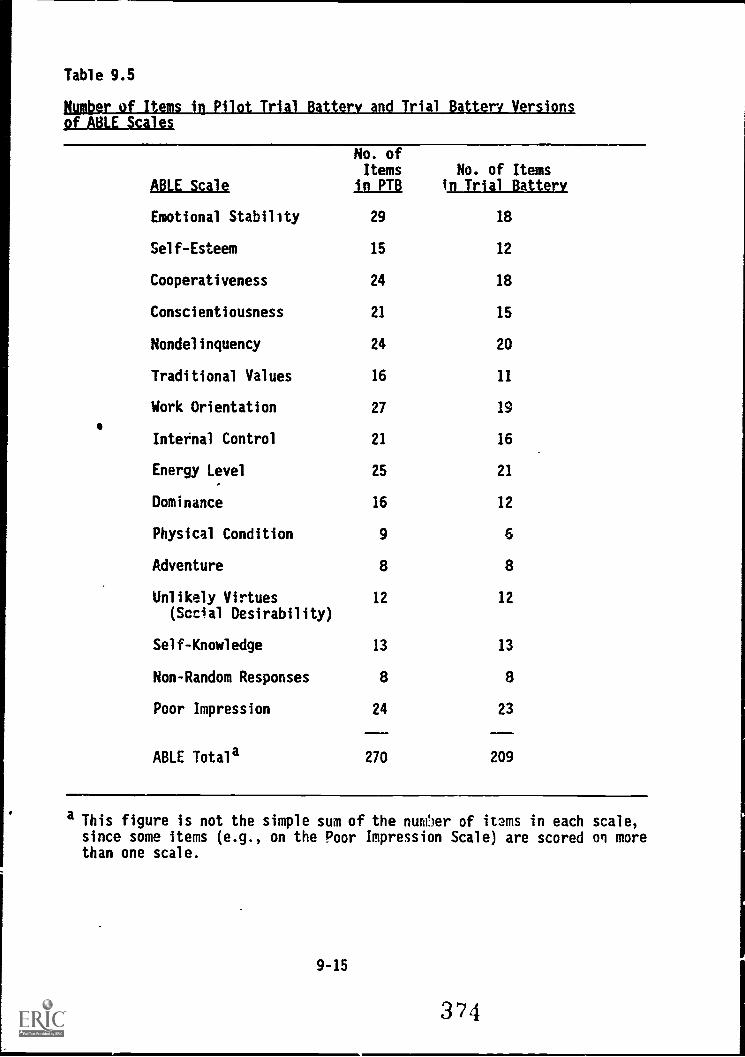
Table 9.5
cumber of Items in Pilot Trial Battery and Trial Battery Versions
ALARLICI121
ABLE Scale
No. ofItems
in PTBNo. of Items
tn_Trial Battery
Emotional Stability 29 18
Self-Esteem 15 12
Cooperativeness 24 18
Conscientiousness 21 15
Nondelinquency 24 20
Traditional Values 16 11
Work Orientation 27 19
Intefnal Control 21 16
Energy Level 25 21
Dominance 16 12
Physical Condition 9 6
Adventure 8 8
Unlikely Virtues 12 12
(Social Desirability)
Self-Knowledge 13 13
Non-Random Responses 8 8
Poor Impression 24 23
ABLE Totala 270 209
a This figure is not the simple sum of the num)er of items in each scale,since some items (e.g., on the Poor Impression Scale) are scored on morethan one scale.
9-15
374
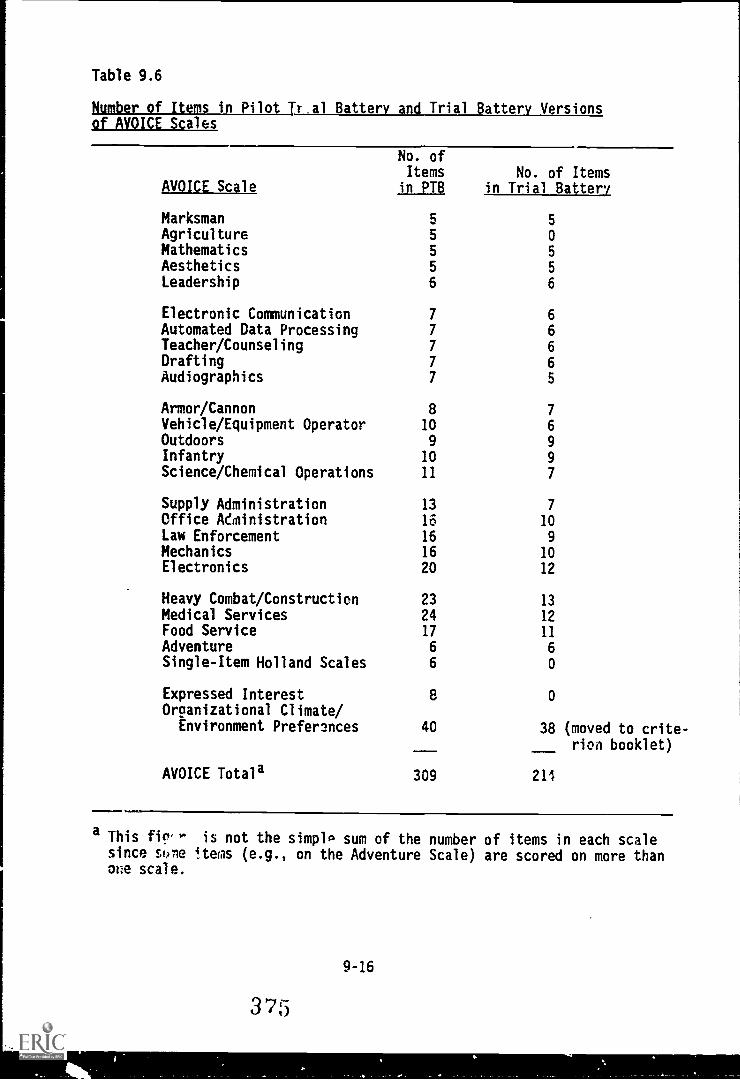
Number of Items in Pilot Tr.al Battery and Trial Battery Versionsof AVOICE Scale
No. ofItems No. of Items
AVOICE Scale in PTB in Trial Battery
Marksman 5 5
Agriculture 5 0
Mathematics 5 5
Aesthetics 5 5
Leadership 6 6
Electronic Communication 7 6
Automated Data Processing 7 6
Teacher/Counseling 7 6
Drafting 7 6Audiographics 7 5
Armor/Cannon 8Vehicle/Equipment Operator 10Outdoors 9
Infantry 10Science/Chemical Operations 11
7
6
9
9
7
Supply Administration 13 7
Office Administration 16 10Law Enforcement 16 9
Mechanics 16 10
Electronics 20 12
Heavy Combat/Construction 23 13
Medical Services 24 12
Food Service 17 11Adventure 6 6
Single-Item Holland Scales 6 0
Expressed Interest 8 0
Organizational Climate/Environment Prefer3nces 40 38 (moved to crite-
rion booklet)
AVOICE Totala 309 211
a This fif is not the simple sum of the number of items in each scalesince sole ;terns (e.g., on the Adventure Scale) are scored on more thanone scale.
9-16
3 75
DESCRIPTION OF THE TRIAL BATTERY AND SUMMARY COMMENTS
In this chapter we have described the revisions made to the PilotTrial Battery that produced the Trial Battery. In essence, the TrialBattery is a shortened and improved version of the Pilot Trial Battery usedin the field tests. The Trial Battery was designed to be administered in aperiod of 4 hours and will be used during the Concurrent Validation phaseof Project A.
Figure 9.2 shows a general description of the Trial Battery. Theseare the measures that were the product of the revisions just described.Appendix H contains copies of the Trial battery measures (Appendix H is ina separate limited - distribution report, ARI Research Note 8724,as noted on p. xiv).
As already noted, the Trial Battery's intended use is as a predictorbattery in the Concurrent Validation phase of Project A. Those data willallow the replication of analyses described here on a much larger sample.(approximately 10,000). In addition, job performance criterion data willbe collected which will allow an examination of the validity of TrialBattery measures for predicting soldiers' job performance. All of thisinformation wilibe used to make revisions to the Trial Battery, therebyproducing the Experimental Battery that will be used in a LongitudinalValidation effort in 1986 and later years. (See Figure 1.2 for a flowchart showing the relationships between the Pilot Trial Battery, TrialBattery, and Experimental Battery.)
Whatever the outcome of those future efforts, we think thedevelopment, pilot testing, and field testing leading up to the TrialBattery has reached the intended objectives. As already noted in Chapter 1(see Task 2: Progress Summary), the measures developed came from acareful, structured process that identified the "best bets" for improvingthe prediction of soldiers' job performance. The new measures weredeveloped using an iterative process that resulted in steady improvementsguided by data. Procedures for efficiently and effectively administeringthe measures were developed along with the measures themselves. Finally,careful scrutiny of the psychometric characteristics of the measures showsthem to be satisfactory to excellent in that regard.
9-17 376
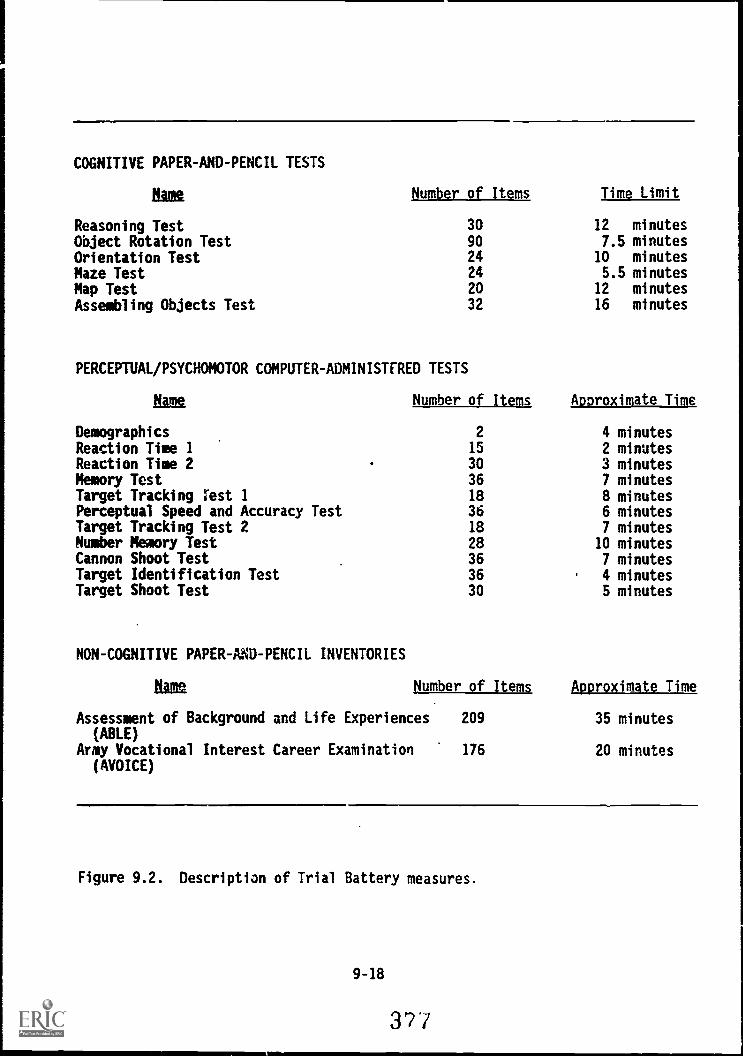
COGNITIVE PAPER-AND-PENCIL TESTS
tint Number of Items Time Limit
Reasoning Test 30 12 minutesObject Rotation Test 90 7.5 minutesOrientation Test 24 10 minutesMaze Test 24 5.5 minutesMap Test 20 12 minutesAssembling Objects Test 32 16 minutes
PERCEPTUAL/PSYCHOMOTOR COMPUTER- ADMINISTERED TESTS
Rug Number of Items Approximate Time
Demographics 2 4 minutesReaction Tine 1 15 2 minutesReaction Time 2 30 3 minutesMemory Test 36 7 minutesTarget Tracking rest 1 18 8 minutesPerceptual Speed and Accuracy Test 36 6 minutesTarget Tracking Test 2 18 7 minutesNumber Memory Test 28 10 minutesCannon Shoot Test 36 7 minutesTarget Identification Test 36 ' 4 minutesTarget Shoot Test 30 5 minutes
NON-COGNITIVE PAPER-AND-PENCIL INVENTORIES
lima Number of Items Approximate Time
Assessment of Background and Life Experiences 209 35 minutes(ABLE)
Army Vocational Interest Career Examination 176 20 minutes(AVOICE)
Figure 9.2. Description of Trial Battery measures.
9-18
371
APPENDIX A
Data Bases Searched
A-1
378
PSCYIUTO. (Commonly known as Psyc Abstracts) This file is produced bythe American Psychological Association and covers the world's literatureIn psychology and related behavioral and social sciences such as psychiatry,sociology, anthropology, education, pharmacology, and linguistics. Thefollowing general fields are covered: applied psychology, educationalpsychology, experimental human and animal psychology, experimental socialpsychology, general psychology, personality, physical and pr),..nologicaldisorders, physiological intervention, physiological pathology, professionalpersonnel and issues, psychometrics, social processes and issues, treatmentand prevention.
!MN. (Co' nment Printing Office Monthly Catalog) This file is producedSup. Atendent of Documents, United States Government Printing
Office and indexes the public documents generated by the legislativebranch, encutive branch, and all agencies of the United States FederalGovernment. Some publications from the judicial branch are also included.The subjects covered are agriculture, commerce, defense, health and humanservices, education energy, housing, interior, justice, labor, state, trans-portation, and treasury.
NTIS. (National Technical Information Service) This file is producedtithe National Technictl Information Service of the U.S. Department ofCommerce. The data base consists of government-sponsored research, devel-opment, and engineering reports as well as other analyses prepared bysevernment agencies, their contractors, or grantees: The following arerepresentative of the subject areas: administration and management; seta-mauties and aerodynamics; agriculture and food; astronomy and astrophysics;atmospheric sciences; behavior and society; biomedical technology andengineering; building industry technology; business and economics; chemistry;civil engineering; communication; computers, control, and information theory;electrotechnology; energy; environmental pollution and control; healthplanning; industrial and mechanical engineering; library and informationdicier as; materials sciences; mathematical sciences; medicine and biology;military sciences; missile technology; natural resources and earth sciences;navigation, guidance, and control; nuclear science and technology; oceantechnology and engineering; photography and recording devices; physics; pro-pulsion and fuels; space technology; transportation; urban and regionaltechnology.
!RIO. (Educational Resources Informatiot Center) This data file a pro-Tuced by The National Institute of Education and covers the following.subject areas: adult, career, and vocational education; counseling andpersonnel services; early childhood education; educational management;handicapped and gifted children; higher education; information resources;junior colleges; languages and Linguistics; reading and communicationskills; rural education and small schools; science, mathematics, andenvironmental education; social studies/social science education; teachereducation; tests, measurement, and evaluation; and urban education.
A-2
3 7;1
.SSCI i SSG'S. (Social Scisearch). These files are produced by the Institute77473Erialike Information (ISI) and constitute an international, multi-disciplinary index to the literature of the social, behavioral, and related
sciences. Subjects included in the data base are anthropology, archaeology.
area studios, business and finance, communication, community health, crimin--*logy and penology, demography, economics, education research, ethnic group
studies, geography, history, information /library science, international re-
ations, law, linguistics, management, marketing, philosophy, political
.Science, psychology, psychiatry, sociology, statistics, And urban planning
and development.
WIZ. (Smithsonian Science Information Exchange) This file is produced by
the Smithsonian Science Information Exchange and contains abstracts of
research either in progress or completed in the past two years. The data
bases encompass all fields of basic and applied research in the physical,
social, engineering, And life sciences includingi agalculcurrA sciences,
behavioral sciences, biological sciences, chemistry and chemical engineering,
earth sciences, electronics, engineering materials, mathematics, medical
sciences, physics, social sciences and economics.
DTIC. (Defense Technical Information Center) This file is produced by the
'Defense Logistics Agency. It makes available from one central repository
the thousands of research and development reports produced each year by
V.S. military organizations and their contractors and grantees. Defense
facilities and their contractors are required to submit to DTIC copies of
each report (up to and including SECRET) that formally records scientific
and technical results of Defense-sponsored research, development, cast.
and evaluation. Although created originally to serve the military, DTIC
services babe been extended to all federal government agencies and their
contractors, subcontractors, and grantees.
A-3
3S o

APPENDIX 8
Copies of Article Review and Predictor Reviaw Forms
B-1.3 ri i
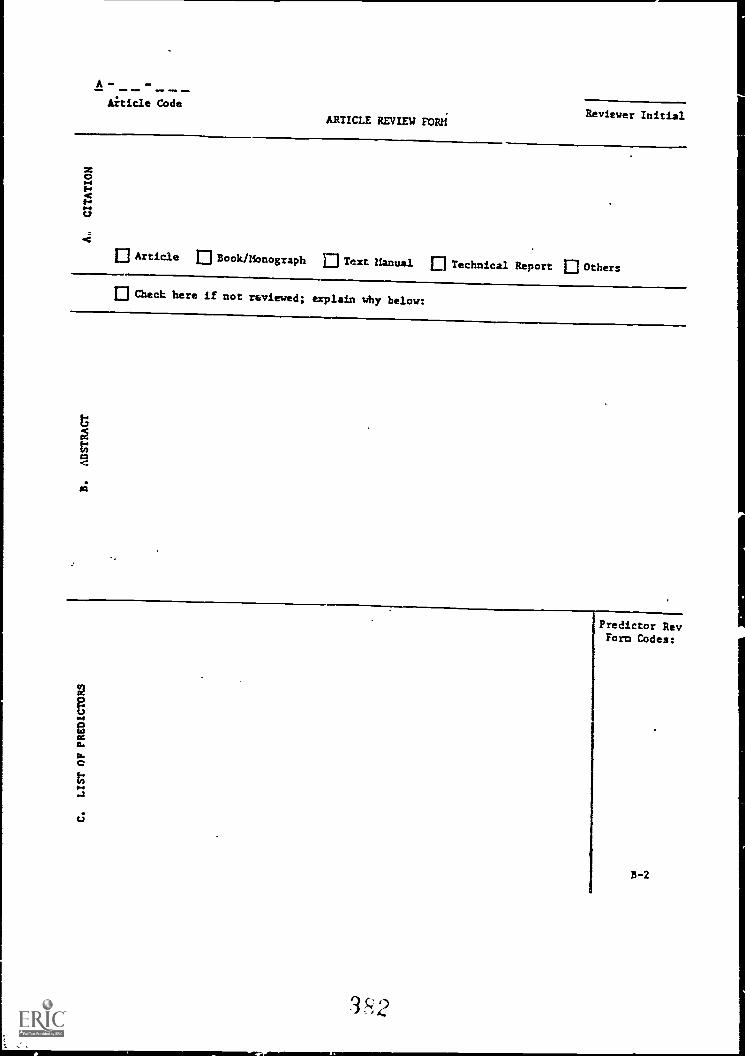
A-Aiticle Code
ARTICLE REVIEW FORMReviewer Initial
0 Article El Book/Monograph 9 Text Manual El Technical Report 9 Others
El Check here if not reviewed; explain why below:
Predictor RevForts Codes:
B-2
3 Y2
1
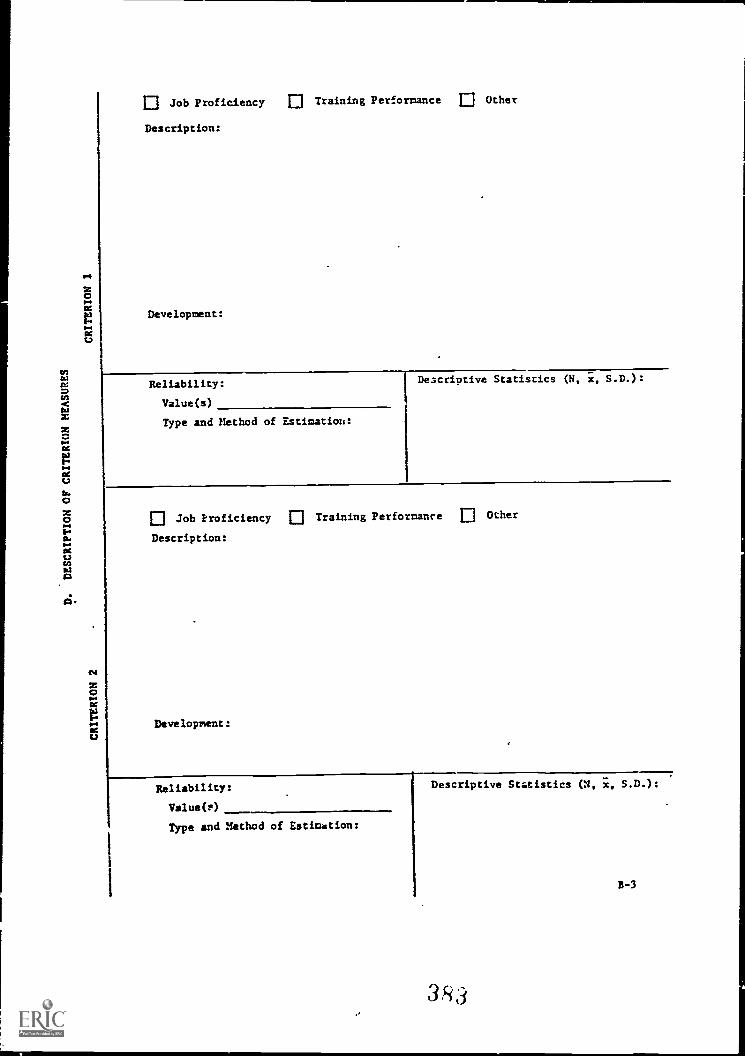
0 Job Proficiency 0 Training Performance Other
Description:
Development:
Reliability:
Value(s)
Type and Method of Estimatiou:
De3criptive Statistics (N, x, S.D.):
0 Job Proficiency 0 Training Performance 0 Other
Description:
Development:
Reliability:
Value(?)
Type and Method of Estimation:
Descriptive Statistics (N, x, S.D.):
B-3
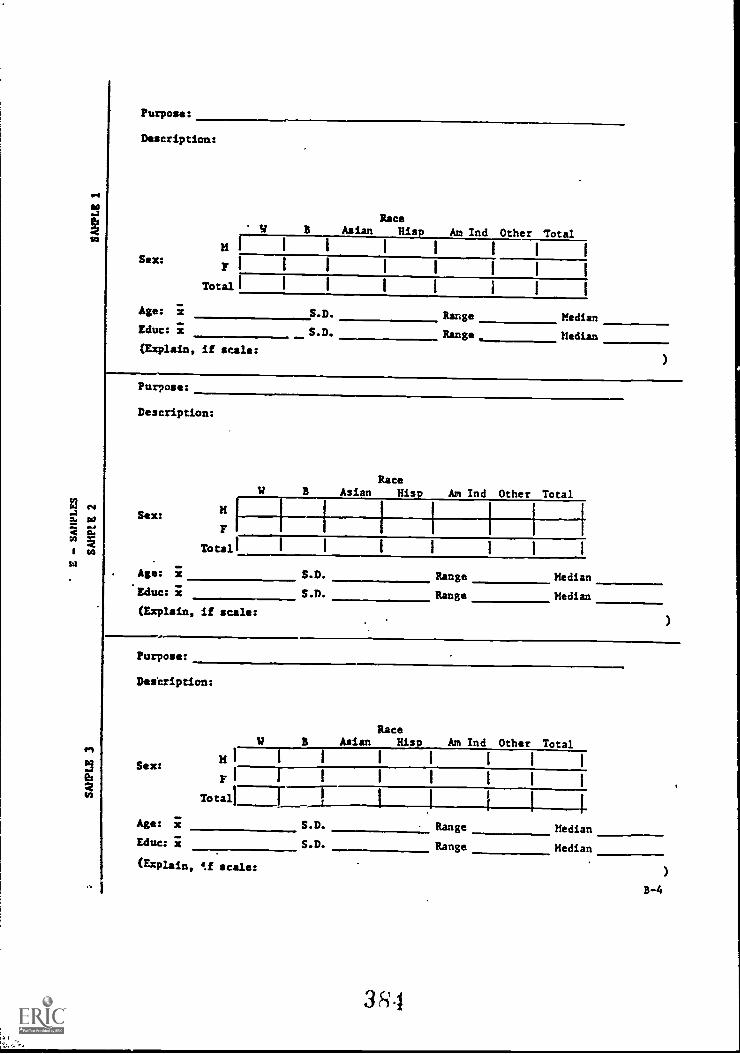
w
1.1
eIn
Purpose:
Description:
RaceV 8 Asian Risp An Ind Other Total
M1 I I I I I I ISax:
F I I1 I I I 1 I
Total' I I 1 1 I I I
Age: 7: S.D. Range MedianEduc: 1 S.D. Range Median
(Explain, if scale:
Purpose:
Description:
Sex:
RaceAsian Risp Am Ind Other Total
m111 i 1 1 I
Total' 1 1 1
. Age: ; S.D. Range Median
Educ: ; S.D. Range Median
(Explain, if scales
Purpose:
Description:
Race%I B Asian Risp Am Ind Other Total
Sex:M 1 1 1 1 I I I I
F 1 f I I I I I I
Total!1 [ [ 1 1
Age: ; S.D. Range Median
Educ: ; S.D. Range Median
(Explain, 41 scale:)
B-4
38.1
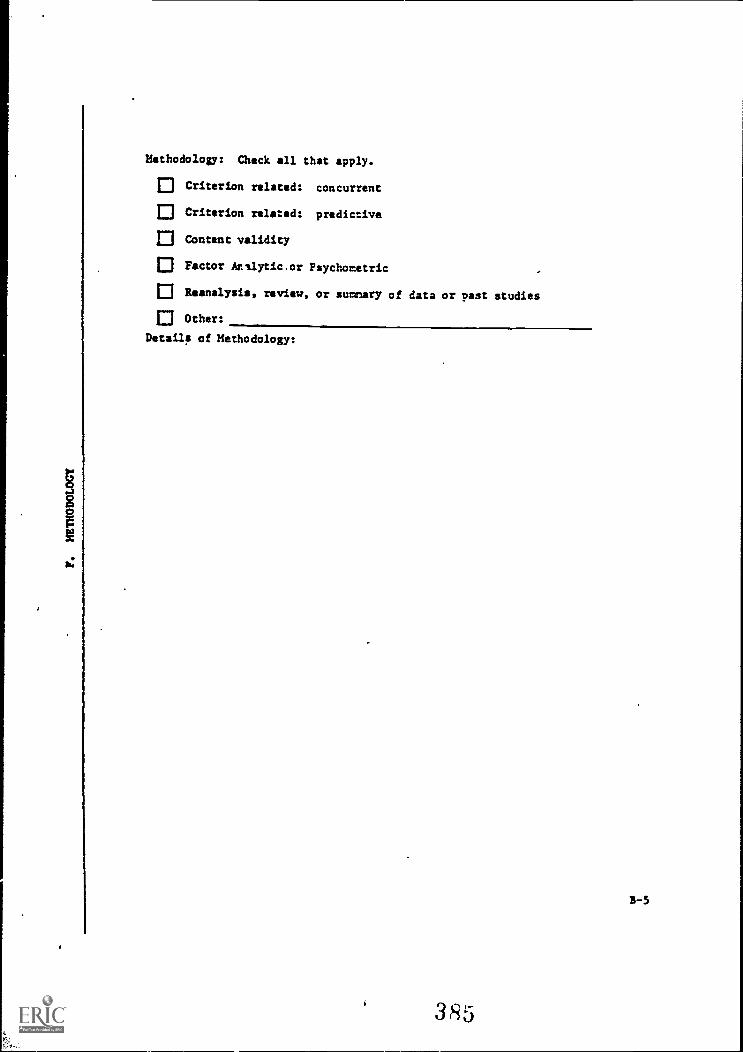
Methodology: Check all that apply.
Criterion related: concurrent
0 Criterion related: predictive
13 Content validity
El Factor Antlyticor Psychometric
0 Reanalysis, review, or summary of data or past studies
El Other:
Details of Methodology:
385
B-5
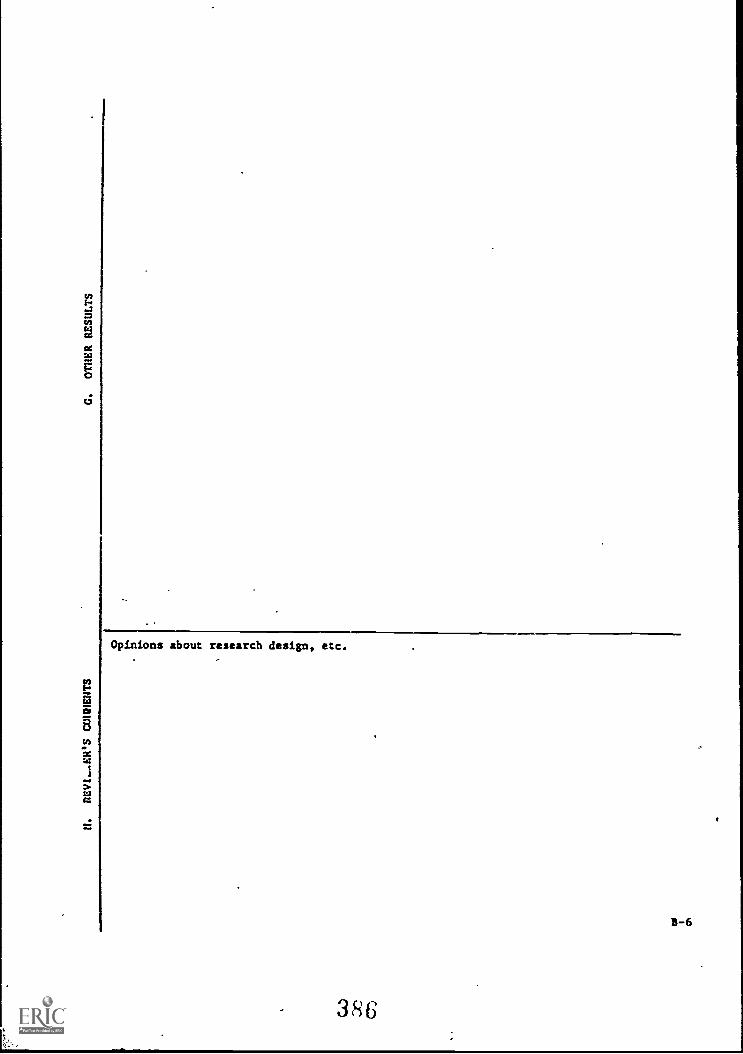
c.;
Opinions about research design, etc.
386
3-6
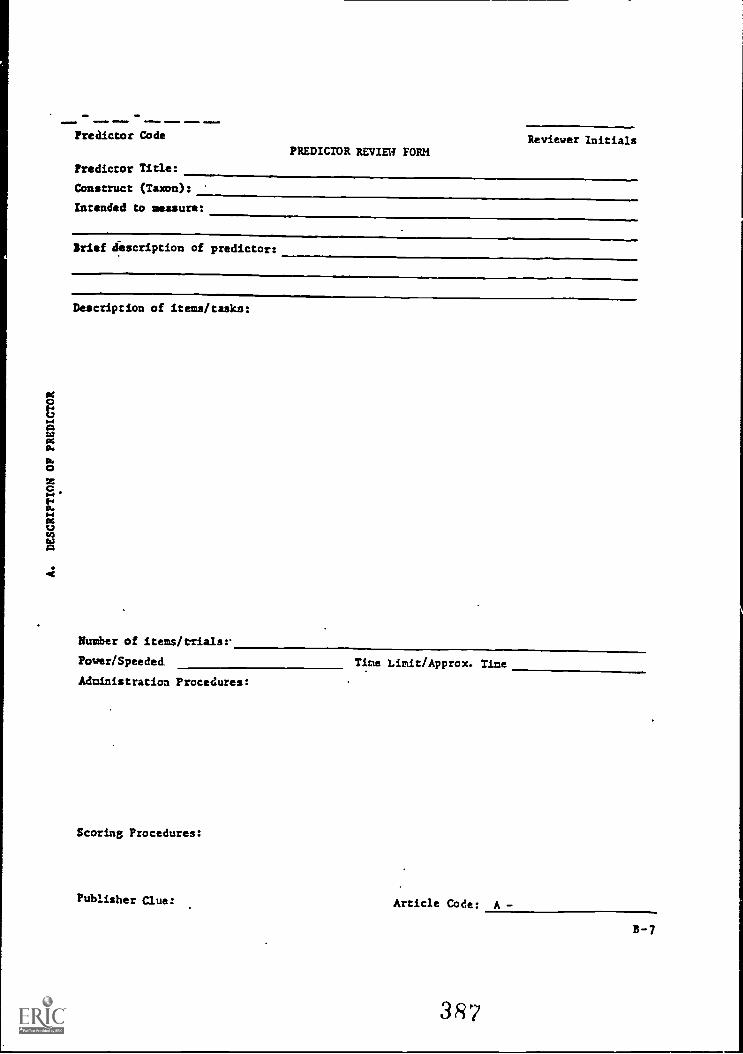
ORD
.11 woo., meows
Predictor Code
Predictor Title:
Construct (Taxon):
Intended to measure:
Reviewer InitialsPREDICTOR REVIEW FORM
Brief description of predictor:
Description of items /tasks:
Number of items/trialsr
Power /Speeded,
Administration Procedures:
Scoring Procedures:
Time Limit/Approx. Time
Publisher Clue: Article Code: A -
3 8 7
B -7
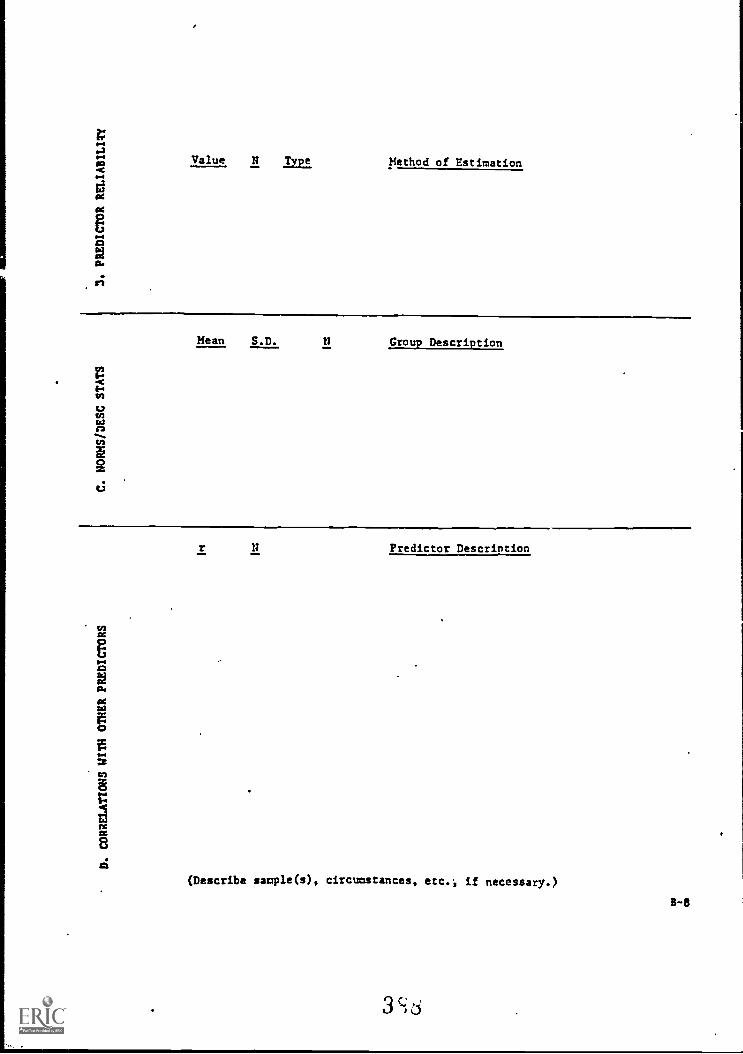
Value LI ape Method of Estimation
Mean S.D. 2J Group Description
Qa
a.aetai
8O
Predictor Description
(Describe sample(s), circumstances, etc., if necessary.)
3 S
B-$
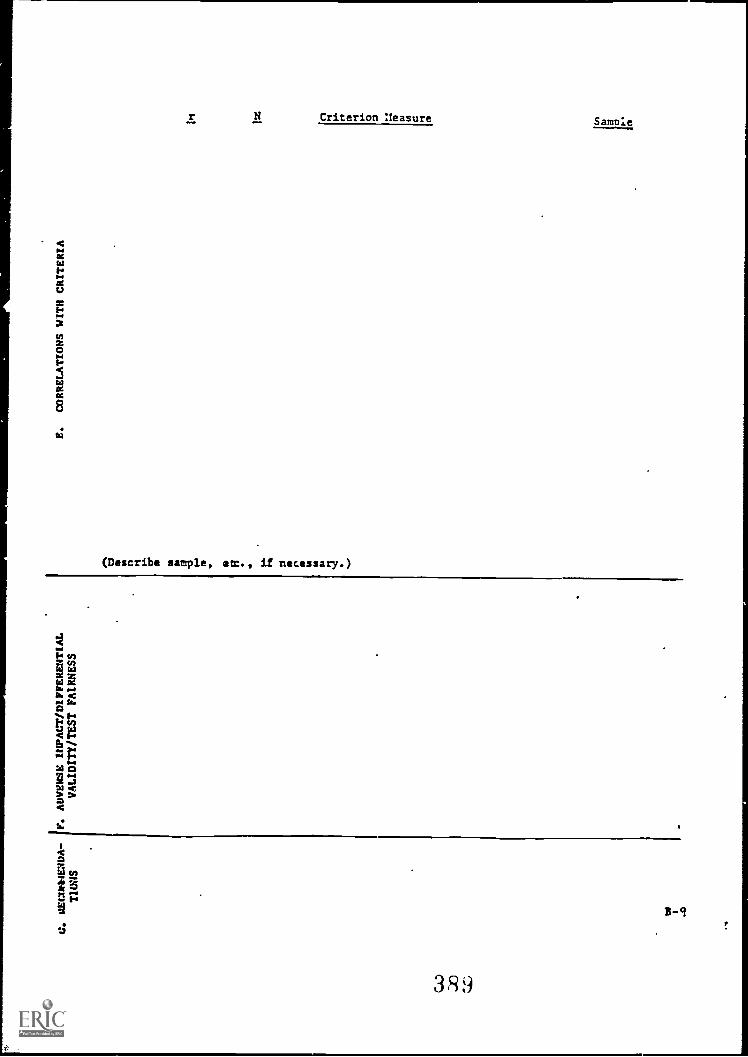
CA)
U. stECERI-IESDA
V. ADVERSE IDPACT/DIFFEREMAL
T1ONS
VALIDITY/TEST FAIRNESS
to
.c
E.
CORRELATIONS WITH CRITERIA
In Ix a 0 I-
n:C
fk
APPENDIX C
Names and Definiticns of Predictor and Criterion VariablesUsed in Expert Judgment Task
C-1
39 0
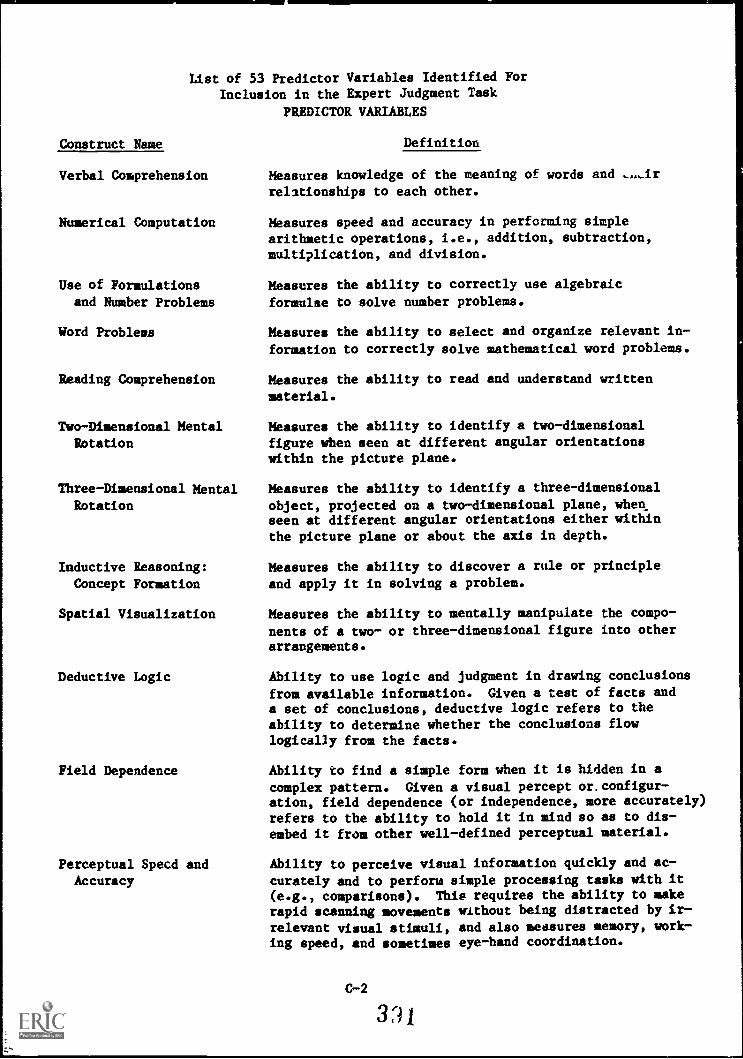
List of 53 Predictor Variables Identified ForInclusion in the Expert Judgment Task
PREDICTOR VARIABLES
Construct Name
Verbal Comprehension
Numerical Computation
Use of Formulations
and Number Problems
Word Problems
Reading Comprehension
Two-Dimensional MentalRotation
Three-Dimensional Mental
Rotation
Inductive Reasoning:
Concept Formation
Spatial Visualization
Deductive Logic
Field Dependence
Perceptual Specd and
Accuracy
Definition
Measures knowledge of the meaning of words and
relationships to each other.
Measures speed and accuracy in performing simplearithmetic operations, i.e., addition, subtraction,multiplication, and division.
Measures the ability to correctly use algebraic
formulae to solve number problems.
Measures the ability to select and organize relevant in-
formation to correctly solve mathematical word problems.
Measures the ability to read and understand written
material.
Measures the ability to identify a two-dimensional
figure when seen at different angular orientationswithin the picture plane.
Measures the ability to identify a three-dimensional
object, projected on a two-dimensional plane, whenseen at different angular orientations either withinthe picture plane or about the axis in depth.
Measures the ability to discover a rule or principle
and apply it in solving a problem.
Measures the ability to mentally manipulate the compo-
nents of a two- or three-dimensional figure into otherarrangements.
Ability to use logic and judgment in drawing conclusions
from available information. Given a test of facts anda set of conclusions, deductive logic refers to theability to determine whether the conclusions flowlogically from the facts.
Ability to find a simple form when it is hidden in a
complex pattern. Given a visual percept or.configur-ation, field dependence (or independence, more accurately)refers to the ability to hold it in mind so as to dis-
embed it from other well-defined perceptual material.
Ability to perceive visual information quickly and ac-
curately and to perform simple processing tasks with it(e.g., comparisons). This requires the ability to makerapid scanning movements without being distracted by ir-
relevant visual stimuli, and also measures memory, work-ing speed, and sometimes eye-hand coordination.
C-2
3%.1
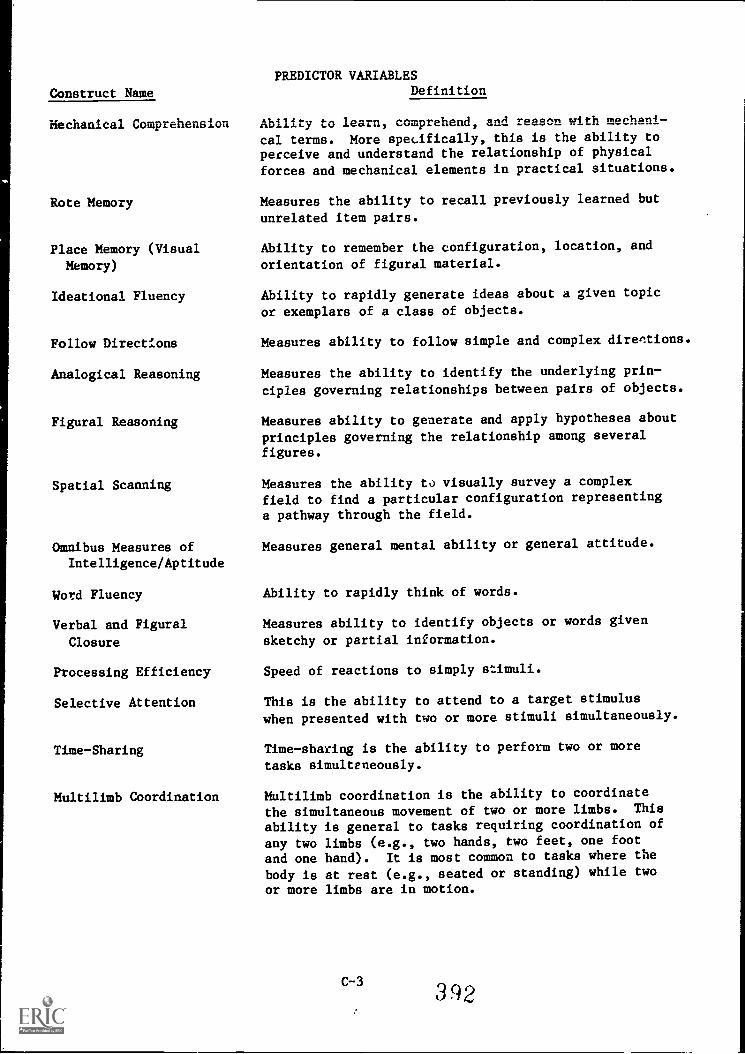
Construct Name
Mechanical Comprehension
Rote Memory
Place Memory (Visual
Memory)
Ideational Fluency
Follow Directions
Analogical Reasoning
Figural Reasoning
Spatial Scanning
Omnibus Measures ofIntelligence/Aptitude
Word Fluency
Verbal and Figural
Closure
Processing Efficiency
Selective Attention
Time-Sharing
Multilimb Coordination
PREDICTOR VARIABLESDefinition
Ability to learn, comprehend, and reason with mechani-
cal terms. More specifically, this is the ability toperceive and understand the relationship of physical
forces and mechanical elements in practical situations.
Measures the ability to recall previously learned but
unrelated item pairs.
Ability to remember the configuration, location, and
orientation of figural material.
Ability to rapidly generate ideas about a given topic
or exemplars of a class of objects.
Measures ability to follow simple and complex diref!tions.
Measures the ability to identify the underlying prin-ciples governing relationships between pairs of objects.
Measures ability to generate and apply hypotheses about
principles governing the relationship among severalfigures.
Measures the ability to visually survey a complex
field to find a particular configuration representinga pathway through the field.
Measures general mental ability or general attitude.
Ability to rapidly think of words.
Measures ability to identify objects or words given
sketchy or partial information.
Speed of reactions to simply stimuli.
This is the ability to attend to a target stimulus
when presented with two or more stimuli simultaneously.
Time-sharing is the ability to perform two or more
tasks simultaneously.
Multilimb coordination is the ability to coordinatethe simultaneous movement of two or more limbs. This
ability is general to tasks requiring coordination ofany two limbs (e.g., two hands, two feet, one foot
and one hand). It is most common to tasks where the
body is at rest (e.g., seated or standing) while twoor more limbs are in motion.
C-3 392
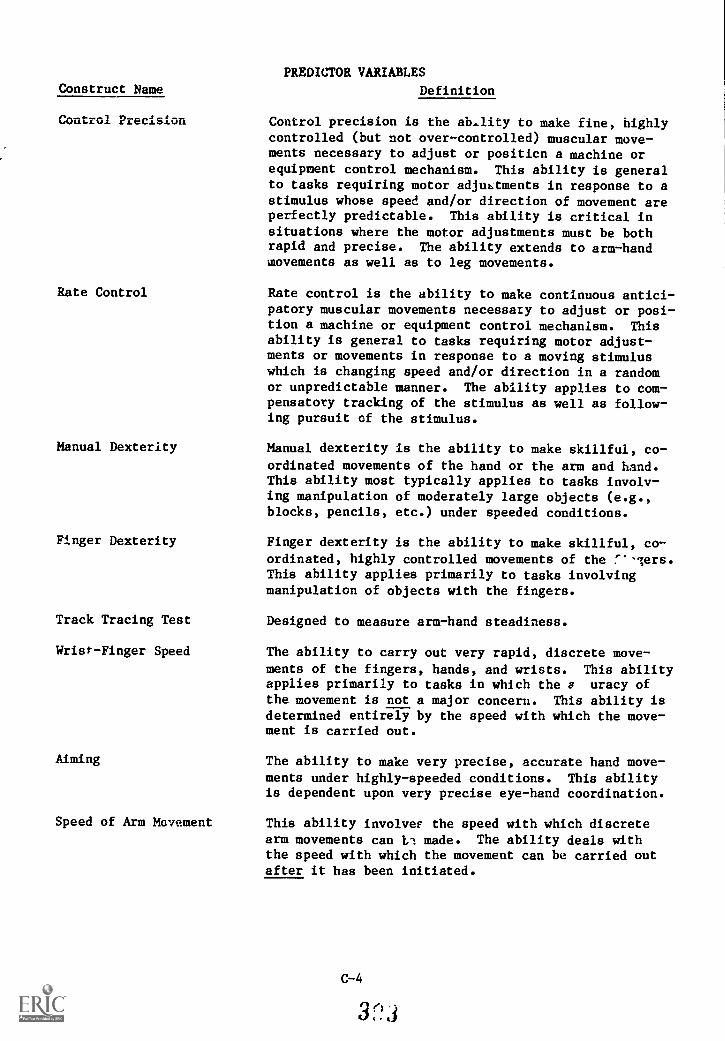
PREDICTOR VARIABLES
Construct Name Definition
Control Precision
Rate Control
Manual Dexterity
Finger Dexterity
Track Tracing Test
Wrisr-Finger Speed
Aiming
Speed of Arm Movement
Control precision is the ab...lity to make fine, highly
controlled (but not over-controlled) muscular move-ments necessary to adjust or positicn a machine orequipment control mechanism. This ability is generalto tasks requiring motor adjustments in response to astimulus whose speed and/or direction of movement areperfectly predictable. This ability is critical insituations where the motor adjustments must be bothrapid and precise. The ability extends to arm-handmovements as well as to leg movements.
Rate control is the ability to make continuous antici-patory muscular movements necessary to adjust or posi-tion a machine or equipment control mechanism. Thisability is general to tasks requiring motor adjust-ments or movements in response to a moving stimuluswhich is changing speed and/or direction in a randomor unpredictable manner. The ability applies to com-pensatory tracking of the stimulus as well as follow-ing pursuit of the stimulus.
Manual dexterity is the ability to make skillful, co-
ordinated movements of the hand or the arm and hand.This ability most typically applies to tasks involv-ing manipulation of moderately large objects (e.g.,blocks, pencils, etc.) under speeded conditions.
Finger dexterity is the ability to make skillful, co-
ordinated, highly controlled movements of the !--lers.This ability applies primarily to tasks involvingmanipulation of objects with the fingers.
Designed to measure arm-hand steadiness.
The ability to carry out very rapid, discrete move-
ments of the fingers, hands, and wrists. This abilityapplies primarily to tasks in which the a uracy ofthe movement is not a major concern. This ability isdetermined entirely by the speed with which the move-ment is carried out.
The ability to make very precise, accurate hand move-
ments under highly-speeded conditions. This abilityis dependent upon very precise eye-hand coordination.
This ability involveF the speed with which discretearm movements can Ll made. The ability deals withthe speed with which the movement can be carried outafter it has been initiated.
C-4
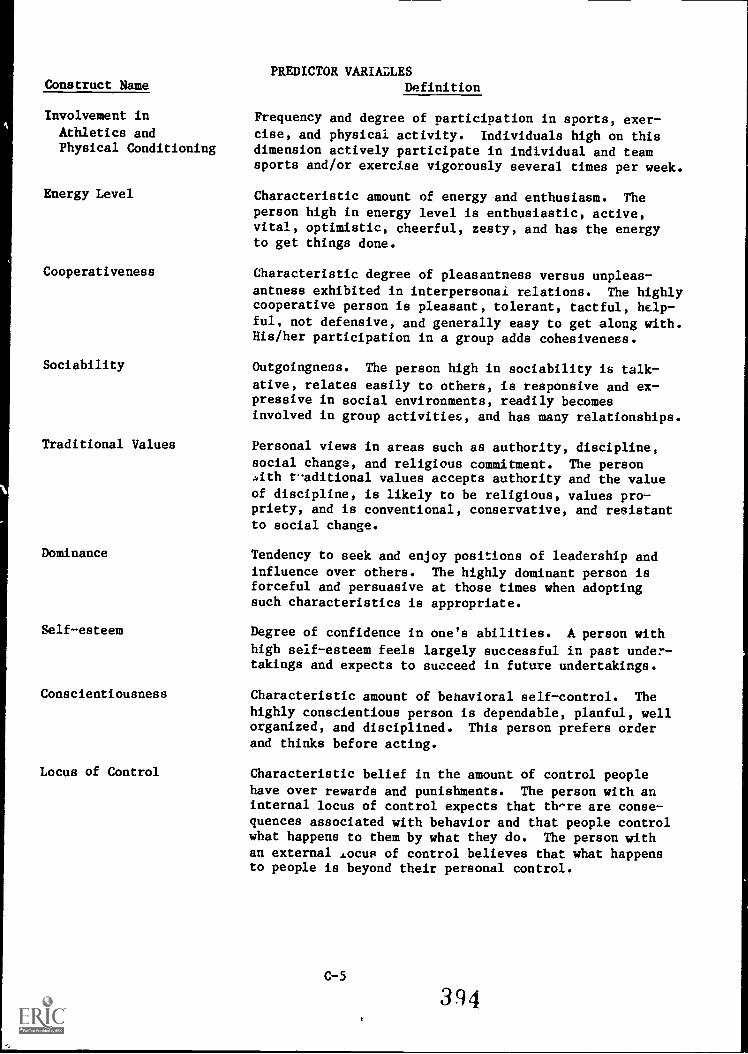
Construct Name
Involvement in
Athletics andPhysical Conditioning
Energy Level
Cooperativeness
Sociability
Traditional Values
Dominance
Self-esteem
Conscientiousness
Locus of Control
PREDICTOR VARIALLESDefinition
Frequency and degree of participation in sports; exer-cise, and physical activity. Individuals high on thisdimension actively participate in individual and teamsports and/or exercise vigorously several times per week.
Characteristic amount of energy and enthusiasm. Theperson high in energy level is enthusiastic, active,vital, optimistic, cheerful, zesty, and has the energyto get things done.
Characteristic degree of pleasantness versus unpleas-
antness exhibited in interpersonal relations. The highlycooperative person is pleasant, tolerant, tactful, help-
ful, not defensive, and generally easy to get along with.His/her participation in a group adds cohesiveness.
Outgoingness. The person high in sociability is talk-
ative, relates easily to others, is responsive and ex-pressive in social environments, readily becomesinvolved in group activities, and has many relationships.
Personal views in areas such as authority, discipline,social change, and religious commitment. The personAth taditional values accepts authority and the valueof discipline, is likely to be religious, values pro-priety, and is conventional, conservative, and resistantto social change.
Tendency to seek and enjoy positions of leadership andinfluence over others. The highly dominant person isforceful and persuasive at those times when adoptingsuch characteristics is appropriate.
Degree of confidence in one's abilities. A person with
high self-esteem feels largely successful in past under-takings and expects to succeed in future undertakings.
Characteristic amount of behavioral self-control. The
highly conscientious person is dependable, planful, wellorganized, and disciplined. This person prefers orderand thinks before acting.
Characteristic belief in the amount of control people
have over rewards and punishments. The person with aninternal locus of control expects that th^re are conse-quences associated with behavior and that people controlwhat happens to them by what they do. The person withan external Focus of control believes that what happensto people is beyond their personal control.
C-5
394
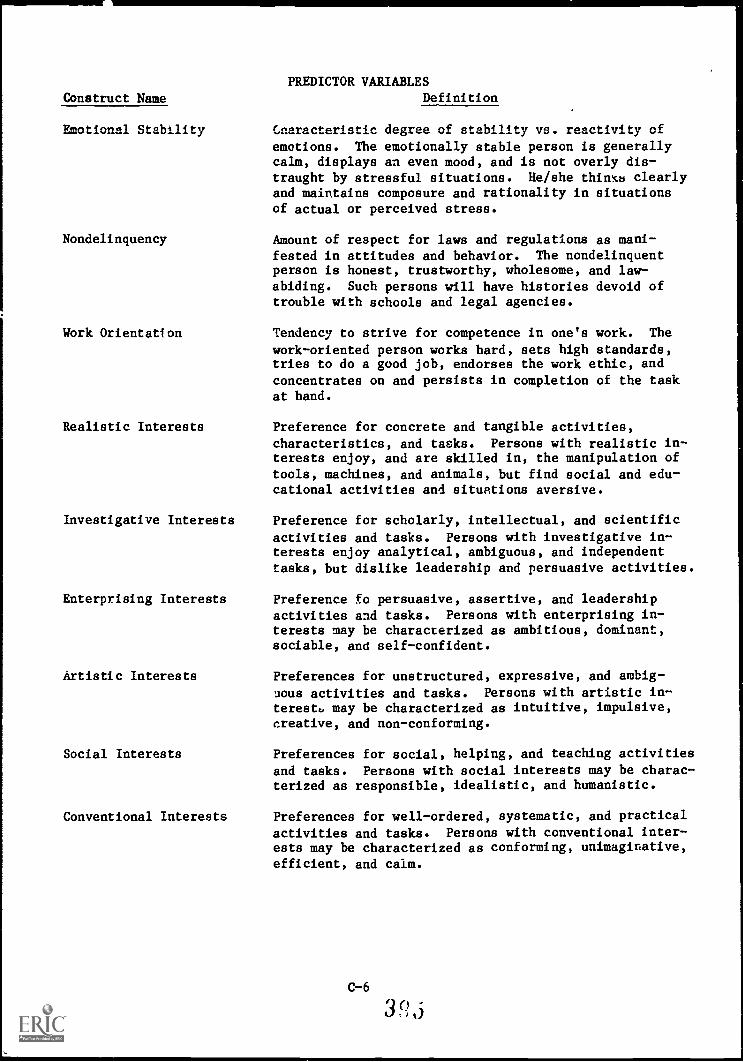
Const
Enot
No
PREDICTOR VARIABLES
runt Name Definition
ional Stability
ndelinquency
Work Orientation
Cnaracteristic degree of stability vs. reactivity of
emotions. The emotionally stable person is generallycalm, displays an even mood, and is not overly dis-traught by stressful situations. He/she thinKa clearlyand maintains composure and rationality in situationsof actual or perceived stress.
Amount of respect for laws and regulations as mani-fested in attitudes and behavior. The nondelinquentperson is honest, trustworthy, wholesome, and law-abiding. Such persons will have histories devoid oftrouble with schools and legal agencies.
Tendency to strive for competence in one's work. The
work-oriented person works hard, sets high standards,tries to do a good job, endorses the work ethic, and
concentrates on and persists in completion of the taskat hand.
Realistic Interests Preference for concrete and tangible activities,
characteristics, and tasks. Persons with realistic in-terests enjoy, and are skilled in, the manipulation oftools, machines, and animals, but find social and edu-cational activities and situations aversive.
Investigative Interests Preference for scholarly, intellectual, and scientific
activities and tasks. Persons with investigative in-terests enjoy analytical, ambiguous, and independenttasks, but dislike leadership and persuasive activities.
Enterprising Interests Preference fo persuasive, assertive, and leadershipactivities and tasks. Persons with enterprising in-terests may be characterized as ambitious, dominant,sociable, and self-confident.
Artistic Interests
Social Interests
Conventional Interests
Preferences for unstructured, expressive, and ambig-
uous activities and tasks. Persons with artistic in-terestb may be characterized as intuitive, impulsive,creative, and non-conforming.
Preferences for social, helping, and teaching activities
and tasks. Persons with social interests may be charac-terized as responsible, idealistic, and humanistic.
Preferences for well-ordered, systematic, and practical
activities and tasks. Persons with conventional inter-ests may be characterized as conforming, unimaginative,efficient, and calm.
C-6
3')
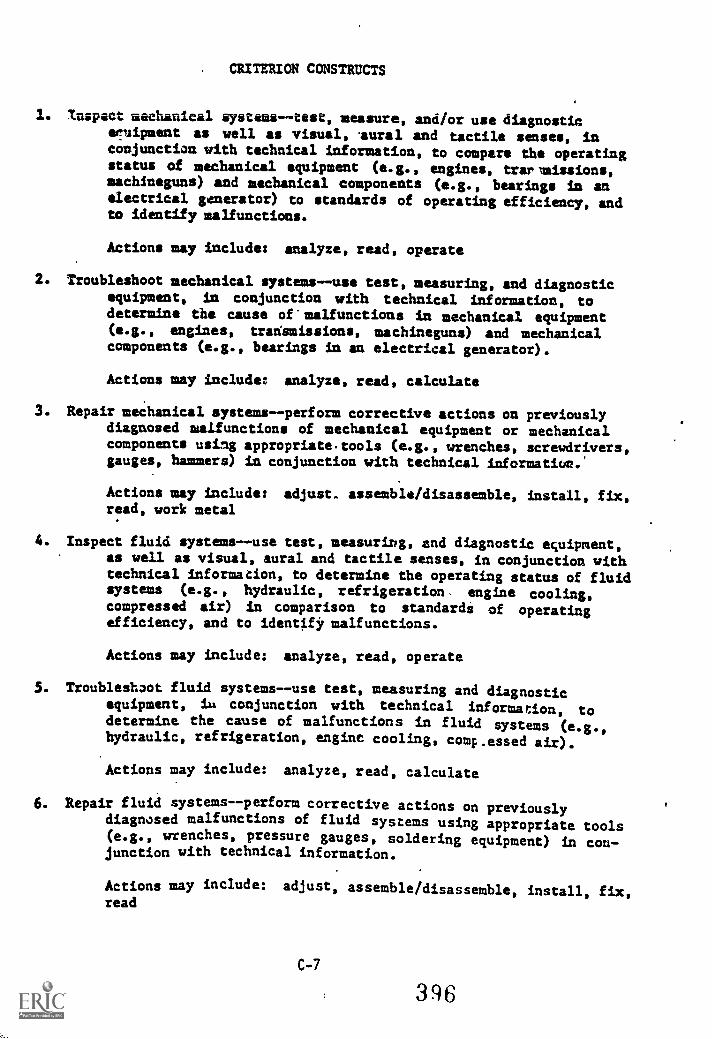
. CRITERION CONSTRUCTS
I. Uspect mechanical systems --test, measure, and/or use diagnosticeTzipment as well as visual, aural and tactile senses, inconjunction with technical information, to compare the operatingstatus of mechanical equipment (e.g., engines, trarlmissions,machineguns) and mechanical components (e.g., bearings in anelectrical generator) to standards of operating efficiency, andto identify malfunctions.
Actions may include: analyze, read, operate
2. Troubleshoot mechanical systems --use test, measuring, and diagnosticequipment, in conjunction with technical information, todetermine the cause of malfunctions in mechanical equipment(e.g., engines, transmissions, machineguns) and mechanicalcomponents (e.g., bearings in an electrical generator).
Actions may include: analyze, read, calculate
3. Repair mechanical systems--perform corrective actions on previouslydiagnosed malfunctions of mechanical equipment or mechanicalcomponents using appropriate. tools (e.g., wrenches, screwdrivers,gauges, hammers) in conjunction with technical informatiun.'
Actions may include: adjust. assemble/disassemble, install, fix,read, work metal
4. Inspect fluid systems --use test, measuring, and diagnostic equipment,as well as visual, aural and tactile senses, in conjunction withtechnical information, to determine the operating status of fluidsystems (e.g., hydraulic, refrigeration, engine cooling,compressed air) in comparison to standardi of operatingefficiency, and to identifi, malfunctions.
Actions may include: analyze, read, operate
3. Troubleshoot fluid systems--use test, measuring and diagnosticequipment, La conjunction with technical information, todetermine the cause of malfunctions in fluid systems (e.g.,hydraulic, refrigeration, engine cooling, compressed air).
Actions may include: analyze, read, calculate
6. Repair fluid systems--perform corrective actions on previouslydiagnosed malfunctions of fluid systems using appropriate tools(e.g., wrenches, pressure gauges, soldering equipment) in con-junction with technical information.
Actions may include: adjust, assemble/disassemble, install, fix,read
C-7
396
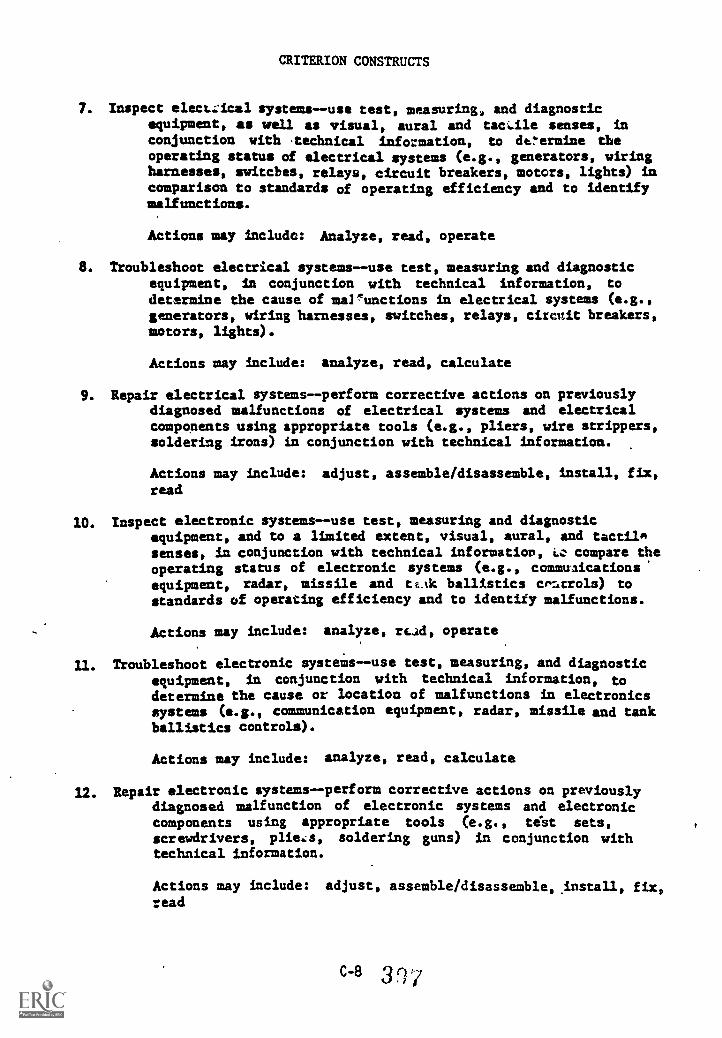
CRITERION CONSTRUCTS
7. Inspect electrical systems --use test, measuring, and diagnosticequipment, as well as visual, aural and tactile senses, inconjunction with technical information, to determine theoperating status of electrical systems (e.g., generators, wiringharnesses, switcbes, relays, circuit breakers, motors, lights) incomparison to standards of operating efficiency and to identifymalfunctions.
Actions may Include: Analyze, read, operate
8. Troubleshoot electrical systems --use test, measuring and diagnosticequipment, in conjunction with technical information, to
determine the cause of marrunctions in electrical systems (e.g.,generators, wiring harnesses, switches, relays, circuit breakers,motors, lights).
Actions may include: analyze, read, calculate
9. Repair electrical systems--perform corrective actions on previouslydiagnosed malfunctions of electrical systems and electricalcomponents using appropriate tools (e.g., pliers, wire strippers,soldering irons) in conjunction with technical information.
Actions may include: adjust, assemble/disassemble, install, fix,
read
10. Inspect electronic systems --use test, measuring and diagnosticequipment, and to a limited extent, visual, aural, and tactil*senses, in conjunction with technical informatics, Lc compare theoperating status of electronic systems (e.g., communications'equipment, radar, missile and ttAk ballistics cen:trols) to
standards of operating efficiency and to identify malfunctions.
Actions may include: analyze, read, operate
11. Troubleshoot electronic systems--use test, measuring, and diagnostic
equipment, in conjunction with technical information, todetermine the cause or location of malfunctions in electronicssystems (e.g., communication equipment, radar, missile and tankballistics controls).
Actions may include: analyze, read, calculate
12. Repair electronic systems -- perform corrective actions on previouslydiagnosed malfunction of electronic systems and electroniccomponents using appropriate tools (e.g., test sets,
screwdrivers, pliers, soldering guns) in conjunction withtechnical information.
Actions may include: adjust, assemble/disassemble, install, fix,read
C-8 3 n 7
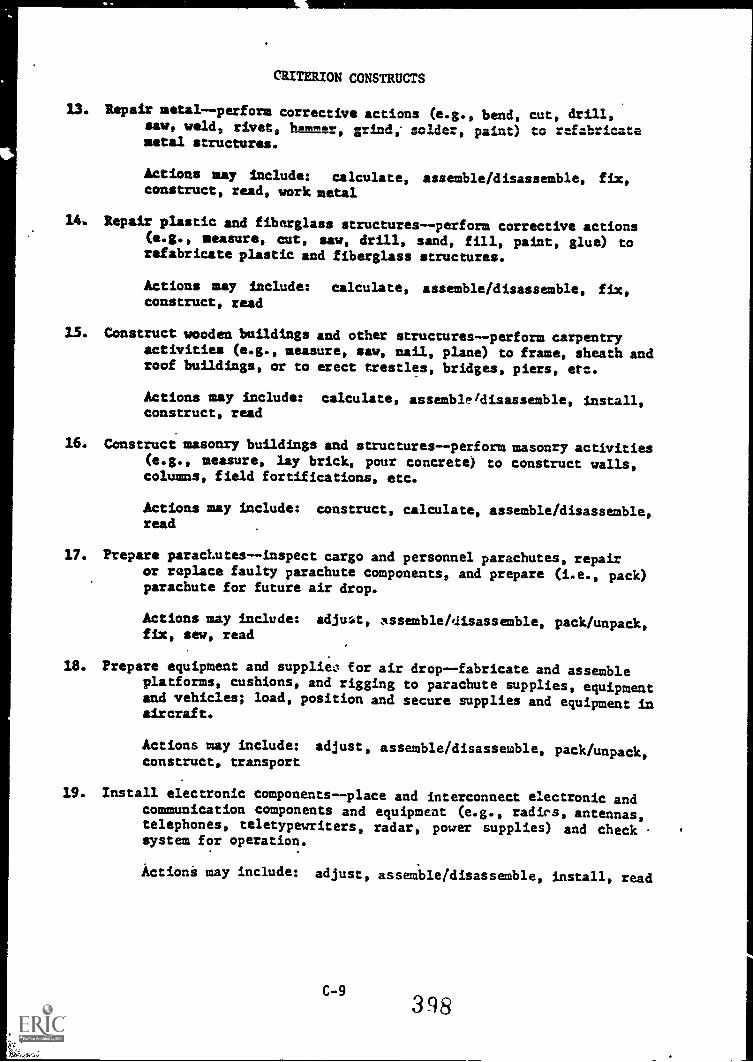
CRITERION CONSTRUCTS
13. Repair metalperform corrective actions (e.g., bend, cut, drill,saw, weld, rivet, grind,' :older, paint) to =fabricatemetal structures.
Actions may include: calculate, assemble/disassemble, fix,construct, read, work metal
14. Repair plastic and fiberglass structures -- perform corrective actions(e.g., measure, cut, saw, drill, sand, fill, paint, glue) torefabricate plastic and fiberglass structures.
Actions may include: calculate, assemble/disassemble, fix,construct, read
15. Construct wooden buildings and other structures -- perform carpentryactivities (e.g., measure, saw, nail, plane) to frame, sheath androof buildings, or to erect trestles, bridges, piers, etc.
Actions may include: calculate, assemble/disassemble, install,construct, read
16. Construct masonry buildings and structuresperform masonry activities(e.g., measure, lay brick, pour concrete) to construct walls,columns, field fortifications, etc.
Actions may include: construct, calculate, assemble/disassemble,read
17. Prepare parachutes-- inspect cargo and personnel parachutes, repairor replace faulty parachute components, and prepare (i.e., pack)parachute for future air drop.
Actions may include: adjust, essemble/disassemble, pack/unpack,fix, sew, read
18. Prepare equipment and supplier for air drop--fabricate and assembleplatforms, cushions, and rigging to parachute supplies, equipmentand vehicles; load, position and secure supplies and equipment inaircraft.
Actions may include: adjust, assemble/disassemble, pack/unpack,construct, transport
19. Install electronic components--place and interconnect electronic andcommunication components and equipment (e.g., radics, antennas,telephones, teletypewriters, radar, power supplies) and checksystem for operation.
Actions may include: adjust, assemble/disassemble, install, read
C-9398
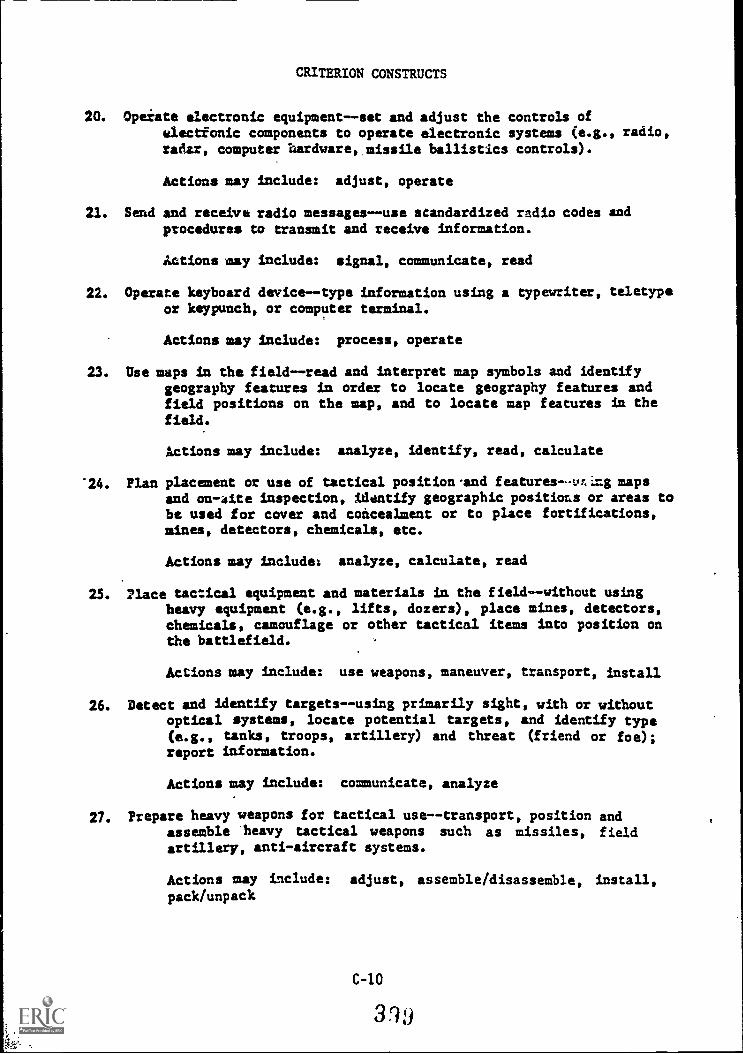
CRITERION CONSTRUCTS
20. Operate electronic equipment--set and adjust the controls ofelectionic components to operate electronic systems (e.g., radio,radar, computer bardware,,missile ballistics controls).
Actions may include: adjust, operate
21. Send and receive radio messages ---use standardized radio codes andprocedures to transmit and receive information.
Actions may include: signal, communicate, read
22. Operate keyboard device--type information using a typewriter, teletypeor keypunch, or computer terminal.
Actions may include: process, operate
23. Use maps in the field --read and interpret map symbols and identifygeography features in order to locate geography features andfield positions on the map, and to locate map features in thefield.
Actions may include: analyze, identify, read, calculate
.24. Plan placement or use of tactical positionand features .L.r,:ng mapsand on -site inspection, identify geographic positions or areas tobe used for cover and concealment or to place fortifications,mines, detectors, chemicals, etc.
Actions may include: analyze, calculate, read
25. Place tactical equipment and materials in the field - -without usingheavy equipment (e.g., lifts, dozers), place mines, detectors,chemicals, camouflage or other tactical items into position onthe battlefield.
Actions may include: use weapons, maneuver, transport, install
26. Detect and identify targets--using primarily sight, with or withoutoptical systems, locate potential targets, and identify type(e.g., tanks, troops, artillery) and threat (friend or foe);report information.
Actions may include: communicate, analyze
27. Prepare heavy weapons for tactical use--transport, position andassemble 'heavy tactical weapons such as missiles, fieldartillery, anti-aircraft systems.
Actions may include: adjust, assemble/disassemble, install,pack/unpack
C-10
3q9
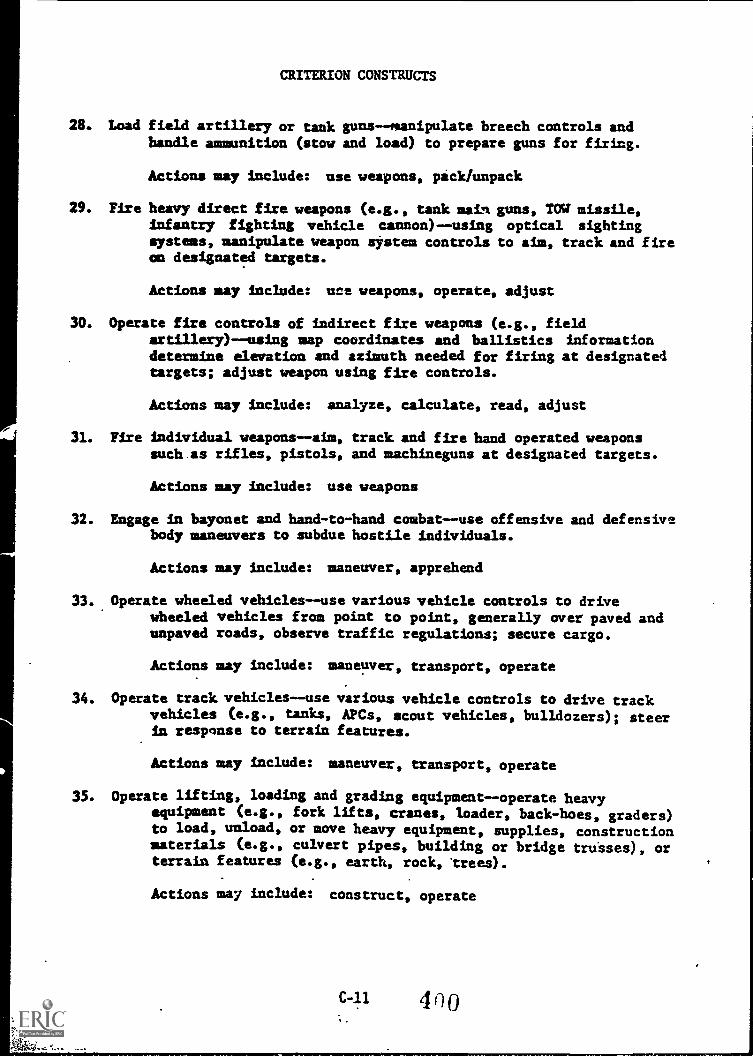
CRITERION CONSTRUCTS
28. Load field artillery or tank gunsmanipulate breech controls andhandle ammunition (stow and load) to prepare guns for firing.
Actions may include: use weapons, pick/unpack
29. Fire heavy direct fire weapons (e.g., tank lain guns, TOW missile,infantry fighting vehicle cannon) --using optical sightingsystems, manipulate weapon system controls to aim, track and fireon designated targets.
Actions may include: nee weapons, operate, adjust
30. Operate fire controls of indirect fire weapons (e.g., fieldartillery) - -using map coordinates and ballistics informationdetermine elevation and azimuth needed for firing at designatedtargets; adjust weapon using fire controls.
Actions may include: analyze, calculate, read, adjust
31. Fire individual weapons aim, track and fire hand operated weaponssuch.as rifles, pistols, and machineguns at designated targets.
Actions may include: use weapons
32. Engage in bayonet and hand-to-hand combat use offensive and defensivebody maneuvers to subdue hostile individuals.
Actions may include: maneuver, apprehend
33. Operate wheeled vehiclesuse various vehicle controls to drivewheeled vehicles from point to point, generally over paved andunpaved roads, observe traffic regulations; secure cargo.
Actions may include: maneuver, transport, operate
34. Operate track. vehicles --use various vehicle controls to drive trackvehicles (e.g., tanks, APCs, scout vehicles, bulldozers); steerin response to terrain features.
Actions may include: maneuver, transport, operate
35. Operate lifting, loading and grading equipment -- operate heavyequipment (e.g., fork lifts, cranes, loader, back-hoes, graders)to load, unload, or move heavy equipment, supplies, constructionmaterials (e.g., culvert pipes, building or bridge trusses)` orterrain features (e.g., earth, rock, trees).
Actions may include: construct, operate

CRITERION CONSTRUCTS
36. Operate power excavating equipment--use pneumatic banners and drills,paving breakers, grinders, and backfill tampers, in thefabrication and modification of concrete, stone and earthenstructures.
Actions may include: construct, operate
37. Reproduce printed materials--operate duplicating machines and offsetpresses to reproduce printed materials; collate and bindmaterials using various types of bindery equipment.
Actions may include: adjust, operate, photograph, calculate
38. Make movies and videotapes--use motion picture cameras or videotapeequipment to record visual and auditory aspects of assignedsubject matter to be used for intelligence analyses, training ordocumentation.
Actions may include: adjust, photograph
39. Draw maps and overlays--use drafting, graphics, and relatedtechniques to prepare and revise maps, with symbols and legends,from aerial photographs.
Actions may include: analyze, process, draw
40. Write and deliver presentations--prepare scripts for formalpresentation including radio and television broadcast; make oralpresentations.
Actions may include: analyze, write
41. Record and file information--collect, transcribe, annotate,index, file, and retrieve information (e.g., trainingpersonnel statistics, supply inventories).
Actions may include: process, dispose
sort,
rosters,
42. Receive, store and issue supplies, equipment and other materials--inspect material and review paperwork upon receipt; sort,transport, and store material; issue or ship material toauthorized personnel or units.
Actions may include: analyze, calculate, process, send,pack/unpick, transport
43. Prepare technical forms and documents--follow standardized proceduresto prepare or complete forms and documents (e.g., personnelrecords and dispositions, efficiency reports, legal briefs).
Actions may include: process, write, analyze
C-12
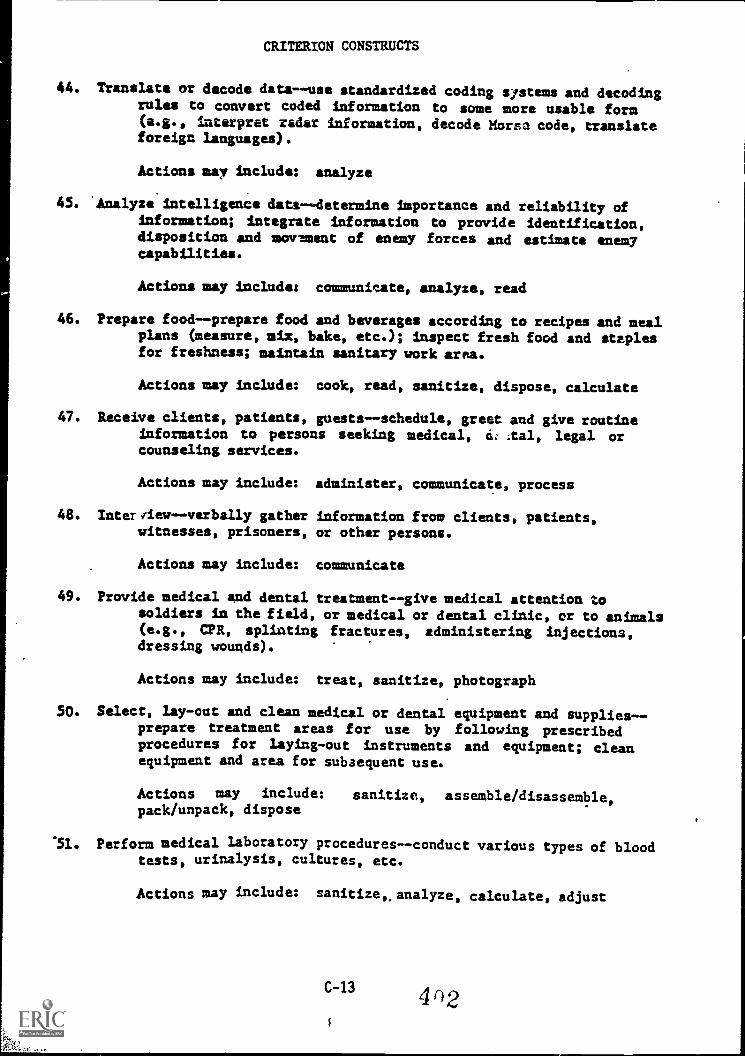
CRITERION CONSTRUCTS
44. Translate or decode data--use standardized coding systems and decodingrules to convert coded information to some more usable form(e.g., interpret radar information, decode Morse code, translateforeign languages).
Actions may include: analyze
45. 'Analyze intelligence data-- determine Importance and reliability ofinformation; integrate information to provide identification,disposition and movlment of enemy forces and estimate enemycapabilities.
Actions may include: communicate, analyze, read
46. Prepare food--prepare food and beverages according to recipes and mealplans (measure, mix, bake, etc.); inspect fresh food and staplesfor freshness; maintain sanitary work area.
Actions may include: cook, read, sanitize, dispose, calculate
47. Receive clients, patients, guests--schedule, greet and give routineinformation to persons seeking medical, c ;W., legal orcounseling services.
Actions may include: administer, communicate, process
48. Interview -- verbally gather information from clients, patients,witnesses, prisoners, or other persons.
Actions may include: communicate
49. Provide medical end dental treatment --give medical attention tosoldiers in the field, or medical or dental clinic, or to animals(e.g., CPR, splinting fractures, administering injections,dressing wounds).
Actions may include: treat, sanitize, photograph
50. Select, lay-out and clean medical or dental equipment and suppliesprepare treatment areas for use by following prescribedprocedures for laying-out instruments and equipment; cleanequipment and area for subsequent use.
Actions may include:pack/unpack, dispose
'51. Perform medical laboratory procedures--conduct various types of bloodtests, urinalysis, cultures, etc.
sanitize, assemble/disassemble,
Actions may include: sanitize,, analyze, calculate, adjust
C-13 4 02
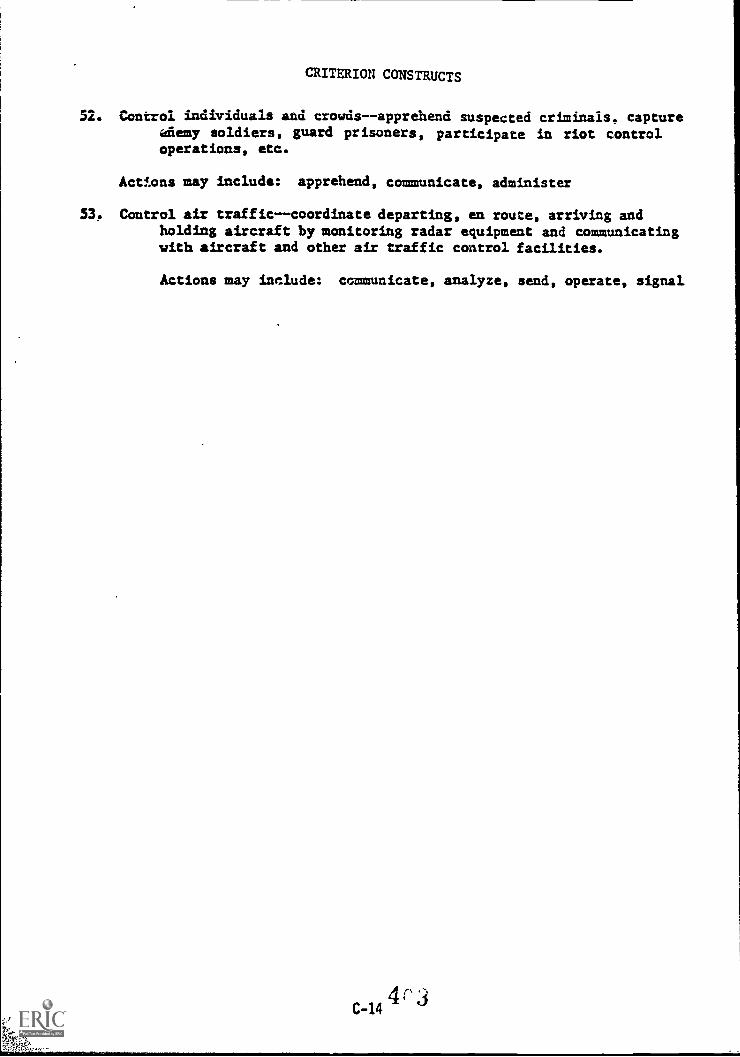
CRITERION CONSTRUCTS
52. Control individuals and crowds -- apprehend suspected criminals. captureaftemy soldiers, guard prisoners, participate in riot controloperations, etc.
Actions may include: apprehend, communicate, administer
53. Control air traffic--coordinate departing, en route, arriving andholding aircraft by monitoring radar equipment and communicatingwith aircraft and other air traffic control facilities.
Actions may include: communicate, analyze, send, operate, signal

Initial Trainlag Performance Variables
1. Training progress/success--successfully completing formal trainingcourse in normal amount of time versus wsshing out, being reas-signed, being "set back" or ?recycled."
2. Effort/motivation in training the degree of effort, motivation, andinterest that a soldier puts into his/her training, as evidencedby such things as curiosity about coursecontent, not beingafraid to be *wrong" or to ask questions, taking notes. beingattentive in class, studying on awn time, seeking out the in-structor to clarify course content.
3. Performance of theoretical. or "classroom" parts'of training--learning the theoretical part of a course; performing wellon quizzes, tests, and examinations given in a classroomsetting that tests the acquisition of concepts, principles,facts, or other information, e.g., learning the basic foodgroups, understanding the principles of internal combustion,learning the noienclature of a weapon.
k. rerforranoo of practical, "bands-on" part of trainingapplyingthe theory or principles of a course to practical problemsand situations', either during simulations, field exercises,or other "hands-on" parts of training, e.g., booking a Meal,repairing an e !gine, firing a weapon, etc.
C-15
404
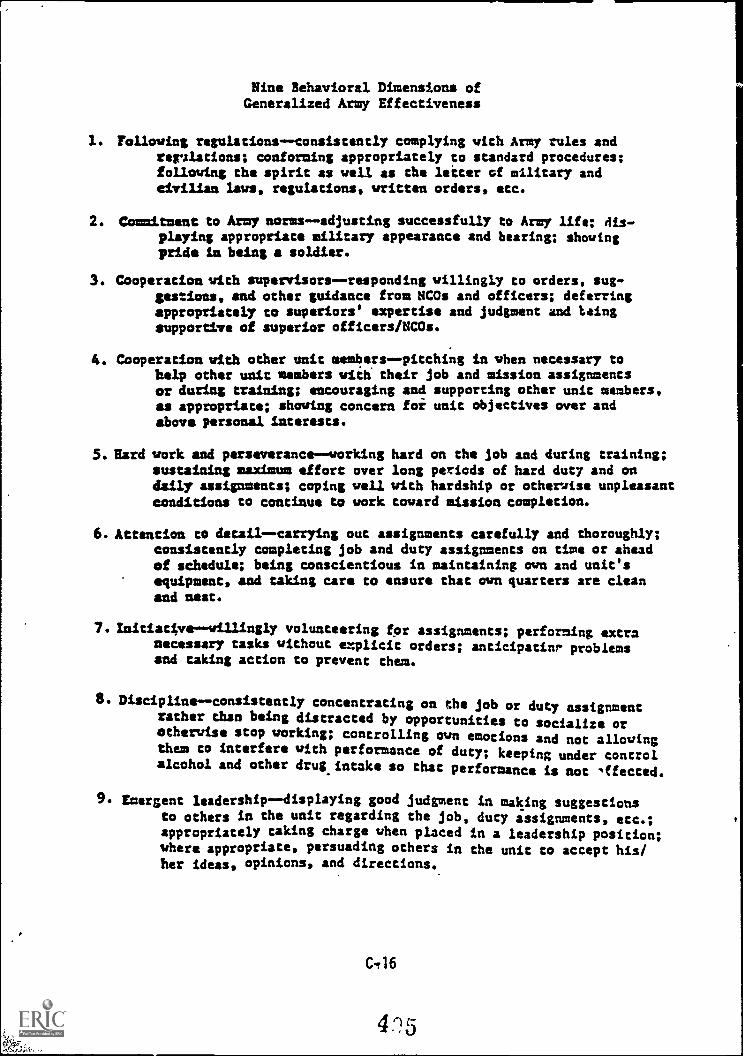
Nine Behavioral Dimensions ofGeneralized Army Effectiveness
1. Following regulations -- consistently complying with Army rules andrerilations; conforming appropriately to standard procedures;following the spirit as well as the letter cf military andcivilian laws, regulations, written orders, etc.
2. Commitment to Army norms--adjusting successfully to Army life; dis-playing appropriate military appearance and bearing; shovingpride in being a soldier.
3. Cooperation with supervisors--responding willingly to orders, sug-gestions, and other guidance from NCOs and officers; deferringappropriately to superiors' expertise and judgment and beingsupportive of superior officers/NCOs.
4. Cooperation with other unit members pitching in when necessary tohelp other unit members with their job and mission assignmentsor during training; encouraging and supporting other unit members,as appropriate; showing concern for unit objectives over andabove personal interests.
5. Bard work and perseverance-working hard on the job and during training;sustaining maximum effort over long periods of hard duty and ondaily assignments; coping well with hardship or otherwise unpleasantconditions to continue to work toward mission completion.
6. Attention to detail--carrying out assignments carefully and thoroughly;consistently completing job and duty assignments on time or aheadof schedule; being conscientious in maintaining own and unit'sequipment, and taking care to ensure that own quarters are cleanand neat.
7. Initiative -- willingly volunteering for assignments; performing extranecessary tasks without explicit orders; anticipating problemsand taking action to prevent them.
8. Discipline-- consistently concentrating on the job or duty assignmentrather than being distracted by opportunities to socialize orotherwise stop working; controlling own emotions and not allowingthem to interfere with performance of duty; keeping under controlalcohol and other drug. intake so that performance is not 'ffected.
9. Emergent leadership displaying good judgment in making suggestionsto others in the unit regarding the job, duty assignments, etc.;appropriately taking charge when placed in a leadership position;
where appropriate, persuading others in the unit to accept his/her ideas, opinions, and directions.
C-06
4 25
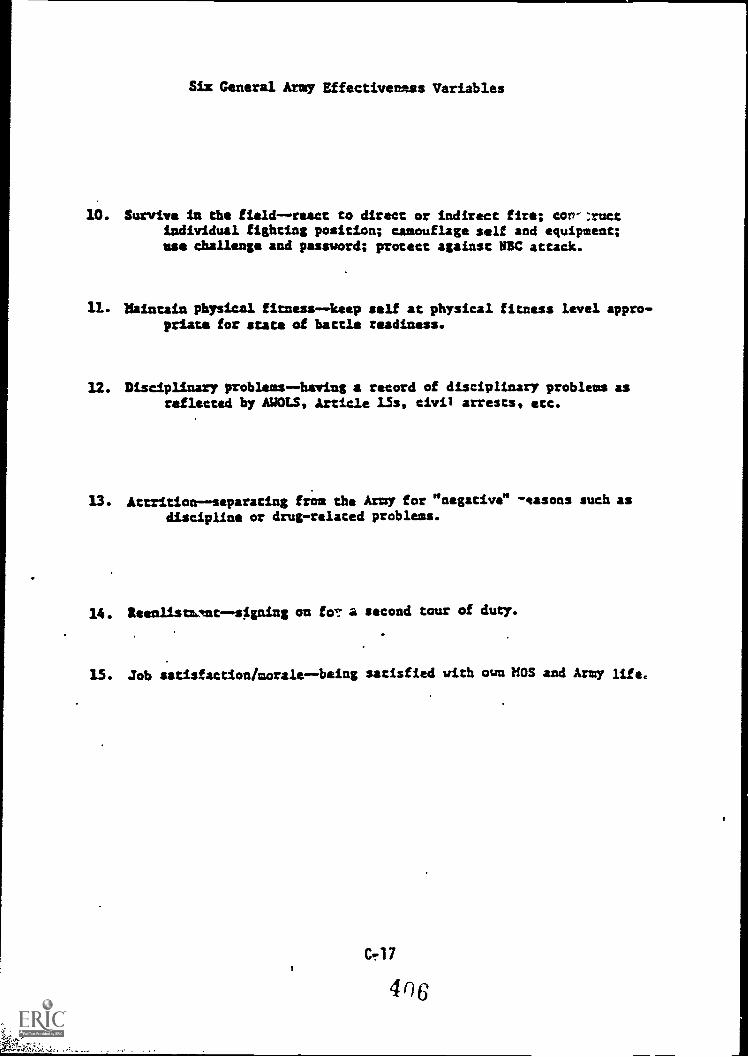
Six General Army Effectiveness Variables
10. Survive in the field--react to direct or indirect fire; corr:ructindividual fighting position; camouflage self and equipment;use challenge and password; protect against NBC attack.
1/. likintain physical fitness - -keep self at physical fitness level appro-priate for state of battle readiness.
12. Disciplinary problems having a record of disciplinary problems asreflected by AWOLS, Article I5s, civil arrests, etc.
13. Attritionseparating from the Army for "negative" -easons such asdiscipline or drug-related problems.
14. Reenlistment signing on fog a second tour of duty.
15. Job satisfaction/moralebeing satisfied with own HOS and Army life.
APPENDIX D
Scale Names and Number of Items in Each Scalefor the Preliminary Battery
0-1
407
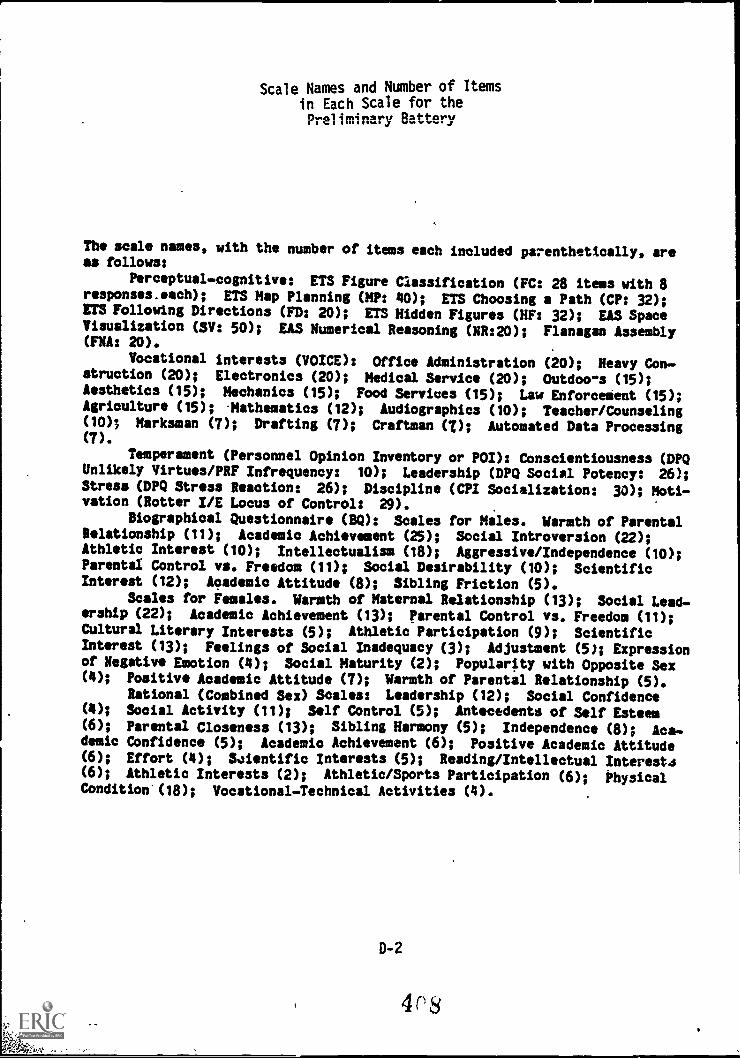
Scale Names and Number of Itemsin Each Scale for the
Preliminary Battery
The scale names, with the number of items each included parenthetically, areas follows:
Perceptual - cognitive: ETS Figure Classification (FC: 28 items with 8responses.each); ETS Map Planning (MP: 40); ETS Choosing a Path (CP: 32);ETS Following Directions (FD: 20); ETS Hidden Figures (HF: 32); EAS SpaceVisualization ($V: 50); EAS Numerical Reasoning (NR:20); Flanagan Assembly(FNA: 20).
Vocational interests (VOICE): Office Administration (20); Heavy Con-struction (20); Electronics (20); Medical Service (20); Outdoo-s (15);Aesthetics (15); Mechanics (15); Food Services (15); Law Enforceient (15);Agriculture (15); Mathematics (12); Audiographics (10); Teacher/Counseling(10); Marksman (7); Drafting (7); Craftman (/); Automated Data Processing(7).
Temperament (Personnel Opinion Inventory or POI): Conscientiousness (DPQUnlikely Virtues/PRF Infrequency: 10); Leadership (DPQ Social Potency: 26);Stress (DPQ Stress Reaction: 26); Discipline (CPI Socialization: 30); Moti-vation (Rotter I/E Locus of Control: 29).
Biographical Questionnaire (841): Scales for Males. Warmth of ParentalRelationship (11); Academic Achievement (25); Social Introversion (22);Athletic Interest (10); Intellectualism (18); Aggressive/Independence (10);Parental Control vs. Freedom (11); Social Desirability (10); ScientificInterest (12); Academic Attitude (8); Sibling Friction (5).
Scales for Females. Warmth of Maternal Relationship (13); Social Lead-ership (22); Academic Achievement (13); Parental Control vs. Freedom (11);Cultural Literary Interests (5); Athletic Participation (9); ScientificInterest (13); Feelings of Social Inadequacy (3); Adjustment (5); Expressionof Negative Emotion (4); Social Maturity (2); Popularity with Opposite Sex(4); Positive Academic Attitude (7); Warmth of Parental Relationship (5).
Rational (Combined Sex) Scales: Leadership (12); Social Confidence(4); Social Activity (11); Self Control (5); Antecedents of Self Esteem(6); Parental Closeness (13); Sibling Harmony (5); Independence (8); Aca-demic Confidence (5); Academic Achievement (6); Positive Academic Attitude(6); Effort (4); Scientific Interests (5); Reading/Intellectual Interests(6); Athletic Interests (2); Athletic/Sports Participation (6); PhysicalCondition*(18); Vocational-Technical Activities (4).
D-2
4r8
APPENDIX E
Computerized Measures Observed During Site Visitsfor ARI Project A, Spring 1983
E-1
4o9
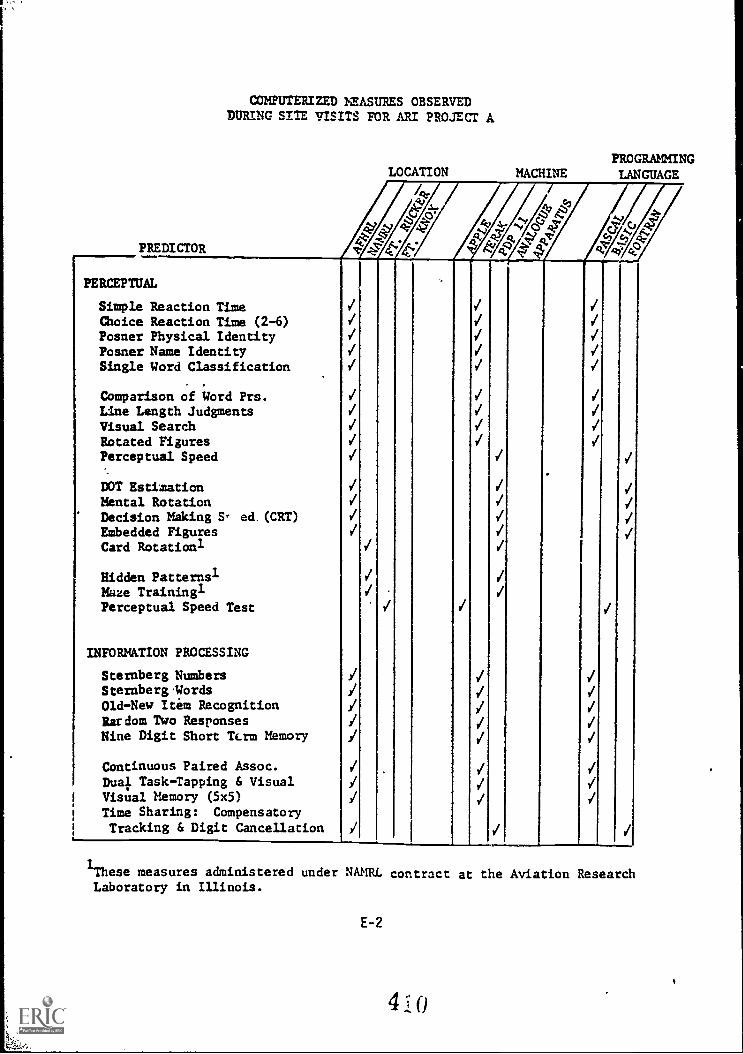
PREDICTOR
COMPUTERIZED MASURES OBSERVEDDURING SITE VISITS FOR ARI PROJECT A
PROGRAMMINGLOCATION MACHINE LANGUAGE
, N 1 '
PERCEPTUAL
Simple Reaction TimeChoice Reaction Time (2-6)Posner Physical IdentityPosner Name IdentitySingle Word Classification
. .
Comparison of Word Prs.Line Length JudgmentsVisual SearchRotated FiguresPerceptual Speed
DOT EstimationMental RotationDecision Making S- ed.(CRT)Embedded FiguresCard Rotationl
Hidden PatternslMaze TraininglPerceptual Speed Test
INFORMATION PROCESSING
Sternberg Numbers J V VSternbergWords J VOld-New Item RecognitionRardom Two Responses
Ij
/ V
Nine Digit Short 'arm Memory I V V
Continuous Paired Assoc. VDual Task-Tapping & Visual / V
I Visual Memory (5x5) / V VTime Sharing: CompensatoryTracking & Digit Cancellation I
'These measures administered under NA1IRL contract at the Aviation ResearchLaboratory in Illinois.
E-2
410
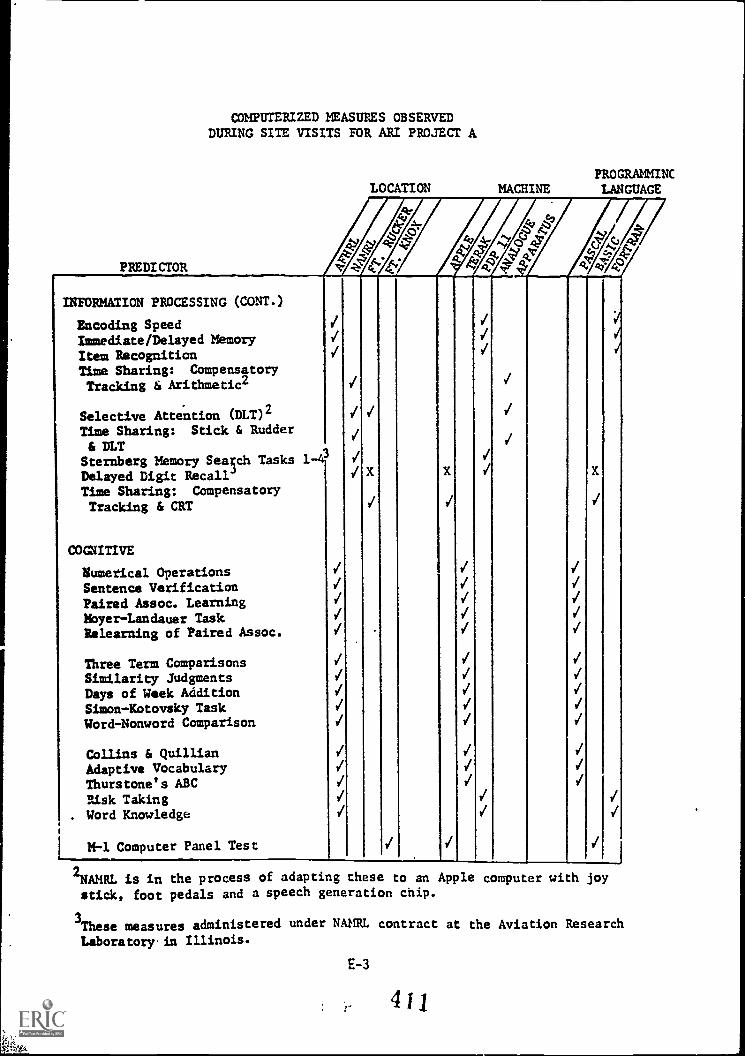
PREDICTOR
COMPUTERIZED MEASURES OBSERVEDDURING SITE VISITS FOR ARI PROJECT A
LOCATION MACHINEPROGRAMMINCLANGUAGE
INFORMATION PROCESSING (CONT.)
Encoding SpeedImmediate/Delayed MemoryItem Recognition
/
Time Sharing: CompensatoryTracking & Arithmetic2
Selective Attention (DLT)2
Time Sharing: Stick & Rudder
& DLTSternberg Memory Sea;ch Tasks 1-43
Delayed Digit Recall X X X
Time Sharing: CompensatoryTracking & CRT
COGNITIVE
Numerical OperationsSentence VerificationPaired Assoc. LearningMoyer-Landauer TaskRelearning of Paired Assoc.
Three Term ComparisonsSimilarity JudgmentsDays of Week AdditionSimon-Kotovsky TaskWord-Nonword Comparison
Collins & QuillianAdaptive VocabularyThurstone's ABCRisk Taking
. Word Knowledge
IM-1 Computer Panel Test. .
2NAMRL is in the process of adapting these tostick, foot pedals and a speech generation chip.
3These measures administered under NAMRL contract at the Aviation Research
Laboratorin Illinois.
n Apple computer with joy
E-3
41i
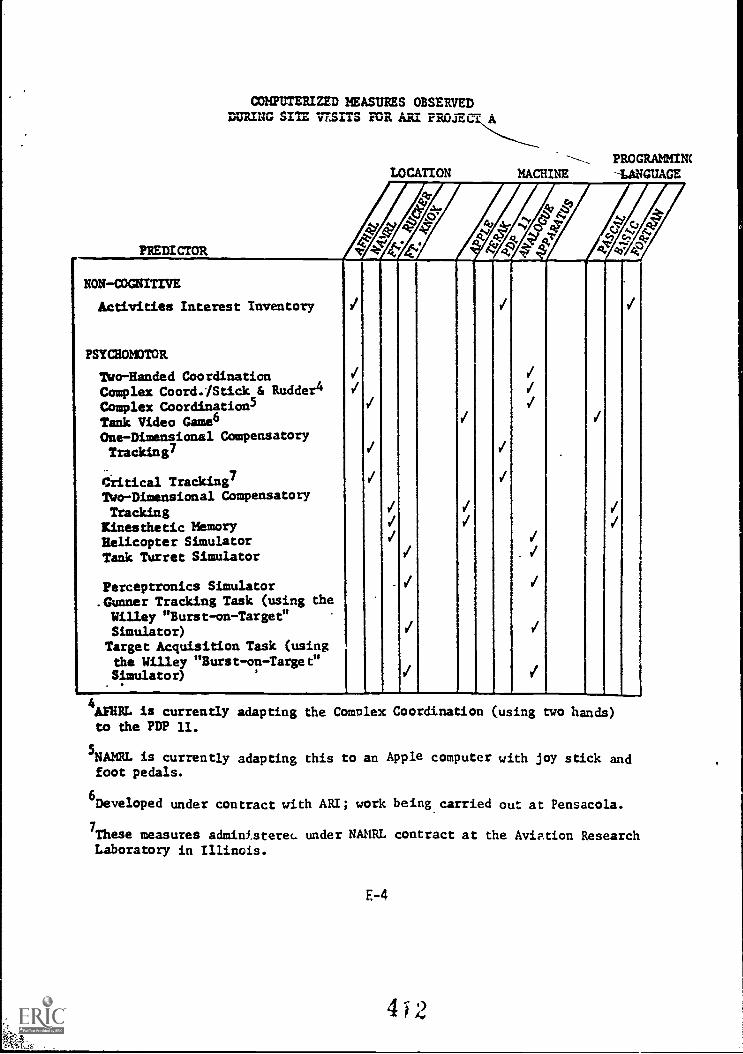
PREDICTOR
COMPUTERIZED MEASURES OBSERVEDDURING SITE VTSITS FORAM PROJEC A
LOCATION-. PROGRAMMINC
MACHINE --LANGUAGE
NON-COGNITIVE
Activities Interest Inventory
PSYCHOI)TOR
Two-Handed CoordinationComplex Coord.IStick & Rudder4Complex Coordination5Tank Video Game6One-Dimensional CompensatoryTracking7 .
Ciitical Tracking7Two - Dimensional Compensatory
TrackingKinesthetic MemoryHelicopter SimulatorTank Turret Simulator
Perceptronics Simulator.Gunner Tracking Task (using the
Willey "Burst-on-Target"Simulator)Target Acquisition Task (usingthe Willey "Burst-on-Target"Simulator)
.
. .
4AFHRL is currently adapting the Complex Coordination (using two hands)to the PDP 11.
5NAME. is currently adapting this to an Applefoot pedals.
computer with joy stick and
6Developed under contract with ARI; work being carried out at Pensacola.
7These measures adminf,sterec. under NAMRL contract at the Aviation ResearchLaboratory in Illinois.
E-4
4 I 2
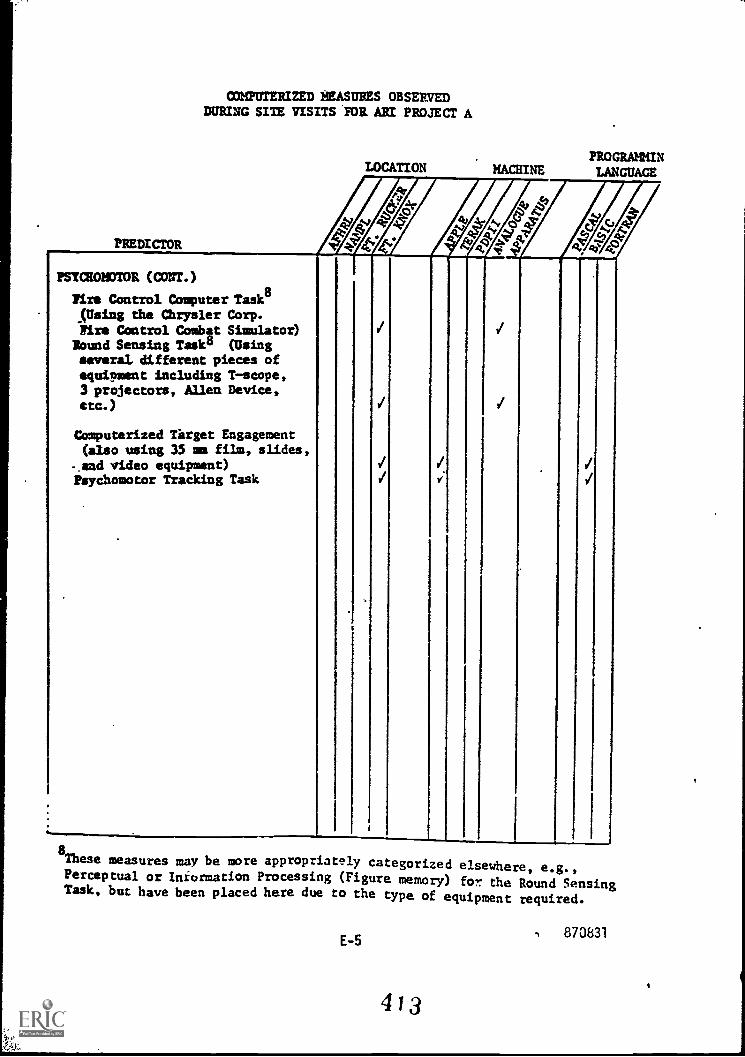
PREDICTOR
COMPUTERIZED MEASURES OBSERVEDDURING SITE VISITS 'MR ARI PROJECT A
LOCATION MACHINEPROGRAM/1iLANGUAGE
#
PSYCHOWTOR (CONT.)
lire Control Computer Task8(Using the Chrysler Corp.*ire Control Combat Simulator)
Round Sensing Task8 (Usingseveral different pieces ofequipment including T-scope,3 projectors, Allen Device,etc.)
Computerized Tirget Engagement(also using 35 mm film, slides,
- and video equipment)Psychomotor Tracking Task
8These measures may be more appropriately categorized elsewhere, e.g.,Perceptual or Information Processing (Figure memory) for, the Round SensingTask, but have been placed here due to the type of equipment required.
E-5
413
, 870831