petrol piyasasında son gelişmeler
TRANSCRIPT

11 October 2013
HIGHLIGHTS
Benchmark Brent and WTI oil futures eased in September and early October following plans for Syria to dispose of its chemical weapons and direct talks between Iran and the US at the UN General Assembly. The US government shutdown added downward pressure on prices. Brent was last trading at $110/bbl and WTI at $101.25/bbl.
Global oil supplies declined by 625 kb/d to 91.12 mb/d in September on steeply lower OPEC output. Non‐OPEC supply growth for 2013 is forecast to average 1.1 mb/d, to 54.7 mb/d, rising to a near‐record 1.7 mb/d next year.
OPEC crude supplies slipped below 30 mb/d for the first time in almost two years, led by steep drops in Libya and Iraq. Output fell by 645 kb/d to 29.99 mb/d despite Saudi output topping 10 mb/d for a third month running. The ‘call on OPEC crude and stock change’ was raised by 100 kb/d to 29.6 mb/d for 4Q13.
Recent demand strength has raised the 2013 oil demand forecast by 90 kb/d, to 91.0 mb/d. Demand growth is projected at 1.0 mb/d (or 1.1%) for 2013, ramping up to 1.1 mb/d in 2014 as the macroeconomic backdrop improves.
Exceptionally high US refinery crude runs in September lift the global throughput estimate for 3Q13 by 100 kb/d, to 77.3 mb/d. Despite steep contractions in Europe of 0.7 mb/d, 3Q13 throughputs jumped by 1.2 mb/d year‐on‐year, led by non‐OECD Asia and the US. Growth is set to slow somewhat in 4Q13, to 0.9 mb/d.
August OECD industry oil inventories drew counter‐seasonally by 7.8 mb to 2 660 mb. Stocks of refined products posted a small build and now cover 31.1 days of forward OECD demand, 0.4 day above end‐July. Preliminary data for September point to a small counter‐seasonal build in total OECD inventories of 1.7 mb.

TABLE OF CONTENTS
HIGHLIGHTS ....................................................................................................................................................................................... 1
THE NEW MATH ON SUPPLY ...................................................................................................................................................... 3
DEMAND ............................................................................................................................................................................................. 4 Summary ........................................................................................................................................................................................... 4 Global Overview ............................................................................................................................................................................ 4 Top 10 Consumers ........................................................................................................................................................................ 6
US Furlough – Impending Feed-through to Demand ................................................................................................................ 7 Uncertainty over Nuclear Restarts Clouds Japanese Oil Outlook ............................................................................................ 9
OECD ............................................................................................................................................................................................. 12 Americas ................................................................................................................................................................................... 13 Europe ....................................................................................................................................................................................... 13 Asia Oceania ............................................................................................................................................................................. 14
Non-OECD ................................................................................................................................................................................... 14
SUPPLY ................................................................................................................................................................................................ 16 Summary ......................................................................................................................................................................................... 16 OPEC Crude Oil Supply ............................................................................................................................................................. 17
Iraqi Crude Exports Turn South in September ........................................................................................................................ 19 Non-OPEC Overview ................................................................................................................................................................. 21 OECD ............................................................................................................................................................................................. 21
North America ........................................................................................................................................................................ 21 North Sea .................................................................................................................................................................................. 23 Looking at 2014 Non-OPEC Supply Growth ........................................................................................................................... 24
Non-OECD ................................................................................................................................................................................... 25 Latin America ........................................................................................................................................................................... 25 Asia ............................................................................................................................................................................................. 26 Former Soviet Union (FSU) .................................................................................................................................................. 26 Kashagan Start-up Poses Questions ......................................................................................................................................... 28
OECD STOCKS ................................................................................................................................................................................ 29 Summary ......................................................................................................................................................................................... 29 OECD Inventory Position at End-August and Revisions to Preliminary Data ................................................................ 29 Recent OECD Industry Stock Changes ................................................................................................................................... 30
OECD Americas ...................................................................................................................................................................... 30 OECD Europe .......................................................................................................................................................................... 31 OECD Asia Oceania ............................................................................................................................................................... 32
Recent Developments in Singapore and China Stocks ......................................................................................................... 33
PRICES ................................................................................................................................................................................................. 35 Summary ......................................................................................................................................................................................... 35 Market Overview ......................................................................................................................................................................... 35 Futures Markets ............................................................................................................................................................................ 37
Financial Regulation ................................................................................................................................................................. 38 Spot Crude Oil Prices ................................................................................................................................................................. 39 Spot Product Prices ..................................................................................................................................................................... 40 Freight ............................................................................................................................................................................................. 42
REFINING ........................................................................................................................................................................................... 44 Summary ......................................................................................................................................................................................... 44 Global Refinery Overview .......................................................................................................................................................... 44
Refinery Margins ...................................................................................................................................................................... 46 OECD Refinery Throughput ...................................................................................................................................................... 47
Here We Go Again – European Refiners Cut Capacity Further ............................................................................................ 50 Non-OECD Refinery Throughput ............................................................................................................................................ 52
New Saudi Refinery Ships First Fuel Cargo in September ...................................................................................................... 53
TABLES ................................................................................................................................................................................................ 54

INTERNATIONAL ENERGY AGENCY ‐ OIL MARKET REPORT MARKET OVERVIEW
11 OCTOBER 2013 3
THE NEW MATH ON SUPPLY Non‐OPEC crude and other liquid supply scaled new heights lately, but you would not know it from world oil prices. Total crude and other liquids supply from non‐OPEC countries, including biofuel and processing gains, surged by 1.7 mb/d in 3Q13 y‐o‐y, the steepest annual growth for any quarter in over 10 years. Throw in OPEC NGL and the figure tops 1.85 mb/d. Amid exceptional outages in Libya and Iraq, this gusher didn’t do much to douse oil markets, though. A crude futures rally during the same quarter took Brent prices to highs of around $117/bbl at the peak. Prices have since receded but remain elevated. Non‐OPEC growth may take something of a breather for the remainder of the year, but the summer’s surge looks less like a one‐off than a preview. If anything, the non‐OPEC supply outlook has brightened in recent months, with Sudan and South Sudan coming to terms and the chronically delayed super‐giant Kashagan field finally coming on line. Non‐OPEC supply growth is now projected at an average 1.7 mb/d for 2014, peaking at 1.9 mb/d in the second quarter. This would be the highest annual growth since the 1970s. The US’s place in the driver’s seat of growth is also a throwback to decades past. With output of more than 10 mb/d for the last two quarters, its highest in decades, the nation is set to become the largest non‐OPEC liquids producer by 2Q14, overtaking Russia. And that’s not even counting biofuels and refinery gains.
-1.5-1.0-0.50.00.51.01.52.02.53.0
Jun 12 Sep 12 Dec 12 Mar 13 Jun 13 Sep 13
mb/dOPEC and Non-OPEC Oil Supply
Year-on-Year Change
OPEC Crude Non-OPEC
OPEC NGLs Total Supply
7
8
9
10
11
12
2009 2010 2011 2012 2013 2014
mb/d Top Three ProducersTotal Liquids Production
Saudi Arabia US Russia
Non‐OPEC growth, however, needs to be seen in perspective. The IEA has often noted that the market impact of supply disruptions depended on the context in which they occurred, as much as on the outages themselves. The same is true of supply additions. Non‐OPEC supply growth in 3Q13 was partly offset by a 1 mb/d plunge in OPEC crude, driven by a collapse in Libyan supply and Iraqi rehabilitation and maintenance work at key southern export terminals. Although Tripoli has since announced a partial restart of production, tribal unrest and political instability continue to throw formidable hurdles for the return of Libyan oil to market. With OPEC losses partly cancelling out North American gains, crude prices have remained well supported by geopolitical turmoil in the MENA region. It also helps that non‐OECD demand for storage has surged, effectively preventing any seasonal build in aggregate OECD stocks ahead of winter. Mutually offsetting supply developments do not amount to a zero‐sum game. The replacement of OPEC barrels with non‐OPEC oil is sending all kinds of ripples through the market. Benchmark Brent and WTI prices, after converging, are once again moving apart, with coastal US grades like Light Louisiana Sweet at a deepening discount to Brent. Importers of Libyan oil have come under pressure. Yet another European refinery closure was announced this month, the 16th since the financial crisis, even as ‘advantaged’ US refiners have kept throughputs at near‐record highs. Further changes to the global refining scene are ongoing, with the commissioning of new capacity in the Middle East and Asia. What seems certain is that surging non‐OPEC production does not necessarily equate to a supply glut. Against the backdrop of recent developments in the Middle East and North Africa, the link between oil prices and non‐OPEC supply growth is undergoing a new twist.

DEMAND INTERNATIONAL ENERGY AGENCY ‐ OIL MARKET REPORT
4 11 OCTOBER 2013
DEMAND
Summary
The forecast of global oil demand for 2013 has been adjusted upwards by 90 kb/d following stronger‐than‐expected data for July and August. Estimates of July demand were raised by 215 kb/d for the US, 110 kb/d for Egypt, 85 kb/d for Chinese Taipei and 65 kb/d for France. Partial offsets were provided by Germany (‐70 kb/d), Nigeria (‐45 kb/d) and the Netherlands (‐45 kb/d). For August, estimates were raised by 110 kb/d for Russia, 95 kb/d for Germany and 60 kb/d for China, declines in India (‐125 kb/d) and Japan (‐60 kb/d) provided a partial offset. Average growth of around 1.0 mb/d (or 1.1%) is forecast for 2013, to 91.0 mb/d.
Signs of improvement in the European economy support the upward revision to the demand forecast, while reports of higher‐than‐anticipated power sector usage in other regions also contributed. Problems with natural gas supplies lifted oil demand for electricity generation in Mexico, much of northern Africa and the Middle East. Nuclear outages, coupled with unusually warm temperatures, also raised Japanese oil use. Meanwhile, European demand data have surprised on the upside recently amid reports that the euro zone’s recession ended in 2Q13 and signs of improvement in business confidence.
Global Oil Demand (2012-2014)
(million barrels per day)
1Q12 2Q12 3Q12 4Q12 2012 1Q13 2Q13 3Q13 4Q13 2013 1Q14 2Q14 3Q14 4Q14 2014Africa 3.6 3.6 3.6 3.7 3.7 3.8 3.8 3.8 3.9 3.8 3.9 4.0 4.0 4.1 4.0Americas 29.5 30.0 30.3 30.3 30.0 30.1 30.3 30.6 30.3 30.3 30.1 30.5 30.7 30.5 30.5Asia/Pacif ic 29.9 29.1 29.2 30.6 29.7 30.6 29.6 29.6 30.9 30.2 31.1 30.2 30.3 31.4 30.8Europe 14.3 14.5 14.5 14.3 14.4 13.8 14.5 14.5 14.1 14.2 13.8 14.1 14.4 14.2 14.1FSU 4.3 4.4 4.6 4.6 4.5 4.3 4.5 4.8 4.8 4.6 4.4 4.6 4.9 4.9 4.7Middle East 7.3 7.8 8.2 7.5 7.7 7.5 7.8 8.4 7.7 7.9 7.7 8.1 8.6 8.0 8.1World 89.0 89.4 90.4 91.1 90.0 90.0 90.6 91.7 91.7 91.0 91.1 91.4 92.8 93.1 92.1Annual Chg (%) 0.7 1.8 0.6 1.5 1.2 1.1 1.3 1.4 0.7 1.1 1.2 1.0 1.3 1.5 1.2Annual Chg (mb/d) 0.6 1.6 0.6 1.3 1.0 1.0 1.2 1.2 0.6 1.0 1.1 0.9 1.2 1.4 1.1Changes from last OMR (mb/d) 0.00 -0.05 -0.03 0.01 -0.02 0.06 0.10 0.19 0.00 0.09 0.02 0.16 0.12 0.07 0.09
Improved economic signals were partly offset by the US Government shutdown. US government funding issues in October raised macroeconomic fears, as “non‐essential” services were closed on 1 October and as many as 800 000 workers put on unpaid leave. The looming 17 October deadline for addressing the debt ceiling is also weighing on consumer sentiment. Such issues contributed to the IMF reducing its global GDP projections for both 2013 and 2014.
Global Overview
The global economy continues to show signs of recovery, albeit still on a modest scale, which when coupled with higher‐than‐anticipated power sector use in some regions raised the overall global oil demand forecast by around 90 kb/d compared to last month’s Report. Demand is now projected to average roughly 91.0 mb/d for 2013, up 1.0 mb/d on the year (or 1.1%). The 3Q13 global demand estimate was adjusted upwards by 195 kb/d since last month’s Report, to 91.7 mb/d, based on revised demand data for July and August. Several countries accounted for the bulk of the adjustments for July, led by the US (+215 kb/d). Other large July upward adjustments include Egypt (+110 kb/d), Chinese Taipei (+85 kb/d), Japan (+80 kb/d) and France (+65 kb/d). Germany provided a partial offset with a downward adjustment of 70 kb/d in July, as did Nigeria (‐45 kb/d) and the Netherlands (‐45 kb/d). Partial preliminary data for August also lead to a net upward adjustment. Notable August additions include Russia (+110 kb/d), Germany (+95 kb/d), China (+60 kb/d) and Italy

INTERNATIONAL ENERGY AGENCY ‐ OIL MARKET REPORT DEMAND
11 OCTOBER 2013 5
(+55 kb/d), partly offset by downward adjustments for India (‐125 kb/d), Japan (‐60 kb/d) and the US (down by 35 kb/d).
World: Total Oil Product Demand
83
85
87
89
91
93
Jan Apr Jul Oct Jan
mb/d
Range 2008-2012 5-year avg2012 2013
World: Other Products Demand
7.5
8.5
9.5
10.5
11.5
Jan Apr Jul Oct Jan
mb/d
Range 2008-2012 5-year avg2012 2013
Delivery data for fuel oil and ‘other products’ (which includes the crude oil burned in the power sector) came in particularly strong in July. Unusually warm Asian weather called for additional oil use for cooling, particularly in Japan, where high temperatures compounded the impact of nuclear shutdowns. Natural gas supply issues also triggered higher consumption of oil for power generation in several regions ranging from Mexico to North Africa and the Middle East. Extra weather‐related demand is unlikely to continue into 4Q13, however, as power‐sector needs typically drop in most of these markets in 4Q.
OECD Europe: Oil Product Demand
12.5
13.5
14.5
15.5
Jan Apr Jul Oct Jan
mb/d
2010 2011 2012 2013
World: Total Oil Product Demand
86
87
88
89
90
91
92
93
94
1Q 2Q 3Q 4Q
mb/d
2011 2012 2013 2014
Signs of improvement in the European economy also supported mid‐2013 oil demand. Although structural contraction in European oil demand continues y‐o‐y, the pace of decline seems to be slowing, with demand occasionally swinging from annual contraction to growth. Following six consecutive quarters of diminishing GDP, its longest post‐war contraction, the 17‐country euro zone returned to growth in 2Q13, the most recent period for which comprehensive economic data are available. The two largest economies in the euro zone, France and Germany, led the rebound, respectively rising by an annualised 2.0% and 2.8%. Forward‐looking indicators for 2H13 add a further modest sheen to the picture, with the closely watched business confidence indicators pointing towards very slight positive GDP growth through to the end of the year. Notably Markit’s euro zone Composite Purchasing Managers’ Index (PMI), which provides one of the best insights into general economic conditions six months ahead, has risen in each month since March, and remained above the key 50 tipping point, signalling expansion, throughout 3Q13. Accordingly, the forecast decline in European oil demand is expected to slow down. Overall, global demand momentum is forecast to accelerate marginally in 2014, with growth predicted to come in around 1.1 mb/d (or 1.2%) on the back of a firming macroeconomic picture. There is significant downside risk to this forecast, however, in view of the recent political standoff in the US and the sharp

DEMAND INTERNATIONAL ENERGY AGENCY ‐ OIL MARKET REPORT
6 11 OCTOBER 2013
currency depreciation seen in many emerging market economies (see OMR dated 12 September). A significant deterioration in business and/or consumer confidence could potentially undermine the macroeconomic momentum required to drive the additional oil demand growth in 2014. The IMF also released slightly weaker GDP numbers in it’s October World Economic Outlook.
Top-10 Oil Consumers(thousand barrels per day)
Jul-13 2013 2014 Jul-13 2013 2014 Jul-13 2013 2014
US50 19,009 18,647 18,620 439 105 -27 2.4 0.6 -0.1
China 10,357 10,204 10,598 535 394 394 5.4 4.0 3.9
Japan 4,375 4,547 4,393 17 -168 -154 0.4 -3.6 -3.4
Russia 3,576 3,407 3,514 156 107 107 4.6 3.2 3.2
Saudi Arabia 3,465 3,029 3,140 169 107 111 5.1 3.7 3.7
India 3,241 3,392 3,506 -59 50 115 -1.8 1.5 3.4
Brazil 3,106 3,091 3,186 142 106 95 4.8 3.5 3.1
Germany 2,454 2,395 2,385 -42 7 -10 -1.7 0.3 -0.4
Canada 2,278 2,298 2,304 -30 12 5 -1.3 0.5 0.2
Korea 2,245 2,309 2,315 17 8 7 0.8 0.3 0.3
% global demand 60% 59% 59%
Demand Annual Chg (kb/d) Annual Chg (%)
Top 10 Consumers
US
Revised July data reveal that US oil deliveries for that month rose to 19.0 mb/d, an 11‐month high and 215 kb/d more than the preliminary estimate carried in last month’s Report. The lighter end of the barrel led the upside revisions, with the final LPG (including ethane), naphtha and gasoline demand numbers significantly above expectations.
US50: Total Oil Product Demand
17,500
18,500
19,500
20,500
Jan Apr Jul Oct Jan
kb/d
Range 08-12 5-year avg2012 2013
US Institute of Supply Management Manufacturing Index
49
53
57
Mar12 Jul12 Nov12 Mar13 Jul13
N ot e : 5 0 =c ont r a c t i on/ e x pa nsi on t hr e shol d. S our c e : I S M .
Supported by a sharp uptick in manufacturing activity (the US Institute of Supply Management’s manufacturing index hit a two‐year high in July), oil demand growth clambered to a near three‐year high of 2.4% in July. Even gasoil/diesel demand, long in contraction, turned recently positive, as trucking activity (tracked by the American Trucking Association) improved. Annual growth in US demand slowed in August, however, with deliveries about flat on the month at roughly 19.0 mb/d, about 0.9% below last year’s level (and roughly on a par with the estimate carried in last month’s Report). This slowdown in US demand growth bucked the seasonal trend, which typically sees US consumption rise from July to August. Weak month‐on‐month demand growth coincided with a lack of improvement in employment statistics for August, while growth in manufacturing sentiment flattened out alongside uncertainty surrounding the US budget process. A relatively marginal gain of

INTERNATIONAL ENERGY AGENCY ‐ OIL MARKET REPORT DEMAND
11 OCTOBER 2013 7
around 0.6% is forecast for the year as a whole, with US50 consumption forecast to average out at around 18.6 mb/d in 2013.
US50: Motor Gasoline Demand
8,200
8,600
9,000
9,400
Jan Apr Jul Oct Jan
kb/d
Range 08-12 5-year avg2012 2013
US50: Gasoil Demand
3,300
3,500
3,700
3,900
4,100
4,300
Jan Apr Jul Oct Jan
kb/d
Range 08-12 5-year avg2012 2013
US Furlough – Impending Feed-through to Demand
The Oxford English Dictionary describes the word “furlough” as a “leave of absence, especially that granted to a member of the armed services”, and it stems from the 17th century, originating from the Dutch word “verlof” which literally means “permission”. Furlough has become something of a buzzword since escalating concerns about US government funding resulted in roughly 800 000 US government employees – though notably not the armed services – being put on unpaid leave on 1 October. “Non‐essential” services, such as park rangers, Federal museum staff and 95% of Department of Education employees, have been forced to take an extended leave of absence. The concern being that absent workers dent consumer confidence patterns and in‐turn consumption, while closures of national parks and monuments curb tourism.
The International Monetary Fund in its October 2013 World Economic Outlook broadly concludes that the “damage to the US economy from a short shutdown is likely to be limited … (but that) a longer shutdown could be quite harmful.” More detailed work by Moody’s Analytics estimates that a three‐to‐four week continuation of the so‐called “furloughing” could strip 4Q13 US economic growth by as much as 1.4 points. Moody’s foresees 4Q13 annualised growth of 2.5% without the “furlough”, so a three‐to‐four week shutdown would accordingly equate to 4Q13 US GDP growth of 1.1%. When factored through to the year as a whole, this reduces the annual US GDP growth estimate to 1.4%, from the previous 1.7% forecast for 2013. Filtering such a slowdown into our own demand model in isolation, i.e. without factoring in any ripple effects in other countries or any potential impact on oil prices, curbs projected US oil consumption by approximately 60 kb/d in 4Q13 or 15 kb/d for the year as whole, thus equating to a relatively muted feed‐through. The key here, however, is a relatively short duration of any US government shutdown.
Macroeconomic Advisors LLC, a consultancy, estimated that a two‐week shutdown would equate to a 0.3 percentage point reduction in 4Q13 US GDP growth, which according to our model would have only a very negligible impact upon oil demand. Goldman Sachs estimated that a three‐week layoff would curtail US GDP by 0.9 percentage points for the quarter. The wide discrepancy in forecasts may be seen as a reflection of how unclear the issue is but while the range of opinions on the economic toll is relatively wide, it seems safe to expect that the “furlough” will have a negative impact on US oil consumption, and that the longer it lasts the deeper its effect on demand. Overall, however, in a 91 mb/d oil market, the total impact of a relatively short “furlough” will be negligible.
Concerns regarding the impending US debt ceiling could end up having a greater detrimental impact upon oil demand, particularly if financial markets push up interest rates in response to a heightened‐risk environment. Under such a scenario, the global GDP forecasts would likely be curtailed, significantly impacting demand. As the IMF notes, “a failure to promptly raise the debt ceiling, leading to a US selective default, could seriously damage the global economy.” Given the uncertainties surrounding budget negotiations, however, it is too early to adjust our forecast of global oil demand growth, which is left unchanged at 1.1 mb/d for 2014.

DEMAND INTERNATIONAL ENERGY AGENCY ‐ OIL MARKET REPORT
8 11 OCTOBER 2013
China
Relatively strong Chinese economic data, coupled with a few months of above‐trend oil demand growth, have combined to raise the forecast of Chinese demand growth for 2013 to 4.0%, up from 3.8% previously. Chief among the upside contributing factors were upward revisions of roughly 25 kb/d to July apparent demand (defined as the sum of refinery output and net product imports, minus product inventory builds) and 60 kb/d for August.
China: Demand by Product(thousand barrels per day)
Annual Chg (kb/d) Annual Chg (%)
2012 2013 2014 2013 2014 2013 2014
LPG & Ethane 763 792 818 28 26 3.7 3.3
Naphtha 1,000 1,096 1,169 96 73 9.6 6.7
Motor Gasoline 1,965 2,118 2,237 153 119 7.8 5.6
Jet Fuel & Kerosene 438 479 506 41 28 9.3 5.8
Gas/Diesel Oil 3,406 3,432 3,530 25 98 0.7 2.9
Residual Fuel Oil 501 513 522 12 9 2.5 1.7
Other Products 1,736 1,775 1,816 38 41 2.2 2.3
Total Products 9,810 10,204 10,598 394 394 4.0 3.9
Demand
In addition, the Chinese macroeconomic backdrop has shown some improvement recently. Electricity demand, a proxy for economic activity, showed the strongest y‐o‐y growth in August in a year, while HSBC’s Manufacturing PMI rose to a five‐month high of 50.2 in September, extending the previous month’s recovery from a July dip. The industrially important gasoil, LPG and naphtha sectors will contribute in the main to the revised 2013 estimate, which along with relatively strong gasoline consumption are forecast to underpin the overall growth trend. Robust road transport demand being supported by total vehicle sales up 10.3% y‐o‐y in August, having risen 9.9% in July, according to the China Association of Automobile Manufacturers.
Chinese Manufacturing PMI
47
48
49
50
51
52
53
Oct11 Mar12 Aug12 Jan13 Jun13
Not e: 50=cont ract ion/ expansion t hreshold. Sources: HSBC, Markit
China: Total Oil Product Demand
6,500
8,000
9,500
11,000
Jan Apr Jul Oct Jan
kb/d
Range 2008-2012 5-year avg2012 2013
Japan
Unusually warm summer weather, coupled with ongoing nuclear capacity constraints, combined to fuel stronger‐than‐expected Japanese oil demand in July. Official government data pointed to a rare y‐o‐y gain, with consumption up 0.4% y‐o‐y to 4.4 mb/d. Preliminary data for August show a return to the declining trend seen earlier, however. A surprise dip in industrial output in August seemed consistent with a 5.5% drop in gasoil consumption to 750 kb/d that month.

INTERNATIONAL ENERGY AGENCY ‐ OIL MARKET REPORT DEMAND
11 OCTOBER 2013 9
Japan: Total Oil Product Demand
3,500
4,000
4,500
5,000
5,500
6,000
Jan Apr Jul Oct Jan
kb/d
Range 08-12 5-year avg2012 2013
-10
0
10
20
30
40
50
60
Aug 12 Nov 12 Feb 13 May 13 Aug 13
Days Cooling Degree Days - JapanDiff. to 10-Year Average and Last Year
Diff to 10-year Avg Diff to Previous Year
Uncertainty over Nuclear Restarts Clouds Japanese Oil Outlook
The shutdown of Japan’s entire nuclear power park in early September is expected to affect Japanese oil demand this winter and in 2014 in a big way. Uncertainty surrounding the restart schedules of the plants taken off for maintenance clouds the outlook, however, as do recent shifts in the fuel mix of thermal power generation, characterised by markedly increased coal use.
Following the devastating earthquake and tsunami of March 2011, the Fukushima Daiichi reactor meltdown left a profound impact on the Japanese energy sector, shutting about 95% of Japan’s total nuclear generating capacity. In the wake of the disaster, the country’s remaining nuclear units were progressively shut down for maintenance, leaving the country nuclear‐free in June 2012. Since then, only a few plants have been allowed to operate to prevent power outages.
In early September, Kansai Electric Power Ohi shut the remaining two nuclear reactors for maintenance, leaving the country nuclear‐free for the second time since the 2011 earthquake. This time, however, the restart will be conditional on compliance with the new security standards drafted by the Japanese Nuclear Regulation Authority (NRA), which came into force on 8 July 2013. By the end of July, nuclear plants operators had already applied for the restart of 12 units and NRA inspection teams are currently reviewing those applications. Given the complex review process, no units are expected to be brought online before early 2014.
-
5
10
15
20
25
30
35
40
Sep 10 Mar 11 Sep 11 Mar 12 Sep 12 Mar 13
Tw/h Power generated by fossil fuels
Coal Oil Gas Nuclear
Source: IEA
-
100
200
300
400
500
600
700
800
Jan Feb Mar Apr May Jun Jul Aug Sep Oct Nov Dec
kb/d Crude and Heavy Fuel OilConsumption for power generation
2013 2012 20112010 2009
Source: FEPC
In the aftermath of the Fukushima disaster, oil and natural gas‐fired units largely replaced lost nuclear capacity in power generation. According to data from the Federation of Electric Power Companies (FEPC), which is comprised of the 10 largest Japanese utilities, fuel oil and crude burn used for power generation doubled in 2011. In 2012, crude and fuel oil burn were almost triple pre‐Fukushima levels, providing more than half of what used to be supplied by the nuclear industry, according to IEA data. After having reached a staggering 735 kb/d in February 2012, however, oil used in power generation in 2013 has eased due to
-
10
20
30
40
50
60
70
Mar 08 Mar 09 Mar 10 Mar 11 Mar 12 Mar 13
Tw/h Power output by source type
Hydro Nuclear Thermal
Source: FEPC

DEMAND INTERNATIONAL ENERGY AGENCY ‐ OIL MARKET REPORT
10 11 OCTOBER 2013
Uncertainty over Nuclear Restarts Clouds Japanese Oil Outlook (continued)
higher coal use. So far in 2013, oil demand by utilities has edged 100 kb/d lower year‐on‐year on the back of more economically attractive coal making its way into the mix and due to milder weather. Power generation from coal was capacity‐constrained in the aftermath of the Fukushima earthquake, but since several coal power plants damaged in the earthquake have been repaired and resumed operations.
While demand for fossil fuels in power generations will remain high for the remainder of this year, the projected return of nuclear capacity in early 2014 is expected to translate into roughly 150 kb/d of heavy fuel oil and crude being displaced. This could bring total petroleum consumption for power generation significantly closer to pre‐Fukushima levels of 170 kb/d in 2009 and 2010. The Japan Institute of Energy Economics (IEEJ) similary expects fuel oil consumption in fiscal year 2014 (March 2014 ‐ April 2015) to be 230 kb/d, 110 kb/d lower than in 2013‐2014. Should more nuclear capacity come back online in 2015, further reductions in fuel oil and crude burn could occur. Of course, questions over the actual timeline of any nuclear restart and the unpredictable nature of winter weather continue to inject uncertainty over Japanese oil demand for power generation.
India
Continued economic problems saw Indian demand hover below year‐earlier levels for a third successive month, according to preliminary data for August which showed a 0.4% contraction in demand to 3.1 mb/d. Total vehicle sales, April‐through‐August, fell by 5.8% compared to the year earlier period, consistent with relatively weak demand for transportation fuels.
India: Transportation Fuels Demand vs. Other
(6)
-
6
12
Aug-10 May-11 Feb-12 Nov-12 Aug-13
Y-o-Y % Chg
Transportation Fuels Other Products
Russia: Total Oil Product Demand
2,600
3,000
3,400
3,800
1Q 2Q 3Q 4Q
kb/d
2010 2011 2012 2013
So urce: P etro market R G, IEA
Russia
Having eased back at the end of 2012, Russian oil consumption has since remained relatively strong, with demand averaging out at 3.4 mb/d in the first eight months of the year, nearly 3% up on the corresponding period in 2012. The outlook for the second half of the year is for a deterioration in momentum, as sentiment indicators point towards a slowdown. Falling Russian new car sales in recent months add to the overall downside momentum, with the Association of European Businesses reporting a 5% y‐o‐y decline in September vehicle sales, their seventh consecutive decline.
Brazil
Stronger than anticipated Brazilian demand for July (45 kb/d above the forecast carried in last month’s Report) has resulted in a modest upgrade to the 2013 growth forecast as oil consumption has thus far largely avoided the pitfalls of slower economic growth. Transportation fuels lead the recent upside, as consumer confidence (as tracked by Confederacao Nacional da Industria) holds up relatively well (increasing in August after a mid‐year lull). A planned hike in the gasoline price, up 8% from 21 October, is expected to curb momentum.

INTERNATIONAL ENERGY AGENCY ‐ OIL MARKET REPORT DEMAND
11 OCTOBER 2013 11
Brazil: Total Oil Product Demand
2,200
2,700
3,200
Jan Apr Jul Oct Jan
kb/d
Range 2008-2012 5-year avg2012 2013
Brazil: Motor Gasoline Demand
600
700
800
900
Jan Apr Jul Oct Jan
kb/d
Range 2008-2012 5-year avg2012 2013
Saudi Arabia
Supported by a still ‘expansionary’ industrial sector and peak‐summer power sector fuel oil demand, Saudi Arabian oil consumption scaled a fresh high of 3.5 mb/d in July, up 5% on the year earlier and also 55 kb/d more than forecast in last month’s Report. Heightened fuel oil demand (+40.8% y‐o‐y) led the increase, driven by additional power‐sector usage. As anticipated, crude oil burn in the power sector has been more subdued this year than in previous summers, while residual fuel oil use has risen. Also supportive has been the relatively robust state of domestic business activity, as tracked by the Saudi British Bank/HSBC PMI, which came in at a strongly ‘expansionary’ 56.6 in July. The earlier arrival of Ramadan, starting in July in 2013, also provided some incremental support to oil use. Demand growth in 2013 should average out at around 3.7% on the year as a whole, a growth momentum that is forecast to continue in 2014.
Saudi Arabia: Total Oil Product Demand
1,900
2,300
2,700
3,100
3,500
Jan Apr Jul Oct Jan
kb/d
Range 2008-2012 5-year avg2012 2013
Saudi Arabia: Residual Fuel Oil Demand
200
300
400
500
Jan Apr Jul Oct Jan
kb/d
Range 2008-2012 5-year avg2012 2013
Germany
German demand data remain volatile, with preliminary statistics for August pointing towards average consumption of around 2.4 mb/d, or 3.4% up on the year earlier and 95 kb/d more than the estimate carried in last month’s Report. Despite a surprise dip in industrial output in July, manufacturing PMI data are expected to remain ‘expansionary’ for 2H13, i.e. above 50. Markit’s Construction PMI rose to a 17‐month high of 55.1 in August, while the services PMI rose to a seven‐month high of 52.8. Confirmed July demand data revealed that roughly 2.5 mb/d of oil products were consumed in the month, 1.7% down on the year earlier as LPG and gasoil, in particular, slid on contracting need from industry in the month. German car sales remain under pressure, with new vehicle registrations falling in August by 5% y‐o‐y and down roughly 7% on the year‐to‐date.

DEMAND INTERNATIONAL ENERGY AGENCY ‐ OIL MARKET REPORT
12 11 OCTOBER 2013
Germany: Total Oil Product Demand
2,100
2,300
2,500
2,700
2,900
Jan Apr Jul Oct Jan
kb/d
Range 08-12 5-year avg2012 2013
Canada: Total Oil Product Demand
2,000
2,100
2,200
2,300
2,400
Jan Apr Jul Oct Jan
kb/d
Range 08-12 5-year avg2012 2013
Canada
The Canadian demand forecast has been modestly upgraded since last month’s Report, reflecting upward revisions to 2Q13 LPG estimates (+45 kb/d). Concerns regarding the sustainability of the economic recovery, however, restrain the scale of this upgrading. Roughly 2.3 mb/d of oil products were consumed in July, 1.3% below year‐earlier levels. The RBC Manufacturing PMI fell to a three‐month low in July, as output and new orders showed signs of weakening, while the Conference Board of Canada’s consumer confidence index slipped in July (to 82.6, versus a 2002 starting point of 100), with the majority of Canadians citizens reportedly becoming more negative about their financial situation.
Korea
At roughly 2.3 mb/d in August, South Korean consumption fell in line with our month‐earlier forecast of 1.7% annual demand growth. Demand for road transportation fuels was particularly robust – with gasoline use up 12.3% on the year earlier and gasoil/diesel demand 9.0% higher – as consumer confidence lifted vehicle usage. The consumer confidence index, as tracked by the Bank of Korea, rose to 105 in July (any indicator above 100 implies optimism). Consumer spending plans related to “transportation and communication” particularly thrived, rising to 109 in July, as did “medical care” at 110.
Korea: Total Oil Product Demand
1,900
2,100
2,300
2,500
Jan Apr Jul Oct Jan
kb/d
Range 08-12 5-year avg2012 2013
Korea: Gasoil Demand
300
350
400
450
Jan Apr Jul Oct Jan
kb/d
Range 08-12 5-year avg2012 2013
OECD
Preliminary estimates of August demand imply a return to the falling trend prevalent in recent years, following an uptick in July. Absolute declines span all main OECD regions, with the steepest contraction in OECD Asia Oceania, followed by Europe. Japan, Italy and Spain led the downside in August demand, partly offset by growth in Korea, Germany and Mexico.
INTERNATIONAL ENERGY AGENCY ‐ OIL MARKET REPORT DEMAND
11 OCTOBER 2013 13
OECD Demand based on Adjusted Preliminary Submissions - August 2013(million barrels per day)
mb/d % pa mb/d % pa mb/d % pa mb/d % pa mb/d % pa mb/d % pa mb/d % pa
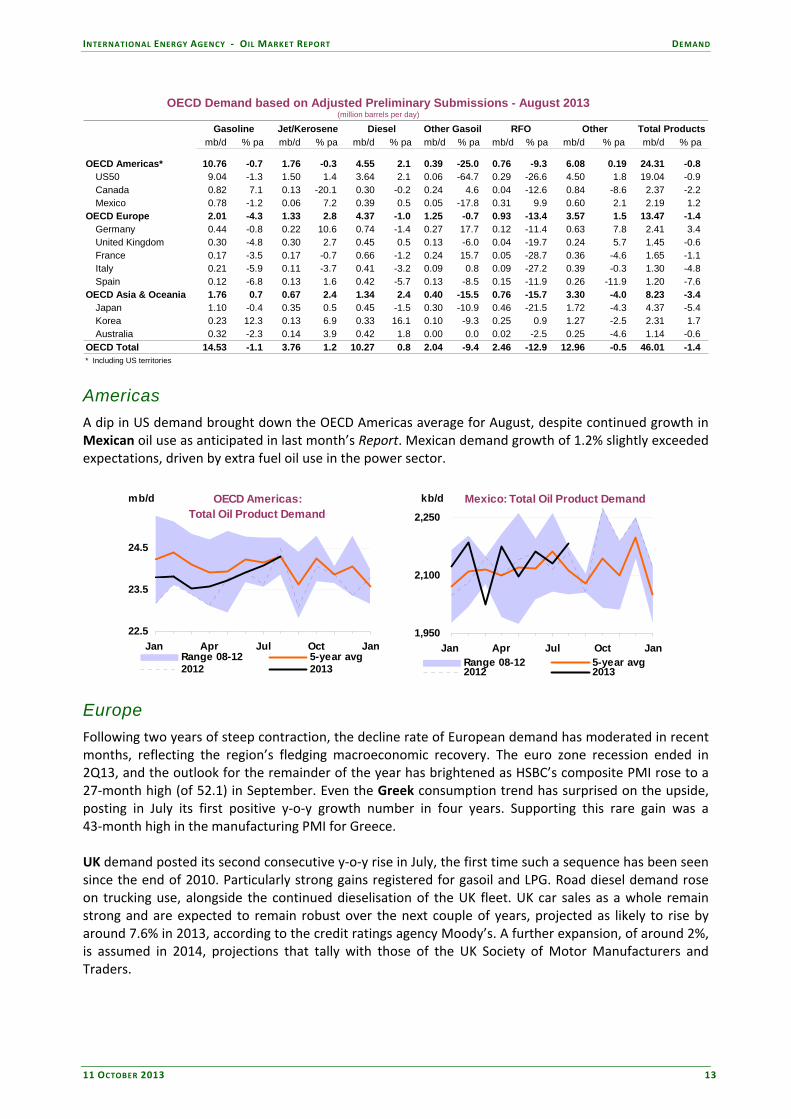
OECD Americas* 10.76 -0.7 1.76 -0.3 4.55 2.1 0.39 -25.0 0.76 -9.3 6.08 0.19 24.31 -0.8 US50 9.04 -1.3 1.50 1.4 3.64 2.1 0.06 -64.7 0.29 -26.6 4.50 1.8 19.04 -0.9 Canada 0.82 7.1 0.13 -20.1 0.30 -0.2 0.24 4.6 0.04 -12.6 0.84 -8.6 2.37 -2.2 Mexico 0.78 -1.2 0.06 7.2 0.39 0.5 0.05 -17.8 0.31 9.9 0.60 2.1 2.19 1.2
OECD Europe 2.01 -4.3 1.33 2.8 4.37 -1.0 1.25 -0.7 0.93 -13.4 3.57 1.5 13.47 -1.4 Germany 0.44 -0.8 0.22 10.6 0.74 -1.4 0.27 17.7 0.12 -11.4 0.63 7.8 2.41 3.4 United Kingdom 0.30 -4.8 0.30 2.7 0.45 0.5 0.13 -6.0 0.04 -19.7 0.24 5.7 1.45 -0.6 France 0.17 -3.5 0.17 -0.7 0.66 -1.2 0.24 15.7 0.05 -28.7 0.36 -4.6 1.65 -1.1 Italy 0.21 -5.9 0.11 -3.7 0.41 -3.2 0.09 0.8 0.09 -27.2 0.39 -0.3 1.30 -4.8 Spain 0.12 -6.8 0.13 1.6 0.42 -5.7 0.13 -8.5 0.15 -11.9 0.26 -11.9 1.20 -7.6
OECD Asia & Oceania 1.76 0.7 0.67 2.4 1.34 2.4 0.40 -15.5 0.76 -15.7 3.30 -4.0 8.23 -3.4 Japan 1.10 -0.4 0.35 0.5 0.45 -1.5 0.30 -10.9 0.46 -21.5 1.72 -4.3 4.37 -5.4 Korea 0.23 12.3 0.13 6.9 0.33 16.1 0.10 -9.3 0.25 0.9 1.27 -2.5 2.31 1.7 Australia 0.32 -2.3 0.14 3.9 0.42 1.8 0.00 0.0 0.02 -2.5 0.25 -4.6 1.14 -0.6
OECD Total 14.53 -1.1 3.76 1.2 10.27 0.8 2.04 -9.4 2.46 -12.9 12.96 -0.5 46.01 -1.4 * Including US territories
RFO Other Total ProductsGasoline Jet/Kerosene Diesel Other Gasoil
Americas
A dip in US demand brought down the OECD Americas average for August, despite continued growth in Mexican oil use as anticipated in last month’s Report. Mexican demand growth of 1.2% slightly exceeded expectations, driven by extra fuel oil use in the power sector.
OECD Americas:Total Oil Product Demand
22.5
23.5
24.5
Jan Apr Jul Oct Jan
mb/d
Range 08-12 5-year avg2012 2013
Mexico: Total Oil Product Demand
1,950
2,100
2,250
Jan Apr Jul Oct Jan
kb/d
Range 08-12 5-year avg2012 2013
Europe
Following two years of steep contraction, the decline rate of European demand has moderated in recent months, reflecting the region’s fledging macroeconomic recovery. The euro zone recession ended in 2Q13, and the outlook for the remainder of the year has brightened as HSBC’s composite PMI rose to a 27‐month high (of 52.1) in September. Even the Greek consumption trend has surprised on the upside, posting in July its first positive y‐o‐y growth number in four years. Supporting this rare gain was a 43‐month high in the manufacturing PMI for Greece. UK demand posted its second consecutive y‐o‐y rise in July, the first time such a sequence has been seen since the end of 2010. Particularly strong gains registered for gasoil and LPG. Road diesel demand rose on trucking use, alongside the continued dieselisation of the UK fleet. UK car sales as a whole remain strong and are expected to remain robust over the next couple of years, projected as likely to rise by around 7.6% in 2013, according to the credit ratings agency Moody’s. A further expansion, of around 2%, is assumed in 2014, projections that tally with those of the UK Society of Motor Manufacturers and Traders.

DEMAND INTERNATIONAL ENERGY AGENCY ‐ OIL MARKET REPORT
14 11 OCTOBER 2013
UK: Total Oil Product Demand
1,400
1,500
1,600
1,700
1,800
1,900
Jan Apr Jul Oct Jan
kb/d
Range 08-12 5-year avg2012 2013
Turkey: Total Oil Product Demand
400
600
800
Jan Apr Jul Oct Jan
kb/d
Range 08-12 5-year avg2012 2013
Notable additions to the July European demand estimate included Turkey, with consumption up by nearly 8% on the year, to 785 kb/d. Strong Turkish growth reflects both a reported resurgence in consumer confidence (which according to the Turkish Statistical Institute rose to a 16‐month high in July) but also the lows seen a year earlier. Resurgent growth took hold as the Turkish economy appeared to put the worst of its year‐long economic slowdown behind it. Indeed industrial activity, as tracked by HSBC’s manufacturing PMI, returned to ‘expansionary’ territory in August, supporting the forecast for a relatively robust second half of the year and 2014. Robust new car sales will underpin the strong demand numbers, with the Turkish Automotive Distributor Association reporting 20.9% y‐o‐y growth over the first eight months of the year.
Asia Oceania
According to partial, preliminary data, OECD Asia Oceania demand is estimated to have dropped by a steep 3.4% y‐o‐y in August, to 8.2 mb/d. July deliveries, for which more complete statistics are available, revealed a stronger (i.e. less sharp decline) pattern. Australia consumed roughly 1.1 mb/d of oil products in July, a gain of 2.7% on the year earlier (and 45 kb/d above the forecast carried in last month’s Report) as relatively robust consumer confidence data suggests the economy may be getting back on track following its mid‐year weakness. Consumer confidence, as tracked by the Westpac Banking Corporation, stood at 102.1 in July (readings above 100 denote optimism) and escalated to a near three‐year high of 110.6 in September, well up on May’s 97.6 low. The demand forecast for the year as a whole has been upgraded to reflect not just the higher July consumption data, but also the continued support likely to be provided by more upbeat consumer confidence.
Non-OECD
Strong non‐OECD gains continue to underpin global oil demand, with transportation fuels contributing the lion’s share of growth. Non‐OECD petrochemical demand is also on the rise, supporting both naphtha and LPG use. Asia once again dominates. Naphtha consumption in Chinese Taipei has been particularly robust recently, as usage has risen ahead of an expected 2H13 uptick in petrochemical plant maintenance.
Non-OECD: Demand by Region(thousand barrels per day)
Annual Chg (kb/d) Annual Chg (%)
May-13 Jun-13 Jul-13 Jun-13 Jul-13 Jun-13 Jul-13
Africa 3,788 3,841 3,768 265 84 7.4 2.3
Asia 21,572 21,901 21,737 938 636 4.5 3.0
FSU 4,513 4,776 4,756 394 134 9.0 2.9
Latin America 6,556 6,545 6,684 182 254 2.9 3.9
Middle East 7,830 8,061 8,492 253 524 3.2 6.6
Non-OECD Europe 679 650 666 -94 -16 -12.7 -2.3
Total Products 44,938 45,775 46,103 1,937 1,616 4.4 3.6
Demand

INTERNATIONAL ENERGY AGENCY ‐ OIL MARKET REPORT DEMAND
11 OCTOBER 2013 15
Other areas of non‐OECD demand that have shown strong growth in recent months include the Middle East, Latin America and Africa. African data for July were surprisingly weak, however. Both the Nigerian and South African July numbers came out roughly 45 kb/d below those forecast in last month’s Report. According to the Central Bank of Nigeria, consumer confidence fell in 2Q13. The overall Nigerian demand trend is expected to accelerate once again in 2014, supported by a widely anticipated uptick in macroeconomic activity. South African demand, in July, maintained the falling trend that has encompassed consumption there since April, including dips in demand for transportation fuels – gasoline, jet fuel and gasoil – as consumer confidence (as reported by the South African Bureau for Economic Research) and employment conditions remained subdued. Downward revisions were partly offset by reports that manufacturing activity has since gained momentum (with the PMI rising to a six‐year high of 56.5 in August).
South Africa: Total Oil Product Demand
450
500
550
600
650
700
Jan Apr Jul Oct Jan
kb/d
Range 2008-2012 5-year avg2012 2013
Egypt: Total Oil Product Demand
600
650
700
750
800
850
Jan Apr Jul Oct Jan
kb/d
Range 2008-2012 5-year avg2012 2013
Despite recent political turmoil in Egypt, consumption estimates for May, June and July have risen, according to the latest JODI reports. It seems from these figures that total Egyptian oil demand has received a fillip from the power sector, as power generation facilities were switched over to oil from natural gas to alleviate shortages. One LNG train is reportedly closed, with another operating at limited volumes. In the short‐term oil consumption prospects are also likely to remain supported by the reduced likelihood of subsidy cuts. Following the ousting of former President Mohamed Morsi, Saudi Arabia, Kuwait and the UAE have pledged to donate a combined $12 billion, reducing the need for the previously cited $4.8 billion IMF package, with its associated subsidy reduction requirements.

SUPPLY INTERNATIONAL ENERGY AGENCY ‐ OIL MARKET REPORT
16 11 OCTOBER 2013
SUPPLY
Summary
Global supplies declined by around 625 kb/d to 91.12 mb/d in September from August levels, with a steep fall in OPEC crude oil production only partially offset by a marginal increase in non‐OPEC supplies. Supplies were up about 630 kb/d from year‐ago levels, however, with a staggering rise in non‐OPEC output and OPEC NGLs of 1.96 mb/d far eclipsing a decline of 1.33 mb/d in OPEC crude production.
Non‐OPEC supplies inched up month‐on‐month by 20 kb/d in September, to 54.61 mb/d, as a gain in the FSU offset a seasonal drop in Norway, but grew by a steep 1.79 mb/d year‐on‐year. US production continued to expand in September, albeit at a somewhat slower pace. Total non‐OPEC production growth is forecast at a robust 1.1 mb/d for 2013, and at an even stronger 1.7 mb/d for 2014, the fastest rate since the highest rate since the 1970s.
OPEC crude oil supplies slipped below 30 mb/d for the first time in almost two years, led by steep declines in Iraq and Libya. September output fell by 645 kb/d to 29.99 mb/d – the lowest level since October 2011 ‐‐ despite Saudi production breaching the 10 mb/d mark for the third consecutive month. Planned upgrading work at southern ports slashed Iraqi crude oil output by 400 kb/d to 2.82 mb/d, the lowest level in 18 months, while Libyan supplies averaged just 300 kb/d in the wake of labour disputes, tribal violence and political turmoil.
The ‘call on OPEC crude and stock change’ was raised by 100 kb/d for 4Q13 and full‐year 2013, to 29.6 mb/d and 29.9 mb/d respectively. For 2014 the ‘call’ was lowered by an average 100 kb/d to 29 mb/d due to an upward revision in non‐OPEC supply growth. OPEC’s ‘effective’ spare capacity was estimated at 2.90 mb/d in September compared with 2.94 mb/d in August.
-1.5-1.0-0.50.00.51.01.52.02.53.0
Jun 12 Sep 12 Dec 12 Mar 13 Jun 13 Sep 13
mb/dOPEC and Non-OPEC Oil Supply
Year-on-Year Change
OPEC Crude Non-OPEC
OPEC NGLs Total Supply
28.028.529.029.530.030.531.031.532.0
50
52
54
56
58
60
62
64
Feb 13 Aug 13 Feb 14 Aug 14
mb/dmb/dOPEC and Non-OPEC Oil Supply
Non-OPEC OPEC NGLsOPEC Crude - RS
All world oil supply figures for September discussed in this report are IEA estimates. Estimates for OPEC countries, Alaska, Mexico and Russia are supported by preliminary September supply data. Note: Random events present downside risk to the non‐OPEC production forecast contained in this report. These events can include accidents, unplanned or unannounced maintenance, technical problems, labour strikes, political unrest, guerrilla activity, wars and weather‐related supply losses. Specific allowance has been made in the forecast for scheduled maintenance in all regions and for typical seasonal supply outages (including hurricane‐related stoppages) in North America. In addition, from May 2011, a nationally allocated (but not field‐specific) reliability adjustment has also been applied for the non‐OPEC forecast to reflect a historical tendency
for unexpected events to reduce actual supply compared with the initial forecast. This totals ‒200 kb/d for non‐OPEC as a whole, with downward adjustments focused in the OECD.

INTERNATIONAL ENERGY AGENCY ‐ OIL MARKET REPORT SUPPLY
11 OCTOBER 2013 17
OPEC Crude Oil Supply
OPEC crude oil supplies fell below the 30 mb/d threshold for the first time in almost two years, with sharply lower output from Iraq and Libya accounting for the bulk of the decline. September output fell by a steep 645 kb/d to 29.99 mb/d – the lowest level since October 2011 – despite Saudi production breaching the 10 mb/d mark for the third consecutive month. As previously flagged, output from Iraq plummeted to 18‐month lows in September due to scheduled rehabilitation work at the southern export terminals. The effect of this work was compounded by pipeline ruptures affecting oil flows from the giant Rumaila field (see ‘Iraqi Crude Exports Turn South in September’). Libyan crude output remained curtailed in September by ongoing labour disputes, civil unrest and political turmoil. The ‘call on OPEC crude and stock change’ was raised by 100 kb/d for 4Q13 and full‐year 2013, to 29.6 mb/d and 29.9 mb/d respectively. For 2014, the ‘call’ was lowered by an average 100 kb/d to 29 mb/d on increased non‐OPEC supplies. OPEC NGLs were pegged at 6.5 mb/d in September. OPEC’s ‘effective’ spare capacity was estimated at 2.90 mb/d in September compared with 2.94 mb/d in August. Saudi Arabia’s spare capacity was assessed at 2.28 mb/d and accounts for the lion’s share of the surplus at around 80%.
28
29
30
31
32
Jan Mar May Jul Sep Nov Jan
mb/d OPEC Crude Oil Production
2010 2011 2012 2013
26
27
28
29
30
31
32
1Q 2Q 3Q 4Q
mb/dQuarterly Call on OPEC Crude +
Stock Change
2012 2013 2014
Saudi Arabia’s crude oil production topped 10 mb/d in September for the third month running, though output was down marginally from August levels. Crude oil production averaged 10.12 mb/d in September, off 70 kb/d from the previous month. Saudi officials said supply to the market was 10.05 mb/d, indicating around 70 kb/d was moved into storage. Higher Saudi production is partly aimed at supplying the new 400 kb/d refinery at Jubail, operated by the Saudi Aramco Total Refining and Petrochemical Company (SATORP). The refinery is designed to process heavy crude from the offshore Manifa field. Higher output is also helping to offset the loss from Libya and Iraq, which totalled 650 kb/d in September. Iran’s crude oil production edged lower by 100 kb/d in September to 2.58 mb/d. As expected, preliminary data indicate crude imports from Iran rose by 180 kb/d in September to 1.17 mb/d, with China and India leading the upward movement. Import estimates are based on data submitted by OECD countries, non‐OECD statistics from customs agencies, tanker movements and news reports. Preliminary data indicate China lifted imports from Iran to a four‐month high of 555 kb/d in September, up by around 120 kb/d. India increased imports by 115 kb/d to 265 kb/d, the highest level since January 2013. Exports to India, however, are expected to decline in October, after a three‐month waiver, approved by
8.0
8.5
9.0
9.5
10.0
10.5
Jan Mar May Jul Sep Nov Jan
mb/d Saudi Arabia Crude Production
2010 2011 2012 2013

SUPPLY INTERNATIONAL ENERGY AGENCY ‐ OIL MARKET REPORT
18 11 OCTOBER 2013
India, which allowed Iran's Kish P&I and Moallem Insurance Co to cover tanker vessels calling at the country’s ports, expired on 27 September. It is unclear when Indian government officials will extend approval for underwriters from Iran to provide insurance. Tanker tracking data indicate Pakistan imported 30 kb/d, the country’s first imports of Iranian oil since January 2011. By contrast, Japan reduced imports by about 60 kb/d to 155 kb/d while volumes into South Korea remained unchanged at about 65 kb/d last month. A change of tone in discussions between Iran and the international community following President Hassan Rouhani’s address to the United Nations in late September received a vote of confidence from the oil market, with prices initially easing somewhat on the news. Few expect sanctions on the country’s oil and finance sector to be eased anytime soon, however. Rather, most expect that turning the clock back on sanctions will be a drawn‐out process based on tangible diplomatic progress with regard to the issues at hand, which many still view as a remote prospect.
2.5
2.7
2.9
3.1
3.3
3.5
3.7
3.9
Jan Mar May Jul Sep Nov Jan
mb/d Iran Crude Production
2010 2011 2012 2013
0.0
0.5
1.0
1.5
2.0
2.5
3.0
0.0
0.2
0.4
0.6
0.8
1.0
1.2
Jan-11 Jul-11 Jan-12 Jul-12 Jan-13 Jul-13
mb/d Iranian Crude Imports
Total - RHS OECD EUROECD PAC China / IndiaOther Non-OECD
Kuwait and the UAE both boosted output by around 20 kb/d in September, to 2.79 mb/d and 2.77 mb/d, respectively. Qatar production was steady month‐on‐month at around 730 kb/d.
Jul 2013 Aug 2013 Sep 2013
Supply Supply Supply
Algeria 1.15 1.12 1.15 1.18 0.03 1.15
Angola 1.73 1.70 1.72 1.89 0.17 1.74
Ecuador 0.52 0.52 0.52 0.53 0.01 0.51
Iran 2.65 2.68 2.58 2.90 0.32 2.67
Iraq 3.06 3.22 2.82 3.32 0.50 3.08
Kuwait2 2.80 2.77 2.79 2.90 0.11 2.81
Libya 1.00 0.55 0.30 1.40 1.10 1.10
Nigeria3 1.92 1.94 2.04 2.25 0.21 1.97
Qatar 0.73 0.73 0.73 0.75 0.03 0.73
Saudi Arabia2 10.00 10.19 10.12 12.40 2.28 9.64
UAE 2.75 2.75 2.77 2.90 0.13 2.71
Venezuela4 2.47 2.47 2.45 2.60 0.15 2.47
Total OPEC 30.77 30.63 29.99 35.02 5.03 30.58
(excluding Iraq, Nigeria, Libya and Iran) 2.901 Capacity levels can be reached within 30 days and sustained for 90 days.2 Includes half of Neutral Zone production.
3 Nigeria's current capacity estimate excludes some 200 kb/d of shut-in capacity.
4 Includes upgraded Orinoco extra-heavy oil assumed at 420 kb/d in September.
Sustainable Production
Capacity1
Spare Capacity vs Sep 2013
Supply
Jan-Sept Average Crude
Supply
OPEC Crude Production(million barrels per day)
INTERNATIONAL ENERGY AGENCY ‐ OIL MARKET REPORT SUPPLY
11 OCTOBER 2013 19
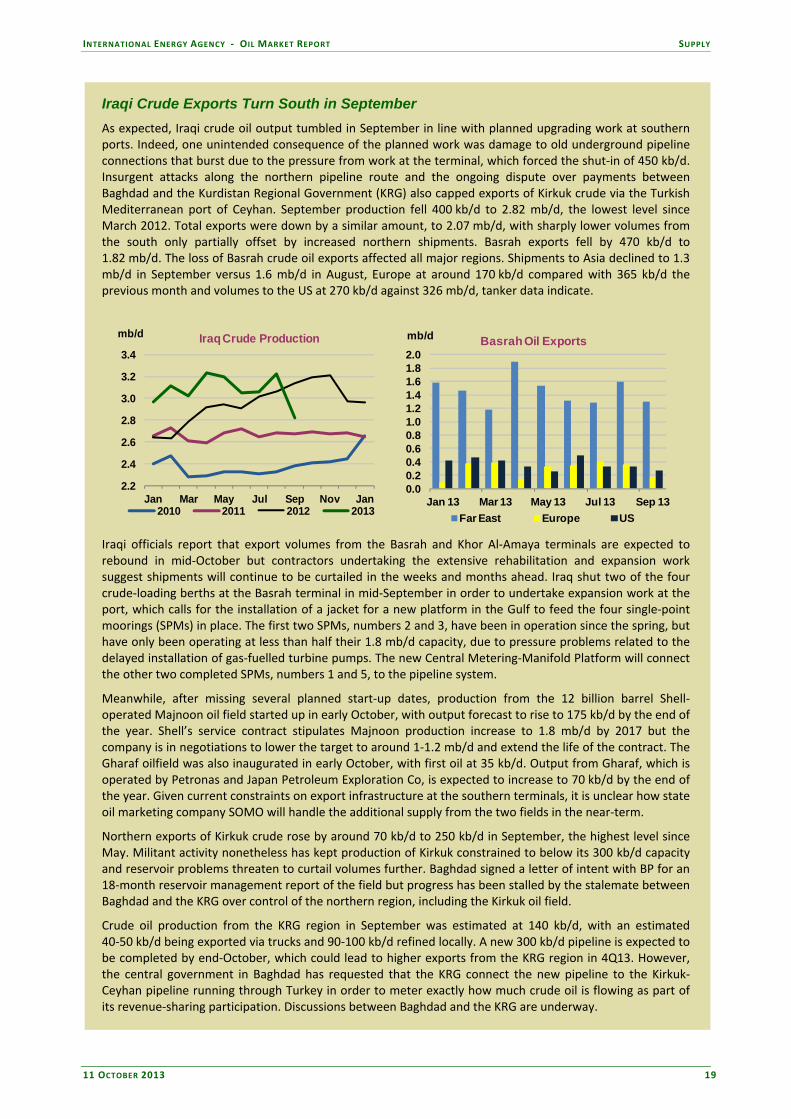
Iraqi Crude Exports Turn South in September
As expected, Iraqi crude oil output tumbled in September in line with planned upgrading work at southern ports. Indeed, one unintended consequence of the planned work was damage to old underground pipeline connections that burst due to the pressure from work at the terminal, which forced the shut‐in of 450 kb/d. Insurgent attacks along the northern pipeline route and the ongoing dispute over payments between Baghdad and the Kurdistan Regional Government (KRG) also capped exports of Kirkuk crude via the Turkish Mediterranean port of Ceyhan. September production fell 400 kb/d to 2.82 mb/d, the lowest level since March 2012. Total exports were down by a similar amount, to 2.07 mb/d, with sharply lower volumes from the south only partially offset by increased northern shipments. Basrah exports fell by 470 kb/d to 1.82 mb/d. The loss of Basrah crude oil exports affected all major regions. Shipments to Asia declined to 1.3 mb/d in September versus 1.6 mb/d in August, Europe at around 170 kb/d compared with 365 kb/d the previous month and volumes to the US at 270 kb/d against 326 mb/d, tanker data indicate.
2.2
2.4
2.6
2.8
3.0
3.2
3.4
Jan Mar May Jul Sep Nov Jan
mb/d Iraq Crude Production
2010 2011 2012 2013
0.00.20.40.60.81.01.21.41.61.82.0
Jan 13 Mar 13 May 13 Jul 13 Sep 13
mb/d Basrah Oil Exports
Far East Europe US
Iraqi officials report that export volumes from the Basrah and Khor Al‐Amaya terminals are expected to rebound in mid‐October but contractors undertaking the extensive rehabilitation and expansion work suggest shipments will continue to be curtailed in the weeks and months ahead. Iraq shut two of the four crude‐loading berths at the Basrah terminal in mid‐September in order to undertake expansion work at the port, which calls for the installation of a jacket for a new platform in the Gulf to feed the four single‐point moorings (SPMs) in place. The first two SPMs, numbers 2 and 3, have been in operation since the spring, but have only been operating at less than half their 1.8 mb/d capacity, due to pressure problems related to the delayed installation of gas‐fuelled turbine pumps. The new Central Metering‐Manifold Platform will connect the other two completed SPMs, numbers 1 and 5, to the pipeline system.
Meanwhile, after missing several planned start‐up dates, production from the 12 billion barrel Shell‐operated Majnoon oil field started up in early October, with output forecast to rise to 175 kb/d by the end of the year. Shell’s service contract stipulates Majnoon production increase to 1.8 mb/d by 2017 but the company is in negotiations to lower the target to around 1‐1.2 mb/d and extend the life of the contract. The Gharaf oilfield was also inaugurated in early October, with first oil at 35 kb/d. Output from Gharaf, which is operated by Petronas and Japan Petroleum Exploration Co, is expected to increase to 70 kb/d by the end of the year. Given current constraints on export infrastructure at the southern terminals, it is unclear how state oil marketing company SOMO will handle the additional supply from the two fields in the near‐term.
Northern exports of Kirkuk crude rose by around 70 kb/d to 250 kb/d in September, the highest level since May. Militant activity nonetheless has kept production of Kirkuk constrained to below its 300 kb/d capacity and reservoir problems threaten to curtail volumes further. Baghdad signed a letter of intent with BP for an 18‐month reservoir management report of the field but progress has been stalled by the stalemate between Baghdad and the KRG over control of the northern region, including the Kirkuk oil field.
Crude oil production from the KRG region in September was estimated at 140 kb/d, with an estimated 40‐50 kb/d being exported via trucks and 90‐100 kb/d refined locally. A new 300 kb/d pipeline is expected to be completed by end‐October, which could lead to higher exports from the KRG region in 4Q13. However, the central government in Baghdad has requested that the KRG connect the new pipeline to the Kirkuk‐Ceyhan pipeline running through Turkey in order to meter exactly how much crude oil is flowing as part of its revenue‐sharing participation. Discussions between Baghdad and the KRG are underway.

SUPPLY INTERNATIONAL ENERGY AGENCY ‐ OIL MARKET REPORT
20 11 OCTOBER 2013
Libyan oil production averaged just 300 kb/d in September in the wake of militant activity, labour disputes and political turmoil, but output rebounded to 600‐700 kb/d in early October according to officials. Underscoring the challenging security environment in the country Libyan Prime Minister Ali Zeidan was kidnapped in the early morning hours of 10 October but freed later in the day after armed locals surrounded the compound where he was being held and forced the kidnappers to let him go. The increase in production follows the restart of the 130 kb/d Elephant field and the 200 kb/d El‐Shahara field in the Western region of the country, in addition to around 90 kb/d from the offshore Al‐Jurf and Bouri fields, which have remained online during the latest crisis. Latest export data show volumes running well below levels reported by officials for October, however. Traders report that the worsening security issues have made it extremely difficult to secure insurance for tankers calling at Libyan ports. Unsold crude may go to fill storage tanks at terminals. Five months on since the onset of the latest turmoil, Libyan officials and the various tribal factions controlling oil facilities have made little progress in resolving the disputes, not least the federalist agenda put forward in the eastern region of the country. Near‐term, output is expected to remain stagnant below 700 kb/d given the significant security issues.
0.0
0.4
0.8
1.2
1.6
2.0
Jan Mar May Jul Sep Nov Jan
mb/d Libya Crude Production
2010 2011 2012 2013
1.8
1.9
2.0
2.1
2.2
2.3
2.4
Jan Mar May Jul Sep Nov Jan
mb/d Nigeria Crude Production
2010 2011 2012 2013
Nigeria output partially recovered in October, up 100 kb/d to 2.04 mb/d—the highest level so far in 2013. In early September ENI lifted force majeure on Brass River crude exports which had been in place since March. Shell lifted force majeure on Bonny Light crude sales following completion of repairs on the 150 kb/d Trans Niger Pipeline, but work on the Nembe Creek Trunkline is still ongoing. Shell announced plans to sell the troublesome Nembe Creek Trunkline amid worsening oil theft and security problems. Export schedules indicate production could falter again in November as scheduled field‐maintenance work at the Shell‐operated offshore Bonga field oil reduces output by around 190 kb/d. Angolan production rose 20 kb/d to 1.72 mb/d while Algerian output inched up 30 kb/d, to 1.15 mb/d as production from the El Merk field continued to ramp up. New output from the field started in 1Q13 and is expected to reach 125 kb/d by year‐end before reaching peak capacity of 135 kb/d in early 2015.
1.5
1.6
1.7
1.8
1.9
2.0
Jan Mar May Jul Sep Nov Jan
mb/d Angola Crude Production
2010 2011 2012 2013
1.10
1.15
1.20
1.25
Jan Mar May Jul Sep Nov Jan
mb/d Algeria Crude Production
2010 2011 2012 2013

INTERNATIONAL ENERGY AGENCY ‐ OIL MARKET REPORT SUPPLY
11 OCTOBER 2013 21
Non-OPEC Overview
Non‐OPEC production inched up m‐o‐m in September by 20 kb/d to 54.61 mb/d after falling in August by 450 kb/d to 54.59 mb/d, when stronger‐than‐expected production from Norway failed to offset declines elsewhere. Despite the small gain, September production thus remained significantly below July levels. Excluding refinery gain and biofuels, however, non‐OPEC supply managed a more healthy gain of 140 kb/d in September m‐o‐m, partly reversing a decline of nearly 500 kb/d in August.
-1.0
-0.5
0.0
0.5
1.0
1.5
2.0
1Q10 4Q10 3Q11 2Q12 1Q13 4Q13 3Q14
mb/d Total Non-OPEC Supply, y-o-y chg
Other North America Total
52
53
54
55
56
57
58
Jan Mar May Jul Sep Nov Jan
mb/d Total Non-OPEC Supply
2011 20122013 2014 forecast2013 forecast
The production patterns of August and September highlight the central role of North America in the broader non‐OPEC supply picture: absent incremental North American supply of 210 kb/d, the non‐OPEC fall in August would have been quite dramatic, while a turn to weaker North American growth in September has led to a flat month for all of non‐OPEC. Nevertheless, non‐OPEC continues solid gains on a quarterly basis: 3Q13 production of 54.72 mb/d is up 480 kb/d q‐o‐q and 1.69 mb/d y‐o‐y. Even with South Sudan production continuing to increase m‐o‐m (albeit by less than what the government initially indicated), political developments are taking a toll on non‐OPEC supply, particularly in Yemen and Syria. Combined 3Q13 liquids production for these three countries was about 340 kb/d; two years ago it was nearly 940 kb/d. As the CEO of oil major Shell recently pointed out, global annual decline rates of 4%‐6% per year means that the industry must “build another Saudi Arabia every 30 months” to stay even. The industry, at least in the short‐term, continues to invest such that growth has been strong this year and is expected to remain so in 2014. We are into the fourth quarter of 2013, and non‐OPEC looks set to manage a net y‐o‐y increase of 1.1 mb/d for 2013. For 2014, our growth forecast is revised upwards to 1.7 mb/d, an increase of about 350 kb/d since the Medium‐Term Oil Market Report (please see “Looking at 2014 Non‐OPEC Supply Growth” for a closer look at this).
OECD
North America
US – August crude oil preliminary; Alaska actual, other states estimated: Preliminary data indicate that crude oil production in the US continued to grow m‐o‐m, reaching 7.56 mb/d in August, up 1.24 mb/d y‐o‐y. Despite Alaska crude oil supply remaining below 500 kb/d since June, production of Bakken light tight oil (LTO) in North Dakota continues to impress, surpassing 800 kb/d for the first time in July, and likely ramping up further to above 830 kb/d in August. We project that Bakken LTO (North Dakota) will reach 900 kb/d by the end of 2013, and 1.0 mb/d during 3Q14. Bakken, and Eagle Ford LTO in Texas, the two largest sources of growth in the US of the last few years, are forecast to average about 2.2 mb/d for 2014 (see chart). That would mean that over a period of five years, production on these two formations will have increased by more than 2 mb/d. One of the reasons that we remain optimistic for further

SUPPLY INTERNATIONAL ENERGY AGENCY ‐ OIL MARKET REPORT
22 11 OCTOBER 2013
expansion is the increase in drilling efficiency, particularly across the Eagle Ford, where drilling times have been reduced by as much as 30% by some companies in the past year. Plains All American and Enterprise Product Partners have announced that they will be adding 120 kb/d of capacity to their Eagle Ford JV Pipeline to accommodate the expanding volumes on the formation. On the Bakken, rail has proved critical in taking out the liquids, but the lack of infrastructure for handling the associated gas has resulted in about 8.5 mcm/d of flared gas in recent months according to North Dakota state authorities. Regulatory changes to reduce flaring remain a possibility. We expect a further increase in overall US production in September, particularly as there were no storm‐related outages in the US Gulf of Mexico (GOM). Our estimate does take into account some loss of production in Colorado due to the flooding that affected the Denver‐Julesburg Basin, however. Some of this loss will carry over into October, which had the first significant storm of the season in the GOM, when tropical storm Karen prompted outages of about 62% of production for a couple of days in early October. Production came back quickly afterwards as the infrastructure emerged unscathed from the storm. Hence, we expect October to show a m‐o‐m decline of about 120 kb/d. Nevertheless, 4Q13, forecast at 7.64 mb/d, will still be an increase on 3Q13 production levels of 7.56 mb/d. US total liquids output (excluding biofuels and refinery processing gain), which exceeded 10 mb/d for the first time in decades in 2Q13, is estimated at 10.37 mb/d in 3Q13. The US is poised to become the largest non‐OPEC liquids producer by 2Q14 even if biofuels and refinery gain are not taken into account (but including additives and oxygenates). NGL production is assessed at 2.53 mb/d for 3Q13, and is expected to grow further for the next three quarters. Despite the surfeit of ethane production discussed in last month’s Report, some analysts now question whether there will be enough propane to utilise all of the planned augmentation in LPG export capacity (some 900 kb/d has been announced for the short and medium term).
-0.4-0.20.00.20.40.60.81.01.21.4
1Q12 3Q12 1Q13 3Q13 1Q14 3Q14
mb/d US Total Oil Supply - Yearly Change
Alaska California TexasOther Lower-48 Gulf of Mexico NGLsNorth Dakota Other Total
-0.2
-0.1
0.0
0.1
0.2
0.3
0.4
0.5
1Q12 3Q12 1Q13 3Q13
mb/d Canada Oil Supply - Yearly Change
Synthetic Crude Alberta L&M
Alberta Heavy In Situ Bitumen
Saskatchewan Other Light Conventional
NGLs Crude (ex. Syncrude) Canada – July actual: July extended June’s strong m‐o‐m rise in total liquids (including synthetics) production, to 3.93 mb/d. Mined bitumen increased by less than expected, mostly because Imperial’s Kearl project was not able to ramp up production in July. Substantial increases were achieved in August and September according to the company, however. Crude oil and condensate production, which includes bitumen but not synthetics, is estimated at 2.39 mb/d in 3Q13, a 290 kb/d y‐o‐y gain. After a 2Q13 that included heavy maintenance and a significant decline for synthetics from 1Q13’s record production of 980 kb/d, we expect that 4Q13 will achieve a new quarterly record of 1.05 mb/d, building on 3Q13’s 970 kb/d. Maintenance on Suncor’s U2 upgrader was completed in early October, but
0
200
400
600
800
1000
1200
1400
2006 2008 2010 2012 2014
Bakken and Eagle Ford Production (2006-14)
Bakken
Eagle Ford
kb/d

INTERNATIONAL ENERGY AGENCY ‐ OIL MARKET REPORT SUPPLY
11 OCTOBER 2013 23
increasing need for maintenance on older projects and staffing shortages could negatively affect Canadian synthetics growth in the medium term. In the long run, in situ production of bitumen that is blended for transport, rather than mining/upgrading synthetic projects, will likely have a much greater share of production because much of the resource is only recoverable in situ, and unit costs are lower. In September, the Kirby South thermal in situ project came online two months ahead of schedule, which will add 40 kb/d of production by the end of 2014. However, offshore Newfoundland, the Terra Nova platform will have its maintenance that started in September extended from four to 11 weeks, during which production, which was at 60 kb/d in July, will be completely shut in. Also offshore, Statoil made a find of 300 million‐600 million barrels in deepwater at Bay du Nord in the Flemish Pass Basin, the company’s largest‐ever discovery outside of Norwegian waters, and one of the largest conventional oil finds ever in Canada. Mexico – August actual, September preliminary: Pemex data show that crude oil production in August was 2.51 mb/d, a 35 kb/d increase on July, as the Zaap and Maloob fields returned to trend after July’s lows. Despite two hurricanes in September that temporarily closed two oil ports and air and sea operations at Pemex rigs, oil production seems to have been unaffected. Preliminary figures from the company show that crude oil production remained basically unchanged from August, at 2.52 mb/d. Total liquids production for 3Q13 was 2.88 mb/d, down 45 kb/d y‐o‐y, as gradual quarterly declines continue.
North Sea
Norway – July actual, August provisional: Final data from NDP confirm as July to have been an outstanding month on the Norwegian shelf. Total liquids production of 1.98 mb/d was the highest of 2013, despite occurring during the summer maintenance season. Preliminary figures indicate that August, although lower in output than July, was still significantly higher than we had expected, at 1.82 mb/d (total liquids). This is the same level of production as February and March of this year, and therefore, a high level to achieve during the summer maintenance season. Maintenance at the Alvheim, Gaupe, Hyme, Njord, Troll, Vilje, and Volund fields brought crude oil production down to 1.48 mb/d in August, a m‐o‐m drop of 100 kb/d. Looking at September, the last month of the maintenance season, we forecast a decline, though given the better‐than‐expected output of the Norwegian sector this year, we have raised our forecast for estimated total liquids by 30 kb/d to 1.64 kb/d, despite the partial shut‐down at the 240‐kb/d Ekofisk J platform for repairs. Delays in October loadings at Ekofisk have been announced. Some of the expected decline for September is also in reduced NGL output, as the Troll gas fields had an outage in the first half of the month. Statoil also announced that Njord, which had been shut‐in at the end of July, will not start up again until mid‐2014 due to extended maintenance. Nevertheless, we expect that 4Q13 total liquids production will finish strongly for the year, at 1.93 mb/d, of which crude oil is estimated to be 1.58 mb/d. Looking further ahead, the newly‐elected government announced at the end of September that the Lofoten Islands offshore area will not be opened to hydrocarbons exploration.
1.40
1.90
2.40
Jan Mar May Jul Sep Nov Jan
mb/d Norway -Total Supply
2011 20122013 2014 forecast2013 forecast
500
650
800
950
1,100
1,250
1,400
Jan Mar May Jul Sep Nov
BFOE* Crude
2010 20112012 2013
kb/d
*Includes Brent, Ninian, Forties, ETAP, Ekofisk, Oseberg

SUPPLY INTERNATIONAL ENERGY AGENCY ‐ OIL MARKET REPORT
24 11 OCTOBER 2013
-100 0 100 200 300 400 500
OECD North AmericaTotal Non-OPEC
Total OECDFormer USSR
Total Non-OECDAfricaChina
Middle EastEast Europe
Global BiofuelsOther Asia
OECD PacificOECD EuropeLatin America
Changes in forecast non-OPEC annual growth for 2014 since the MTOMR, in kb/d
UK – June actual, July provisional: June production, as preliminary data had indicated, fell compared to May, with total liquids declining by about 100 kb/d, to 835 kb/d. July preliminary data shows similar maintenance levels as for June, with production up slightly to 855 kb/d. Our expectation is that August data will show that this was the peak maintenance month of the year, lowering offshore crude production to 590 kb/d, and total liquids to 650 kb/d for the month. If so, then this will be only the second time that UK offshore crude oil production will have dropped below 600 kb/d for a month in recent decades. The Forties pipeline was shut down at the beginning of August, lowering cargoes for the month. Forties loadings were again delayed in September, indicating possible production outages on the system, although overall we expect that production will increase in September by 60 kb/d. In September, the UK government announced a $31‐billion tax relief programme on decommissioning costs that is designed to spur greater investment in the upstream sector. The 115 kb/d q‐o‐q increase in UK 4Q13 offshore production combined with the 90 kb/d q‐o‐q rise in Norwegian production indicate a weakening of support for the Brent marker compared to August and September. BFOE crude supply, having declined to 700 kb/d in September, is expected to increase by about 200 kb/d in October, with scheduled BFOE loadings recently revised upward to 871 kb/d for that month.
Looking at 2014 Non-OPEC Supply Growth
Since the publication of the Medium‐Term Oil Market Report last May, the amount of total non‐OPEC production growth forecast for 2014 has increased by 360 kb/d, to 1.72 mb/d. Non‐OPEC growth of such magnitude looks high by historical standards, particularly in absolute terms, where it is the highest y‐o‐y growth in decades. Yet, outside of the well‐known revolution in non‐conventional oil in North America that continues to surpass expectations, such a large annual gain was mostly expected, and other recent changes to the forecast are in response to new developments.
As one can see from the chart below, ‘Changes in forecast non‐OPEC annual growth for 2014 since the MTOMR’, the increase comes from three sources: North America, the FSU and Africa.
Changes in the forecast for North America span both the US and Canada. Forecast total liquids growth for the US has been increased by 245 kb/d, taking the annual growth rate up from 5.9% to 8.1%, and total growth to 830 kb/d (but still lower than 2013’s increase of 1.02 mb/d). In light of the continued strength
of light tight oil production, particularly at Eagle Ford and the Bakken, our latest forecast increases projected crude‐oil growth by 165 kb/d. The boom in liquids coming from increases in wet gas production in places such as the Marcellus and Utica will continue into 2014, we believe, and the total NGL production forecast for 2014 has been increased by 75 kb/d. Investments in transport seen in the US, both in pipeline and rail, will help unlock this source of incremental supply.
Forecast total liquids growth for Canada has been adjusted upwards by 180 kb/d, to 255 kb/d, taking the annual growth rate from 2.0% to 6.4%. We now believe that the number of bitumen projects either already ramping up or to come online before the end of 2014 will add about 180 kb/d of
net growth, up from our assessment of 75 kb/d of annual growth in May, when some projects’ start‐up dates or their ability to ramp up were less clear. Much the same thing can be said for synthetics projects, where we now see growth of 70 kb/d for 2014, up from 10 kb/d projected earlier. As in the US, commensurate investments are being made in transport.

INTERNATIONAL ENERGY AGENCY ‐ OIL MARKET REPORT SUPPLY
11 OCTOBER 2013 25
Looking at 2014 Non-OPEC Supply Growth (continued)
Kazakhstan accounts for the bulk of the reassessment of FSU production growth. An important change since the MTOMR is that the Kashagan field has come online (please see ‘Kashagan start‐up poses questions.’) We had previously taken a conservative approach to substantial production coming from the field in 2014, but we now have added about 140 kb/d to production from Kashagan for that year. Changes to the Russian forecast are relatively minor in comparison: Instead of a slight decline of 10 kb/d forecast earlier for Russia, we now have a small gain of 35 kb/d for 2014. This, in part, is based on an assessment of the level of investments done by Russian companies on their fields. However, the growth rate has only marginally risen to 0.3% from ‐0.1%, leaving our basic forecast of steady production for Russia in 2014 vs. 2013 essentially unchanged.
For Africa, a 95 kb/d increase in the growth forecast is in large part explained by recent improvements in the political outlook for South Sudan, and evidence that production has been able to ramp up in that country. There are also small increases in growth from places such as Ghana and Gabon.
That being said, our forecast does see some places declining more than previously, or having growth that is not as strong as previously forecast. Given project delays, we have lowered the growth in crude oil production for Brazil by 10 kb/d. We no longer expect that the UK will be able to sustain a production increase next year of 50 kb/d, but rather project yet another annual decline – down 15 kb/d in the forecast. Meanwhile, a lower‐than‐expected 2013 production level for China due to flooding increases the 2014 growth rate without an increase in expected production for that year.
Non-OECD
Latin America
Brazil – August preliminary: August crude oil production bounced back by 35 kb/d from July’s 125 kb/d drop, to 2.02 mb/d, on the completion of maintenance on the Marlim Sul field. Total liquids for August (not including ethanol) achieved 2.11 mb/d. The remainder of 2013 is expected to show m‐o‐m increases, despite some possible maintenance in the Campos Basin in October. Several projects are coming online in 4Q13. Production from the second phase of the Parque das Conchas commenced in early October, adding 10 kb/d within two months, and 35 kb/d by the end of 2014. The 140‐kb/d Papa Terra FPSO will start up before the end of October, achieving 10 kb/d in 4Q13 and 40 kb/d by mid‐2014. Most importantly, the P‐55 platform on the giant Roncador field will come online in December, as work on the platform was completed in mid‐September and testing has begun. Together with the P‐62 platform scheduled to come online before the end of 2H14, Roncador’s production is expected to be some 150 kb/d higher by the end of 2014 than August’s production of 260 kb/d. In other developments, in September, Chevron reached a settlement with the government for the March 2012 oil spill at the Frade field. Production was shut down until May 2013, but the company has been unable to return to pre‐shutdown levels (which peaked at 80 kb/d in July 2011). Production declined in August for the second consecutive month, to 12 kb/d. The financially‐troubled OGX, whose Tubarão Azul field halted production in August, may lose its licenses on additional fields if it refuses to develop them, despite the company declaring the fields uneconomic with current technology. Petrobras, which is still the dominant producer in Brazil by far, has a $237‐billion capital expenditure program for the next five years, including $147 billion for upstream oil and gas E&P. We estimate that Brazilian crude oil production will increase by about 160 kb/d in 2014 y‐o‐y, much of it on the base of this investment, though it has come at the price of Petrobras acquiring a very‐high debt of $64 000 per boe/d, prompting a downgrading of the company’s debt by one of the rating agencies.
1.70
1.90
2.10
2.30
2.50
Jan Mar May Jul Sep Nov Jan
mb/d Brazil - Crude Oil
2011 20122013 2014 forecast2013 forecast

SUPPLY INTERNATIONAL ENERGY AGENCY ‐ OIL MARKET REPORT
26 11 OCTOBER 2013
Asia
China – August preliminary: August data shows Chinese production fell by 80 kb/d to 4.0 mb/d, a second‐consecutive monthly decline. Following floods at Daqing in August, as well as from the lingering effects of July’s floods in other areas, Chinese production reached its lowest level since October 2011. Chinese production is expected to grow by about 95 kb/d in 2014. Sources of that growth include the increasing use of horizontal wells on the Tarim field and investment in offshore fields in the Bohai Bay. In addition, the flood impact of 2013 has led to a forecast decline in production vs. 2012, of ‐25 kb/d.
3.90
4.10
4.30
4.50
Jan Mar May Jul Sep Nov Jan
mb/d China -Total Supply
2011 20122013 2014 forecast2013 forecast
-0.2
0.0
0.2
0.4
0.6
0.8
1.0
2000 2002 2004 2006 2008 2010 2012 2014
mb/d FSU Oil Supply - Annual Change
Russia Azerbaijan Kazakhstan Turkmenistan
Former Soviet Union (FSU)
Russia – August actual, September provisional: Russian output was essentially unchanged overall for September compared to August, at 10.12 mb/d of crude and 10.89 mb/d of total liquids. For 4Q13, the respective figures are estimated at 10.03 mb/d and 10.82 mb/d. Against the relentless declines of mature fields, Russian producers have managed to bring on just enough new projects and investments in ongoing projects to counter these declines. Hence, 2013 crude oil production is expected to be 50 kb/d higher y‐o‐y than 2012, and 2014 to be 15 kb/d lower than 2013 y‐o‐y (which are basically flat in percentage terms). A few highlights of such efforts in 2013/2014 include:
Lukoil invested about $3.9 billion in 1H13 on domestic E&P, much of which was spent on development drilling in Siberia and the Komi Republic.
Bashneft has made investments to increase the usage of horizontal drilling and modern technology, as well as brought on the Trebs/Titov fields.
After 30 exploration wells drilled by Gazprom in the Arctic Sea in the past 15 years, two sizable projects are going forward, Prirazlomnoye and Kirinskii. The Prirazlomnoye platform is expected to begin drilling for production in October, with initial output before the end of the year. Kirinskii will bring on condensate production in 2014.
Gazprom Neft has increased production on the giant Priobsk field to a record 275 kb/d in August, as in the first seven months of the year, 194 new wells were drilled and 86 hydrofracturing operations were carried out. The company is also investing in multi‐stage hydrofracturing on low permeability reservoirs on the Sutorminsk, Umseisk, Severo‐yangtinsk, and Yety‐Purovsk fields that are expected to yield new production in 2014.
Rosneft will commence associated gas reinjection on the 1.4‐billion barrel Verkhnechonsk field by the end of 2014.
Note that Rosneft monthly production numbers in IEA data series from September 2013 onward include all former TNK‐BP assets acquired by Rosneft. Hence, Rosneft’s production appears to increase from 2.51 mb/d in August to 3.77 mb/d in September, but, in fact, taking into account all of those assets over the reference period, production declined slightly from 3.79 mb/d in August.

INTERNATIONAL ENERGY AGENCY ‐ OIL MARKET REPORT SUPPLY
11 OCTOBER 2013 27
Kazakhstan – August preliminary: As forecast, Kazakhstan’s total liquids production declined in August by 120 kb/d, to 1.59 kb/d, as maintenance on Tengiz reduced production to 450 kb/d, a 115 kb/d m‐o‐m decline. The headline news of September is that the long‐delayed, giant Kashagan field finally started up (please see “Kashagan Start‐up Poses Questions”). We estimate the field’s contribution to 4Q13 output at a relatively modest 55 kb/d, taking 4Q13 Kazakhstan total liquids production up to 1.76 mb/d (of which 1.4 mb/d crude). In September, state oil company KMG announced that a $23‐billion plan to expand output at Tengiz to 825 kb/d by 2H18 had been approved by the government. Kazakhstan’s President Nazerbayev declared that same month that the country should take a conservative approach to its crude oil production in future years, and not attempt to produce more than 2 mb/d.
Latest month vs.
Jul 13 Aug 12
Crude
Black Sea 1.93 1.81 1.74 1.78 1.80 1.80 1.78 1.80 1.71 -0.10 -0.08
Baltic 1.50 1.67 1.78 1.69 1.60 1.68 1.40 1.35 1.32 -0.03 -0.43
Arctic/FarEast 0.67 0.65 0.64 0.72 0.78 0.80 0.77 0.81 0.79 -0.02 0.17
BTC 0.70 0.66 0.64 0.59 0.58 0.71 0.73 0.70 0.69 -0.01 0.06
Crude Seaborne 4.80 4.79 4.80 4.78 4.76 5.00 4.68 4.65 4.50 -0.15 -0.27
Druzhba Pipeline 1.17 1.08 0.98 0.98 0.99 1.02 1.04 1.08 1.04 -0.04 0.03
Other Routes 0.53 0.52 0.53 0.54 0.55 0.54 0.52 0.55 0.54 -0.01 0.02
Total Crude Exports 6.50 6.39 6.31 6.30 6.31 6.55 6.25 6.29 6.09 -0.20 -0.22
Of Which: Transneft1 4.18 4.22 4.24 4.10 4.09 4.15 3.90 3.91 3.78 -0.14 -0.54
Products
Fuel oil2 1.58 1.72 1.83 1.61 1.61 1.69 1.63 1.61 1.43 -0.18 -0.52
Gasoil 0.77 0.79 0.76 0.79 0.97 0.84 0.84 0.81 0.76 -0.05 -0.05
Other Products 0.43 0.44 0.45 0.47 0.48 0.48 0.49 0.56 0.54 -0.02 0.03
Total Product 2.77 2.95 3.04 2.87 3.06 3.01 2.96 2.99 2.73 -0.26 -0.53
Total Exports 9.27 9.34 9.35 9.17 9.36 9.57 9.22 9.28 8.82 -0.46 -0.75
Imports 0.09 0.09 0.08 0.09 0.07 0.06 0.07 0.08 0.08 -0.01 -0.02
Net Exports 9.18 9.25 9.27 9.08 9.29 9.50 9.14 9.20 8.74 -0.45 -0.74 Sources: Argus M edia Ltd, IEA estimates1Transneft data exclude Russian CPC volumes.2Includes Vacuum Gas Oil
Aug 13
FSU Net Exports of Crude & Petroleum Products(million barrels per day)
2011 2012 3Q2012 4Q2012 1Q2013 2Q2013 Jun 13 Jul 13
FSU net exports plunged by 450 kb/d to 8.74 mb/d in August, their lowest level since November 2008. The drop was split between crude (‐200 kb/d) and products (‐260 kb/d) after high refinery throughputs and healthy domestic demand curtailed shipments. Crude exported via Black Sea ports experienced the largest monthly drop, falling by 100 kb/d after volumes of Russian and Kazakh crude shipped outside the Transneft network fell away. In the Baltic, shipments inched down by 30 kb/d to 1.3 mb/d, as exports from Primorsk fell to 870 kb/d, their lowest since summer 2004. The scarcity of Urals pushed prices for the grade in both Northwest Europe and the Mediterranean to rare premiums over North Sea dated in July and early‐August. Urals dropped in relation to Brent over late‐August and September as supply rebounded, notably in the Baltic. Preliminary loading schedules indicate Urals exports should further edge higher in October, as Russian refineries curb runs due to maintenance. In the east, flows through the ESPO pipeline dropped by 60 kb/d with Kozmino volumes declining by 50 kb/d and Rosneft shipments through the Chinese spur sliding by 10 kb/d. Meanwhile, Sakhalin exports rose by 30 kb/d as a rise in Sokol grade out of De Kastri offset a fall in Vityaz from Sakhalin Energy. It is anticipated that combined Sakhalin volumes will fall further in September due to scheduled maintenance. Total product exports now stand at 2.7 mb/d, 530 kb/d below a year ago, due to apparently robust domestic demand. The drop spanned all product categories, notably fuel oil and gasoil which decreased by 180 kb/d and 50 kb/d, respectively. Furthermore, despite the recent start up of Rosneft’s upgraded

SUPPLY INTERNATIONAL ENERGY AGENCY ‐ OIL MARKET REPORT
28 11 OCTOBER 2013
Tuapse refinery expected to produce increased light products at the expense of fuel oil, ‘other products’ (here including naphtha and gasoline) fell by 20 kb/d as, for the moment at least, the refinery appears geared towards the Russian market.
Kashagan Start-up Poses Questions
On 11 September, the North Caspian Operating Consortium (NCOC), announced that production had started on the super giant Kashagan field offshore Kazakhstan. NCOC is the group of companies with stakes in the field, including several super majors. With some 35 billion barrels in place, and estimated recoverable reserves of 9 billion barrels, Kashagan ranks as the world’s fourth‐largest known offshore oil field. The project has been notorious for its difficulties, from associated poisonous hydrogen sulphide gas to winter sea ice, as well as for underestimates of costs and development times. Total cost estimates for development of the field have risen to $136 billion from an initial $57 billion, and for the first phase alone, the development budget was increased in 2012 by $8 billion to $46 billion. The first phase, the only phase whose production outlook appears clear at this time, is expected to eventually ramp up to 370 kb/d, with 180 kb/d achieved in 2014. Further increases in phase‐one production to 450 kb/d may be possible with gas injection. As mentioned in last month’s Report, NCOC was under pressure to produce by 1 October, or the consortium risked losing government compensation of certain development costs under the terms of the PSA.
NCOC claims that output in September reached a daily high of 48 kb before a (non‐poisonous) gas leak on 25 September shut down production. Production restarted on 7 October, and the Kazakhstan Oil Ministry has stated that approximate commercial levels of 75 kb/d will still be achieved for the month. Given that the field has already experienced an outage, as well as the possible need for maintenance in order to sustain higher production levels in 2014, we estimate that commercial production levels will not be achieved until sometime in November, and production levels of 180 kb/d may not be achieved until 3Q14.
KAZAKHSTAN
China
Russia
KyrgyzstanUzbekistan
Turkmenistan
Georgia
TurkeyAzerbaijan
Omsk
Pavlodar
Atasu
AlashankouKumkolAralsk
KenkiyakAtyrau
Novorossiisk
Kuryk
CPC Pipeline
Baku
planned pipelineexisting pipeline
Kashagan Crude Export Options
This map is without prejudice the status and sovereignty over any territory, to the delimitation of international frontiers and boundaries and to the name of any territory, city or area.
The field’s start‐up has prompted much debate as to how its crude will reach markets. In the short‐term, and independent of the recent problems at the field, the CPC pipeline is likely to be used as the main export conduit. However, preliminary loading schedules for both September and October do not indicate an uptick in CPC volumes with flows expected to remain below May’s 2013 peak of 740 kb/d.
In the longer term, an expanded CPC pipeline is unlikely to be sufficient to handle all future volumes. A number of other options have been mooted, including moving the oil north through the Transneft network, railing shipments to Black Sea ports and using Kazakhstan’s pipeline network to send volumes to China. It may not be a coincidence that this month the Kazakhstani government announced that the expansion of the Atashu‐Alashankou pipeline to China was likely to be completed by end‐2013, well ahead of schedule. With CNPC due to finalise their acquisition of an 8.33% stake in Kashagan, this route may be used to export their share of production. A further tranche of the expanded capacity is also likely to be used to export Kazakh crude to China under a swap agreement with Rosneft, whereby the latter will supply Kazakhstan‘s Pavlodar refinery with 140 kb/d of Urals in return for, initially at least, Kazakh Kumkol crude flowing to China.

INTERNATIONAL ENERGY AGENCY ‐ OIL MARKET REPORT OECD STOCKS
11 OCTOBER 2013 29
OECD STOCKS
Summary
OECD industry stocks drew counter‐seasonally by 7.8 mb in August, to 2 660 mb. Total oil stocks covered 58.6 days of OECD forward demand at end‐month, 0.1 day above the five‐year average and 0.5 day lower than twelve months ago.
A steep 23.9 mb draw in crude oil inventories led the August stock decline. Refined products built by a muted 16.6 mb to cover 31.1 days of forward OECD demand at end‐August, 0.4 day above end‐July.
The OECD industry stock build for July was revised downwards to 4.6 mb, less than one fourth the 21.9 mb average build for the month.
Preliminary data point to a 1.7 mb counter‐seasonal build in OECD total oil inventories in September following a build in OECD Americas more than offsetting draws in Asia Oceania and Europe.
Reported changes in Chinese oil inventories point to a record 20.6 mb crude stock build in August after a tranche of newly built commercial storage capacity was filled.
-150
-100
-50
0
50
100
Aug 11 Feb 12 Aug 12 Feb 13 Aug 13
mbOECD Industry Total Oil Stocks
Relative to Five-Year Average
Asia Oceania AmericasEurope OECD
-4.0
-2.0
0.0
2.0
4.0
6.0
8.0
Aug-11 Feb-12 Aug-12 Feb-13 Aug-13
OECD Total Oil StocksRelative to Five Year AverageIn Days of Forward Demand
Americas EuropeAsia Oceania OECD
OECD Inventory Position at End-August and Revisions to Preliminary Data
OECD industry inventory drew counter‐seasonally by 7.8 mb in August, to 2 660 mb. Since this draw was in contrast to the 11.5 mb five‐year average build for that month, the deficit of OECD stocks to five‐year average levels increased to 74.9 mb, its widest since May 2004. Measured in days of forward OECD demand, however, OECD stocks tell another story and look somewhat looser than they otherwise appear, covering 58.6 days at end‐August, 0.1 day above the five‐year average, but 0.5 day lower than 12 months ago. The August stock draw was driven by a steep 23.9 mb slide in crude oil, more than twice the 10.9 mb five‐year average draw for that month. Japan alone accounts for much of the drop with a 11.6 mb crude draw, largely after stocks were run down at the 140 kb/d Sakaide refinery in preparation for its closure. Despite high global refinery runs, refined products built by only 16.6 mb, weaker than the 21.1 mb five‐year average rise. Mirroring August 2012, ‘other products’ pushed stocks upwards, building by a sharp 13.0 mb, with middle distillates posting a further 11.2 mb increase. However, product builds were tempered by a broadly seasonal 6.2 mb decrease in motor gasoline, after refiners in North America wound down stocks in preparation for the switch to winter‐grade fuel. Regardless, OECD refined products covered 31.1 days of forward demand at end‐August, 0.4 day above end‐July and 0.2 day above twelve months ago.

OECD STOCKS INTERNATIONAL ENERGY AGENCY ‐ OIL MARKET REPORT
30 11 OCTOBER 2013
(million barrels)
Americas Europe Asia Oceania OECD
Jun-13 Jul-13 Jun-13 Jul-13 Jun-13 Jul-13 Jun-13 Jul-13
Crude Oil 9.4 13.9 0.9 1.9 0.0 -6.8 10.3 8.9 Gasoline 0.0 -3.3 0.0 2.3 0.0 0.3 0.0 -0.7 Middle Distillates 0.0 -0.1 1.8 3.5 0.0 -0.5 1.8 2.9 Residual Fuel Oil 0.0 0.5 0.1 2.4 0.0 0.1 0.1 3.1 Other Products 0.0 -3.1 -0.8 -8.3 0.0 0.3 -0.8 -11.2 Total Products 0.0 -5.9 1.2 -0.1 0.0 0.1 1.2 -5.9 Other Oils1 1.1 4.1 0.0 1.9 0.0 0.1 1.1 6.1 Total Oil 10.4 12.1 2.1 3.6 0.0 -6.6 12.5 9.1 1 Other oils includes NGLs, feedstocks and other hydrocarbons.
Revisions versus 12 September 2013 Oil Market Report
Upon the receipt of more complete data, the estimate of end‐July OECD commercial oil stocks was revised upwards by 9.1 mb. However, since June data were also adjusted upwards, by 12.5 mb, the 8.0 mb stock build for July reported last month was cut to 4.6 mb, far weaker than the 21.9 mb average build for the month. Revisions were concentrated in OECD Americas as crude holdings there were raised by 9.4 mb and 13.9 mb for June and July, respectively. Additionally, the estimate of Italian inventories of ´other products’ has been revised lower from January 2011 onwards.
Am Europe As. Ocean Total Am Europe As. Ocean Total Am Europe As. Ocean Total
Crude Oil -3.0 -8.1 -12.9 -23.9 -0.10 -0.26 -0.41 -0.77 -0.17 -0.03 0.01 -0.19 Gasoline -6.5 0.7 -0.5 -6.2 -0.21 0.02 -0.02 -0.20 0.00 -0.08 0.00 -0.09 Middle Distillates 5.4 1.5 4.3 11.2 0.17 0.05 0.14 0.36 0.03 -0.08 -0.03 -0.08 Residual Fuel Oil -2.6 0.0 1.2 -1.4 -0.09 0.00 0.04 -0.05 0.00 -0.03 -0.01 -0.03 Other Products 9.4 0.5 3.1 13.0 0.30 0.01 0.10 0.42 0.34 -0.02 -0.02 0.29 Total Products 5.7 2.7 8.2 16.6 0.18 0.09 0.26 0.53 0.37 -0.21 -0.06 0.09 Other Oils1
-1.5 0.7 0.4 -0.4 -0.05 0.02 0.01 -0.01 0.12 -0.02 0.02 0.11 Total Oil 1.2 -4.7 -4.3 -7.8 0.04 -0.15 -0.14 -0.25 0.32 -0.27 -0.04 0.01 1 Other oils includes NGLs, feedstocks and other hydrocarbons.
(million barrels) (million barrels per day) (million barrels per day)
Preliminary Industry Stock Change in August 2013 and Second Quarter 2013August 2013 (preliminary) Second Quarter 2013
Preliminary data point to a slight 1.7 mb counter‐seasonal build in OECD total oil inventories in September following a 5.5 mb build in OECD Americas more than offsetting draws in Asia Oceania (‐3.4 mb) and Europe (‐0.5 mb). Crude stocks built by a strong 8.8 mb, in contrast to the 6.0 mb five‐year average draw for the month after builds in the Americas (7.4 mb) and Europe (3.7 mb) offset a further 2.2 mb decrease in OECD Asia Oceania. Refined products were led 5.4 mb lower following draws in middle distillates (‐6.1 mb) and fuel oil (4.0 mb). If preliminary data were to be confirmed by final data, this would suggest that OECD inventories drew by a slight 1.5 mb in 3Q13, equating to a slender 16 kb/d stock draw spread over the quarter.
Recent OECD Industry Stock Changes
OECD Americas
Commercial total oil inventories in OECD Americas edged up by 1.2 mb in August as a 5.7 mb build in refined products offset draws in crude oil and NGLs and other feedstocks. Despite continued high US refinery runs, crude stocks only drew by a seasonal 3.0 mb as domestic production also remained high. ‘Other products’ stocks surged by 9.4 mb amid lofty US propane production while those of middle distillates increased by a seasonal 5.4 mb. Meanwhile, motor gasoline inventories dropped by a seasonal 6.5 mb as refiners destocked in preparation for the switch to winter grade. Despite this, gasoline inventories remain high: 12.4 mb and 16.4 mb above the five‐year average and last year, respectively. All told, regional refined products holdings covered 30.2 days of forward demand, 0.5 day above end‐July.

INTERNATIONAL ENERGY AGENCY ‐ OIL MARKET REPORT OECD STOCKS
11 OCTOBER 2013 31
400
450
500
550
Jan Mar May Jul Sep Nov Jan
mbOECD Americas Crude Oil Stocks
Range 2008-2012 Avg 2008-2012
2012 2013
210
220
230
240
250
260
270
280
Jan Mar May Jul Sep Nov Jan
mbOECD Americas Gasoline Stocks
Range 2008-2012 Avg 2008-2012
2012 2013 Preliminary weekly data from the US Energy Information Administration (EIA) indicate that US total industry stocks rose by 5.5 mb in September, in line with seasonal trends. Stocks were boosted by a 7.4 mb build in crude oil on the back of robust domestic production and imports from Canada, offsetting exceptionally high refinery runs of near 16 mb/d. Despite runs were close to 900 kb/d above a year ago, crude stocks remained in line with five‐year average levels when measured in days of refinery runs, covering 25 days. The regional distribution of crude has dramatically shifted in recent months. Following the start‐up of several new pipeline projects and the restart of the Whiting refinery, inventories have shifted from the midcontinent to the Gulf Coast region. PADD 2 stocks fell by approximately 20 mb in 3Q13 while stocks in Cushing, Oklahoma plunged to 32.6 mb at end‐September, their lowest level since February 2012. Meanwhile, despite exceptionally strong runs, PADD 3 inventories have remained steady at close to 190 mb, thanks to higher crude transfers from PADD 2.
17
19
21
23
25
27
29
Jan Apr Jul Oct
days US Weekly Crude Run Cover
Range 2008-2012 5-yr Average
2012 2013
Source: EIA
10
20
30
40
50
60
Jan Apr Jul Oct
mb US Weekly Cushing Crude Stocks
Range 2008-12 5-yr Average
2012 2013
Source: EIA
US refined product stocks built by a slight 0.1 mb in September. However, given exceptionally high runs, it appears that, as in previous months, product builds were tempered by booming product exports that, according to EIA estimates, reached a record 3.3 mb/d in September. Nevertheless, motor gasoline built by 3.8 mb as refiners likely built stocks of winter‐grade product while holdings of middle distillates and fuel oil fell by 1.4 mb and 1.9 mb, respectively.
OECD Europe
OECD European industry inventories edged down counter‐seasonally by 4.7 mb in August. Crude oil holdings plunged by 8.1 mb, in sharp contrast to the 0.6 mb five‐year average draw for the month, following the collapse of Libyan exports. On an absolute basis, total oil stocks now stand at a record 90.5 mb deficit to the five‐year average. However, due to declining regional consumption, total oil inventories now cover 64.9 days of demand, only 0.7 day below the five‐year average.

OECD STOCKS INTERNATIONAL ENERGY AGENCY ‐ OIL MARKET REPORT
32 11 OCTOBER 2013
290
300
310
320
330
340
350
360
Jan Mar May Jul Sep Nov Jan
mbOECD Europe Crude Oil Stocks
Range 2008-2012 Avg 2008-2012
2012 2013
35
36
37
38
39
40
41
42
Jan Mar May Jul Sep Nov Jan
days
OECD Europe Total Products Stocks Days of Forward Demand
Range 2008-2012 Avg 2008-2012
2012 2013 Seasonally‐low refinery runs following poor margins weighed heavy on European refined product inventories as they rose by a muted 2.7 mb, far weaker than the 10.7 average build for August. Middle distillates led the build with a gain of 1.5 mb, but this was far weaker than the 9.1 mb five‐year average build for the month for that product. Motor gasoline, fuel oil and ‘other products’ edged up seasonally by less than 1 mb each. Refined products covered 37.9 days of forward demand at end‐August, 0.2 day above end‐July. Reports indicate that German homeowners continued to refill their heating‐oil tanks ahead of winter, lifting levels to 60.5 % of capacity in early September, up 3.5 percentage points from a month earlier and 3 percentage points above September 2012. Preliminary data from Euroilstock for EU‐15 countries plus Norway indicate that stocks edged down by a slender 0.5 mb in September, far weaker than the 22 mb average draw for the month. Refined product stocks fell by 4.1 mb after middle distillates and fuel oil inched down by 4.1 mb and 1.9 mb, respectively, while motor gasoline built by a counter‐seasonal 1.9 mb. Crude oil holdings built by 3.7 mb, in contrast to the 7.6 mb average draw for the month. Meanwhile, information pertaining to inventories of refined products held in independent storage in Northwest Europe indicate that total stocks rose driven by builds in fuel oil, gasoline and naphtha.
OECD Asia Oceania
140
150
160
170
180
Jan Mar May Jul Sep Nov Jan
mbOECD Asia Oceania Crude Oil
Stocks
Range 2008-2012 Avg 2008-2012
2012 2013
18
19
20
21
22
23
24
25
Jan Mar May Jul Sep Nov Jan
days
OECD Asia Oceania Total Products Stocks Days of Forward Demand
Range 2008-2012 Avg 2008-2012
2012 2013 Commercial inventories in OECD Asia Oceania drew counter‐seasonally by 4.3 mb in August largely after crude stocks at Japan’s Sakaide refinery were run down in preparation for its shuttering. Confirming preliminary data presented in last month’s Report, Japanese crude stocks plunged by 11.6 mb with regional holdings declining by 12.9 mb, faster than the 7.7 mb five‐year average draw for August. Since the draw was counter‐seasonal, the region’s deficit versus five‐year average levels increased to 14.4 mb, its widest since February 2012. Refined products built by 8.2 mb with all categories except motor gasoline (‐0.5 mb) posting seasonal builds. Middle distillates and fuel oil built by 4.3 mb and 1.2 mb,

INTERNATIONAL ENERGY AGENCY ‐ OIL MARKET REPORT OECD STOCKS
11 OCTOBER 2013 33
respectively. All told, at end‐August refined products covered 22.2 days of forward demand, 0.7 day and 0.5 day above end‐July and 12 months ago, respectively. Preliminary weekly data from the Petroleum Association of Japan point to a counter‐seasonal 3.4 mb decrease in Japanese industry inventories. Crude oil holdings edged down seasonally by a further 2.2 mb, although NGLs and refinery feedstocks posted a combined 0.2 mb rise. Refined products slipped by an unseasonal 1.3 mb after draws in motor gasoline, middle distillates and fuel oil more than offset a 0.6 mb rise in ‘other products’.
Recent Developments in Singapore and China Stocks
According to China Oil, Gas and Petrochemicals (China OGP), Chinese commercial crude oil inventories surged by 9.7 % in August. Expressed in volume terms, that would correspond to a 20.6 mb build, a record since IEA started tracking Chinese reported stock data in 2008. Since OGP data do not include stock changes in China’s Strategic Petroleum Reserve, the build points to the filling of a tranche of recently completed commercial storage capacity. Indeed, recent reports indicate that approximately 75 mb of commercial storage capacity is likely to be commissioned by end‐2013. Refined product holdings dropped by an equivalent 7.5 mb after draws in gasoline (4.7 mb, 7.9 %), gasoil (2.6 mb, 3.9 %) and kerosene (0.2 mb, 1.4 %).
(15)(10)(5)0 5
10 15 20 25
Aug 12 Nov 12 Feb 13 May 13 Aug 13
mb China Monthly Oil Stock Change*
Crude Gasoline Gasoil Kerosene
*Since August 2010, COGP only reports percentage stock change
Source: China Oil, Gas & Petrochemicals
7
9
11
13
Jan Apr Jul Oct
mb Singapore Weekly Light Distillate Stocks
Range 2008-2012 5-yr Average
2012 2013
Source: International Enterprise
Weekly data from International Enterprise pertaining to the land‐based storage of refined products in Singapore indicate that inventories there broadly held steady in September (‐0.3 mb m‐o‐m) after August’s record build. All told, total product levels now stand at approximately 43 mb, 2 mb and 5 mb above the five‐year average and last year, respectively. Despite climbing over the first part of the month, light‐distillate stocks drew steeply in the final week of September as imports from Southeast Asia dried up, so that levels finished slightly below end‐August. Middle distillates were the only product category to post a build (0.6 mb), due largely to a build of over 1 mb in early‐September as arrivals from Korea surged while Indonesian demand waned.

OECD STOCKS INTERNATIONAL ENERGY AGENCY ‐ OIL MARKET REPORT
34 11 OCTOBER 2013
1 Days of forw ard demand are based on average demand over the next three months
Days1 Million Barrels
Regional OECD End-of-Month Industry Stocks(in days of forward demand and million barrels of total oil)
50
52
54
56
58
60
62
Jan Mar May Jul Sep Nov Jan
Days OECD Total Oil
Range 2008-2012 Avg 2008-2012
2012 2013
45
50
55
60
Jan Mar May Jul Sep Nov Jan
Days Americas
Range 2008-2012 Avg 2008-2012
2012 2013
58
60
62
64
66
68
70
72
Jan Mar May Jul Sep Nov Jan
Days Europe
Range 2008-2012 Avg 2008-2012
2012 2013
42
44
46
48
50
52
54
56
Jan Mar May Jul Sep Nov Jan
Days Asia Oceania
Range 2008-2012 Avg 2008-2012
2012 2013
1,150
1,200
1,250
1,300
1,350
1,400
1,450
Jan Mar May Jul Sep Nov Jan
mb Americas
Range 2008-2012 Avg 2008-2012
2012 2013
860
910
960
1,010
1,060
Jan Mar May Jul Sep Nov Jan
mb Europe
Range 2008-2012 Avg 2008-2012
2012 2013
360
380
400
420
440
460
Jan Mar May Jul Sep Nov Jan
mb Asia Oceania
Range 2008-2012 Avg 2008-2012
2012 2013
2,500
2,550
2,600
2,650
2,700
2,750
2,800
2,850
Jan Mar May Jul Sep Nov Jan
mb OECD Total Oil
Range 2008-2012 Avg 2008-2012
2012 2013

INTERNATIONAL ENERGY AGENCY ‐ OIL MARKET REPORT PRICES
11 OCTOBER 2013 35
PRICES
Summary
Brent and WTI oil futures gradually eased between 6%‐7% over September and into early October. Futures prices for Brent flirted near six‐month highs and WTI hovered at a near 30‐month peak in the first week of September against a backdrop of supply outages and international alarm over Syria’s use of chemical weapons before turning lower on moderating geopolitical concerns.
The risk premium in oil futures tapered off following agreed plans for Syria to dispose of its chemical weapons under the auspices of the UN Security Council, combined with the nascent rapprochement between the presidents of Iran and the US during the UN General Assembly in late September. The shutdown of the US government also added downward pressure on oil prices, with worries that the impact on the economy will undermine oil demand growth. Prices for benchmark Brent and WTI were last trading at $110/bbl and $101.25/bbl, respectively.
Refined product crack spreads were mixed depending on the products and regions, with gasoil and diesel posting modest strength while gasoline was weak in all major markets, particularly the Atlantic basin. Gasoil crack spreads rose in the US and Europe, but fell in Asia. Market participants focused on low US stocks ahead of winter.
Rates for crude tankers experienced a mixed month in September with VLCCs and Aframax carriers outperforming Suezmaxes. Meanwhile, benchmark product tanker rates had a poor month.
80
85
90
95
100
105
110
115
120
Sep 12 Dec 12 Mar 13 Jun 13 Sep 13
$/bblCrude Futures
Front Month Close
NYMEX WTI ICE Brent
Source: ICE, NYMEX
100102104106108110112114116118
M1 2 3 4 5 6 7 8 9 10 11 12
$/bblICE Brent
Forward Price Curve
09 Oct 12 09 Aug 1306 Sep 13 09 Oct 13
Source: ICE
Market Overview
Brent and WTI oil futures gradually eased by 6%‐7% over September and into early October. Futures prices for Brent flirted near six‐month highs and WTI traded near a 30‐month peak in the first week of September against a backdrop of supply outages and international alarm over Syria’s use of chemical weapons. Oil futures retreated following plans for Syria to dispose of its chemical weapons under the auspices of the UN Security Council and signals from the presidents of Iran and the US during the UN General Assembly reviving hopes that confrontation over Tehran’s nuclear program could be avoided. ICE Brent futures fell by around $8/bbl over September, from a high of just over $116/bbl on 6 September to below $108/bbl on 1 October, but for the month averaged $112/bbl, up $0.80/bbl from August levels. WTI posted similar swings over the same period, from a high of around $110.50/bbl in early September to just a few cents above $102/bbl by 1 October. On the month, WTI gained a modest $0.31/bbl to average $106.23/bbl. Benchmark Brent and WTI were last trading at $110/bbl and $101.25/bbl, respectively.

PRICES INTERNATIONAL ENERGY AGENCY ‐ OIL MARKET REPORT
36 11 OCTOBER 2013
Iranian President Hassam Rouhani’s so‐called ‘charm offensive’ at the UN in late September, coupled with an historic phone call with US President Barak Obama, injected an unexpected level of equanimity into the oil market. The high‐level talks were the first to take place in more than 34 years. There have been no formal diplomatic relations between Iran and the US since the 1979 Iranian revolution and seizure of American embassy personnel. President Rouhani’s offer to engage in negotiations aimed at removing any "reasonable concerns" over the country's nuclear programme and President Obama’s pledge to spend the last three years of his term focussing on Middle East foreign policy, and, in particular, efforts to reach a diplomatic solution with Iran, provided a respite from the sabre‐rattling of the past 11 years. Nonetheless, few expect that the nascent rapprochement will lead to an easing of wide‐ranging sanctions on the country’s oil and finance sector in the near to medium term.
1200
1300
1400
1500
1600
1700
1800
70
80
90
100
110
120
Jan 12 May 12 Sep 12 Jan 13 May 13 Sep 13
IndexUS $/bbl NYMEX WTI vs S&P 500
NYMEX WTI S&P 500 (RHS)
Source: NYMEX
0
1
2
3
4
5
Sep 12 Dec 12 Mar 13 Jun 13 Sep 13
$/bbl NYMEX WTIM1 Daily Spread High-Low
Source: NYMEX
The shutdown of the US government further added downward pressure on oil prices, with worries that the impact on economic growth will undermine oil demand growth. A surge in equity markets mid‐month was not tracked by oil futures. The S&P 500 hit a record 1 725 after the Federal Reserve refrained from tapering its $85‐billion‐per‐month bond‐buying programme on 18 September but the gains proved fleeting under the weight of the US fiscal crisis.
-1.0
-0.5
0.0
0.5
1.0
1.5
2.0
2.5
3.0
Sep 12 Dec 12 Mar 13 Jun 13 Sep 13
$/bblCrude Futures
Front Month Spreads
WTI M1-M2 Brent M1-M2
Contango
Source: ICE, NYMEXBackwardation
-5.0
-2.5
0.0
2.5
5.0
7.5
10.0
12.5
15.0
Sep 12 Dec 12 Mar 13 Jun 13 Sep 13
$/bbl Crude FuturesForward Spreads
WTI M1-M12 Brent M1-M12
Source: ICE, NYMEX
Backwardation
Markets were supported by the loss of near 80% of Libyan crude oil production in September but restoration of some of the country’s western production in early October tempered prices. Refinery maintenance in Europe, Asia, Russia and the US is forecast to reduce runs to a seasonal low of 75.9 mb/d in October, a reduction of 1.4 mb/d from the 3Q13 average of 77.3 mb/d. Global refinery throughputs had surged to an all‐time high in July before easing slightly in August, compounding the impact of crude supply disruptions. Brent markets are expected to loosen with the supply of North Sea grades set to reach a 2013 high in November. As supply/demand balances looked set to ease, the backwardation for prompt contracts narrowed in September and into October. The Brent M1‐M2 spread contract contracted to $0.85/bbl in early October

INTERNATIONAL ENERGY AGENCY ‐ OIL MARKET REPORT PRICES
11 OCTOBER 2013 37
from $1.20/bbl in September and compared with just $0.25/bbl in June. Further out, the Brent M1‐M12 also narrowed in early October, to $6.85/bbl compared with $8.60/bbl in September.
Jul Aug Sep Sep-Aug % Week Commencing:Avg Chg Chg 09 Sep 16 Sep 23 Sep 30 Sep 07 Oct**
NYMEX
Light Sw eet Crude Oil 104.70 106.54 106.23 -0.31 -0.3 108.26 106.23 103.06 103.12 102.71
RBOB 126.20 124.55 114.81 -9.74 -8.5 115.77 113.41 112.02 110.22 110.31
No.2 Heating Oil 126.64 129.01 128.19 -0.83 -0.6 130.09 126.93 125.03 125.34 126.71
No.2 Heating Oil ($/mmbtu) 22.34 22.75 22.61 -0.15 -0.6 22.94 22.39 22.05 22.11 22.35
Henry Hub Natural Gas ($/mmbtu) 3.64 3.41 3.62 0.21 5.7 3.61 3.72 3.54 3.54 3.66
ICE
Brent 107.43 110.45 111.25 0.80 0.7 112.38 109.37 108.59 108.79 109.61
Gasoil 122.37 125.32 125.93 0.61 0.5 127.13 124.94 123.11 123.21 124.66
Prompt Month Differentials
NYMEX WTI - ICE Brent -2.73 -3.91 -5.02 -1.11 -4.12 -3.14 -5.53 -5.67 -6.90
NYMEX No.2 Heating Oil - WTI 21.94 22.47 21.96 -0.52 21.83 20.70 21.97 22.22 24.00
NYMEX RBOB - WTI 21.50 18.01 8.58 -9.43 7.51 7.18 8.96 7.10 7.60
NYMEX 3-2-1 Crack (RBOB) 21.65 19.50 13.04 -6.46 12.29 11.69 13.30 12.14 13.07
NYMEX No.2 - Natural Gas ($/mmbtu) 18.69 19.34 18.99 -0.35 19.33 18.67 18.52 18.56 18.69
ICE Gasoil - ICE Brent 14.94 14.87 14.68 -0.19 14.75 15.57 14.52 14.42 15.05
Source: ICE, NYM EX. ** Includes prices through 9 October
Prompt Month Oil Futures Prices(monthly and weekly averages, $/bbl)
Futures Markets
ICE Brent hedge funds liquidated their record net‐long positions between 27 August and 1 October as tensions surrounding Syria eased in mid‐September, prompting prices to plummet from $117/bbl to under $110/bbl. Money managers’ long‐to‐short ratio peaked by end‐August to 2.45 and steadily decreased throughout the month.
NYMEX WTI money managers behaved similarly although they started liquidating their assets earlier, consistently reducing their long exposure since end‐July. Due to the US government shutdown, the CFTC’s last “Commitments of Traders Report” available is for 24 September.
1.4
1.6
1.8
2.0
2.2
2.4
2.6
95
100
105
110
115
120
125
Aug 12 Nov 12 Feb 13 May 13 Aug 13
L/S$/bblICE Brent vs Money Managers
Long/Short ratio
ICE Brent L/S ratio
1.0
1.2
1.4
1.6
1.8
2.0
2.2
80
85
90
95
100
105
110
Aug 12 Nov 12 Feb 13 May 13 Aug 13
L/S$/bblNYMEX WTI vs Money Managers
Long/Short ratio
WTI Long/Short ratio
On the products side, New York hedge funds reduced their long positions in RBOB gasoline as prices fell more than $0.30/gallon at the end of the driving season. Gasoil and heating oil prices also tracked the decline in crude prices throughout September, with ICE and CME money managers accordingly reducing their net‐long stance.
In terms of open interest, while both contracts were relatively stable on a monthly basis moving within the 1% range, they posted a year‐on‐year growth of 18.5% and 30.8% for NYMEX WTI and ICE Brent,

PRICES INTERNATIONAL ENERGY AGENCY ‐ OIL MARKET REPORT
38 11 OCTOBER 2013
respectively. Brent global volumes surpassed WTI for the second time historically after March‐April this year, on the back of the Cushing‐based benchmark losing momentum, posting two consecutive monthly declines in its number of trades.
-200
0
200
400
600
800
Aug 11 Feb 12 Aug 12 Feb 13 Aug 13
('000 contracts)
WTI - BrentOpen Interest
Mth 1-5 Mth 6-12 Mth 13+
5
10
15
20
25
Sep 10 Mar 11 Sep 11 Mar 12 Sep 12 Mar 13 Sep 13
(mln) WTI vs BrentFutures trade volumes
WTI (ICE + CME) Brent (ICE + CME)
Source: CME, ICE
24 September 2013 Long Short Net Long/Short Net from Prev. Week
Net Vs Last Month
Producers' Positions 373.5 337.7 35.9 Long -6.0 -14.8
Swap Dealers' Positions 344.7 720.7 -376.0 Short 9.9 30.9
Money Managers' Positions 659.4 415.7 243.7 Long -1.7 -25.6
Others' Positions 408.5 331.4 77.0 Long -4.4 1.0
Non-Reportable Positions 95.0 75.6 19.4 Long 2.2 8.5
Open Interest 1881.1 -45.3 45.7
Source: CFTC
Thousand Contracts
Positions on Light Sweet Crude Oil (WTI) Futures
01 October 2013 Long Short Net Long/Short Net from Prev. Week
Net Vs Last Month
Producers' Positions 582.1 888.4 -306.3 Short 15.8 89.8
Swap Dealers' Positions 470.9 306.2 164.6 Long -3.6 -13.4
Money Managers' Positions 334.5 173.9 160.7 Long -7.2 -63.7
Others' Positions 83.4 116.3 -32.9 Short -4.9 -1.6
Non-Reportable Positions 43.4 29.5 13.9 Long -0.1 -11.1
Open Interest 1514.3 28.3 -14.3
Source: ICE
Positions on ICE Brent Crude FuturesThousand Contracts
Financial Regulation
Italy became the first country worldwide to tax high frequency trading (HFT) on stock markets on 4 September. This will be a closely‐watched test‐drive, as a draft EU proposal is being examined by the European Parliament and EU governments.
The EU Commission published its benchmark regulation draft on 18 September, regulating commodities among other financial indicators. Firms would be compelled to use ESMA‐complying benchmarks. National authorities would enforce the regulation except for ‘critical benchmarks’, for which colleges of national supervisors would be formed. Oil price reporting agencies (PRAs) would be required to make their sources sign a code of conduct. Fines for transgressors could be as high as 10% of yearly sales or €1m, whichever is higher.
Trading on the new swap‐exchange platforms began on October 2, though the CFTC is effectively closed due to the government shutdown.

INTERNATIONAL ENERGY AGENCY ‐ OIL MARKET REPORT PRICES
11 OCTOBER 2013 39
Spot Crude Oil Prices
Spot oil prices for benchmark crudes trended lower throughout September as tensions eased over the standoff with Syria, with Dubai and Brent posting a month‐on‐month average increase while WTI edged marginally lower. Seasonally declining refining runs curbed demand for prompt barrels despite the continued loss of Libyan and Iraqi supplies to the market. Stronger demand for heavier Mideast crudes pushed prices for Dubai up $1.20/bbl to a monthly average of $108.25/bbl but by end of the month prices were too rich. As refiners looked for alternatives, prices then settled $3/bbl lower.
80
85
90
95
100
105
110
115
120
Sep 12 Dec 12 Mar 13 Jun 13 Sep 13
$/bbl Benchmark Crude Prices
WTI Cushing N. Sea Dated Dubai
Copyright © 2013 Argus Media Ltd
-0.5
0.0
0.5
1.0
1.5
2.0
2.5
Sep 12 Dec 12 Mar 13 Jun 13 Sep 13
$/bbl Crude PricesPrompt Month Differentials
North Sea M1 - M2 Dubai M1 - M2
Copyright © 2013 Argus Media Ltd
Underscoring the easing the prompt price premium, Brent M1‐M2 differentials narrowed in early October to $0.80/bbl compared with $1.15/bbl in September while Dubai M1‐M2 was trading at $1.25/bbl compared with around $1.60/bbl in September. The price spread between Brent and Dubai crudes narrowed in September as the geopolitical risks eased. The Brent/Dubai spread contracted by around $0.60/bbl to an average $3.65/bbl from $4.28/bbl in August. An expected increase in North Sea supply, which underpin the Brent market, are expected to reach a 2013 high in November. In September spot prices for Brent rose by a relatively smaller $0.59/bbl, to $111.91/bbl, compared with Dubai. In contrast to the rise seen in the other major benchmarks, WTI spot prices declined by around $0.30/bbl, to an average $106.25/bbl in September. WTI prices have been under pressure from rising supplies of light tight oil and increased access to pipeline routes. The diverging market trends for the Atlantic basin markets is reflected in the widening spread between WTI and Brent in September, to an average $5.66/bbl compared with $4.80/bbl in August and $3.20/bbl in July.
-30
-25
-20
-15
-10
-5
0
Sep 12 Dec 12 Mar 13 Jun 13 Sep 13
$/bbl WTI vs North Sea Dated
Copyright © 2013 Argus Media Ltd
-8
-6
-4
-2
0
2
4
Sep 12 Dec 12 Mar 13 Jun 13 Sep 13
$/bbl North Sea Dated vs. Dubai
Dubai Mth1 - North Sea Dated
Copyright © 2013 Argus Media Ltd
Indeed, relatively weaker spot prices for US grades has seen the Light, Louisiana Sweet (LLS) crude trade at an atypical discount to Brent, in recent months. The LLS/Brent discount averaged ‐$3.50/bbl in

PRICES INTERNATIONAL ENERGY AGENCY ‐ OIL MARKET REPORT
40 11 OCTOBER 2013
September compared with ‐$0.45/bbl in August and a more typical premium of $2.60/bbl in July. Urals crude also lost its lustre compared with Brent in September, in part due to increased supplies of Russian exports in September, with the price spread between the two crudes widening further in early October. The Urals/Brent discount increased to $0.60/bbl in early October versus ‐$0.30/bbl on average in September and a more normal premium of $0.55/bbl in August.
-6
-4
-2
0
2
4
6
8
10
Sep 12 Dec 12 Mar 13 Jun 13 Sep 13
$/bbl Light Sweet Crude ArbitrageLLS vs. North Sea Dated
Copyright © 2013 Argus Media Ltd
-3.5-3.0-2.5-2.0-1.5-1.0-0.50.00.51.01.5
Sep 12 Dec 12 Mar 13 Jun 13 Sep 13
$/bbl UralsDifferentials to North Sea Dated
Urals (NWE) Urals (Med)
Copyright © 2013 Argus Media Ltd
Jul Aug Sep Sep-Aug Week Commencing:Avg Chg % 09 Sep 16 Sep 23 Sep 30 Sep 07 Oct**
Crudes
North Sea Dated 107.91 111.32 111.91 0.59 0.5 113.18 110.58 108.97 108.70 109.93
Brent (Asia) Mth 1 107.53 111.10 112.14 1.04 0.9 113.19 111.05 109.63 109.08 109.57
WTI (Cushing) Mth 1 104.69 106.54 106.25 -0.30 -0.3 108.26 106.23 103.10 103.12 102.71
Urals (Mediterranean) 108.74 111.89 111.61 -0.29 -0.3 113.03 110.32 108.25 108.05 109.23
Dubai 103.46 107.04 108.25 1.20 1.1 109.43 108.00 106.14 105.27 106.42
Tapis (Dated) 113.81 118.46 119.91 1.44 1.2 120.50 118.14 118.47 118.20 119.40
Differential to North Sea Dated
WTI (Cushing) -3.21 -4.78 -5.66 -0.89 -4.93 -4.35 -5.87 -5.58 -7.22
Urals (Mediterranean) 0.83 0.57 -0.30 -0.88 -0.15 -0.26 -0.72 -0.65 -0.70
Dubai -4.44 -4.28 -3.66 0.61 -3.75 -2.58 -2.83 -3.43 -3.52
Tapis (Dated) 5.90 7.14 8.00 0.85 7.32 7.56 9.50 9.50 9.47
Prompt Month Differential
Forw ard Cash Brent Mth1-Mth2 0.72 1.11 1.15 0.03 1.17 1.12 0.73 0.82 0.74
Forw ard WTI Cushing Mth1-Mth2 0.30 0.44 0.57 0.13 0.88 0.45 0.25 0.38 0.19
Forw ard Dubai Mth1-Mth2 0.57 1.06 1.61 0.55 2.08 1.94 0.98 1.18 1.22
Copyright © 2013 Argus M edia Ltd - All rights reserved ** Includes prices through 9 October
Spot Crude Oil Prices and Differentials(monthly and weekly averages, $ /bbl)
Spot Product Prices
Spot product crack spreads were mixed in September, with gasoil and diesel posting modest strength in most regions ahead of the winter season. As expected, gasoline was weak in all major markets and particularly in the Atlantic basin where the peak driving season drew to a close. The US Gulf Coast crack spreads for super unleaded gasoline and regular unleaded gasoline fell by $11/bbl and $9.80/bbl, respectively. Northwest Europe and Mediterranean crack spreads followed the downtrend in the US Gulf Coast, but less severely, off by $5.40/bbl and $4.50/bbl, respectively. While prices were pressured lower by ample supplies and seasonally lower demand the decline also reflected the switch to winter‐grade gasoline, which is cheaper to produce. US producers switched fuel specs in early September while European refiners started to produce winter‐grade in the second half of the month. High refinery runs in the US led to a counter‐seasonal rise in gasoline stocks. In Asia, gasoline crack spreads fell marginally due to higher crude costs and amid subdued deman. Elsewhere, Latin American demand for gasoline imports is reportedly high, in part due to continued problems in Venezuelan refining sector.

INTERNATIONAL ENERGY AGENCY ‐ OIL MARKET REPORT PRICES
11 OCTOBER 2013 41
-505
10152025303540
Sep 12 Dec 12 Mar 13 Jun 13 Sep 13
$/bblGasoline
Cracks to Benchmark Crudes
NWE Prem Unl USGC 93 ConvMed Prem Unl SP Prem Unl
Copyright © 2013 Argus Media Ltd
-16-14-12-10-8-6-4-2024
Sep 12 Dec 12 Mar 13 Jun 13 Sep 13
$/bblNaphtha
Cracks to Benchmark Crudes
NWE SPMed ME Gulf
Copyright © 2013 Argus Media Ltd
Naphtha crack spreads strengthened in September in Europe and Asia. Naphtha cracks were supported by reduced supplies in Northwest Europe as many of the region’s refiners cut runs on poor margins. In Asia naphtha cracks were buoyed by stronger demand from the petrochemical industry due to relatively higher LPG cost through most of September but by end month increased imports from Europe, India and the Middle East pressured the differentials.
Gasoil crack spreads diverged along geographic lines but outright levels were still healthy heading into the winder demand season. Crack spreads rose in the Atlantic basin while falling in Asia. Market participants focused on low US heating oil stocks ahead of the winter season. Diesel stocks were also running below the five‐year average. In Europe, diesel crack spreads strengthened on reduced supplies in tandem with seasonal refinery maintenance.
0
5
10
15
20
25
Sep 12 Dec 12 Mar 13 Jun 13 Sep 13
$/bbl Gasoil/Heating OilCracks to Benchmark Crudes
NWE Gasoil 0.1% USGC Heating OilMed Gasoil 0.1% SP Gasoil 0.05%
Copyright © 2013 Argus Media Ltd
810121416182022242628
Sep 12 Dec 12 Mar 13 Jun 13 Sep 13
$/bbl Diesel FuelCracks to Benchmark Crudes
NWE ULSD USGC ULSDMed ULSD SP Gasoil 0.05%
Copyright © 2013 Argus Media Ltd
Fuel oil crack spreads were marginally lower in September bar at the US Gulf Coast. Fuel oil demand in Asia was weaker as ship owners and power utilities reduced buying. Exceptionally, US fuel oil exports are going as far afield as Asia. As a result, bunker fuel oil supply in Houston area was tight in mid‐September, while Singapore stocks rose during the month.
-20
-15
-10
-5
0
5
10
Sep 12 Dec 12 Mar 13 Jun 13 Sep 13
$/bblLow-Sulphur Fuel Oil (1%)
Cracks to Benchmark Crudes
NWE LSFO 1% Med LSFO 1%Indonesia LSWR
Copyright © 2013 Argus Media Ltd
-30
-25
-20
-15
-10
-5
0
Sep 12 Dec 12 Mar 13 Jun 13 Sep 13
$/bblHigh-Sulphur Fuel Oil
Cracks to Benchmark Crudes
NWE HSFO 3.5% Med HSFO 3.5%SP HSFO 380 4%
Copyright © 2013 Argus Media Ltd

PRICES INTERNATIONAL ENERGY AGENCY ‐ OIL MARKET REPORT
42 11 OCTOBER 2013
Sep-Aug Week Commencing:Chg % 09 Sep 16 Sep 23 Sep 30 Sep 07 Oct**
Rotterdam, Barges FOB Differential to Dated Brent
Premium Unl 10 ppm 119.45 121.80 116.95 -4.85 -4.0 117.04 115.85 112.94 112.10 111.61 11.54 10.48 5.04
Naphtha 98.55 102.68 104.49 1.82 1.8 106.01 103.69 101.33 99.57 100.17 -9.35 -8.64 -7.42
Jet/Kerosene 122.52 125.91 125.94 0.03 0.0 127.15 124.53 123.31 123.46 125.35 14.62 14.59 14.03
ULSD 10ppm 124.88 128.40 129.59 1.19 0.9 131.20 128.47 126.82 127.17 128.10 16.97 17.08 17.68
Gasoil 0.1% 122.43 125.17 125.88 0.71 0.6 127.26 124.79 123.08 123.31 124.81 14.53 13.85 13.97
LSFO 1% 95.16 96.21 96.31 0.10 0.1 96.79 96.21 95.20 94.30 93.01 -12.75 -15.11 -15.60
HSFO 3.5% 92.34 92.58 91.71 -0.87 -0.9 91.60 91.55 91.32 91.14 89.82 -15.57 -18.74 -20.20
Mediterranean, FOB Cargoes Differential to Urals
Premium Unl 10 ppm 120.63 122.99 118.20 -4.79 -3.9 118.28 117.11 114.20 113.40 112.91 11.90 11.10 6.60
Naphtha 96.14 100.21 102.37 2.16 2.2 103.89 101.63 99.28 97.53 98.15 -12.60 -11.68 -9.23
Jet Aviation fuel 121.28 124.62 124.95 0.34 0.3 126.16 123.62 122.38 122.49 124.40 12.55 12.72 13.35
ULSD 10ppm 124.57 127.82 128.73 0.91 0.7 130.17 127.84 125.75 125.86 127.02 15.84 15.93 17.13
Gasoil 0.1% 122.39 125.05 126.18 1.13 0.9 127.50 125.34 123.54 123.72 125.49 13.66 13.15 14.57
LSFO 1% 96.44 97.68 97.55 -0.13 -0.1 97.84 97.37 96.66 96.09 94.72 -12.30 -14.21 -14.05
HSFO 3.5% 91.67 91.93 91.03 -0.89 -1.0 90.84 90.84 90.77 90.77 89.46 -17.06 -19.96 -20.57
US Gulf, FOB Pipeline Differential to LLS
Super Unleaded 137.97 133.56 119.83 -13.73 -10.3 119.01 117.77 116.10 113.93 113.97 27.31 22.69 11.59
Unleaded 124.08 122.07 109.66 -12.42 -10.2 110.54 107.94 106.05 104.66 105.43 13.43 11.20 1.42
Jet/Kerosene 121.65 126.22 123.03 -3.19 -2.5 124.90 122.48 119.45 120.28 122.05 10.99 15.35 14.79
ULSD 10ppm 125.20 127.77 126.66 -1.11 -0.9 128.68 125.50 123.41 123.28 124.71 14.55 16.90 18.43
Heating Oil 119.01 122.43 122.01 -0.42 -0.3 123.80 121.19 119.09 120.07 122.07 8.36 11.56 13.77
No. 6 3%* 91.25 93.07 94.56 1.50 1.6 94.34 94.46 93.78 93.00 91.85 -19.40 -17.80 -13.68
Singapore, FOB Cargoes Differential to Dubai
Premium Unleaded 121.70 117.06 117.34 0.28 0.2 116.93 115.89 115.71 113.68 114.50 18.24 10.01 9.09
Naphtha 97.91 101.33 103.04 1.71 1.7 104.56 102.83 100.15 98.05 98.39 -5.56 -5.71 -5.21
Jet/Kerosene 121.17 124.78 123.91 -0.87 -0.7 125.15 123.25 121.50 121.69 122.85 17.71 17.73 15.66
Gasoil 0.05% 123.07 124.14 123.61 -0.53 -0.4 124.50 123.01 121.57 122.57 124.08 19.61 17.10 15.36
LSWR Cracked 101.68 103.58 104.40 0.82 0.8 103.78 104.45 105.19 104.79 102.28 -1.78 -3.47 -3.85
HSFO 180 CST 95.38 95.62 96.15 0.54 0.6 95.42 96.12 96.64 97.22 96.03 -8.09 -11.42 -12.09
HSFO 380 CST 4% 93.93 95.25 95.31 0.06 0.1 94.57 95.16 95.98 97.05 95.78 -9.53 -11.79 -12.93
Copyright © 2013 Argus M edia Ltd - A ll rights reserved * Waterborne ** Includes prices through 9 October
Spot Product Prices(monthly and weekly averages, $ /bbl)
SepJul Aug Sep Jul Aug
Freight
Rates for crude tankers experienced a mixed month in September with VLCCs and Aframax carriers outperforming Suezmaxes. In the Middle East, rates for VLCCs firmed steadily over the month as cargoes were gradually drip fed into the market, slowly tightening fundamentals. By mid‐month the fixture count had already surpassed the summer peak reached in July.
0
5
10
15
20
25
Jan-12 Jul-12 Jan-13 Jul-13
US$/mt Daily Crude Tanker Rates
130Kt WAF - USGC VLCC MEG-Asia
80Kt UK - UK cont 100Kt Baltic - UK
5
10
15
20
25
30
35
40
Jan-12 Jul-12 Jan-13 Jul-13
US$/mt Daily Product Tanker Rates
38Kt Carib - USAC 37Kt UKC - USAC
75Kt MEG - Jap 30Kt SP - Jap
Copyright © 2013 Argus Media Ltd
Accordingly, rates on the benchmark VLCC Middle East Gulf – Asia route rose from $8.80/mt in early September to a high of $10.60/mt at the time of writing. Aframax vessels on trades in Northwest Europe and the Baltic experienced a rise in rates mid‐month after the release of a number of date‐specific

INTERNATIONAL ENERGY AGENCY ‐ OIL MARKET REPORT PRICES
11 OCTOBER 2013 43
cargoes out of Russia that tightened tonnage and pushed rates on the Baltic – UK route up by $2/mt to a high of over $8/mt in the first week of October. Suezmax rates on trades out of West Africa tumbled during September as demand remained low. A further millstone was the arrival of a number of vessels in the region ballasting from the Mediterranean where the loss of Libyan supply had reduced tanker demand. Consequently, by early‐October rates on the benchmark Suezmax West Africa – US Gulf trade coast sank below $11/mt. With bunker costs remaining high, this puts Suezmax vessel owners firmly in negative territory. Benchmark product tanker rates had a poor month in September with any rises being muted at best. The worst performing route was the UK – US Atlantic trade which softened steadily over the month to stand below $12/mt by early October. Interestingly, shipbrokers report that rates on backhaul US – European routes surged over September as European distillate demand remained high with refineries there entering maintenance. If US exports to Europe remain strong and US gasoline import demand remains weak it will likely see the US – Europe leg switch to become the more profitable front haul trade and the traditional Europe – US trade becoming the less important back haul trade.

REFINING INTERNATIONAL ENERGY AGENCY ‐ OIL MARKET REPORT
44 11 OCTOBER 2013
REFINING
Summary
Global refinery crude throughputs came off their seasonal peak in August but remained 1.2 mb/d above year‐earlier levels, at an estimated 77.6 mb/d. Non‐OECD Asia, the US, Russia and Africa led the annual growth. In contrast, OECD European runs contracted by 0.8 mb/d year‐on‐year. Refinery crude demand likely fell steeply from September onwards on the back of seasonal maintenance and lower margins, though US throughputs remained exceptionally robust.
The estimate of global refinery crude runs for 3Q13 was revised upwards by 100 kb/d since last month’s Report, to 77.3 mb/d. Higher US runs in September and slightly stronger‐than‐expected Indian runs in August lifted 3Q annual growth to an impressive 1.2 mb/d. Non‐OECD Asia and the US accounted for the bulk of the gains, though Russia and Africa also contributed. Growth is set to moderate in 4Q13, to 0.9 mb/d.
OECD crude runs fell 270 kb/d in August, to 37.7 mb/d, as higher Japanese runs failed to offset lower North American and European throughputs. Overall, OECD runs contracted by 320 kb/d y‐o‐y. The disparity in regional trends became more entrenched: US runs stood 480 kb/d above year earlier levels while those in Europe contracted by 790 kb/d. Despite unseasonably strong US crude runs in September, total OECD runs likely fell sharply, as the onset of maintenance in Europe and Asia, compounded by weak margins, curbed runs.
Refinery margins deteriorated in September on sharply lower gasoline cracks. European margins fell by $0.85/bbl on average and were firmly negative for simple plants. Urals cracking margins on the Mediterranean were at their lowest since 2009. In Singapore, all margins surveyed in this Report extended earlier losses. US Gulf Coast refiners recorded the steepest monthly declines, of $3.65/bbl on average, as gasoline cracks plummeted amid very high utilisation rates. US Midcontinent margins were mixed, but outperformed all other margins in absolute terms.
717273747576777879
Jan Mar May Jul Sep Nov Jan
mb/dGlobal RefiningCrude Throughput
Range 08-12 Average 08-122012 2013 est.2013
0.0
0.5
1.0
1.5
2.0
2.5
1Q11 3Q11 1Q12 3Q12 1Q13 3Q13
mb/d Global Throughputs vs. DemandAnnual growth
Crude Runs Oil Product Demand
Global Refinery Overview
Global refinery crude runs came off their seasonal peak in August but remained elevated. At 77.6 mb/d, global throughputs were more than 1.2 mb/d higher than a year earlier. Steeply contracting European runs, down by 0.8 mb/d year‐on‐year in August, caused growth to slow down from the higher rates seen in the previous two months. August gains stemmed mostly from non‐OECD Asia, the US, Russia and Africa, the latter due to recovering refinery operations in Algeria after significant outages last year.

INTERNATIONAL ENERGY AGENCY ‐ OIL MARKET REPORT REFINING
11 OCTOBER 2013 45
Despite unseasonably strong US utilisation rates, global crude runs are seen sharply lower in September compared with August. Heavy maintenance in Europe, the FSU and in OECD Asia Oceania cut rates sharply in those regions, while deteriorating margins likely added further downward momentum. Refiners in Europe were particularly hard‐hit by lower Libyan and Iraqi supplies in September, on top of seasonal, maintenance‐related cuts in North Sea production. US refiners, on the other hand, processed an impressive 725 kb/d crude oil more than a year earlier in September. A particularly light start to the maintenance season and no hurricane disruptions until early October help explain that strong performance. Increased supplies of US light tight oil and Western Canadian oil sands furthermore caused these grades’ price discount to widen, making rail economics to all US regions attractive, and significantly improving refinery profitability relative to the benchmark crudes margins surveyed.
Global Refinery Crude Throughput1 2
(million barrels per day)
Jun 13 2Q2013 Jul 13 Aug 13 Sep 13 3Q2013 Oct 13 Nov 13 Dec 13 4Q2013 Jan 14
Americas 19.0 18.4 19.2 18.9 18.7 19.0 18.2 18.4 18.8 18.5 18.2
Europe 12.0 11.7 12.1 11.9 11.6 11.9 11.5 11.7 11.8 11.7 11.6
Asia Oceania 6.5 6.3 6.6 6.8 6.5 6.6 6.5 6.8 6.9 6.7 7.1
Total OECD 37.5 36.4 38.0 37.7 36.8 37.5 36.1 36.9 37.5 36.8 36.9
FSU 7.0 6.6 7.0 7.1 6.6 6.9 6.6 7.0 6.9 6.8 6.9
Non-OECD Europe 0.5 0.5 0.5 0.5 0.5 0.5 0.5 0.5 0.5 0.5 0.5
China 9.7 9.4 9.5 9.4 9.5 9.5 9.7 10.2 10.3 10.1 10.0
Other Asia 9.5 9.6 9.8 9.9 9.7 9.8 9.9 9.9 10.0 9.9 10.1
Latin America 4.7 4.7 4.8 4.7 4.7 4.8 4.7 4.8 4.7 4.7 4.9
Middle East 5.9 5.5 6.0 6.1 6.1 6.1 6.1 6.1 6.1 6.1 6.1
Africa 2.2 2.1 2.3 2.3 2.2 2.2 2.2 2.2 2.2 2.2 2.1
Total Non-OECD 39.5 38.3 40.0 39.9 39.4 39.8 39.7 40.7 40.8 40.4 40.6
Total 77.0 74.7 77.9 77.6 76.2 77.3 75.8 77.6 78.2 77.2 77.5
1 Preliminary and estimated runs based on capacity, know n outages, economic run cuts and global demand forecast
2 From the report dated 10 August, 2012 OECD Americas include Chile and OECD Asia Oceania includes Israel. Global runs are forecast to average 77.2 mb/d in 4Q13, 385 kb/d higher than in last month’s Report, and only slightly lower than in 3Q13. Growth continues to stem from non‐OECD Asia and the US, but is also supported by increased capacity in the Middle East and rebounding runs in Africa and Latin America, after last year’s outages. In contrast, European throughputs will likely contract further as weak regional demand and increased competition undermine refinery profitability.
-1.0-0.50.00.51.01.52.02.5
1Q12 3Q12 1Q13 3Q13
mb/d Global Crude ThroughputsAnnual Change
Americas Europe Asia OceaniaChina Other Asia Middle EastLatin America Other
28.0
30.0
32.0
34.0
36.0
38.0
40.0
42.0
1Q2004 1Q2006 1Q2008 1Q2010 1Q2012
mb/d OECD vs. Non-OECD Crude Runs
OECD Non-OECD

REFINING INTERNATIONAL ENERGY AGENCY ‐ OIL MARKET REPORT
46 11 OCTOBER 2013
Refinery Margins
Refinery margins continued to fall in September as gasoline cracks plummeted while crude oil markets remained firm. Supply outages in Libya and Iraq and maintenance in the North Sea in September supported crude prices in both Europe and Asia. In the US, Bakken and Western Canadian Select (WCS) prices fell sharply on increased supplies and heightened competition for pipeline space. In contrast, gasoline cracks plummeted by more than $11/bbl on the US Gulf Coast and around $5/bbl in Europe, on ample supplies and high inventories. While middle distillate cracks remained healthy in all regions, that was not enough to support the entire refining complex.
-7.5-5.0-2.50.02.55.07.5
10.012.515.0
Sep 12 Dec 12 Mar 13 Jun 13 Sep 13
$/bbl Northwest Europe Refining Margins
Brent Cracking Brent HSUrals Cracking Urals HS
Source: IEA/KBC
-10.0
-5.0
0.0
5.0
10.0
15.0
Sep 12 Dec 12 Mar 13 Jun 13 Sep 13
$/bbl Mediterranean Refining Margins
Es Sider Cracking Es Sider HSUrals Cracking Urals HS
Source: IEA/KBC
European refinery margins extended earlier declines, and remained firmly negative for simple refinery configurations in both Northwest Europe and on the Mediterranean. Lower output, due to heavy refinery maintenance in September supported ULSD diesel cracks above $17/bbl. That was not enough to prevent gasoline cracks from plummeting, as supplies remained plentiful and refiners switched to winter grades. European margins fell by $0.85/bbl on average, though they generally improved in the second half of the month on lower crude prices and reduced refinery output. US refinery margins saw diverging trends in September. Margins on the Gulf Coast plunged by $3.65/bbl on average due to unseasonably high refinery throughputs and plummeting gasoline cracks. Refinery margins in the Midcontinent improved, however, on the widening discount of Bakken and Canadian crudes to WTI. Bakken’s discount to WTI reached $14.50/bbl in early October, compared to $6.50/bbl at the end of August, while that of WCS was at $34.60/bbl, its highest since January. Increased production of both Canadian oil sands and US light tight oil and competition for pipeline space are keeping a lid on prices. Given the current discount, both the East and West Coast markets provided attractive options for Bakken producers, with the rail netback to New York Harbour reaching $96/bbl in late September, while that to the West Coast (vs. ANS) was $94/bbl, $10‐15/bbl less than the reference crude price.
-10.0
-5.0
0.0
5.0
10.0
15.0
20.0
Sep 12 Dec 12 Mar 13 Jun 13 Sep 13
$/bbl US Gulf Coast Refining Margins
HLS/LLS Cra. Mars CrackingASCI Cracking HLS/LLS Cok.Maya/Mars Cok. ASCI Coking
Source: IEA/KBC
-10.0
-7.5-5.0
-2.5
0.0
2.55.0
7.5
10.0
Sep 12 Dec 12 Mar 13 Jun 13 Sep 13
$/bbl Singapore Refining Margins
Dubai Cracking Dubai HSTapis Cracking Tapis HS
Data Source: IEA/KBC

INTERNATIONAL ENERGY AGENCY ‐ OIL MARKET REPORT REFINING
11 OCTOBER 2013 47
Singapore refinery margins lost on average another $1.35/bbl in September and were negative for all configurations surveyed except for Dubai Hydrocracking. Singapore product stocks surged to the top of their historical range, with fuel oil holdings particularly ample. Amid weaker Asian margins, Saudi Aramco cut its official selling price (OSP) for Arab Light in the region for November.
IEA/KBC Global Indicator Refining Margins1
($/bbl)
Monthly Average Change Average for w eek ending:
Jun 13 Jul 13 Aug 13 Sep 13 Sep 13-Aug 13 06 Sep 13 Sep 20 Sep 27 Sep 04 Oct
NW Europe
Brent (Cracking) 5.11 4.45 3.56 1.75 -1.82 1.81 1.48 1.99 1.64 1.64
Urals (Cracking) 4.03 2.93 2.31 1.89 -0.42 1.47 1.45 1.90 2.47 2.59
Brent (Hydroskimming) 0.65 -1.34 -2.58 -3.67 -1.10 -4.55 -3.96 -3.15 -3.22 -3.33
Urals (Hydroskimming) -1.93 -3.68 -4.86 -4.85 0.01 -6.28 -5.51 -4.57 -3.49 -3.34
MediterraneanEs Sider (Cracking) 6.90 5.46 4.63 3.30 -1.33 2.90 2.87 3.73 3.53 3.62
Urals (Cracking) 5.32 3.35 2.79 2.37 -0.42 1.44 1.75 2.76 3.22 3.34
Es Sider (Hydroskimming) 2.64 0.19 -1.08 -2.28 -1.21 -3.27 -2.86 -1.65 -1.61 -1.63
Urals (Hydroskimming) -1.71 -4.11 -5.43 -5.93 -0.50 -7.63 -6.87 -5.31 -4.38 -4.25
US Gulf Coast50/50 HLS/LLS (Cracking) 6.95 5.77 6.89 3.15 -3.73 2.79 2.42 3.30 3.93 2.37
Mars (Cracking) 3.11 0.80 1.76 -1.11 -2.88 -2.27 -2.46 -0.34 0.14 -1.34
ASCI (Cracking) 2.83 0.42 1.45 -0.79 -2.24 -2.27 -2.23 -0.01 0.87 -1.41
50/50 HLS/LLS (Coking) 8.34 7.87 8.94 4.33 -4.61 4.53 3.76 4.35 4.74 3.16
50/50 Maya/Mars (Coking) 4.44 4.55 5.55 1.00 -4.55 1.26 0.38 0.99 1.37 1.09
ASCI (Coking) 7.35 6.03 7.06 3.26 -3.80 2.50 2.34 3.74 4.31 2.21
US MidconWTI (Cracking) 22.86 15.62 10.83 9.27 -1.56 12.50 10.02 8.38 7.33 5.47
30/70 WCS/Bakken (Cracking) 21.48 18.45 16.16 17.65 1.49 18.89 16.94 17.64 17.33 18.91
Bakken (Cracking) 24.92 21.42 17.26 17.36 0.10 19.60 17.58 17.05 15.88 17.98
WTI (Coking) 25.13 18.21 13.00 10.99 -2.01 14.88 12.03 10.01 8.52 6.45
30/70 WCS/Bakken (Coking) 25.07 22.06 19.30 20.39 1.09 22.18 20.14 20.28 19.48 20.75
Bakken (Coking) 25.63 22.28 17.92 17.81 -0.12 20.38 18.17 17.46 16.06 18.04
SingaporeDubai (Hydroskimming) -0.24 -1.21 -3.06 -4.32 -1.26 -4.67 -5.36 -4.50 -3.13 -2.04
Tapis (Hydroskimming) -0.32 -2.85 -6.20 -7.58 -1.38 -8.73 -7.76 -6.36 -7.55 -7.62
Dubai (Hydrocracking) 5.46 5.69 3.45 2.18 -1.27 2.55 1.44 1.81 2.70 3.39
Tapis (Hydrocracking) 2.63 1.39 -2.46 -3.95 -1.49 -4.42 -3.93 -2.94 -4.47 -4.63
1 Global Indicator Refining Margins are calculated for various complexity configurations, each optimised for processing the specific crude(s) in a specific refining
centre. Margins include energy cost, but exclude other variable costs, depreciation and amortisation. Consequently, reported margins should be taken as an
indication, or proxy, of changes in profitability for a given refining centre. No attempt is made to model or otherwise comment upon the relative economics of
specific refineries running individual crude slates and producing custom product sales, nor are these calculations intended to infer the marginal values of crude
for pricing purposes.
Source: IEA, KBC Advanced Technologies (KBC)
OECD Refinery Throughput
OECD refinery crude throughputs fell 270 kb/d in August, to average 37.7 mb/d, in line with expectations. Both US and European refinery runs came down from their seasonal July peak, while Japanese refinery runs rose by 210 kb/d m‐o‐m. North American runs fell 270 kb/d m‐o‐m and European runs were down by 200 kb/d. Overall OECD runs averaged 320 kb/d less than a year earlier, as robust US crude runs failed to offset contracting European throughputs.

REFINING INTERNATIONAL ENERGY AGENCY ‐ OIL MARKET REPORT
48 11 OCTOBER 2013
Refinery Crude Throughput and Utilisation in OECD Countries(million barrels per day)
Change from Utilisation rate1
Mar 13 Apr 13 May 13 Jun 13 Jul 13 Aug 13 Jul 13 Aug 12 Aug 13 Aug 12
US2 14.70 14.86 15.30 15.83 16.04 15.80 -0.24 0.48 89.1% 86.7%
Canada 1.77 1.57 1.46 1.71 1.72 1.73 0.01 -0.08 90.3% 96.1%
Chile 0.16 0.14 0.18 0.19 0.18 0.17 -0.01 0.05 74.7% 54.0%
Mexico 1.29 1.28 1.28 1.30 1.27 1.25 -0.02 0.04 75.5% 73.3%
OECD Americas 17.92 17.86 18.21 19.02 19.21 18.95 -0.27 0.48 88.0% 86.1%
France 1.12 1.20 1.22 1.28 1.28 1.21 -0.07 -0.15 86.5% 87.4%
Germany 1.84 1.70 1.87 1.96 1.92 1.88 -0.05 -0.10 92.8% 92.6%
Italy 1.19 1.21 1.19 1.27 1.41 1.28 -0.13 -0.34 63.7% 74.5%
Netherlands 0.94 1.03 0.99 0.99 0.99 1.01 0.02 -0.02 78.2% 79.8%
Spain 1.18 1.32 1.21 1.21 1.21 1.22 0.01 -0.03 80.7% 82.5%
United Kingdom 1.26 1.36 1.26 1.32 1.30 1.32 0.03 -0.08 76.7% 77.9%
Other OECD Europe 4.02 3.77 3.76 3.96 4.03 4.01 -0.02 -0.06 80.6% 82.4%
OECD Europe 11.54 11.58 11.49 11.99 12.14 11.94 -0.20 -0.79 79.9% 82.4%
Japan 3.37 3.30 2.85 2.97 3.22 3.43 0.21 0.14 76.7% 71.4%
South Korea 2.43 2.24 2.33 2.59 2.47 2.47 0.00 -0.15 90.1% 95.6%
Other Asia Oceania 0.92 0.92 0.91 0.94 0.94 0.92 -0.02 -0.01 29.6% 75.7%
OECD Asia Oceania 6.72 6.46 6.08 6.50 6.62 6.82 0.20 -0.02 81.0% 79.7%
OECD Total 36.17 35.90 35.79 37.51 37.97 37.71 -0.27 -0.32 84.0% 83.7%
1 Expressed as a percentage, based on crude throughput and current operable refining capacity
2 US50
3 OECD Americas includes Chile and OECD Asia Oceania includes Israel. OECD Europe includes Slovenia and Estonia, though neither country has a refinery
Despite remarkably strong US utilisation rates, in September overall OECD runs are assessed sharply lower. Refiners in both Europe and in Asia Oceania embarked on seasonal maintenance in September and weak margins in Europe and Singapore probably curbed runs further. While US refiners also normally reduce runs in September, this year lower‐than‐normal maintenance and the absence of any hurricane disruptions helped keep runs above the seasonal norm. Furthermore, US refiners continue to benefit from access to discounted feedstock and cheap natural gas used as refinery fuel, increasing their competitive advantage over Europe beyond that already conferred by economies of scale and a lighter regulatory and tax burden.
September US runs stood 725 kb/d above year earlier levels, when compared with revised 2012 data. European runs on the other hand faced supply disruptions from Libya and Iraq, in addition to a heavier‐than‐normal maintenance schedule and poor margins. In all, OECD runs are forecast to average 36.8 mb/d in 4Q13, down from 37.5 mb/d in 3Q13 and 135 kb/d below 4Q12.
35
36
37
38
39
40
Jan Mar May Jul Sep Nov Jan
mb/dOECD Total
Crude Throughput
Range 08-12 Average 08-122012 2013 est. 2013
-1.2-1.0-0.8-0.6-0.4-0.20.00.20.40.6
1Q11 3Q11 1Q12 3Q12 1Q13 3Q13
mb/d OECD Crude ThroughputsAnnual Change
Americas Europe Asia Oceania OECD

INTERNATIONAL ENERGY AGENCY ‐ OIL MARKET REPORT REFINING
11 OCTOBER 2013 49
North American refinery runs declined by 270 kb/d in August to average 18.9 mb/d. Regional runs remained well above year‐earlier levels, up some 480 kb/d on August 2012. While benchmark US refining margins are less attractive than they were a year ago, US refiners, as discussed above, continues to enjoy better margins than their international competitors. As North American crude production continue to rise and infrastructure is adapted, a greater share of discounted US and Canadian crudes is making its way to refineries outside of the Midwest. Philadelphia Energy Solution’s 350 kb/d Pennsylvania refinery is a case in point: it recently reported that it was now processing 20% Bakken crude and that this share is set to increase.
16.5
17.0
17.5
18.0
18.5
19.0
19.5
Jan Mar May Jul Sep Nov Jan
mb/d OECD AmericasCrude Throughput
Range 08-12 Average 08-122012 2013 est. 2013
0.0
0.5
1.0
1.5
2.0
2.5
3.0
Jan Mar May Jul Sep Nov Jan
mb/d OECD North AmericaRefinery Shutdowns
Range 08-12 Average 08-122012 2013 Reported
The strength in US refinery runs was even more remarkable in September. Weekly data from the US EIA show crude oil processed by US refiners rose by 940 kb/d compared with a year earlier (725 kb/d when compared with final monthly data for 2012). Of this, more than 70% stemmed from the US Gulf Coast, while another 14% was accounted for by the East Coast and 8% from the Midcontinent. The US Gulf Coast, which accounts for 45% of total US crude distillation capacity, normally sees reduced runs in September due to the hurricane season. This year, however, the season’s first significant tropical storm, Karen, only hit the US Gulf Coast in early October. The storm, which briefly shut 62% of US Gulf Coast output, had minimal impact on refinery operations. Only one refinery, Motiva’s 233 kb/d Norco plant in Louisiana, reported it had reduced runs due to lack of crude supplies. The plant was already scheduled to start routine maintenance of several units in October. From its September peak of 16.1 mb/d, total US crude intake fell by 1.2 mb/d over the three weeks through 4 October, to a more normal seasonal level.
13.5
14.0
14.5
15.0
15.5
16.0
16.5
17.0
Jan Feb Apr May Jun Aug Sep Oct Dec
mb/d US Weekly Refinery Throughput
5-yr Average 2012 2013
Source: EIA
6.0
6.5
7.0
7.5
8.0
8.5
9.0
Jan Feb Mar Apr May Jul Aug Sep Oct NovDec
mb/d US Gulf Coast Refinery Throughputs
5-yr Average 2012 2013
Source: EIA
Refinery throughputs in Europe fell slightly more than expected in August, to average 11.9 mb/d. The declines were wide spread, though Italian refiners recorded the steepest declines due to Libyan supply disruptions. Italian refinery runs fell 130 kb/d to average 1.28 mb/d. In the first half of this year, just over 20% of Italy’s crude imports were sourced from Libya (240 kb/d on average). As discussed in the Supply Section, Libyan crude production plummeted to only 550 kb/d in August and 300 kb/d in September forcing Italian refiners to pay a premium for alternative supplies. Runs in France and Germany slipped by 70 kb/d and 50 kb/d, respectively, while throughputs in the Netherlands, UK and Spain were largely unchanged from a month earlier.

REFINING INTERNATIONAL ENERGY AGENCY ‐ OIL MARKET REPORT
50 11 OCTOBER 2013
Here We Go Again – European Refiners Cut Capacity Further
The announcement on 4 October that MOL will close its 55 kb/d Mantova refinery in northern Italy in January 2014 did not come as a surprise. MOL cited an “unfavorable economic environment” for refining in Italy as the reason for the closure and will convert the site into an oil‐product storage and terminal facility. Despite a large number of refinery closures since 2008 (1.7 mb/d of capacity in total), Italy and Europe continue to grapple with declining regional demand and over‐capacity. Recent supply declines in Libya and Iraq just added fuel to the fire.
Italian refiners are currently the largest importers of Libyan crude, sourcing more than 20% of their total crude oil imports from the country in 2012. So far in 2013 (January‐July), Italy imported 240 kb/d of Libyan crude, making the complete halt to Libyan exports in parts of August and September especially challenging. Italian refiners also had to replace Iranian barrels since EU sanctions were put in place in July 2012. In 2008, 10% of Italy’s crude oil imports came from Iran, but this has now been entirely replaced by increased volumes of Saudi and Azeri crude.
The crude‐supply sourcing issues are of course not the root of the woes of European refiners. Regional demand continues to contract and 2013 OECD Europe demand is forecast to average 13.5 mb/d, almost 2 mb/d less than in 2008. The contraction spans all products but particularly affects residual fuel oil and gasoline. Only diesel demand has held up, and even that just barely.
13.0
13.5
14.0
14.5
15.0
15.5
16.0
0.0
1.0
2.0
3.0
4.0
5.0
6.0
2000 2004 2008 2012
mb/d European Oil Demand
Motor Gasoline Jet and KeroseneDiesel Other GasoilResidual Fuels Other ProductsTotal Prods (RHS)
37%
38%
39%
40%
41%
42%
Jan Mar May Jul Sep Nov
OECD Europe - Gasoil / Diesel
Range 2012-2008 5-yr Average2012 2013
Implied Refinery Yield ‐ Five‐year Range
While OECD European refiners have managed to lift gasoil/diesel yields significantly in recent years, output, especially of Ultra Low Sulphur Diesel, continues to lag regional demand. In 2012, gasoil/diesel accounted for 44% of total demand, while refinery output of these products averaged 40.4%.
Sourcing this extra diesel has not seemed to be a problem of late, quite to the contrary. Concerns now seem to be that Europe will be flooded by surplus distillates from US, India, Russia and soon Saudi Arabia, further undermining refining profitability and forcing more closures. US refinery runs and product exports have surged along with rising North American crude oil supplies. It was estimated that the US diesel exports to reached 2 million tons in September (520 kb/d) (and that total US product exports reached an all time high of 3.3 mb/d). An additional 1.5 mt of diesel was reportedly coming from Russia and Asia (largely India).
New supplies are also coming to market from new refineries. While the start‐up of the SATORP’s new Jubail refinery in Saudi Arabia will probably not ship product directly to Europe on a large scale, the increased production will still free up additional volumes previously imported by Saudi Arabia (see “New Saudi Refinery Ships First Fuel Cargo in September”). New supplies are also coming from India’s 300 kb/d Paradeep refinery, now expecterd to start up in December. India’s net oil product exports already totaled 925 kb/d in 2012, of which gasoline and diesel accounted for 370 kb/d and 400 kb/d, respectively. Once fully operational, likely in 2H14, the plant could add another 160 kb/d of gasoline and diesel exports.
0
100
200
300
400
500
600
2008 2010 2012 2014
kb/d OECD Europe Refinery Closures
Czech Republic France Germany Italy UK

INTERNATIONAL ENERGY AGENCY ‐ OIL MARKET REPORT REFINING
11 OCTOBER 2013 51
11.0
11.5
12.0
12.5
13.0
13.5
14.0
Jan Mar May Jul Sep Nov Jan
mb/d OECD Europe Crude Throughput
Range 08-12 Average 08-122012 2013 est. 2013
0.0
0.5
1.0
1.5
2.0
Jan Mar May Jul Sep Nov Jan
mb/d OECD EuropeRefinery Shutdowns
Range 08-12 Average 08-12
2012 2013 Reported Preliminary data released by Euroilstock show European runs plummeting in September. Overall, ‘EU‐15 plus Norway’ runs fell by 340 kb/d according to the data released 9 October. Our maintenance data suggest 1.2 mb/d of capacity was offline for turnarounds that month, up from only 300 kb/d in August. More than 1 mb/d of capacity is expected to remain shut in October. Seasonal maintenance, largely concentrated in Northwest Europe, is heavier than normal this year, as refiners reportedly delayed routine maintenance where possible last year due to relatively good margins. (Brent cracking margins in Northwest Europe were $12.30/bbl in September last year, compared to $1.75/bbl last month). Regional runs are expected to remain weak for the coming months, pressured by weak margins and high distillate imports. In OECD Asia Oceania, refinery crude intake rose seasonally in August, to 6.8 mb/d, in line with expectations. Regional runs were on par with levels of the previous year, as higher year‐on‐year Japanese runs offset lower throughputs in South Korea. Japanese throughputs held up despite primary capacity being shut this summer. The 140 kb/d Sakaide plant halted crude processing in early August. Despite the closure, there still seems to be spare capacity in Japan. In the latest month, utilisation rates averaged only 76.7%. Ahead of the March 2014 deadline set by the government to improve the country’s upgrading ratio, another 500 kb/d of primary crude distillation capacity is expected to shut in Japan.
6.0
6.5
7.0
7.5
Jan Mar May Jul Sep Nov Jan
mb/dOECD Asia Oceania
Crude Throughput
Range 08-12 Average 08-122012 2013 est. 2013
2.5
3.0
3.5
4.0
4.5
Jan Apr Jul Oct
mb/d Japan Weekly Refinery Throughput
Range 2008-12 5-yr Average2012 2013
Source: PAJ, IEA estimatesSource: PAJ, IEA estimates
In contrast, while South Korean runs were 150 kb/d below year‐earlier levels in August, averaging 2.47mb/d, utilisation rates remained above 90%. Lower throughputs in July and August were primarily due to maintenance at SK’s Ulsan refinery from July through September. Regional runs are expected to have fallen sharply from September onwards in line with seasonal trends. Preliminary weekly data from the Petroleum Association of Japan seem to confirm this trend. Japanese runs declined by 200 kb/d in September to 3 mb/d. Extended maintenance in October will likely curb runs further, before operators ramp up runs from November to produce winter heating fuels.

REFINING INTERNATIONAL ENERGY AGENCY ‐ OIL MARKET REPORT
52 11 OCTOBER 2013
Non-OECD Refinery Throughput
Non‐OECD refinery run estimates have been revised up by 185 kb/d for 4Q13 since last month’s Report, due to an upward adjustment to Latin America throughputs and higher‐than‐expected Russian throughputs towards the end of the year. Our 3Q13 forecast is largely unchanged since last month’s report, at 39.8 mb/d. Annual growth in non‐OECD throughputs is expected to slow from 1.5 mb/d in 3Q13 to 1.1 mb/d in 4Q13. Increases are almost entirely accounted for by non‐OECD Asia in 3Q13, while Middle East, Africa and Latin America will contribute to growth in the fourth quarter.
333435363738394041
Jan Mar May Jul Sep Nov Jan
mb/dNon-OECD Total Crude Throughput
Range 08-12 Average 08-122012 2013 est.2013
-0.5
0.0
0.5
1.0
1.5
2.0
1Q12 3Q12 1Q13 3Q13
mb/d Non-OECD Crude ThroughputsAnnual Change
China Other Asia Middle East
Latin America Africa FSU
Chinese refinery crude runs fell to 9.35 mb/d in August, from 9.5 mb/d in July, but are expected to have picked up slightly in September based on reported maintenance and company throughput plans. Refinery margins, as calculated by ICIS C1 energy consultants, show slightly better refinery profitability in July and August, supporting increased runs from September onwards. Activity is likely to pick up further towards year‐end with the start up of new capacity, compounding the effect of historical trends. Sinopec’s new 200 kb/d Pengzhou refinery in the Sichuan province started operations in October. Petrochina’s expansion of its Urumchi petchem refinery from 120 kb/d to 190 kb/d is also scheduled to be commissioned this month. Another 500 kb/d of capacity is scheduled to be commissioned in China before year‐end, including Sinochem’s 240 kb/d Quanzhou refinery.
6.0
7.0
8.0
9.0
10.0
11.0
Jan Mar May Jul Sep Nov Jan
mb/d ChinaCrude Throughput
2009 2010 20112012 2013
-15
-10
-5
0
5
10
15
20
Jan-2010 Jan-2011 Jan-2012 Jan-2013
Daqing crude Oman crude
$/bbl
Source:ICIS C1 Energy
Chinese Refining Margin(on ex-refinery basis)
Indian throughputs rose to six‐month highs in August, of 4.56 mb/d. Unscheduled outages in September likely curbed runs again. HPCL’s 160 kb/d Vizag refinery ran at reduced rates for most of the month, as a fire at the end of August damaged a cooling tower. Other Asian refinery run rates have been revised slightly lower for the first half of 2013 based on a reassessment of Pakistani refinery runs. While monthly data are not readily available for that country, our forecast had incorporated the start‐up of Byco’s new 120 kb/d refinery for early 2013. The new project, which lifted total capacity to 155 kb/d was only commissioned mid‐year, however, and reports indicate that the plant is still operating at low rates. We now forecast throughputs to ramp up to capacity by early 2014.

INTERNATIONAL ENERGY AGENCY ‐ OIL MARKET REPORT REFINING
11 OCTOBER 2013 53
New Saudi Refinery Ships First Fuel Cargo in September
Saudi Arabia’s new 400 kb/d SATORP refinery at Jubail, on the Middle East Gulf, started operations in September and by end‐month shipped its first cargo of oil products. An 80 kt cargo of straight fuel oil left Jubail in late September, and was expected to arrive in Singapore on 11 October. A further two cargoes of fuel oil are expected to be shipped in October with two more following in November.
The refinery, a joint venture between Saudi Aramco and Total, has so far commissioned one of its two crude distillation units, and is currently processing light crude. The second crude tower, as well as the coker and other secondary units, are expected to come on line over the next few months. Once fully operational, the plant will become one of the most complex in the world, and will switch to process Arab Heavy crude from the nearby Safaniyah and Manifa fields. The plant will become Saudi Arabia’s first producer of petroleum coke and paraxylene.
Once the secondary units come onstream, the plant is expected to halt fuel oil shipments and instead export more light‐end products such as gasoline and diesel. It is expected to yield some 260 kb/d of Ultra‐Low Sulphur Diesel (ULSD) and 90 kb/d of gasoline. The JV is expected to export its first ULSD cargo later in October.
While the Jubail refinery will first and foremost meet rapidly growing Saudi and regional demand, initially a significant share of the products is expected to be earmarked for export. This is at least the case for Total’s 37.5% share of product output. According to JODI data, Saudi Arabia’s net imports of gasoline averaged 110 kb/d so far in 2013 (Jan‐Jul), while net diesel imports were almost 150 kb/d.
Saudi refined product balances will ease further as other projects are brought on stream. The next project to be commissioned is the 400 kb/d refinery Saudi Aramco is building with China’s Sinopec near Yanbu on the Red Sea, north of Jeddah. The project will likely be commissioned in late 2014 or 2015. Aramco has another large‐scale refinery planned in Jizan also on the Red Sea but closer to the Yemen border. That refinery will likely not start up until 2017 or 2018.
In August, Russian refinery runs averaged 5.76 mb/d, up 260 kb/d y‐o‐y. Preliminary data show that Russian refinery runs fell by almost 400 kb/d in September to 5.36 mb/d, or 200 kb/d above year‐earlier. The monthly decline was slightly less than anticipated, based on announced turnarounds. Announced maintenance schedules show almost 1 mb/d of capacity offline in September, compared with 430 kb/d in August. Maintenance is expected to remain high in October, further curbing runs. Elsewhere in the region, Ukraine’s Odessa refinery reportedly resumed operations in September, three years after having shut due to poor economics. The 60 kb/d plant was sold by Lukoil earlier this year to Ukrainian energy trader Ventek. Kazakh refinery operations also improved as maintenance at the country’s Pavlodar plant wound down.
5.65.86.06.26.46.66.87.07.2
Jan Mar May Jul Sep Nov Jan
mb/dFSU
Crude Throughput
Range 08-12 Average 08-122012 2013 est. 2013
4.5
5.0
5.5
6.0
Jan Mar May Jul Sep Nov Jan
mb/dRussia
2010 2011 2012
2013 est. 2013
Crude ThroughputCrude Throughput
5.0
5.2
5.4
5.6
5.8
6.0
6.2
6.4
Jan Mar May Jul Sep Nov Jan
mb/dMiddle East
Crude Throughput
Range 08-12 Average 08-122012 2013 est. 2013

TABLES INTERNATIONAL ENERGY AGENCY ‐ OIL MARKET REPORT
54 11 OCTOBER 2013
Table 1 - World Oil Supply and Demand Table 1WORLD OIL SUPPLY AND DEMAND
(million barrels per day)
2010 2011 1Q12 2Q12 3Q12 4Q12 2012 1Q13 2Q13 3Q13 4Q13 2013 1Q14 2Q14 3Q14 4Q14 2014
OECD DEMANDAmericas1 24.1 24.0 23.4 23.6 23.7 23.8 23.6 23.7 23.7 23.9 23.7 23.8 23.7 23.8 23.8 23.7 23.7Europe2 14.7 14.3 13.7 13.8 13.8 13.7 13.7 13.2 13.8 13.8 13.4 13.5 13.1 13.4 13.7 13.5 13.4Asia Oceania3 8.2 8.2 9.2 8.1 8.3 8.8 8.6 8.9 7.9 8.2 8.6 8.4 8.8 7.7 8.0 8.5 8.3
Total OECD 47.0 46.5 46.3 45.5 45.9 46.2 46.0 45.8 45.4 45.8 45.7 45.7 45.6 44.9 45.6 45.6 45.4
NON-OECD DEMANDFSU 4.1 4.4 4.3 4.4 4.6 4.6 4.5 4.3 4.5 4.8 4.8 4.6 4.4 4.6 4.9 4.9 4.7Europe 0.7 0.7 0.7 0.7 0.7 0.7 0.7 0.6 0.7 0.7 0.7 0.7 0.7 0.7 0.7 0.7 0.7China 8.9 9.3 9.5 9.6 9.8 10.3 9.8 10.0 10.0 10.2 10.6 10.2 10.4 10.4 10.6 11.0 10.6Other Asia 10.7 11.0 11.2 11.4 11.1 11.5 11.3 11.6 11.7 11.3 11.7 11.6 11.9 12.0 11.7 12.0 11.9Latin America 6.1 6.2 6.2 6.4 6.5 6.6 6.4 6.4 6.6 6.7 6.6 6.6 6.5 6.7 6.9 6.8 6.7Middle East 7.3 7.4 7.3 7.8 8.2 7.5 7.7 7.5 7.8 8.4 7.7 7.9 7.7 8.1 8.6 8.0 8.1Africa 3.5 3.5 3.6 3.6 3.6 3.7 3.7 3.8 3.8 3.8 3.9 3.8 3.9 4.0 4.0 4.1 4.0
Total Non-OECD 41.4 42.5 42.8 43.9 44.6 44.9 44.0 44.2 45.1 45.8 46.0 45.3 45.5 46.6 47.3 47.5 46.7
Total Demand4 88.4 89.0 89.0 89.4 90.4 91.1 90.0 90.0 90.6 91.7 91.7 91.0 91.1 91.4 92.8 93.1 92.1
OECD SUPPLYAmericas1,7 14.1 14.6 15.6 15.5 15.7 16.6 15.9 16.8 16.7 17.3 17.7 17.1 18.0 18.0 18.1 18.5 18.2Europe2 4.1 3.8 3.8 3.6 3.1 3.3 3.5 3.3 3.3 3.1 3.4 3.3 3.4 3.2 3.0 3.2 3.2Asia Oceania3 0.7 0.6 0.6 0.6 0.6 0.5 0.6 0.4 0.5 0.5 0.5 0.5 0.5 0.5 0.5 0.5 0.5
Total OECD 18.9 19.0 19.9 19.7 19.4 20.5 19.9 20.6 20.5 20.9 21.5 20.9 21.8 21.8 21.6 22.3 21.9
NON-OECD SUPPLYFSU 13.5 13.6 13.7 13.6 13.6 13.7 13.6 13.8 13.8 13.8 13.8 13.8 13.9 13.9 13.9 14.0 13.9Europe 0.1 0.1 0.1 0.1 0.1 0.1 0.1 0.1 0.1 0.1 0.1 0.1 0.1 0.1 0.1 0.1 0.1China 4.1 4.1 4.2 4.1 4.2 4.3 4.2 4.2 4.2 4.0 4.1 4.2 4.2 4.3 4.2 4.2 4.2Other Asia5 3.7 3.6 3.7 3.6 3.6 3.7 3.6 3.7 3.6 3.5 3.5 3.6 3.6 3.5 3.5 3.6 3.5Latin America5,7 4.1 4.2 4.3 4.1 4.1 4.2 4.2 4.2 4.2 4.2 4.3 4.2 4.3 4.4 4.4 4.5 4.4Middle East 1.7 1.7 1.4 1.4 1.5 1.5 1.5 1.4 1.3 1.4 1.3 1.4 1.3 1.3 1.3 1.3 1.3Africa5 2.6 2.6 2.4 2.2 2.2 2.3 2.3 2.3 2.3 2.4 2.5 2.4 2.6 2.6 2.6 2.6 2.6
Total Non-OECD 29.9 29.9 29.8 29.2 29.3 29.7 29.5 29.7 29.6 29.3 29.7 29.6 30.0 30.1 30.2 30.3 30.2
Processing Gains6 2.1 2.1 2.1 2.1 2.2 2.1 2.1 2.2 2.2 2.2 2.2 2.2 2.2 2.2 2.2 2.2 2.2
Global Biofuels7 1.8 1.9 1.5 1.9 2.1 1.9 1.9 1.5 2.0 2.3 2.1 2.0 1.7 2.1 2.4 2.1 2.1
Total Non-OPEC5 52.7 52.9 53.5 52.9 53.0 54.2 53.4 53.9 54.2 54.7 55.5 54.6 55.8 56.2 56.5 56.9 56.4
OPECCrude8 29.2 29.9 31.3 31.7 31.5 30.7 31.3 30.4 30.8 30.5NGLs 5.6 5.9 6.2 6.2 6.3 6.4 6.3 6.4 6.4 6.5 6.6 6.5 6.7 6.7 6.7 6.8 6.7
Total OPEC5 34.7 35.8 37.5 37.9 37.8 37.1 37.6 36.8 37.2 37.0
Total Supply9 87.4 88.7 90.9 90.8 90.8 91.3 91.0 90.7 91.5 91.7
STOCK CHANGES AND MISCELLANEOUSReported OECDIndustry 0.1 -0.2 0.6 0.3 0.5 -0.7 0.2 0.2 0.0Government 0.0 -0.1 0.0 0.0 0.0 0.1 0.0 0.0 0.0
Total 0.1 -0.3 0.6 0.4 0.5 -0.7 0.2 0.3 0.0
Floating Storage/Oil in Transit -0.2 -0.1 -0.4 0.2 -0.1 0.1 0.0 0.2 -0.1Miscellaneous to balance10 -0.9 0.1 1.7 0.9 0.0 0.7 0.8 0.3 1.0
Total Stock Ch. & Misc -1.0 -0.3 1.9 1.4 0.4 0.2 1.0 0.7 0.9 0.1
Memo items:
Call on OPEC crude + Stock ch.11 30.2 30.2 29.4 30.3 31.1 30.5 30.3 29.8 29.9 30.4 29.6 29.9 28.6 28.6 29.6 29.4 29.0Adjusted Call on OPEC + Stock ch.12 29.3 30.3 31.1 31.2 31.1 31.3 31.2 30.0 31.0 31.0 30.3 30.6 29.2 29.2 30.2 30.0 29.71 As of August 2012 OMR, OECD Americas includes Chile.2 As of August 2012 OMR, OECD Europe includes Estonia and Slovenia.3 As of August 2012 OMR, OECD Asia Oceania includes Israel.4 Measured as deliveries from refineries and primary stocks, comprises inland deliveries, international marine bunkers, refinery fuel, crude for direct burning, oil from non-conventional sources and other sources of supply.5 Other Asia includes Indonesia throughout. Latin America excludes Ecuador throughout. Africa excludes Angola throughout. Total Non-OPEC excludes all countries that were members of OPEC at 1 January 2009. Total OPEC comprises all countries which were OPEC members at 1 January 2009. 6 Net volumetric gains and losses in the refining process and marine transportation losses.7 As of the July 2010 OMR, Global Biofuels comprise all world biofuel production including fuel ethanol from the US and Brazil.8 As of the March 2006 OMR, Venezuelan Orinoco heavy crude production is included within Venezuelan crude estimates. Orimulsion fuel remains within the OPEC NGL and non-conventional category, but Orimulsion production reportedly ceased from January 2007.9 Comprises crude oil, condensates, NGLs, oil from non-conventional sources and other sources of supply.10 Includes changes in non-reported stocks in OECD and non-OECD areas.11 Equals the arithmetic difference between total demand minus total non-OPEC supply minus OPEC NGLs.12 Equals the "Call on OPEC + Stock Ch." with "Miscellaneous to balance" added for historical periods and with an average of "Miscellaneous to balance" for the most recent 8 quarters added for forecast periods.

INTERNATIONAL ENERGY AGENCY ‐ OIL MARKET REPORT TABLES
11 OCTOBER 2013 55
Table 1a - World Oil Supply and Demand: Changes from Last Month’s Table 1 Table 1aWORLD OIL SUPPLY AND DEMAND: CHANGES FROM LAST MONTH'S TABLE 1
(million barrels per day)
2010 2011 1Q12 2Q12 3Q12 4Q12 2012 1Q13 2Q13 3Q13 4Q13 2013 1Q14 2Q14 3Q14 4Q14 2014
OECD DEMANDAmericas - - - -0.1 -0.1 - -0.1 - - - -0.1 - - - - - -Europe - - - - - - - - - 0.1 - - - - 0.1 - -Asia Oceania - - - - - - - - - - - - - - - -0.1 -
Total OECD - - - -0.1 -0.1 - -0.1 - - 0.1 -0.1 - - 0.1 - - -
NON-OECD DEMANDFSU - - - - - - - - - - - - - - - - -Europe - - - - - - - - - - - - - - - - -China - - - - - - - - 0.1 - 0.1 0.1 - 0.1 0.1 0.1 0.1Other Asia - - - - - - - - - - - - - - - - -Latin America - - - - - - - - - - - - - - - - -Middle East - - - - - - - - - - - - - - - - -Africa - - - - - - - - 0.1 - - - - - - - -
Total Non-OECD - - - - - - - 0.1 0.1 0.1 0.1 0.1 - 0.1 0.1 0.1 0.1
Total Demand - - - -0.1 - - - 0.1 0.1 0.2 - 0.1 - 0.2 0.1 0.1 0.1
OECD SUPPLYAmericas - - - - - - - - - 0.1 - - 0.1 0.2 0.2 0.1 0.2Europe - - - - - - - - - 0.1 - - - - - - -Asia Oceania - - - - - - - - - - - - - - - - -
Total OECD - - - - - - - - - 0.2 - 0.1 0.2 0.2 0.2 0.2 0.2
NON-OECD SUPPLYFSU - - - - - - - - - 0.1 0.1 - 0.1 0.2 0.1 0.2 0.1Europe - - - - - - - - - - - - - - - - -China - - - - - - - - - - - - - - - - -Other Asia - 0.1 0.1 - - 0.1 0.1 0.1 0.1 - - - - - - - -Latin America - - - - - - - - - -0.1 -0.1 - -0.1 -0.1 -0.1 -0.1 -0.1Middle East - - - - - - - - - - - - - - - - -Africa - - - - - - - - - - - - - - - - -
Total Non-OECD - - - - - - - - - -0.1 -0.1 - 0.1 0.1 0.1 0.1 0.1
Processing Gains - - - - - - - - - - - - - - - - -
Global Biofuels - - - - - - - - 0.1 - - - - - - - -
Total Non-OPEC - - 0.1 0.1 - - - - 0.1 0.1 - 0.1 0.2 0.3 0.2 0.3 0.3
OPECCrude - - - - - - - - -NGLs - - - - - - - - - -0.1 -0.1 - - - - - -
Total OPEC - - - - - - - - -
Total Supply - - 0.1 0.1 - - - - 0.1
STOCK CHANGES AND MISCELLANEOUSREPORTED OECDIndustry - - 0.1 - - - - 0.1 0.1Government - - - - - - - - -
Total - - 0.1 - - - - 0.1 0.1
Floating Storage/Oil in Transit - - - - - - - - -0.1Miscellaneous to balance - - - 0.1 0.1 - 0.1 -0.1 -
Total Stock Ch. & Misc - - 0.1 0.1 0.1 - 0.1 -0.1 - 0.1
Memo items:Call on OPEC crude + Stock ch. - - -0.1 -0.1 -0.1 - -0.1 0.1 - 0.1 0.1 0.1 -0.2 -0.1 -0.1 -0.2 -0.1Adjusted Call on OPEC + Stock ch. - - -0.1 - - - - -0.1 - 0.1 0.1 - -0.1 -0.1 -0.1 -0.1 -0.1When submitting their monthly oil statistics, OECD Member countries periodically update data for prior periods. Similar updates to non-OECD data can occur.

TABLES INTERNATIONAL ENERGY AGENCY ‐ OIL MARKET REPORT
56 11 OCTOBER 2013
Table 2 - Summary of Global Oil Demand Table 2
SUMMARY OF GLOBAL OIL DEMAND2011 1Q12 2Q12 3Q12 4Q12 2012 1Q13 2Q13 3Q13 4Q13 2013 1Q14 2Q14 3Q14 4Q14 2014
Demand (mb/d)
Americas1 23.96 23.39 23.61 23.74 23.77 23.63 23.71 23.74 23.92 23.69 23.76 23.66 23.77 23.84 23.67 23.74
Europe2 14.28 13.69 13.79 13.81 13.66 13.74 13.17 13.79 13.77 13.42 13.54 13.13 13.38 13.70 13.50 13.43
Asia Oceania3 8.23 9.18 8.07 8.33 8.78 8.59 8.92 7.90 8.15 8.62 8.40 8.82 7.74 8.03 8.47 8.26Total OECD 46.47 46.26 45.48 45.87 46.21 45.96 45.81 45.44 45.83 45.72 45.70 45.61 44.89 45.56 45.65 45.43Asia 20.35 20.74 21.03 20.91 21.80 21.12 21.64 21.72 21.49 22.27 21.78 22.32 22.42 22.26 22.97 22.50Middle East 7.43 7.27 7.79 8.16 7.48 7.68 7.46 7.85 8.38 7.73 7.86 7.66 8.10 8.57 7.97 8.08Latin America 6.17 6.16 6.36 6.52 6.57 6.40 6.36 6.57 6.69 6.65 6.57 6.46 6.71 6.87 6.81 6.71FSU 4.39 4.31 4.42 4.63 4.61 4.49 4.31 4.52 4.82 4.78 4.61 4.43 4.65 4.88 4.93 4.72Africa 3.48 3.65 3.63 3.65 3.74 3.67 3.80 3.81 3.78 3.86 3.81 3.93 3.99 3.97 4.06 3.99Europe 0.66 0.65 0.71 0.70 0.68 0.69 0.63 0.67 0.69 0.72 0.68 0.66 0.69 0.70 0.71 0.69Total Non-OECD 42.49 42.77 43.94 44.55 44.88 44.04 44.20 45.13 45.84 45.99 45.30 45.46 46.56 47.26 47.46 46.69World 88.96 89.03 89.42 90.43 91.10 90.00 90.00 90.57 91.67 91.71 91.00 91.07 91.45 92.82 93.10 92.12of which: US50 18.95 18.43 18.61 18.64 18.48 18.54 18.64 18.63 18.80 18.51 18.65 18.59 18.74 18.68 18.48 18.62
Europe 5* 8.65 8.33 8.28 8.28 8.20 8.27 7.99 8.29 8.21 7.97 8.11 7.96 7.96 8.08 8.00 8.00
China 9.32 9.50 9.60 9.83 10.30 9.81 9.99 10.02 10.22 10.57 10.20 10.44 10.41 10.59 10.95 10.60
Japan 4.47 5.27 4.28 4.47 4.84 4.71 5.07 4.10 4.33 4.70 4.55 4.90 4.00 4.19 4.49 4.39
India 3.20 3.36 3.45 3.17 3.39 3.34 3.43 3.46 3.17 3.50 3.39 3.55 3.56 3.33 3.59 3.51
Russia 3.21 3.19 3.24 3.41 3.35 3.30 3.20 3.33 3.61 3.48 3.41 3.33 3.45 3.66 3.62 3.51
Brazil 2.87 2.87 2.93 3.03 3.12 2.99 2.99 3.08 3.13 3.17 3.09 3.05 3.17 3.26 3.26 3.19
Saudi Arabia 2.79 2.57 3.00 3.32 2.79 2.92 2.72 3.05 3.41 2.92 3.03 2.81 3.18 3.52 3.04 3.14
Canada 2.27 2.19 2.23 2.34 2.38 2.29 2.28 2.30 2.31 2.30 2.30 2.30 2.24 2.35 2.33 2.30
Korea 2.26 2.34 2.23 2.26 2.37 2.30 2.31 2.27 2.28 2.36 2.31 2.38 2.22 2.26 2.40 2.32
Mexico 2.11 2.09 2.13 2.11 2.24 2.14 2.11 2.14 2.14 2.20 2.15 2.09 2.13 2.14 2.19 2.14
Iran 1.77 1.80 1.82 1.69 1.68 1.75 1.73 1.74 1.72 1.70 1.72 1.76 1.75 1.73 1.72 1.74
Total 61.86 61.95 61.82 62.56 63.14 62.37 62.47 62.43 63.33 63.38 62.91 63.16 62.80 63.77 64.07 63.45
% of World 69.5% 69.6% 69.1% 69.2% 69.3% 69.3% 69.4% 68.9% 69.1% 69.1% 69.1% 69.3% 68.7% 68.7% 68.8% 68.9%
Annual Change (% per annum)
Americas1 -0.8 -3.0 -0.5 -1.5 -0.6 -1.4 1.4 0.5 0.7 -0.4 0.6 -0.2 0.1 -0.3 -0.1 -0.1
Europe2 -2.8 -3.7 -2.4 -6.0 -3.0 -3.8 -3.7 0.0 -0.3 -1.8 -1.4 -0.4 -3.0 -0.5 0.6 -0.8
Asia Oceania3 0.6 5.8 7.8 2.9 1.2 4.3 -2.8 -2.1 -2.1 -1.8 -2.3 -1.1 -2.0 -1.5 -1.7 -1.6Total OECD -1.2 -1.6 0.3 -2.2 -1.0 -1.1 -1.0 -0.1 -0.1 -1.1 -0.6 -0.4 -1.2 -0.6 -0.2 -0.6Asia 3.5 2.5 3.1 4.1 5.5 3.8 4.3 3.3 2.8 2.1 3.1 3.2 3.2 3.6 3.2 3.3Middle East 2.0 3.5 4.7 3.7 1.1 3.2 2.6 0.7 2.7 3.3 2.3 2.7 3.2 2.3 3.2 2.8Latin America 1.5 3.6 3.5 2.7 4.8 3.7 3.3 3.3 2.7 1.1 2.6 1.6 2.2 2.7 2.5 2.3FSU 6.3 6.0 2.2 1.1 0.8 2.4 0.0 2.1 4.2 3.5 2.5 2.8 2.9 1.3 3.2 2.5Africa -1.2 4.1 3.7 7.5 6.0 5.3 4.2 4.9 3.6 3.3 4.0 3.2 4.7 5.1 5.3 4.6Europe -0.2 3.4 8.6 3.0 -1.3 3.3 -2.7 -5.6 -0.7 4.8 -1.0 4.3 3.3 1.5 -1.2 1.9Total Non-OECD 2.7 3.3 3.5 3.7 4.1 3.7 3.3 2.7 2.9 2.5 2.9 2.8 3.2 3.1 3.2 3.1World 0.7 0.7 1.8 0.6 1.5 1.2 1.1 1.3 1.4 0.7 1.1 1.2 1.0 1.3 1.5 1.2Annual Change (mb/d)
Americas1 -0.18 -0.71 -0.11 -0.37 -0.14 -0.33 0.32 0.13 0.18 -0.08 0.13 -0.05 0.03 -0.08 -0.01 -0.03
Europe2 -0.41 -0.53 -0.33 -0.88 -0.42 -0.54 -0.51 0.01 -0.04 -0.25 -0.20 -0.05 -0.42 -0.07 0.09 -0.11
Asia Oceania3 0.05 0.50 0.58 0.24 0.11 0.36 -0.26 -0.17 -0.18 -0.16 -0.19 -0.10 -0.16 -0.13 -0.14 -0.13Total OECD -0.55 -0.74 0.14 -1.02 -0.45 -0.52 -0.45 -0.04 -0.04 -0.49 -0.26 -0.19 -0.55 -0.27 -0.07 -0.27Asia 0.69 0.51 0.63 0.81 1.14 0.78 0.90 0.69 0.58 0.47 0.66 0.69 0.70 0.78 0.70 0.72Middle East 0.14 0.25 0.35 0.29 0.08 0.24 0.19 0.06 0.22 0.25 0.18 0.20 0.25 0.20 0.25 0.22Latin America 0.09 0.21 0.22 0.17 0.30 0.23 0.20 0.21 0.17 0.07 0.17 0.10 0.14 0.18 0.17 0.15FSU 0.26 0.24 0.09 0.05 0.04 0.10 0.00 0.09 0.19 0.16 0.11 0.12 0.13 0.06 0.15 0.12Africa -0.04 0.14 0.13 0.26 0.21 0.19 0.15 0.18 0.13 0.12 0.15 0.12 0.18 0.19 0.20 0.18Europe 0.00 0.02 0.06 0.02 -0.01 0.02 -0.02 -0.04 -0.01 0.03 -0.01 0.03 0.02 0.01 -0.01 0.01Total Non-OECD 1.14 1.38 1.47 1.60 1.77 1.55 1.43 1.19 1.29 1.11 1.26 1.26 1.43 1.42 1.46 1.39World 0.59 0.64 1.61 0.58 1.32 1.04 0.97 1.15 1.25 0.61 1.00 1.06 0.88 1.15 1.39 1.12Revisions to Oil Demand from Last Month's Report (mb/d)
Americas1 0.00 -0.05 -0.10 -0.08 -0.03 -0.06 -0.02 0.01 0.05 -0.07 -0.01 0.00 0.03 0.02 -0.01 0.01
Europe2 0.00 0.00 0.00 0.00 0.00 0.00 0.02 -0.01 0.07 -0.01 0.02 -0.04 0.04 0.05 0.02 0.02
Asia Oceania3 0.00 0.00 0.00 0.00 0.00 0.00 0.00 0.01 0.00 0.03 0.01 0.02 -0.02 -0.04 -0.05 -0.02Total OECD 0.00 -0.05 -0.10 -0.08 -0.03 -0.06 0.00 0.01 0.11 -0.05 0.02 -0.02 0.06 0.03 -0.04 0.01Asia 0.02 0.05 0.05 0.05 0.05 0.05 0.07 0.06 0.00 0.06 0.05 0.04 0.05 0.07 0.10 0.07Middle East 0.00 0.00 0.00 0.00 0.00 0.00 0.00 0.00 0.03 0.00 0.01 0.01 0.00 0.00 0.01 0.01Latin America 0.00 0.00 0.00 0.00 0.00 0.00 -0.01 0.01 0.04 0.00 0.01 0.02 0.03 0.00 0.00 0.01FSU 0.00 0.00 0.00 0.00 0.00 0.00 0.00 0.00 0.02 0.00 0.00 -0.01 0.02 0.01 0.00 0.01Africa 0.00 0.00 0.00 0.00 0.00 0.00 -0.01 0.05 0.02 -0.02 0.01 -0.01 0.02 0.01 0.01 0.01Europe 0.00 0.00 0.00 0.00 0.00 0.00 0.00 -0.03 -0.02 0.01 -0.01 -0.01 -0.02 -0.01 -0.01 -0.01Total Non-OECD 0.02 0.05 0.05 0.05 0.05 0.05 0.06 0.09 0.08 0.05 0.07 0.04 0.10 0.09 0.12 0.09World 0.02 0.00 -0.05 -0.03 0.01 -0.02 0.06 0.10 0.19 0.00 0.09 0.02 0.16 0.12 0.07 0.09Revisions to Oil Demand Growth from Last Month's Report (mb/d)World 0.02 -0.01 -0.07 -0.05 0.00 -0.03 0.05 0.16 0.23 -0.01 0.11 -0.03 0.05 -0.07 0.08 0.011 As of the August 2012 OMR, includes Chile.
2 As of the August 2012 OMR, includes Estonia and Slovenia.
3 As of the August 2012 OMR, includes Israel.
* France, Germany, Italy, Spain and UK

INTERNATIONAL ENERGY AGENCY ‐ OIL MARKET REPORT TABLES
11 OCTOBER 2013 57
Table 2a - OECD Regional Oil Demand Table 2a
OECD REGIONAL OIL DEMAND1
(million barrels per day)
2011 2012 3Q12 4Q12 1Q13 2Q13 May 13 Jun 13 Jul 13 2 Jun 13 Jul 12
Americas3
LPG&Ethane 3.13 3.14 2.98 3.36 3.64 2.96 2.89 2.86 2.98 0.12 0.09 Naphtha 0.35 0.34 0.32 0.35 0.36 0.40 0.40 0.42 0.40 -0.02 0.09 Motor Gasoline 10.42 10.34 10.49 10.18 10.03 10.57 10.67 10.65 10.79 0.14 0.31 Jet/Kerosene 1.64 1.65 1.70 1.62 1.58 1.68 1.69 1.69 1.77 0.08 0.06 Gasoil/Diesel Oil 5.12 4.97 4.86 5.00 5.16 5.01 5.06 4.91 4.81 -0.10 0.08 Residual Fuel Oil 0.87 0.78 0.82 0.72 0.75 0.67 0.57 0.75 0.73 -0.02 -0.17 Other Products 2.42 2.42 2.57 2.53 2.18 2.46 2.46 2.65 2.63 -0.02 0.02
Total 23.96 23.63 23.74 23.77 23.71 23.74 23.73 23.92 24.10 0.18 0.46
Europe4
LPG&Ethane 0.97 0.94 0.88 0.91 1.05 1.13 1.15 1.08 1.04 -0.03 0.11 Naphtha 1.15 1.17 1.13 1.17 1.22 1.11 1.08 1.14 1.25 0.11 0.19 Motor Gasoline 2.13 1.99 2.06 1.93 1.79 1.96 1.94 2.00 2.08 0.08 0.00 Jet/Kerosene 1.24 1.21 1.32 1.18 1.13 1.23 1.23 1.25 1.32 0.07 -0.01 Gasoil/Diesel Oil 6.06 5.95 5.88 6.14 5.79 6.00 5.92 5.87 6.01 0.13 -0.01 Residual Fuel Oil 1.23 1.09 1.07 1.03 1.01 0.99 1.01 0.94 0.95 0.01 -0.13 Other Products 1.49 1.40 1.48 1.31 1.19 1.37 1.33 1.42 1.48 0.06 -0.03
Total 14.28 13.74 13.81 13.66 13.17 13.79 13.66 13.71 14.13 0.42 0.12
Asia Oceania5
LPG&Ethane 0.87 0.89 0.85 0.84 0.94 0.82 0.85 0.77 0.83 0.06 -0.05 Naphtha 1.73 1.78 1.78 1.83 1.83 1.72 1.69 1.71 1.81 0.10 0.07 Motor Gasoline 1.60 1.61 1.67 1.63 1.54 1.56 1.56 1.56 1.66 0.10 0.01 Jet/Kerosene 0.88 0.88 0.65 1.02 1.13 0.69 0.67 0.61 0.66 0.05 0.03 Gasoil/Diesel Oil 1.71 1.78 1.75 1.83 1.80 1.72 1.73 1.70 1.75 0.05 -0.02 Residual Fuel Oil 0.78 0.91 0.89 0.86 0.91 0.67 0.64 0.67 0.76 0.09 -0.14 Other Products 0.67 0.76 0.73 0.76 0.77 0.72 0.76 0.68 0.69 0.01 0.07
Total 8.23 8.59 8.33 8.78 8.92 7.90 7.89 7.70 8.15 0.45 -0.05
OECDLPG&Ethane 4.97 4.96 4.71 5.11 5.64 4.91 4.89 4.70 4.85 0.14 0.14 Naphtha 3.23 3.29 3.23 3.35 3.41 3.22 3.18 3.27 3.46 0.19 0.34 Motor Gasoline 14.14 13.93 14.22 13.74 13.37 14.09 14.17 14.21 14.53 0.32 0.31 Jet/Kerosene 3.76 3.73 3.67 3.82 3.84 3.60 3.59 3.55 3.74 0.19 0.08 Gasoil/Diesel Oil 12.90 12.69 12.49 12.97 12.74 12.73 12.71 12.48 12.57 0.09 0.04 Residual Fuel Oil 2.89 2.77 2.78 2.62 2.66 2.33 2.22 2.36 2.44 0.08 -0.44 Other Products 4.59 4.58 4.77 4.61 4.14 4.56 4.54 4.74 4.80 0.05 0.06
Total 46.47 45.96 45.87 46.21 45.81 45.44 45.29 45.32 46.38 1.06 0.54 1 Demand, measured as deliveries from refineries and primary stocks, comprises inland deliveries, international bunkers and refinery fuel. It includes crude for direct burning, oil from non-conventional sources and other sources of supply. Jet/kerosene comprises jet kerosene and non-aviation kerosene. Gasoil comprises diesel, light heating oil and other gasoils. North America comprises US 50 states, US territories, Mexico and Canada. 2 Latest official OECD submissions (MOS).3 As of the August 2012 OMR, includes Chile.4 As of the August 2012 OMR, includes Estonia and Slovenia.5 As of the August 2012 OMR, includes Israel.
Latest month vs.
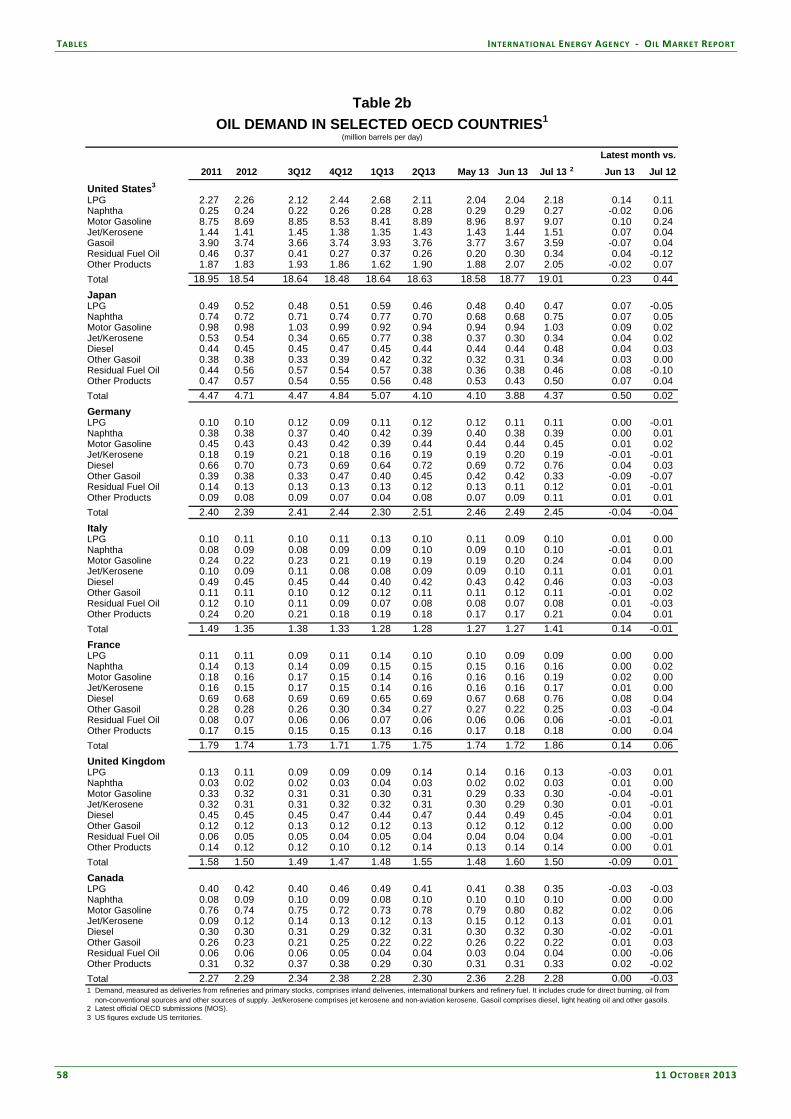
TABLES INTERNATIONAL ENERGY AGENCY ‐ OIL MARKET REPORT
58 11 OCTOBER 2013
Table 2b - OECD Oil Demand and % Growth in Demand in Selected OECD Countries Table 2b
OIL DEMAND IN SELECTED OECD COUNTRIES1
(million barrels per day)
2011 2012 3Q12 4Q12 1Q13 2Q13 May 13 Jun 13 Jul 13 2 Jun 13 Jul 12
United States3
LPG 2.27 2.26 2.12 2.44 2.68 2.11 2.04 2.04 2.18 0.14 0.11 Naphtha 0.25 0.24 0.22 0.26 0.28 0.28 0.29 0.29 0.27 -0.02 0.06 Motor Gasoline 8.75 8.69 8.85 8.53 8.41 8.89 8.96 8.97 9.07 0.10 0.24 Jet/Kerosene 1.44 1.41 1.45 1.38 1.35 1.43 1.43 1.44 1.51 0.07 0.04 Gasoil 3.90 3.74 3.66 3.74 3.93 3.76 3.77 3.67 3.59 -0.07 0.04 Residual Fuel Oil 0.46 0.37 0.41 0.27 0.37 0.26 0.20 0.30 0.34 0.04 -0.12 Other Products 1.87 1.83 1.93 1.86 1.62 1.90 1.88 2.07 2.05 -0.02 0.07
Total 18.95 18.54 18.64 18.48 18.64 18.63 18.58 18.77 19.01 0.23 0.44
JapanLPG 0.49 0.52 0.48 0.51 0.59 0.46 0.48 0.40 0.47 0.07 -0.05 Naphtha 0.74 0.72 0.71 0.74 0.77 0.70 0.68 0.68 0.75 0.07 0.05 Motor Gasoline 0.98 0.98 1.03 0.99 0.92 0.94 0.94 0.94 1.03 0.09 0.02 Jet/Kerosene 0.53 0.54 0.34 0.65 0.77 0.38 0.37 0.30 0.34 0.04 0.02 Diesel 0.44 0.45 0.45 0.47 0.45 0.44 0.44 0.44 0.48 0.04 0.03 Other Gasoil 0.38 0.38 0.33 0.39 0.42 0.32 0.32 0.31 0.34 0.03 0.00 Residual Fuel Oil 0.44 0.56 0.57 0.54 0.57 0.38 0.36 0.38 0.46 0.08 -0.10 Other Products 0.47 0.57 0.54 0.55 0.56 0.48 0.53 0.43 0.50 0.07 0.04
Total 4.47 4.71 4.47 4.84 5.07 4.10 4.10 3.88 4.37 0.50 0.02
GermanyLPG 0.10 0.10 0.12 0.09 0.11 0.12 0.12 0.11 0.11 0.00 -0.01 Naphtha 0.38 0.38 0.37 0.40 0.42 0.39 0.40 0.38 0.39 0.00 0.01 Motor Gasoline 0.45 0.43 0.43 0.42 0.39 0.44 0.44 0.44 0.45 0.01 0.02 Jet/Kerosene 0.18 0.19 0.21 0.18 0.16 0.19 0.19 0.20 0.19 -0.01 -0.01 Diesel 0.66 0.70 0.73 0.69 0.64 0.72 0.69 0.72 0.76 0.04 0.03 Other Gasoil 0.39 0.38 0.33 0.47 0.40 0.45 0.42 0.42 0.33 -0.09 -0.07 Residual Fuel Oil 0.14 0.13 0.13 0.13 0.13 0.12 0.13 0.11 0.12 0.01 -0.01 Other Products 0.09 0.08 0.09 0.07 0.04 0.08 0.07 0.09 0.11 0.01 0.01
Total 2.40 2.39 2.41 2.44 2.30 2.51 2.46 2.49 2.45 -0.04 -0.04
ItalyLPG 0.10 0.11 0.10 0.11 0.13 0.10 0.11 0.09 0.10 0.01 0.00 Naphtha 0.08 0.09 0.08 0.09 0.09 0.10 0.09 0.10 0.10 -0.01 0.01 Motor Gasoline 0.24 0.22 0.23 0.21 0.19 0.19 0.19 0.20 0.24 0.04 0.00 Jet/Kerosene 0.10 0.09 0.11 0.08 0.08 0.09 0.09 0.10 0.11 0.01 0.01 Diesel 0.49 0.45 0.45 0.44 0.40 0.42 0.43 0.42 0.46 0.03 -0.03 Other Gasoil 0.11 0.11 0.10 0.12 0.12 0.11 0.11 0.12 0.11 -0.01 0.02 Residual Fuel Oil 0.12 0.10 0.11 0.09 0.07 0.08 0.08 0.07 0.08 0.01 -0.03 Other Products 0.24 0.20 0.21 0.18 0.19 0.18 0.17 0.17 0.21 0.04 0.01
Total 1.49 1.35 1.38 1.33 1.28 1.28 1.27 1.27 1.41 0.14 -0.01
FranceLPG 0.11 0.11 0.09 0.11 0.14 0.10 0.10 0.09 0.09 0.00 0.00 Naphtha 0.14 0.13 0.14 0.09 0.15 0.15 0.15 0.16 0.16 0.00 0.02 Motor Gasoline 0.18 0.16 0.17 0.15 0.14 0.16 0.16 0.16 0.19 0.02 0.00 Jet/Kerosene 0.16 0.15 0.17 0.15 0.14 0.16 0.16 0.16 0.17 0.01 0.00 Diesel 0.69 0.68 0.69 0.69 0.65 0.69 0.67 0.68 0.76 0.08 0.04 Other Gasoil 0.28 0.28 0.26 0.30 0.34 0.27 0.27 0.22 0.25 0.03 -0.04 Residual Fuel Oil 0.08 0.07 0.06 0.06 0.07 0.06 0.06 0.06 0.06 -0.01 -0.01 Other Products 0.17 0.15 0.15 0.15 0.13 0.16 0.17 0.18 0.18 0.00 0.04
Total 1.79 1.74 1.73 1.71 1.75 1.75 1.74 1.72 1.86 0.14 0.06
United KingdomLPG 0.13 0.11 0.09 0.09 0.09 0.14 0.14 0.16 0.13 -0.03 0.01 Naphtha 0.03 0.02 0.02 0.03 0.04 0.03 0.02 0.02 0.03 0.01 0.00 Motor Gasoline 0.33 0.32 0.31 0.31 0.30 0.31 0.29 0.33 0.30 -0.04 -0.01 Jet/Kerosene 0.32 0.31 0.31 0.32 0.32 0.31 0.30 0.29 0.30 0.01 -0.01 Diesel 0.45 0.45 0.45 0.47 0.44 0.47 0.44 0.49 0.45 -0.04 0.01 Other Gasoil 0.12 0.12 0.13 0.12 0.12 0.13 0.12 0.12 0.12 0.00 0.00 Residual Fuel Oil 0.06 0.05 0.05 0.04 0.05 0.04 0.04 0.04 0.04 0.00 -0.01 Other Products 0.14 0.12 0.12 0.10 0.12 0.14 0.13 0.14 0.14 0.00 0.01
Total 1.58 1.50 1.49 1.47 1.48 1.55 1.48 1.60 1.50 -0.09 0.01
CanadaLPG 0.40 0.42 0.40 0.46 0.49 0.41 0.41 0.38 0.35 -0.03 -0.03 Naphtha 0.08 0.09 0.10 0.09 0.08 0.10 0.10 0.10 0.10 0.00 0.00 Motor Gasoline 0.76 0.74 0.75 0.72 0.73 0.78 0.79 0.80 0.82 0.02 0.06 Jet/Kerosene 0.09 0.12 0.14 0.13 0.12 0.13 0.15 0.12 0.13 0.01 0.01 Diesel 0.30 0.30 0.31 0.29 0.32 0.31 0.30 0.32 0.30 -0.02 -0.01 Other Gasoil 0.26 0.23 0.21 0.25 0.22 0.22 0.26 0.22 0.22 0.01 0.03 Residual Fuel Oil 0.06 0.06 0.06 0.05 0.04 0.04 0.03 0.04 0.04 0.00 -0.06 Other Products 0.31 0.32 0.37 0.38 0.29 0.30 0.31 0.31 0.33 0.02 -0.02
Total 2.27 2.29 2.34 2.38 2.28 2.30 2.36 2.28 2.28 0.00 -0.03 1 Demand, measured as deliveries from refineries and primary stocks, comprises inland deliveries, international bunkers and refinery fuel. It includes crude for direct burning, oil from non-conventional sources and other sources of supply. Jet/kerosene comprises jet kerosene and non-aviation kerosene. Gasoil comprises diesel, light heating oil and other gasoils. 2 Latest official OECD submissions (MOS).3 US figures exclude US territories.
Latest month vs.

INTERNATIONAL ENERGY AGENCY ‐ OIL MARKET REPORT TABLES
11 OCTOBER 2013 59
Table 3 - World Oil Production Table 3
WORLD OIL PRODUCTION(million barrels per day)
2012 2013 2014 2Q13 3Q13 4Q13 1Q14 2Q14 Jul 13 Aug 13 Sep 13
OPECCrude Oil Saudi Arabia 9.51 9.29 9.84 9.74 9.93 9.86 Iran 3.00 2.68 2.64 2.65 2.68 2.58 Iraq 2.95 3.16 3.04 3.06 3.22 2.82 UAE 2.65 2.72 2.76 2.75 2.75 2.77 Kuwait 2.46 2.56 2.53 2.54 2.51 2.53 Neutral Zone 0.54 0.52 0.52 0.52 0.52 0.52 Qatar 0.74 0.73 0.73 0.73 0.73 0.73 Angola 1.78 1.76 1.71 1.73 1.70 1.72 Nigeria 2.10 1.94 1.97 1.92 1.94 2.04 Libya 1.39 1.31 0.62 1.00 0.55 0.30 Algeria 1.17 1.14 1.14 1.15 1.12 1.15 Ecuador 0.50 0.51 0.52 0.52 0.52 0.52 Venezuela 2.50 2.52 2.46 2.47 2.47 2.45
Total Crude Oil 31.30 30.83 30.47 30.77 30.63 29.99 Total NGLs1 6.28 6.46 6.70 6.40 6.52 6.57 6.66 6.66 6.52 6.52 6.52
Total OPEC 37.58 37.22 36.99 37.29 37.15 36.51
NON-OPEC2
OECDAmericas6 15.86 17.10 18.16 16.70 17.25 17.66 18.02 18.02 17.11 17.32 17.34 United States5 9.18 10.20 11.03 10.06 10.37 10.53 10.80 11.00 10.32 10.38 10.42 Mexico 2.92 2.88 2.85 2.88 2.88 2.86 2.87 2.86 2.85 2.89 2.90 Canada 3.75 4.01 4.27 3.75 3.99 4.27 4.34 4.15 3.93 4.04 4.01 Chile 0.01 0.01 0.01 0.01 0.01 0.01 0.01 0.01 0.01 0.01 0.01 Europe7 3.46 3.28 3.21 3.30 3.11 3.37 3.36 3.22 3.41 3.03 2.89 UK 0.94 0.85 0.83 0.89 0.74 0.87 0.89 0.84 0.85 0.65 0.71 Norway 1.91 1.85 1.83 1.84 1.82 1.93 1.90 1.84 1.98 1.82 1.64 Others 0.60 0.58 0.54 0.58 0.56 0.57 0.56 0.54 0.57 0.57 0.55 Asia Oceania8 0.56 0.49 0.52 0.49 0.52 0.50 0.46 0.52 0.52 0.52 0.51 Australia 0.48 0.42 0.44 0.42 0.45 0.45 0.38 0.44 0.44 0.46 0.46 Others 0.08 0.07 0.08 0.08 0.06 0.05 0.08 0.08 0.08 0.06 0.05
Total OECD 19.88 20.88 21.88 20.50 20.89 21.53 21.85 21.76 21.04 20.87 20.75
NON-OECD
Former USSR 13.65 13.82 13.93 13.78 13.79 13.85 13.89 13.91 13.80 13.69 13.90 Russia 10.73 10.83 10.86 10.84 10.85 10.82 10.85 10.86 10.78 10.89 10.89 Others 2.92 2.98 3.07 2.94 2.94 3.03 3.04 3.05 3.02 2.80 3.01
Asia 7.82 7.71 7.79 7.82 7.51 7.64 7.79 7.80 7.58 7.46 7.50 China 4.18 4.15 4.24 4.24 4.03 4.14 4.23 4.26 4.08 4.00 4.01 Malaysia 0.67 0.67 0.69 0.65 0.65 0.68 0.69 0.69 0.66 0.63 0.68 India 0.91 0.89 0.88 0.90 0.89 0.88 0.89 0.88 0.89 0.89 0.88 Indonesia 0.89 0.84 0.79 0.87 0.82 0.81 0.81 0.80 0.83 0.82 0.81 Others 1.17 1.15 1.18 1.17 1.12 1.13 1.16 1.17 1.12 1.13 1.12
Europe 0.14 0.14 0.13 0.14 0.14 0.13 0.13 0.13 0.14 0.14 0.14
Latin America 4.18 4.19 4.41 4.17 4.17 4.28 4.33 4.37 4.17 4.18 4.15 Brazil5 2.16 2.12 2.28 2.10 2.10 2.21 2.22 2.25 2.07 2.10 2.11 Argentina 0.66 0.63 0.61 0.64 0.63 0.62 0.62 0.62 0.65 0.62 0.62 Colombia 0.95 1.02 1.10 1.00 1.02 1.04 1.07 1.10 1.02 1.03 1.01 Others 0.42 0.42 0.41 0.43 0.42 0.41 0.42 0.41 0.43 0.42 0.41
Middle East3 1.46 1.36 1.33 1.33 1.36 1.34 1.34 1.33 1.36 1.37 1.34 Oman 0.92 0.95 0.96 0.94 0.96 0.96 0.95 0.95 0.96 0.96 0.95 Syria 0.17 0.06 0.04 0.06 0.05 0.04 0.05 0.04 0.06 0.06 0.05 Yemen 0.18 0.14 0.13 0.12 0.14 0.14 0.14 0.13 0.14 0.14 0.13 Others 0.18 0.21 0.20 0.21 0.21 0.21 0.21 0.20 0.21 0.21 0.21
Africa 2.28 2.36 2.59 2.32 2.37 2.48 2.56 2.59 2.42 2.31 2.39 Egypt 0.72 0.70 0.66 0.70 0.69 0.68 0.67 0.67 0.70 0.70 0.69 Gabon 0.25 0.24 0.24 0.23 0.24 0.24 0.24 0.24 0.25 0.24 0.24 Others 1.31 1.42 1.69 1.39 1.43 1.55 1.65 1.69 1.48 1.37 1.46
Total Non-OECD 29.52 29.57 30.18 29.56 29.34 29.73 30.04 30.13 29.47 29.15 29.41
Processing Gains4 2.14 2.18 2.21 2.16 2.20 2.18 2.21 2.19 2.22 2.22 2.17
Global Biofuels5 1.86 1.97 2.10 2.02 2.32 2.06 1.72 2.11 2.31 2.35 2.28
TOTAL NON-OPEC 53.40 54.60 56.37 54.24 54.75 55.50 55.82 56.19 55.04 54.59 54.61
TOTAL SUPPLY 90.98 91.46 91.73 92.32 91.74 91.12 1 Includes condensates reported by OPEC countries, oil from non-conventional sources, e.g. Venezuelan Orimulsion (but not Orinoco extra-heavy oil),
and non-oil inputs to Saudi Arabian MTBE. Orimulsion production reportedly ceased from January 2007.
2 Comprises crude oil, condensates, NGLs and oil from non-conventional sources
3 Includes small amounts of production from Jordan and Bahrain.
4 Net volumetric gains and losses in refining and marine transportation losses.
5 As of the July 2010 OMR, Global Biofuels comprise all world biofuel production including fuel ethanol from the US and Brazil.
6 As of the August 2012 OMR, includes Chile.
7 As of the August 2012 OMR, includes Estonia and Slovenia.
8 As of the August 2012 OMR, includes Israel.
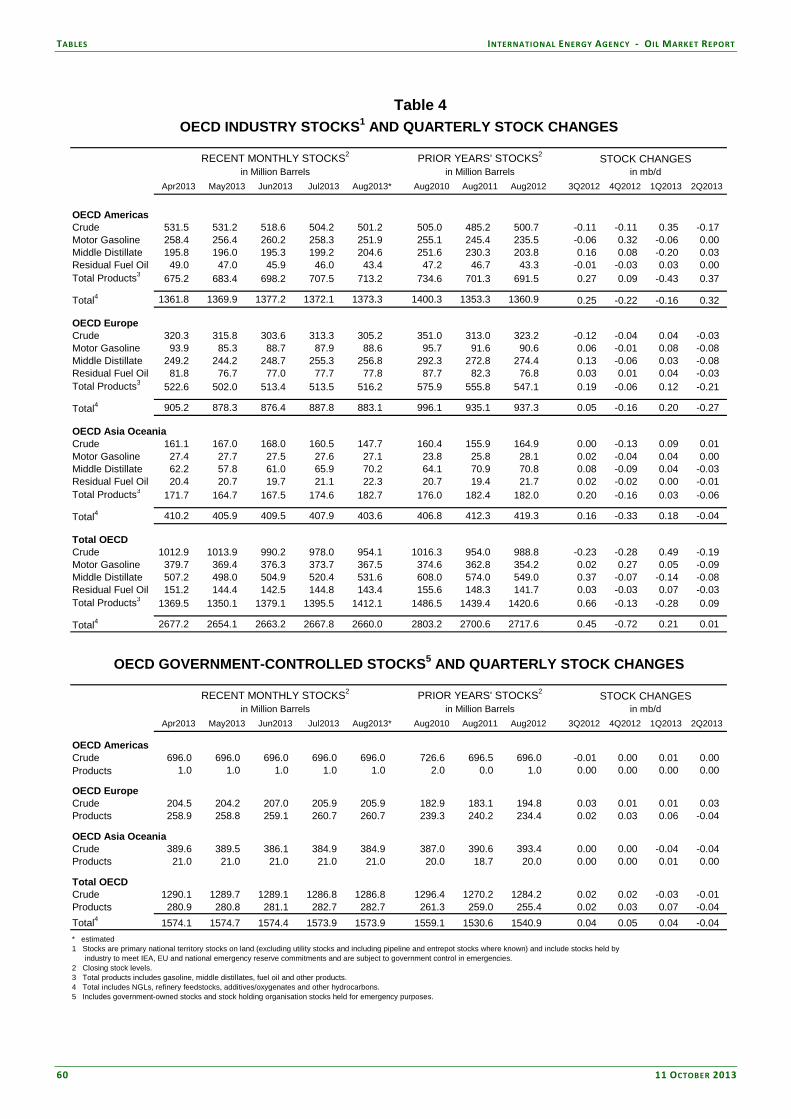
TABLES INTERNATIONAL ENERGY AGENCY ‐ OIL MARKET REPORT
60 11 OCTOBER 2013
Table 4 - OECD Industry Stocks and Quarterly Stock Changes/OECD Government-Controlled Stocks and Quarterly Stock Changes
OECD INDUSTRY STOCKS1 AND QUARTERLY STOCK CHANGES
RECENT MONTHLY STOCKS2 PRIOR YEARS' STOCKS2STOCK CHANGES
in Million Barrels in Million Barrels in mb/d
Apr2013 May2013 Jun2013 Jul2013 Aug2013* Aug2010 Aug2011 Aug2012 3Q2012 4Q2012 1Q2013 2Q2013
OECD AmericasCrude 531.5 531.2 518.6 504.2 501.2 505.0 485.2 500.7 -0.11 -0.11 0.35 -0.17 Motor Gasoline 258.4 256.4 260.2 258.3 251.9 255.1 245.4 235.5 -0.06 0.32 -0.06 0.00 Middle Distillate 195.8 196.0 195.3 199.2 204.6 251.6 230.3 203.8 0.16 0.08 -0.20 0.03 Residual Fuel Oil 49.0 47.0 45.9 46.0 43.4 47.2 46.7 43.3 -0.01 -0.03 0.03 0.00 Total Products3
675.2 683.4 698.2 707.5 713.2 734.6 701.3 691.5 0.27 0.09 -0.43 0.37
Total4 1361.8 1369.9 1377.2 1372.1 1373.3 1400.3 1353.3 1360.9 0.25 -0.22 -0.16 0.32
OECD EuropeCrude 320.3 315.8 303.6 313.3 305.2 351.0 313.0 323.2 -0.12 -0.04 0.04 -0.03 Motor Gasoline 93.9 85.3 88.7 87.9 88.6 95.7 91.6 90.6 0.06 -0.01 0.08 -0.08 Middle Distillate 249.2 244.2 248.7 255.3 256.8 292.3 272.8 274.4 0.13 -0.06 0.03 -0.08 Residual Fuel Oil 81.8 76.7 77.0 77.7 77.8 87.7 82.3 76.8 0.03 0.01 0.04 -0.03 Total Products3 522.6 502.0 513.4 513.5 516.2 575.9 555.8 547.1 0.19 -0.06 0.12 -0.21
Total4 905.2 878.3 876.4 887.8 883.1 996.1 935.1 937.3 0.05 -0.16 0.20 -0.27
OECD Asia OceaniaCrude 161.1 167.0 168.0 160.5 147.7 160.4 155.9 164.9 0.00 -0.13 0.09 0.01 Motor Gasoline 27.4 27.7 27.5 27.6 27.1 23.8 25.8 28.1 0.02 -0.04 0.04 0.00 Middle Distillate 62.2 57.8 61.0 65.9 70.2 64.1 70.9 70.8 0.08 -0.09 0.04 -0.03 Residual Fuel Oil 20.4 20.7 19.7 21.1 22.3 20.7 19.4 21.7 0.02 -0.02 0.00 -0.01 Total Products3
171.7 164.7 167.5 174.6 182.7 176.0 182.4 182.0 0.20 -0.16 0.03 -0.06
Total4 410.2 405.9 409.5 407.9 403.6 406.8 412.3 419.3 0.16 -0.33 0.18 -0.04
Total OECDCrude 1012.9 1013.9 990.2 978.0 954.1 1016.3 954.0 988.8 -0.23 -0.28 0.49 -0.19 Motor Gasoline 379.7 369.4 376.3 373.7 367.5 374.6 362.8 354.2 0.02 0.27 0.05 -0.09 Middle Distillate 507.2 498.0 504.9 520.4 531.6 608.0 574.0 549.0 0.37 -0.07 -0.14 -0.08 Residual Fuel Oil 151.2 144.4 142.5 144.8 143.4 155.6 148.3 141.7 0.03 -0.03 0.07 -0.03 Total Products3 1369.5 1350.1 1379.1 1395.5 1412.1 1486.5 1439.4 1420.6 0.66 -0.13 -0.28 0.09
Total4 2677.2 2654.1 2663.2 2667.8 2660.0 2803.2 2700.6 2717.6 0.45 -0.72 0.21 0.01
OECD GOVERNMENT-CONTROLLED STOCKS5 AND QUARTERLY STOCK CHANGES
RECENT MONTHLY STOCKS2 PRIOR YEARS' STOCKS2STOCK CHANGES
in Million Barrels in Million Barrels in mb/d
Apr2013 May2013 Jun2013 Jul2013 Aug2013* Aug2010 Aug2011 Aug2012 3Q2012 4Q2012 1Q2013 2Q2013
OECD AmericasCrude 696.0 696.0 696.0 696.0 696.0 726.6 696.5 696.0 -0.01 0.00 0.01 0.00 Products 1.0 1.0 1.0 1.0 1.0 2.0 0.0 1.0 0.00 0.00 0.00 0.00
OECD EuropeCrude 204.5 204.2 207.0 205.9 205.9 182.9 183.1 194.8 0.03 0.01 0.01 0.03 Products 258.9 258.8 259.1 260.7 260.7 239.3 240.2 234.4 0.02 0.03 0.06 -0.04
OECD Asia OceaniaCrude 389.6 389.5 386.1 384.9 384.9 387.0 390.6 393.4 0.00 0.00 -0.04 -0.04 Products 21.0 21.0 21.0 21.0 21.0 20.0 18.7 20.0 0.00 0.00 0.01 0.00
Total OECDCrude 1290.1 1289.7 1289.1 1286.8 1286.8 1296.4 1270.2 1284.2 0.02 0.02 -0.03 -0.01 Products 280.9 280.8 281.1 282.7 282.7 261.3 259.0 255.4 0.02 0.03 0.07 -0.04
Total4 1574.1 1574.7 1574.4 1573.9 1573.9 1559.1 1530.6 1540.9 0.04 0.05 0.04 -0.04
* estimated1 Stocks are primary national territory stocks on land (excluding utility stocks and including pipeline and entrepot stocks where known) and include stocks held by industry to meet IEA, EU and national emergency reserve commitments and are subject to government control in emergencies. 2 Closing stock levels.3 Total products includes gasoline, middle distillates, fuel oil and other products. 4 Total includes NGLs, refinery feedstocks, additives/oxygenates and other hydrocarbons. 5 Includes government-owned stocks and stock holding organisation stocks held for emergency purposes.
Table 4

INTERNATIONAL ENERGY AGENCY ‐ OIL MARKET REPORT TABLES
11 OCTOBER 2013 61
Table 5 - Total Stocks on Land in OECD Countries/Total OECD Stocks Table 5
TOTAL STOCKS ON LAND IN OECD COUNTRIES1
('millions of barrels' and 'days')
3
Stock Days Fwd2Stock Days Fwd Stock Days Fwd Stock Days Fwd Stock Days Fwd
Level Demand Level Demand Level Demand Level Demand Level Demand
OECD AmericasCanada 170.1 73 179.6 76 173.2 76 170.9 74 174.1 -Chile 10.3 29 9.8 27 8.9 25 9.5 25 9.3 -Mexico 45.3 21 48.8 22 47.5 23 48.7 23 50.0 -United States4 1811.2 97 1820.5 99 1808.8 97 1794.2 96 1818.7 -
Total4 2058.9 87 2080.7 88 2060.5 87 2045.4 86 2074.2 87OECD Asia OceaniaAustralia 40.8 36 42.8 37 37.5 34 37.5 33 39.7 -Israel - - - - - - - - - -Japan 601.3 135 605.7 125 590.2 116 589.2 144 585.8 -Korea 176.7 78 183.8 78 175.4 76 187.6 82 182.3 -New Zealand 8.0 56 8.9 58 7.8 49 9.0 60 8.8 -Total 826.8 99 841.3 96 811.0 91 823.3 104 816.6 100OECD Europe5
Austria 21.5 79 21.6 86 22.9 95 22.5 83 22.0 -Belgium 38.6 65 38.3 60 38.7 57 37.7 60 39.4 -Czech Republic 18.6 89 18.9 96 20.2 118 20.3 107 18.5 -Denmark 19.5 122 21.2 138 21.3 147 23.7 152 22.1 -Estonia 1.2 49 1.1 39 1.5 55 1.6 72 2.3 -Finland 28.0 145 28.2 139 26.3 136 36.6 188 38.2 -France 163.7 95 164.0 96 162.3 93 160.9 92 165.5 -Germany 279.6 116 283.0 116 287.1 125 290.5 116 288.4 -Greece 28.9 93 30.1 104 30.8 112 32.0 110 26.4 -Hungary 15.9 115 15.6 113 15.1 123 16.6 123 15.4 -Ireland 10.5 82 9.5 67 10.3 77 10.0 82 10.5 -Italy 134.4 97 142.8 108 125.5 98 130.3 102 125.7 -Luxembourg 0.6 11 0.7 13 0.7 11 0.7 11 0.6 -Netherlands 112.6 111 113.5 115 121.3 128 132.5 129 123.1 -Norway 27.4 127 27.0 108 27.9 126 25.6 100 23.3 -Poland 62.7 118 62.8 119 63.9 139 63.3 132 61.0 -Portugal 20.4 86 20.8 97 21.3 97 23.1 93 21.7 -Slovak Republic 9.0 109 8.8 108 8.5 119 8.7 120 8.6 -Slovenia 4.6 83 5.2 97 5.3 111 5.0 97 5.2 -Spain 132.8 104 130.8 105 120.1 101 123.8 104 117.1 -Sweden 29.0 92 30.2 95 27.6 91 28.7 88 27.7 -Switzerland 35.2 146 36.7 135 36.8 147 36.5 142 36.7 -Turkey 64.0 89 63.4 93 62.0 104 62.0 86 63.9 -United Kingdom 82.5 55 75.4 51 80.9 55 79.1 51 83.4 -
Total 1341.2 97 1349.8 99 1338.4 102 1371.7 99 1346.7 98
Total OECD 4226.9 92 4271.8 92 4209.9 92 4240.4 93 4237.5 92
DAYS OF IEA Net Imports6 - 149 - 150 - 148 - 149 - 1601 Total Stocks are industry and government-controlled stocks (see breakdown in table below). Stocks are primary national territory stocks on land (excluding utility stocks and including pipeline and entrepot stocks where known) they include stocks held by industry to meet IEA, EU and national emergency reserves commitments and are subject to government control in emergencies.2 Note that days of forward demand represent the stock level divided by the forward quarter average daily demand and is very different from the days of net imports used for the calculation of IEA Emergency Reserves.3 End June 2013 forward demand figures are IEA Secretariat forecasts. 4 US figures exclude US territories. Total includes US territories.5 Data not available for Iceland.6 Reflects stock levels and prior calendar year's net imports adjusted according to IEA emergency reserve definitions (see www.iea.org/netimports.asp). Net exporting IEA countries are excluded.
TOTAL OECD STOCKS
CLOSING STOCKS Total Industry Total Industry
2Q2010 4330 1566 2765 91 33 583Q2010 4306 1553 2753 90 33 584Q2010 4244 1565 2679 90 33 571Q2011 4208 1562 2646 93 34 582Q2011 4250 1565 2685 91 33 573Q2011 4199 1529 2670 90 33 574Q2011 4141 1536 2605 90 33 561Q2012 4194 1536 2657 92 34 592Q2012 4227 1539 2688 92 34 593Q2012 4272 1542 2729 92 33 594Q2012 4210 1547 2663 92 34 581Q2013 4240 1578 2662 93 35 592Q2013 4238 1574 2663 92 34 581 Includes government-owned stocks and stock holding organisation stocks held for emergency purposes.2 Days of forward demand calculated using actual demand except in 2Q2013 (when latest forecasts are used).
End September 2012 End June 2012 End December 2012 End March 2013
Millions of Barrels
Government1
controlledGovernment1
controlledDays of Fwd. Demand 2
End June 2013

TABLES INTERNATIONAL ENERGY AGENCY ‐ OIL MARKET REPORT
62 11 OCTOBER 2013
Table 6 - IEA Member Country Destinations of Selected Crude Streams Table 6
IEA MEMBER COUNTRY DESTINATIONS OF SELECTED CRUDE STREAMS1
(million barrels per day)
Year Earlier2010 2011 2012 3Q12 4Q12 1Q13 2Q13 May 13 Jun 13 Jul 13 Jul 12 change
Saudi Light & Extra LightAmericas 0.69 0.69 0.76 0.67 0.65 0.69 0.66 0.55 0.62 0.89 0.68 0.21Europe 0.66 0.83 0.85 0.97 0.77 0.67 0.88 0.94 1.05 0.93 0.96 -0.03Asia Oceania 1.21 1.24 1.26 1.21 1.27 1.22 1.20 1.23 1.11 1.15 1.25 -0.09
Saudi MediumAmericas 0.36 0.37 0.44 0.41 0.43 0.44 0.44 0.48 0.42 0.45 0.41 0.04Europe 0.00 0.02 0.05 0.05 0.02 - 0.02 0.01 0.01 0.01 0.06 -0.05Asia Oceania 0.34 0.40 0.45 0.48 0.44 0.49 0.34 0.27 0.43 0.40 0.46 -0.06
Saudi HeavyAmericas 0.02 0.02 0.05 0.02 0.02 - 0.06 0.15 0.01 0.15 0.03 0.12Europe 0.00 0.01 0.12 0.21 0.13 0.08 0.20 0.19 0.20 0.19 0.16 0.02Asia Oceania 0.22 0.20 0.20 0.19 0.19 0.20 0.20 0.18 0.20 0.21 0.20 0.01
Iraqi Basrah Light2
Americas 0.36 0.29 0.49 0.46 0.55 0.56 0.26 0.21 0.27 0.37 0.41 -0.04Europe 0.09 0.11 0.26 0.42 0.31 0.18 0.26 0.29 0.26 0.42 0.50 -0.08Asia Oceania 0.29 0.34 0.33 0.39 0.31 0.35 0.35 0.31 0.33 0.29 0.41 -0.12
Iraqi KirkukAmericas 0.03 0.07 0.05 0.04 0.03 0.01 0.01 - - - 0.04 -Europe 0.27 0.27 0.22 0.21 0.25 0.19 0.21 0.19 0.21 0.12 0.18 -0.06Asia Oceania - - - - - - - - - - - -
Iranian LightAmericas - - - - - - - - - - - -Europe 0.24 0.23 0.12 0.05 0.05 0.10 0.10 0.09 0.11 0.06 0.00 0.06Asia Oceania 0.04 0.04 0.02 0.01 0.01 0.01 - - - - - -
Iranian Heavy3
Americas - - - - - - - - - - - -Europe 0.49 0.55 0.16 0.08 0.04 0.02 0.01 0.01 - 0.04 0.04 -0.01Asia Oceania 0.52 0.51 0.33 0.11 0.36 0.39 0.25 0.42 0.27 0.30 0.01 0.28
Venezuelan Light & MediumAmericas 0.14 0.18 0.13 0.14 0.16 0.17 0.09 0.09 0.18 - 0.19 -Europe 0.02 0.02 0.02 0.01 0.06 0.03 - - - 0.02 0.02 0.00Asia Oceania - - 0.01 - - - 0.01 - - - - -
Venezuelan 22 API and heavierAmericas 0.86 0.76 0.69 0.77 0.73 0.60 0.62 0.57 0.68 0.67 0.71 -0.04Europe 0.06 0.05 0.08 0.11 0.04 0.06 0.08 0.11 0.05 0.09 0.12 -0.03Asia Oceania - - - - - - - - - - - -
Mexican MayaAmericas 0.91 0.82 0.73 0.76 0.74 0.63 0.67 0.67 0.70 0.68 0.76 -0.08Europe 0.11 0.12 0.14 0.13 0.17 0.15 0.16 0.13 0.19 0.13 0.11 0.02Asia Oceania - - - - - - - - - - - -
Mexican IsthmusAmericas 0.04 0.07 0.04 0.05 0.04 0.05 0.03 0.00 0.01 0.01 0.09 -0.08Europe 0.02 0.01 0.03 0.03 0.04 0.03 0.02 0.02 0.02 0.03 0.05 -0.02Asia Oceania - - - - - - - - - - - -
Russian UralsAmericas 0.08 0.01 0.00 0.01 - - 0.02 0.02 0.02 - 0.02 -Europe 1.80 1.69 1.86 1.97 1.94 1.85 1.93 2.07 1.68 1.72 1.97 -0.25Asia Oceania - - - - - - - - - - - -
Nigerian Light4
Americas 0.60 0.53 0.24 0.25 0.14 0.14 0.15 0.23 0.21 - 0.22 -Europe 0.34 0.45 0.58 0.72 0.58 0.65 0.46 0.46 0.45 0.50 0.62 -0.12Asia Oceania - 0.05 0.04 0.03 0.03 0.02 0.05 0.08 0.04 0.03 - -
Nigerian MediumAmericas 0.25 0.18 0.12 0.14 0.21 0.07 0.12 0.11 0.13 0.03 0.16 -0.13Europe 0.09 0.14 0.25 0.26 0.23 0.21 0.21 0.18 0.15 0.25 0.31 -0.06Asia Oceania - - 0.00 0.00 - - - - - - - -
1 Data based on monthly submissions from IEA countries to the crude oil import register (in '000 bbl), subject to availability. May differ from Table 8 of the Report. IEA Americas includes United States and Canada. IEA Europe includes all countries in OECD Europe except Estonia, Hungary and Slovenia. IEA Asia Oceania includes Australia, New Zealand, Korea and Japan.2 Iraqi Total minus Kirkuk.3 Iranian Total minus Iranian Light.4 33° API and lighter (e.g., Bonny Light, Escravos, Qua Iboe and Oso Condensate).

INTERNATIONAL ENERGY AGENCY ‐ OIL MARKET REPORT TABLES
11 OCTOBER 2013 63
Table 7 - Regional OECD Imports
Table 7REGIONAL OECD IMPORTS1,2
(thousand barrels per day)
Year Earlier
2010 2011 2012 3Q12 4Q12 1Q13 2Q13 May 13 Jun 13 Jul 13 Jul 12 % change
Crude Oil
Americas 7494 6870 6101 6147 5610 5039 5323 5457 5457 5547 6226 -11%
Europe 9072 8988 9346 9795 9286 8947 9229 9407 8983 9574 9784 -2%
Asia Oceania 6473 6609 6761 6627 6702 6999 6242 6241 6186 6340 6778 -6%
Total OECD 23038 22468 22208 22568 21597 20985 20795 21104 20627 21461 22788 -6%
LPG
Americas 34 33 26 34 23 37 31 45 21 51 35 46%
Europe 285 318 287 271 297 352 400 433 355 314 256 23%
Asia Oceania 565 568 620 598 615 598 547 494 572 577 536 8%
Total OECD 884 919 933 903 936 987 977 972 948 942 827 14%
Naphtha
Americas 36 42 20 17 15 21 20 26 16 15 10 50%
Europe 399 298 350 291 347 348 275 258 325 298 341 -13%
Asia Oceania 908 884 900 920 961 954 939 927 962 833 816 2%
Total OECD 1344 1224 1270 1228 1324 1324 1235 1210 1303 1146 1167 -2%
Gasoline3
Americas 801 762 730 802 652 610 801 808 731 664 826 -20%
Europe 187 222 212 201 188 121 99 86 118 124 275 -55%
Asia Oceania 84 95 86 68 89 96 91 94 69 76 65 17%
Total OECD 1073 1079 1028 1071 928 828 990 988 917 865 1165 -26%
Jet & Kerosene
Americas 76 77 73 99 86 51 84 95 73 84 47 79%
Europe 418 397 398 456 465 327 415 421 432 489 479 2%
Asia Oceania 45 58 63 55 82 107 56 44 63 43 61 -30%
Total OECD 539 532 534 609 634 484 555 560 568 616 588 5%
Gasoil/Diesel
Americas 100 72 59 50 69 83 81 78 71 51 43 18%
Europe 1071 1044 984 966 1074 1031 955 1016 985 1182 1019 16%
Asia Oceania 103 147 185 194 203 177 166 131 176 143 222 -36%
Total OECD 1275 1263 1227 1210 1347 1291 1203 1225 1232 1376 1284 7%
Heavy Fuel Oil
Americas 277 268 206 208 181 163 150 130 130 185 207 -11%
Europe 464 537 521 483 439 539 511 531 551 593 533 11%
Asia Oceania 123 153 223 227 241 260 197 186 198 198 223 -11%
Total OECD 864 958 951 918 860 963 858 847 879 976 963 1%
Other Products
Americas 807 871 813 838 829 735 865 951 811 937 829 13%
Europe 692 700 654 658 671 833 773 888 799 819 676 21%
Asia Oceania 367 366 356 359 317 381 372 425 333 400 341 17%
Total OECD 1866 1937 1823 1855 1817 1949 2010 2265 1944 2156 1846 17%
Total Products
Americas 2132 2125 1927 2048 1855 1701 2031 2132 1854 1987 1998 -1%
Europe 3516 3516 3405 3326 3481 3552 3428 3633 3564 3819 3579 7%
Asia Oceania 2197 2271 2432 2421 2509 2572 2368 2301 2373 2269 2263 0%
Total OECD 7845 7912 7765 7795 7846 7825 7827 8066 7791 8076 7840 3%
Total Oil
Americas 9625 8995 8028 8195 7465 6740 7354 7589 7311 7534 8223 -8%
Europe 12588 12504 12751 13121 12767 12499 12657 13040 12547 13394 13363 0%
Asia Oceania 8670 8880 9194 9048 9210 9572 8611 8542 8559 8609 9041 -5%
Total OECD 30883 30380 29973 30363 29443 28810 28622 29171 28418 29537 30628 -4%1 Based on Monthly Oil Questionnaire data submitted by OECD countries in tonnes and converted to barrels. 2 Excludes intra-regional trade.3 Includes additives.

©© OOEECCDD//IIEEAA 22001133.. AAllll RRiigghhttss RReesseerrvveedd
The International Energy Agency (IEA) makes every attempt to ensure, but does not guarantee, the accuracy and completeness of the information or the clarity of content of the Oil Market Report (hereafter the OMR). The IEA shall not be liable to any party for any inaccuracy, error or omission contained or provided in this OMR or for any loss, or damage, whether or not due to reliance placed by that party on information in this OMR.
The Executive Director and Secretariat of the IEA are responsible for the publication of the OMR. Although some of the data are supplied by IEA Member‐country governments, largely on the basis of information they in turn receive from oil companies, neither these governments nor these oil companies necessarily share the Secretariat’s views or conclusions as expressed in the OMR. The OMR is prepared for general circulation and is distributed for general information only. Neither the information nor any opinion expressed in the OMR constitutes an offer, or an invitation to make an offer, to buy or sell any securities or any options, futures or other derivatives related to such securities.
This OMR is the copyright of the OECD/IEA and is subject to terms and conditions of use. These terms and conditions are available on the IEA website at http://www.iea.org/oilmar/licenceomr.html. In relation to the Subscriber Edition (as defined in the OMR's online terms and conditions), all Argus information is sourced from Copyright © 2013 Argus Media Limited and is published here with the permission of Argus. The spot crude and product price assessments are based on daily Argus prices, converted when appropriate to US$ per barrel according to the Argus specification of products. Argus Media Limited reserves all rights in relation to all Argus information. Any reproduction of Argus information requires the express prior written permission of Argus. Argus shall not be liable to any party for any inaccuracy, error or omission contained or provided in Argus information contained in this OMR or for any loss, or damage, whether or not due to reliance placed by that party on information in this OMR.

Next Issue: 14 November 2013
OMR Contacts
Editor and Head, Oil Industry and Markets Division
Antoine Halff
Analysts
Toril Bosoni (Refining)
Charles Esser (Non-OPEC Supply)
Diane Munro (OPEC Supply and Prices)
Matt Parry (Demand)
Andrew Wilson (Stocks/Statistics)
Statistics
Valerio Pilia
Editorial Assistant
Annette Hardcastle
Contact: (+33) 0*1 40 57 66 67 [email protected] * 0 - only within France
Media Enquiries
IEA Press Office (+33) 0* 1 40 57 65 54 [email protected]
User’s Guide and Glossary to the IEA Oil Market Report For information on the data sources, definitions, technical terms and general approach used in preparing the Oil Market Report (OMR), Medium-Term Oil Market Report (MTOMR) and Annual Statistical Supplement (current issue of the Statistical Supplement dated 9 August 2013), readers are referred to the Users’ Guide at www.oilmarketreport.org/glossary.asp. It should be noted that the spot crude and product price assessments are based on daily Argus prices, converted when appropriate to US$ per barrel according to the Argus specification of products (Copyright © 2013 Argus Media Limited - all rights reserved).
Subscription and Delivery Enquiries Oil Market Report Subscriptions International Energy Agency BP 586-75726 PARIS Cedex 15, France (+33) 0* 1 40 57 67 72 [email protected] (+33) 0* 1 40 57 66 90
The Oil Market Report is published under the responsibility of the Executive Director and Secretariat of the International Energy Agency. Although some of the data are supplied by Member-country Governments, largely on the basis of information received from oil companies, neither governments nor companies necessarily share the Secretariat’s views or conclusions as expressed therein. © OECD/IEA 2013