petroleum exploration activity in australia (bmr … · ee o aciiy hr r vr ndtr hh b d t r th lvl f...
TRANSCRIPT

I
I
C. I
SMR Record 1971/43
c.1
•
•
Record No. 1971 I 43 052890
Petroleum Exploration Act ivity
in Australia
by
L-a.'O\NG cor 0 .. t::.1~
oT TO Bi Rt.160~
Roll \J
L W. Williams
Record No. 1971 1 43
Petroleum Exploration Activity
in Australia
by
L.W.Williams
The information contained in this report has been obtained bythe Department of National Development as part of the policyof the Commonwealth Government to assist in the explorationand development of mineral resources. It may not be publishedin any form or used in a company prospectus or statemen. withoutthe permission in writing of the Director, Bureau of MineralResources, Geology and Geophysics.

PETROLEUM EXPLORATION ACTIVITY IN AUSTRALIA -
by
L.W. Williams
CONTENTS
Page
ABSTRACT 1
INTRODUCTION 1
EXPLORATION IN 1970 1-2
LEVEL OF ACTIVITY 3-5
PREDICTIONS FOR 1971 5-6
GENERAL 6-7
CONCLUSIONS 7-8
ILLUSTRATIONS
Figure 1^Active Exploration Units
Drilling RigsSeismic Crews
Figure 2a Exploration footage drilled
Figure 2b Number of Exploration Wells
Figure 3 Exploration Expenditure
-

PETROLEUf1 EXPLORATION ACTIVITY IN AUSTRALIA
by
L.1tl 0 \'!i1liams
Record No. 1971/43
ABSTRACT
The highlight of the 1970 petroleum exploration in Australia
was the number of onshore discoveries o These were mostly gas and were
mainly in two basins o A success ratio of about one discovery in eight
exploration wells was achieved. The offshore results were disappointing
with no major discoveries recorded.
An analysis of the level of exploration activity up to the
end of 1970 shows onshore exploration continuing at a steady rate for
the last three years, but a small,decrease in offshore acti vi ty was
apparent in 1970. However, estimates of activity in 1971 indicate that
a decrease in the level of activity can be expected this year and that
this decrease may intensify if 6il discoveries are not made.
INTRODUCTION
This paper is based largely on information kindly supplied
by exploration companies whose co-operation is gratefully acknowledged.
It is presented with the permission of the Director, Bureau of Mineral
Resources, Geology and Geophysics, Canberra A.C.T.
EXPLORATION IN 1970
Exploration activity "'as spread widely throughout most of
the sedimentary basins during 1970 9 although the level of activity
varied considerably among them.

2.
The onshore areas which received most attention were the
Cooper, Surat and Canning Basins. Papua can probably also be included
in this category on the basis of expenditure although geophysical
coverage and number of wells were not high. Other areas which had
received little recent attention and which were explored again in 1970
were the Laura, eastern Officer and Arckaringa Basins and the Toko
Syncline. Little or no work was done in the Amadeus, Adavale and
Carnarvon (onshore) Basins°
Offshore activity was concentrated mainly off the northwest
of the continent and, during the first part of the year, in Bass Strait.
Some geophysics was carried out in other areas°
The outstanding result of exploration during 1970 was the
discovery of several onshore gas fields, The most notable of these were
in the Cooper Basin, where large flows were recorded, and in the Surat
Basin. These discoveries were in addition to other wells which increased
the known reserves in several fields,
The Cooper Basin discoveries were at Della Noa 1 9 Strzelecki
Noa 1, Merrimelia No. 5, Packsaddle No° 1 9 Mudrangie No, 1 and Tirrawarra
.No. ia In the Surat Basin new discoveries were made at Boxleigh No. 1,
Euthulla No. 1, Westlands Noa 1, Kincora Northeast No. 1 and Noorindoo
No. 1. A small gas flow was also recorded from Nogarth. o. 2 in the
Clarence-Moreton Basin.
A significant onshore oil discovery was made at Tirrawarra No. 1
where a flow of over 600 b.p.d0 was encountered° This discovery requires
confirmation, but is very interesting in that it is the first oil flow
in the Cooper Basina
Offshore exploration was again very disappointing with
none of the 26 wells which reached total depth discovering commercial
petroleum. However, a considerable amount of seismic work was carried
out, particularly on the Northwest Shelf and in the Timor Sea, and
there is no shortage of drilling targets in these areas.
It is interesting to note in comparison with the offshore lack
of success, that approximately one in eight of the onshore exploration wells
drilled in 1970 encountered a significant new accumulation of -petroleum,

LEVEL OF ACTIVITY
There are various indicators which may be used to measure
the level of exploration activity and, for many reasons, these need
not necessarily give consistent assessments of trends. This has happened
recently in Australia.
One indicator is the number of active exploration units,
which are shown in Figure 10 The upper graph shows the annual average
number of drilling rigs engaged on exploration from 1965 to 1970 with
a breakdown into onshore and offshore rigs. The lower graph shows the
same information for seismic crews.
From 1966 to 1968 the increase in numbers of active offshore
rigs roughly balanced the decrease in numbers of onshore rigs and it
• is only in 1970 that we see a decrease in the average number of rigs
both onshore and offshore. In 1970, the average number of active
exploration rigs was about half the average number in 1965, which was
the peak year for rig activity . in Australia.
The lower graph shows that the.average number of active
seismic crews fell from 1965 9 which was also the peak year for seismic
activity, until 1968 and then after a minor recovery in 1969 dropped
slightly in 1970. This drop in 1970 in total crews is due to the
decrease in the number of offshore crews, which has fallen steadily
since 1966. The average number of onshore crews was about the same'in
1970 as in 1969.
The number of' idle rigs in. the. country and the fact that
drilling contractors are sending rigs overseas have been mentioned as
indications that the level of exploration o is falling off. This
argument is not valid. During the lasttwo years there has been an
average of 31 onshore rigs-available in Australia. Several of these
have not worked at all during the period and many others have worked
for less than half the time. This indicates a surplus of drilling rigs
and, while, the number of active drilling rigs may be considered to be
one of the indicators of level of exploration activity, the ratio of
active rigs to available 'rigs should certainly not be. It must also
be remembered that the same rigs can be used on exploration and
development projects.

The next in.dicator that oafL be used is the amount of'
exploration work done by these a~tive unitao rpW.s is.very difficult
to assess on a consistent basis for sei sml.C 0rews a.Yld so I have
confined this part of this analysis to dr.U.h.ng r.igs. Figure 2a shows
annual exploration footage d.rilled. and Figure 2b shows the number of
exploration wells for the same: pe.riod v 1965 to 1970 0
The total explorati.on footage drilled (onshore and offshore)
fell from a peak in 1965 until 196; and has increased each year since.
The same pattern applies to number of wellsa \ole see a similar pattern
also in onshore footage and number of wells except that. the minimum was
in 1968 9 and only in the offshore is a different pattern apparento The
shape of the curves for number of offshore wells and exploration footage
drilled is similar to that fo:r number of active offshore rigs (Fig. 1) 0
Both the number of offshore wells and footage drIlled increased from 1966
to 1969 and then dropped off in 1970., This is an indicati.on of what we
can expect in 19710
If we consider the totals for onshc-re and offshore in Figures
2a and 2b 9 this indicator sho,,'s that the level of drilling activity has
increased over the last three years"
The third indicatoT "'hleh m9.Y be used is expendi ture o Figure 3
shows annual exploration expenditures a'1d the breakdown into onshore and
offshore expendit.ures for the years 1965 to 19690 Expenditure figures for
1910 are not yet availableo 'rhe total ·e:x:pendi.ture figure: does not reflect
the 1965 peak for number of ac"':;i.ve UXtl·ts 9 footage drilled afLd number of
wellso In fact exploration expenditure has increased each year o Figure 3 shows quite clearly that thi s in.crease is entirely due to increased
expenditure offshoreo Onshore ey.penditure dropped sharply until 1961
and remained reasonably consta!·!t for the r:ext two yearsn
To summarise what these various indicators show9 it is
desirable to consider onshore a.nd offshore separately" Ever'J indicator
shows the recent or~shore exploration effort to be considerably less than
in 19650 However~ during the last three years!' th.ey show different trends. . :i
Wi th,out putting emphaSis on any Of!.e indi cator it is reasonable· to conclude
that the onshore· exploration effort has been reasonably steady or even
increasing sli.ghtly si.nOE: 1968 0
5.
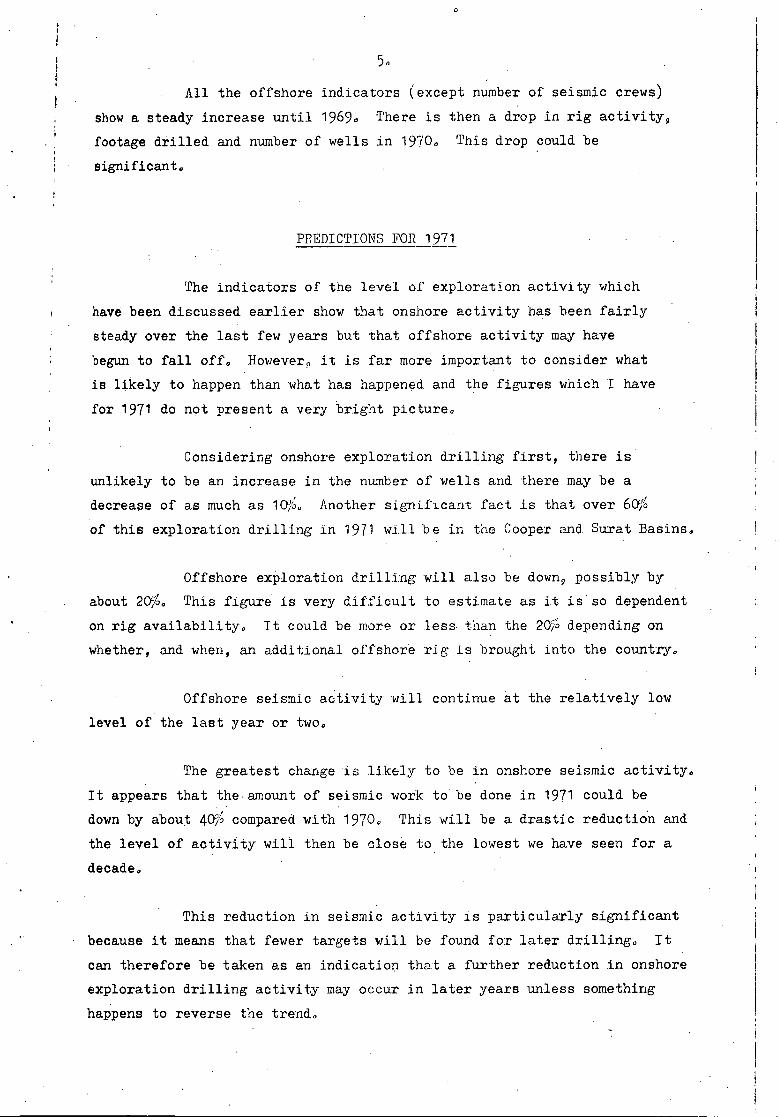
All the offshore indicators (except number of seismic crews)
show a steady increase until 1969. There is then a drop in rig activity,
footage drilled and number of wells in 1970. This drop could be
significant.
PREDICTIONS FOR 1971
The indicators of the level of exploration activity which
have been discussed earlier show that onshore activity has been fairly
steady over the last few years but that offshore activity may have
begun to fall off. However it is far more important to consider what
is likely to happen than what has happened and the figures which I have
for 1971 do not present a very bright picture.
Considering onshore exploration drilling first, there is
unlikely to be an increase in the number of wells and there may be a
decrease of as much as 10%. Another significant fact is that over 60%
of this exploration drilling in 1971 will be in the Cooper and. Surat Basins.
Offshore exploration drilling will also be down, possibly by
about 20%. This figure . is very difficult to estimate as it is so dependent
on rig availability. It could be more or less- than the 20% depending on
whether, and when, an additional offshore rig is brought into the .country.
Offshore seismic activity will continue at the relatively low
level of the last year or two.
The greatest change is likely to be in onshore seismic activity.
It appears that the amount of seismic work to be done in 1971 could be
down by about 40% compared with 1970. This will be a drastic reduction and
the level of activity will then be close to the lowest we have seen for a
decade.
This reduction in seismic activity is particularly significant
because it means that fewer targets will be found for later drilling. It
can therefore be taken as an indication that a further reduction in onshore
exploration drilling activity may occur in later years unless something
happens to reverse the trend.

6 .
The analysis of various indicators of the level of exploration
over the last few years and what I can predict about 1971 indicate that
offshore activity has passed a peak and is starting to decline. Onshore,
although exploration drilling has proceeded at a steady, if modest, pace
the expected decrease in seismic activity and possible decrease in drilling
indicate that a decline in onshore activity is also starting.
The big danger at this time is that the indications which
we now see of a decline are the start of a major rundown in the level
of exploration activity. Once such a rundown starts it is very difficult
to stop because it is self supporting. The fewer wells that are drilled
the less chance there is of a discovery and this lack of success becomes
the reason for further reductions in the level of exploration.
In 1967-1968 we saw a similar reduction in onshore exploration
activity which was halted, or perhaps slightly reversed, in 1969 and 1970.
It may be argued that a similar thing Could happen again but there is one
important difference. The revival in 1969 and 1970 was largely due to
the many new exploration companies which were floated and the farmouts
which they were able to acquire. The same thing is not likely to happen
in 1972, partly because of the present stock market climate which is not
conducive to new floats and partly because, through the farmouts, a
second look has been taken at many areas.
What we must strive for is to maintain a reasonable level of
exploration in the hope that discoveries will be made which will lead to
an increase in that level.
GENERAL
Up until a year or two ago, following the series of Gippsland
Shelf discoveries, there was a fairly generally held opinion that much
of Australia's offshore area was highly prospective and certainly far
more prospective than the onshore areas. Recent results have not supported
this opinion.
There has not been a major offshore oil discovery since 1967
and substantial gas discoveries have been restricted to the Gulf of Papua

7 .
and Bonaparte Gulf. This is in contrast to the onshore areas where
we have seen a string of successes, These have been mostly gas and
possibly hot large enough to be commercial offshore, but a success ratio •
of about one in eight in 1970 may be considered encouraging.
The reduction in offshore activity is understandable in view
of the very little recent success, Companies cannot be expected to
continue this very expensive exploration indefinitely without sufficient
encouragement to persuade them that they have a reasonable chance of
at least recovering their expenses,
On the other hand the onshore successes could reasonably be
expected to supply the impetus to increase activity. This has not
occurred, The drawback is that the discoveries have been mostly gas and,
with contracts already written or being negotiated for the major existing
gas markets, the incentive to discover more gas is considerably reduced.
It appears that oil discoveries are necessary to give the
required impetus to exploration. For this reason it is desirable that
more exploration be carried out in areas other than the general Moomba-
Gidgealpa area of the Cooper Basin and the Roma area of the Surat Basin.
Although oil has been discovered in these areas and it is possible that
more will be found, at this stage in their exploration they must be considered
primarily as gas provinces. Fortunately there are still large areas in
Australia which have not been adequately explored and which may be capable
of producing large quantities of oil. It is to these areas which we
must look for the oil discoveries which are necessary to supply the
incentive for increased exploration,
CONCLUSIONS
The results of exploration during the last two or three years
have not supplied the incentive necessary to maintain the past level of
exploration activity in 1971, The offshore results have been disappointing
but nevertheless there are still large areas to be explored which appear
to have all the necessary requirements to produce large quantities of
petroleum, The onshore results have been encouraging but, because gas
aa
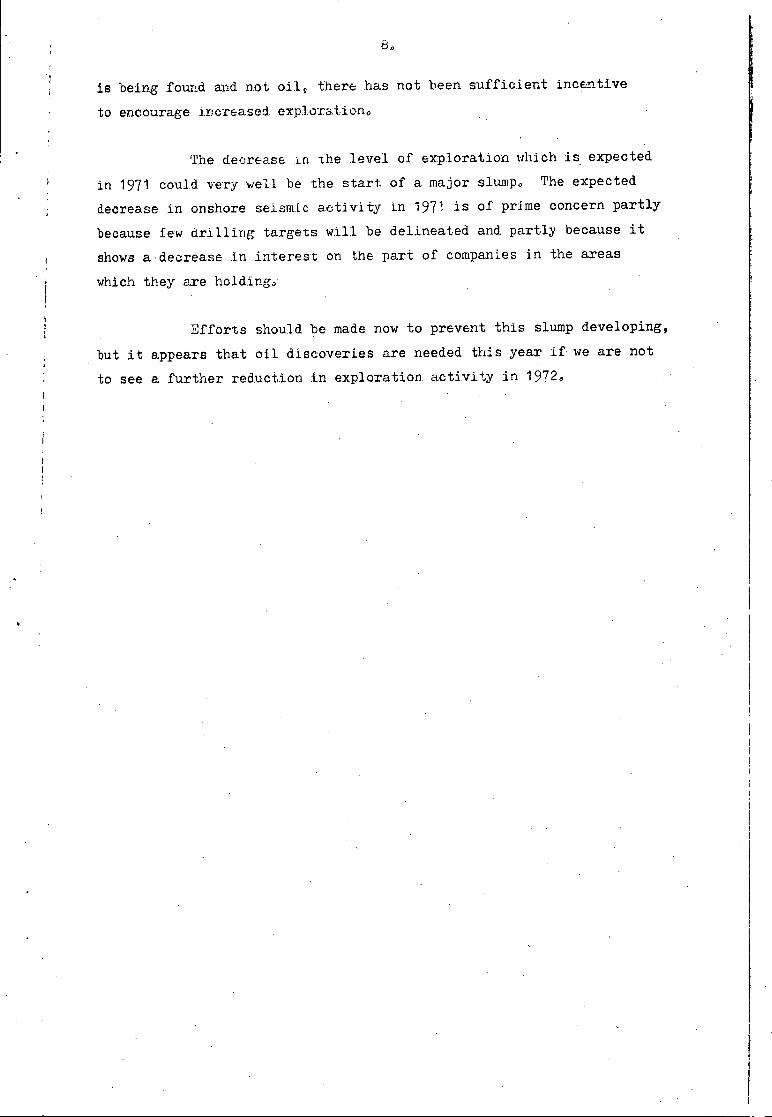
is being found and not oil, there has not been sufficient incentive
to encourage increased exploration.
The decrease in the level of exploration which is expected
in 1971 could very well be the start of a major slump. The expected
decrease in onshore seismic activity in 1971 is of prime concern partly
because few drilling targets will be delineated and partly because it
shows a-decrease in interest on the part of companies in the areas
which they are holding..
Efforts should be made now to prevent this slump developing,
but it appears that oil discoveries are needed this year if we are not
to see a further reduction in exploration activity in 1972.

.. , ~
Fig. I
ACTIVE EXPLORATION UNITS 30
DRILLING RIGS
~ -~ ........
..... ----- --------1------- -------I
20
10
p..-.-.-.-.-. 1--._._._._. I--.-o_o_o~._ --.---_0_._0_0_0 ~.-.-. o
40r-------~------~--------.-------~------_,
SEISMIC CREWS
30~~~~d-~----~--------~------+-------~
20~------4-~~~~--------~----~+-------~
10~------~--~--~--~~--~·
.-.-.-.-. o ___ .--1-____ ---L ______ .l-____ --'-_.-_O_-_O-..::.=.-=. 1965 ·1966 1967 1968 1969 1970
TOTAL ----- ONSHORE -.-0-.- OFFSHORE
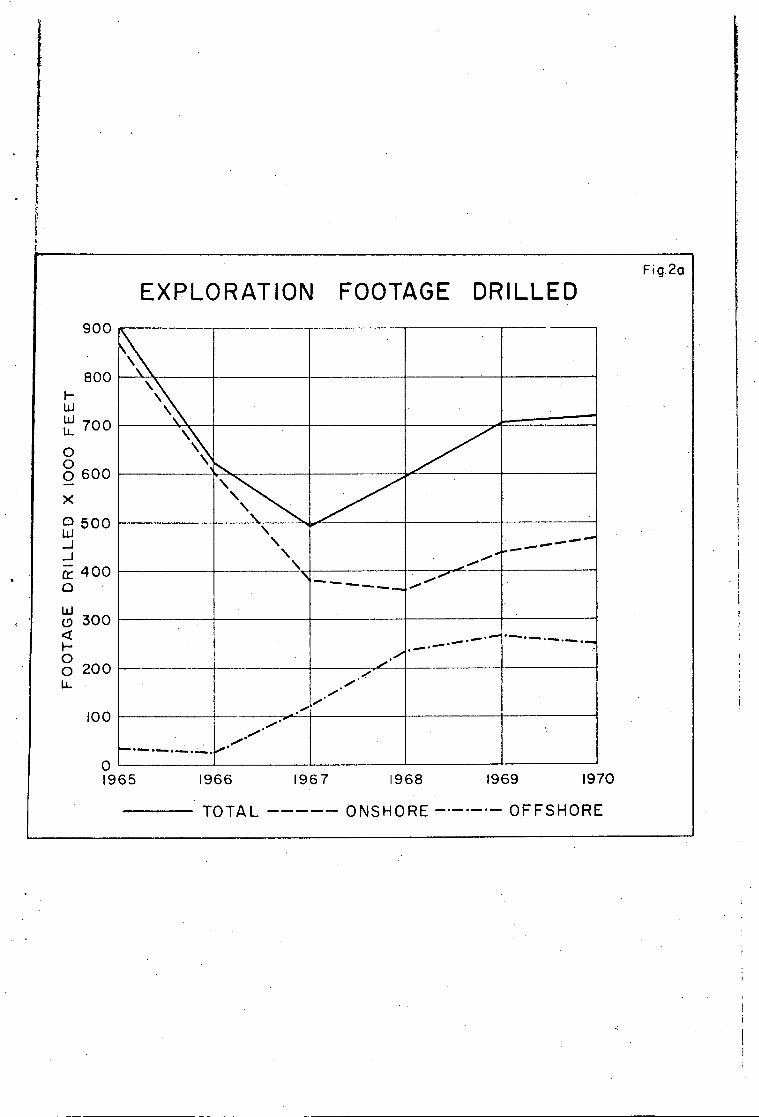
Fig. 2a
EXPLORATION FOOTAGE DRILLED900
8001-w• 700u_00O 600
X
O 500_1
E 400a
O 300
O
•
200
100
0
\\\\\\\\\\
\\\\\\\\ ^V::
•••••• ......
...••• ..". -... •••■•• -...
•••••• •...•••• ...... ...... .••••• • .......,...
— . — . — .^. •
1965^
1966^
1967^
1968^
1969^1970
TOTAL
ONSHORE ---- OFFSHORE
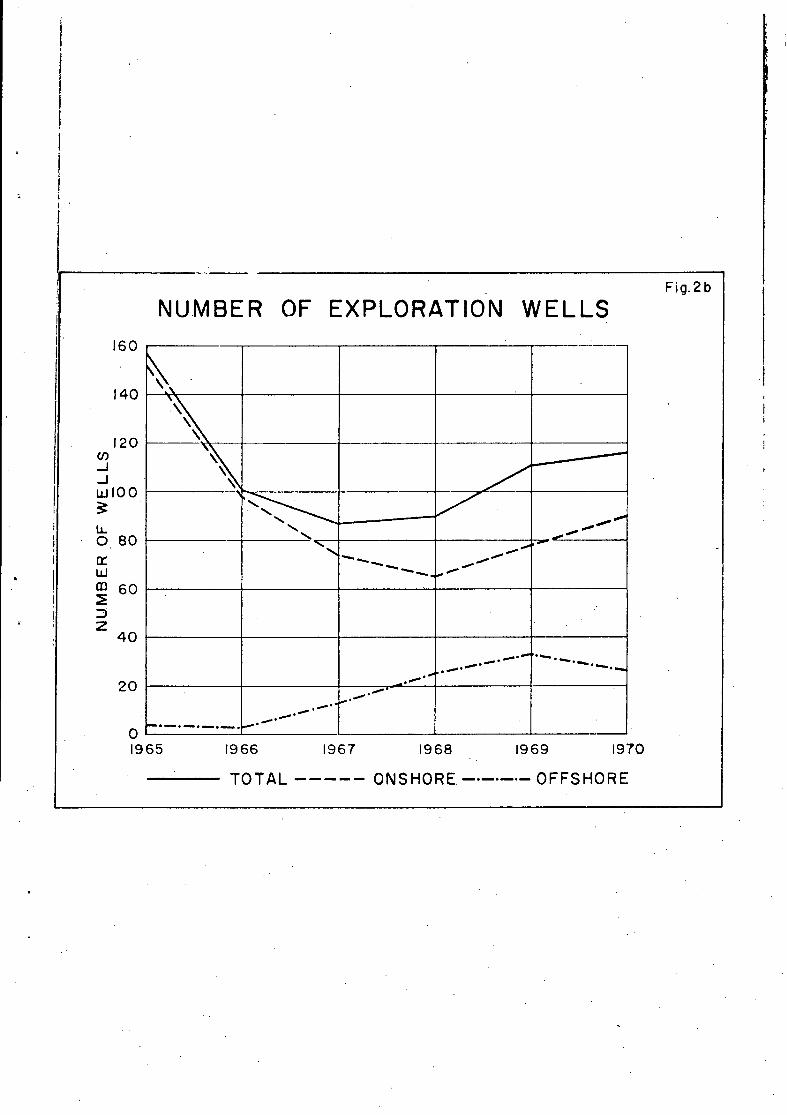
Fig.2b
NUMBER OF EXPLORATION WELLS160
140
120
_J_JLAJ 100
0 80
M 602
40
20
\
\\\\\\
-'''
..'•■
do ....
'S.*,..... .....
...... ...v. ....
....'.....
.....
....•..•••• ....'
.../..."'
...'''.
.. ..... • I'
....• .....".
••••• '• .... • ...... ....... •••■.•
• .....
PM. • minim • • • . • • '.....
..•••..r•••-
...0. •••• -
...., '.....
1965^1966^1967^1968^1969^1970
TOTAL
ONSHORE ------- OFFSHORE

2 0 -l -l -~
~
2 -
W n:
('
::J I--0 2 W a.. x w
EXPLORATION EXPENDITURE Fig.3
100
80
60
.... _--
40
20
~.-
o 1965
. -.
/ ~
~ V
_0
~o-.,..".,"""
° / ---"', / ° 0 ,
° / , . / ,
/' , ~.
" . .
::< ~--- ..... ---./ ------
./ /
/ /.
/ ..... .".,. . 1/
__ L... .... •• _ eo., -1966 1967 1968 1969 1970
TOT A L - - - - - 0 N S H 0 R E -.-.-. - 0 F F S HO R E
\