petroleum exploration plays and resource estimates, 1989
TRANSCRIPT

U.S. DEPARTMENT OF THE INTERIOR
U.S. GEOLOGICAL SURVEY
Petroleum Exploration Plays and Resource Estimates, 1989,Onshore United States-
Region 6, Gulf Coast
By
Richard B. Powers, Editor1
Open-File Report 93-705
This report is preliminary and has not been reviewed for conformity with U.S. Geological Survey editorial standards or with the North American Stratigraphic Code. Any use of trade, product, or firm names is for descriptive purposes only and does not imply endorsement by the U.S. Government.
Denver, Colorado
1993
CONTENTS
IntroductionRichard B. Powers..................................................................................................... 1
Commodities assessed................................................................................................... 2
Areas of study................................................................................................................ 2
Play discussion format................................................................................................... 5
Assessment procedures and methods............................................................................. 5
References cited............................................................................................................. 7
Glossary......................................................................................................................... 8
Region 6~Gulf Coast
Geologic FrameworkRichard B. Powers..................................................................................................... 9
Western Gulf Basin Province (112)Richard Q. Foote, Linda M. Massingill, Robert H. Wells,Gordon L. Dolton, andMahlonM. Ball................................................................... 11
East Texas Basin Province (113)Richard Q. Foote, Linda M. Massingill and Robert H. Wells................................. 48
Louisiana-Mississippi Salt Basins Province (114)Richard Q. Foote, Robert H. Wells, Linda M. Massingill, andMahlon M. Ball........................................................................................................ 69
Selected References..................................................................................................... 104
FIGURES
1. Diagram showing petroleum resource classification.............................................. 3
2. Map showing petroleum regions assessed in this study ......................................... 4
3. Index map of lower 48 states showing provinces assessed inRegion 6................................................................................................................ 10
4. Generalized stratigraphic column, Western Gulf Basin province........................ 12
5-15. Play maps:
5. Southeast Texas-South Louisiana Salt....................................................................14
6. South Texas-Louisiana Reef...................................................................................17
7. South Texas Chalk Oil and South Texas Chalk Gas ..............................................20

Contents-continued
8. Tuscaloosa-Woodbine............................................................................................24
9. Southern Maverick Basin .......................................................................................27
10. Wilcox.......................................................^
11. Northern Maverick Basin .......................................................................................33
12. South Texas Upper Eocene.....................................................................................36
13. Frio-Anahuac-Miocene...........................................................................................39
14. Louisiana Chalk Oil and Louisiana Chalk Gas.......................................................42
15. South Texas Oligocene-Miocene............................................................................46
16. Generalized stratigraphic column, East Texas Basin province ..............................49
17-22. Play maps:
17. Mexia-Talco Fault Zone .........................................................................................52
18.
19.
20. Cotton Valley....................................,.....................................................................61
21. Basement Structure.................................................................................................64
22. Salt Anticlines.........................................................................................................67
23. Generalized stratigraphic columns, Louisiana-Mississippi Salt Basinsprovince ..................................................................................................................70
24-34. Play maps:
24. Salt Basin Deep.......................................................................................................72
25. Pickens-PollardFault..............................................................................................75
26. Basin Structural......................................................................................................78
27. Salt Basin................................................................................................................81
28. Wiggins-Hancock Arch..........................................................................................84
29. Smackover..............................................................................................................87
30. Arkansas Structural.................................................................................................90
31. Alabama Miocene...................................................................................................93
11

Contents Continued
32 Sabine Uplift Gas....................................................................................................96
33. Sabine Uplift Oil.....................................................................................................99
34. Monroe Uplift....................................................................................................... 102
TABLE
Region 6 Gulf Coast; estimates of undiscovered recoverable conventional oil, gas,and natural gas liquids in onshore provinces by play.................................................. 105
in

PETROLEUM EXPLORATION PLAYS AND RESOURCE ESTIMATES, 1989,ONSHORE UNITED STATES-
REGION 6, GULF COAST
Richard B. Powers, Editor
INTRODUCTION
By Richard B. Powers
This report, one of a series, provides brief discussions of the petroleum geology, play descriptions, and resource estimates of 30 individually assessed exploration plays in 3 onshore geologic provinces in assessment Region 6 within the continental United States; these 3 onshore provinces were among 80 provinces, including 220 total plays, that were assessed in connection with the determination of the Nation's estimated undiscovered resources of oil and gas in 1989. The report is an outgrowth of, and is based on, studies that led to the publication of "Estimates of undiscovered conventional oil and gas resources in the United States A part of the Nation's energy endowment" (Mast and others, 1989). That report, a cooperative effort by the USGS (U.S. Geological Survey) and MMS (Minerals Management Service), presented estimates of undiscovered conventionally recoverable oil and gas for both the onshore and offshore petroleum provinces of the Nation. The data sources, assumptions, and methodologies used in the development of these estimates are summarized in Mast and others (1989) and described in more detail in a joint USGS-MMS Working Paper, U.S. Geological Survey Open-File Report 88-373 (1988). The plays discussed in this present report are those that are located exclusively within the onshore United States and adjoining State offshore areas, as assessed by the USGS. All estimates of undiscovered oil and gas resources are as of January 1,1987; additional data received after that date were not incorporated into the assessment.
In the 1989 National appraisal of undiscovered oil and gas resources, plays were the basic unit for quantitative estimates; this report presents not only the play estimates, but also the framework and petroleum geology for each of these basic units. Play discussions here summarize the open-file reports which were prepared by the geologists assigned to each assessment area. We are presenting the resource estimates and narrative descriptions at this basic play level because of the great interest shown by the public, State Geological Surveys, the oil and gas industry, and workers involved in oil and gas appraisal.
Sources of information for province studies included published and purchased data, data from USGS studies in progress, data from previous resource assessments, data from State Geological Surveys, and analysis of geological, geochemical, and geophysical data from various sources utilized in developing and defining plays. Computerized drilling and well completion data from oil and gas exploratory and development wells came from PI WHCS (Petroleum Information Corporation's Well History Control System). In addition, data on oil and gas fields were obtained from the "Significant oil and gas fields of the United States" file of NRG Associates, Inc. of 1986, and from the PI PDS (Petroleum Data System) computerized file of 1986. Additional statistical information on field production and reserves was obtained from yearly publications of various State oil and gas commissions, or their equivalents.
Uncertainties are inherent in estimating undiscovered quantities of oil and gas. Play estimates presented here are judgmental and are based upon a variety of geologic data, records of exploration successes and failures, production histories, assumptions of economic and technical conditions, and appraisal methods. Methodologies were developed to aid in making decisions under conditions of uncertainty, and the results are presented as ranges of values with associated probabilities of occurrence. The estimates should be viewed as indicators, not absolutes, of the
petroleum potential of the plays. The plays range from those in mature, established producing basins, to highly speculative, frontier-type plays in provinces that have experienced scant exploration or wildcat drilling.
COMMODITIES ASSESSED
Commodities assessed in this study are crude oil, natural gas, and natural gas liquids that exist in conventional reservoirs. Terms defined here are standard usage of the the oil and natural gas industry and resource estimation.
Undiscovered recoverable resources. Resources in undiscovered accumulations analogous to those in existing fields which are producible with current recovery technology and efficiency, but without reference to economic viability. These resources occupy the area of the heavily framed box in figure 1.
Conventional resources. Resources included in this category are crude oil, natural gas, and natural gas liquids that exist in reservoirs or in a fluid state amenable to extraction techniques employed in traditional development practices. They occur as discrete accumulations. They do not include oil occurring within extremely viscous and intractable heavy oil deposits, tar deposits, or oil shales, or gas from low-permeability "tight" sandstone and fractured shale reservoirs having in situ permeabilities to gas of less than 0.1 millidarcy, coal bed methane, gas in geopressured shales and brines, or gas hydrates.
AREAS OF STUDY
The primary organization of this study is by region (fig. 2); the nine regions described correspond to those in Mast and others (1989). Discussion of the region begins with a description of its geologic framework, modified from Mast and others (1989). Discussion of provinces in the region follows; the format for each province includes an introduction covering the geologic setting, exploration history, age of sediments, and a generalized stratigraphic chart. (No stratigraphic chart is provided for a province where no individual plays were assessed; a map of the province is substituted, because no specific stratigraphy is given in that province.) Following each province introduction is a systematic discussion of its individual plays. The play format includes the play name, narrative discussion and two illustrations, (1) a province map with the area of the play emphasized, and (2) a tabular form showing the original input data for the play appraisal.
Areas of State but not Federal waters are included in the assessment of adjacent onshore regions and provinces. The boundaries of State waters are 3 nautical miles offshore for the Pacific and Atlantic coasts and for the Alabama coast of the Gulf of Mexico. Louisiana and Mississippi have decreed State water boundaries that vary slightly from 3 nautical miles. For the Texas and Florida coasts of the Gulf of Mexico, the boundaries of State waters are 3 marine leagues (10.36 statute miles) offshore. In addition, all maritime boundaries and limits depicted on maps in the report are for initial planning purposes only, and do not prejudice or affect United States jurisdiction in any way.
Regions are basically geographic in character; however, their outlines are an attempt to group individual provinces along broad geologic lines. Provinces are constructed around natural geologic entities and may include a single dominant structural element, or a number of contiguous elements; they are named for structural or geographic features within their boundaries. These boundaries, following State and county lines, wherever possible, facilitate the use of production, reserves, and other reported data. A play is named after the most dominant feature or characteristic of a structural, stratigraphic, or geographic nature that best identifies it.

UNDISCOVEREDDEMONSTRATED
-INCREASING DEGREE OF GEOLOGIC ASSURANCE
Figure 1. Diagrammatic representation of petroleum resource classification (Mast and others, 1989) representing conventional oil and gas resources. Area with heavy frame on upper right represents undiscovered recoverable resources estimated in this study.

Maritime boundaries and Smfls depiaed on the maps are for initial planning purposes onty and do not prejudice or affect Unfted Stales juris diction in any way.
REGION
NO. NAME
1. Alaska2. Pacific Coast3. Colorado Plateau and Basin and Rang*4. Rocky Mountains and Northern Gr*ai Plains5. W«st Texas and Eastern New Mexico6. Guff Coast7. Mid-continent8. Eastern Interior9. Atlantic Coast
Figure 2. Map showing petroleum regions assessed in this study. Heavy lines are region boundaries, dotted lines are State boundaries.

Its name can also apply to a concept. Many plays described herein are recognized from their titles by the petroleum industry, but play titles are in no way formal geologic or stratigraphic names.
PLAY DISCUSSION FORMAT
Individual plays described and assessed in this report include only those that were estimated to have undiscovered accumulations greater than 1 MMBO (million barrels of oil) or 6 BCFG (billion cubic feet of gas). Plays judged to have undiscovered accumulations that fell below that threshold were assessed separately for the provinces as a whole, and are not described in the report. A play is defined as a group of geologically related known or undiscovered accumulations and(or) prospects having similar characteristics of hydrocarbon source, reservoir, trap, and geologic history.
In order to achieve some degree of consistency in narrative discussions of a great number and variety of plays, a topical outline based on the definition of an exploration play has been used. Each play discussion notes the play characteristics, followed by descriptions of (1) reservoirs, (2) source rocks and related geochemistry, (3) timing of generation and migration of hydrocarbons, (4) traps (types, sizes, seals, and drilling depths), (5) exploration status (history, discovered volumes, field sizes, and hydrocarbon types), and (6) qualitative future hydrocarbon potential and factors limiting that potential. Although the discussions adhere to the order of the topical outline, it will be apparent that some inconsistency occurs in the amount of detail and coverage of each topic from one play to another. This is due to the relative abundance or lack of data pertinent to each play and is unavoidable in a report of this scope. Play discussions here are, of necessity, brief summaries. More detailed play information can be found in the province open-file reports, which are listed in the references at the close of the region. Each play title is followed by a sequence number (for example, Tuscaloosa-Woodbine Play (060)), and these also appear on the table of resource estimates.
ASSESSMENT PROCEDURES AND METHODS
Assessments of undiscovered recoverable oil and gas in the individual plays in each province, and resources in small (< 1 MMBO or < 6 BCFG) accumulations were based upon review and analysis of the petroleum geology and exploration history of each province arid incorporated the most recent geologic and geophysical information available as of JanuaryT, 1987. In the National assessment, 220 plays covering the onshore and State offshore areas were identified, and for each individual play, undiscovered oil and gas resources were estimated. Plays judged to contain more than 1 MMBO or 6 BCFG were individually assessed; plays judged to contain less than those amounts were treated differently, as described following. See Mast and others (1989) and USGS/MMS (1988) for a detailed discussion of this assessment, its assumptions, methods, and results.
In the play analysis method, geologic settings of oil and gas occurrence are modeled. The play is treated as a collection of accumulations (pools, fields) of similar geologic risk sharing common geologic characteristics that include reservoir and source rocks and known or suspected trapping conditions. A team of geoscientists made judgments as to the probability of the occurrence of those geologic factors necessary for the formation of hydrocarbon accumulations, and quantitatively assessed each factor as a play attribute; the team then estimated the numbers and sizes of accumulations as probability distributions, conditional on favorable play attributes. All of this information was entered on the play data input form which is included in each play discussion in this report. A computer program then performed the resource calculations on the basis of the assessment information in the input form, employing an analytical method based on
probability theory. Final, undiscovered oil and gas estimates for each play, based on this method, are shown on the table of estimates.
Probabilistic estimates of recoverable oil and gas in accumulations smaller than the established size cut-off (1 MMBO, 6 BCFG) were made separately. These estimates of small accumulations were based primarily on log-geometric extrapolations of numbers of fields into field-size classes smaller than the cut-offs. Estimates of undiscovered resources for these small fields were made for the province as a whole, rather than for the individual plays. These are shown in the table of estimates as: Oil < 1 MMB and Gas < 6BCF. In addition, minor plays and very mature, or nearly depleted plays not assessed individually are included in the table of estimates as: Other Occurrences > 1 MMBO and Other Occurrences >6 BCFG. Ratios of associated-dissolved gas to oil, and NGL (natural gas liquids) to gas, were estimated from historical production data and used for calculation of these components.

REFERENCES CITED
Mast, R.F., Dolton, G.L., Crovelli, R.A., Root, D.H., Attanasi, E.D., U.S. Geological Survey; Martin, P.E., Cooke, L.W., Carpenter, G.B., Pecora, W.C., and Rose, M.B., Minerals Management Service; 1989, Estimates of undiscovered conventional oil and gas resources in the United States--A part of the Nation's energy endowment: U.S. Department of the Interior, 44 p.
NRG Associates, Inc., 1986, The significant oil and gas fields of the United States (through December 31, 1983): Available from Nehnng Associates, Inc., P.O. Box 1655, Colorado Springs, Colorado 80901.
Petroleum Information Corporation, 1986a, Petroleum Data System (through 1985): Available from Petroleum Information Corporation, 4100 East Dry Creek Road, Littleton, Colorado 80122.
____1986b, Well History Control System (through December 1985): Available fromPetroleum Information Corporation, 4100 East Dry Creek Road, Littleton, Colorado 80122.
USGS-MMS, 1988, Working papers National assessment of undiscovered conventional oil and gas resources: U.S. Geological Survey Open-File Report 88-373, Slip. Revised and reissued in microfiche only, July 1989.

GLOSSARY
Play. A. group of geologically related known or undiscovered accumulations and (or) prospects having similar characteristics of hydrocarbon source, reservoir, trap and geologic history.
Field. A single pool or multiple pools of hydrocarbons grouped on, or related to, a structural or stratigraphic feature.
Prospect. A geologic feature having the potential for trapping and accumulating hydrocarbons.
Crude oil.--A mixture of hydrocarbons present in underground reservoir rocks in a liquid state that remains in a liquid state as it is produced from wells.
Associated g&s.-Free natural gas, occurring as a gas cap, in contact with and above an oil accumulation within a reservoir.
Dissolved gas.--Natural gas dissolved in crude oil within a reservoir.
Nonassociated gas. (A/A) Natural gas that is neither associated with nor in contact with crude oil within a reservoir.
Natural gas liquids (7VGL).-Those portions of reservoir gas that are liquified at the surface in lease separators, field facilities, or gas processing plants. NGL is reported only in the tables of estimates in this report.
MMB<9.--Millions (10^) of barrels of oil (standard stock tank barrels of crude oil, 42 gallons per barrel).
BBO.-EMons (109) of barrels of oil.
£CFG.--Billions (109) of cubic feet of gas (standard cubic feet of gas at 14.73 pounds per in2 and 60°F). Hydrocarbon gases only.
rCFG.-Trillions (1012) of cubic feet of gas.
MMBOE. Millions of barrels of oil equivalent (conversion factor utilized is 6,000 ft3 of gas = 1 BOB).
8
REGION 6--GULF COAST
GEOLOGIC FRAMEWORK
By Richard B. Powers
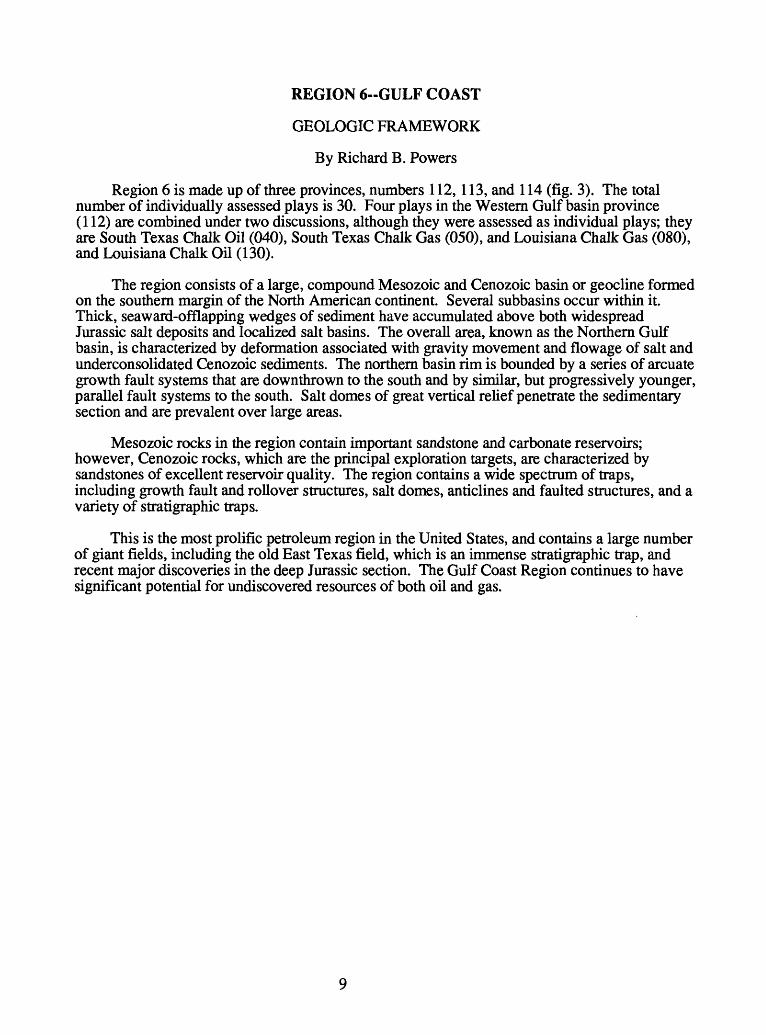
Region 6 is made up of three provinces, numbers 112,113, and 114 (fig. 3). The total number of individually assessed plays is 30. Four plays in the Western Gulf basin province (112) are combined under two discussions, although they were assessed as individual plays; they are South Texas Chalk Oil (040), South Texas Chalk Gas (050), and Louisiana Chalk Gas (080), and Louisiana Chalk Oil (130).
The region consists of a large, compound Mesozoic and Cenozoic basin or geocline formed on the southern margin of the North American continent. Several subbasins occur within it. Thick, seaward-offlapping wedges of sediment have accumulated above both widespread Jurassic salt deposits and localized salt basins. The overall area, known as the Northern Gulf basin, is characterized by deformation associated with gravity movement and flowage of salt and underconsolidated Cenozoic sediments. The northern basin rim is bounded by a series of arcuate growth fault systems that are downthrown to the south and by similar, but progressively younger, parallel fault systems to the south. Salt domes of great vertical relief penetrate the sedimentary section and are prevalent over large areas.
Mesozoic rocks in the region contain important sandstone and carbonate reservoirs; however, Cenozoic rocks, which are the principal exploration targets, are characterized by sandstones of excellent reservoir quality. The region contains a wide spectrum of traps, including growth fault and rollover structures, salt domes, anticlines and faulted structures, and a variety of stratigraphic traps.
This is the most prolific petroleum region in the United States, and contains a large number of giant fields, including the old East Texas field, which is an immense stratigraphic trap, and recent major discoveries in the deep Jurassic section. The Gulf Coast Region continues to have significant potential for undiscovered resources of both oil and gas.

Figure 3. Index map of lower 48 States, showing provinces assessed in Region 6 (shaded). Names of provinces are listed by number in the Table of Estimates.
10
WESTERN GULF BASIN PROVINCE (112)
By Richard Q. Foote, Linda M. Massingill, Robert H, Wells, Gordon L. Dolton, and Mahlon M.Ball
INTRODUCTION
The Western Gulf Basin province extends from the Rio Grande River to Chandeleur Sound off the eastern extremity of the Mississippi delta, and from the inner edge of the Gulf Coastal Plain to the seaward edge of the involved coastal States' territorial waters. It includes the southern portions of the States of Texas and Louisiana and encompasses more than 110,000 mi^. It is contained within the greater Gulf of Mexico depositional basin of Mesozoic and Cenozoic age and is bordered on the north by the Bend Arch-Fort Worth Basin (110), East Texas Basin (113) and the Louisiana-Mississippi Salt Basin (114) provinces. The north boundary consists of county lines that more or less conform to the position of the Balcones Fault Zone around the south and east margins of the Llano Uplift, and swings eastward approximately along the paleo- Cretaceous shelf margin. The southern boundary, along the seaward limit of State waters, exhibits an offset that marks the expansion of State waters from three miles off Louisiana to three leagues (10.36 statute mi) off Texas.
The province was a part of a relatively small ocean basin formed on the southern passive margin of the North American continent during early Mesozoic time. Evaporite, carbonate, and siliciclastic rocks were deposited on this margin, resulting in a well-defined carbonate shelf by Late Cretaceous time. Following construction of the Mesozoic shelf, a massive influx of terrigenous clastic sediments was deposited during the Cenozoic in mostly depocenters in the central and western parts of the Gulf of Mexico, basinward of the Mesozoic shelf edge (fig. 4). Thick, offlapping prisms of Cenozoic terrigenous sediments, locally exceeding 40,000 ft in thickness, built a southward-prograding continental shelf. Gravity movement of salt and underconsolidated sediment occurred in this sediment mass, and much of the area is characterized by salt ridges and domes, and complex systems of growth faults. The province has been heavily explored and more than 28 BBO and 260 TCFG have been discovered to the end of 1986.
Thirteen plays were individually assessed in the province and are discussed as follows: Southeast Texas-South Louisiana Salt (020), South Texas-Louisiana Reef (030), South Texas Chalk Oil (040), South Texas Chalk Gas (050), Tuscaloosa-Woodbine (060), Southern Maverick Basin (070), Wilcox (090), Northern Maverick Basin, (100) South Texas Upper Eocene (110), Frio-Anahuac-Miocene (120), Louisiana Chalk Gas (080), Louisiana Chalk Oil (130), and South Texas Oligocene-Miocene(150).
11

AGE
SYS TEM
QUAT
TERTIARY
CRETACEOUS
JURASSIC
V
SERIES
PLEISTOCENE
PLIOCENE
MIOCENE
OLIGOCENE
EOCENE
PALEOCENE
3
_o
GULFIAN
COMAN- CHIAN
COAHUIL- AN
upper
middle
lower
FORMATION OR GROUP
Central-East Southwest
Houston
Willis Formation Goliad Formation
Fleming Group
,,,... Anahuac Formation
\ Hackberrv ____ 1
Frio Formation
Vteksburg GroupJackson Group
c Yegua-Cockfield FormationS § Cook Mountain Formation
4> 6 Sparta Formation
o Cane River Formation
Midway Group
Navarro Group Escondido Formation
Olmos FormationTaylor Group San M|gue| Formatlon
Austin Chalk (Group)
j-^^ Eagle Ford Group
Woodbine Group ^^^^^^^^^
/////////////////////A
Buda FormationDel Rio Formation
Georgetown f ̂ \ Formation /StuartY - Edwarda / city \ Formation
a Glen Rose Formation3
e0 ....... , -. .. ,., . , , , ,
Pea rsa II Formation
tHosston \ Sligo Formation
Formation V
Cotton Valley Group
^ _ _. -Smaekover Grouo
, , , , i/oJP!)i^ ,,,,,,,, *j s s sLouanne Salt f̂ /s/S;
'////////j/^/^^^Eagle Mills ^^////^y/^
/////////////// ///y//s
Figure 4. province.
Generalized stratigraphic column, Western Gulf basin
12

SOUTHEAST TEXAS-SOUTH LOUISIANA SALT PLAY (020)
This play encompasses the occurrence of oil and gas in salt related structures and combination traps within a piercement dome dominated portion of Texas and Louisiana (fig. 5).
Principal reservoirs are sandstones of Eocene through Pliocene age, mostly in the early Eocene Wilcox Group, Eocene Yegua Formation, Oligocene Frio Formation and Miocene Fleming Group. Reservoirs largely represent a mixture of deltaic facies. Many fields produce from multiple zones, occasionally exceeding 10 in number, and individual pay thicknesses range from less than 10 ft to over 200 ft. Reservoir characteristics are often excellent, with porosities averaging over 30 percent. Calcite caprock reservoirs have been historically important and local reef limestone reservoirs sometimes occur in the Miocene section.
Source rocks are present in basinal facies of the Mesozoic section and in the slope and rise facies of the older Cenozoic sequence. Thermal histories are conducive to generating hydrocarbons for Mesozoic rocks, and the oil generation window for overlying Paleocene to Oligocene rocks ranges from about 8,700 to 13,000 ft. Generally, Miocene hydrocarbon production in Louisiana is from thermally immature progradational facies, which overlie older thermally mature slope and rise facies. Oil and gas generation in the lower Miocene of Texas appears to be limited to the thermally mature lower Miocene expansion zone, basinward of the Oligocene shelf margin. The upper Miocene section of Texas appears to lie above the oil- maturation level and all hydrocarbons, except biogenic gas, are probably derived either by upward migration from older formations or by lateral, updip migration from basinward time- equivalent marine units.
Traps associated with salt domes and salt ridges dominate the play. Traps include simple and complex anticlines over piercement and deep seated domes and ridges, complex fault structures on the flanks of piercement domes, caprocks, terminations of reservoir strata against diapir walls or overhangs, and stratigraphic traps formed by reservoir truncation, or by sandstones onlapping salt shoulders or shale masses. In addition, structures between closely spaced salt masses and anticlinal folds and growth faults in interdomal areas are important trapping features. Deep water turbidite sandstones in the Hackberry Facies, that have been transported downslope through submarine channels into basinal areas, also provide additional combination and stratigraphic traps. Drilling depths range from 1,000 to 23,000 ft.
This play has had a long history of exploration. Since the initial discoveries of the historic Spindletop and Saratoga fields in 1901,401 oil fields greater than 1 MMBO and 477 gas fields greater than 6 BCFG have been discovered, accounting for over 17.9 BBO and 130 TCFG. This has been the largest oil and gas play in the province. The largest oil field, Conroe, is greater than 735 MMBO in size and the largest gas field, Katy, is approximately 10 TCFG in size. Both fields are located in Texas (fig. 5).
Exploration is in a mature stage and future exploration will be primarily for smaller and more subtle, complex structural and combination traps. Predominantly gas is expected as exploration focuses on deeper parts of the play, including basinal or slope sandstone reservoir facies ponded in interdomal areas, or onlapping growth features. Future potential for both oil and gas is considered to be excellent.
13

o hh O Ci ft cn
rt cn I cn
O c: rt 02
PJ M ft 13
34°
30°
26°
94°
-90
°
AR
KA
NS
AS
V
MIS
SIS
SIP
PI
AL
AB
AM
A
TE
XA
S/
K
Eas
t Tex
as
i S
abin
e \ N
orth
Lou
isia
na
, ^
Sal
t B
asin
'
Arc
h \
Sal
t B
asin
j
/
K*
V ^
1 ii
r' $
L
OU
ISIA
NA
1%
M
issi
ssip
pi' ̂
S
alt
Bas
in
/

OIL AND GAS PLAY DATA
SOUTHEAST TEXAS-SOUTH LOUISIANA SALTPLAYPROVINCE WESTERN GULF BASIN CODE 06-112-020
Play attributes
Hydrocarbon source (S)Timing (T)Migration (M)Potential reservoir-rock facies (R)
Probability of attribute being favorable or present
1.001.001.001.00
Marginal play probability (MP) (SxTxMxR=MP)
1.00
Accumulation attribute, conditional on favorable play attributes
6 9 Minimum size assessed: oil, 1 x 10 BBL; gas, 6 x 10 CFG
Probability of occurrenceAt least one undiscovered accumulation
least minimum size assessedof at 1.00
Character of undiscovered accumulations, conditional on at least undiscovered accumulation present
Reservoir lithology Sandstone Carbonate rocks Other
Hydrocarbon typeOil Gas
one
Probability of occurrence X
0.30.7
Fractiles * (estimated amounts)Fractile percentages * -
Accumulation size6
Oil (x 10 BBL)9
Gas (x 10 CFG)3
Reservoir depth (x 1 0 ft)OilGas (non-associated)
Number of accumulations
100
16
12
150
95 75
1.1 1.8
6.7 10
260 390
50
3.2
19
812
450
Average ratio of associated-dissolved gas to oil (GOR)
Average ratio of NGL to non-associated gas
Average ratio of NGL to associated-dissolved gas
25
7
41
520
3000
35
0
5
30
170
640
0
140
810
1823
750
CFG/BBL6
BBL /106
BBL/10
CFG
CFG
* For example, fractile percentage 95 represents a 19 in 20 chance of the occurrence of at least the fractile tabulated.
15

SOUTH TEXAS-LOUISIANA REEF PLAY (030)
The play is characterized by the occurrence of non-associated gas in shelf margin reef reservoirs, including associated skeletal and oolitic grainstones in the Lower Cretaceous Sligo and Stuart City Formations at the old Cretaceous shelf edge. The play is restricted to a narrow, linear trend of reef and shoal development, extending the length of the shelf margin (Sligo and Stuart City trends) (fig. 6).
Reservoirs are skeletal packstones, wackestones and boundstones of coralgal-caprinid (rudistid) bioherms, and coral-caprinid grainstone and coated-grain packstone and packstones of an associated detrital facies. Matrix porosity and permeability is generally poor, but in some cases it is augmented by fracturing.
Probable source rocks are fine-grained downdip basinal facies, including pelagic lime mudstone and black, shaly lime mudstone, which are largely in a gas generation phase. Migrated hydrocarbons are now widely distributed in reservoirs along the shelf margin.
Traps are stratigraphic and combination, primarily involving closures along the crests of the reefs. Typical of traps along the reef trend, fields such as Stuart City have more hydrocarbon column than mappable structural closure. Drilling depths range from about 10,000 to 17,000 ft.
The first significant gas discovery in the play, the Dilworth field in Texas, was made in 1950. Exploration to date has yielded one significant oil field and 12 gas fields. The Black Lake field in Louisiana is approximately 50 MMBO in size and has a very substantial gas cap estimated to contain 675 BCFG and 69 MMB of condensate. The largest nonassociated gas field, North Word in Texas, is approximately 255 BCF in size (fig. 6). Total resources in discovered fields is approximately 1.4 BCFG and 50 MMBO. A significant problem in the continued development of the play is the generally low quality of reservoirs associated with reef trends. Future potential for gas is estimated as low to moderate.
16

O
Hi
PJ
en f
O C
H-
05
H-
PJ (D
Hi
13
M
PJ
AR
KA
NSA
S
|
IAN
A
Mis
siss
ippi
^ &
S
alt
Bas
in
26

OIL AND GAS PLAY DATA
PLAY SOUTH TEXAS-LOUISIANA REEF PROVINCE WESTERN GULF BASIN CODE 06-112-030
Play attributes
Hydrocarbon source (S)Timing (T)Migration (M)Potential reservoir-rock facies (R)
Probability of attribute being favorable or present
1.001.001.001.00
Marginal play probability (MP) (SxTxMxR = MP)
1.00
Accumulation attribute, conditional on favorable play attributes
6 9 Minimum size assessed: oil, 1 x 10 BBL; gas, 6 x 10 CFG
Probability of occurrenceAt least one undiscovered accumulation of at * QQ
least minimum size assessed
Character of undiscovered accumulations, conditional on at least one undiscovered accumulation present
Reservoir lithology Sandstone Carbonate rocks Other
Hydrocarbon typeOil Gas
Probability of occurrence
X
01
Fractiles * (estimated amounts)Fractile percentages * -
Accumulation size6
Oil (x 10 BBL)9
Gas (x 10 CFG)3
Reservoir depth (xlO ft)OilGas (non-associated)
Number of accumulations
100
0
6
09.5
1
95 75
0 0
1 10
1 2
50
0
15
013
3
Average ratio of associated-dissolved gas to oil (GOR)
Average ratio of NGL to non-associated gas
Average ratio of NGL to associated-dissolved gas
25
0
25
4
0
1
0
5
0
50
5
0
0
80
017
6
CFG/BBL6
BBL /106
BBL /10
CFG
CFG
* For example, fractile percentage 95 represents a 19 in 20 chance of the occurrence of at least the fractile tabulated.
18
SOUTH TEXAS CHALK OIL PLAY (040)
SOUTH TEXAS CHALK GAS PLAY (050)
This dual play is treated under one discussion because of a common play area, which for purposes of assessment, was separated into oil and gas components. It is defined by the occurrence of oil and gas in fractured chalk and limestone reservoirs of the Upper Cretaceous Austin Chalk Group and Lower Cretaceous Buda Formation which extend across South Texas as a regional linear trend 5 to 15 mi wide (fig. 7). Although assessed separately, the plays are treated as a single large occurrence which is limited geographically by the development of sufficient fracturing to allow for economic production.
Reservoirs are fractured chalk beds and largely foraminifer and cocolith-bearing micritic limestones of the Austin Chalk and Buda Formation. Geographic limits of the play are defined essentially by the area of optimal fracturing, which occurs in a regional linear trend, 5-15 mi wide. The foci of the fractures are at the older Mesozoic hinge lines of the basin, resulting in the development of fracture trends along overlapped paleo-shelf edges. Thickness of the Austin reservoir ranges up to 800 ft, while the Buda is substantially thinner, generally between 70 to 100 ft.
Source rocks have been identified as shelf or ramp facies, organic-rich dark chalks and shales that lie within the Austin Chalk and calcareous, organic-rich mudstone of the underlying Eagle Ford Shale. Most of the hydrocarbons are believed to be derived from local source rocks.
Oil and gas are stratigraphically trapped within a very fine grained reservoir rock by variations in internal porosity and permeability. The presence of structure appears to be incidental to hydrocarbon accumulation, other than controlling the distribution of fracturing that is essential for economic exploitation. Two of the largest fields are located along homoclines. Drilling depths range from about 5,000 to 17,000 ft
Exploration in the play has been ongoing for several years; the initial discovery of the Pearsall field (fig. 7) was made in 1935, but continued development has been very sensitive to fluctuation in oil and gas prices. The advent of horizontal drilling has stimulated much activity in the play and prospects appear attractive for continued growth. Approximately 300 MMBO and 1.1 TCFG has been discovered in the play to the end of 1986. The Giddings field within the Austin-Buda trend is the single largest producing area in the play and is approximately 170 MMBO and 796 BCFG in size. The future potential for undiscovered oil and gas is good.
19

34°
98°
94°
90°
to
o
O
Hi
CO
O en O O
H-
CO
O ft o h-1 * Q
en
30°
26°
AR
KA
NSA
S
U- ,
......
-T "
A
V A
rch*,
TE
XA
S/
§
Eas
t Tex
as
i S
abin
e \ N
orth
Lou
isia
na
^f
Sal
t Bas
in
' A
rch
\ S
alt
Bas
in
j >
,\
\
y '
°
MIS
SIS
SIP
PI
I A
LA
BA
MA

OIL AND GAS PLAY DATA
PLAY SOUTH TEXAS CHALK OIL PROVINCE WESTERN GULF BASIN CODE 06-112-040
Play attributes
Hydrocarbon source (S)Timing (T)Migration (M)Potential reservoir-rock facies (R)
Probability of attribute being favorable or present
1.001.001.001.00
Marginal play probability (MP) (SxTxMxR = MP)
1.00
Accumulation attribute, conditional on favorable play attributes
6 9 Minimum size assessed: oil, 1 x 10 BBL; gas, 6 x 10 CFG
Probability of occurrenceAt least one undiscovered accumulation of at I QQ
least minimum size assessed
Character of undiscovered accumulations, conditional on at least one undiscovered accumulation present
Reservoir lithology Sandstone Carbonate rocks Other
Hydrocarbon type
Probability of occurrence
X
OilGas
10
Fractiles * (estimated amounts)Fractile percentages * -
Accumulation size6
Oil (x 10 BBL)9
Gas (x 10 CFG)3
Reservoir depth (xlO ft)OilGas (non-associated)
Number of accumulations
100
300
0
50
1
Average ratio of associated-dissolved gas to
95 75
350 475
0 0
1 1
oil (GOR)
50
600
0
80
1
Average ratio of NGL to non-associated gas
Average ratio of NGL to associated-dissolved gas
25
800
0
1
3200
0
0
5
1200
0
1
0
1300
0
120
1
CFG/BBL6
BBL/106
BBL/10
CFG
CFG
* For example, fractile percentage 95 represents a 19 in 20 chance of the occurrence of at least the fractile tabulated.
21

OIL AND GAS PLAY DATA
PLAY SOUTH TEXAS CHALK GAS PROVINCE WESTERN GULF BASIN CODE 06-112-050
Play attributes
Hydrocarbon source (S)Timing (T)Migration (M)Potential reservoir-rock facies (R)
Probability of attribute being favorable or present
1.001.001.001.00
Marginal play probability (MP) (SxTxMxR = MP)
1.00
Accumulation attribute, conditional on favorable play attributes
6 9 Minimum size assessed: oil, 1 x 10 BBL; gas, 6 x 10 CFG
Probability of occurrenceAt least one undiscovered accumulation of at I QQ
least minimum size assessed
Character of undiscovered accumulations, conditional on at least undiscovered accumulation present
Reservoir lithology Sandstone Carbonate rocks Other
Hydrocarbon typeOil Gas
one
Probability of occurrence
X
01
Fractiles * (estimated amounts)Fractile percentages *
Accumulation size6
Oil (x 10 BBL)9
Gas (x 10 CFG)3
Reservoir depth (xlO ft)OilGas (non-associated)
Number of accumulations
100
0
200
05
1
95 75
0 0
250 325
1 1
50
0
400
09
1
Average ratio of associated-dissolved gas to oil (GOR)
Average ratio of NGL to non-associated gas
Average ratio of NGL to associated-dissolved gas
25
0
500
1
0
100
0
5
0
650
1
0
0
800
017
1
CFG/BBL6
BBL/106
BBL/10
CFG
CFG
* For example, fractile percentage 95 represents a 19 in 20 chance of the occurrence of at least the fractile tabulated.
22

TUSCALOOSA-WOODBINE PLAY (060)
This play is defined by the occurrence of oil and gas in sandstones of the Upper Cretaceous Tuscaloosa Formation and Woodbine Group in closed anticlines on the downthrown sides of growth faults basinward of the Cretaceous shelf margin. It also involves oil and gas in stratigraphic and combination traps resulting from sandstone pinchouts associated with these structures, and down-slope. It extends across south-central Louisiana and into southeastern Texas (fig. 8).
Reservoirs in the Woodbine are varied, ranging from deltaic to marine bar sandstone to downslope submarine turbidite fan complexes. Pay thicknesses range from 7 to 185 ft, but more typically are on the order of 20 to 80 ft. Reservoir porosities range from 9 to 29 percent, but usually are from 12 to 25 percent. The occurrence of relatively high porosities in the more deeply buried sandstone beds has been attributed to secondary porosity development caused by selective grain dissolution and leaching of early iron-rich calcite cement.
Cretaceous source rocks are generally fine-grained, organic-rich, marine to basinal facies rocks associated directly with the reservoirs. Locally, migration from other, deeper or downdip, sources may also have taken place. The play is primarily gas prone towards the southeast where drilling depths exceed 17,000 ft; gas fields in this deeper area contain considerable condensate.
Traps are growth faults and anticlines, combined with facies changes within the reservoir sequence, and porosity pinchouts in lenticular submarine fan and continental margin sandstones that are isolated within thick mudstones. Drilling depths range from 1,000 ft to more than 22,000 ft.
Exploration in the play began in the early 1970's. To the end of 1986, 3 oil fields and 15 gas fields greater than 1 MMBO or 6 BCFG had been discovered, accounting for approximately 100 MMBO and 2.2 TCFG, plus a large amount of condensate. The largest fields are Damascus, which is 84 MMBO, and Port Hudson, which is 390 BCFG in size, respectively (fig. 8). Some estimates indicate that as much as 4 TCFG has been discovered in the play. Future gas resources in the play are substantial.
23

fD
CO 3 6 O
Hi
0 e H-
34°
94°
90"
30°
26°
,,
^^
AR
KA
NS
AS
/^T
alc
^T
ultZ
onT
[_
^M
ow
ot
)
/<
A
V
Arc
h//
IM
ISSI
SSIP
PI
I A
LA
BA
MA
i
TE
XA
S
y
\
( Ll
ano
Upl
ift
, <j
/ i/t
&
East
Tex
as
' ('§
S
alt
Bas
in
' A
rch
^ S
alt
/ /
<?
V
> _ /
LO
UIS
IAN
A'
/. .
9
I v
\^^
LS
abiri
e \ N
ort
h L
ou
isia
na
7
Are
h
\ S
alt
Bas
in
)£
Mis
siss
ippi
Sal
t B
asin
ME
XIC
O

OIL AND GAS PLAY DATA
PLAY TUSCALOOSA-WOODBINE PROVINCE WESTERN GULF BASIN CODE 06-112-060
Play attributes
Hydrocarbon source (S)Timing (T)Migration (M)Potential reservoir-rock facies (R)
Probability of attribute being favorable or present
1.001.001.001.00
Marginal play probability (MP) (SxTxMxR = MP)
1.00
Accumulation attribute, conditional on favorable play attributes
6 9 Minimum size assessed: oil, 1 x 10 BBL; gas, 6 x 10 CFG
Probability of occurrenceAt least one undiscovered accumulation of at I QQ
least minimum size assessed
Character of undiscovered accumulations, conditional on at least one undiscovered accumulation present
Reservoir lithology Sandstone Carbonate rocks Other
Hydrocarbon typeOilGas
Probability of occurrence X
0.250.75
Fractiles * (estimated amounts)Fractile percentages *
Accumulation size6
Oil (x 10 BBL)9
Gas (x 10 CFG)3
Reservoir depth (xlO ft)OilGas (non-associated)
Number of accumulations
100
1
6
1.215
10
95 75
2 8
13 47
12 16
50
18
105
12.519
20
Average ratio of associated-dissolved gas to oil (GOR)
Average ratio of NGL to non-associated gas
Average ratio of NGL to associated-dissolved gas
25
35
201
24
1000
40
0
5
65
380
30
0
85
500
1522.5
35
CFG/BBL6
BBL/106
BBL/10
CFG
CFG
* For example, fractile percentage 95 represents a 19 in 20 chance of the occurrence of at least the fractile tabulated.
25

SOUTHERN MAVERICK BASIN (070)
The play involves exclusively nonassociated gas in combination and stratigraphic traps on the old Cretaceous shelf in the southern part of the Rio Grande Embayment and contains primarily shelf sandstones of Upper Cretaceous age as reservoirs. The play area includes the southern extremity of the Maverick basin of South Texas (fig. 9).
Reservoirs are diverse, and include deltaic, coastal barrier, delta front and prodelta sandstones of the Upper Cretaceous Navarro and Taylor Groups. Principal reservoirs are in the San Miguel and Olmos Formations. Individual field reservoirs are often complex, containing numerous heterogeneities. Reservoir sandstones have typically average porosities of 15 to 27 percent and pay thicknesses range from 20 to 107 ft. Source rocks are probably within the basinal shale facies of the Cretaceous and are in the gas generative window.
Traps are mainly stratigraphic and combination, involving faults and faulted anticlines, facies changes in sandstone, reservoir truncations by unconformities, and diagenetic traps. Drilling depths range from 4,000 to 12,000 ft.
This play developed largely in the 1960's and 70's. To date, 12 gas fields larger than 6 BCFG in size have been discovered, accounting for more than 400 BCFG and a small amount of NGL. The largest field is Southwest Catarina, which is 114 BCFG in size (fig. 9). The future gas potential is estimated to be modest.
26

s 8 O
i-h O d rt
& (D
h{
3 dd H-
3 O
H
30°
26°
94°
90°
_
^~
'~~
} A
RK
AN
SA
S
Tal
co F
ault
Zon
e j_
_ _
__
_ _
_
r "\
\
7s OCM
ISSI
SSIP
PI7
AL
AB
AM
A
TE
XA
S/
%x >x °*
/I
L.
/ i/tf
Eas
t T
exas
i
Sab
ine
\ N
ort
h L
ouis
iana
j
' I' y
S
alt
Bas
in
' A
rch
^ S
alt
Bas
in
jo\
-^^-^j
//"'D
V
/
LO
UIS
IAN
A
/^
Mis
siss
ippi
^^O
n^
""r
- ^ ̂
S
alt
Bas
in
( e
A
.^£___.
I ^_
^^
nX
*~
+ *
' \*
^
~"
'""
*
'
:?$&
^^^
-
& *
' i
^^^^
\
^~^<
~^
ME
XIC
O
FLA
.
o^^^
^^K
^^-i
*>.
*;^
^vy^^-^
cr-
<S
?5^-x
^-5
#iJ

OIL AND GAS PLAY DATA
PLAY SOUTHERN MAVERICK BASIN PROVINCE WESTERN GULF BASIN CODE 06-112-070
Play attributes
Hydrocarbon source (S)Timing (T)Migration (M)Potential reservoir-rock facies (R)
Probability of attribute being favorable or present
1.001.001.001.00
Marginal play probability (MP) (SxTxMxR = MP)
1.00
Accumulation attribute, conditional on favorable play attributes
6 9 Minimum size assessed: oil, 1 x 10 BBL; gas, 6 x 10 CFG
Probability of occurrenceAt least one undiscovered accumulation of at I QQ
least minimum size assessed
Character of undiscovered accumulations, conditional on at least one undiscovered accumulation present
Reservoir lithology Sandstone Carbonate rocks Other
Hydrocarbon type
Probability of occurrence X
Oil Gas
0 1
Fractiles * (estimated amounts)Fractile percentages *
Accumulation size6
Oil (x 10 BBL)9
Gas (x 10 CFG)3
Reservoir depth (xlO ft)OilGas (non-associated)
Number of accumulations
100
0
6
04
3
Average ratio of associated-dissolved gas to
95 75
0 0
6.7 10.3
4 6
oil (GOR)
50
0
16
07
7
Average ratio of NGL to non-associated gas
Average ratio of NGL to associated-dissolved gas
25
0
28
8
0
25
0
5
0
57
10
0
0
103
012
12
CFG/BBL6
BBL/106
BBL/10
CFG
CFG
* For example, fractile percentage 95 represents a 19 in 20 chance of the occurrence of at least the fractile tabulated.
28

WILCOX PLAY (090)
This play is defined by the occurrence of gas and oil in sandstone reservoirs of the Paleocene-Eocene Wilcox Group in structural and combination traps of the coastal plain of Texas and Louisiana (fig. 10). The play involves mainly anticlinal and fault structures related to systems of growth faults shelfward of the regional Vicksburg Fault Zone.
Reservoirs are alluvial, deltaic and strandplain sandstones of late Paleocene and early Eocene age which show considerable stratigraphic variation, but are of generally good reservoir quality. Many fields have multiple pay zones and many reservoirs have porosities of 20 to 30 percent.
Probable source rocks are marine shales of Paleocene and Eocene age. The oil generation window for these rocks ranges from about 8,700 to 13,000 ft, with thermal gradients highest to the south. Drilling depths range from 1,000 ft to approximately 22,000 ft
Traps are generally anticlines or fault closures on noses and folds, combined with sandstone facies changes and pinchouts. Most are related to the subordinate systems of growth faults and flexures north of the major Vicksburg flexure. Greater drilling depths south of this flexure essentially limit the play on the south.
Since the first significant discovery in the play in 1926, exploration has remained active. To date, 69 oil fields and 257 gas fields greater than 1 MMBO or 6 BCFG in size have been discovered, accounting for more than 5(X) MMBO and approximately 19.3 TCFG. The largest oil field is Ville Platte in Louisiana (fig. 10), which is 62.4 MMBO in size, and the largest gas field is Sheridan in Texas, which is 1.7 TCFG in size. Exploration in the play is now focused in deeper areas, where gas is the primary commodity. The future gas potential is good to excellent.
29

34°
94°
90°
co
O
O
H,
S!
H-
M
O
O
IX
30°
26°
^ A
RK
AN
SAS
-"
" ^^~
'
~ *-
"*
I
Tal
co F
ault
Zon
e |
~
MIS
SISS
IPPI
AL
AB
AM
A
.V
Arc
h'/
TE
XA
S/
I/J*
Eas
t Te
xas
i S
abin
e \ N
orth
Lou
isia
na'
/'*
S
alt
Bas
in
Arc
h ^
Sal
t B
asin
/
'/<
/ ^ ^ _
_\
s
LOU
ISIA
NA
((/
'
Mis
siss
ippi
S
alt
Bas
in\
MEX
ICO

OIL AND GAS PLAY DATA
PLAY WILCOXPROVINCE WESTERN GULF BASIN CODE 06-112-090
Play attributes
Hydrocarbon source (S)Timing (T)Migration (M)Potential reservoir-rock facies (R)
Probability of attribute being favorable or present
1.001.001.001.00
Marginal play probability (MP) (SxTxMxR = MP)
1.00
Accumulation attribute, conditional on favorable play attributes
6 9 Minimum size assessed: oil, 1 x 10 BBL; gas, 6 x 10 CFG
Probability of occurrenceAt least one undiscovered accumulation of at
least minimum size assessed 1.00
Character of undiscovered accumulations, conditional on at least undiscovered accumulation present
one
Reservoir lithology Probability of occurrence Sandstone X Carbonate rocks Other
Hydrocarbon type Oil 0.1 Gas 0.9
Fractiles * (estimated amounts)Fractile percentages * 100 95 75
Accumulation size6
OH (x 10 BBL) 1 1.03 1.29
Gas (x 10 CFG) 6 6.5 93
Reservoir depth (xlO ft)Oil 1Gas (non-associated) 6
Number of accumulations 100 150 165
Average ratio of associated-dissolved gas to oil (GOR)
Average ratio of NGL to non-associated gas
Average ratio of NGL to associated-dissolved gas
50
1.5
15
7.511
175
25
2.2
31
200
4000
10
0
5
5.2
120
300
0
14
700
1522
350
CFG/BBL6
BBL /106
BBL /10
CFG
CFG
* For example, fractile percentage 95 represents a 19 in 20 chance of the occurrence of at least the fractile tabulated.
31

NORTHERN MAVERICK BASIN PLAY (100)
The play is characterized by the occurrence of oil and gas in sandstone reservoirs of Upper Cretaceous age in structural and stratigraphic traps in the northern part of the Maverick basin of South Texas (fig. 11).
Reservoirs are Navarro and Taylor Group sandstones of Upper Cretaceous age, primarily sandstones in the San Miguel and Olmos Formations. Reservoirs are diverse, ranging from deltaic, coastal barrier, delta front and prodelta sandstones, such as those in the Big Wells field, to middle neritic turbidite channels and fan deposits which are the primary reservoirs at the A.W.P. field. Reservoirs are interpreted to be complex and contain numerous heterogeneities. Consequently, although reservoir porosities tend to be high, ranging between 19 and 28 percent in several fields, oil recovery efficiencies tend to be low.
Traps are structural, stratigraphic and combination, involving faults and faulted anticlines, facies changes in sandstones and reservoir truncations by unconformities. Drilling depths range from 1,000 to more than 17,000 ft.
The first significant discovery in the play was in 1911. Approximately 32 oil fields and 10 gas fields have since been discovered and account for approximately 315 MMBO and 640 BCFG, respectively. The largest fields are Big Wells (including Northeast), which is 78 MMBO in size, and Winn-Dulce, which is 60 BCFG in size (fig. 11). It is anticipated that an increase in the gas component will be realized in future expansion of the play. The undiscovered resource potential of the play is low to moderate.
32

Figure 11. Map of Northern Maverick Basin play
33

OIL AND GAS PLAY DATA
PLAY NORTHERN MAVERICK BASIN PROVINCE WESTERN GULF BASIN CODE 06-112-100
Play attributes
Hydrocarbon source (S)Timing (T)Migration (M)Potential reservoir-rock facies (R)
Probability of attribute being favorable or present
1.001.001.001.00
Marginal play probability (MP) (SxTxMxR = MP)
1.00
Accumulation attribute, conditional on favorable play attributes
6 9 Minimum size assessed: oil, 1 x 10 BBL; gas, 6 x 10 CFG
Probability of occurrenceAt least one undiscovered accumulation of at
least minimum size assessed 1.00
Character of undiscovered accumulations, conditional on at least one undiscovered accumulation present
Reservoir lithology Sandstone Carbonate rocks Other
Hydrocarbon typeOilGas
Probability of occurrence X
0.4 0.6
Fractiles * (estimated amounts)Fractile percentages * -
Accumulation size6
Oil (x 10 BBL)9
Gas (x 10 CFG)3
Reservoir depth (xlO ft)OilGas (non-associated)
Number of accumulations
100
16
1.25
10
Average ratio of associated-dissolved gas to
95 75
1.03 1.2
6.2 7.4
11 13
oil (GOR)
50
1.6
10
79
15
Average ratio of NGL to non-associated gas
Average ratio of NGL to associated-dissolved gas
25
3
18
18
1600
1
0
5
11
73
22
0
64
420
1117
25
CFG/BBL6
BBL/106
BBL/10
CFG
CFG
* For example, fractile percentage 95 represents a 19 in 20 chance of the occurrence of at least the fractile tabulated.
34

SOUTH TEXAS UPPER EOCENE PLAY (110)
This play encompasses the occurrence of oil and gas in sandstone reservoirs of middle to late Eocene age in structural and combination traps associated with the Wilcox Fault Zone (fig. 12).
Reservoirs are primarily Eocene Jackson and Claiborne Group sandstones and equivalents, the most important of which are sandstones of the Yegua-Cockfield Formation. Deltaic and barrier bar/strandplain facies predominate as reservoir rocks. Considerable stratigraphic variability exists in these reservoirs, but average porosities are generally good and range typically from 25 to 35 percent. Fields often have multiple pay zones.
Probable source rocks are marine shales of Paleocene and Eocene age. The oil generation window for these rocks ranges from about 8,700 to 13,000 ft, with thermal gradients becoming progressively higher to the south where the play becomes more gas prone.
Traps are generally anticlines or fault closures on noses, combined with sandstone facies changes and pinchouts, and occasionally associated with salt domes. Most of these features are growth structures related to the Wilcox Fault Zone and to subordinate systems of growth faults and flexures north of the major Vicksburg flexure. Much greater drilling depths south of this zone limit the play on the south. Drilling depths range from 1,000 ft to about 16,000 ft.
The first significant discovery in the play was in 1908. More than 109 oil fields and 36 gas fields larger than 1 MMBO and 6 BCFG in size have since been discovered, and account for approximately 820 MMBO and 2.9 TCFG. The largest oil field discovered is Government Wells which is 108 MMBO in size, and the largest gas field is Sejita, which is 450 BCFG in size (fig. 12). The future potential for both oil and gas is low to moderate.
35

(D M
KJ O
l-h cn
O H
O
O
(D
34°
30°
26°
94°
90°
~T
^__
_-_
____
.
AR
KA
NSA
S s |
MIS
SISS
IPPI
'tal
c^u
ltZ
on
T
| ^^M
onro
e^)
-^
-T ^
l
Arc
h'^
.N
.
ALA
BA
MA
TE
XA
S
VI
^ \
&
Eas
t T
exas
i
Sab
ine
\ N
ort
h L
ouis
iana
Sal
t B
asin
ME
XIC
O

OIL AND GAS PLAY DATA
PLAY SOUTH TEXAS UPPER EOCENE PROVINCE WESTERN GULF BASIN CODE 06-112-110
Play attributes
Hydrocarbon source (S)Timing (T)Migration (M)Potential reservoir-rock facies (R)
Probability of attribute being favorable or present
1.001.001.001.00
Marginal play probability (MP) (SxTxMxR = MP)
1.00
Accumulation attribute, conditional on favorable play attributes
6 9 Minimum size assessed: oil, 1 x 10 BBL; gas, 6 x 10 CFG
Probability of occurrenceAt least one undiscovered accumulation of at
least minimum size assessed 1.00
Character of undiscovered accumulations, conditional on at least undiscovered accumulation present
Reservoir lithology Sandstone Carbonate rocks Other
Hydrocarbon typeOil Gas
one
Probability of occurrence X
0.3 0.7
Fractiles * (estimated amounts)Fractile percentages * -
Accumulation size6
Oil (x 10 BBL)9
Gas (x 10 CFG)3
Reservoir depth (xlO ft)OilGas (non-associated)
Number of accumulations
100
16
12
14
Average ratio of associated-dissolved gas to
95 75
1 1.2
6.3 8
20 26
oil (GOR)
50
1.7
11
810
31
Average ratio of NGL to non-associated gas
Average ratio of NGL to associated-dissolved gas
25
2.8
18
36
2000
16
0
5
9
40
42
0
40
85
1416
50
CFG/BBL6
BBL/106
BBL/10
CFG
CFG
* For example, fractile percentage 95 represents a 19 in 20 chance of the occurrence of at least the fractile tabulated.
37

FRIO-ANAHUAC-MIOCENE PLAY (120)
The play involves the occurrence of oil and gas in stratigraphic, combination and structural traps in the growth fault systems of the southwestern Gulf Coast, mainly sandstones principally of Oligocene age, with associated reservoirs in the lower Miocene (fig. 13). The play is bounded on the northwest by the Wilcox fault zone, and most existing production is associated with the Vicksburg and Frio Fault Zones.
Reservoirs are primarily fluvial, deltaic, shoreline and neritic sandstones of the Oligocene Frio Formation and Vicksburg Group but also included are sandstones in the Anahuac Formation and in the lower Miocene. Multiple pays are common and individual reservoirs are typically 10 to 50 ft thick. Reservoir porosities average about 30 percent. Slope facies of these sandstones may also be found in downdip positions but are expected to be of poorer reservoir quality.
Source rocks are probably either associated or subjacent Frio/Anahuac slope, shelf and prodelta mudstones and, locally, lower Miocene shelf mudstones, which appear to be gas-prone. Vertical migration into shallower producing zones appears to have taken place.
Traps are typically anticlines and faulted anticlines within the flexure and growth fault systems, primarily of the Frio and Vicksburg Fault Zones. Many combination traps are known, which are the result of sandstone pinchouts on structures within the fault trends. Potential traps are also believed to exist in downdip basinal and slope reservoir facies onlapping fine-grained slope rocks. Drilling depths range from less than 1,000 ft to more than 22,000 ft.
Exploration in the play began about 1908. To date, 211 oil fields and 378 gas fields larger than 1 MMBO and 6 BCFG in size have been discovered and account for approximately 5 BBO and more than 75 TCFG, making this, historically, the second largest play in the Western Gulf province. The largest oil and gas fields discovered are Greta-Tom O'Connor, which is 915 MMBO in size and Agua Dulce-Stratton, which is 6.6 TCFG (in addition to about 150 MMBO) in size (fig. 13). The future potential for gas is very good.
38

s -8 O Hi o S H-
O
O
(D
34°
94°
30°
26°
TE
XA
S/ '/
,
v- ^
^
I /£
_
- ^_^
*^H
A
RK
AN
SA
S
^ £
Tal
co F
ault
Zon
e _
_ _
__ _
__
.
^
^C ~
\ \
Arc
h'/
/
.?
/
I ^
\ -
"""<
A
//^
Eas
t Tex
as
i S
abin
e \ N
ort
h L
ou
isia
na
^
''§
Sal
t B
asin
'
Arc
h
^ S
alt
Bas
in
^
^.
\ /
LO
UIS
IAN
A
90°
MIS
SIS
SIP
PI
I A
LA
BA
MA
v/T
^x
%;>
, *ȣ
**
ME
XIC
O

OIL AND GAS PLAY DATA
PLAY FRIO-ANAHUAC-MIOCENE PROVINCE WESTERN GULF BASIN CODE 06-112-120
Play attributes
Hydrocarbon source (S)Timing (T)Migration (M)Potential reservoir-rock facies (R)
Probability of attribute being favorable or present
1.001.001.001.00
Marginal play probability (MP) (SxTxMxR = MP)
1.00
Accumulation attribute, conditional on favorable play attributes
6 9 Minimum size assessed: oil, 1 x 10 BBL; gas, 6 x 10 CFG
Probability of occurrence At least one undiscovered accumulation of at
least minimum size assessed 1.00
Character of undiscovered accumulations, conditional on at least one undiscovered accumulation present
Reservoir lithology Sandstone Carbonate rocks Other
Hydrocarbon type
Probability of occurrence X
Oil Gas
0 1
Fractiles * (estimated amounts)Fractile percentages * -
Accumulation size6
Oil (x 10 BBL)9
Gas (x 10 CFG)3
Reservoir depth (x 10 ft)OilGas (non-associated)
Number of accumulations
100
0
6
01
20
95 75
0 0
7.5 15
23 27
50
0
27
012
30
Average ratio of associated-dissolved gas to oil (GOR)
Average ratio of NGL to non-associated gas
Average ratio of NGL to associated-dissolved gas
25
0
50
36
0
6
0
5
0
110
44
0
0
203
023
50
CFG/BBL6
BBL /106
BBL /10
CFG
CFG
* For example, fractile percentage 95 represents a 19 in 20 chance of the occurrence of at least the fractile tabulated.
40
LOUISIANA CHALK GAS PLAY (080)
LOUISIANA CHALK OIL PLAY (130)
This dual play was separated into oil and gas components for assessment purposes, but is treated under one discussion because of a common play area; it is based on the occurrence of oil and associated gas in fractured chalk reservoirs of the Upper Cretaceous Austin Chalk and Lower Cretaceous Buda Formation. It extends in a linear pattern across south-central Louisiana (fig. 14). The plays are similar in areal size, trend, depths and reservoir lithology as the South Texas Chalk plays (040 and 050), but were assessed separately in Louisiana.
Reservoirs are fractured chalk and limestone. Areal limits of the play are essentially defined by the area of optimal fracturing, which occurs in a linear trend, 5-15 mi wide. The foci of the fractures are at the older Mesozoic hinge lines of the basin, resulting in the development of fracture trends along overlapped paleo shelf edges. The plays are treated as a single large occurrence, which is limited geographically by the development of fracturing sufficient to allow economic production. Drilling depths range from about 7,000 to 12,000 ft. Gross thickness of reservoir rocks in the Austin Chalk is about 800 ft, and between 70 and 100 ft in the Buda Formation. Source rocks are associated, or downdip organic-rich facies of the Austin and underlying Eagle Ford Shale.
Traps are stratigraphic and formed within fine grained carbonate reservoir rocks by variations in internal porosity and permeability. Structure is not pertinent to oil and gas accumulation, however, it controls fracture distribution essential to exploitation.
Exploration in the play has been largely incidental to exploration for other deeper targets. Following the discovery of the Pearsall field in Texas in 1935 (fig. 14), the economic potential of these reservoirs was investigated and, in 1984, Austin Chalk production was established in West Feliciana Parish, Louisiana As in Texas, the amount of exploration activity is affected in large degree by fluctuating oil and gas prices. The advent of horizontal drilling has stimulated much activity in the Texas Chalk plays and it is probable that this activity will extend into this Louisiana play area. Future potential for both oil and gas is moderate.
41

Figure 14. Map of Louisiana Chalk Oil and Louisiana Chalk Gas plays
42

OIL AND GAS PLAY DATA
PLAY LOUISIANA CHALK GAS PROVINCE WESTERN GULF BASIN CODE 06-112-080
Play attributes
Hydrocarbon source (S)Timing (T)Migration (M)Potential reservoir-rock facies (R)
Probability of attribute being favorable or present
1.001.001.000.70
Marginal play probability (MP) (SxTxMxR = MP)
0.70
Accumulation attribute, conditional on favorable play attributes
6 9 Minimum size assessed: oil, 1 x 10 BBL; gas, 6 x 10 CFG
Probability of occurrenceAt least one undiscovered accumulation of at ^ QQ
least minimum size assessed
Character of undiscovered accumulations, conditional on at least one undiscovered accumulation present
Reservoir lithology Sandstone Carbonate rocks Other
Hydrocarbon typeOil Gas
Probability of occurrence
X
01
Fractiles * (estimated amounts)Fractile percentages * -
Accumulation size6
Oil (x 10 BBL)9
Gas (x 10 CFG)3
Reservoir depth (xlO ft)OilGas (non-associated)
Number of accumulations
100
0
120
07
1
Average ratio of associated-dissolved gas to
95 75
0 0
200 300
1 1
oil (GOR)
50
0
400
09
1
Average ratio of NGL to non-associated gas
Average ratio of NGL to associated-dissolved gas
25
0
550
1
0
100
0
5
0
750
1
0
0
1000
012
1
CFG/BBL6
BBL/106
BBL/10
CFG
CFG
* For example, fractile percentage 95 represents a 19 in 20 chance of the occurrence of at least the fractile tabulated.
43

OIL AND GAS PLAY DATA
PLAY LOUISIANA CHALK OIL PROVINCE WESTERN GULF BASIN CODE 06-112-130
Play attributes
Hydrocarbon source (S)Timing (T)Migration (M)Potential reservoir-rock facies (R)
Probability of attribute being favorable or present
1.001.001.000.70
Marginal play probability (MP) (SxTxMxR = MP)
0.70
Accumulation attribute, conditional on favorable play attributes
6 9 Minimum size assessed: oil, 1 x 10 BBL; gas, 6 x 10 CFG
Probability of occurrenceAt least one undiscovered accumulation of at * QQ
least minimum size assessed
Character of undiscovered accumulations, conditional on at least one undiscovered accumulation present
Reservoir lithology Sandstone Carbonate rocks Other
Hydrocarbon typeOil Gas
Fractile percentages * 100 Accumulation size
6Oil (x 10 BBL)
9 Gas (x 10 CFG)
3Reservoir depth (xlO ft)
OilGas (non-associated)
Number of accumulations
Probability of occurrence
X
10
Fractiles * (estimated amounts)- 100
60
0
95
100
0
75
150
0
50
200
0
25
275
0
5
400
0
0
500
0
100
Average ratio of associated-dissolved gas to oil (GOR)
Average ratio of NGL to non-associated gas
Average ratio of NGL to associated-dissolved gas
3200
0
0
CFG/BBL6
BBL/10 CFG6
BBL/10 CFG
* For example, fractile percentage 95 represents a 19 in 20 chance of the occurrence of at least the fractile tabulated.
44

SOUTH TEXAS OLIGOCENE-MIOCENE PLAY (150)
This play contains mainly nonassociated gas and minor oil in sandstone reservoirs of Miocene and Oligocene age in the South Texas Coastal Fault Zone (fig. 15).
Reservoirs are sandstones of Miocene age and the underlying Oligocene Anahuac Formation. Sandstones are barrier, strandplain and deltaic in origin. Pay thicknesses of individual reservoirs range typically from 4 to 40 ft, averaging 10 to 20 ft. Reservoirs are of excellent quality, averaging 25 to 34 percent porosity in fields reported.
Source rocks are probably either associated or subjacent Frio-Anahuac slope, shelf and prodelta mudstones and, locally, lower Miocene shelf mudstones. Vertical migration into many of the shallower producing zones has probably taken place.
Traps are primarily in anticlines and faulted anticlines associated with growth faults. Additional traps are associated with scattered salt domes. Drilling depths range from abut 1,000 to 23,000 ft.
The first significant discovery in the play occurred in 1922. Approximately 55 gas fields and 4 oil fields larger than 6 BCF and 1 MMB in size have since been discovered, accounting for approximately 104 MMBO and 3.3 TCFG. The largest oil field is Willamar (including Willamar West), which is 90 MMBO and 375 BCFG in size (fig. 15). Remaining exploration will be mainly in deeper areas, and primarily for gas. The future gas potential is estimated to be excellent
45

fD H
(_n o Hi
o ci rt O
M
H-
^Q
O
O
fD
13
fD I g
H-
O o fD
34°
30°
26°
98°
_
^T
"^
A
RK
AN
SAS
/Tja
lco
Fau
lt Zo
ne"*
|_
;_ _
__
_ _
_
x<"N
V
T
Mon
roe
)
90°
IM
ISSI
SSIP
PI
I A
LAB
AM
Ai
TE
XA
S
. i
\ y
Arc
n
/ I/
J?
E
ast T
exas
i
Sab
ine
\ N
orth
Lou
isia
na
' [f
§
Sal
t B
asin
'
Are
h ^
Sal
t B
asin
j^
s/
1/l
P
\
\ V
in
illC
IA
MA
/
C.
&
*vo °^
/>
$
'^^'
\ X
L
OU
ISIA
NA
r&
M
issi
ssip
pi
/f*oiT
\r
----
-
' &
S
alt
Bas
in
i * ,\
w^
i iFL
AT
-W--
-^l>
- V
L^T
^^te
r- C
hand
eleu
r
ME
XIC
O

OIL AND GAS PLAY DATA
PLAY SOUTH TEXAS OLIGOCENE-MIOCENE PROVINCE WESTERN GULF BASIN CODE 06-112-150
Play attributes
Hydrocarbon source (S)Timing (T)Migration (M)Potential reservoir-rock facies (R)
Probability of attribute being favorable or present
1.001.001.001.00
Marginal play probability (MP) (SxTxMxR = MP)
1.00
Accumulation attribute, conditional on favorable play attributes
6 9 Minimum size assessed: oil, 1 x 10 BBL; gas, 6 x 10 CFG
Probability of occurrence At least one undiscovered accumulation of at
least minimum size assessed 1.00
Character of undiscovered accumulations, conditional on at least one undiscovered accumulation present
Reservoir lithology Sandstone Carbonate rocks Other
Hydrocarbon type
Probability of occurrence X
Oil Gas
Fractile percentages * -Accumulation size
6Oil (x 10 BBL)
9 Gas (x 10 CFG)
3Reservoir depth (x 10 ft)
Oil Gas (non-associated)
Number of accumulations
0.2 0.8
Fractiles * (estimated amounts)100
1
6
0.52
150
95 75
1.1 1.4
6.5 10
200 260
50
2.1
16
8 12
300
Average ratio of associated-dissolved gas to oil (GOR)
Average ratio of NGL to non-associated gas
Average ratio of NGL to associated-dissolved gas
25
4
35
365
7000
25
0
5
10
200
490
0
30
1000
1322
600
CFG/BBL6
BBL /10 CFG6
BBL /10 CFG
* For example, fractile percentage 95 represents a 19 in 20 chance of the occurrence of at least the fractile tabulated.
47

EAST TEXAS BASIN PROVINCE (113)
By Richard Q. Foote, Laura M. Massingill, Robert H. Wells and Mahlon M. Ball
INTRODUCTION
The East Texas Basin Province is one of three Mesozoic basins (East Texas basin, Mississippi Salt basin, and North Louisiana Salt basin) flanking the northern rim of the Gulf Coastal Plain. Initial subsidence due to rifting and crustal attenuation, combined with subsequent sediment loading, resulted in maximum subsidence of more than 23,000 ft in the center of the basin. The province is located in northeast and east central Texas. It is limited on the north by the Texas-Oklahoma State boundary and the Talco fault zone, on the east by the Texas-Louisiana State boundary, on the south by the Western Gulf Basin province (112) (south of the Angelina - Caldwell flexure), and on the west by county boundary lines generally coincident with the Balcones Fault zone - Ouachita Thrust Front. The province encompasses 30,577 mi2. Approximately 294 significant oil and gas fields have been discovered in the province since 1895 that produce from reservoirs ranging in age from Upper Jurassic (Smackover) to Eocene (Claiborne Group) (fig. 16). Known recoverable hydrocarbons in these fields amount to 8.9 BBO, 28.6 TCFG, and 1.6 BB of NGL. The giant East Texas field alone accounts for nearly 6 BB of the total amount of recoverable crude oil. Six plays were individually assessed in the province; Mexia-Talco Fault Zone (020), Tyler Basin (030), Woodbine-Eagle Ford (040), Cotton Valley (050), Basement Structure (080), and Salt Anticlines (090).
48

EM-STSTCMSERCS
TAYUDR
GROUP
WIUCOX
MIDWAY
NAVARRO
EAGLE FORD
WOODBINE
WASHITA
FREDCRICKSBURG
TRINITY
COTTON VALLEY
COUARK
COUANN
FORMATION^CMBER
uxoirrcntoTukTto
tuvumo CULT
COOOCANO UWCSTONC
MASSIVE ANHTOMrTC
TMVIS^CAX (MOSSTONI
COTTON vtLLtr LWCS1TX
SUKKOVt* Fin
t»6ct KILLS Fo
Figure 16. Generalized stratigraphic column, East Texas basin province.
49

MEXIA-TALCO FAULT ZONE PLAY (020)
The play is defined by oil and gas accumulations in limestone, dolomite, or sandstone reservoirs of Upper Jurassic and Cretaceous age in a variety of fault-related traps along an arcuate band defined by the Mexia and Talco fault zones. The play is located in east-central and northern Texas, where it extends in an east-west direction for about 90 mi, and in an northeast- southwest direction for about 180 mi. (fig. 17). The northern and eastern limits of the play are defined by the Talco fault zone, and the western and southern limits by the Mexia fault zone. The Mexia-Talco fault zone represents the updip limit for fields of significant size in the play as well as the updip limit of the Jurassic Louann Salt.
Reservoirs range in lithology and age from carbonates of Upper Jurassic age to sandstones of Cretaceous age. Limestone or dolomite reservoirs in the Upper Jurassic Smackover Formation yield predominantly gas. These reservoirs are usually narrow and restricted to fault closure; producing fields may be several miles in length. Porosity in the Smackover ranges from 8 to 32 percent and averages 18 percent. Permeability ranges from 0.1 to 3,200 millidarcies and averages 33 millidarcies. Net pay of these reservoirs ranges from 20 to 108 ft and averages 42 ft. Other reservoirs are Cretaceous in age and include sandstone in the Paluxy, Woodbine, Upper Taylor, Navarro, and Nacatoch Formations. Reservoirs in the Paluxy Formation occur in channel-fill fluvial sandstone along the northern part of the Talco fault zone. Sandstone porosity varies between 15 and 39 percent and averages 29 percent. Permeability ranges between 24 and 4,000 millidarcies and averages 1,900 millidarcies . Thickness of pay zones ranges from 18 to 80 ft and averages 40 ft. Reservoirs in the Woodbine occur primarily in sandstone that is interbedded with mudstone. The sandstones are dominantly coastal-barrier sand facies deposited in the distal part of wave-dominated deltas. Sandstone reservoir porosity range from 22 to 32 percent and average 26 percent. Permeability ranges from 1,045 to 3,400 millidarcies and averages 1,850 millidarcies. Net pay of these reservoirs varies between 3 and 75 ft and averages 38 ft. Reservoirs in the Upper Taylor, Navarro, and Nacatoch Formations produce oil and gas from shallow depths. Reservoirs in the Nacatoch are clean, well sorted shelf sandstones that grade laterally and vertically into shelf mudstones. Sandstone porosity ranges from 23 to 32 percent and averages 26 percent, and permeability ranges from 600 to 940 millidarcies, and averages 773 millidarcies. Net pay of reservoirs in the Taylor and Navarro Groups ranges from 3 to 90 ft and averages about 49 ft.
Source rocks for hydrocarbons in the Smackover are probably dark limestone and mudstone beds within the Formation. Potential source rocks for Lower Cretaceous accumulations include organic-rich clay, shale, and lime mudstone; for Upper Cretaceous hydrocarbon accumulations, source rocks include organic-rich clay and chalk, and marine shale. In general, timing of migration appears to have had a significant influence on hydrocarbon accumulation because of regional structural movement. Timing of migration for hydrocarbons in the Smackover Formation occurred before early, precompaction cement formed, but prior to the formation of cement precipitated in the deeper subsurface.
Traps are formed primarily by structural closures against faults, faulted anticlines, and faulted structural arches; facies changes also affect hydrocarbon entrapment. Hydrocarbons trapped in Upper Cretaceous reservoirs may have been aided by structural movement. Drilling depths range from 600 to 9,700 ft. The principal reservoir-seal relationships in the play are: (1) Smackover- Buckner Anhydrite, (2) Woodbine-Eagle Ford Shale-Austin Chalk, and (3) Upper Cretaceous sandstone-Upper Cretaceous shale, chalk, and marl.
The play contains 24 oil and 4 gas fields and appears to be in a mature stage of exploration. The first discovery was the Corsicana field in 1895 along the Mexia Fault zone (fig. 17); other discoveries followed in the teens, 1920's and 1930's, including the discovery in 1936 of the Talco
50

field, the largest in the play (> 290 MMBO in size) along the Talco Fault zone. The last significant field discovery was in 1969 at the Brantley-Jackson West field. The future potential of the play is low.
51

Figure 17. Map of Mexia-Talco Fault Zone play.
52

OIL AND GAS PLAY DATA
PLAY MEXIA-TALCO FAULT ZONE PROVINCE EAST TEXAS BASIN CODE 06-113-020
Play attributes
Hydrocarbon source (S)Timing (T)Migration (M)Potential reservoir-rock facies (R)
Probability of attribute being favorable or present
1.001.001.001.00
Marginal play probability (MP) (SxTxMxR = MP)
1.00
Accumulation attribute, conditional on favorable play attributes
6 9Minimum size assessed: oil, 1 x 10 BBL; gas, 6 x 10 CFG
Probability of occurrenceAt least one undiscovered accumulation of at
least minimum size assessed 1.00
Character of undiscovered accumulations, conditional on at least one undiscovered accumulation present
Reservoir lithology Sandstone Carbonate rocks Other
Hydrocarbon typeOil Gas
Fractile percentages * -Accumulation size
6Oil (x 10 BBL)
9Gas (x 10 CFG)
3Reservoir depth (xlO ft)
OilGas (non-associated)
Number of accumulations
Probability of occurrence X
1 0
Fractiles * (estimated amounts)100 95 75
1 1.1 1.4
000
4 0
468
Average ratio of associated-dissolved gas to oil (GOR)
Average ratio of NGL to non-associated gas
Average ratio of NGL to associated-dissolved gas
50 25 5 0
2 3.1 5.9 10.2
0000
5 10 0 0
10 13 17 20
2000 CFG/BBL6
0 BBL/10 CFG6
0 BBL/10 CFG
* For example, fractile percentage 95 represents a 19 in 20 chance of the occurrence of at least the fractile tabulated.
53

TYLER BASIN PLAY (030)
The play is characterized by productive Cretaceous to Eocene clastic and carbonate reservoirs in a variety of structural traps, including salt domes, in a large elongate area in the central part of the province south and east of the Mexia - Talco fault system. It exceeds 20,000 mi^ in area (fig. 18).
Reservoirs range in age from Lower Cretaceous (Trinity Group) to Eocene (Carrizo Formation) (fig. 16). Most reservoirs are sandstone, although others are limestone and dolomite. Sandstone reservoirs occur in the Lower Cretaceous Travis Peak Formation, Glen Rose Subgroup and the Upper Cretaceous Woodbine and Eagle Ford Groups. Limestone reservoirs are found in the Pettet (Sligo) Member of the Lower Glen Rose Formation of the Trinity Group. No productive limestone reservoirs have been found in Cenozoic sedimentary rocks. Thicknesses of producing zones range from 2 ft in the Woodbine and Rodessa Member to 1,314 ft in the Travis Peak Formation. The 161 ft average thickness of pay in the Travis Peak Formation is significantly greater than the 72 ft in the James Formation and other pay zones in the play. Porosities of reservoirs range from 5.5 percent in the Pettet Formation to 32 percent in the Wilcox. Permeability ranges from 0.1 millidarcy to 5,900 millidarcies.
Source rocks for hydrocarbons in Smackover reservoirs are probably dark limestones and organic-rich shales within the lower Smackover and shale in the Bossier Formation; source rocks for hydrocarbons in Lower Cretaceous reservoirs are shale and carbonate of the same age, and age-equivalent marine shale, chalk, and marl for Upper Cretaceous reservoirs. Emplacement of hydrocarbons appears related to movement of salt, and probably spans a range of time from Early Cretaceous into the Tertiary.
Salt domes are important structures for trapping hydrocarbons; of 24 salt domes in the play area, 18 are productive. Other productive traps include structures over salt domes, anticlines, faulted anticlines, and complex graben-fault traps associated with salt tectonics deeper within the basin. Seals are formed by dense limestone, anhydrite, and shale overlying sandstone and limestone-dolomite reservoirs. Drilling depths range from 420 to 10,620 ft.
There are 62 oil and 57 producing gas fields in the play. The initial hydrocarbon discovery was the Boggy Creek field in 1927 (fig. 18), followed by the 1929 discovery of the giant Van field (> 500 MMBO in size). The most recent oil discovery was the Alabama Ferry field in 1983. The first gas discovery in the play was the South Buffalo field in 1933, and the most recent gas field found was Green Acres in 1985. The largest oil field is the Hawkins field, which is about 825 MMBO in size, and the largest gas field is the Opelika Area field at 870 BCFG in size. Although the play is maturely explored, the future potential for gas is good and the potential for oil is low to moderate.
54
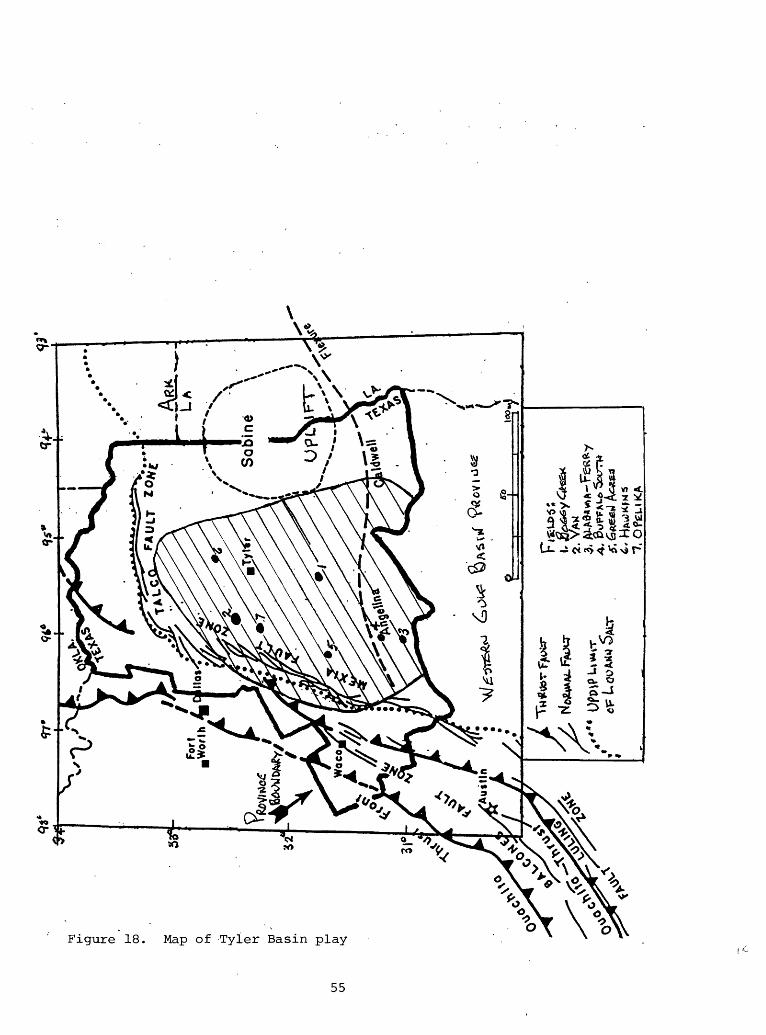
en Ul

OIL AND GAS PLAY DATA
PLAY TYLER BASIN PROVINCE EAST TEXAS BASIN CODE 06-113-030
Play attributes
Hydrocarbon source (S) Timing (T) Migration (M) Potential reservoir-rock facies (R)
Marginal play probability (MP) (SxTxMxR = MP)
Accumulation attribute,
Probability of attribute being favorable or present
1.00 1.00 1.00 1.001.00
conditional on favorable play attributes
6 9Minimum size assessed: oil, 1 x 10 BBL; gas, 6 x 10 CFG
Probability of occurrence At least one undiscovered accumulation of at
least minimum size assessed 1.00
Character of undiscovered accumulations, conditional on at least undiscovered accumulation present
Reservoir lithology Sandstone Carbonate rocks Other
Hydrocarbon typeOil Gas
one
Probability of occurrenceX X
0.4 0.6
Fractiles * (estimated amounts)Fractile percentages * -
Accumulation size6
Oil (x 10 BBL)9
Gas (x 10 CFG)3
Reservoir depth (xlO ft)OilGas (non-associated)
Number of accumulations
100
16
55
20
Average ratio of associated-dissolved gas to
95 75
1.1 1.7
6.7 10
22 26
oil (GOR)
50
3
15
6.57
30
Average ratio of NGL to non-associated gas
Average ratio of NGL to associated-dissolved gas
25
6.5
25
35
1000
25
0
5
26
70
43
0
126
200
1314
50
CFG/BBL6
BBL/106
BBL/10
CFG
CFG
* For example, fractile percentage 95 represents a 19 in 20 chance of the occurrence of at least the fractile tabulated.
56

WOODBINE-EAGLE FORD PLAY (040)
The play is characterized by producing fields in structural-stratigraphic traps mainly in clastic reservoirs of the Upper Cretaceous Woodbine and Eagle Ford Groups, and forms an elongate arc 25-40 mi wide and approximately 190 mi long, extending southwest from the west flank of the Sabine uplift (fig. 19). The main oil and associated gas reservoirs are sandstone beds in the Woodbine and Eagle Ford Formations, mainly the Lewisville and Dexter Sandstone Members of the Woodbine; one secondary reservoir occurs in a shale zone. Gas is produced from a sandstone in the Sub-Clarksville Member of the Eagle Ford. In the northern part of the play, two fields produce from deltaic sandstone reservoirs, and at the south end of the play there is production from marine sandstone reservoirs. Thickness of these productive reservoirs ranges between 5 and 38 ft, with an average of 14 ft. Porosity tends to be good, ranging from 25 to 27 percent, but is lower in finer-grained sandstones, averaging 18 percent. Permeability varies between 15 and 1,500 millidarcies and averages 570 millidarcies.
Source rocks for hydrocarbons in the Woodbine Formation are probably marine shale beds within this unit. Hydrocarbons found in post-Woodbine rocks were probably generated from marine shale interbedded with sandstone, or from chalk and marl, some of which also act as seals. The timing of hydrocarbon migration is not completely certain, but is probably pre- Eocene. Traps in the play are stratigraphic or structural-stratigraphic. Seals are shale in the Austin Chalk or Eagle Ford. Drilling depth to objectives ranges from 3,700 to 8,400 ft.
There are five oil fields and one gas field in the play. Exclusive of the giant (6 BBO in size) East Texas field discovery in 1930, the first significant field in the play, Lone Star, was found in 1938 (fig. 19). The most recent discovery was in 1970 at the Good Springs West field. The largest field is New Diana, which is estimated to be 11.9 MMBO and 1.05 BCFG in size. Future potential for both oil and gas is estimated to be moderate.
57

Figure 19. Map of Woodbine-Eagle Ford play
58

OIL AND GAS PLAY DATA
PLAY WOODBINE-EAGLE FORD PROVINCE EAST TEXAS BASIN CODE 06-113-040
Play attributes
Hydrocarbon source (S)Timing (T)Migration (M)Potential reservoir-rock facies (R)
Probability of attribute being favorable or present
1.001.001.001.00
Marginal play probability (MP) (SxTxMxR = MP)
1.00
Accumulation attribute, conditional on favorable play attributes
6 9 Minimum size assessed: oil, 1 x 10 BBL; gas, 6 x 10 CFG
Probability of occurrenceAt least one undiscovered accumulation of at
least minimum size assessed 1.00
Character of undiscovered accumulations, conditional on at least one undiscovered accumulation present
Reservoir lithology Probability of occurrence Sandstone X Carbonate rocks Other
Hydrocarbon type Oil 0.8 Gas 0.2
Fractiles * (estimated amounts)Fractile percentages * 100 95 75
Accumulation size6
Oil (x 10 BBL) 1 1.1 1.59
Gas (x 10 CFG) 6793
Reservoir depth (x 1 0 ft)Oil 3.5Gas (non-associated) 3.5
Number of accumulations 10 12 16
Average ratio of associated-dissolved gas to oil (GOR)
Average ratio of NGL to non-associated gas
Average ratio of NGL to associated-dissolved gas
50
2.5
12
88
20
25
5
25
25
930
40
0
5
20
80
34
0
100
400
1111
40
CFG/BBL6
BBL/106
BBL/10
CFG
CFG
* For example, fractile percentage 95 represents a 19 in 20 chance of the occurrence of at least the fractile tabulated.
59

COTTON VALLEY PLAY (050)
The play is defined by gas accumulations in Upper Jurassic and Lower Cretaceous Cotton Valley Group limestone and sandstone reservoirs in structural, combination, and stratigraphic traps. The play covers an elongate north-south trending area in the southwest corner of the East Texas basin approximately 100 mi long and 40 mi wide (fig. 20). Reservoirs in the Schuler and Bossier Formations and Haynesville Limestone (Cotton Valley Limestone equivalent), predominantly gas bearing, consist of oolitic limestone formed in lagoonal bars and as grainstone lenses. There are 25 primary limestone and 9 sandstone reservoirs in the section. Shelf-edge grainstone or boundstone reservoirs have high porosities (18 to 27 percent), but low permeabilities (1.1 to 12 millidarcies; average 2.5 millidarcies). A narrow band of fractured wackestone reservoirs is associated with a hingeline; the fracturing resulted from basinal subsidence, and primary porosity in this band is 8 percent or less. Grainstone facies in the Haynesville Limestone, often associated with deeper salt and basement structures, have porosities ranging between 3 and 20 percent and averaging 9 percent. Permeability in this facies varies between 0.1 and 3 millidarcies, and averages 1.6 millidarcies. Thin sandstone or siltstone beds occur in thick intervals of the Bossier Formation. Porosity in these beds is about 10.5 percent, and permeability is about 0.02 millidarcies.
Potential source rocks are shale beds underlying, overlying, or enclosing the Cotton Valley reservoirs. Limestone and shale beds in the underlying Upper Jurassic Smackover Formation also have source rock potential.
Traps vary from anticlinal to porosity pinchout on structural noses and on crests of anticlines to stratigraphic, in which oolitic shoal facies reservoirs are enclosed by mudstones. Seals are dense, impermeable limestone and mudstone beds. Drilling depths to productive zones range from 9,200 to 16,400 ft and average about 11,600 ft.
There are 31 gas fields in the play; the first gas field, Stewards Mill, was discovered in 1943, and the most recent gas discovery was in 1981 (fig. 20). Two oil fields were discovered in 1953 and 1978. One of the larger gas fields is Personvifie North, which is approximately 240 BCFG in size. Future gas potential for the play appears to be moderate to good.
60

Figure 20. Map of Cotton Valley play
61

OIL AND GAS PLAY DATA
PLAY COTTON VALLEY PROVINCE EAST TEXAS BASIN CODE 06-113-050
Play attributes
Hydrocarbon source (S) Timing (T) Migration (M) Potential reservoir-rock facies (R)
Marginal play probability (MP) (SxTxMxR = MP)
Accumulation attribute,
Probability of attribute being favorable or present
1.00 1.00 1.00 1.001.00
conditional on favorable play attributes
6 9Minimum size assessed: oil, 1 x 10 BBL; gas, 6 x 10 CFG
Probability of occurrenceAt least one undiscovered accumulation of at
least minimum size assessed 1.00
Character of undiscovered accumulations, conditional on at least one undiscovered accumulation present
Reservoir lithology Sandstone Carbonate rocks Other
Hydrocarbon typeOil Gas
Probability of occurrenceX X
01
Fractiles * (estimated amounts)Fractile percentages * -
Accumulation size6
Oil (x 10 BBL)9
Gas (x 10 CFG)3
Reservoir depth (x 1 0 ft)OilGas (non-associated)
Number of accumulations
100
0
6
09
10
Average ratio of associated-dissolved gas
95 75
0 0
6.6 9.3
12 16
to oil (GOR)
50
0
15
012
20
Average ratio of NGL to non-associated gas
Average ratio of NGL to associated-dissolved gas
25
0
28
25
0
11
0
5
0
76
34
0
0
230
016
40
CFG/BBL6
BBL /106
BBL /10
CFG
CFG
* For example, fractile percentage 95 represents a 19 in 20 chance of the occurrence of at least the fractile tabulated.
62
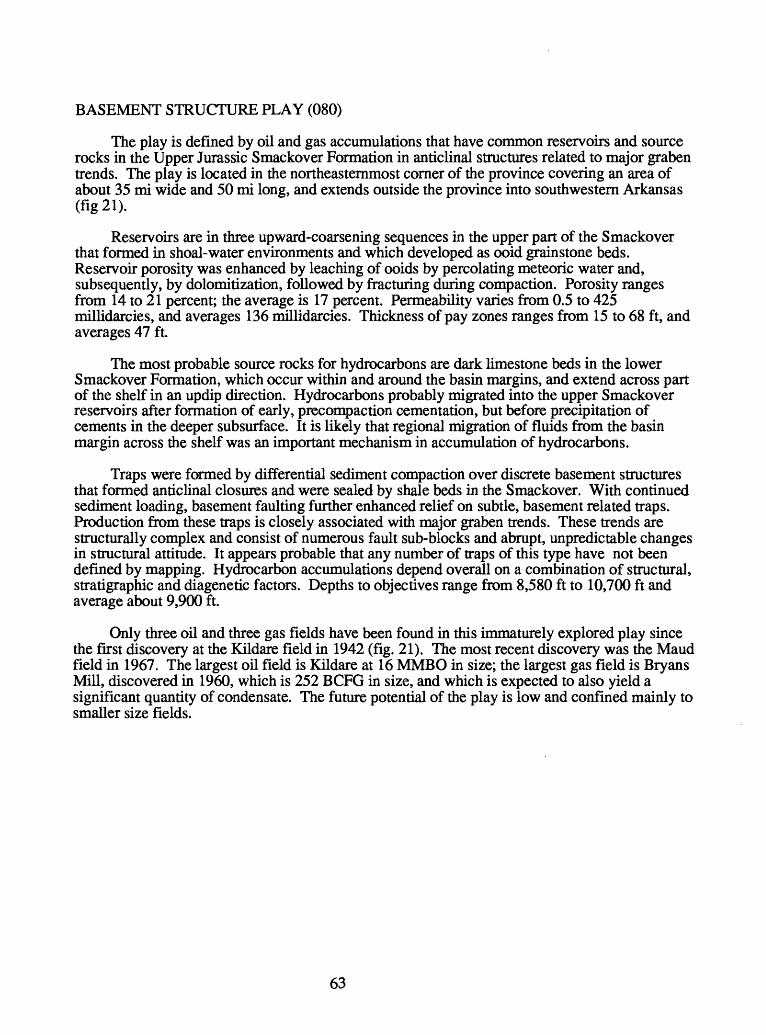
BASEMENT STRUCTURE PLAY (080)
The play is defined by oil and gas accumulations that have common reservoirs and source rocks in the Upper Jurassic Smackover Formation in anticlinal structures related to major graben trends. The play is located in the northeasternmost corner of the province covering an area of about 35 mi wide and 50 mi long, and extends outside the province into southwestern Arkansas (fig 21).
Reservoirs are in three upward-coarsening sequences in the upper part of the Smackover that formed in shoal-water environments and which developed as ooid grainstone beds. Reservoir porosity was enhanced by leaching of ooids by percolating meteoric water and, subsequently, by dolomitization, followed by fracturing during compaction. Porosity ranges from 14 to 21 percent; the average is 17 percent. Permeability varies from 0.5 to 425 millidarcies, and averages 136 millidarcies. Thickness of pay zones ranges from 15 to 68 ft, and averages 47 ft.
The most probable source rocks for hydrocarbons are dark limestone beds in the lower Smackover Formation, which occur within and around the basin margins, and extend across part of the shelf in an updip direction. Hydrocarbons probably migrated into the upper Smackover reservoirs after formation of early, precompaction cementation, but before precipitation of cements in the deeper subsurface. It is likely that regional migration of fluids from the basin margin across the shelf was an important mechanism in accumulation of hydrocarbons.
Traps were formed by differential sediment compaction over discrete basement structures that formed anticlinal closures and were sealed by shale beds in the Smackover. With continued sediment loading, basement faulting further enhanced relief on subtle, basement related traps. Production from these traps is closely associated with major graben trends. These trends are structurally complex and consist of numerous fault sub-blocks and abrupt, unpredictable changes in structural attitude. It appears probable that any number of traps of this type have not been defined by mapping. Hydrocarbon accumulations depend overall on a combination of structural, stratigraphic and diagenetic factors. Depths to objectives range from 8,580 ft to 10,700 ft and average about 9,900 ft.
Only three oil and three gas fields have been found in this immaturely explored play since the first discovery at the Kildare field in 1942 (fig. 21). The most recent discovery was the Maud field in 1967. The largest oil field is Kildare at 16 MMBO in size; the largest gas field is Bryans Mill, discovered in 1960, which is 252 BCFG in size, and which is expected to also yield a significant quantity of condensate. The future potential of the play is low and confined mainly to smaller size fields.
63

Figure 21. Map of Basement Structure play.
64

OIL AND GAS PLAY DATA
PLAY BASEMENT STRUCTURE PROVINCE EAST TEXAS BASIN CODE 06-113-080
Play attributes
Hydrocarbon source (S)Timing (T)Migration (M)Potential reservoir-rock facies (R)
Probability of attribute being favorable or present
1.001.001.001.00
Marginal play probability (MP) (SxTxMxR = MP)
1.00
Accumulation attribute, conditional on favorable play attributes
6 9 Minimum size assessed: oil, 1 x 10 BBL; gas, 6 x 10 CFG
Probability of occurrenceAt least one undiscovered accumulation of at j QQ
least minimum size assessed
Character of undiscovered accumulations, conditional on at least one __ undiscovered accumulation present
Reservoir lithology Sandstone Carbonate rocks Other
Hydrocarbon type
Probability of occurrence
X
Oil Gas
0.7 0.3
Fractiles * (estimated amounts)Fractile percentages *
Accumulation size6
Oil (x 10 BBL)9
Gas (x 10 CFG)3
Reservoir depth (xlO ft)OilGas (non-associated)
Number of accumulations
100
1
6
66
2
Average ratio of associated-dissolved gas to
95 75
1.2 2.2
7.2 13
2 3
oil (GOR)
50
4
20
8.58.5
4
Average ratio of NGL to non-associated gas
Average ratio of NGL to associated-dissolved gas
25
7.3
29.2
5
1100
200
0
5
15.6
55
6
0
28.7
90
1111
6
CFG/BBL6
BBL /106
BBL /10
CFG
CFG
* For example, fractile percentage 95 represents a 19 in 20 chance of the occurrence of at least the fractile tabulated.
65

SALT ANTICLINES PLAY (090)
The play involves gas, condensate and oil fields that have common reservoir and source rocks in the Smackover Formation and are associated with drape salt structures and complexly faulted anticlines. The play is associated with two areas of salt anticlines, one extending east- west, roughly parallel to and downdip from the Talco fault zone, which is approximately 90 mi long and up to 35 mi wide; the second cluster of salt anticlines trends northeast-southwest, and is basinward of the Mexia fault zone (fig. 22).
Reservoirs in the play are carbonate beds and associated facies of the upper Jurassic Smackover Formation. Carbonate beds were deposited in shallow water environments, and incipient salt structures contributed in the localizing of high quality carbonate reservoir facies in discrete areas. Thickness of the producing intervals ranges between 10 and 292 ft and averages 88 ft. Porosity varies from 7 to 18 percent and averages 13 percent. Permeability ranges from 1.1 millidarcies to 87 millidarcies and averages 14 millidarcies.
Primary source rocks are probably dark limestone units in the lower Smackover Formation. These limestones occur within and around the basin margins, and extend partly across the shelf in an updip direction, attaining a thickness of greater than 500 ft. Timing and migration of hydrocarbons is thought to be consistent with timing and migration in the Basement Structure Play (080).
Traps in the northern and northeastern part of the play formed in anticlinal structures over low-amplitude salt anticlines, which formed in response to sediment loading, and over which Jurassic rocks are draped. The southern part of the play contains more complex anticlines in which salt has commonly broken through the overlying Upper Jurassic carbonate beds, and reservoir rocks here are complexly faulted. The Buckner anhydrite, where present, acts as a very effective seal. Drilling depths to the top of the Smackover vary from 10,800 to 13,200 ft; average drilling depth is 12,300 ft.
The play has been fairly well explored since the discovery of the New Hope field in 1943 (fig. 22). Although most fields are productive of sour gas (H^S) and condensate, eight are classified as oil fields and three others are classified as oil and associated gas fields. A total of 18 gas fields were discovered between 1944 (Myrtle Springs) and 1982 (Ginger Southeast). Known recoverable hydrocarbons in the 29 fields in the play are 2.2 MMBO, 1,111 BCFG and 147.4 MMB of condensate. Future potential in the play is low for oil and moderate for gas.
66

Figure 22. Map of Salt Anticlines play.
67

OIL AND GAS PLAY DATA
PLAY SALT ANTICLINES PROVINCE EAST TEXAS BASIN CODE 06-113-090
Play attributes
Hydrocarbon source (S) Timing (T) Migration (M) Potential reservoir-rock facies (R)
Marginal play probability (MP) (SxTxMxR = MP)
Accumulation attribute,
Probability of attribute being favorable or present
1.00 1.00 1.00 1.001.00
conditional on favorable play attributes
6 9Minimum size assessed: oil, 1 x 10 BBL; gas, 6 x 10 CFG
Probability of occurrenceAt least one undiscovered accumulation of at
least minimum size assessed 1.00
Character of undiscovered accumulations, conditional on at least undiscovered accumulation present
Reservoir lithology Sandstone Carbonate rocks Other
Hydrocarbon typeOil Gas
one
Probability of occurrenceX X
0.4 0.6
Fractiles * (estimated amounts)Fractile percentages * -
Accumulation size6
Oil (x 10 BBL)9
Gas (x 10 CFG)3
Reservoir depth (xlO ft)OilGas (non-associated)
Number of accumulations
100
16
6.38
10
Average ratio of associated-dissolved gas to
95 75
1.1 1.4
6.6 9.7
11 13
oH (GOR)
50
2
16
910
15
Average ratio of NGL to non-associated gas
Average ratio of NGL to associated-dissolved gas
25
3.2
30
18
2400
60
0
5
7.2
87
22
0
16
260
1314
25
CFG/BBL6
BBL /106
BBL /10
CFG
CFG
* For example, fractile percentage 95 represents a 19 in 20 chance of the occurrence of at least the fractile tabulated.
68

LOUISIANA-MISSISSIPPI SALT BASINS PROVINCE (114)
By Richard Q. Foote, Robert H. Wells, Linda M. Massingill, and Mahlon M. Ball
INTRODUCTION
The province is located in northern Louisiana and extreme southern Arkansas, central and southern Mississippi, southwest Alabama,, and the extreme western end of the Florida panhandle. Boundaries of the province are, to the west, the Sabine uplift; to the north, the structural margins of the Black Warrior and Arkoma basins; to the south, the Angelina-Caldwell flexure, Wiggins- Hancock arch, and the 3-mile State of Alabama offshore limit. The province encompasses about 94,340 mA Exploration and development are in a mature stage with more than 600 significant oil and gas fields having been found between 1904 and 1986. Cumulative production from these fields through 1986 is 10.3 BBO, 55.6 TCFG and 1.74 BB of NGL. The first major oil field discovered in the province was Caddo-Pine Island in 1904 on the Texas-Louisiana border, cumulative production from this field is 390 MMBO and 312 BCFG. The largest oil accumulation is the Jay field in the Florida Panhandle with a cumulative production of 436 MMBO and 363 BCFG, and the largest gas field is the Monroe field in northeastern Louisiana with a cumulative production of 7.5 TCFG. Rocks ranging from Upper Jurassic to Miocene in age are productive of hydrocarbons in the province (fig. 23). Eleven plays were individually assessed: Salt Basin Deep, (020); Pickens-Pollard Fault, (030); Basin Structural, (040); Salt Basin, (050); Wiggins-Hancock Arch, (060); Smackover, (070); Arkansas Structural, (080); Alabama Miocene, (090); Sabine Uplift Gas, (100); Sabine Uplift Oil (110); and Monroe Uplift ((120).
69

^Snwn^^On,,-
Oligocene 1 Miocene
TERTIARY
Paleocene | Eocene
3 O
83 £ o
I
3 0
8ra
20
1 o
Upper Jurassic
rriaeejA Middle lnassTJurassic
S. Arkansas/ N. Louisiana
Miocene undifferenti
ated
Anahuac. _ Formation
Frio. _ Formation.Vicksburg Fm.
°§ Yazoo Fm.So? c
Branch^ockfiald Fm.
o 3 Cook Ml. Fm.SS Sparta FIT
3^ CanaRwarFm.
x Q Carrizo Fm.Oi
§JSabinetown Fm.
CL 3 logansporl Fm. & O Nebencn Fm.
10 Port ars Creek Fm
§ Kincak) Fm.
isNavarro Group
Taylor Group
Group
Arkedelphia Fm.
Nacatoch Fm
Saratoga Fm.Marlbrook FmAnnonj 1OzanFn
m
Eagle Ford FmWoodbine / . .
G r ou p i^_Lawi»viii«
>^ Lower ./Tuscaloosa
Washita/ Fredericksburg
Group
Paluxy Fm.
Mooringsport Fm
Ferry Lake Fm.^Rodi_J|ex
JamPine
PeUet FT
Travs
ssa FmarFm.es Lmst.stand Fm
^"sligoFm.
°FSm°n
£ Cotton /
O(j / Fm.
g Bossier F
Gilmer^---'
^^ ville Fm
Buckner Fm.
Smackover F
m
V
<n CO
m
Norphlet Fm.
Louann Salt
Werner Fm.-^s~*~s~^s-~^s^~s
Eagle Mills Fm
Central Mississippi
Miocene undifferenti
ated
Olig ocene undifferentiated
\\
0)Eo. -A g
0
Yazoo Fm.Moodva
Branch Fm.CockfiekJ Fm.Cook Mt. Fm.
Winona Fm.Tallahatta Fm.
g Q. Carrizo Fm.
~ S Sabinetown $0 Fm.
Midway G roup
Navarro Group
Taylor Group
Arkedelphia Fm.
Nacatoch Fm.
Saratoga Fm.MarlbrookFm.AnnonaFm.
OzanFm.
Srou'pl Uppor Eutaw Fm.
Lower Eutaw Fm.| tt _ Upper_
«!! Middle So . t fi Lower
Washita/ Fredericksburg
Group
Paluxy Fm.
Mooringsport Fm
Ferry Lake Fm.
Rodessa Frn.
Sligo Fm.
Hosston Fm.
_w !j5a SchulerFm.
S Bossier Fm.
Haynesville Fm.
Buckner Fm.
Smackover Fm.
Norphlet Fm.
Louann Salt
Werner Fm.
Eagle Mills Fm.
S.W. Alabama
to
o > ra ro
a.
Meyer Sandstone
Escambia SsLuce Ss.
Amos Ss.
Oligocene undifferentiated
JacksonGroup
Clai borne Group
Wilcox Group
Midway Group
Selma Group
Eutaw Fm.
/Tuscaloosa n\ G|DUP
UpperMiddle Lower
antzler Fm.
Washita/ Fredericksburg
GroupPaluxy Fm.
Mooringsport Fm.
Ferry Lake Fm.
Rodessa Fm.
Sligo Fm.
Hosston Fm.
Cotton Valley Group
Haynesville Fm.
Buckner Anhydrite Member
Smackover Fm.
Norphlet Fm.
Pine Hill Anh. Mbr.
Louann Salt
Werner Fm.
Eagle Mills Fm.
Paleozoic and undifferentiated basement rocks
Figure 23. Generalized stratigraphic columns,Louisiana-Mississippi Salt Basins province
70

SALT BASIN DEEP PLAY (020)
This play is characterized by predominantly gas-bearing, Upper Jurassic and Cretaceous sandstone, limestone and dolomite reservoirs associated with salt-movement-produced structural traps within the Mississippi Salt Basin. The play extends from west-central Louisiana southeast to southwest Alabama and the western end of Florida (fig. 24).
Fifty-nine individual, mainly carbonate Upper Jurassic reservoirs are present in the Norphlet, Smackover, and Haynesville Formations. More than 160 individual Lower Cretaceous sandstone reservoirs occur in the Hosston, Sligo, Rodessa, Paluxy, and Mooringsport Formations. Twenty-one sandstone reservoirs are present in the Lower Cretaceous Eutaw Formation. Average porosity values for all productive reservoirs are fair to good, ranging from 13 to 18 percent; average permeabilities are favorable except for the Hosston and Sligo Formations where they average about 10 millidarcies. Thickeness of pay zones in the Upper Jurassic Norphlet and Smackover Formations is substantial, averaging 138 ft and 144 ft, respectively. Lower Cretaceous pay thicknesses are less, averaging 19 ft in the Rodessa, 22 ft in the Mooringsport and 7 ft in the Paluxy Formations.
Source rocks for Upper Jurassic hydrocarbons are the dark lime mudstones in the lower part of the Smackover Formation with TOC values averaging 36 percent. Source rocks for Cretaceous hydrocarbons are thought to be basinal shale beds of the Hosston and Sligo Formations, and Upper Cretaceous carbonates. Oil generation in both the Jurassic and Cretaceous source rocks probably began in the Late Cretaceous, and the original crude oil in reservoirs had probably cracked thermally to methane by mid-Tertiary time.
Trapping in the play is structural; salt movement produced anticlines, faulted anticlines, salt domes, and other salt-related structures. Seals are shale, carbonate, and evaporite beds. Drilling depths range from 9,000 to 24,000 ft.
The play contains 50 fields, of which 11 are oil fields. Gas was first discovered at the Jackson field in 1930, and the most recent discovery was the Higgins field in 1981. The first oil field, Merit, was discovered in 1959, and the most recent discovery was the Blackshear field in 1980. Known recoverable hydrocarbons in the play are 3,476 BCFG, 0.94 MMBO, and 214 MMB of NGL. The future potential for gas is excellent.
71

O
O w
pj en H- D
(D
(D

PLAY PROVINCE
OIL AND GAS PLAY DATA
SALT BASIN DEEP LOUISIANA-MISSISSIPPI SALT BASINS CODE 06-114-020
Play attributes
Hydrocarbon source (S)Timing (T)Migration (M)Potential reservoir-rock facies (R)
Probability of attribute being favorable or present
1.001.001.001.00
Marginal play probability (MP) (SxTxMxR = MP)
1.00
Accumulation attribute, conditional on favorable play attributes
6 9Minimum size assessed: oil, 1 x 10 BBL; gas, 6 x 10 CFG
Probability of occurrenceAt least one undiscovered accumulation of at I QQ
least minimum size assessed
Character of undiscovered accumulations, conditional on at least one undiscovered accumulation present
Reservoir lithology Sandstone Carbonate rocks Other
Hydrocarbon typeOil Gas
Probability of occurrence X
0
Fractiles * (estimated amounts)Fractile percentages * 100 95 75
Accumulation size6
OH (x 10 BBL) 0009
Gas (x 10 CFG) 6 8 183
Reservoir depth (xlO ft)
Oil 0Gas (non-associated) 9
Number of accumulations 30 36 44
Average ratio of associated-dissolved gas to oil (GOR)
Average ratio of NGL to non-associated gas
Average ratio of NGL to associated-dissolved gas
50
0
42
014
50
25
0
110
56
0
100
0
5
0
480
64
0
0
3000
024
70
CFG/BBL6
BBL /106
BBL/10
CFG
CFG
* For example, fractile percentage 95 represents a 19 in 20 chance of the occurrence of at least the fractile tabulated.
73

PICKENS-POLLARD FAULT PLAY (030)
This play is defined by oil and associated gas accumulations in Upper Jurassic reservoirs along the Pickens-Pollard fault system, which extends from just east of the Monroe uplift southeast to offshore Florida, and includes the updip (northeast) pinch-out of both the Norphlet and Smackover Formations (fig. 25).
Reservoirs are predominantly limestone and dolomite of the Smackover Formation. Porosity of these carbonate reservoirs ranges from 18 to 19 percent, and permeability ranges from 300 to 330 millidarcies. Norphlet reservoirs are eolian sandstone with porosities ranging from 18 to 19.5 percent, and permeabilities ranging from 300 to 330 millidarcies. Pay thickness of reservoirs in these two units ranges from 4 to 40 ft and averages 21 ft.
Source rocks are considered to be lime mudstones of the lower Smackover Formation. Total organic carbon values of the lower Smackover average 51 percent, compared to 24 percent for the upper Smackover. Thermal maturity of lower Smackover source rocks increases basinward; at present, the generative window is at depths between 11,500 and 12,500 feet. Migration of hydrocarbons most likely occurred in Cretaceous time. Traps include anticlines, extensional fault structures and faulted anticlines over salt features and basement highs that are related to salt movement within the Pickens-Pollard fault zone. Major seals are the Buckner Anhydrite and shale in the lower Smackover. Drilling depths range from 10,000 to 16,000 ft.
The first oil discovery in the play was the Quitman field in 1945; the most recent discovery was the South Womack Hills field in 1985. A total of 25 oil fields have been found since the initial discovery. Known quantities of hydrocarbons produced in the play include 635 MMBO, 792 BCF of associated gas and 160 MMB of NGL. Future potential of the play is estimated to be in accumulations in the small field-size category.
74

o Hi

PLAY PROVINCE
OIL AND GAS PLAY DATA
PICKENS-POLLARD FAULT LOUISIANA-MISSISSIPPI SALT BASINS CODE 06-114-1
Play attributes
Hydrocarbon source (S)Timing (T)Migration (M)Potential reservoir-rock facies (R)
Probability of attribute being favorable or present
1.001.001.001.00
Marginal play probability (MP) (SxTxMxR = MP)
1.00
Accumulation attribute, conditional on favorable play attributes
6 9Minimum size assessed: oil, 1 x 10 BBL; gas, 6 x 10 CFG
Probability of occurrenceAt least one undiscovered accumulation of at j QQ
least minimum size assessed
Character of undiscovered accumulations, conditional on at least one undiscovered accumulation present
Reservoir lithology Sandstone Carbonate rocks Other
Hydrocarbon typeOil Gas
Probability of occurrence X
0Fractiles * (estimated amounts)
Fractile percentages * 100 95 75Accumulation size
6Oil (x 10 BBL) 1 1.1 1.4
9Gas (x 10 CFG) 000
3Reservoir depth (xlO ft)
Oil 10.5Gas (non-associated) 0
Number of accumulations 5 7 10
Average ratio of associated-dissolved gas to oil (GOR)
Average ratio of NGL to non-associated gas
Average ratio of NGL to associated-dissolved gas
50
2
0
12.50
12
25
3.3
0
14
420
0
0
5
9
0
17
0
25
0
160
20
CFG/BBL6
BBL/106
BBL/10
CFG
CFG
* For example, fractile percentage 95 represents a 19 in 20 chance of the occurrence of at least the fractile tabulated.
76

BASIN STRUCTURAL PLAY (040)
This play is defined by oil and gas accumulations in combination structural and stratigraphic and structural traps in sandstone reservoirs that range from Early Cretaceous to Eocene in age in central Louisiana and southwest Mississippi. The play extends from the axis of the north Louisiana Salt Basin southeast to the Wiggins-Hancock arch, and north to the southern half of the Monroe uplift (fig. 26).
Lower Cretaceous sandstone reservoirs include the Paluxy Formation and Washita- Fredericksburg Group undifferentiated; however, the main productive reservoirs are Late Cretaceous and Paleocene-Eocene in age. Upper Cretaceous reservoirs are in the Tuscaloosa (Woodbine) Group. Porosity in these sandstone reservoirs ranges from 14 to 31 percent, averaging 25 percent. Permeability ranges from 24 to 600 millidarcies, averaging 250 millidarcies, and net reservoir pay thickness ranges from 6 to 285 feet, averaging 33 feet. Paleocene-Eocene reservoirs are mainly in the Wilcox Group, which includes as many as 13 productive Formations. Porosity in Wilcox reservoirs ranges from 20 to 38 percent, averaging 30 percent. Permeability ranges from 30 to 1400 millidarcies., averaging 186 millidarcies Gravity of produced oil ranges from 20° to 59° API.
Source rocks for hydrocarbons in Tuscaloosa reservoirs are probably organic-rich mudstone and basinal shales in the Tuscaloosa. Source rocks for hydrocarbons in Wilcox sandstone reservoirs are interbedded black shale and possibly coal beds. Timing of migration is generally unknown, although Wilcox oil is believed to have migrated and accumulated before subsidence began. Traps include a variety of structures formed as a result of salt movement such as anticlines, and structural closures against faults; however, the most common trapping mechanism in numerous small-size Wilcox producing fields are combination traps where shale sealing beds also act as permeability barriers in sandstone reservoirs in association with minor structural closures. Drilling depths range from 1,000 to 13,000 ft.
The play is relatively well explored, containing 188 oil and 16 gas fields. The initial oil discovery was the Tullos-Urania field in 1925, followed by a gas discovery in 1926 at the Richland field. Greater than 95 percent of the production in the play is from hundreds of individual reservoirs in the Tuscaloosa and Wilcox Groups. The largest oil and gas fields are Delhi-Big Creek (236 MMBO) and Cranfield (681 BCFG), respectively. Known quantities of produced hydrocarbons from fields in the play are 1,799 MMBO, 4,806 BCFG, and 50.5 MMB of NGL. Future potential for both oil and gas is estimated to be fair to good.
77

00
H- S H n> K)
CFi
0
Hi
W
PJ
w
H- cn
rt

OIL AND GAS PLAY DATA
PLAY BASIN STRUCTURALPROVINCE LOUISIANA-MISSISSIPPI SALT BASINS CODE 06-114-040
Play attributes
Hydrocarbon source (S)Timing (T)Migration (M)Potential reservoir-rock facies (R)
Probability of attribute being favorable or present
LOO LOO LOO LOO
Marginal play probability (MP) (SxTxMxR = MP)
LOO
Accumulation attribute, conditional on favorable play attributes
6 9Minimum size assessed: oil, 1 x 10 BBL; gas, 6 x 10 CFG
Probability of occurrenceAt least one undiscovered accumulation of at ^ QQ
least minimum size assessed
Character of undiscovered accumulations, conditional on at least one undiscovered accumulation present
Reservoir lithology Sandstone Carbonate rocks Other
Hydrocarbon type
Probability of occurrence X
OilGas
0.9 0.1
Fractiles * (estimated amounts)Fractile percentages *
Accumulation size6
Oil (x 10 BBL)9
Gas (x 10 CFG)3
Reservoir depth (xlO ft)OilGas (non-associated)
Number of accumulations
100
1
6
0.61
30
95 75
1.1 L3
6.1 6.2
36 44
50
1.9
6.6
18
50
Average ratio of associated-dissolved gas to oil (GOR)
Average ratio of NGL to non-associated gas
Average ratio of NGL to associated-dissolved gas
25
3.2
7.5
56
1500
15
0
5
8.5
11.5
64
0
25
20
1213
70
CFG/BBL6
BBL/106
BBL/10
CFG
CFG
* For example, fractile percentage 95 represents a 19 in 20 chance of the occurrence of at least the fractile tabulated.
79

SALT BASIN PLAY (050)
The play consists of oil and minor gas accumulations in structural traps involving sandstone reservoirs of Late Jurassic and Cretaceous age. The play area includes the Mississippi Salt Basin and extends from the Louisiana-Mississippi state line southeast to the State 3-mile or 3-league boundary, and from the Monroe uplift in the north to the Wiggins-Hancock arch in the south (fig. 27).
Numerous reservoirs are in rocks of Upper Jurassic, Lower Cretaceous, and Upper Cretaceous age. Upper Jurassic reservoirs are in the Norphlet and Smackover formations. Porosity of Norphlet sandstones averages 13 percent, and permeability averages 80 millidarcies, while porosity of Smackover carbonate reservoirs averages 13 percent, and permeability averages 33 millidarcies. Upper Cretaceous reservoirs are predominantly in sandstones of the Eutaw Group, and some are in fractured chalk of the Navarro and Taylor Groups.
Source rocks for hydrocarbons in the Norphlet and Smackover are generally considered to be dark lime mudstones of the lower Smackover Formation. Source rocks for hydrocarbons in Cretaceous reservoirs are considered to be mudstones of the Eutaw Formation. Hydrocarbon generation is considered to have begun in Cretaceous time for Upper Jurassic source rocks, and in Late Cretaceous-early Tertiary time for Cretaceous source rocks. Traps are related to structures formed by salt movement, and include anticlines, faulted anticlines, extensional fault structures, and anticlines over basement highs. Drilling depths range from 2,500 to 20,000 ft.
The play is well explored with 78 oil and 8 gas fields discovered since the Tinsley oil field was found in 1939 and the Sharon gas field in 1949. The most recent oil and gas discoveries were the Blackshear and Higgins fields in 1980 and 1981, respectively. The largest fields are Sharon (32 MMBO) and Gwinville (1,187 BCFG). Known quantities of produced hydrocarbons from all fields in the play are 2,174 MMBO, 1,372 BCFG and 183 MMB of NGL. Future potential of the play is estimated to be fair to good.
80
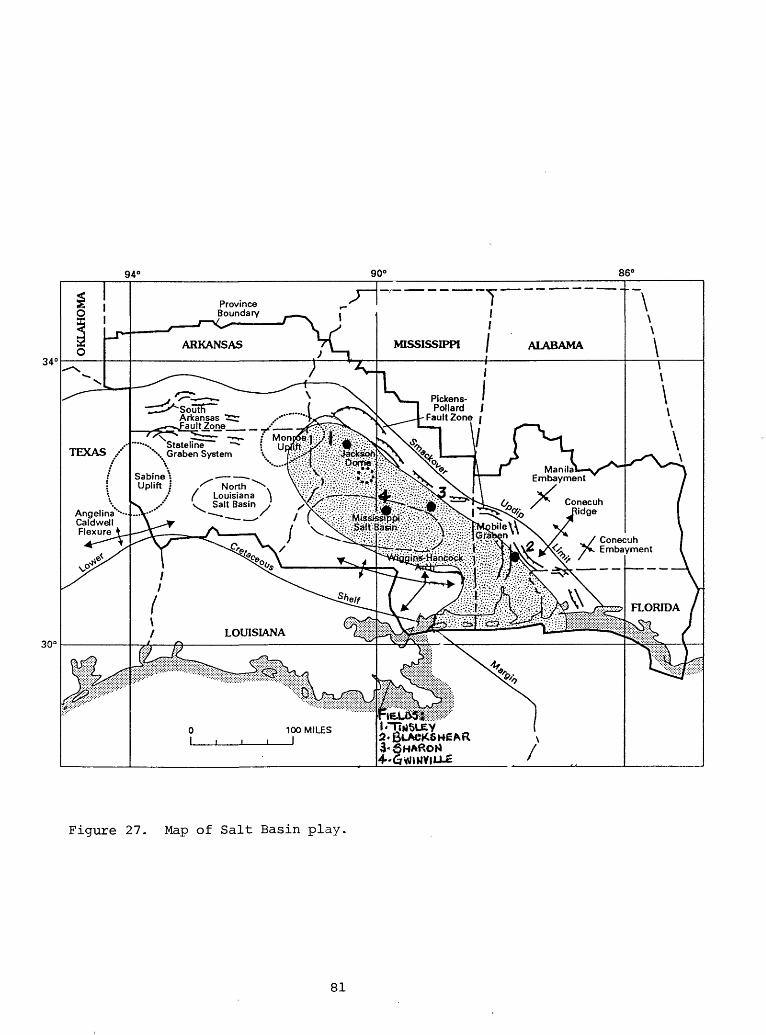
CO
0)
NJ 3 8 0
Mi
cn ft
(3d

PLAY PROVINCE
OIL AND GAS PLAY DATA
SALT BASIN LOUISIANA-MISSISSIPPI SALT BASINS CODE 06-114-050
Play attributes
Hydrocarbon source (S)Timing (T)Migration (M)Potential reservoir-rock facies (R)
Probability of attribute being favorable or present
1.001.001.001.00
Marginal play probability (MP) (SxTxMxR = MP)
1.00
Accumulation attribute, conditional on favorable play attributes
6 9 Minimum size assessed: oil, 1 x 10 BBL; gas, 6 x 10 CFG
Probability of occurrenceAt least one undiscovered accumulation of at ^ QQ
least minimum size assessed
Character of undiscovered accumulations, conditional on at least one undiscovered accumulation present
Reservoir lithology Sandstone Carbonate rocks Other
Hydrocarbon typeOil Gas
Probability of occurrenceX X
1 0
Fractiles * (estimated amounts)Fractile percentages * -
Accumulation size6
Oil (x 10 BBL)9
Gas (x 10 CFG)3
Reservoir depth (xlO ft)OilGas (non-associated)
Number of accumulations
100
10
8.50
7
Average ratio of associated-dissolved gas to
95 75
1.2 2
0 0
11 16
oil (GOR)
50
3.8
0
140
20
Average ratio of NGL to non-associated gas
Average ratio of NGL to associated-dissolved gas
25
7.4
0
25
535
0
0
5
19
0
32
0
43
0
170
35
CFG/BBL6
BBL /106
BBL/10
CFG
CFG
* For example, fractile percentage 95 represents a 19 in 20 chance of the occurrence of at least the fractile tabulated.
82

WIGGINS-HANCOCK ARCH PLAY (060)
This play is defined by stratigraphically trapped gas and minor oil in mainly Upper Jurassic and Cretaceous sandstone reservoirs along the Wiggins-Hancock arch at the southern margin of the province in southern Mississippi (fig. 28). The play is largely in Cretaceous reservoirs. Reservoirs are predominantly quartz sandstones that range from 5 to 10 percent porosity and range in age from the Late Jurassic Cotton Valley Group to as young as the Paleocene Wilcox Group. However, the great majority of reservoirs are in the Tuscaloosa and Washita-- Fredericksburg Groups. Minor limestone reservoirs occur in the Lower Cretaceous James Limestone and Mooringsport Formation. Pay thicknesses are measured in the tens of feet, but in specific cases, range up to 27 and as high as 85 ft in one reservoir.
Source rocks include the dark lime mudstones of the Lower Smackover Formation that sourced reservoirs in the Upper Jurassic. Shales of the Hosston and Sligo Formations, and shale in the Tuscaloosa and Wilcox Groups probably acted as source rocks for sandstones within those formations. Generation and migration probably began in the Early Cretaceous. Intrastratal migration is thought to be a significant process in the play. Traps, particularly in the lower Tuscaloosa Group sandstones, are mainly stratigraphic. These multi-storied, composite point-bar and channel sandstones form stratigraphic traps where they are encased in flood plain siltstone and shale and sealed updip on a low angle regional structure. Drilling depths range from 4,000 to 20,000 ft.
Natural gas production was established in the Upper Jurassic Cotton Valley Group at the Catahoula Creek field in 1981; however, the first discovery of gas in the play occurred in 1945 at the Hub Area field. The first of four oil fields was found in 1944 at the Baxterville field. Gravity of oil in the Tuscaloosa Group ranges from 15.5° to 62° API. Known quantities of produced hydrocarbons from 11 gas and 4 oil fields in the play are 2,273 BCFG, 336 MMBO, and 24.3 MMB of NGL. The play is moderately explorated and the future gas potential is fair.
83

00
to
OD o l-h s; H-
W I ffi
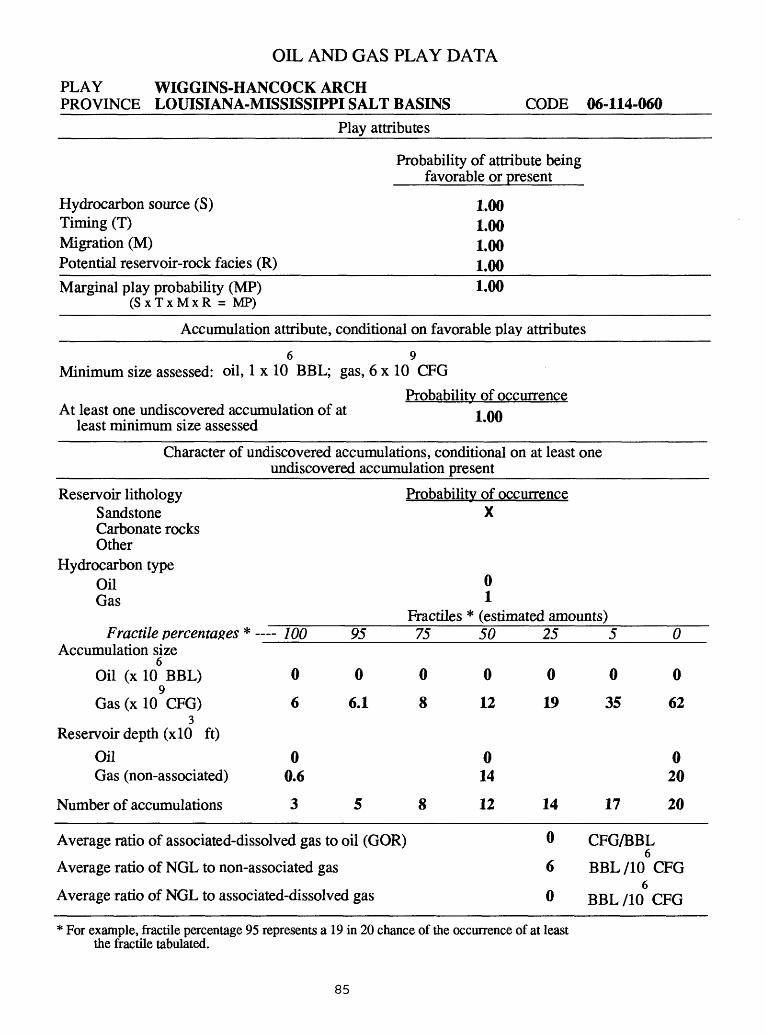
OIL AND GAS PLAY DATA
PLAY WIGGINS-HANCOCK ARCH PROVINCE LOUISIANA-MISSISSIPPI SALT BASINS CODE 06-114-060
Play attributes
Hydrocarbon source (S)Timing (T)Migration (M)Potential reservoir-rock facies (R)
Probability of attribute being favorable or present
1.001.001.001.00
Marginal play probability (MP) (SxTxMxR = MP)
1.00
Accumulation attribute, conditional on favorable play attributes
6 9 Minimum size assessed: oil, 1 x 10 BBL; gas, 6 x 10 CFG
Probability of occurrenceAt least one undiscovered accumulation of at
least minimum size assessed 1.00
Character of undiscovered accumulations, conditional on at least one undiscovered accumulation present
Reservoir lithology Sandstone Carbonate rocks Other
Hydrocarbon typeOil Gas
Fractile percentages * -Accumulation size
6 Oil (x 10 BBL)
9Gas (x 10 CFG)
3Reservoir depth (xlO ft)
OilGas (non-associated)
Number of accumulations
Probability of occurrence X
01
Fractiles * (estimated amounts)100 95 75
000
6 6.1 8
0 0.6
358
Average ratio of associated-dissolved gas to oil (GOR)
Average ratio of NGL to non-associated gas
Average ratio of NGL to associated-dissolved gas
50 25 5 0
0000
12 19 35 62
0 0 14 20
12 14 17 20
0 CFG/BBL6
6 BBL/10 CFG6
0 BBL/10 CFG
* For example, fractile percentage 95 represents a 19 in 20 chance of the occurrence of at least the fractile tabulated.
85

SMACKOVER PLAY (070)
This play is defined by oil and gas production from Upper Jurassic reservoirs in which trapping is largely related to structures along the Stateline Graben system, and to updip combination and stratigraphic traps mainly in the Smackover Formation. The play is located in northernmost Louisiana and southernmost Arkansas (fig. 29). The northern limit is defined by the South Arkansas fault zone, the eastern limit by the Monroe uplift, and southwestern limit by the Sabine uplift.
Reservoirs are all Late Jurassic in age, and include the Smackover, Buckner, and Haynesville Formations, and the Gray Sandstone (fig. 23). The Smackover reservoirs are medium- to coarse- grained oolitic grainstones deposited on east-west trending, elongate structural highs. Porosity of the grainstone reservoirs ranges from 6 to 14 percent, averaging 11.8 percent. Permeability ranges from 12 to 365 millidarcies, averaging 161 millidarcies. Extreme spatial variability in depositional and diagenetic fabrics leads to the observed ranges in porosity and permeability. Net pay thickness of these oolitic grainstone ranges from 10 to 323 ft, averaging 52 ft. Reservoirs of the Buckner Formation are fine- to medium- grained oolitic grainstones, with extreme spatial variability in porosity and permeability. Porosity averages 15 percent, and permeability averages 150 millidarcies. Net pay thickness of oolitic grainstone in the Buckner averages 48 ft. Reservoirs in the Haynesville Formation are also oolitic grainstones; porosity averages 12 percent. Thickness of net pay in these grainstones ranges from 19 to 120 ft, and averages 54 ft. Reservoirs in the Gray Sandstone are in sandstones of a submarine fan complex deposited basinward of the Smackover shelf margin. Porosity of the sandstones averages 13 percent, and permeability averages 1 millidarcy, The low permeability is due to the presence of pore-filling clays and dolomite. Net pay thickness ranges from 20 to 130 ft, and averages 65 ft.
Source rocks for hydrocarbons are generally considered to be the lime mudstones of the lower Smackover Formation, and basinal shales of the Buckner and Haynesville formations. Timing of hydrocarbon migration is not well constrained, but probably occurred early from the maturing shales and mudstones west of the play in the east Texas area.
Traps in the Smackover Formation are formed by northward pinch-outs of the oolitic sandstone bodies updip on topographic and anticlinal noses. In the south, trapping is associated with a zone of structures in the Stateline graben system, such as anticlines, faults, and folds. Seals are largely mudstones and shales of the Haynesville and Buckner Formations. Trapping in the Gray Sandstone is both structural and stratigraphic, and seals are largely basin-plain and distal-overbank mudstones. Drilling depths range from 9,300 to 12,500 ft.
Successful exploration in the play began with the discovery of the Haynesville Area field in 1921, and continued to 1982 with the discovery of Keoan field. Future potential of the play is estimated to be moderate for both oil and gas. Haynesville is the largest field in the play with known production of 192 MMBO, 405 BCFG, and 19.8 MMB of NGL. Total known hydrocarbon production is 326 MMBO, 1,421 BCFG, and 80 MMB of NGL.
86

H-
vQ O Hi cn
3
00

OIL AND GAS PLAY DATA
PLAY SMACKOVERPROVINCE LOUISIANA-MISSISSIPPI SALT BASINS CODE 06-114-070
Play attributes
Hydrocarbon source (S)Timing (T)Migration (M)Potential reservoir-rock facies (R)
Probability of attribute being favorable or present
1.001.001.001.00
Marginal play probability (MP) (SxTxMxR=MP)
1.00
Accumulation attribute, conditional on favorable play attributes
6 9 Minimum size assessed: oil, 1 x 10 BBL; gas, 6 x 10 CFG
Probability of occurrenceAt least one undiscovered accumulation of at
least minimum size assessed 1.00
Character of undiscovered accumulations, conditional on at least undiscovered accumulation present
one
Reservoir lithology Probability of occurrence Sandstone X Carbonate rocks X Other
Hydrocarbon typeOil 0-7 Gas 0-3
Fractiles * (estimated amounts)Fractile percentages * 100 95 75
Accumulation size6
Oil (x 10 BBL) 1 1.25 2.49
Gas (x 10 CFG) 6 7.5 133
Reservoir depth (xlO ft)Oil 9Gas (non-associated) 9
Number of accumulations 457
Average ratio of associated-dissolved gas to oil (GOR)
Average ratio of NGL to non-associated gas
Average ratio of NGL to associated-dissolved gas
50
4.5
28
1111
8
25
8
48
9
3400
93
0
5
16
90
11
0
27
160
1313
12
CFG/BBL6
BBL/106
BBL/10
CFG
CFG
* For example, fractile percentage 95 represents a 19 in 20 chance of the occurrence of at least the fractile tabulated.
88

ARKANSAS STRUCTURAL PLAY (080)
This play is characterized by oil and minor gas accumulations in Upper Jurassic post- Haynesville and various Cretaceous reservoirs in traps that are dominantiy structural, and are related to movement of the Louann Salt. The play extends from the Texas state line east to the Monroe uplift, north and east of the North Louisiana salt basin, and south of Arkansas State line (fig. 30).
Reservoirs are mainly sandstone, but include some carbonates. Upper Jurassic reservoirs are in the Cotton Valley Group and Schuler Formation. Porosity in these reservoirs ranges from 16 to 21 percent, and permeability ranges from 252 to 577 millidarcies. Net reservoir pay thickness ranges from 35 to 67 ft. Lower Cretaceous reservoirs are in the Hosston Formation (Travis Peak equivalent), Sligo Formation (Pettet equivalent), and Rodessa and Paluxy Formations. Porosity in these reservoirs ranges from 19 to 31 percent, and permeability ranges from 118 to 2,000 millidarcies. Net reservoir pay thickness ranges from 4 to 52 ft. Limestones that are productive in the play include those in the Sligo and Rodessa Formations, and the James Limestone. Upper Cretaceous reservoirs include sandstone in the Tuscaloosa Group and the Austin, Taylor, and Navarro Groups. Porosity in these reservoirs ranges from 27 to 31 percent, and permeability ranges from 112 to 3,401 millidarcies. Net reservoir pay thickness ranges from 2 to 39 ft.
Source rocks include dark lime mudstones of the lower Smackover Formation, shale in the Cotton Valley Group and Bossier Formation, and shale interbedded with sandstone in the Travis Peak, Rodessa, and Paluxy Formations. Basinal shale beds in the Upper Cretaceous Woodbine Group are considered to be source rocks for hydrocarbons in reservoirs ranging up to, and including the Upper Cretaceous Nacatoch Formation (fig. 29). Additional source rocks include shales, chalks, and marls of the Eagle Ford, Austin, Taylor, and Navarro Groups. The inception of salt movement in the Louann Salt probably had a profound influence on both the timing and generation of hydrocarbons, as well as on migration pathways. Most of the movement apparently occurred in the Upper Jurassic.
Traps in the play are largely structural, including anticlines, faulted anticlines, closures against faults, graben faults, and combination traps related to the movement of the Louann salt. Seals for the reservoir sandstones and limestones include enclosing shales, anhydrite beds, and non-porous limestones. Drilling depths range from 1,150 to 10,500 ft.
The play is fairly well explored and has a total of 70 oil and 16 gas fields. The initial oil discovery was in 1920 at the Eldorado field, and the first gas discovery was the Ada-Sibley field in 1936. Known hydrocarbon production from all fields in the play is 1,273 MMBO, 4,885 BCFG, and 107 MMB of NGL. Future potential for oil and gas is estimated to be low.
89

H-
03 3 6 0
Hi cn
rt o rt

OIL AND GAS PLAY DATA
PLAY ARKANSAS STRUCTURAL PROVINCE LOUISIANA-MISSISSIPPI SALT BASINS CODE 06-114-080
Play attributes
Hydrocarbon source (S)Timing (T)Migration (M)Potential reservoir-rock facies (R)
Probability of attribute being favorable or present
1.001.001.001.00
Marginal play probability (MP) (SxTxMxR = MP)
1.00
Accumulation attribute, conditional on favorable play attributes
6 9Minimum size assessed: oil, 1 x 10 BBL; gas, 6 x 10 CFG
Probability of occurrence At least one undiscovered accumulation of at
least minimum size assessed 1.00
Character of undiscovered accumulations, conditional on at least one undiscovered accumulation present
Reservoir lithology Sandstone Carbonate rocks Other
Hydrocarbon typeOil Gas
Probability of occurrenceX X
0.950.05
Fractiles * (estimated amounts)Fractile percentages *
Accumulation size6
Oil (x 10 BBL)9
Gas (x 10 CFG)3
Reservoir depth (x 1 0 ft)onGas (non-associated)
Number of accumulations
100
1
6
1.51.5
4
Average ratio of associated-dissolved gas to
95 75
1.1 1.4
6.1 8
5 7
oil (GOR)
50
2
12
5.55.5
8
Average ratio of NGL to non-associated gas
Average ratio of NGL to associated-dissolved gas
25
3
18
9
200
5
0
5
5.4
28
11
0
8.5
36
9.59.5
12
CFG/BBL6
BBL /106
BBL /10
CFG
CFG
* For example, fractile percentage 95 represents a 19 in 20 chance of the occurrence of at least the fractile tabulated.
91

ALABAMA MIOCENE PLAY (090)
The play is characterized by shallow, biogenic gas accumulations in structural-stratigraphic traps in Miocene shelf sandstone reservoirs. The play is limited to the lower coastal plain of Alabama, extending east-west from State offshore waters of the Florida Panhandle, Alabama and Mississippi to the province boundary (fig. 31).
Four Miocene reservoirs are included in the play: The Amos, Luce, Escambia, and Meyer Sandstone members of the Pensacola Clay. These sandstones were deposited in transitional marine, inner neritic, and middle neritic environments, and are now isolated sandstone bodies encased in shales. Porosity of the sandstones ranges from 21 to 35 percent. Lower porosities combined with high water saturations, small reservoir size, and low pressure all have a significant effect on the total volume of recoverable gas in these reservoirs.
Source rocks are claystones and shales underlying and surrounding the marine sandstones. The low level of maturity of the source rocks suggests a biogenic origin for the gas. Generation of gas probably began in the late Miocene, and continues to the present.
Structure plays a minor role in trapping and only to the extent that most accumulations are in sandstone bodies that drape across anticlinal noses. Most of the traps are the result of a combination of sandstone porosity pinchout against regional dip, and across subtle nosing trends. Seals are impermeable, encasing clays and shales. Known drilling depths range from 1,200 to 3,500ft.
Exploration in the play is relatively recent with the first gas discovery occurring in 1979 at the Foley field. Between 1981 and 1986,21 additional fields were found, and in 1987, 7 more fields were discovered. Cumulative production in the play was 1.4 BCFG. Future gas potential is estimated as moderate.
92

U>
H 9 O Hi
>
H
V tr

OIL AND GAS PLAY DATA
PLAY ALABAMA MIOCENEPROVINCE LOUISIANA-MISSISSIPPI SALT BASINS CODE 06-114-090
Play attributes
Hydrocarbon source (S)Timing (T)Migration (M)Potential reservoir-rock facies (R)
Probability of attribute being favorable or present
1.001.001.001.00
Marginal play probability (MP) (SxTxMxR = MP)
1.00
Accumulation attribute, conditional on favorable play attributes
6 9 Minimum size assessed: oil, 1 x 10 BBL; gas, 6 x 10 CFG
Probability of occurrenceAt least one undiscovered accumulation of at I QQ
least minimum size assessed
Character of undiscovered accumulations, conditional on at least one undiscovered accumulation present
Reservoir lithology Sandstone Carbonate rocks Other
Hydrocarbon typeOil Gas
Probability of occurrence X
01
Fractiles * (estimated amounts)Fractile percentages *
Accumulation size6
Oil (x 10 BBL)9
Gas (x 10 CFG)3
Reservoir depth (xlO ft)OilGas (non-associated)
Number of accumulations
wo
0
6
01.2
12
Average ratio of associated-dissolved gas to
95 75
0 0
6.4 8.4
16 21
oil (GOR)
50
0
12
02
25
Average ratio of NGL to non-associated gas
Average ratio of NGL to associated-dissolved gas
25
0
18
30
0
0
0
5
0
28
40
0
0
36
03.5
60
CFG/BBL6
BBL/106
BBL/10
CFG
CFG
* For example, fractile percentage 95 represents a 19 in 20 chance of the occurrence of at least the fractile tabulated.
94

SABINE UPLIFT GAS PLAY (100)
This play is charcterized by accumulations in gas-prone Upper Jurassic and Lower Cretaceous reservoirs in structural, stratigraphic, and combination traps along the flanks and crest of the Sabine uplift. The play is located on the crest and east flank of the Sabine uplift, and extends from the Texas state line east to the western edge of the synclinal axis of the North Louisiana salt basin, and from the Stateline graben system on the north to the Angelina-Caldwell flexure on the south (fig. 32).
Reservoirs in the play are mainly sandstone in the Lower Cretaceous Hosston Formation (Travis Peak equivalent) and Upper Jurassic Cotton Valley Group. Porosity in these sandstones ranges from 8.5 to 20 percent, averaging 14.4 percent, and permeability ranges from 3 to 250 millidarcies, averaging 84 millidarcies. Net reservoir pay thickness ranges from 8 to 772 ft, averaging 118 ft. Up to eight additional Jurassic and Cretaceous reservoirs are productive in the play. Limestone reservoirs in the Mooringsport Formation are minor and produce from two fields.
Source rocks most likely are the shale beds interbedded with sandstone of the Cotton Valley Group. Other hydrocarbon source rocks include dark lime mudstones of the lower Smackover Formation and organic-rich shale in the Bossier Formation. Upper Jurassic source rocks probably entered the oil-generation window in Early Cretaceous time, and migration occurred up the flanks of the uplift in Cretaceous and Tertiary time.
Traps are structural, stratigraphic, and combination. Structures on the eastern crest and western flank of the Sabine uplift are broad and gently sloping. Stratigraphic traps are formed by sandstones enclosed and sealed by shales. Combination traps, the most common in the play, are formed by facies changes across structural noses. Drilling depths range from 5,000 to 14,000 ft.
Exploration has been extensive over a long period of time, with a total of 53 gas fields in the play. The first gas discovery occurred in 1922 at the Cotton Valley field, the largest field (cummulative production of 62.5 MMBO, 1,380 BCFG, and 141 MMB of NGL) in the play. Liquid hydrocarbons have an average API gravity of 53.9°. The first of 17 oil fields was found in 1904 at the Caddo Lake field. Known hydrocarbon production was 16,769 BCFG, 521 MMBO, and 534 MMB of NGL. Future gas potential of the play is good to excellent.
95

H-
Co
to o Hi en
DJ cr H-
H-
Hi
ft

PLAY PROVINCE
OIL AND GAS PLAY DATA
SABINE UPLIFT GAS LOUISIANA-MISSISSIPPI SALT BASINS CODE 06-114-100
Play attributes
Hydrocarbon source (S)Timing (T)Migration (M)Potential reservoir-rock facies (R)
Probability of attribute being favorable or present
1.001.001.001.00
Marginal play probability (MP) (SxTxMxR = MP)
1.00
Accumulation attribute, conditional on favorable play attributes
6 9 Minimum size assessed: oil, 1 x 10 BBL; gas, 6 x 10 CFG
Probability of occurrenceAt least one undiscovered accumulation of at I QQ
least minimum size assessed
Character of undiscovered accumulations, conditional on at least one undiscovered accumulation present
Reservoir lithology Sandstone Carbonate rocks Other
Hydrocarbon typeOil Gas
Probability of occurrenceX X
01
Fractiles * (estimated amounts)Fractile percentages *
Accumulation size6
Oil (x 10 BBL)9
Gas (x 10 CFG)3
Reservoir depth (xlO ft)OilGas (non-associated)
Number of accumulations
100
0
95 75
0 0
6 6.6 10
05
30 40 50
50
0
17
09
60
Average ratio of associated-dissolved gas to oil (GOR)
Average ratio of NGL to non-associated gas
Average ratio of NGL to associated-dissolved gas
25
0
37
75
0
30
0
5
0
150
90
0
0
700
013
100
CFG/BBL6
BBL /106
BBL/10
CFG
CFG
* For example, fractile percentage 95 represents a 19 in 20 chance of the occurrence of at least the fractile tabulated.
97

SABINE UPLIFT OIL PLAY (110)
The play is defined by oil accumulations in combination structural and stratigraphic traps in Lower and Upper Cretaceous carbonates, sandstone and minor chalk reservoirs on the Sabine uplift. The play is located on the eastern flank and crest of the Sabine uplift, and extends from the Texas State line east to the western edge of the north Louisiana salt basin, and south from the Stateline graben system to the Angelina-Caldwell flexure (fig. 33).
Reservoirs are dominated by carbonates of the lowermost Cretaceous, and a few reservoirs are in carbonates of the Fredericksburg, Austin, Taylor, and Navarro Groups. Reservoirs from the Sligo through Rodessa Formations are predominantly shallow water, open-shelf oolitic and skeletal carbonate deposits, and sandstone of a delta plain environment. Porosity in these reservoirs ranges from 5 to 25 percent, and permeability ranges from .3 to 41 millidarcies. Net reservoir pay thickness ranges from 7 to 91 ft. Porosity in carbonate reservoirs in the Rodessa Formation ranges from 12 to 21 percent, and permeability ranges from 4 to 20 millidarcies. Fractured chalk in the Saratoga and Annona Formations of the Taylor Group forms reservoirs in a few fields.
Source rocks are believed to be dark lime mudstone of the lower Smackover Formation, organic-rich shale and mudstone of Early Cretaceous age, and shale and chalk of Late Cretaceous age. As the source rocks are in close proximity to the reservoirs, short-distance migration has been postulated. Oil in chalk reservoirs of the Taylor Group probably migrated upward through sandstone beds of the Ozan Formation from deeper source rocks. Seals overlying some chalk reservoirs are shale beds in the Midway Group, indicating that migration must have taken place in the Tertiary after the shale had been compacted to form impervious seals.
Traps are largely combination, with structural components such as closure against faults, anticlines, faulted anticlines, and faulted structural arches acting in concert with facies changes in most reservoirs. Sandstone reservoir beds grade laterally and vertically into dense shale beds which act as seals. Drilling depths range from about 1,000 to 7,500 ft.
The play is relatively well explored with a total of 53 fields, including 18 gas fields. The largest field is Caddo-Pine Island, discovered in 1904, which has recoverable quantities of 385 MMBO, 312 BCFG, and 4.3 MMB of NGL. The initial gas discovery was at the Spider field in 1914; the most recent gas discovery was the San Miguel field in 1979. Total production from all fields in the play is 817 MMBO, 3,333 BCFG, and 26 MMB of NGL. Future potential is estimated to be moderate.
98

g n> OJ
OJ O i-h cn ju tr H-
H-
i-h
ft O H-
I-1

OIL AND GAS PLAY DATA
PLAY SABINE UPLIFT OILPROVINCE LOUISIANA-MISSISSIPPI SALT BASINS CODE 06-114-110
Play attributes
Hydrocarbon source (S) Timing (T) Migration (M) Potential reservoir-rock facies (R)
Marginal play probability (MP) (SxTxMxR = MP)
Accumulation attribute,
Probability of attribute being favorable or present
1.00 1.00 1.00 1.001.00
conditional on favorable play attributes
6 9Minimum size assessed: oil, 1 x 10 BBL; gas, 6 x 10 CFG
Probability of occurrenceAt least one undiscovered accumulation of at I QQ
least minimum size assessed
Character of undiscovered accumulations, conditional on at least one _________________undiscovered accumulation present_________
Reservoir lithology Probability of occurrence Sandstone X Carbonate rocks X Other
Hydrocarbon typeOil 1Gas 0
Fractiles * (estimated amounts)Fractile percentages * 100 95 75
Accumulation size6
Oil (x 10 BBL) 1 1.2 29
Gas (x 10 CFG) 0003
Reservoir depth (x 10 ft)Oil 1.5Gas (non-associated) 0
Number of accumulations 10 12 16
Average ratio of associated-dissolved gas to oil (GOR)
Average ratio of NGL to non-associated gas
Average ratio of NGL to associated-dissolved gas
50
3.5
0
3.50
20
25
6
0
25
3300
0
0
5 0
12 20
0 0
7.50
32 40
CFG/BBL6
BBL /10 CFG6
BBL/10 CFG
* For example, fractile percentage 95 represents a 19 in 20 chance of the occurrence of at least the fractile tabulated.
100

MONROE UPLIFT PLAY (120)
This play is defined almost entirely by a gas accumulation in a structural trap in fractured chalk reservoir beds of the Monroe "Gas Rock" (Upper Cretaceous Navarro Group) along the crest of the complexly truncated Monroe uplift, which is located at the juncture of the States of Louisiana, Mississippi, and Arkansas (fig. 34). The main gas reservoir is the Monroe "Gas Rock," which is porous and fractured chalk. Porosity of the fractured chalk averages 25 percent, and net reservoir pay thickness ranges from 25 to 42 ft. The one oil field in the play produces from a 15-ft. thick sandstone reservoir in the Nacatoch Formation that averages 28 percent porosity and 1,150 millidarcies permeability, with a secondary reservoir in the Monroe "Gas Rock."
Source rocks are generally considered to be shale in the Upper Cretaceous Austin Group and Eagle Ford Formation that underlies the chalk reservoir. Greater than normal geothermal gradients resulting from igneous activity associated with the Monroe uplift may have contributed significantly to the thermal maturation and generation of gas. The regional high formed by the complexly truncated Monroe uplift constitutes the basic trapping mechanism. The uplift is the result of probably four episodes of uplift, erosion, and truncation beginning in latest Triassic time and culminating in localized uplift in the Eocene (Claiborne Group). The latter resulted in the termination of the Monroe "Gas Rock" to the west and the establishment of the overall trap.
The play has had extensive exploration, however, only three fields have been found. Dominating the play is the giant Monroe field that was discovered in 1916. Known, ultimately recoverable gas in this one field is 7,530 BCFG, 0.010 MMBO, and 0.035 MMB of NGL. The other gas field in the play, the Epps field, which was discovered in 1928, has an ultimate recovery of 37.2 BCF of dry gas. One oil accumulation was found in 1947. Ultimate recovery from this field is 10.5 MMBO and 1.0 BCFG. Total known recoverable hydrocarbons are 10.56 MMBO, 7,568 BCFG, and 0.035 MMB of NGL. Future potential of the play is estimated to be low.
101

0>
00 SF O
Hi
H-
Hi
ft
O
NJ

PLAY PROVINCE
OIL AND GAS PLAY DATA
MONROE UPLIFT LOUISIANA-MISSISSIPPI SALT BASINS CODE 06-114-120
Play attributes
Hydrocarbon source (S)Timing (T)Migration (M)Potential reservoir-rock facies (R)
Probability of attribute being favorable or present
1.001.001.001.00
Marginal play probability (MP) (SxTxMxR = MP)
1.00
Accumulation attribute, conditional on favorable play attributes
6 9 Minimum size assessed: oil, 1 x 10 BBL; gas, 6 x 10 CFG
Probabilit of occurrence At least one undiscovered accumulation of at
least minimum size assessedI
Character of undiscovered accumulations, conditional on at least one undiscovered accumulation present
Reservoir lithology Sandstone Carbonate rocks Other
Hydrocarbon typeOil Gas
Probability of occurrence X
0
Fractiles * (estimated amounts)Fractile percentages * 100 95 75
Accumulation size6
Oil (x 10 BBL) 0009
Gas (x 10 CFG) 6 6.2 7.23
Reservoir depth (x 1 0 ft)
Oil 0Gas (non-associated) 2
Number of accumulations 234
Average ratio of associated-dissolved gas to oil (GOR)
Average ratio of NGL to non-associated gas
Average ratio of NGL to associated-dissolved gas
50
0
9
02.5
5
25
0
12
6
0
0
0
5
0
16
7
0
0
18
03
8
CFG/BBL6
BBL /106
BBL/10
CFG
CFG
* For example, fractile percentage 95 represents a 19 in 20 chance of the occurrence of at least the fractile tabulated.
103

SELECTED REFERENCES
Region 6. Gulf Coast
(112) Western Gulf basinFoote, R.Q., Massingill, L.M., Wells, R.H., Dolton, G.L., and Ball, M.M., 1992, Geologic framework for petroleum assessment of the Western Gulf basin, Province 112: U.S. Geological Survey Open-File Report 89-450B, 34 p. $5.25 paper, $4.00 microfiche.
(113) East Texas basinFoote, R.Q., Massingill, L.M., and Wells, R.H., 1989, Petroleum geology and the distribution of conventional crude oil, natural gas, and natural gas liquids, East Texas basin: U.S. Geological Survey Open-File Report 88-450K, 118 p. $18.75 paper, $4.00 micofiche.
(114) Louisiana-Mississippi Salt basinsFoote, R.Q., Wells, R.H., Massingill, L.M., and Ball, M.M., in press, Petroleum geology and the distribution of conventional crude oil, natural gas, and natural gas liquids, Louisiana-Mississippi salt basins, Province 114, U.S. National Assessment, 1988: U.S. Geological Survey Open-File Report 89-450F.
104

TAB
LE 1
.-R
egio
n 6
Gul
f C
oast
. E
stim
ates
of
undi
scov
ered
rec
over
able
con
vent
iona
l oi
l, ga
s, a
nd n
atur
al g
as li
quid
s (N
GL
)in o
nsho
re
prov
ince
s by
pla
y.
Pro
vinc
e an
d re
gion
tota
ls a
re g
iven
.
Mea
n va
lue
tota
ls m
ay n
ot b
e eq
ual t
o t
he s
ums
of
the
com
pone
nt m
eans
bec
ause
num
bers
hav
e be
en i
ndep
ende
ntly
rou
nded
. F
ract
ile v
alue
s (F
95,
FS)
are
not
addi
tive
and
repr
esen
t es
timat
es w
ith a
19
in 2
0 ch
ance
and
a 1
in
20 c
hanc
e, r
espe
ctiv
ely,
of
at
leas
t th
ese
tabu
late
d es
timat
es.
Gas
inc
lude
s bo
th n
onas
soci
ated
and
ass
ocia
ted-
diss
olve
d ga
s.
Neg
l., n
eglig
ible
qua
ntity
; -,
no e
stim
ate.
]C
rude
Oil
(Mill
ions
of
Bar
rels
)F9
5F5
Mea
n
Tot
al G
as
(Bill
ions
of
Cub
ic F
eet)
F95
FSM
ean
NG
L (M
illio
ns o
f B
arre
ls)
F95
F5M
ean
1 1 2
W
este
rn G
ulf
Bas
in020
03
0040
05
0060
070
080
090
100
110
120
130
150
300
310
320
330
1 1 3
E
ast
020
030
040
050
080
090
320
330
SE T
ex.-
Sou
th L
a. S
alt
Sou
th T
ex.-L
a. R
eef
Sou
th T
exas
Cha
lk O
ilS
outh
Tex
as C
halk
Gas
Tusc
aloo
sa- W
ood
bine
Sou
ther
n M
aver
ick
Bas
inLo
uisi
ana
Cha
lk G
asW
ilcox
Nor
ther
n M
aver
ick
Bas
inS
outh
Tex
as U
pper
Eoc
ene
Frio
-Ana
huac
-Mio
cene
Loui
sian
a C
halk
Oil
So.
Tex.
Olig
ocen
e-M
ioce
neO
ther
Occ
urre
nces
>1
MM
BOO
ther
Occ
urre
nces
>6
BCFG
Oil
<1 M
MB
Gas
<6
BCF
Pro
vinc
e T
otal
1
Texa
s B
asin
Mex
ia-T
alco
Fau
lt Zo
neT
yler
Bas
inW
oodb
ine-
Eag
le F
ord
Cot
ton
Val
ley
Bas
emen
t S
truc
ture
Sal
t A
ntic
lines
Oil
<1 M
MB
Gas
<6
BCF
790.
50.
033
9.7
0.0
40.6 0.0
0.0
22.2 5.9
10.9 0.0
0.0
137.
220
.9 0.0
243.
40.
0
,589
.3
13.3
36.3
42.3 0.0
3.3
7.2
93.2 0.0
2,1
92
.6 0.0
1,15
3.3
0.0
263.
90.
00.
076
.571
.172
.1 0.0
374.
84
07
.813
9.0
0.0
372.
50.
0
5,1
56.0
47.9
246.
725
3.8
0.0
35.5
36.3
171.
60.
0
1,38
1.3
0.0
670.6 0.0
122.
70.
00.
044.2
27.2
33.0 0.0
155.
524
9.9
63.6 0.0
303.6 0.0
3,05
1.7
27.2
112.
112
0.2
0.0
14.9
18.3
128.
60.
0
13,9
87.0
16.7
1,08
7.0
247.
21,
188.
672
.6 0.0
4,8
87.9
99.6
250.
7807.4 0.0
10,6
32.0
41.8
49.1
85
2.0
4,7
91
.9
38
,70
7.0
26.6
330.
178
.527
5.3
12.9
146.
710
7.1
581.7
34,2
43.0
119.
03,6
90.4
662.
23,
812.
727
1.2
728.3
12,6
50.0
672.
665
3.6
1,92
8.5
1,19
9.4
29,0
61.0
277.
964
7.9
1,30
3.6
7,7
34
.0
99
,78
8.0
95.7
96
7.4
535.
31,
061.
196
.761
2.9
197.
31,
021.
3
22,7
10.4
53.3
2,14
6.0
423.
12,
266.
615
2.1
306.
68,
198.
930
6.4
422.
31,
292.
3497.6
18,4
17.9
127.
324
2.6
1,06
2.7
6,15
2.5
64,7
78.2
54.4
596.
124
3.1
587.
942
.632
9.6
147.
978
2.1
395.3 0.1
108.
724
.748.4 1.8
0.0
49.5 0.2
4.1
4.8
0.0
265.
80.
50.
50.
011
9.8
1,01
9.2
0.3
10.8 2.6
3.0
1.5
12.2 0.0
29.1
988.5 0.8
369.0
66.2
154.
06.
872
.812
7.7
1.0
10.7
11.6
30.0
726.5 3.6
6.5
0.0
193.
4
2,7
76.9 1.
232
.919
.711
.716
.942.4 0.0
51.1
649.8 0.4
21
4.6
42.3
91.9 3.8
30.7
82.9 0.5
6.9
7.8
12.4
46
0.4 1.7
2.4
0.0
153.
8
1,76
2.2
0.7
19.9 8.6
6.5
6.6
24.4 0.0
39.1
Pro
vinc
e T
otal
183.
3 79
3.8
42
1.3
1,
506.
3 4
,58
7.7
2,
783.
856.4
176.
3 10
5.8

TAB
LE 1
. R
egio
n 6
Gul
f C
oast
. E
stim
ates
of
undi
scov
ered
rec
over
able
con
vent
iona
l oi
l, ga
s, a
nd n
atur
al g
as li
quid
s (N
GL
)in o
nsho
re
prov
ince
s by
pla
y.
Pro
vinc
e an
d re
gion
tot
als
are
give
n-C
ontin
ued
O
CTi
Cru
de O
il ( M
illio
ns o
f B
arre
ls}
F95
FSM
ean
Tot
al G
as
(Bill
ions
of
Cub
ic F
eet)
F95
FSM
ean
NG
L (M
illio
ns o
f B
arre
ls)
F95
F5
Mea
n
114
Loui
sian
a-M
issi
ssip
pi S
alt
Bas
ins
02
00
30
04
00
50
06
00
70
08
00
90
100
110
120
320
330
Sal
t B
asin
Dee
pP
icke
ns-P
olla
rd F
ault
Bas
in S
truc
tura
lS
alt
Bas
inW
iggi
ns-H
anco
ck A
rch
Sm
acko
ver
Ark
ansa
s S
truc
tura
lA
laba
ma
Mio
cene
Sab
ine
Upl
ift G
asS
abin
e U
plift
Oil
Mon
roe
Upl
iftO
il <1
MM
BG
as <
6 BC
F
0.0
18.9
96.4
65.9 0.0
13.8
10.1 0.0
0.0
52.4 0.0
233.
50.
0
0.0
71.7
216.
023
7.1
0.0
64.1
29.3 0.0
0.0
166.
40.
037
7.3
0.0
0.0
40.0
148.
713
4.8
0.0
33.2
18.1 0.0
0.0
99.3 0.0
300.
00.
0
4,46
1.1 8.0
174.
735
.282
.096
.5 1.5
205.
41,
725.
117
2.9
25.4
373.
77
58
.4
14,8
03.0
30.1
369.
112
6.9
30
5.6
343.
725
.660
4.7
5,37
8.7
548.
971
.560
3.6
1,38
8.7
8,6
84.8
16.8
260.
672
.117
1.5
196.
28.
937
1.9
3,23
3.6
327.
744
.8480.0
1,04
3.8
446.
1 1
0.7
2.6
1.2
0.5
5.0 Neg
l.0.
051
.8 4.7
0.0
0.0
56.9
,480.3 2.6
5.5
4.3
1.8
24.1 0.1
0.0
161.
414
.8 0.0
0.0
104.
2
868.5 1.4
3.9
2.5
1.0
12.3 Neg
l0.
097.0 8.8
0.0
0.0
78.3
Pro
vinc
e T
otal
REG
ION
TOTA
L
481.
1 1,
159.
5 77
4.1
8,0
61.0
24,5
93.0
2,42
9.9
6,74
2.2
4,24
7.1
51
,21
9.0
1
23
,61
0.0
14,9
12.6
56
6.6
1,7
98.8
1,
073.
7
82,4
74.6
1,
801.
0 4
,45
4.7
2,9
41.8