petrology 53 9 cover - china university of geosciences · petrology volume 53 number 9 september...
TRANSCRIPT

JOURNAL OFPETROLOGYVOLUME 53 NUMBER 9 SEPTEMBER 2012
JOURNAL OFPETROLOGYVOLUME 53 NUMBER 9 SEPTEMBER 2012
www.petrology.oxfordjournals.org
ISSN 1460-2415 (ONLINE)ISSN 0022-3530 (PRINT)
jo
ur
na
l o
f p
etr
olo
gy
VO
LUM
E 53 NU
MB
ER 9 SEP
TEM
BER
2012
1767 R. SPIESS, R. DIBONA, E. RYBACKI, R. WIRTH AND G. DRESENDepressurized Cavities within High-strain Shear Zones: their Role in the Segregation and Flow of SiO2-rich Melt in Feldspar-dominated Rocks
1777 J. ANDÚJAR AND B. SCAILLETExperimental Constraints on Parameters Controlling the Difference in the Eruptive Dynamics of Phonolitic Magmas: the Case of Tenerife (Canary Islands) [S]
1807 Z.-F. YANGCombining Quantitative Textural and Geochemical Studies to Understand the Solidification Processes of a Granite Porphyry: Shanggusi, East Qinling, China [S]
1837 R. R. ALMEEV, T. BOLTE, B. P. NASH, F. HOLTZ, M. ERDMANN AND H. E. CATHEYHigh-temperature, low-H2O Silicic Magmas of the Yellowstone Hotspot: an Experimental Study of Rhyolite from the Bruneau–Jarbidge Eruptive Center, Central Snake River Plain, USA [S]
1867 D. W. PEATE, I. U. PEATE, M. C. ROWE, J. M. THOMPSON AND A. C. KERRPetrogenesis of High-MgO Lavas of the Lower Mull Plateau Group, Scotland: Insights from Melt Inclusions [S]
1887 S. M. LIMA, F. CORFU, A. M. R. NEIVA AND J. M. F. RAMOSDissecting Complex Magmatic Processes: an in-depth U–Pb Study of the Pavia Pluton, Ossa–Morena Zone, Portugal [S]
1913 A. C. HUNT, I. J. PARKINSON, N. B. W. HARRIS, T. L. BARRY, N. W. ROGERS AND M. YONDONCenozoic Volcanism on the Hangai Dome, Central Mongolia: Geochemical Evidence for Changing Melt Sources and Implications for Mechanisms of Melting [S]
1943 O. PLÜMPER, S. PIAZOLO AND H. AUSTRHEIMOlivine Pseudomorphs after Serpentinized Orthopyroxene Record Transient Oceanic Lithospheric Mantle Dehydration (Leka Ophiolite Complex, Norway) [S]
[S] Contains supplementary data available at Journal of Petrology online.
petrology_53_9_Cover.indd 1petrology_53_9_Cover.indd 1 16-08-2012 11:55:5016-08-2012 11:55:50

Journal of PetrologyExecutive EditorMARJORIEWILSONEARTH SCIENCES, SCHOOL OF EARTH AND ENVIRONMENT,UNIVERSITYOF LEEDS, LEEDS LS2 9JT, UKE-mail: [email protected]
Editorial ManagerALASTAIR LUMSDENEARTH SCIENCES, SCHOOL OF EARTH AND ENVIRONMENT,UNIVERSITYOF LEEDS, LEEDS LS2 9JT, UKPhone and Fax: 44 (0) 1937 573595E-mail: [email protected]
Editorial BoardJ. S. BEARDVIRGINIA MUSEUM OF NATURAL HISTORY, 21 STARLING AVENUE,MARTINSVILLE,VA 24112, USAE-mail: [email protected]
W. A. BOHRSONDEPARTMENT OF GEOLOGICAL SCIENCES, CENTRAL WASHINGTONUNIVERSITY, 400 E UNIVERSITY WAY, ELLENSBURG,WA 98926, USAE-mail: [email protected]
G. CLARKESCHOOL OF GEOSCIENCES FO5, UNIVERSITY OF SYDNEY, NSW 2006,AUSTRALIAE-mail: [email protected]
C. DEVEYDYNAMIK DES OZEANBODENS, FACHBEREICH 4, WISCHHOFSTRASSE1-3, D-24148 KIEL, GERMANYE-mail: [email protected]
B. R. FROSTDEPARTMENT OF GEOLOGY AND GEOPHYSICS, UNIVERSITY OFWYOMING, LARAMIE,WY 82071, USAE-mail: [email protected]
J. GAMBLESCHOOL OF GEOGRAPHY, ENVIRONMENT AND EARTH SCIENCES,VICTORIA UNIVERSITY OF WELLINGTON, P.O. BOX 600, WELLINGTON,NEW ZEALANDE-mail: [email protected]
R. GIERE¤UNIVERSITA« T FREIBURG, INSTITUT FU« R MINERALOGIE,PETROLOGIE UND GEOCHEMIE, ALBERTSTRASSE, 23B, D-79104,FREIBURG I. BR., GERMANYE-mail: [email protected]
JO« RG HERMANNRESEARCH SCHOOL OF EARTH SCIENCES, INSTITUTE OFADVANCED STUDIES, THE AUSTRALIAN NATIONAL UNIVERSITY, 0200,CANBERRA, AUSTRALIAE-mail: [email protected]
R. C. PRICETHE UNIVERSITY OF WAIKATO, SCIENCE & ENGINEERING, PRIVATEBAG 3105, HAMILTON, NEW ZEALANDE-mail: [email protected]
A. SKELTONDEPARTMENT OF GEOLOGICAL SCIENCES, STOCKHOLM UNIVERSITY,STOCKHOLM SE-106 91, SWEDENE-mail: [email protected]
S. TURNERDEPARTMENT OF EARTH AND PLANETARY SCIENCES,MACQUARIE UNIVERSITY, SYDNEY, NSW 2109, AUSTRALIAE-mail: [email protected]
D.WEISDEPARTMENT OF EARTH AND OCEAN SCIENCES,THE UNIVERSITYOF BRITISH COLUMBIA, 6339 STORES ROAD,VANCOUVER, BRITISH COLUMBIA, CANADAV6T 1Z4E-mail: [email protected]
G.WO« RNERGEORG AUGUST UNIVERSITA« T GO« TTINGEN,GOLDSCHMIDTSTRASSE 1, GO« TTINGEN, 37077, GERMANYE-mail: [email protected]
Production EditorK. COLDWELLOXFORD UNIVERSITY PRESS, GREAT CLARENDON STREET,OXFORD OX2 6DP, UKE-mail: [email protected]
http://www.petrology.oxfordjournals.orghttp://earth.leeds.ac.uk/jpet/jpet.html
Advisory BoardR. ARCULUSAUSTRALIAN NATIONALUNIVERSITY, AUSTRALIA
N. T. ARNDTUNIVERSITE¤ DE GRENOBLE, FRANCE
G. BERGANTZUNIVERSITYOF WASHINGTON, USA
K. BUCHERUNIVERSITA« T FREIBURG, GERMANY
J. DAVIDSONUNIVERSITYOF DURHAM, UK
G. R. DAVIESVRIJEUNIVERSITEITAMSTERDAM
J. G. FITTONUNIVERSITYOF EDINBURGH, UK
D. GEISTUNIVERSITYOF IDAHO, USA
S. HARLEYUNIVERSITYOF EDINBURGH, UK
B. D. MARSHJOHNS HOPKINS UNIVERSITY, USA
E.-R. NEUMANNUNIVERSITETET I OSLO, NORWAY
I. A. NICHOLLSMONASH UNIVERSITY, AUSTRALIA
I. PARSONSUNIVERSITYOF EDINBURGH, UK
J. A. PEARCEUNIVERSITYOF WALES, CARDIFF, UK
J. M. RHODESUNIVERSITYOF MASSACHUSETTS, USA
S. SORENSENSMITHSONIAN INSTITUTE, USA
B. G. J. UPTONUNIVERSITYOF EDINBURGH, UK
Manuscripts should be sent to the Executive Editor or to any member of the EditorialBoard.
� OXFORD UNIVERSITY PRESS 2012.
Cover illustration: from Giere¤ , R., Rumble, D., Gu« nther, D., Connolly, J. andCaddick, M.J., Journal of Petrology 52, 2293^2334.Large staurolite crystals in muscovite-rich metapelites from Campolungo,Central Alps (Switzerland). The yellowish crystals overgrow two foliations:the main schistosity (S2), oriented at a low angle to the long edge of the leftcrystal, and the younger crenulation cleavage (S3), delineated by muscoviteand ilmenite and oriented diagonally across the image (from lower left toupper right). S3 represents an axial plane cleavage of the folded S2.Width of photomicrograph is 4.3 mm. Image taken in plane-polarized light atthe University of Freiburg, Germany.
All rights reserved: no part of this publication may be reproduced, stored ina retrieval system, or transmitted in any form or by any means, electronic,mechanical, photocopying, recording, or otherwise without either the priorwritten permission of the Publisher, or a licence permitting restricted copyingissued in the UK by the Copyright Licensing Agency Ltd, 90 TottenhamCourt Road, London W1P 9HE, or in the USA by the Copyright ClearanceCenter, 222 Rosewood Drive, Danvers, MA 01923.

SubscriptionsA subscription toJournal of Petrology comprises 12 issues. All prices includepostage, and for subscribers outside the UK delivery is by Standard Air.Journal of PetrologyAdvance Access contains papers that have recently beenaccepted/reached corrected proof stage, but have not yet been includedwithin an issue. Advance Access is updated regularly.
Annual Subscription Rates (Volume 53, 12 issues, 2012)Institutional
Print edition and site-wide online access: »1094/$2191/E1643Print edition only: »1003/$2009/E1506Site-wide online access only: »912/$1826/E1369Personal
Print edition: »515/$1030/E773
Please note: US$ rate applies to US & Canada, E applies to Europe,» applies to UK and Rest of World. For a complete listing please visitwww.oxfordjournals.org/petroj/access_purchase/price_list.htmlFull prepayment, in the correct currency, is required for all orders. Ordersare regarded as firm and payments are not refundable. Subscriptionsare accepted and entered on a complete volume basis. Claims cannot beconsidered more than FOUR months after publication or date of order,whichever is later. All subscriptions in Canada are subject to GST.Subscriptions in the EU may be subject to European VAT. If registered,please supply details to avoid unnecessary charges. For subscriptions thatinclude online versions, a proportion of the subscription price may be subjectto UK VAT. Personal rate subscriptions are only available if payment ismade by personal cheque or credit card and delivery is to a private address.The current year and two previous years’ issues are available from OxfordUniversity Press. Previous volumes can be obtained from the PeriodicalsService Company, 11 Main Street, Germantown, NY 12526, USA. Email:[email protected]. Tel: +1 (518) 537 4700. Fax: +1 (518) 537 5899.
For further information, please contact: Journals Customer ServiceDepartment, Oxford University Press, Great Clarendon Street, OxfordOX2 6DP, UK. Email: [email protected]. Tel (and answerphoneoutside normal working hours): +44 (0)1865 353907. Fax: +44 (0) 1865353485. In the US, please contact: Journals Customer ServiceDepartment, Oxford University Press, 2001, Evans Road, Cary, NC 27513,USA. Email: [email protected]. Tel (and answerphone outside normalworking hours): 800 852 7323 (toll-free in USA/Canada). Fax: 919 677 1717.In Japan, please contact: Journals Customer Services, OxfordUniversity Press, Tokyo, 4-5-10-8F Shiba, Minato-ku, Tokyo 108-8386,Japan. Email: [email protected]. Tel: +81 3 5444 5858. Fax: +81 3 34542929.
Methods of payment. (i) Cheque (payable to Oxford University Press,to Oxford University Press, Cashiers Office, Great Clarendon Street,Oxford OX2 6DP, UK) in GB» Sterling (drawn on a UK bank), US$Dollars (drawn on a US bank), or EUE Euros. (ii) Bank transfer toBarclays Bank Plc, Oxford Group Office, Oxford (bank sort code 20-65-18) (UK), overseas only Swift code BARC GB 22 (GB» Sterling toaccount no. 70299332, IBAN GB89BARC2065187029933; US$ Dollarsto account no. 66014600, IBAN GB27BARC2065186601460; EUE Eurosto account no. 78923655, IBAN GB16BARC20651878923655). (iii) Creditcard (Mastercard,Visa, Switch or American Express).
Oxford Journals Environmental and Ethical PoliciesOxford Journals is committed to working with the global communityto bring the highest quality research to the widest possible audience.Oxford Journals will protect the environment by implementingenvironmentally friendly policies and practices wherever possible. Pleasesee http://www.oxfordjournals.org/ethicalpolicies.html for further infor-mation on Oxford Journals’ environmental and ethical policies.
Journal of Petrology is published monthly by Oxford University Press,Oxford, UK. Annual subscription price is »1094/$2191/E1643. Journal ofPetrology is distributed by Mercury Media Processing, 1634 E. ElizabethAve., Linden, NJ 07036, USA. Periodicals postage paid at Rahway, NJand at additional entry points.US Postmaster: send address changes toJournal of Petrology (0022-3530), c/oMercury Media Processing, 1634 E. Elizabeth Ave., Linden, NJ 07036,USA.
For information about DOIs and to resolve them, please visit http://www.doi.org/.
PermissionsFor information on how to request permissions to reproduce articles/information from this journal, please visit www.oxfordjournals.org/access_purchase/rights_permissions.html
AdvertisingAdvertising, inserts and artwork enquiries should be addressed toAdvertising and Special Sales, Oxford Journals, Oxford University Press,Great Clarendon Street, Oxford, OX2 6DP, UK. Tel: +44 (0)1865 354767;Fax +44 (0)1865 353774; E-mail: [email protected].
DisclaimerStatements of fact and opinion in the articles in Journal of Petrology arethose of the respective authors and contributors and not of Journal ofPetrology or Oxford University Press. Neither Oxford University Pressnor Journal of Petrology make any representation, express or implied, inrespect of the accuracy of the material in this journal and cannot acceptany legal responsibility or liability for any errors or omissions that may bemade. The reader should make his/her own evaluation as to the appro-priateness or otherwise of any experimental technique described.
� Journal of Petrology 2012
All rights reserved; no part of this publication may be reproduced, storedin a retrieval system, or transmitted in any form or by any means, electro-nic, mechanical, photocopying, recording, or otherwise without prior writ-ten permission of the Publishers, or a licence permitting restricted copyingissued in the UK by the Copyright Licensing Agency Ltd, 90 TottenhamCourt Road, London W1P 9HE, or in the USA by the CopyrightClearance Center, 222 Rosewood Drive, Danvers, MA 01923.
Typeset by Glyph International, Bangalore, IndiaPrinted by C.O.S. Printers Pte Ltd, Singapore
Instructions to AuthorsThese instructions are intended only as a preliminary guide tointending authors. For detailed instructions, please refer to theJournal’s web site at http://www.petrology.oxfordjournals.org
Scope and policy of the Journal of PetrologyTheJournal of Petrology provides an international forum for the publicationof high quality research in the broad field of igneous and metamorphicpetrology and petrogenesis. Papers published cover a wide range of topicsincluding:
� major element, trace element and isotope geochemistry andgeochronology applied to petrogenesis
� experimental petrology� processes of magma generation, differentiation and emplacement� regional studies of igneous and metamorphic rocks which contribute to
the solution of fundamental petrological problems� theoretical modelling of petrogenetic processes� quantitative studies of rock-forming minerals and their paragenesis
Papers must be written clearly and concisely in English. The normalmaximum length is 12,000 words, including equivalent space fortables and figures, but longer papers can be accepted, provided that thelength is justified by the scientific argument presented in the paper.However, authors are encouraged to submit papers which are substantiallyshorter than the normal maximum length.
Papers submitted for review should report original and unpublishedwork that is not under consideration for publication elsewhere in anylanguage. If previously published illustrations, tables, figures or morethan 200 words of text are to be included, the written permission of thecopyright holder must be obtained and sent to the editor.
Every paper which passes initial Editorial scrutiny is reviewed by atleast two independent reviewers selected by the Editors. Authors shouldinclude the names and addresses of three appropriate reviewers with theirmanuscript submission. Reviewers’ reports are carefully considered bythe Editors before making decisions concerning publication, major orminor revision or rejection.
Manuscripts must be submitted online via http://mc.manuscriptcentral.com/oup/jpet.

JOURNALOF PETROLOGYVOLUME 53 NUMBER 9 SEPTEMBER 2012
CONTENTS
1767 RICHARD SPIESS, RAFFAELLA DIBONA, ERIK RYBACKI, RICHARD WIRTH &GEORG DRESENDepressurized Cavities within High-strain Shear Zones: their Role in the Segregation and Flow of SiO2-richMelt in Feldspar-dominated Rocks
1777 JOAN ANDU¤ JAR & BRUNO SCAILLETExperimental Constraints on Parameters Controlling the Difference in the Eruptive Dynamics of PhonoliticMagmas: the Case of Tenerife (Canary Islands) [S]
1807 ZONG-FENG YANGCombining QuantitativeTextural and Geochemical Studies to Understand the Solidification Processes of aGranite Porphyry: Shanggusi, East Qinling, China [S]
1837 RENAT R. ALMEEV, TORSTEN BOLTE, BARBARA P. NASH, FRANC� OIS HOLTZ,MARTIN ERDMANN & HENRIETTA E. CATHEYHigh-temperature, low-H2O Silicic Magmas of theYellowstone Hotspot: an Experimental Study of Rhyolitefrom the Bruneau^Jarbidge Eruptive Center, Central Snake River Plain, USA [S]
1867 DAVID W. PEATE, INGRID UKSTINS PEATE, MICHAEL C. ROWE, JAY M. THOMPSON &ANDREW C. KERRPetrogenesis of High-MgO Lavas of the Lower Mull Plateau Group, Scotland: Insights from MeltInclusions [S]
1887 S. M. LIMA, F. CORFU, A. M. R. NEIVA & J. M. F. RAMOSDissecting Complex Magmatic Processes: an in-depth U^Pb Study of the Pavia Pluton, Ossa^Morena Zone,Portugal [S]
1913 A. C. HUNT, I. J. PARKINSON, N. B. W. HARRIS, T. L. BARRY, N. W. ROGERS &M. YONDONCenozoicVolcanism on the Hangai Dome, Central Mongolia: Geochemical Evidence for Changing MeltSources and Implications for Mechanisms of Melting [S]
1943 OLIVER PLU« MPER, SANDRA PIAZOLO & H—KON AUSTRHEIMOlivine Pseudomorphs after Serpentinized Orthopyroxene RecordTransient Oceanic Lithospheric MantleDehydration (Leka Ophiolite Complex, Norway) [S]
[S] Contains supplementary data available atJournal of Petrology online.
Please visit the journal’s World Wide Web site at http://petrology.oxfordjournals.org/subscriptions/index.dtl. Activate your subscription at http://www3.oup.co.uk/Register.Keep up-to-date with the latest contents of Journal of Petrology by registering forour email alerting service at http://petrology.oxfordjournals.org/cgi/alerts.etoc. Thisservice is freely available to all, no subscription required.

Combining QuantitativeTextural andGeochemical Studies to Understand theSolidification Processes of a Granite Porphyry:Shanggusi, East Qinling, China
ZONG-FENG YANG*STATE KEY LABORATORY OF GEOLOGICAL PROCESSES AND MINERAL RESOURCES, CHINA UNIVERSITY OF
GEOSCIENCES, BEIJING, 100083, CHINA
RECEIVED APRIL 1, 2011; ACCEPTED MAY 2, 2012ADVANCE ACCESS PUBLICATION JUNE 22, 2012
Igneous rock textures reflect the cooling history of the parental
magma. Combined with chemical data, they can provide physical
and chemical information about the evolution of a magma body.The
petrographic textures and chemical compositions of 21 coarse- and
fine-grained granite samples along an �250 m horizontal outcrop
of the Shanggusi granite porphyry are presented in this case study.
The coarse-grained granite porphyry is an early intrusion, and the
fine-grained granite dykes, mostly intruded into the granite porphyry,
are later intrusions. The studied samples have nearly homogeneous
major element bulk-rock and mineral compositions, but show large
variations in their trace element compositions and textural character-
istics.The trace element data suggest the influence of hydrous fluids
(possibly enriched in CO2, F, and Cl) in the evolution of the plutonic
body.Textural analysis of the coarse-grained granite porphyry indi-
cates that the crystal size distribution (CSD) slopes, intercepts and
total numbers of groundmass decrease from the center to the margin
of the intrusion in contrast to the maximum diameter of the crystals
(Lmax) (average length of the four largest quartz crystals for each
sample); however, most fine-grained samples and the groundmass of
the coarse-grained samples show concave-down CSDs, indicating
textural coarsening. Quartz CSDs in the coarse-grained samples are
kinked, with a steep-sloped log^linear section representing small
crystals (51mm) and a shallow-sloped log^linear section represent-
ing large crystals (41mm).These two crystal populations are inter-
preted as resulting from a shift in cooling regime. The straight
CSDs of two fine-grained samples may be due to a different cooling
history. In general, the spatial variation of the CSD patterns can be
attributed to various degrees of overgrowth and mechanical
compaction. The quartz phenocrysts in several coarse-grained sam-
ples exhibit a high degree of alignment, which may be the result of
magmatic flow. By integrating the field geology, geochemistry and
quantitative textural data from the horizontal profile of the
Shanggusi granite porphyry, it is suggested that hydrous fluids at
the top of the intrusion not only controlled the fractionation of elem-
ents but also affected its cooling history. Fluid migration-controlled
undercooling can explain the solidification processes in the
Shanggusi intrusion, and may also be prevalent in other fluid-rich
shallow intrusions. Quantitative integration of textural and geo-
chemical data for igneous rocks can contribute to our understanding
of the relationships between physical and chemical processes in a
magma system, and provide relatively comprehensive insights into
the petrogenesis of granites.
KEY WORDS: Shanggusi; granite porphyry; solidification processes;
crystal size distributions; fluids; undercooling
I NTRODUCTIONA fundamental issue in igneous petrology is to understandthe magma solidification process, and in particular to clar-ify which physical and chemical processes control the char-acteristics of the final product. Typically, a variety ofcomplex magma solidification processes can be investi-gated by studying suites of comagmatic rocks that have dif-ferent chemical and textural characteristics. However, it is
*Corresponding author. E-mail: [email protected]
� The Author 2012. Published by Oxford University Press. Allrights reserved. For Permissions, please e-mail: [email protected]
JOURNALOFPETROLOGY VOLUME 53 NUMBER 9 PAGES1807^1835 2012 doi:10.1093/petrology/egs034 by guest on A
ugust 21, 2012http://petrology.oxfordjournals.org/
Dow
nloaded from

difficult to examine and verify the physical processes ofmagma solidification in terms of traditional geochemicaland qualitative petrographic studies, especially for crystalnucleation and growth, which, to a large extent, are inde-pendent of the chemical composition of the system.Depending on their cooling history, magmas with thesame composition can solidify into rocks with dramaticallydifferent physical appearances. For example, equigranulargranite, granite porphyry and rhyolite show three differentsolidification processes in their textural characteristics,whilst having similar chemical compositions. Thus, if wewish to understand the textural differences within a singlecompositional type of rock in order to constrain the cool-ing history and solidification processes, the textures of therocks need to be quantified.In recent years, following the work of Marsh (1988), who
first introduced the theory of crystal size distributions(CSDs) for magmatic systems, quantitative textural ana-lysis of igneous rocks combined with their geochemicalstudy has been increasingly applied to investigate mag-matic processes (e.g. Cashman & Marsh, 1988; Mocket al., 2003; Boorman et al., 2004; Higgins, 2006a; Higgins& Roberge, 2007; Morgan et al., 2007; O’Driscoll et al.,2007; Salisbury et al., 2008; Higgins & Meilleur, 2009;Pappalardo & Mastrolorenzo, 2010; Vinet & Higgins,2010). Some magmatic processes, such as magma flow(e.g. Higgins, 2002a), compaction and compaction-drivenrecrystallization (e.g. Boorman et al., 2004; Williams et al.,2006), and textural coarsening (e.g. Higgins, 1998, 1999,2009; Higgins & Roberge, 2003; Magee et al., 2010) arebetter examined by quantitative textural studies ratherthan geochemical studies. In particular, textural coarsen-ing of igneous rocks, which may be as important a processas fractional crystallization, does not change the chemicalcomposition of the rocks and can be investigated only byquantitative textural analysis (Higgins, 2011, and referencestherein).The solidification of magma is a result of a complex
interplay between crystallization and dissolution (e.g.Higgins & Roberge, 2003; Armienti et al., 2007). Crystalnucleation, growth and dissolution are strongly dependenton the degree of undercooling, which in turn is controlledby both the actual crystallization temperature and theliquidus temperature. The undercooling of magma in achamber can be modified by addition of hotter magma, orby the reduction of total or partial pressure during ascentof the magma. When a pulse of magma begins to crystal-lize, and the liquidus temperature of the residual melt isreduced only within a very limited range as the result ofcrystallization that continually changes the crystallizingmelt composition, the undercooling in different locationsin the magma chamber is mainly controlled by the actualcrystallization temperature, which has a close relationshipwith the isotherms. Such cooling histories have been
theoretically modeled and verified by the spatial texturalvariation of natural samples (e.g. Zieg & Marsh, 2002;Nkono et al., 2006; Patwardhan & Marsh, 2011). However,the liquidus temperature of the melt typically can be sig-nificantly changed by variations in fluid content or fluidcirculation in the magma or residual magma, giving riseto variations in the degree of undercooling. If the changein the undercooling of a magma chamber mainly resultsfrom the variation of the liquidus temperature rather thanthat of the actual temperature (e.g. Higgins, 2002a), thetextural variations within the plutonic body would not beconsistent with those predicted from the isotherms. In add-ition, the migration and accumulation of fluids may resultin chemical fractionation within the magma body. Hence,combining quantitative textural and geochemical studiesmay help us to investigate such processes.In this study, observations were made of the field geol-
ogy, mineralogy and petrology, and were combined withquantitative textural and geochemical analysis of theShanggusi granite porphyry.The results show that the spa-tial variations in the CSD parameters are not consistentwith those controlled by isotherms: the center of the intru-sion has a much higher undercooling than its margins. Itis argued that this phenomenon is closely related to the mi-gration and heterogeneous accumulation of fluids at thetop of the intrusion, which might also play an importantrole in chemical variation within the intrusion.
GEOLOGICAL SETT ING ANDSAMPLE DESCR IPT IONSGeology of the Qinling^Dabie orogenThe Qinling^Dabie orogen extends more than 1500 kmacross central China (Fig. 1a). The western segment iscalled the Qinling region and the eastern segment iscalled the Dabie region. The Qinling^Dabie orogen com-prises two sutures and three blocks (Meng & Zhang, 1999,2000). The Shangdan suture separates the North ChinaBlock (including the North Qinling belt) from theQinling microplate (the South Qinling belt), and theMianlue suture separates the Qinling microplate fromthe South China Block. The Shangdan suture is generallyconsidered to have formed following subduction of theShangdan ocean and multi-stage accretion of the SouthQinling belt to the North Qinling belt. The suture repre-sents a Middle Palaeozoic subduction^collision event fol-lowed by Mesozoic^Cenozoic intraplate strike-slipfaulting (Mattauer et al., 1985; Zhang et al., 1989;Ratschbacher et al., 2003; Wang et al., 2005). The Mianluesuture was formed by the Triassic collision between theSouth Qinling belt and the South China Block (Zhanget al., 2004). The North Qinling belt, bounded by theMachaoyin fault zone and the Shangdan suture (Fig. 1a),is composed predominantly of Proterozoic to Palaeozoic
JOURNAL OF PETROLOGY VOLUME 53 NUMBER 9 SEPTEMBER 2012
1808
by guest on August 21, 2012
http://petrology.oxfordjournals.org/D
ownloaded from

medium-grade metasedimentary and metavolcanic rocks.The Qinling complex constitutes the Precambrian base-ment of the Qinling^Dabie orogen (Hu et al., 1993; Youet al., 1993; Wang et al., 2003). The South Qinling belt is
bounded to the north by the Shangdan suture and to thesouth by the Mianlue suture (Fig.1), and comprises a thickpile of Late Proterozoic to Triassic sediments overlying anEarly Proterozoic crystalline basement. Three pulses of
Fig. 1. (a) General geological map of the Qinling^Dabie orogen showing its regional tectonic setting (after Meng & Zhang, 2000) and thelocation of the Shanggusi intrusion (outlined by black square); MF, Machaoyin fault; MS, Mianlue suture; SS, Shangdan suture.(b) Geological map of the Shanggusi area showing the major lithological units and the location of the studied granite porphyry (after Yanget al., 2011).
YANG SHANGGUSI GRANITE PORPHYRY SOLIDIFICATION
1809
by guest on August 21, 2012
http://petrology.oxfordjournals.org/D
ownloaded from

granitoid magmatism and Mo mineralization have beenrecognized, corresponding to significant tectonic events inthe East Qinling^Dabie oregen (e.g. Mao et al., 2008).
Geology of the Shanggusi granite porphyryand samplingThe Shanggusi granite porphyry, situated in the southernmargin of the North China Block, is a newly discoveredporphyry-type molybdenum deposit in east Qinling(Yang et al., 2011) (Fig. 1a). Re^Os dating of disseminatedmolybdenite in the Shanggusi granites yields emplacementages ranging from 122·5 (�2·1) Ma to 124·8 (�1·8) Ma(Yang et al., 2010). Figure 1b shows the fundamental
geological characteristics of the Shanggusi granite por-phyry. It covers an area of c. 1·5 km2 bounded by thegranodiorite to the north, pantellerite to the SW andgneiss to the east. A number of granite dykes occur withinor surround the granite porphyry body; most of them areemplaced into the pantellerite (Fig. 1b). A profile c. 250mlong in the southern part of the granite porphyry outcropwas investigated and sampled in the field (Fig. 2).Evidence for magmatic fluid phase exsolution is pro-
vided by miarolitic cavities (e.g. Candela, 1997) within theoutcrop (Fig. 2a^f). These cavities consist mainly of quartzand alkali feldspar (Fig. 2d), and commonly also containpyrite, which is usually altered to brown limonite at both
Fig. 2. Field photographs and sample locations across the Shanggusi outcrop profile. (a, b) Miarolitic cavities that contain altered pyrite; theseoccur in both sides of the profile. (c) A representative granite dyke (right) intruded into the granite porphyry; the contact is curved and indis-tinct (note the disseminated molybdenite in the coarse-grained granite porphyry). (d) A large miarolitic cavity showing reddish-brown alkalifeldspar surrounding quartz. (e) Representative photograph of unaltered pyrite in the coarse-grained granite porphyry. (f) Miarolitic cavities,without significant amount of pyrite, at the center of the profile. The pens shown for scale are �14 cm in length. The coin for scale is �2·4 cmin diameter.
JOURNAL OF PETROLOGY VOLUME 53 NUMBER 9 SEPTEMBER 2012
1810
by guest on August 21, 2012
http://petrology.oxfordjournals.org/D
ownloaded from

ends of the profile (Fig. 2a^e). In contrast, pyrite or otherore minerals are rare in the center of the profile, and onlya few miarolitic cavities were observed there (Fig. 2f).Twenty-one samples were collected from the profile.
These were preliminarily divided into two categoriesbased on their qualitative petrographic characteristics inthe field. The sample set includes 13 coarse-grained sam-ples that contain quartz and feldspar phenocrysts andeight fine-grained samples without phenocrysts. Amongthese samples are six fine-grained samples collected fromgranite dykes that are emplaced into the granite porphyryor the adjacent pantellerite. The exact locations of eachsample and typical field petrographic characteristics areindicated in Fig. 2.The major rock-forming minerals in all the samples
are quartz (20^40%), alkali feldspar (25^40%) andNa-plagioclase (30^50%). Figure 3 shows representativepetrographic characteristics of the coarse-grained samples.The striking porphyritic texture typically shows resorption
of quartz and alkali feldspar phenocrysts. The rounded,embayed morphology of quartz can be clearly seen undercrossed polars (Fig. 3a, c and d); resorption of perthiticalkali feldspar, surrounded by subsequent overgrowthrims, is more easily seen when a wave plate with a retard-ation of 137 nm is inserted into the polarizing microscope(Fig. 3b). The petrographic characteristics of thefine-grained samples are discussed in more detail below.
ANALYT ICAL METHODSCrystal size distributionsCSD theory
If the number of crystals (per unit size range) in an igne-ous rock is plotted against their relative size, in asemi-logarithmic fashion, many rocks show remarkablysmooth, often linear trends with negative slopes. This rela-tionship can be explained by CSD theory, which allowscrystal size data to be used as a method of determining
Fig. 3. Representative photomicrographs showing the textural characteristics of the granite porphyry. (a) Typical phenocrysts of quartz andalkali feldspar (perthite). Quartz phenocrysts are rounded and show embayments because of resorption. (b) Magnified view of (a) with inser-tion of a wave plate with a retardation of 137 nm.The perthite shows an overgrowth rim and does not show embayments like the quartz pheno-crysts. (c) Typical rounded embayment in a quartz phenocryst. The magnified view in (d) clearly shows the eutectic crystallization offine-grained quartz and feldspar in the resorbed region of the quartz phenocryst. Mi, microlite; Per, perthite; Pl, plagioclase; Qz, quartz.
YANG SHANGGUSI GRANITE PORPHYRY SOLIDIFICATION
1811
by guest on August 21, 2012
http://petrology.oxfordjournals.org/D
ownloaded from

some of the crystallization kinetics of magmatic systems in-dependent of experimental approaches or thermodynamicor kinetic models (e.g. Cashman & Marsh, 1988; Resmini& Marsh, 1995; Marsh, 1998, 2007; Higgins, 2002a, 2011;Higgins & Roberge, 2003; Boorman et al., 2004; Higgins& Chandrasekharam, 2007; Resmini, 2007; Moss et al.,2010). CSD theory is based on a parameter called popula-tion density, which is used to develop the general crystalpopulation balance equation.To establish the crystal popu-lation balance in a magma body, the number of crystals ofa given size, per unit volume of magma, the populationdensity (n), must be known as a function of crystal size(L). A plot of ln(n) vs L for a steady-state system, which iscontinuously fed and emptied, will be a line with a slopeof �1/Gt and intercept n0, where G represents the growthrate, t is the residence (or growth) time and n0 is the finalnucleation density (when crystal size approximates tozero) (Marsh, 1988, 1998). If either the residence time orthe growth rate is known, the other may be determined.Although the above formulation was developed forsteady-state systems, it can be shown that for a non-steady-state, batch-cooling, model, in which the magma isnot allowed input or output of crystals, and under certainconditions (e.g. exponentially increasing nucleation ratewith a constant growth rate), the relation has the sameform as the steady-state model (Marsh, 1988, 1998). Themost important assumption of the two end-member CSDmodels is constant crystal growth rate (G). Kinking orcurvature in CSD plots has been attributed to processessuch as crystal accumulation and removal (e.g. Marsh,1988, 1998), compaction (e.g. Boorman et al., 2004), mixingof crystal populations (e.g. Higgins, 1996; Turner et al.,2003; Vinet & Higgins, 2010) and post-nucleation crystalageing caused by annealing or Ostwald ripening (e.g.Higgins, 1998, 1999, 2002a, 2011; Higgins & Roberge, 2003).
Method
All the samples contain three major crystal populations ofquartz, alkali feldspar, and Na-plagioclase. Among these,quartz was chosen for quantitative textural analysis as it isthe most abundant phenocryst phase in the granite por-phyry. Furthermore, it is the most resistant one topost-alteration and therefore may preserve its originalgrain morphology. The other minerals are not sufficientlyfresh in thin section for accurate textural analysis.Regular thin sections were used for textural analysis andthe methods used generally follow those presented byHiggins & Roberge (2003). We first prepared digitizedimages, examples of which are shown in Figs 4 and 5. Toidentify and outline the quartz crystals more accurately, awave plate with a retardation of 137 nm was inserted intothe polarizing microscope (Fig. 4c). For touching crystalsthat are at extinction or have the same interference colorin the digitized images, the quartz crystals were identifiedby rotating the microscope stage as shown in Fig. 6.
This procedure was carried out only to increase the accur-acy of analysis. More than 300 crystals were analyzed ineach sample. The greyscale image was analyzed using theprogram ImageJ, a Java version of the popular programNIHImage. The raw positional data were reduced to inter-section parameters using a specially written program. TheCSD of crystals was calculated with the programCSDCorrections 1.38 (Higgins, 2000).The mean crystal shape is expressed by the crystal
aspect ratio S:I:L (short:intermediate:long dimensions).The shape aspect ratio Short/Intermediate is estimatedfrom the mode of the distribution of intersection widths/intersection lengths (Higgins, 1994, 2000). The ratioIntermediate/Long is more complicated to determine;simple modeling of populations of parallelepipeds hasbeen shown to yield imprecise results for some crystalshapes (Garrido et al., 2001; Higgins, 2006a). The CSDSlice
program of Morgan & Jerram (2006) calculates a best fitfor the 2D aspect ratios and compares these directly withcurves for known crystal shapes. However, the calculatedCSD volume using the aspect ratio determined from thismethod always yields a significantly higher volume thanthat determined from the total area of the intersectionsmeasured, which might result from the complicated crystalshapes of quartz (e.g. Mock & Jerram, 2005). Thus, theratio Intermediate/Long is estimated by comparison be-tween the quartz volumetric proportion determined fromthe total area of the intersections measured and the volu-metric proportion determined from the CSD (e.g.Higgins, 2002b). The crystal shapes of quartz used in thisstudy range from 1:1·54:1·54 to 1:1·96:1·96 based on the aver-age aspect ratio for each sample (Table 1). The crystalswere considered to have a roundness of 0·6 or 0·7.Logarithmic length intervals were used such that each binis 100·125, 100·167 and 100·2 times the size of the previous binaccording to the crystal number and the accuracy of eachCSD plot. Bins with fewer than five crystals were removedfrom the CSD as they are not precise. The lower limit ofthe CSD is the smallest crystal that could be easily mea-sured, typically 0·05mm, and not the smallest crystals inthe rock.Because the CSDs of the fine-grained samples
determined here are only slightly curved on a classicalCSD diagram [S-type distribution of Higgins (2006b)],meaningful values for the slope and intercept of the CSDcould be determined by linear regression using the meth-ods of Higgins (2006b). The ‘goodness of fit’, Q, is a param-eter that describes how well the data fit to a straight line,taking into account the error in each point. Avalue greaterthan 0·1 indicates a very significant fit, but values greaterthan 0·01 are acceptable (Higgins, 2006b). The strongestcurved CSDs will have very small values of Q. It is easierto understand CSD dynamics if the characteristic lengths(CL¼�1/slope) are considered rather than the slopes, as
JOURNAL OF PETROLOGY VOLUME 53 NUMBER 9 SEPTEMBER 2012
1812
by guest on August 21, 2012
http://petrology.oxfordjournals.org/D
ownloaded from

they have the units of length. For crystals that have a per-fect semi-logarithmic size distribution, the characteristiclength is equal to the mean size.
Spatial distribution patternsAnalysis of the spatial distribution of crystals in rocks isanother method of quantifying igneous texture (e.g.Jerram et al.,1996). Such analysis can be used to understandwhether crystals are clustered or randomly distributed,and has implications for discerning between differingmodels of the crystallization of igneous rocks (Jerramet al., 1996, 2003). Furthermore, experimental work hasidentified characteristic trends for mechanical compaction,sorting and overgrowth on spatial distribution plots(Jerram et al., 1996).A method for quantifying the spatial distribution pat-
tern (SDP) of grains and crystals in thin section, by calcu-lating an R value, where R is a quantification of the SDP,was introduced by Jerram et al. (1996). In a random distri-bution of points, R¼1·0; R41·0 indicates an orderedarray of points whereas R51·0 indicates a clustered arrayof points (see Jerram et al., 1996).
Alignment factorTo obtain the degree of alignment of the quartz crystals inthe granite porphyry, the AF (alignment factor) is calcu-lated on the 40 largest grains in each sample followingBoorman et al. (2004) and Williams et al. (2006), as thelarger grains primarily define the foliation in these rocks.An AF of 100 indicates perfect alignment of the crystalsand a value of zero indicates a random arrangement withno alignment (e.g. Boorman et al., 2004;Williams et al., 2006).
Geochemical analysisTwenty-one representative samples selected for major andtrace element analysis were reduced to chips after removalof altered surfaces. The chips were then pulverized intopowders using agate mortars. Bulk-rock major and traceelement compositions were determined at the ChineseAcademy of Geological Sciences. Major elements weredetermined by X-ray fluorescence (XRF); ferrous ironwas determined by a wet chemical method. The accuraciesof the XRFanalyses are estimated to be 1% for SiO2, 2%for other major oxides present in concentrations greaterthan 0·5wt %, and 5% for minor oxides present in
Fig. 4. Representative characteristics of sample S-7-7A in a stitched photomicrograph and digitized image. (a, b, c) Optical photomicrographunder crossed polars, plane polars and crossed polars with wave plate of 137 nm respectively. (d) Digitized outlined image of quartz, wherethe region outlined in black was used for the textural analysis of the groundmass; the scale bar represents 2mm. This sample shows a distinctcrystal size contrast between the phenocrysts and the groundmass. The phenocrysts mainly consist of quartz (note some of them are resorbedwith rounded morphology) and alkali feldspar.
YANG SHANGGUSI GRANITE PORPHYRY SOLIDIFICATION
1813
by guest on August 21, 2012
http://petrology.oxfordjournals.org/D
ownloaded from

concentrations between 0·01 and 0·5wt %. Trace elementabundances were determined by inductively coupledplasma-mass spectrometry (ICP-MS), following Dulski(1994). The accuracies of the ICP-MS analyses are esti-mated to be better than 5% (relative) for most elements.Mineral compositions were determined using a JXA-8100
electron microprobe at the Analytical Laboratory, BeijingResearch Institute of Uranium Geology. Analytical condi-tions involved an acceleration voltage of 20 kV, a beam cur-rent of 10 nA, beam diameter of 2^5mm, and countingtimes of 10^20 s for peaks and 5 s for background for eachelement. Measured data were corrected by the ZAFmethod. Relative analytical uncertainty is51%.
RESULTSMineral chemistryElectronic Appendix 1çdata (available for downloadingat http://www.petrology.oxfordjournals.org) presents the
microprobe data for the major and accessory rock-formingminerals in the granite porphyry and granite dykes. Theplagioclase in all of the samples is albite, ranging fromAn0·89Ab98·8 to An6·29Ab92·7 and from An0·2Ab99·4 toAn3·9Ab95·6 for the fine- and coarse-grained samples re-spectively (Table 1 of Electronic Appendix 1çdata). Thealkali feldspars are all K-feldspars, with chemical compos-itions that vary from Ab5·1Or94·9 to Ab2·8Or97·2 and fromAb6·1Or93·7 to Ab1·7Or98·3 for the fine- and coarse-grainedsamples respectively.The accessory minerals are mainly hematite, pyrite,
rutile, zircon, apatite, niobite and bastnasite (Fig. 7). Theirchemical compositions are shown in Table 3 of ElectronicAppendix 1 and indicate that the accessory minerals maybe the main carrier of trace elements. Rare muscovite isan iron-rich ferrimuscovite (Table 2 of ElectronicAppendix 1)
CSD dataCSD data for all the samples are presented inTable 1 andCSD plots are illustrated in Fig. 8. The outlined images ofquartz crystals and raw data output from theCSDCorrections 1.38 program for all the samples are pro-vided in Electronic Appendix 1çdata and Appendix2çdigitized images.The CSD curves for all the samples have negative slopes
and turn down at the lower size bins on the semilogarith-mic CSD diagrams (Fig. 8a^d). If the concave-down partsof the lower size bins are not considered, the CSDs of thefine-grained samples all have Q40·01 (Table 1), andhence have a very significant fit to a straight line (Fig. 8a).The coarse-grained samples, except sample S-7-3 andS-7-8, have curved to concave-up CSDs (Q50·01)(Fig. 8b). However, because there were not sufficient largequartz crystals outlined for these two samples, in whichmany more quartz phenocrysts are present, the two sam-ples are also considered have curved to concave-up CSDs(Q50·01) (Fig. 8c). When the CSD data for thefine-grained samples and the groundmass of thecoarse-grained samples are plotted on cumulative distribu-tion function (CDF) diagrams (Higgins, 2006b), theyclearly show log-normal CSDs (L-CSD) (Fig. 8e). Thecurved concave-up CSDs of the coarse-grained samplesare similar to fractal CSDs (F-CSD) (Higgins, 2006b) ifthe concave-down parts are not considered (Fig. 8f).However, here two separate straight CSDs for the ground-mass and phenocrysts of the coarse-grained samples areobserved (Fig. 8c). These straight CSDs typically demon-strate the textural characteristics of the granite porphyry.CSD shapes and ranges are fairly consistent for thecoarse- and fine-grained samples, respectively, but withlocal deviations from the main trend. The notable excep-tions are the CSDs of the fine-grained samples S-7-4 andS-12-4, which are highlighted in Fig. 8. The CSDs of these
Fig. 5. Representative photomicrographs and outlined quartz imagesfor coarse- and fine-grained samples. (a^c) Samples from the graniteporphyry; (d) a sample from a granite dyke. (a) and (c) arecoarse-grained samples; (b) and (d) are fine-grained samples;(c) has the most well-developed porphyritic texture; (b) and(d) have an almost equigranular texture; (a) has intermediate tex-tural characteristics between (b) [or (d)] and (c). The regions in(a) and (c) outlined in black were used for textural analysis of thegroundmass; scale bars in these outlined images represent 2mm.
JOURNAL OF PETROLOGY VOLUME 53 NUMBER 9 SEPTEMBER 2012
1814
by guest on August 21, 2012
http://petrology.oxfordjournals.org/D
ownloaded from

two samples neither significantly turn down at smallercrystal lengths, nor show curved, concave-up shapes; theycan therefore be called straight CSDs (S-CSD) (Higgins,2006b).To fully illustrate and understand the quantitative tex-
tural characteristics for all the samples, the CSD datahave been divided into three groups; group 1 comprisesthe fine-grained samples (Fig. 8a); group 2 are the pheno-crysts of the coarse-grained samples (Fig. 8c); group 3comprises the groundmass of the coarse-grained samples(Fig. 8d).A general fundamental and universal equation that
uniquely relates CSD slope and intercept has been givenby Zieg & Marsh (2002) and Marsh (2007) as
lnðn0Þ ¼ 4 lnðSÞ � lnðCÞ ð1Þ
where ln(n0) is the intercept and S is the absolute value ofthe slope of the CSD. C is a modal normalization factor
and can be obtained from the following equation (Zieg &Marsh, 2002):
NT �L3 ¼ C�1 ð2Þ
where NTand �L are the total number and mean length ofthe crystals in the sample. When NT �L3 is compared withthe observed modal abundance of quartz (XQz) in the sam-ples from this study (Fig. 9a), there is a clear correlation:
NT �L3 ¼ 0 � 41XQz ¼ C�1: ð3Þ
In Fig. 9b equations (1) and (3) are used to explore theShanggusi quartz CSD data. All the samples have valuesof C in the range of 6^30, corresponding to XQz of 0·08^0·41.The coarse-grained samples are all fairly uniform with
24^39% quartz crystals up to 4mm long. The porphyritictexture is expressed as strongly curved and concave-up
Fig. 6. Photomicrographs to illustrate how touching quartz crystals are separated by changing their interference color. In both (a) and (c) thetouching crystals have the same interference color and separation is difficult; however, it becomes easier to outline each of the touching crystalswhen their interference color is changed by rotating the microscope stage.
YANG SHANGGUSI GRANITE PORPHYRY SOLIDIFICATION
1815
by guest on August 21, 2012
http://petrology.oxfordjournals.org/D
ownloaded from

Table1:
TexturalparametersoftheShanggusigraniteporphyrysamples
Sam
ple
Distance
(m)
AR1
AR2
Number
AF
Roundness
Area
(mm
2)
RLmax
(mm)
Vol.
phase
(%)
CSD
volume
(%)
Reg
ression
volume
(%)
Intercep
tError
(1s)
Slope
Error
(1s)
CL
Total
number
(cm�3)
Goodness
of
fit(Q
)
s-3-2
�25
1·82
2693
2·7
0·6
204·9
1·21
1·10
21·0
22·0
24·09
5·54
0·12
�7·05
0·29
0·142
11200
0·0444
s-3-3
�25
1·82
1·89
679
31·3
0·6
211·3
1·22
1·12
22·3
22·1
25·83
5·75
0·15
�7·31
0·32
0·137
9830
0·0566
s-7-4
901·54
1·91
353
21·4
0·6
247·3
1·20
2·08
35·9
45·7
39·13
2·61
0 ·13
�3·14
0·15
0·318
3180
0·2788
s-7-5
961·54
1·91
535
11·1
0·6
235·6
1·26
1·87
27·9
34·2
32·95
4·27
0·15
�4·96
0·26
0·202
5610
0·6844
s-8
199
1·54
1·65
565
12·9
0·7
98·0
1·20
0·92
32·3
33·6
36·94
6·05
0·13
�7·39
0·35
0·135
22300
0·0531
s-12-1B
219
22·54
323
32·8
0·5
289·6
1·21
2·49
24·2
26·9
24·90
2 ·84
0·15
�3·54
0·19
0·282
2120
0·4648
s-12-2
219
1·67
1·87
442
12·5
0·7
32·9
1·22
0·57
30·5
31·9
34·19
7·66
0·15
�11·10
0·60
0·090
82800
0·6308
s-12-4
229
1·43
1·65
880
40·5
0·7
299·5
1·20
1·19
24·7
28·1
26·66
4·68
0·09
�5·91
0·20
0·169
10300
0·5143
s-6-1(W)
131·67
1·93
523
31·3
0·7
216·5
1·08
1·94
26·9
27·7
29·55
4·32
0·10
�4·97
0·19
0·201
9360
2E-06
s-6-1(G)
131·67
415
0·7
173·0
0·96
0·56
8·8
8·7
10·56
5·48
0·14
�8·60
0·46
0·116
11500
0·7941
s-6-1(P)
131·67
1·93
152
31·3
0·7
216·5
1·30
1·94
22·3
23·1
26·18
3·02
0·29
�3·70
0·33
0·270
969
0·3713
s-6-3(W)
381·43
1·64
1010
5·1
0·7
502·1
1·04
4·20
30·8
35·2
32·79
4·26
0·08
�4·95
0·14
0·202
6140
5E-06
s-6-3(G)
381·43
964
0·7
421·0
1·06
0·97
17·6
19·4
20·95
4·88
0·11
�6·48
0·25
0·154
6070
0·1426
s-6-3(P)
381·43
1·64
815·1
0·7
502·1
1·08
4·20
18·8
20·1
19·29
0·11
0·32
�2·00
0·21
0·500
152
0·2105
s-6-5(W)
431·67
2·11
732
59·6
0·7
317·3
1·11
2·32
32·3
36·3
33·66
4 ·04
0·10
�4·48
0·15
0·223
6410
1E-05
s-6-5(G)
431·67
682
0·7
317·3
1·06
1·27
22·6
23·8
25·25
4·41
0·12
�5·29
0·22
0·189
6380
0·479
s-6-5(P)
431·67
2·11
4659·6
0·7
317·3
1·27
2·32
13·2
17·1
18·47
1·32
0·68
�2·64
0·47
0·379
120
0·9186
s-7-1(W)
521·43
1·64
533
27·8
0·7
389·9
1·02
4·58
39·1
43·4
39·59
3·29
0 ·11
�3·71
0·14
0·270
3870
0·0002
s-7-1(G)
521·43
483
0·7
389·9
0·88
0·97
11·0
12·5
14·13
3·93
0·14
�5·64
0·31
0·177
3640
0·0179
s-7-1(P)
521·43
1·64
8127·8
0·7
389·9
1·12
4·58
30·7
33·0
35·47
0·20
0·35
�1·76
0·21
0·568
183
0·127
s-7-2(W)
691·67
1·97
566
37·3
0·7
347·4
1·11
4·26
31·9
34·4
33·66
3·78
0 ·11
�4·20
0·16
0·238
4290
0·0002
s-7-2(G)
691·67
530
0·7
347·4
1·04
0·98
14·3
14·5
18·36
4·38
0·16
�5·68
0·31
0·176
4090
0·7876
s-7-2(P)
691·67
1·97
7137·3
0·7
347·4
1·21
4·26
20·8
22·4
25·51
0·88
0·43
�2·18
0·30
0·459
211
0·7801
s-7-3(W)
861·67
1·96
668
50·7
0·6
415·8
1·04
3·36
27·1
28·0
28·38
3·91
0·12
�4·61
0·18
0·217
4470
0·4631
s-7-3(G)
861·67
653
0·6
375·0
1·06
1·32
18·0
20·1
19·37
4·03
0·10
�5·23
0·19
0·191
4800
0·0527
s-7-3(P)
861·67
1·96
152
50·7
0·6
933·0
1·08
3·66
15·1
16·0
15·80
0·40
0·21
�2·21
0·15
0·452
163
0·1778
s-7-7A
(G)
134
1·67
273
0·7
94·0
1·00
0·68
9·5
9·4
11·49
6·65
0·24
�11·30
0·80
0·088
14300
0·4045
s-7-7A
(P)
134
1·67
1·72
175
42·9
0·7
949·0
0·98
3·19
16·2
16·0
16·76
0·02
0·21
�1·95
0·14
0·513
195
0·0587
s-7-8(W)
159
1·54
1·64
679
61·2
0·7
260·7
1·08
2·88
26·1
27·9
29·79
5·10
0·13
�6·26
0·27
0·160
8190
0·8838
s-7-8(G)
159
1·54
669
0·7
237·0
1·09
0·95
19·0
20·7
21·62
5·24
0·12
�6 ·91
0·28
0·145
9120
0·219
s-7-8(P)
159
1·54
1·64
4761·2
0·7
870·6
1·09
3·09
9·6
11·5
13·30
�1·69
0·46
�1·38
0·23
0·725
350·2946
s-7-10A(W
)198
1·54
1·51
1090
49·4
0·7
341·7
1·12
2·56
33·5
34·3
34·33
4·92
0·08
�5·68
0·16
0·176
11300
0·0023
s-7-10A(G
)198
1·54
1061
0·7
300·0
1·14
0·98
24·5
25·0
27·80
5·30
0·09
�6·57
0·20
0·152
12900
0·9832
s-7-10A(P)
198
1·54
1·51
217
49·4
0·7
979·0
1·04
2·94
13·6
14·0
12·50
2·12
0·27
�3·63
0·26
0·275
239
0·3505
s-7-9(G)
179
1·54
321
0·7
93·0
1·18
0·88
20·7
22·4
24·98
6·00
0·24
�8·05
0·54
0·124
12800
0·6478
s-7-9(P)
179
1·54
1·74
126
4·8
0·7
873·0
1·03
3·39
9·5
11·0
9·10
1·10
0·34
�3·04
0·30
0·329
149
0·9756
s-9-1(W)
200
1·54
1·87
1077
19·6
0·7
361·5
1·06
2·75
24·1
27·0
25·74
5·24
0·08
�6·61
0·18
0·151
11700
1E-11
s-9-1(G)
200
1·54
1053
0·6
330·0
1·07
0·95
16·9
18·6
18·10
5·65
0·08
�8·00
0·23
0·125
13000
0·0042
s-9-1(P)
200
1·54
1·87
116
19·6
0·6
885·0
0·93
4·03
14·2
14·6
16·10
0·23
0·32
�2 ·16
0·21
0·463
117
0·4255
s-10-1(G
)203
1·82
352
0·7
164·0
1·07
0·95
13·7
12·4
13·70
5·08
0·14
�7·12
0·34
0·140
8490
0·0027
s-10-1(P)
203
1·82
1·77
123
35·1
0·6
858·0
0·96
3·93
15·0
13·8
16·20
0·02
0·23
�1·96
0·15
0·510
138
0·2561
s-11-1(G
)217
1·67
421
0·7
170·0
1·11
0·92
18·0
17·2
19·50
5·65
0·19
�7·70
0·42
0·130
7980
0·7099
s-11-1(P)
217
1·67
1·75
6241·2
0·7
860·8
0·98
3·37
7·7
7·5
9·20
�0·16
0·44
�2·17
0·30
0·461
750·595
Theeightsamplesat
thetopofTab
le1arefine-grained
samplesin
thisstudy.
(W),(G
)an
d(P)referto
whole
crystals,groundmassan
dphen
ocrysts
ofquartz
ineach
sample
respectively.Distance,0m
represents
thelocationoftheintrusionco
ntact
withthewall-rock
onthewestside;
positive
andneg
ativenumbersreferto
theeast
andwestsiderelative
tothe0m
locationrespectively.AR1,
averag
easpectratio.AR2,
averag
easpectratioofthe40
largestcrystals.Number,number
ofgrainsan
alyzed
.AF,alignmen
tfactor.
Roundness,
averag
eroundnessofgrainsan
alyzed
.Area,
area
ofthin
sectionan
alyzed
.R,spatial
distributionR-value.
Lmax,averag
eofthefourlargestintersectionlengthsofeach
sample.Vol.phase,
volumeofquartz
determined
from
thearea
ofquartz
inthin
section.CSD
volume,
regressionvo
lume,
intercep
t,slope,
CL(characteristic
length),totalnumber,an
dgoodnessoffitarecalculatedusingCSDCorrections1.38.Itshould
benotedthat
slopean
dintercep
tforwhole
crystalsofeach
sample
(W)donot
havemuch
physical
significan
ce,butother
param
etersmightbemeaningful.The‘goodnessoffit’,Q,is
aparam
eter
that
describes
thequalityoffitofthelinearregression(see
text
fordetails).
JOURNAL OF PETROLOGY VOLUME 53 NUMBER 9 SEPTEMBER 2012
1816
by guest on August 21, 2012
http://petrology.oxfordjournals.org/D
ownloaded from

CSDs. Because it is difficult to parameterize curved CSDs,here the CSD is considered as the sum of two straightCSDs, as done by Higgins (1996), but without the implica-tion that the texture was produced necessarily by mixing.CL is about 0·27^0·73mm for the population of pheno-crysts (group 2) and 0·09^0·19mm for the population ofgroundmass crystals (group 3) (Table 1). The interceptvaries from ^1·69 to 3·02 for the population of phenocrysts(group 2) and from 4·03 to 6·65 for the population ofgroundmass crystals (group 3). The characteristic length(CL) of the fine-grained samples (group 1) varies from0·09 to 0·28mm and intercept ranges from 2·61 to 7·66.The volumetric proportions of quartz in the fine-grainedsamples (group 1) have a limited range of 21^36%. Themaximum crystal size is 2·5mm.A plot of CSD characteristic length vs volume phase pro-
portion (see Higgins, 2002a) highlights three distinctgroups for all the quartz crystals (Fig. 10a). Plots of Lmax
against CSD slope are shown in Fig. 10b. It should benoted that Lmax is measured (in mm) as the average ofthe four largest grains from the crystal population of eachsample (e.g. Boorman et al., 2004; O’Driscoll et al., 2007,2008). The two strong positive correlations of Lmax againstCSD slope suggest that the group 1 and group 2 CSDdata represent two distinct crystal populations, which isconsistent with their different emplacement stages in thefield.Figure 11 presents the spatial variation of slope, inter-
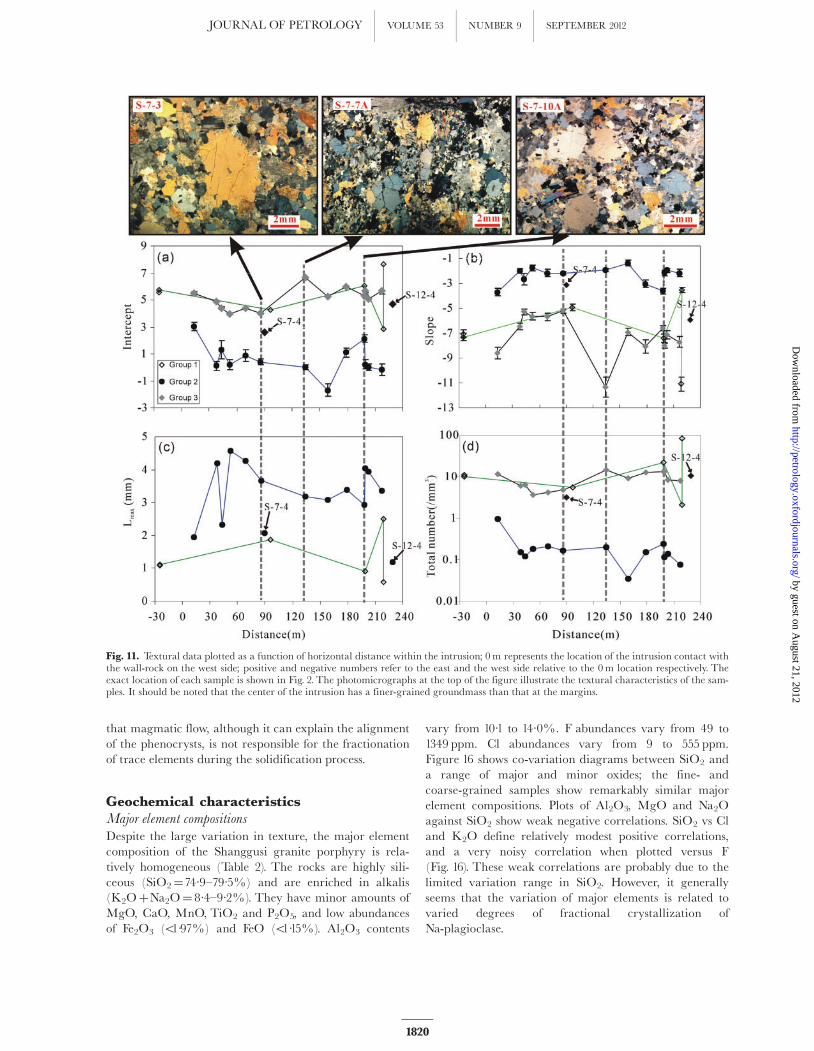
cept, Lmax, and total number of crystals (per cm3) as afunction of distance in the intrusion. There is no obviousregular variation of these parameters for group 1 andgroup 2. None the less, the Lmax and slope of group 3 inthe margins of the intrusion are larger than those in thecenter, and the intercept and total number of crystalsshow opposite characteristics. The representative photo-micrographs of the margins and the center of the intrusion
that are shown at the top of Fig. 11 qualitatively indicatethat the groundmass at the center of intrusion is finergrained, with a more rapid cooling history.
SDP plotsCrystal spatial distribution can be random, ordered orclustered, as quantified by the R-value method applied toa thin section (Jerram et al., 1996). For example, in Fig. 12,populations of grains plotting above the random distribu-tion line (RSDL) are ordered, whereas populations belowthis line are clustered. The trends for grain distributionsthat have undergone different degrees of size sorting,mechanical compaction (simple grain rearrangement), de-formational compaction or overgrowth have been deter-mined (Jerram et al., 1996), and are shown as vectorarrows in Fig. 12.The vector for sorting shows the trend ex-pected for increasingly better size sorting, and the over-growth vector reflects the movement of grain centers withgrain overgrowth of neighboring grains. The mechanicalcompaction trend reflects an increase in R-value coupledwith a decrease in matrix abundance as grains undergosimple re-ordering and move into contact with each otherin response to loss of interstitial liquid. The deformationalcompaction trend results from a decrease in R-value as thepure shear deformation of initially spherical grains causesthe grain centers to move apart in a plane normal to theprincipal stress, along with a further decrease in matrixabundance (Jerram et al., 1996).The spatial distribution data from the Shanggusi sam-
ples generally show a negative trend in Fig. 12. TheR-value of group 2 has a very broad variation, and changesfrom a clustered to a more random distribution. The nega-tive trend seen in most of the data for group 3 can be theresult of variable degrees of overgrowth and/or mechanicalcompaction. The scattered negative trends of group 1 andgroup 2 might result from more complex processes andare discussed in more detail below.
Fig. 7. Back-scattered electron images showing representative accessory mineral characteristics. (a) Magnified view of the white rectangle in(b). Ab, albite; Bat, bastnasite; Hm, hematite; Kfs, potassium feldspar; Py, pyrite; Rt, rutile; Zrn, zircon.
YANG SHANGGUSI GRANITE PORPHYRY SOLIDIFICATION
1817
by guest on August 21, 2012
http://petrology.oxfordjournals.org/D
ownloaded from

Fig. 8. Quartz CSDs for all the studied samples. (a) Fine-grained samples, including six samples from the granite dyke (group 1) and two sam-ples (labelled) from the granite porphyry. (Note the sequence of progressively shallower right-hand parts to the CSDs observed for group 1 sam-ples.) (b, c, d) Coarse-grained samples of the granite porphyry. The groundmass and phenocryst are simultaneously considered in (b) and areseparated in (c). The CSDs with large size range and shallower slope in (c) are phenocryst data (group 2). (d) Groundmass CSDs (group 3).(e) Cumulative distribution function diagrams showing log-normal CSDs for group 1 samples. (f) Bi-logarithmic cumulative size diagram.The schematic inset diagrams in (d)^(f) show three different theoretical CSD models.
JOURNAL OF PETROLOGY VOLUME 53 NUMBER 9 SEPTEMBER 2012
1818
by guest on August 21, 2012
http://petrology.oxfordjournals.org/D
ownloaded from

The progressive deformation of initially sphericalgrains will produce grains that have increasingly higheraspect ratios and become more similar to tabular grainsin shape. Hence, one would expect R-value to show anegative correlation when plotted against the aspect ratioif deformation were the cause of the positive trend inFig. 13b. In contrast, if the trend were the result of bettersorting, one might expect the R-value to correlate posi-tively with CSD slope (Fig. 13a); well-sorted samplesshould have a more uniform size distribution and hencea flatter slope. Plots of R-value against CSD slope show arelative modest negative correlation for group 2 and noclear correlation trend for the other groups (Fig. 13a).Plots of R-value against aspect ratio show a slightly posi-tive correlation for group 2 (Fig. 13b). Hence, the vari-ation trends of R-value for all the samples mainly resultfrom variable degrees of overgrowth and/or mechanicalcompaction.
Alignment factorData for the alignment factor (AF) in all of the samplesare presented in Table 1. The AF value of group 1 andgroup 2 ranges from 2·7 to 40·5 and from 4·8 to 61·2 re-spectively. Therefore, there is a higher degree of alignmentof the long axes of the phenocrysts in group 2. If thehigher degree of alignment results from deformationalcompaction, plots of aspect ratio against alignment factorwould show a positive correlation. However, such a trendis not observed in Fig. 14a. Plots of the volume fraction(group 1 and group 2) against alignment factor show anoisy negative correlation (Fig. 14b). This cannot be dueto deformational compaction, which would result in an in-crease of the volume fraction (group 1 and group 2) withincreasing alignment factor. In addition, there is no clearcorrelation trend between the AF value and bulk-rocktrace element content (e.g.
PREE) (Fig. 15), suggesting
Fig. 9. (a) Relationship between NT �L3 and XQz. (b) Comparison of measured and predicted CSD slopes and intercepts. Predicted curves arefrom equation (1); measured values are fromTable 1.
Fig. 10. (a) Plot of characteristic length (CL) vs measured volumephase proportion for all the studied samples. (b) Plot of slope vsLmax for group 1 and group 2. R2 values indicated. The errors for CLand slope are indicated where these are larger than the symbol size.
YANG SHANGGUSI GRANITE PORPHYRY SOLIDIFICATION
1819
by guest on August 21, 2012
http://petrology.oxfordjournals.org/D
ownloaded from
that magmatic flow, although it can explain the alignmentof the phenocrysts, is not responsible for the fractionationof trace elements during the solidification process.
Geochemical characteristicsMajor element compositions
Despite the large variation in texture, the major elementcomposition of the Shanggusi granite porphyry is rela-tively homogeneous (Table 2). The rocks are highly sili-ceous (SiO2¼74·9^79·5%) and are enriched in alkalis(K2OþNa2O¼ 8·4^9·2%). They have minor amounts ofMgO, CaO, MnO, TiO2 and P2O5, and low abundancesof Fe2O3 (51·97%) and FeO (51·15%). Al2O3 contents
vary from 10·1 to 14·0%. F abundances vary from 49 to1349 ppm. Cl abundances vary from 9 to 555 ppm.Figure 16 shows co-variation diagrams between SiO2 anda range of major and minor oxides; the fine- andcoarse-grained samples show remarkably similar majorelement compositions. Plots of Al2O3, MgO and Na2Oagainst SiO2 show weak negative correlations. SiO2 vs Cland K2O define relatively modest positive correlations,and a very noisy correlation when plotted versus F(Fig. 16). These weak correlations are probably due to thelimited variation range in SiO2. However, it generallyseems that the variation of major elements is related tovaried degrees of fractional crystallization ofNa-plagioclase.
Fig. 11. Textural data plotted as a function of horizontal distance within the intrusion; 0m represents the location of the intrusion contact withthe wall-rock on the west side; positive and negative numbers refer to the east and the west side relative to the 0m location respectively. Theexact location of each sample is shown in Fig. 2. The photomicrographs at the top of the figure illustrate the textural characteristics of the sam-ples. It should be noted that the center of the intrusion has a finer-grained groundmass than that at the margins.
JOURNAL OF PETROLOGY VOLUME 53 NUMBER 9 SEPTEMBER 2012
1820
by guest on August 21, 2012
http://petrology.oxfordjournals.org/D
ownloaded from

Trace element compositions
The rare earth element (REE) patterns for all the samplesare characterized by enriched light REE (LREE), slightlyenriched heavy REE (HREE) and pronounced negativeEu anomalies (Eu*¼ 0·33^0·67) (Fig. 17a, Table 3). Inmulti-element patterns, all the samples show characteristic
negative anomalies in Ba, Sr and Ti, and positive anoma-lies inTh, U, Pb and Hf (Fig. 17b).Because feldspar and quartz are the major rock-forming
minerals in the Shanggusi granite porphyry, Sr, Ba andEu can be considered as compatible elements and Th andREE as incompatible elements for all the samples. Plots ofEu* vs Sr and Ba show no clear correlation for thefine-grained samples (Fig. 18). Plots of Eu* vs Sr, Ba andCaO/Al2O3 show a modest positive correlation for thecoarse-grained samples (Fig. 18), which are in principle inagreement with fractionation of feldspar. However, theobserved slightly positive correlations of Eu* vs La andlack of correlation of Eu* vs Th (Fig. 18) are inconsistentwith typical feldspar fractional crystallization trends. Inaddition, plots of Sr vs REE, Ba vs Th and CaO/Al2O3 vsLa show relatively good positive correlations (Fig. 18),implying that the assumed compatible elements Ba andSr, and the CaO/Al2O3 ratio, display the behavior of in-compatible elements, which indicates that fractionation ofthese trace elements is not the result of fractional crystal-lization of feldspar. Furthermore, there is no correlationbetween Eu* and quartz volume fraction (Fig. 18), indicat-ing that the variation of quartz volume fraction does notcontrol the fractionation of these trace elements. In sum-mary, the negative Eu anomalies and the trace elementfractionation might not mainly result from the fractionalcrystallization of the major rock-forming minerals (quartzand feldspars). The negative Eu anomalies may instead bea characteristic of the source region, reflecting the impactof residual plagioclase. The fractionation of trace elementsmight also be controlled by other magmatic processes;this will be discussed together with quantitative texturalanalysis below.
Fig. 12. R-value vs matrix volume phase (%) for all the studied sam-ples. RSDL is a line for the random distribution of spheres of differingmodal abundance (Jerram et al., 1996). Data above RSDL indicate anordered grain distribution whereas those below it have a clusteredgrain distribution. The vectors indicate expected changes caused bydifferent processes (Jerram et al., 1996). The distribution of crystalsplotting above the dashed line has a non-touching framework of crys-tals (Jerram et al., 2003).
Fig. 13. (a) Plot of CSD slope vs R-value for all the samples. (b) Plot of aspect ratio vs R-value for group 1 and group 2. It should be noted thatthe aspect ratios used here are averages of the major/minor axes of the 40 largest crystals in each sample (AR2 inTable 1) as larger crystalsare more sensitive to deformational compaction. Group 3 is not considered here.
YANG SHANGGUSI GRANITE PORPHYRY SOLIDIFICATION
1821
by guest on August 21, 2012
http://petrology.oxfordjournals.org/D
ownloaded from

DISCUSS IONCrystal nucleation and growthThe data for SDP and AF suggest that the textural featuresof the Shanggusi granite porphyry can generally be re-garded as the result of simple crystal nucleation andgrowth processes. Magmatic flow and mechanical compac-tion of crystals, as discussed above, did not significantlyaffect the original nucleation and growth of quartz.Therefore, the CSD data are appropriate to explore thefundamental aspects of crystal nucleation and growthduring the progressive solidification of the intrusion.
The CSDs of group 1 and group 3 exhibit a generalconcave-down shape, which means that small crystals aredeficient when compared with the linear CSDs observedin other systems (e.g. Mock et al., 2003). Concave-downCSDs for quartz crystals have been reported for silicic sys-tems in several recent studies (e.g. Bindeman, 2003;Stemprok et al., 2008; Inanli & Huff, 2009). Bindeman(2003) and Inanli & Huff (2009) concluded thatconcave-down log-normal CSDs are a general result ofsurface-controlled, size-dependent growth, with a minortextural coarsening component; they are an intrinsic prop-erty of near-equilibrium systems, such as large-volume,near-eutectoid, silicic magma bodies. Stemprok et al.(2008) proposed that the small-size fraction of quartz crys-tals is eliminated by subsolidus annealing. However, onecontroversy surrounding these earlier studies involves theinterpretation of log-normal CSDs and whether they canbe produced as a result of size-independent (constant)crystal growth. Eberl et al. (2002) demonstrated thatlog-normal CSDs cannot be generated or maintained bysize-independent crystal growth based on the population-balance modeling equation. However, a deficit of smallcrystals may also be produced by other processes. Marsh(1998) suggested that, in a hypothetical closed system, thediminishing liquid fraction during the last stages of crys-tallization could cause a pronounced decrease in the CSDat the smallest crystal sizes. Although such a process canproduce a single concave-down CSD, it cannot producethe sequence of progressively shallower right-hand partsto the CSDs observed here for group 1 and group 3 and inmany other studies (e.g. Higgins, 1998, 1999, 2002a;O’Driscoll et al., 2008; Inanli & Huff, 2009). In addition, it
Fig. 14. (a) Plot of aspect ratio vs alignment factor for group 1 and group 2.The aspect ratios used here are an average of the major/minor axesof the 40 largest crystals in each sample (AR2 inTable 1). (b) Plot of volume phase (%) vs alignment factor for group 1 and group 2.
Fig. 15. Plot of alignment factor vs bulk-rock REE content for group1 and group 2.
JOURNAL OF PETROLOGY VOLUME 53 NUMBER 9 SEPTEMBER 2012
1822
by guest on August 21, 2012
http://petrology.oxfordjournals.org/D
ownloaded from

has been shown by experiment that in synthetic silicicmelts quartz cannot coarsen measurably if its initial size isaround a millimeter over geological timescales; however,textural coarsening may be very active at the end of nucle-ation events and result in the consumption of a significantproportion of crystalline nuclei (Cabane et al., 2001).Textural coarsening is also known as Ostwald ripening,
textural maturation and equilibration, crystal ageing andannealing (e.g. Cashman & Ferry, 1988; Marsh, 1988;Boudreau, 1995; Elliott et al., 1997; Higgins, 1998, 1999;Higgins & Roberge, 2003). This process occurs becausesmall grains have a higher surface energy per unit volumethan do larger grains. Therefore, crystals smaller than acritical size will dissolve and ‘feed’ the growth of larger crys-tals to minimize the energy of the system.This process canoccur only when a crystal is held at a temperature close toits liquidus for a long period of time. Under these condi-tions, the nucleation rate is zero, but the growth rate ishigh for crystals larger than the critical size. This does notnecessarily mean that the temperature is held constant,just that the undercooling remains small and the tempera-ture is above the solidus. Several models have been pro-posed to account for textural coarsening processes(Lifshitz & Slyozov, 1961; Wagner, 1961; DeHoff, 1991;Simakin & Bindeman, 2008). Among these models, theCommunicating Neighbours (CN) model has been success-fully applied to plutonic rocks by Higgins (1998); thismodel is better than the Lifshitz-Slyozov-Wagner (LSW)
model and can produce CSDs that are consistent with nat-ural examples. However, both the CNand LSWcoarseningmodels are for constant temperature, which might be un-likely in most magma chambers. A new coarsening modelhas been proposed more recently by Simakin & Bindeman(2008) and Mills et al. (2011) that takes into account suchtemperature variations. These researchers have shown thata time-series of multiple dissolution^reprecipitation epi-sodes generates concave-downward CSDs and these resultsfit well with experimental and natural observations of thecommon concave-down CSDs in silicic igneous rocks. Thismight amplify the CN coarsening processes and the twomight not be easily distinguishable. In the simplest CNcoarsening models the system is closed and the volumetricproportion of the phase is constant; however, the quartzvolume in the samples from the Shanggusi porphyry thathave experienced the textural coarsening has changedmore than 10%. Hence, textural coarsening might be anopen-system process, reflecting transfer of material via aliquid phase that can migrate into or out of a rock.
Origin of curved CSDsAlthough it is generally recognized that porphyritic tex-tures are very common in granites, quantitative texturalanalysis has not been widely applied (see Higgins, 2006a),and further work is needed to investigate exactly whichphysical processes it reflects. The curved CSDs of thecoarse-grained samples display F-type CSD characteristics
Table 2: Whole-rock major element, Cl and F compositions of the Shanggusi granite porphyry samples
Sample: S-6-1 S-7-3 S-7-4 S-7-5 S-7-8 S-8 S-9-1 S-7-10A S-3-3 S-6-3 S-7-1 S-7-2 S-7-7A S-7-9 S-10-1 S-11-1 S-12-1 S-12-2 S-12-4
SiO2 75·71 75·63 75·98 76·38 75·45 79·50 75·78 76·26 74·91 76·32 75·79 75·24 77·77 77·22 77·24 77·80 77·34 75·51 77·43
Al2O3 13·37 13·15 13·45 13·28 13·23 11·55 13·09 13·07 14·04 11·20 11·01 11·53 10·06 11·01 10·85 10·89 11·11 12·47 11·46
Fe2O3* 0·73 0·63 0·45 0·06 0·59 0·16 0·53 0·58 0·45 1·91 2·47 2·19 2·26 1·90 2·04 1·76 1·32 1·47 1·43
MgO 0·07 0·15 0·11 0·07 0·11 0·03 0·11 0·11 0·07 0·10 0·09 0·11 0·07 0·06 0·08 0·06 0·03 0·02 0·01
CaO 0·29 0·42 0·37 0·33 0·62 0·20 0·35 0·32 0·55 0·53 0·51 0·47 0·52 0·42 0·41 0·51 0·43 0·25 0·29
Na2O 4·43 4·26 4·85 4·74 4·74 4·17 4·36 4·63 5·66 4·10 3·92 4·00 3·25 4·39 3·87 3·99 3·85 4·46 4·44
K2O 4·75 4·74 4·15 4·40 4·26 4·19 4·72 4·19 3·38 4·83 4·67 4·39 5·15 4·41 4·81 4·66 5·10 5·01 4·35
MnO 0·02 0·03 0·09 0·01 0·03 0·01 0·01 0·01 0·03 0·27 0·14 0·33 0·03 0·03 0·08 0·04 0·01 0·14 0·02
P2O5 0·01 0·03 0·02 0·01 0·02 0·01 0·02 0·02 0·02 0·03 0·02 0·03 0·03 0·02 0·03 0·02 0·01 0·02 0·01
TiO2 0·04 0·06 0·04 0·01 0·03 0·00 0·04 0·04 0·02 0·07 0·07 0·08 0·09 0·06 0·07 0·06 0·06 0·04 0·03
LOI 0·51 0·34 0·31 0·24 0·40 0·20 0·35 0·32 0·21 0·48 1·05 1·36 0·51 0·30 0·34 0·10 0·50 0·45 0·35
H2Oþ 0·03 0·26 0·20 0·09 0·17 0·05 0·05 0·07 0·10 0·38 0·93 1·24 0·27 0·28 0·21 0·10 0·28 0·31 0·29
Total 99·93 99·42 99·82 99·52 99·47 100·01 99·35 99·56 99·32 99·83 99·74 99·73 99·74 99·83 99·81 99·79 99·76 99·84 99·83
FeO 0·09 0·16 0·10 0·10 0·06 0·11 0·04 0·09 0·19 0·90 0·45 0·35 1·10 1·10 1·00 1·00 0·75 1·15 1·15
Cl 17 33 28 18 17 9 34 26 26 128 88 43 555 347 388 290 406 187 135
F 180 180 1349 1019 941 941 156 1149 563 1226 870 549 613 643 562 1073 478 129 49
Fe2O3*, total iron. Oxides and LOI are in wt %; Cl and F are in ppm.
YANG SHANGGUSI GRANITE PORPHYRY SOLIDIFICATION
1823
by guest on August 21, 2012
http://petrology.oxfordjournals.org/D
ownloaded from

as noted above. Several models have been proposed to ex-plain F-type CSDs. Armienti et al. (1994) first proposedthat crystallization within several different cooling re-gimes, such as a magma chamber and a conduit, could beresponsible for F-type CSDs. Marsh (1998) suggested thata change of CSD slope can be affected by nucleation rate.
Kinked CSDs may record sudden changes in nucleationrate. However, F-type CSDs may also result from themixing of magmas with two different S-type CSDs(Higgins, 1996) or periods of textural coarsening in amagma chamber (Higgins & Roberge, 2003). Fractal sizedistributions (F-type CSDs) have also been considered to
Fig. 16. Major element oxide vs SiO2 variation diagrams for the fine- and coarse-grained samples.
JOURNAL OF PETROLOGY VOLUME 53 NUMBER 9 SEPTEMBER 2012
1824
by guest on August 21, 2012
http://petrology.oxfordjournals.org/D
ownloaded from

result from crystal fragmentation (e.g. Marsh, 1998;Bindeman, 2005; Gualda & Rivers, 2006). However, thevast majority of the quartz phenocrysts in the Shanggusiporphyry are euhedral or subhedral, indicating that frag-mentation processes are not significant. Therefore, thecurved CSDs observed for the coarse-grained samples inthis study are more likely to result from two different cool-ing regimes. Pamukcu et al. (2012) have demonstrated thatthe phenocrysts of quartz and feldspar in a silicic magmabody represent crystallization in the deep magma cham-ber, whereas the fine-grained groundmass represents thefinal quenching process. The resorption of some quartzphenocrysts might be the result of ascent of phenocryst-bearing granitic magma under H2O-undersaturated con-ditions (e.g. Blundy & Cashman, 2001; Stemprok et al.,2008). In addition, a drop in pressure during adiabaticascent of the magma may explain the resorption ofperthite, as this ascent process may bring the temperatureof an H2O-undersaturated magma closer to its liquidustemperature. The overgrowth of perthite is probably dueto the expansion of the stability field of alkali feldspar atthe expense of quartz in the Qz^Ab^Or^H2O system.
Hence, the highly porphyritic texture, homogeneousbulk-rock major element and major rock-forming mineralcompositions also support the suggestion that the kinkedCSDs record sudden changes in nucleation rate ratherthan magma mixing.
Heterogeneity of textural and chemicalcharacteristicsCombined with the relative homogeneous chemical com-position of the major rock-forming minerals, the correl-ation between whole-rock major and trace elements, andquantitative textural analysis indicate that chemical frac-tionation across the profile of the Shanggusi granite por-phyry is not mainly directly controlled by fractionalcrystallization, magma mixing, magma flow or mechan-ical compaction. The significant fractionation of minorand trace elements may be due to variations in the modalabundance of accessory minerals, such as apatite, zircon,rutile and rare earth minerals, as these minerals typicallyshow very strong compatibility for almost all trace elem-ents (Rollinson, 1993). During the magma solidificationprocess, the trace elements that are typically concentratedin accessory minerals might be present in a fluid phaseduring major rock-forming mineral crystallization pro-cesses.The migration and convection of such fluids may in-fluence the fractionation of trace elements. Plots of REEvs P2O5,TiO2 and (TFe2O3þMgOþCaO) show positivecorrelations for the coarse-grained samples, with thefine-grained samples plotting along the same variationtrends (Fig. 19), suggesting that these minor elements mayhave behaved incompatibly. In addition, the positivetrends of H2O
þ vs REE, TFe2O3þMgOþCaO, and Csmay also result from the migration and heterogeneous dis-tribution of hydrous fluids (Fig. 19).Fluids, characterized by low viscosity and density, mi-
grate easily and have long been proposed as an effectivemedium for the transportation of various chemical compo-nents in magmatic systems, giving rise to differentiationand diversification of the resultant magmas (e.g.Boudreau et al., 1986; Keppler & Wyllie, 1990; Wilkinsonet al., 1996; Webster, 1997; Ferlito & Lanzafame, 2010). Atpresent, however, knowledge of the fluid^melt partitioningof trace elements is only fragmentary, and the data are in-consistent (e.g. Borchert et al., 2010, and references therein).Another challenging aspect in understanding fluid-inducedmagmatic differentiation is that fluids can easily changetheir composition when they interact with melts, crystalsor other fluids.This makes it difficult to identify the behav-iour of fluids in a magmatic system. The correlationsshown in Fig. 19 may suggest that the fluids in theShanggusi intrusion are hydrous. Because fluid-bearingmelts typically have lower solidus temperatures thanequivalent dry melts, the heterogeneous distribution offluids would give rise to variations in the degree of under-cooling in the magma chamber, which differs from that
Fig. 17. (a) Chondrite-normalized REE patterns for the Shanggusigranite porphyry. (b) Primitive mantle-normalized trace element pat-terns of the Shanggusi granite porphyry. Normalizing values arefrom Sun & McDonough (1989).
YANG SHANGGUSI GRANITE PORPHYRY SOLIDIFICATION
1825
by guest on August 21, 2012
http://petrology.oxfordjournals.org/D
ownloaded from

controlled by a decease in the actual temperature alone.Therefore, we might expect rock textures to show some re-lationship with these trace element abundances if fluid mi-gration is the main cause of the fractionation offluid-mobile trace elements in the Shanggusi intrusion.However, it should be noted here that the exact
components and characteristics of the fluids that contribu-ted to the Shanggusi intrusion are difficult to address atpresent, owing to the limited information available. Nonethe less, exploring the potential relationships betweenquantitative textural data and bulk-rock chemical vari-ation may be helpful to investigate comprehensively what
Table 3: Whole-rock trace element compositions of the Shanggusi granite porphyry samples (ppm)
Sample: S-9-1 S-8 S-7-9 S-7-8 S-7-7A S-7-5 S-7-4 S-7-3 S-7-2 S-7-10A S-7-1 S-6-3 S-6-1 S-3-3 S-12-4 S-12-2 S-12-1 S-11-1 S-10-1
Sc 5·06 3·65 8·40 4·22 6·34 2·17 4·50 4·87 6·74 3·92 6·31 6·37 6·88 3·63 7·66 11·70 5·78 6·18 5·65
Cr 4·07 3·02 9·65 3·64 8·81 4·07 3·17 4·35 8·17 3·68 7·74 9·31 3·77 3·75 7·99 9·19 8·18 10·70 9·31
Co 0·12 0·10 1·00 0·23 1·13 0·14 0·17 0·69 0·83 0·29 0·59 1·24 1·09 0·27 1·12 1·38 1·01 1·13 1·19
Ni 1·26 0·83 1·17 0·92 1·01 1·18 0·77 1·67 1·28 2·89 0·95 1·42 1·04 0·88 1·65 2·23 1·30 1·20 1·19
Cu 30·5 3·6 30·0 9·1 11·6 3·7 4·0 4·4 13·5 15·9 4·1 4·9 25·9 3·9 16·5 12·4 8·6 16·1 4·6
Zn 29·7 12·7 28·3 34·6 38·2 17·3 41·0 36·4 31·0 23·1 31·6 71·8 22·3 21·8 49·2 38·1 27·9 45·3 27·5
Ga 26·9 29·4 23·5 29·9 21·8 29·8 28·5 26·8 23·0 26·6 22·8 22·9 31·3 30·5 29·4 32·6 25·4 22·0 22·0
Rb 405 370 408 398 406 394 382 435 439 353 453 478 448 270 368 538 455 449 429
Sr 50 31 44 29 46 26 38 42 52 28 50 67 15 11 24 19 30 34 52
Nb 40 103 100 56 51 43 54 51 46 56 58 63 88 59 147 169 76 69 60
Mo 319 6·8 3·4 2·0 7·9 2·9 17·2 5·3 6·3 6·1 3·5 7·8 32·6 1·1 0·6 1·8 1·9 18·8 58·7
Cs 3·77 3·52 3·90 4·01 4·18 3·93 4·01 4·60 5·21 3·25 4·43 4·89 4·46 3·21 3·76 5·35 3·95 4·05 4·41
Ba 130 42 108 61 143 36 103 121 149 62 150 165 175 29 39 103 45 118 137
Ta 2·14 4·53 7·93 2·43 3·32 2·21 2·48 2·70 3·45 2·83 4·24 4·31 4·06 3·39 15·90 10·80 4·24 3·76 3·47
W 3·01 1·98 5·36 2·63 4·36 2·83 7·81 7·03 3·18 1·80 7·89 14·20 5·88 1·37 2·36 1·74 2·53 1·54 6·59
Pb 31 35 42 43 42 36 40 47 54 35 50 45 46 38 38 64 39 53 55
Th 30 18 33 30 32 19 29 33 33 26 31 30 38 18 23 23 35 29 31
U 11·8 14·4 14·9 8·8 11·6 14·0 11·3 15·6 9·0 15·6 12·2 14·3 15·7 6·1 15·4 6·3 6·7 7·6 6·3
Be 6·0 3·8 10·0 7·4 7·5 6·0 7·1 5·4 8·9 6·9 7·9 8·3 5·5 11·2 8·9 12·7 8·7 9·2 8·3
Zr 103 58·3 135 115 131 100 96·9 102 143 135 142 142 166 68·5 138 246 282 151 150
Hf 6·1 7·4 7·2 7·2 6·3 7·5 6·6 6·2 8·0 8·8 7·9 8·1 12·7 5·6 17·2 19·2 16·1 7·9 8·1
La 16·6 14·8 15·9 18·0 25·8 4·0 13·6 18·8 22·5 13·3 21·3 18·3 6·7 11·1 13·1 8·7 16·2 12·5 18·5
Ce 27·0 24·7 28·2 27·8 43·7 4·8 18·5 32·8 40·8 20·8 36·7 33·1 11·6 16·2 32·0 18·9 29·2 22·6 35·6
Pr 2·6 2·5 2·9 3·0 4·2 0·7 2·2 3·1 4·0 2·4 3·4 3·2 1·2 1·8 2·7 1·8 2·8 2·3 3·2
Nd 7·5 6·9 8·5 8·3 12·4 1·9 6·1 9·1 11·8 6·7 9·6 10·1 3·0 4·9 7·4 5·5 8·3 6·4 9·1
Sm 1·01 0·90 1·39 1·12 1·46 0·34 0·95 1·26 1·95 0·97 1·27 1·49 0·41 0·74 1·19 0·71 1·27 1·16 1·16
Eu 0·12 0·12 0·19 0·13 0·23 0·05 0·14 0·14 0·27 0·13 0·22 0·26 0·04 0·12 0·11 0·18 0·15 0·17 0·22
Gd 0·60 0·49 1·10 0·76 1·40 0·34 0·77 0·85 1·34 0·80 1·16 1·23 0·34 0·57 1·02 0·95 0·91 1·03 1·12
Tb 0·11 0·09 0·21 0·14 0·22 0·06 0·15 0·15 0·21 0·14 0·19 0·20 0·08 0·13 0·16 0·19 0·17 0·18 0·19
Dy 0·69 0·58 1·34 0·92 1·30 0·39 1·02 0·94 1·44 0·89 1·14 1·28 0·65 0·85 1·02 1·50 1·02 1·23 1·18
Ho 0·15 0·12 0·24 0·22 0·26 0·09 0·26 0·21 0·29 0·20 0·25 0·32 0·17 0·19 0·22 0·38 0·27 0·28 0·27
Er 0·57 0·45 0·96 0·84 0·99 0·39 1·00 0·76 1·08 0·73 0·87 1·17 0·75 0·72 0·88 1·71 1·04 1·05 1·02
Tm 0·11 0·09 0·22 0·17 0·23 0·08 0·20 0·15 0·24 0·15 0·19 0·26 0·18 0·14 0·20 0·44 0·26 0·24 0·21
Yb 1·01 0·95 1·94 1·58 1·81 0·86 1·80 1·33 1·97 1·40 1·83 2·50 1·83 1·32 1·81 3·77 2·44 2·23 1·92
Lu 0·20 0·18 0·37 0·33 0·37 0·20 0·37 0·27 0·43 0·26 0·36 0·54 0·41 0·27 0·39 0·78 0·55 0·43 0·43
Y 5·66 2·86 9·10 7·56 12·80 3·60 9·32 7·80 11·20 7·12 9·97 15·50 6·99 6·20 7·52 14·60 11·80 11·90 10·60
Eu* 0·47 0·55 0·47 0·43 0·49 0·45 0·50 0·41 0·50 0·45 0·56 0·60 0·33 0·56 0·31 0·67 0·42 0·46 0·59
�REE 58·25 52·86 63·45 63·25 94·35 14·12 47·05 69·85 88·34 48·82 78·46 74·00 27·30 39·05 62·13 45·44 64·57 51·83 74·13
Eu*, Eu anomaly.
JOURNAL OF PETROLOGY VOLUME 53 NUMBER 9 SEPTEMBER 2012
1826
by guest on August 21, 2012
http://petrology.oxfordjournals.org/D
ownloaded from

physico-chemical factors played a dominant role in the so-lidification of the intrusion. Such data may provide furtherinsights into the fluid activities and chemical heterogene-ities in shallow-level intrusions.If we assume a uniform growth rate for quartz in all of
the studied samples, the observed positive correlations ofLmax with TiO2, P2O5, H2O
þ, Sr, and La (Fig. 20) couldresult from an increase of the quartz crystallization time,reflecting accumulation of fluids that were enriched inthese chemical components. It should be noted that inFig. 20 the fine-grained samples do not show significantcorrelations, but they generally have relatively lower traceelement contents and plot within the trends defined by thecoarse-grained samples. Eu anomalies (Eu*) and ratios ofCaO/Al2O3, La/Nb and Zr/Hf also positively correlatewith Lmax, suggesting that the fluids may affect both
textural variation and the fractionation of some elementratios. Eu* shows a good negative correlation with Lmax
for the fine-grained samples. This might reflect the com-plex nature of the fluids, or could represent a differentcooling stage, as these samples are from the granite dykesrather than the main granite porphyry. Similarly, theCSD slope of the quartz phenocrysts (including samplesS-7-4 and S-12-4) in the coarse-grained samples shows aweak positive correlation with these elements and elementratios; the fine-grained samples mostly fall within the over-all trends (Fig. 21), consistent with the suggestion that theundercooling variation is accompanied by chemical frac-tionation. However, the CSD slope of the groundmassfrom the coarse-grained samples displays a very weak cor-relation with trace element abundance, which might be ex-plained by the relatively small volume melt fraction at the
Fig. 18. Trace element co-variation diagrams for all of the samples studied.The regression lines are calculated based on the coarse-grained sam-ples, including group 2 and samples S-7-4 and S-12-4.
YANG SHANGGUSI GRANITE PORPHYRY SOLIDIFICATION
1827
by guest on August 21, 2012
http://petrology.oxfordjournals.org/D
ownloaded from

final crystallization stage. In addition, the CSD interceptreveals similar correlations to those of the slope (notshown), indicating that, to some extent, the nucleationdensity is reduced by fluid-induced chemical fractionation.Hence, it can be concluded that the heterogeneity of tex-tural and chemical characteristics is mostly controlled bythe same physico-chemical factors, which are possibly theresult of the migration and heterogeneous distribution offluids.
Implications from the spatial texturalvariation trendsIn the idealized theoretical solidification processes dis-cussed by Zieg & Marsh (2002), when the distance fromthe intrusion margin is much smaller than the thicknessof the intrusion, the solidus isotherms first arrive at themargins of the intrusion and gradually propagate into thecenter. The result of this should be that the slope and inter-cept vary systematically with distance from the intrusionmargin. They are highest near the contact, where coolingwas rapid, and lowest in the interior of the body, wherecooling was slow. Figure 22a shows the spatial variationsin texture in terms of CL (�1/slope) for a vertical profilethrough a hypothetical intrusion. The solidification pro-cess is mainly controlled by heat transfer; this has beendescribed for large plutonic intrusions (e.g. Zieg &Marsh, 2002) and small dykes (e.g. Nkono et al., 2006;Patwardhan & Marsh, 2011). In contrast to the
characteristics of these hypothetical solidification pro-cesses, the slope and intercept of the groundmass arelowest on both sides of the Shanggusi granite porphyryrather than in its center. It should be noted here that thegroundmass texture is a better indicator of the final solidi-fication process after the emplacement of the intrusion, be-cause once the intrusion has crystallized by about 50%(by volume) the intrusion no longer behaves as a magmabut is now a porous crystal mush where the behaviour(motion) of the interstitial melt (or fluids) governs furthercrystallization; thus, it becomes rheologically improbablefor the magma to convect or erupt and it becomes a rigidcrystal mush (Marsh, 1981). In this context, fluids, espe-cially hydrous fluids with low density and viscosity, if pre-sent or injected from other parts of the system, might stillmigrate more easily than the interstitial melt. In addition,the variation trends of the slope and intercept are not arte-facts, as the photomicrographs taken of the samples fromthe center and both sides of the intrusion, presented inFig. 13, display clear obvious crystal size differences.Therefore, these deviations between predicted and mea-sured textures reveal additional processes beyond simplenucleation and growth that have contributed to the finalCSD. These processes may include, for example, crystalsorting, resorption of small crystals, multiple cooling andmagma injection events (Zieg & Marsh, 2002).However, there is another, better, explanation from the
perspective of undercooling that may account for the
Fig. 19. Element co-variation diagrams for all of the samples studied. The regression lines are calculated based on the coarse-grained samples,including group 2 and samples S-7-4 and S-12-4.
JOURNAL OF PETROLOGY VOLUME 53 NUMBER 9 SEPTEMBER 2012
1828
by guest on August 21, 2012
http://petrology.oxfordjournals.org/D
ownloaded from

deviations between the predicted and measured textures.This process has been called fluid circulation and/orlatent heat driven textural coarsening (e.g. Higgins, 1998,1999, 2002a), where undercooling is reduced as a result ofthe release of latent heat and changes in the intercumulusliquid composition. Particularly coarse-grained areas mayreflect focusing of circulating magmatic fluids during tex-tural coarsening (e.g. Higgins, 2002a). Such an interpret-ation may also be partially applied here to explain thespatial textural variation of the profile of the Shanggusigranite porphyry. However, the shallower CSD slope ofthe groundmass on both sides of the intrusion may not beentirely produced by textural coarsening processes; it ismore likely to result from a lower nucleation rate andlonger crystallization time because of a reduction in
undercooling. It is proposed that the migration and hetero-geneous accumulation of fluids controlled the observedtextural variations across the Shanggusi profile (Fig. 22b).Because fluid-bearing melts typically have lower liquidustemperatures than equivalent dry melts, the enrichment offluids can effectively decrease the amount of undercoolingand increase the solidification time. This, combinedwith field observations and quantitative correlations be-tween rock textures and bulk-rock geochemistry, indicatesthat large amounts of fluids were probably trapped atthe top of the intrusion when it was emplaced, resultingin a fluid-controlled final cooling stage rather thanone controlled by isotherm regime alone. This also, tosome extent, contributes to the chemical fractionationof the intrusion as discussed above. Thus, fluid
Fig. 20. Element and element ratios vs Lmax variation diagrams for all the studied samples. The regression lines are calculated based on thecoarse-grained samples, including group 2 and samples S-7-4 (Lmax¼ 2·08mm) and S-12-4 (Lmax¼1·19mm).
YANG SHANGGUSI GRANITE PORPHYRY SOLIDIFICATION
1829
by guest on August 21, 2012
http://petrology.oxfordjournals.org/D
ownloaded from

migration-controlled undercooling, rather than the heattransfer-controlled undercooling, played a major role inthe cooling history of the intrusion, and this solidificationprocess may be a common phenomenon for shallow-level,fluid-rich granitic intrusions.
CONCLUSIONSBy integrating the geological, geochemical, mineralogicaland textural data, the solidification processes for theShanggusi granite porphyry can be summarized intothree main stages as follows.
(1) The magma in the deep magma chamber partiallycrystallized producing quartz and feldspar pheno-crysts (Fig. 23a), and the phenocryst-bearing magma
was subsequently transported adiabatically to theshallow crust. Because of the sudden drop in pressure,the temperature of the water-undersaturated magmawas brought closer to its liquidus temperature, result-ing in the resorption of the phenocrysts of quartz andfeldspar. Meanwhile, fluids, formed as the result ofcrystallization or injected from other parts of thesystem, migrated to the outer zone of the intrusionand accumulated at the top, from where they wereprevented from leaking by the surroundingfine-grained pantellerite wall-rock (Fig. 23b).
(2) Because of the fluid exsolution and drop in tempera-ture, the residual melt in the outer part of the intru-sion began to crystallize rapidly. The nucleationrate suddenly changed to a new exponential rate andcontributed to the typical porphyritic texture
Fig. 21. Element and element ratios vs slope variation diagrams for all the studied samples. The regression lines are calculated based on thecoarse-grained samples, including group 2 and samples S-7-4 and S-12-4. Group 3 data are very scattered and the three best-fit dashed linesare drawn by ignoring the outliers.
JOURNAL OF PETROLOGY VOLUME 53 NUMBER 9 SEPTEMBER 2012
1830
by guest on August 21, 2012
http://petrology.oxfordjournals.org/D
ownloaded from

characterized by two-stage crystallization processes.However, as large amounts of fluid were concentratedat the top of the intrusion, the undercooling of theresidual melt was not exclusively controlled by thetemperature difference between the intrusion andits wall-rocks. It is the enrichment of fluid thatdecreased the degree of undercooling, resulting inan increase of the crystallization time on bothsides of the intrusion that are different from those ofidealized theoretical models in which the crystalliza-tion time decreases from core to margin of anintrusion.
(3) During the solidification of the outer part of the intru-sion, fluid exsolution in the inner zone of the intrusionnot only effectively increased the undercooling butalso produced an increase in the volume, so that themagma expanded enough to fracture the overlyingrocks and the outer zone of the intrusion.The residualmelts in the inner zone of the intrusion were emplacedinto these fractures (Fig. 23c) and solidified to formthe granite dykes that are observed in the field(Fig. 23d). It should be noted that the typical
phenocrysts do not exist in these granite dykes, whichmight be explained as follows: (a) the interiormagma experienced a very low degree of undercool-ing that prevented its crystallization; (b) even if asmall amount of crystallization occurred in the deepmagma chamber, the temperature of the interiormagma chamber might be closer to its liquidus tem-perature for long enough to dissolve almost all thephenocrysts. The granite dykes might not representdifferentiated melts generated by fractional crystal-lization of the phenocryst-bearing magma, as boththe fine- and coarse-grained samples have similarcompositions and contents of rock-forming minerals,and the incompatible trace element contents of thefine-grained samples are lower than those of thecoarse-grained samples. The earlier intruded graniteporphyry (coarse-grained samples) and the laterintruded granite dykes (fine-grained samples) possiblyrepresent the outer part and inner part of the intru-sion respectively, indicating that the incompatibleelement enrichment at the top of the intrusion maybe the result of fluid transportation.
Fig. 22. (a, b) Idealized solidification processes in an intrusion showing different trends of CSD slope, intercept, and Lmax for a single closedsystem. Here only CL (^1/slope) is represented.The undercooling in (a) is mainly controlled by the actual temperature (heat transfer-controlledundercooling), whereas in (b) the migration of fluids effectively changes the liquidus temperature, which mainly controls the undercooling(fluid migration-controlled undercooling). It should be noted that the lowest undercooling in (b) is produced between the margin and thecenter of the intrusion, and its exact location is determined by the variation trend of the liquidus temperature and isotherms. The simplifiedCSDs [inset between (a) and (b)] show the relationship between ln(n) and Lmax in a single closed system; the numbers 2, 4 and 8 show the dis-tinct characteristic length (L).
YANG SHANGGUSI GRANITE PORPHYRY SOLIDIFICATION
1831
by guest on August 21, 2012
http://petrology.oxfordjournals.org/D
ownloaded from

The results of this study are consistent with an increas-ing number of CSD studies indicating that texturalcoarsening can occur during magma solidification pro-cesses and may not necessarily significantly change thebulk chemical composition of the rocks. However, the tex-tural coarsening process may be associated with the migra-tion of fluids, resulting in the redistribution of somefluid-mobile incompatible elements. Textural coarsen-ing would then be accompanied by changes in the abun-dances of these trace elements; however, this process ismuch less likely to cause changes in major elementcompositions.The quantitative textural characteristics of samples ob-
tained from a horizontal outcrop profile of the Shanggusigranite porphyry reveal a solidification process associatedwith fluid migration-controlled undercooling, which differsfrom conventional models of heat transfer-controlledundercooling. If the liquidus temperature of the residual
melt in an intrusion shows significant variation betweenthe margin and the core, the fluid migration-controlledundercooling model could play a leading role; otherwise,the cooling history of an intrusion would be controlled byconductive heat transfer.This study indicates that internal heterogeneities within
apparently homogeneous magma bodies can be measuredand interpreted by detailed, quantitative textural analysis,consistent with other recent CSD studies (e.g. Mock et al.,2003). A model of fluid migration-controlled undercoolingis proposed for the Shanggusi porphyry, based on the cor-relation of quantitative textural data and geochemicaldata. Further work is required to demonstrate if thismodel has more general applicability. This study suggeststhat quantitative correlations between textural andbulk-rock chemical characteristics can provide importantphysico-chemical constraints on our understanding ofmagma solidification processes.
Fig. 23. Sketch of the possible solidification processes in the Shanggusi granite porphyry. (a) Quartz and feldspar (mainly alkali feldspar) crys-tallized in a deep magma chamber. (b) The crystal-bearing, H2O-undersaturated magma ascends adiabatically to the shallow crust; fluids mi-grate to the outer zone of the intrusion and are prevented from leaking by the fine-grained pantellerite wall-rocks, giving rise to a decrease ofliquidus temperature and undercooling; higher undercooling is generated in the inner zone as the result of fluid loss. (c) Fine-grained granitedykes emplaced into the solidified or crystal mush of the granite porphyry and wall-rock. (d) The observed profile. (Note the three representa-tive samples showing different degrees of undercooling across the profile.) The dashed grey curve in (b), (c) and (d) qualitatively separates thelow undercooling region from the high undercooling region.
JOURNAL OF PETROLOGY VOLUME 53 NUMBER 9 SEPTEMBER 2012
1832
by guest on August 21, 2012
http://petrology.oxfordjournals.org/D
ownloaded from

ACKNOWLEDGEMENTSI am very grateful to Zhao-Hua Luo, Xin-Xiang Lu, Bi-HeChen and Fan Huang for their help in the field.Laboratory assistance and discussions with Ying Pan,Dan-Feng Huang, Li-Lu Cheng and Jiu-Long Zhou aremuch appreciated. Xiang-Kun Ge is also thanked for helpwith the microprobe analysis. Dan J. Morgan generouslyprovided CSDSlice and suggestions on the identificationof crystal shape, and is gratefully acknowledged.Constructive and thorough reviews by Bruce D. Marshand Michael D. Higgins, and comments from MarjorieWilson greatly improved the quality of the paper. I finallyowe many thanks to Chen-Guang Sun and Xiao-Wei Lifor their comments and help with the English language.
FUNDINGThis work is partially supported by the key scientific andtechnological projects on the geology and mineral re-sources of Henan Province (26417), an open research grantfrom the State Key Laboratory of Geological Processesand Mineral Resources, China University of Geosciences(GMPR201031) and the Fundamental Research Funds forthe Central Universities (2011PY0157).
SUPPLEMENTARY DATASupplementary data for this paper are available at Journalof Petrology online.
REFERENCESArmienti, P., Pareschi, M. T., Innocenti, F. & Pompilio, M. (1994).
Effects of magma storage and ascent on the kinetics of crystal-growthçthe case of the 1991^93 Mt Etna eruption. Contributions toMineralogy and Petrology 115, 402^414.
Armienti, P., Francalanci, L. & Landi, P. (2007). Textural effects ofsteady state behavior of the Stromboli feeding system. Journal ofVolcanology and Geothermal Research 160, 86^98.
Bindeman, I. N. (2003). Crystal sizes in evolving silicic magma cham-bers. Geology 31, 367^370.
Bindeman, I. N. (2005). Fragmentation phenomena in populations ofmagmatic crystals. American Mineralogist 90, 1801^1815.
Blundy, J. & Cashman, K. (2001). Ascent-driven crystallisation ofdacite magmas at Mount St Helens, 1980^1986. Contributions to
Mineralogy and Petrology 140, 631^650.Boorman, S., Boudreau, A. & Kruger, F. J. (2004). The Lower Zone^
Critical Zone transition of the Bushveld Complex: A quantitativetextural study. Journal of Petrology 45, 1209^1235.
Borchert, M., Wilke, M., Schmidt, C., Cauzid, J. & Tucoulou, R.(2010). Partitioning of Ba, La, Yb and Y between haplograniticmelts and aqueous solutions: An experimental study. Chemical
Geology 276, 225^240.Boudreau, A. E. (1995). Crystal aging and the formation of fine-scale
igneous layering. Mineralogy and Petrology 54, 55^69.Boudreau, A., Mathez, E. & McCallum, I. (1986). Halogen geochem-
istry of the Stillwater and Bushveld Complexes: evidence for trans-port of the platinum-group elements by Cl-rich fluids. Journal ofPetrology 27, 967^986.
Cabane, H., Laporte, D. & Provost, A. (2001). Experimental investiga-tion of the kinetics of Ostwald ripening of quartz in silicic melts.Contributions to Mineralogy and Petrology 142, 361^373.
Candela, P. A. (1997). A review of shallow, ore-related granites:Textures, volatiles, and ore metals. Journal of Petrology 38, 1619^1633.
Cashman, K.V. & Ferry, J. M. (1988). Crystal size distribution (CSD)in rocks and the kinetics and dynamics of crystallization III:Metamorphic crystallization. Contributions to Mineralogy and Petrology
99, 401^415.Cashman, K. & Marsh, B. (1988). Crystal size distribution (CSD) in
rocks and the kinetics and dynamics of crystallization II:Makaopuhi lava lake. Contributions to Mineralogy and Petrology 99,292^305.
DeHoff, R. T. (1991). A geometrically general theory of diffusion con-trolled coarsening. Acta Metallurgia et Materialia 39, 2349^2360.
Dulski, P. (1994). Interferences of oxide, hydroxide and chloride ana-lyte species in the determination of rare-earth elements in geolo-gical samples by inductively-coupled plasma-mass spectrometry.FreseniusJournal of Analytical Chemistry 350, 194^203.
Eberl, D. D., Kile, D. E. & Drits,V. A. (2002). On geological interpret-ations of crystal size distributions: Constant vs. proportionategrowth. American Mineralogist 87, 1235^1241.
Elliott, M. T., Cheadle, M. J. & Jerram, D. A. (1997). On the identifi-cation of textural equilibrium in rocks using dihedral angle meas-urements. Geology 25, 355^358.
Ferlito, C. & Lanzafame, G. (2010). The role of supercritical fluids inthe potassium enrichment of magmas at Mount Etna volcano(Italy). Lithos 119, 642^650.
Garrido, C. J., Kelemen, P. B. & Hirth, G. (2001).Variation of coolingrate with depth in lower crust formed at an oceanic spreadingridge: Plagioclase crystal size distributions in gabbros fromthe Oman ophiolite. Geochemistry, Geophysics, Geosystems 2,2000GC000136.
Gualda, G. A. R. & Rivers, M. (2006). Quantitative 3D petrog-raphy using X-ray tomography: Application to Bishop Tuffpumice clasts. Journal of Volcanology and Geothermal Research 154,48^62.
Higgins, M. D. (1994). Numerical modeling of crystal shapes in thinsections: estimation of crystal habit and true size. American
Mineralogist 79, 113^119.Higgins, M. D. (1996). Magma dynamics beneath Kameni volcano,
Thera, Greece, as revealed by crystal size and shape measure-ments. Journal of Volcanology and Geothermal Research 70, 37^48.
Higgins, M. D. (1998). Origin of anorthosite by textural coarsening:Quantitative measurements of a natural sequence of textural devel-opment. Journal of Petrology 39, 1307^1323.
Higgins, M. D. (1999). Origin of megacrysts in granitoids by texturalcoarsening: a crystal size distribution (CSD) study of microclinein the Cathedral Peak Granodiorite, Sierra Nevada, California.In: Castro, A., Fernandez, C. & Vigneresse, J.-L. (eds)Understanding Granites. Integrating New and Classical Techniques.
Geological Society, London, Special Publications 168, 207^219.Higgins, M. D. (2000). Measurement of crystal size distributions.
American Mineralogist 85, 1105^1116.Higgins, M. D. (2002a). A crystal size-distribution study of the
Kiglapait layered mafic intrusion, Labrador, Canada: evidence fortextural coarsening. Contributions to Mineralogy and Petrology 144,314^330.
Higgins, M. D. (2002b). Closure in crystal size distributions (CSD),verification of CSD calculations, and the significance of CSD fans.American Mineralogist 87, 171^175.
Higgins, M. D. (2006a). QuantitativeTextural Measurements in Igneous and
Metamorphic Petrology. Cambridge: Cambridge University Press.
YANG SHANGGUSI GRANITE PORPHYRY SOLIDIFICATION
1833
by guest on August 21, 2012
http://petrology.oxfordjournals.org/D
ownloaded from

Higgins, M. D. (2006b).Verification of ideal semi-logarithmic, lognor-mal or fractal crystal size distributions from 2D datasets. Journalof Volcanology and Geothermal Research 154, 8^16.
Higgins, M. D. (2009). The Cascadia megathrust earthquake of 1700may have rejuvenated an isolated basalt volcano in westernCanada: Age and petrographic evidence. Journal of Volcanology andGeothermal Research 179, 149^156.
Higgins, M. D. (2011). Textural coarsening in igneous rocks.International Geology Review 53, 354^376.
Higgins, M. D. & Chandrasekharam, D. (2007). Nature ofsub-volcanic magma chambers, Deccan Province, India: Evidencefrom quantitative textural analysis of plagioclase megacrysts inthe giant plagioclase basalts. Journal of Petrology 48, 885^900.
Higgins, M. D. & Meilleur, D. (2009). Development and emplacementof the Inyo Domes Magmatic Suite, California: Evidence from geo-logical, textural (CSD) and geochemical observations of ash andlava. Journal of Volcanology and Geothermal Research 186, 280^292.
Higgins, M. D. & Roberge, J. (2003). Crystal size distribution ofplagioclase and amphibole from Soufrie' re Hills volcano,Montserrat: Evidence for dynamic crystallization-textural coarsen-ing cycles. Journal of Petrology 44, 1401^1411.
Higgins, M. D. & Roberge, J. (2007). Three magmatic components inthe 1973 eruption of Eldfell volcano, Iceland: Evidence from plagio-clase crystal size distribution (CSD) and geochemistry. Journal ofVolcanology and Geothermal Research 161, 247^260.
Hu, N. G., Yang, J. X., An, S. Y. & Hu, J. M. (1993). Metamorphismand tectonic evolution of the Shangdan Fault Zone, Shaanxi,China. Journal of Metamorphic Geology 11, 537^548.
Inanli, F. O. & Huff,W. D. (2009). Quartz crystal size distribution ofthe Ordovician Millbrig K-bentonite. Journal of Volcanology and
Geothermal Research 184, 285^291.Jerram, D. A., Cheadle, M. J., Hunter, R. H. & Elliott, M. T. (1996).
The spatial distribution of grains and crystals in rocks.Contributions to Mineralogy and Petrology 125, 60^74.
Jerram, D. A., Cheadle, M. J. & Philpotts, A. R. (2003). Quantifyingthe building blocks of igneous rocks: Are clustered crystal frame-works the foundation? Journal of Petrology 44, 2033^2051.
Keppler, H. & Wyllie, P. J. (1990). Role of fluids in transport and frac-tionation of uranium and thorium in magmatic processes. Nature348, 531^533.
Lifshitz, I. M. & Slyozov, V. V. (1961). The kinetics of precipitationfrom supersaturated solid solutions. Journal of Physics and Chemistry
of Solids 19, 35^50.Magee, C., O’Driscoll, B. & Chambers, A. D. (2010). Crystallization
and textural evolution of a closed-system magma chamber: insightsfrom a crystal size distribution study of the Lilloise layered intru-sion, East Greenland. Geological Magazine 147, 363^379.
Mao, J. W., Xie, G. Q., Bierlein, F., Qu, W. J., Du, A. D., Ye, H. S.,Pirajno, F., Li, H. M., Guo, B. J., Li, Y. F. & Yang, Z. Q. (2008).Tectonic implications from Re^Os dating of Mesozoic molyb-denum deposits in the East Qinling^Dabie orogenic belt.Geochimica et Cosmochimica Acta 72, 4607^4626.
Marsh, B. D. (1981). On the crystallinity, probability of occurrence,and rheology of lava and magma. Contributions to Mineralogy and
Petrology 78, 85^98.Marsh, B. D. (1988). Crystal size distribution (CSD) in rocks and the
kinetics and dynamics of crystallization I. Theory. Contributions toMineralogy and Petrology 99, 277^291.
Marsh, B. D. (1998). On the interpretation of crystal size distributionsin magmatic systems. Journal of Petrology 39, 553^599.
Marsh, B. D. (2007). Crystallization of silicate magmas decipheredusing crystal size distributions. Journal of the American Ceramic
Society 90, 746^757.
Mattauer, M., Matte, P., Malavieille, J., Tapponnier, P., Maluski, H.,Qin, X., Lun, L. & Qin, T. (1985). Tectonics of the Qinling belt:build-up and evolution of eastern Asia. Nature 317, 496^500.
Meng, Q. R. & Zhang, G.W. (1999). Timing of collision of the Northand South China blocks: Controversy and reconciliation. Geology27, 123^126.
Meng, Q. R. & Zhang, G.W. (2000). Geologic framework and tectonicevolution of the Qinling orogen, central China.Tectonophysics 323,183^196.
Mills, R. D., Ratner, J. J. & Glazner, A. F. (2011). Experimental evi-dence for crystal coarsening and fabric development during tem-perature cycling. Geology 39, 1139^1142.
Mock, A. & Jerram, D. A. (2005). Crystal size distributions (CSD) inthree dimensions: Insights from the 3D reconstruction of a highlyporphyritic rhyolite. Journal of Petrology 46, 1525^1541.
Mock, A., Jerram, D. A. & Breitkreuz, C. (2003). Using quantitativetextural analysis to understand the emplacement of shallow-levelrhyolitic laccolithsçA case study from the Halle VolcanicComplex, Germany. Journal of Petrology 44, 833^849.
Morgan, D. J. & Jerram, D. A. (2006). On estimating crystal shape forcrystal size distribution analysis. Journal of Volcanology and
Geothermal Research 154, 1^7.Morgan, D. J., Jerram, D. A., Chertkoff, D. G., Davidson, J. P.,
Pearson, D. G., Kronz, A. & Nowell, G. M. (2007). CombiningCSD and isotopic microanalysis: Magma supply and mixing pro-cesses at Stromboli Volcano, Aeolian Islands, Italy. Earth and
Planetary Science Letters 260, 419^431.Moss, S., Russell, J. K., Smith, B. H. S. & Brett, R. C. (2010). Olivine
crystal size distributions in kimberlite. American Mineralogist 95,527^536.
Nkono, C., Femenias, O., Diot, H., Berza, T. & Demaiffe, D. (2006).Flowage differentiation in an andesitic dyke of the Motru DykeSwarm (Southern Carpathians, Romania) inferred from AMS,CSD and geochemistry. Journal of Volcanology and Geothermal Research154, 201^221.
O’Driscoll, B., Donaldson, C. H., Troll, V. R., Jerram, D. A. &Emeleus, C. H. (2007). An origin for harrisitic and granular olivinein the Rum Layered Suite, NWScotland: a crystal size distributionstudy. Journal of Petrology 48, 253^270.
O’Driscoll, B., Stevenson, C. E. & Trolly,V. R. (2008). Mineral lamin-ation development in layered gabbros of the British palaeogene ig-neous province: A combined anisotropy of magnetic susceptibility,quantitative textural and mineral chemistry study. Journal of
Petrology 49, 1187^1221.Pamukcu, A. S., Gualda, G. A. R. & Anderson, A. T. (2012).
Crystallization stages of the Bishop Tuff magma body recorded incrystal textures in pumice clasts. Journal of Petrology 53, 589^609.
Pappalardo, L. & Mastrolorenzo, G. (2010). Short residence times foralkaline Vesuvius magmas in a multi-depth supply system:Evidence from geochemical and textural studies. Earth and
Planetary Science Letters 296, 133^143.Patwardhan, K. & Marsh, B. D. (2011). Dynamics of the development
of the Isle au Haut gabbro^diorite layered complex: quantitativeimplications for mafic^silicic magma interactions. Journal of
Petrology 52, 2365^2395.Ratschbacher, L., Hacker, B. R., Calvert, A.,Webb, L. E., Grimmer, J.
C., McWilliams, M. O., Ireland, T., Dong, S. W. & Hu, J. M.(2003). Tectonics of the Qinling (Central China): tectonostratigra-phy, geochronology, and deformation history. Tectonophysics 366,1^53.
Resmini, R. G. (2007). Modeling of crystal size distributions(CSDs) in sills. Journal of Volcanology and Geothermal Research 161,118^130.
JOURNAL OF PETROLOGY VOLUME 53 NUMBER 9 SEPTEMBER 2012
1834
by guest on August 21, 2012
http://petrology.oxfordjournals.org/D
ownloaded from

Resmini, R. G. & Marsh, B. D. (1995). Steady-state volcanism,paleoeffusion rates, and magma system volume inferred fromplagioclase crystal size distributions in mafic lavasçDomeMountain, Nevada. Journal of Volcanology and Geothermal Research 68,273^296.
Rollinson, H. R. (1993). Using Geochemical Data: Evaluation, Presentation,Interpretation. Harlow: Longman.
Salisbury, M. J., Bohrson, W. A., Clynne, M. A., Ramos, F. C. &Hoskin, P. (2008). Multiple plagioclase crystal populations identi-fied by crystal size distribution and in situ chemical data: implica-tions for timescales of magma chamber processes associated withthe 1915 eruption of Lassen Peak, CA. Journal of Petrology 49,1755^1780.
Simakin, A. G. & Bindeman, I. N. (2008). Evolution of crystal sizesin the series of dissolution and precipitation events in openmagma systems. Journal of Volcanology and Geothermal Research 177,997^1010.
Stemprok, M., Dolejs, D., Muler, A. & Seltmann, R. (2008). Texturalevidence of magma decompression, devolatilization and disequilib-rium quenching: an example from the Western Krusne hory/Erzgebirge granite pluton. Contributions to Mineralogy and Petrology
155, 93^109.Sun, S. S. & McDonough,W. F. (1989). Chemical and isotopic system-
atics of oceanic basalts: implications for mantle composition andprocesses. In: Saunders, A. D. & Norry, M. J. (eds) Magmatism in
the Ocean Basins. Geological Society, London, Special Publications 42,313^345.
Turner, S., George, R., Jerram, D. A., Carpenter, N. &Hawkesworth, C. (2003). Case studies of plagioclase growth andresidence times in island arc lavas from Tonga and the LesserAntilles, and a model to reconcile discordant age information.Earth and Planetary Science Letters 214, 279^294.
Vinet, N. & Higgins, M. D. (2010). Magma solidification processes be-neath Kilauea volcano, Hawaii: a quantitative textural and geo-chemical study of the 1969^1974 Mauna Ulu lavas. Journal of
Petrology 51, 1297^1332.Wagner, C. (1961). Theorie der Alterung von Niederschla« gen durch
Umlosen (Ostwald-reifung). Zeitschrift fu« r Elektrochemie, Berichte derBunsengesellschaft fu« r physikalische Chemie 65, 581^591.
Wang, T., Wang, X. X., Zhang, G. W., Pei, X. Z. & Zhang, C. L.(2003). Remnants of a Neoproterozoic collisional orogenic belt in
the core of the Phanerozoic Qinling orogenic belt (China).Gondwana Research 6, 699^710.
Wang, Y. J., Fan, W. M., Peng, T. P., Zhang, H. F. & Guo, F. (2005).Nature of the Mesozoic lithospheric mantle and tectonic decou-pling beneath the Dabie Orogen, Central China: Evidence fromAr-40/Ar-39 geochronology, elemental and Sr^Nd^Pb isotopiccompositions of early Cretaceous mafic igneous rocks. Chemical
Geology 220, 165^189.Webster, J. D. (1997). Exsolution of magmatic volatile phases from
Cl-enriched mineralizing granitic magmas and implications forore metal transport. Geochimica et Cosmochimica Acta 61, 1017^1029.
Wilkinson, J., Nolan, J. & Rankin, A. (1996). Silicothermal fluid: Anovel medium for mass transport in the lithosphere. Geology 24,1059.
Williams, E., Boudreau, A. E., Boorman, S. & Kruger, F. J. (2006).Textures of orthopyroxenites from the Burgersfort Bulge of the east-ern Bushveld Complex, Republic of South Africa. Contributions toMineralogy and Petrology 151, 480^492.
Yang, Z. F., Luo, Z. H. & Luo, X. X. (2010).Whole rock geochemical,Nd^Pb^Sr isotopic characteristics and Re^Os ages for molybdeniteof the Shangguisi granite porphyry in East Qinling. Geochimica et
Cosmochimica Acta 74, A1179^A1179.Yang, Z. F., Luo, Z. H., Luo, X. X., Huang, F. & Chen, B. H. (2011).
Geological characteristics and prospecting potential of thenewly-discovered Shanggusi porphyry molybdenum deposit in theEast Qinling. Geology and Exploration 47, 1077^1090.
You, Z. D., Han, Y. J., Suo, S. T., Chen, N. S. & Zhong, Z. Q. (1993).Metamorphic history and tectonic evolution of the QinlingComplex, Eastern Qinling Mountains, China. Journal of
Metamorphic Geology 11, 549^560.Zhang, G. W., Yu, Z. P., Sun, Y., Cheng, S. Y., Li, T. H., Xue, F. &
Zhang, C. L. (1989). The major suture zone of the Qinling orogenicbelt. Journal of Southeast Asian Earth Sciences 3, 63^76.
Zhang, G.W., Dong,Y. P., Lai, S. C., Guo, A. L., Meng, Q. R., Liu, S.F., Cheng, S. Y., Yao, A. P., Zhang, Z. Q., Pei, X. Z. & Li, S. Z.(2004). Mianlue tectonic zone and Mianlue suture zone on south-ern margin of Qinling^Dabie orogenic belt. Science in China Series
DçEarth Sciences 47, 300^316.Zieg, M. J. & Marsh, B. D. (2002). Crystal size distributions and scal-
ing laws in the quantification of igneous textures. Journal of
Petrology 43, 85^101.
YANG SHANGGUSI GRANITE PORPHYRY SOLIDIFICATION
1835
by guest on August 21, 2012
http://petrology.oxfordjournals.org/D
ownloaded from

JOURNAL OFPETROLOGYVOLUME 53 NUMBER 9 SEPTEMBER 2012
JOURNAL OFPETROLOGYVOLUME 53 NUMBER 9 SEPTEMBER 2012
www.petrology.oxfordjournals.org
ISSN 1460-2415 (ONLINE)ISSN 0022-3530 (PRINT)
jo
ur
na
l o
f p
etr
olo
gy
VO
LUM
E 53 NU
MB
ER 9 SEP
TEM
BER
2012
1767 R. SPIESS, R. DIBONA, E. RYBACKI, R. WIRTH AND G. DRESENDepressurized Cavities within High-strain Shear Zones: their Role in the Segregation and Flow of SiO2-rich Melt in Feldspar-dominated Rocks
1777 J. ANDÚJAR AND B. SCAILLETExperimental Constraints on Parameters Controlling the Difference in the Eruptive Dynamics of Phonolitic Magmas: the Case of Tenerife (Canary Islands) [S]
1807 Z.-F. YANGCombining Quantitative Textural and Geochemical Studies to Understand the Solidification Processes of a Granite Porphyry: Shanggusi, East Qinling, China [S]
1837 R. R. ALMEEV, T. BOLTE, B. P. NASH, F. HOLTZ, M. ERDMANN AND H. E. CATHEYHigh-temperature, low-H2O Silicic Magmas of the Yellowstone Hotspot: an Experimental Study of Rhyolite from the Bruneau–Jarbidge Eruptive Center, Central Snake River Plain, USA [S]
1867 D. W. PEATE, I. U. PEATE, M. C. ROWE, J. M. THOMPSON AND A. C. KERRPetrogenesis of High-MgO Lavas of the Lower Mull Plateau Group, Scotland: Insights from Melt Inclusions [S]
1887 S. M. LIMA, F. CORFU, A. M. R. NEIVA AND J. M. F. RAMOSDissecting Complex Magmatic Processes: an in-depth U–Pb Study of the Pavia Pluton, Ossa–Morena Zone, Portugal [S]
1913 A. C. HUNT, I. J. PARKINSON, N. B. W. HARRIS, T. L. BARRY, N. W. ROGERS AND M. YONDONCenozoic Volcanism on the Hangai Dome, Central Mongolia: Geochemical Evidence for Changing Melt Sources and Implications for Mechanisms of Melting [S]
1943 O. PLÜMPER, S. PIAZOLO AND H. AUSTRHEIMOlivine Pseudomorphs after Serpentinized Orthopyroxene Record Transient Oceanic Lithospheric Mantle Dehydration (Leka Ophiolite Complex, Norway) [S]
[S] Contains supplementary data available at Journal of Petrology online.
petrology_53_9_Cover.indd 1petrology_53_9_Cover.indd 1 16-08-2012 11:55:5016-08-2012 11:55:50