pfc emissions from australian & global aluminium production
TRANSCRIPT

PFC emissions from Australian & global aluminium production
CSIRO Marine and Atmospheric Research: Light Metals FlagshipPaul Fraser, C. Trudinger, B. Dunse, P. Krummel & P. Steele
2009 ESRL Global Monitoring Annual ConferenceBoulder, Colorado, 13 - 14 May 2009
SIO: J. Mühle, P. Salameh, R. Weiss & C. Harth MIT: A. Ganesan, R. Prinn NOAA ESRL: B. Miller Hydro Aluminium: P. Reny

PFC emissions from Australian & global aluminium production
Perfluorocarbons (PFCs) from aluminium production
PFCs (CF4, C2F6) are released to the atmosphere from aluminium production (during anode events) & by the electronics industry (plasma etching, cleaning etc)
normal operation: 2Al2O3 + 3C → 4Al + 3CO2anode event (AE): Na3AlF6 + nC → (CF2)n → CF4, C2F6….typical AE frequency: 0.2-1.5 per cell per day (150-300 cells/smelter)typical AE duration: 2 minutesAl2O3 feed control technology critical in determining anode event frequency
Direct CO2-e emissions from aluminium smelting: 2-4 tonnes CO2-e/tonne AlPFCs account for ~20%CO2 from anode consumption accounts for 65%, CO2 from anode baking 15%CO2-e emissions from electricity generation: 14-19 tonnes CO2/tonne Al (coal)

PFC emissions from Australian & global aluminium production
Global aluminium production (IAI 2009, ABARE 2009)
Global aluminium production 2009 will likely decline 9% from 2008Significant zonal change (Europe, N. America →Asia) in PFC emissions pattern
1990: Asia 5%, EU, N. America 50%; 2007: Asia 40%, EU, N. America 25%

PFC emissions from Australian & global aluminium production
PFC-14 (CF4) emissions from atmospheric observations
UNFCCC data: 40% of aluminium smelting in countries not reporting to UNFCCCCF4 emissions (UNFCCC Tier 2) from aluminium, electronics: ~50% of global emissionsMissing CF4 source(s)?

PFC emissions from Australian & global aluminium production
Future global PFC-14 (CF4) emissions
CF4 emissions set to rise again: unlikely to follow the current IPCC scenariosindustry estimates & IPCC scenarios are 50% lower,100% higher than actual emissions

PFC emissions from Australian & global aluminium production
Australia/NZ smelters & AGAGE PFC monitoring sites(Cape Grim, Aspendale)
Australian/NZ smelters: 2.3 M tonnes aluminium/year, 6% of global productionPortland/Pt Henry/Bell Bay: 0.8 M tonnes/year, 40% of Australia’s production PFC plumes (Portland, Pt Henry & Bell Bay) observed regularly at Cape Grim & Aspendale

PFC emissions from Australian & global aluminium production
PFC observations at Cape Grim & Aspendale
PFC-14 ~1%/year (2%/year above background); PFC-116 ~3%/year
PFC emissions from Australian & global aluminium production
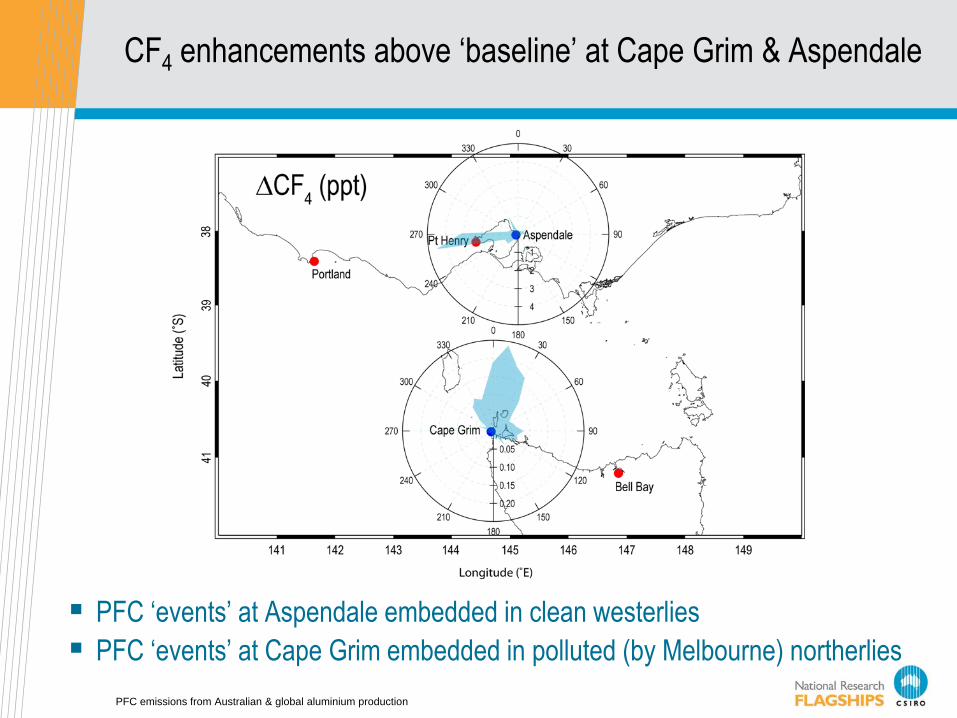
CF4 enhancements above ‘baseline’ at Cape Grim & Aspendale
PFC ‘events’ at Aspendale embedded in clean westerliesPFC ‘events’ at Cape Grim embedded in polluted (by Melbourne) northerlies

PFC emissions from Australian & global aluminium production
PFC-14, PFC-116, benzene enhancements at Aspendale
C2F6/CF4 mass emission ratio: 0.10±0.03 (IPCC 0.12±0.01)No CHF3 emissions observed

PFC emissions from Australian & global aluminium production
PFC plumes from Portland, Pt Henry and Bell Bay smelters: TAPM 3D transport model simulation May 2004

PFC emissions from Australian & global aluminium production
PFC-14 pollution events at Cape Grim: observed & modelled
Model CF4 annual emissions from Portland/Pt Henry/Bell Bay smelters scaled to match observations

PFC emissions from Australian & global aluminium production
Australian PFC-14 emission factors (kg CF4/tonne Al)
Significant technology changes in early 1990s and 2005/2006IAI targets: EF reductions from 1990 by 2010 (80%) and by 2020 (93%)
PFC emissions from Australian & global aluminium production
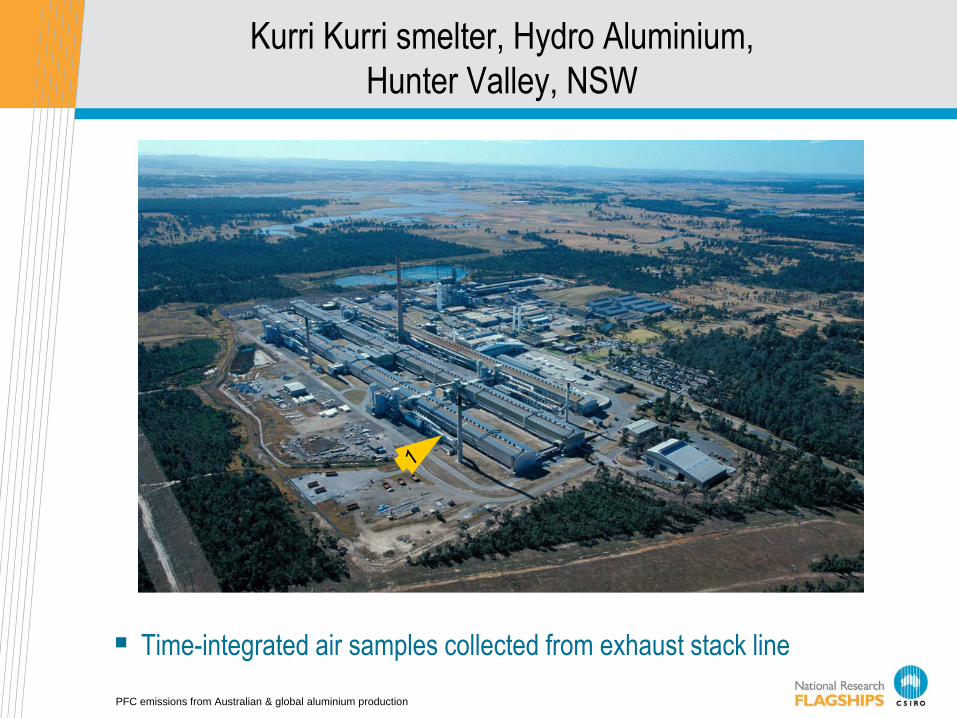
Kurri Kurri smelter, Hydro Aluminium,Hunter Valley, NSW
Time-integrated air samples collected from exhaust stack line

PFC emissions from Australian & global aluminium production
PFC, CO2 & other emissions at Kurri Kurri, April 2008
concentration CF4 C2F6 C3F8 COS HF CO2
ppt ppt ppt ppm ppm ppmKurri Kurri pot line exhaust 16300 250 44 2.4 3.1 4920
pot line shed 130 8.3 1.1 0.002 416smelter ambient 81 4.2 0.6 0.001 383
Cape Grim Apr 2008 77 3.8 0.5 0.001 382
emission factors CF4 C2F6 C3F8 COS HF CO2
g/tonne Al t/tonne AlKurri Kurri 18 0.43 0.10 63 30 0.96SE Australian smelters 53 5.3IAI (PFPB, CWPB) 38-64 4.5-7.7 1.59NGGI (2006) 40 5 1.59

PFC emissions from Australian & global aluminium production
Conclusionsglobal CF4 emissions peaked in the 1980s at close to 20 k tonnes per year, then declined & stabilised at 10 k tonnes per year since the early 2000sbottom-up estimates of emissions from the aluminium (IAI) and electronics (EDGAR) industries underestimate total current CF4 emissions by a factor of 2UNFCCC underestimates global CF4 emissions because 40% of aluminium producing countries do not report to UNFCCCglobal CF4 emissions set to rise again, but unlikely to follow IPCC-TAR scenarios (100% higher than actual emissions)aluminium smelter PFC emissions & emission factors can be derived from strategically located atmospheric monitoring stations or by exhaust gas sampling at smeltersaluminium smelters emit at least 3 PFCs: CF4, C2F6, C3F8, but no HFCs, c-C4F8?at Kurri Kurri, the exhaust gas extraction system collects >95% of PFCs producedin 2006 Australian aluminium smelters emitted ~120 tonnes PFCs (800 k tonnes CO2-e) and 3100 k tonnes CO2 (PFCs: 20%) ($27M @ $25/tonne C)Australian smelters should meet the 2010 IAI target for reduced emission factorsthe 2020 target presents a significant challenge for aluminium producers
This paper is dedicated to the memory of Derek Cunnold – thank you
CSIRO Marine and Atmospheric ResearchPaul FraserChief Research Scientist
Phone: +61 3 9239 4613Email: [email protected]: www.csiro.au/group
Contact UsPhone: 1300 363 400 or +61 3 9545 2176Email: [email protected] Web: www.csiro.au

PFC emissions from Australian & global aluminium production
A new method for determining PFC emission factors
∆PFC = PFC (downwind) – PFC (upwind)∆CO2 = CO2 (downwind) – CO2 (upwind)EPFC = kPFC * ∆PFCECO2 = kCO2 * ∆CO2
since the sources of CO2 & PFCs are co-located, kPFC = kCO2, thereforeEPFC/ECO2 = ∆PFC/∆CO2
ECO2 = fCO2 * PAl, EPFC = fPFC * PAl, thereforeEPFC/ECO2 = fPFC/fCO2
fPFC = fCO2 * ∆PFC/∆CO2
∆PFC, ∆CO2 can be measured directly, fCO2 is a well constrained factor, therefore fPFC can be estimated
PFC emissions from Australian & global aluminium production
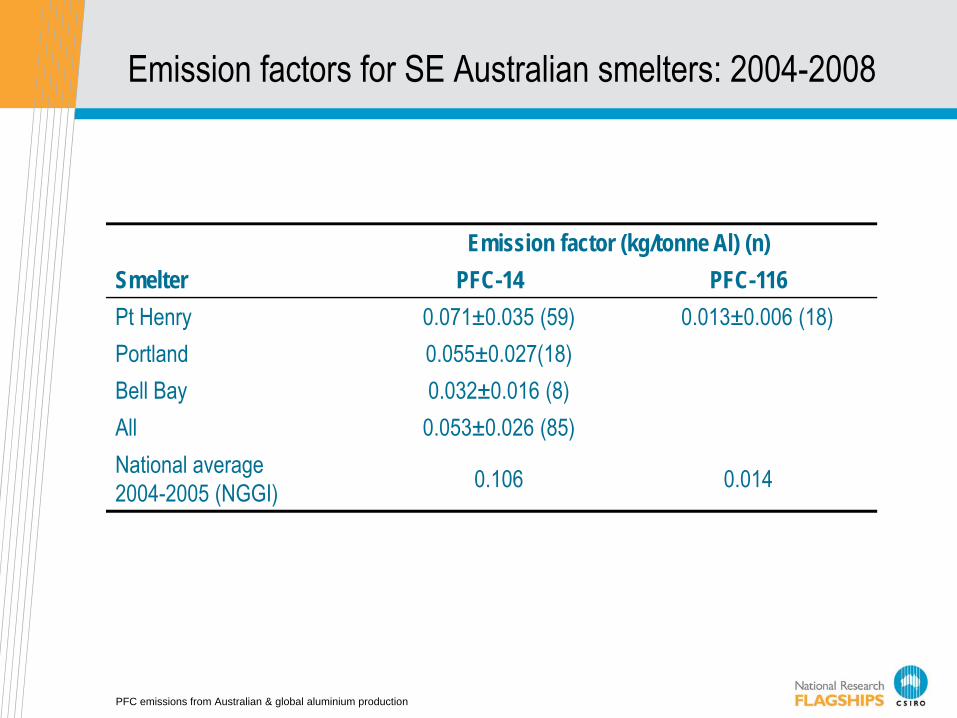
Emission factors for SE Australian smelters: 2004-2008
Emission factor (kg/tonne Al) (n)Smelter PFC-14 PFC-116Pt Henry 0.071±0.035 (59) 0.013±0.006 (18)Portland 0.055±0.027(18)Bell Bay 0.032±0.016 (8)All 0.053±0.026 (85)National average2004-2005 (NGGI) 0.106 0.014

PFC emissions from Australian & global aluminium production
Global PFC-14 emission factors from global PFC emissions and aluminium production
1980s emission factor 1.1 kg PFC per tonne of Alcurrent factor 0.35 kg PFC per tonne of Al

PFC emissions from Australian & global aluminium production
PFCs in the southern hemisphere
PFC-14 concentration doubled since aluminium first producedPFC-14 growth rate slowed after 1980PFC-116 first appeared in the atmosphere in the 1930s
PFC emissions from Australian & global aluminium production
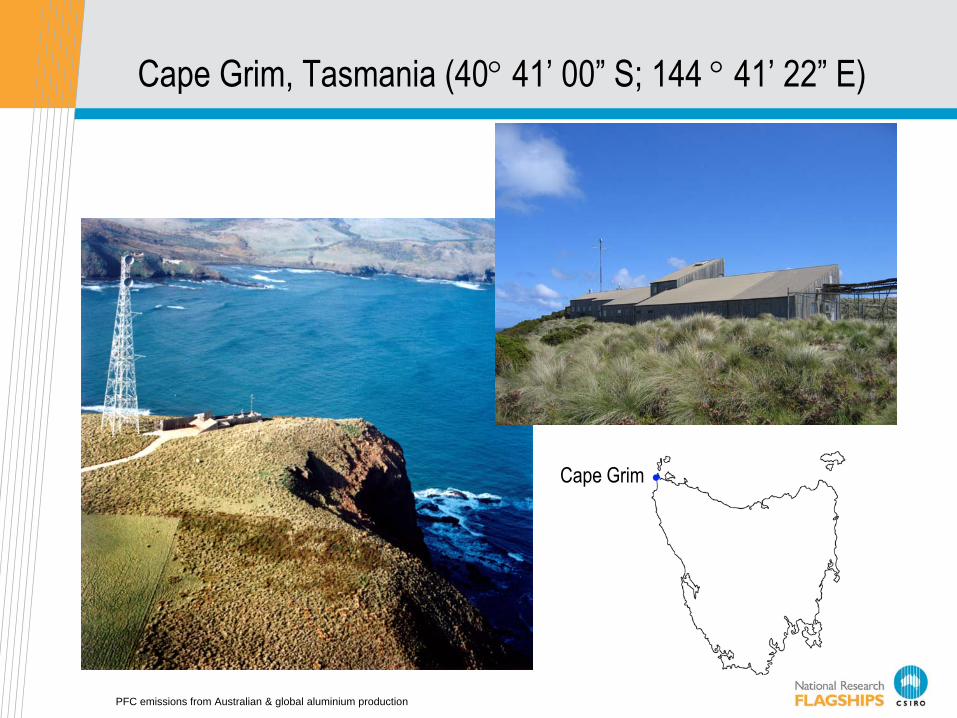
Cape Grim, Tasmania (40° 41’ 00” S; 144 ° 41’ 22” E)
Cape Grim

PFC emissions from Australian & global aluminium production
Global PFC emissions from atmospheric observations using inverse modelling
PFC-14 emissions peaked at 16.7 k tonnes mid-1980s and stabilised at 10.3 k tonnes in the early 2000s.PFC-116 emissions reached 1.5 k tonnes in the early 2000s.
PFC emissions from Australian & global aluminium production
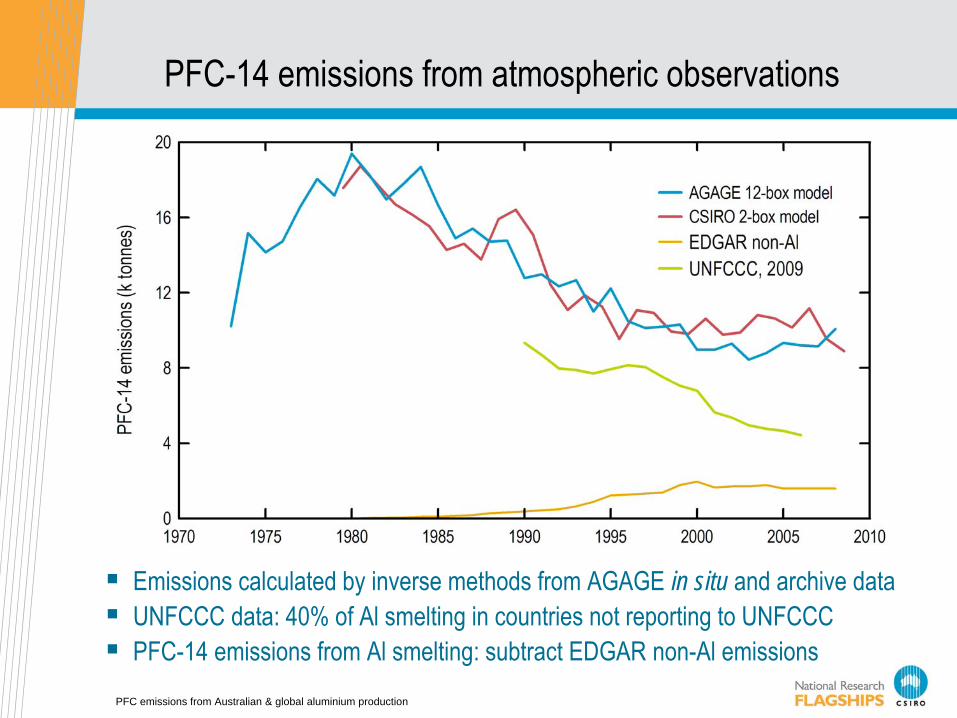
PFC-14 emissions from atmospheric observations
Emissions calculated by inverse methods from AGAGE in situ and archive dataUNFCCC data: 40% of Al smelting in countries not reporting to UNFCCCPFC-14 emissions from Al smelting: subtract EDGAR non-Al emissions

PFC emissions from Australian & global aluminium production
Future global PFC-14 emissions
PFC-14 emissions set to rise again?Unlikely to follow the current IPCC scenarios

PFC emissions from Australian & global aluminium production
PFC-14, PFC-116 enhancements at Cape Grim
north 0.14±0.06
east 0.13±0.08

PFC emissions from Australian & global aluminium production
Global PFC-14 emissions from aluminium smelting
Emissions from atmospheric data are now significantly higher than those obtained from the IAI Anode Effect Survey (May 2009)Has the IAI Anode Effect Survey captured the emissions from China?

PFC emissions from Australian & global aluminium production
PFC-14 (CF4) annual emissions & emission factors
Aluminium production (k tonnes) 2004 2005 2006 2007 2008 2004-2008Bell Bay 162 174 176 176 176 864Portland 355 346 340 358 358 1757Pt Henry 192 187 190 190 190 950Pt Henry/Portland 546 534 530 548 548 2707All 708 707 707 725 725 3571
CF4 annual emissions (tonnes)Bell Bay 5 5 25±14Portland 19 23 13 22 12 90±37 Pt Henry 10 16 9 9 14 58±19 Pt Henry/Portland 30 39 23 29 41 161±53 all 39 48 28 36 39 191±41
CF4 emission factors (kg/tonne)Bell Bay 0.03 0.03 0.03±0.02 (8)Portland 0.06 0.07 0.04 0.06 0.03 0.05±0.02 (47)Pt Henry 0.05 0.09 0.05 0.05 0.08 0.06±0.02 (68)Pt Henry/Portland 0.06 0.07 0.04 0.05 0.08 0.06±0.02 (36)all 0.06 0.07 0.04 0.05 0.05 0.05±0.01 (159)Australia NGGI 0.10 0.11 0.04