pfr syerin
TRANSCRIPT

1.0ABSTRACT
This experiment is to study the saponification reaction between sodium hydroxide and ethyl acetate
in PFR. It is also conducted to determine the relationship of residence time and conversion and how
they affect the reaction rate. In this experiment, equimolar of sodium hydroxide and ethyl acetate
are used. This experiment is carried out for six different flow rates (600mL/min, 500mL/min,
400mL/min, 300mL/min, 200mL/min and 100mL/min). For every flow rates, the conductivities are
recorded and samples are taken and titrated with sodium hydroxide along with 10mL of
hydrochloric acid. The results obtained is then compared with the calbration curve plotted. It is
found that the residence time influent the conversion in such manner that as the residence time
increases increases, the conversion increases and the rate of reaction decreases.
2.0INTRODUCTION
Reactor is one of the important unit operation in chemical industry where various reaction took
place in reactor. In industries, a reactor is design to produce the desired product in low cost but at
high yield. There are are many types of reactors used in today's industries and the usage of the
reactors depends on many criterion and application.
There are three important chemical reactors used, they are batch reactor, continuous flow
reactor(CSTR) and plug flow reactor(PFR). In CSTR, the reaction is a complete mixing reaction
where there is a presence of strirrer or mixer. In PFR, the reaction is also complete mixing reaction
and the shape of the reactor is cylindrical.
In this experiment, it concern the usage of PFR. PFRs are used to model the chemical
transformation of compounds as they are transported in systems resembling "pipes". PFR is the
steady state of tubular reactor (TFR), where it operates at ideal condition. The reactants enter the
cylindrical reactor at one end and exit at another end. In PFR, there are few assumptions made.
They are:
1. no mixing in the axial direction, which is in the direction of the flow
2. complete mixing in the radial direction
3. a uniform velocity profile across the radius
According to Gilmour and Samson, the validity of the assumptions will depend on the geometry of

the reactor and the flow conditions. Deviation which are frequent but not always important are of
two kind:
1. mixing in longitudinal direction due to vortices and turbulence
2. incomplete mixing in radial direction n laminar flow condition
The advantages of using PFR is that it has a high volumetric unit conversion, able to operate for
long periods of time without maintenance, and the heat transfer rate can be optimized by using
more, thinner tubes or fewer, thicker tubes in parallel. Disadvantages of plug flow reactors are that
temperatures are hard to control and can result in undesirable temperature gradients. PFR
maintenance is also more expensive than CSTR maintenance[1].
Plug flow reactors are used for large-scale reactions, fast reactions, homogeneous or heterogeneous
reactions, continuous production and high-temperature reactions[1].
3.0AIM
1. To carry out a saponification reaction between NaOH and Et(Ac) in a PFR
2. To determine the reaction constant
3. To determine the effect of residence time on the conversion in a PFR
4.0THEORY
For different types of reactor, the reaction kinetic for each reactor is different. Therefore, the
equation for each of the reactor is differrent. For PFR, the design equation is
dFA = rA
dV
The residence time distribution is the characteristic of the mixing that occurs in the chemical
reactor. Residence time on the other hand ,is the time for which the reaction can takes place.
Residence time is given by,
τ = VPFR
Vo
The rate of reaction indicates that the rate of disappearance of reactant or the rate of formation of
reactant. For this reaction,

NaOH + CH3COOC2H5 produce CH3COONa + C2H3 OH
the rate of reaction can be represented by,
-rA = k[CA][CB]
where, k is the rate constant, [CA] is the concentration of sodium hydroxide and [CB] is the
concentration of ethyl acetate.
Since the concentration of sodium hydroxide and ethyl acetate are equimolar, the equation can be
reduce to
-rA = k[CA]2
-rA = kCAo (1-X)2
-rA = FAo dX = voCAo dX dV dV
VTFR = vo X kCAo(1-X)
5.0 APPARATUS/MATERIAL
Solteq tubular flow reactor
NaoH(0.1M)
Et(Ac) ().1M)
HCl(0.25M)
phenophthalene
6.0PROCEDURE
Calibration Curve:
1.The following solution are prepared:
a) 0% conversion: 100 ml NaOH
b) 25% conversion: 75ml NaOH + 25mL Na(Ac)
c)50% conversion: 50ml NaOH + 50mL Na(Ac)
d)75% conversion: 25ml NaOH + 75mL Na(Ac)
e) 100% cnversion: 100mL Na(Ac)
2.calibration curve of conductivity vs conversion is plotted.

General Start-up:
1. All valves are ensured to be initially closed except valve V7.
2. The following solutions are prepared:
a.20 liter of sodium hydroxide, NaOH (0.1M)
b.20 liter of ethyl acetate, Et(Ac) (0.1M)
c.1 liter of hydrochloric acid, HCl (0.25M)
3. The feed tank B1 is filled with NaOH solution and tank B2 is filled with Et(Ac) solution.
4. The water jacket B4 and pre-heater B5 are filled with clean water.
5. The power for control panel is turned on.
6. Valves V2, V6, V9, V11 were opened.
7. Both pumps P1 and P2 are switched on. Flow controller at P1 and P2 are adjusted to obtaian
flow of approximately 300 ml/min at both flow meters Fl-01 and Fl-02. Both flowrates are
ensured to be the same.
8. Both solutions are allowed to flow through the reactor R1 and overflow into the waste tank
B3.
9. Valves V13 and V8 are opened. Pump P3 is switched on to circulate the water through pre-
heater B5. The stirrer motor M1 is switched on and the speed is set about 200 ppm to ensure
homogeneous water jacket temperature.
Effect of Residence Time on the Reaction in a PFR:
1. Valves V9 and V11 are opened.
2. Both NaOH and Et(Ac) solutions are allowed to enter the tubular reactor R1 and
empty into the waste tank B3.
3. Pump P1 and P2 flow controller are adjusted to give a constant flow rate of about
300ml/min at flow meter Fl-01 and Fl-02. Both flow rates are ensured to be the same. The
flow rate are recorded.
4. The inlet (Ql-01) and outlet (Ql-02) conductivity values are monitored until they do
not change over time. This is to ensure that the reactor has reached steady state.
5. Both inlet and outlet steady staete conductivity values are recorded. The
concentration of NaOH exiting the reactor and extent of conversion from calibration curve
are found.
6. Sampling valve V15 is opened and 50 ml sample is collected. Back titration is
carried out to determine the concentration of NaOH in the reactor and extend of conversion.

7. The experiment is repeated for steps 3-6 for different residence times by increasing
the feed flow rates of NaOH and Et(Ac) to about 250, 200, 150, 100, 50 ml/min. Both flow
rates are ensured to be the same.
7.0RESULTS
Table 1: Data obtained from the experiment
No Flow rate
of NaOH
(mL/min)
Flow rate
of Et(Ac)
(mL/min)
Total
flow rate
of
solutions,
Vo
(mL/min)
Residenc
e time
(min)
Outlet
conductiv
ity
(mS/cm)
Inlet
conductivit
y (mS/cm)
Conversion,
X
Reaction
rate
constant
(L/
mol.min)
Rate of
reaction
(mol/L.min)
Volume of
NaOH
(cm3)
1 300 300 600 3.3333 5.7 7.9 83.28 7.4713 0.02089 23.4
2 250 250 500 4.0000 5.2 7.8 88.84 9.9507 0.01239 23.7
3 200 200 400 5.000 5.1 7.3 89.96 8.9602 0.00903 23.8
4 150 150 300 66.6667 4.6 7.2 95.52 15.9911 0.00321 27
5 100 100 200 10.0000 4.5 7.0 96.64 14.3810 0.00162 25.5
6 50 50 100 20.0000 3.9 5.7 100 - - 25.4
Table 2: Data obtained from calibration curve
Conversion(%) Conductivity(mS/cm)
0 10.70
25 12.77
50 8.65
75 6.59
100 4.75
8.0SAMPLE CALCULATION
1.From the graph: f(x) = -11.13x + 146.72
where, f(x) is conversion value and x is conductivity value.
A) Calculation of conversion(%)

From the data obtained, for total flow rate = 600 mL/min, the outlet conductivity is 5.7
hence,
f(x) = -12.4x + 157.79
f(x) = -12.4(5.7) + 157.79
= 87.11%
For flow rate of 50 mL/min with the outlet conductivity of 3.9,
f(x) = -12.4x + 157.79
f(x) = -12.4(3.9) + 157.79
= 109.43%
Since, conversion value cannot exceed 100%, the conversion for flow rate of 50 mL/min is 100%.
B) Calculation of residence time,τ
τ = VPFR
Vo where, VPFR is volume of the reactor and Vo is flow rate
For total flow rate = 600 mL/min,
τ = VPFR
Vo τ = 2L (300 x 10-3)L/min = 6.6667 min
CH3–COO–CH2 –CH3 +NaOH→CH3 –COONa+CH3 –CH2 –OH
C) Calculation for reaction constant
Since this reaction is a second order reaction and CAO = CBO, the rate law is,
-rA = kCACB = kCA2 = kCAO(1-X)2
-rA = FAO dX = VoCao dX dV dV
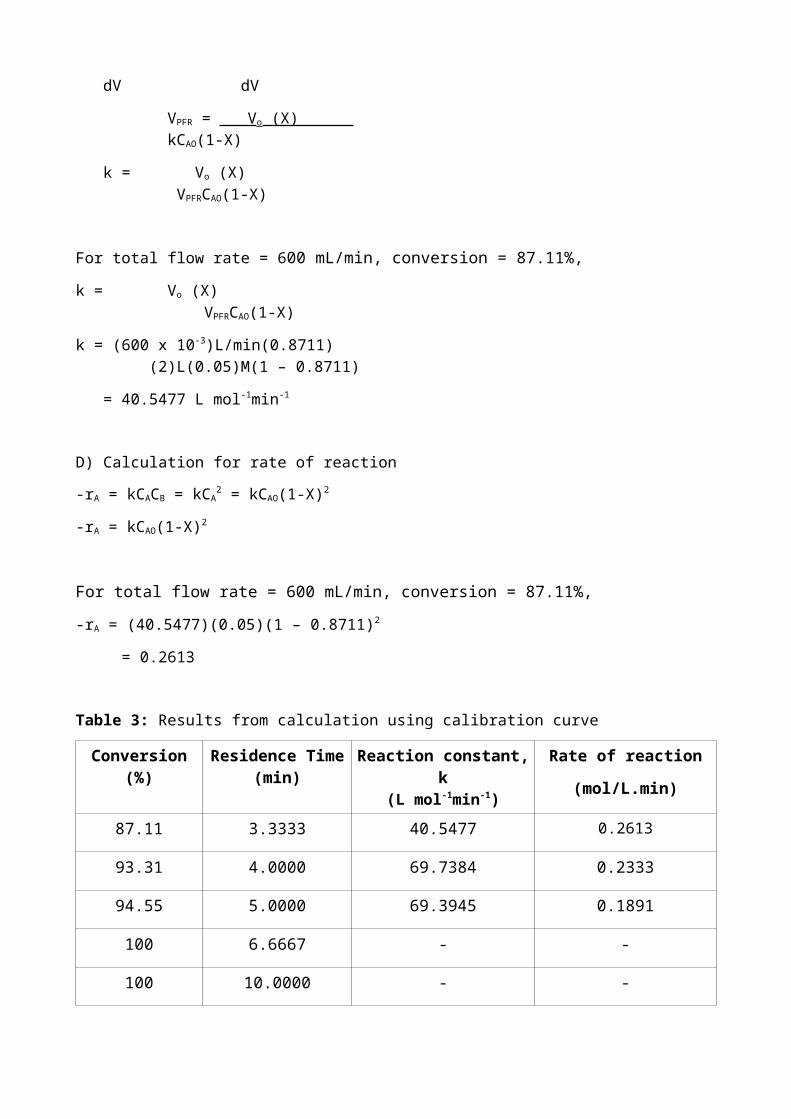
VPFR = Vo (X) kCAO(1-X)
k = Vo (X) VPFRCAO(1-X)
For total flow rate = 600 mL/min, conversion = 87.11%,
k = Vo (X) VPFRCAO(1-X)
k = (600 x 10-3)L/min(0.8711)

(2)L(0.05)M(1 – 0.8711)
= 40.5477 L mol-1min-1
D) Calculation for rate of reaction
-rA = kCACB = kCA2 = kCAO(1-X)2
-rA = kCAO(1-X)2
For total flow rate = 600 mL/min, conversion = 87.11%,
-rA = (40.5477)(0.05)(1 – 0.8711)2
= 0.2613
Table 3: Results from calculation using calibration curve
Conversion (%) Residence Time(min)
Reaction constant, k(L mol-1min-1)
Rate of reaction
(mol/L.min)
87.11 3.3333 40.5477 0.2613
93.31 4.0000 69.7384 0.2333
94.55 5.0000 69.3945 0.1891
100 6.6667 - -
100 10.0000 - -
100 20.0000 - -
2. By using data obtained from titration
A) Calculation of conversion
Concentration = (VHCl)(CHCl) – (VnaOH)(CNaOH) volume of reaction mixture
For total flow rate = 600 mL/min,
Concentration = (10)(0.25) – (23.4)(0.1)
50= 0.0032 M
Conversion, X = 1 – CA CAO
= 1- 0.0024

0.05
= 0.936
B) Calculation of residence time,τ
τ = VPFR
Vo where, VPFR is volume of the reactor and Vo is flow rate
For total flow rate = 600 mL/min,
τ = VPFR
Vo τ = 2L (600 x 10-3)L/min = 6.6667 min
CH3–COO–CH2 –CH3 +NaOH→CH3 –COONa+CH3 –CH2 –OH
C) Calculation for reaction constant
Since this reaction is a second order reaction and CAO = CBO, the rate law is,
-rA = kCACB = kCA2 = kCAO(1-X)2
-rA = FAO dX = VoCao dX dV dV
VPFR = Vo (X) kCAO(1-X)
k = Vo (X) VPFRCAO(1-X)
For total flow rate = 600 mL/min, conversion = 93.6%,
k = Vo (X) VPFRCAO(1-X)
k = (600 x 10-3)L/min(0.936) (2)L(0.05)M(1 – 0.936)
= 90.75 L mol-1min-1
D) Calculation for rate of reaction
-rA = kCACB = kCA2 = kCAO(1-X)2
-rA = kCAO(1-X)2
For total flow rate = 600 mL/min, conversion = 93.6%,
-rA = (87.75)(0.05)(1 – 0.936)2
= 0.01797 mol/L.min
Table 4: Results obtained through calculation using titration data
Conversion (%) Residence Time(min)
Reaction constant, k(L mol-1min-1)
Rate of reaction
(mol/L.min)
93.6 3.3333 87.75 0.01797
94.8 4.0000 91.15 0.01232
95.2 5.0000 73.33 8.4476 x 10⁻³
100 6.6667 - -
100 10.0000 - -
100 20.0000 - -
9.0DISCUSSION
The experiment is about saponification reaction between sodium hydroxide NaOH and ethyl
acetate(Et(Ac)) in a plug flow reactor (PFR). This reation is a saponification reaction where
saponification process is the reaction between a strong base which in this case is sodium hydroxide and
a natural fat which, for this experiment is ethyl acetate. The reaction is a second order reaction where,
-rA = k[CA][CB]
and for this case, the concentration of sodium hydroxide fed to the reactor is equal to the
concentration of ethyl acetate fed to the reactor. Since the equimolar concentration of reactant is fed
to the reactor,
[CA] = [CB]
Thus,
-rA = k[CA]2

This experiment is conducted in order to understand the relationship of conductivity and conversion
and how this may affect the reaction. A calibration cuve of conversion vs conductivity is plotted to
determine the unknown conversion of reactant at a given flow rate.
Conductivity or salinity is a measure of the ability of water to conduct electricity, which provides a
measure of what is dissolved in water. A higher conductivity value indicates that there higher content of
chemical dissolved in the water. Conductivity is the inverse of resistivity. Resisitivity is the measure of
the resisting power of a specified material to the flow an electric current.
From the calibration curve obtained, it is seen that as the conversion increases, the conductivity
decreases. This is because, the charge particles in material or substance aid in conduction of electric
current in that particular substance. Therefore, higher concentration will results in higher
conductivity. It should be noted that there are substances that do not follow this behaviour such as
concentrated sulphuric acid. Hence, when conversion is high, it means that the concentration of
sodium hydroxide is low, therefore it is only reasonable if the conductivity is low as well.
From the data obtained it can be seen that as the flow rate increases, the conductivity increases. This
means that when the flow rate is high, the conversion of sodium hydroxide is low which means that
there is high concentration of unreacted sodium hydroxide left in the reactor. In addition, as the total
flow rate increases, the residence time decreases. Therefore, residence time increases with the
increasing of conversion of sodium hydroxide.
Residence time refers to the average length of time a molecule spends in a container, where material
flow is concern. Therefore, basically residence time indicates the time taken or given for the
concentration to change or for the reactant to react. That is the reason as the residence time
increases, the conversion increases. When the residence time is longer, there are more time for the
reaction to take place, hence causing the conversion to be higher. The theory of residence time is
applied to conserved quantities of mass, momentum, energy and charge.
In determining the unknown conversion value of sodium hydroxide, the conductivity value from the
experiment is used along with the calibration curve plotted. The results is recheck with the data
obtained from the titration of sodium hydroxide and hydrochloric acid.
There a slight difference in conversion values obtained by both method. By using calibration curve,
the conversion values obtained is less that the conversion values gained from titration of sodium

hydroxide. However, both results shows the same pattern in which as the residence time increases,
the conversion increases. When conversion vs residence time graphs are plotted for both, the pattern
of the graph is the same. The graph shows that, as the conversion inreases, the residences time
increases even after the conversion reaches 100% for total flow rate of 300mL/min, 200mL/min and
100mL/min.
For both methods of calculating the conversion that occur during the reaction at each flow rate, the
data shows that as the residence time increases, the rate of reaction decreases. The rate of reaction
can be expressed as,
-rA = dCA
dt
From this expression, it can be concluded that the rate of reaction is the change of concentration
over time.
Let,
dCA = CA – CAo
dt = residence time
and,
CA = CAo (1 – X)
Here, it can be seen that, as conversion increases, concentration decreases. When concentration
decreases, the change of concentration become small. It was stated earlier that as residence time
increases, conversion increases. This means that as the residence time increases, the concentration
will decrease, hence it will cause the change of concentration to decrease as well along with the
increase of residence time. Therefore, when small value of dCA is divided with large value of time,
it is only significant if the rate of reaction dcreases when residence time increases.
This can be supported by the collision theory, where it states that the rate of reaction will increase
proportional to the number of effective collision per second between the reactant molecules. If the
concentration increases, the greater the frequency of collision and the greater it will be for the frequency
of effective collisions and the consequently the greater will the rate of reaction be.
10.0CONCLUSION

From the data gained, it can be concluded that as the residence time has the influence on the conversio
of the reactant as well as the rate of reaction. The longer the residence time, the higher will the
conversion be and the lower the rate of reaction as the concentration of reactant is decreasing. The
reaction rate constant varies with the values of conversion and the total flow rate.
11.0RECOMMENDATIONS
In order to increase the yield of the reaction, plug flow reactor can be combined with membrane
seperator. The products are selectively pulled out of the reactor as they are made so that the equilibrium
in the reactor itself continues to shift towards making more product.
The conversion of the reactor can be increases by adding another reactor to it such as PFR or CSTR.
Since the rate of reaction is low when the resindence time is high, the rate of reaction can be fasten
by adding catalyst to the reaction. Catalyst will make the reaction process faster.
REFERENCES
September 11, 2011, http://en.wikipedia.org/wiki/Plug_flow_reactor_model#PFR_modeling
November 16, 2010,
Gilmour D., Samson P., Chapter 10: Reaction Kinetic, http://docs.google.com/viewer?
a=v&q=cache:359IYQ1TuVcJ:www.che.boun.edu.tr/courses/che302/Chapter
%252010.pdf+reaction+constant+vs+flow+rate&hl=en&gl=my&pid=bl&srcid=ADGEESh_PXZg
kAmRlwKpk-X9bKdqYSzbyxbvLGRMsxVPk-
gNuC9cXnMTlzbZ6heSJ1wW8MXx5iGMdPSI4MeFeNFnxngVtd4LrZz7saix8TJ5FutMNA8YSI
ScjSBj-CODDBAKB0kYXd-C&sig=AHIEtbRBEdaLLBKTJ9q0EGF0LNCESov-ZA
APPENDICES
Figure 1: Graph conversion vs conductivity from calibration curve
Figure 2: Graph conversion vs residence time through calculation from calibration curve

Figure 3: Graph conversion vs residence time through calculation obtained from titration data