ph hi il la addeelpphia cchhiilldd ddeeaatthh rreevviieeww ... · figure 6a.1: undetermined deaths...
TRANSCRIPT
i
PPPhhhiiilllaaadddeeelllppphhhiiiaaa CCChhhiiilllddd DDDeeeaaattthhh RRReeevvviiieeewww RRReeepppooorrrttt 222000111111---222000111777 A report that describes and discusses child deaths, 2011-2017, that were reviewed by the Philadelphia Child Death Review Team
ii
MEDICAL EXAMINER’S OFFICE
Thomas Farley, MD, MPH – Health Commissioner
Sam Gulino, MD – Chief Medical Examiner
Report Prepared by: Roy Hoffman, MD, MPH – Medical Director, Fatality Review Program David Bissell, MPH – Program Coordinator, Fatality Review Program

iii
PHILADELPHIA CHILD DEATH REVIEW TEAM MEMBERS
Anti-Violence Partnership (AVP) Lisa Christian
Asia Adams SAVE Our Children Foundation Shelah Harper
Bryn Mawr College Carolina Hausmann-Stabile
Children's Hospital of Philadelphia Colleen Bennett, Brian Brennan, Barbara Chaiyachati, Avram Mack, Laura Popma
Community Behavioral Health Mia Everett, Stacey Golonka, Kamilah Jackson
Department of Behavioral Health and Intellectual disAbility Services Maria Boswell, Joanne Butler, Kate Fox, Serge Levin
Department of Human Services - Child Welfare Operations Theresa Childers, Jennifer Good , Frank Macrina
Department of Human Services - Juvenile Justice Services Monique Brown , Timene Farlow
Einstein Healthcare Network Guillermo Otero Perez
Philadelphia Family Court Linda Candoi
Mantua Against Drugs (MAD) C.B. Kimmins
Medical Examiner's Office - Bereavement Services Ebony Williams, Rose Winchell
Medical Examiner's Office – Investigations Harolyn C. Rodgers
Medical Examiner's Office - Fatality Review Program David Bissell , Roy Hoffman
Northwest Victim Services Melany Nelson
Office of Homeless Services Fred Gigliotti
Philadelphia Children's Crisis Response Center Jocelyn Lluberes
Philadelphia District Attorney's Office Ebony Wortham
Philadelphia Fire Department
Philadelphia Fire Department - Emergency Medical Services Jeffrey Schurr
Philadelphia Police Department Debra Reilly, Joseph Rossa
Private Practice Michael DeStefano, Samuel Wyche
St. Christopher's Hospital for Children Norrell Atkinson, Katie Burdett, Ife Ford, Angela Kim, Marita Lind, Daniel Taylor
School District of Philadelphia Lori Paster
Thomas Jefferson University Matthew Wintersteen
Special thanks to all of the former child death review team members - several who served for many years, and a few who have since passed: Michael Andrews, Brittany Anuskiewicz, Rebecca Aspden, Sheena Banks, Kathy Battle, Iesha Brown-Pygatt, Amber Brubaker Hendricks, Paul Callahan, Dana Careless, Valerie Carter, Thomas Cieslinski, Antoinette Cook, Jacqueline Cunningham, Neal Demp, Stephanie Deutsch, Maria Dobinick, Trina Dow, Leti Egea-Hinton, Paul Fink, Angel Flores, Kristine Fortin, Heather Franklin, Dionne Freeman, Victoria Greene, James Griffin, Lisa Harvey, Kate Henry, Ashley Johnson, Dorothy Johnson-Speight, Janet Jones, Kerrie Kelley, Edward Lendvay, Elisa Lehman, Myra Maxwell, Maria McColgan, Sherry McDaniels, Belinda Moody, Raquel Mora, George Mosee, Jr., Andrea October, Carla Parkin-Joseph, Susan Pearlstein, Michelle Pickens, Cheryl Priest, Lawrence Real, Linda Ricci, Lynn Roman, Alyssa Schatz, Samantha Schilling, Norma Serrano, Christina Severio, Aneesha Shabazz, Jonathan Singer, Natalie Stavas, Patty Stewart-Taylor, Bridget Taylor-Brown, Lauren Tucker, Sylvie Urrata, Claire Van Til, Patricia West, Benita Williams, Vanessa Williams-Cain, Crystal Yates

1
TABLE OF CONTENTS
EXECUTIVE SUMMARY 3
BACKGROUND AND OVERVIEW | SECTION ONE 5
A. HISTORY AND PURPOSE OF THE CHILD DEATH REVIEW 5
B. THE CITY OF PHILADELPHIA AND THE CHILD DEATH REVIEW PROCESS 5
C. PHILADELPHIA CHILD DEATH REVIEW – OVERALL NUMBERS 6 Figure 1C.1: Annual Average of Child Deaths by Year Groupings 6 Figure 1C.2: Child Deaths by Gender and Race/Ethnicity 6 Figure 1C.3: Child Deaths by Age Groups 6 Figure 1C.4: Manner of Child Deaths 7 Figure 1C.5: Child Deaths Due to Gunshot Wounds 7
Figure 1C.6: Top Categories of Child Deaths 8
FOCUS ON INFANT DEATHS | SECTION TWO 9
A. OVERVIEW 9 Figure 2A.1: Annual Average of Infant Deaths by Year Groupings 9 Figure 2A.2: Infant Deaths by Age, Gender and Race/Ethnicity 9 Figure 2A.3: Category of Infant Deaths 9
B. SLEEP-RELATED DEATHS 10 Figure 2B.1: Annual Average of Sleep-Related Deaths by Year Groupings 10 Figure 2B.2: Sleep-Related Deaths by Gender and Race/Ethnicity 10 Figure 2B.3: Sleep-Related Deaths by Age in Months 11 Figure 2B.4: Category of Death for Sleep-Related Deaths 11 Figure 2B.5: Child Protection Service History of Sleep-Related Deaths 12 Figure 2B.6: Degree of Safety in Sleep-Related Death Sleep Environment 12 Figure 2B.7: Last Place of Sleep for Sleep-Related Deaths 13 Figure 2B.8: Bed-Sharing Sleep-Related Deaths with an Appropriate Sleep Location Available 13 Figure 2B.9: Last Sleep Position Placement of Sleep-Related Deaths 14
C. PREMATURITY/PERINATAL DEATHS 15 Figure 2C.1: Annual Average Deaths of Prematurity and Perinatal Conditions by Year Groupings 15 Figure 2C.2: Deaths of Prematurity and Perinatal Conditions by Age, Gender and Race/Ethnicity 15
D. RECOMMENDATIONS 16
UNINTENTIONAL INJURY DEATHS | SECTION THREE 17
A. OVERVIEW 17
Figure 3A.1: Unintentional Injury Deaths by Age, Gender, and Race/Ethnicity 17 Figure 3A.2: Category of Unintentional Injury Deaths 17
B. TRANSPORTATION-RELATED DEATHS 18 Figure 3B.1: Transportation-Related Deaths by Age, Gender, and Race/Ethnicity 18 Figure 3B.2: Decedent's Role in Transportation-related Deaths 18 Figure 3B.3: Decedent's Role in Transportation-related Deaths by Age Groups 18 Figure 3B.4: Vehicle Type Involved in Non-Pedestrian Deaths 19 Figure 3B.5: Belt Usage in Transportation-Related Deaths 19 Figure 3B.6: Behavioral Factors in Transportation-Related Deaths 20 Figure 3B.7 Environmental Conditions Present in Transportation-Related Deaths 20 Figure 3B.8 Street Type for Transportation-Related Deaths 21
C. DRUG-RELATED DEATHS 22 Figure 3C.1: Unintentional Drug-Related Deaths, by Age Group 22
Figure 3C.2: Fentanyl Presence in Toxicology Reports of Unintentional Drug-Related Deaths 22 Figure 3C.3: Unintentional Drug-Related Deaths by Age, Gender, and Race/Ethnicity 23 Figure 3C.4: Substances Detected in Toxicology Reports of Unintentional Drug-Related Deaths 23
D. FIRE, BURN AND ELECTROCUTION DEATHS 24 Figure 3D.1: Fire and Electrocution Deaths by Age, Gender, and Race/Ethnicity 24 Figure 3D.2: Source for House Fire Deaths 24 Figure 3D.3: Fire Detector Status of House Fire Deaths 24
E. DROWNING DEATHS 25 Figure 3E.1: Accidental Drowning Deaths by Age, Gender, and Race/Ethnicity 25 Figure 3E.2: Water Location of Accidental Drowning Deaths 25
F. RECOMMENDATIONS 26
2
INTENTIONAL INJURY DEATHS | SECTION FOUR 27
A. OVERVIEW 27 Figure 4A: Intentional Injury Deaths by Age, Gender, and Race/Ethnicity 27
B. SUICIDE DEATHS 28 Figure 4B.1: Suicide Deaths by Age, Gender, and Race/Ethnicity 28 Figure 4B.2: Suicide Deaths by Method 28 Figure 4B.3: Method of Suicide by Age Group 28 Figure 4B.4: Known History of Suicide Threats or Attempts 29 Figure 4B.5: Location of Suicide 29 Figure 4B.6: School and Employment Status 30 Figure 4B.7: Percent Suicide Deaths with Known Factors that May Have Contributed to Suicide 30
C. HOMICIDE DEATHS 31 Figure 4C.1: Homicide Deaths (not due to Child Abuse) by Year 31 Figure 4C.2: Homicide Deaths by Age, Gender, and Race/Ethnicity 31 Figure 4C.3: Type of Weapon Used on Homicide Victims 31 Figure 4C.4: Toxicology Screen Results of Homicide Victims 32 Figure 4C.5: Detention, Criminal and Truancy History of Homicide Victims Ages >10 32 Figure 4C.6: Relationship of Primary Perpetrator to Homicide Victim 32 Figure 4C.7: Age Groups of Primary Perpetrator to Homicide Victim 32
D. RECOMMENDATIONS 33
FOCUS ON CHILD ABUSE AND NEGLECT DEATHS | SECTION FIVE 35
A. OVERVIEW 35 Figure 5A.1: Child Abuse & Neglect Deaths by Age, Gender, and Race/Ethnicity 35 Figure 5A.2: Child Abuse & Neglect Deaths by Year 35 Figure 5A.3: Child Abuse & Neglect Deaths by DHS Contact with Family 35
B. CHILD ABUSE DEATHS 36 Figure 5B.1: Child Abuse Deaths by Age, Gender, and Race/Ethnicity 36 Figure 5B.2: Categories of Child Abuse Deaths 36
C. CHILD NEGLECT DEATHS 36 Figure 5C.1: Child Neglect Deaths by Age, Gender, and Race/Ethnicity 36 Figure 5C.2: Categories of Child Neglect Deaths 36
UNDETERMINED DEATHS | SECTION SIX 37
A. OVERVIEW 37
Figure 6A.1: Undetermined Deaths by Age, Gender, and Race/Ethnicity 37 Figure 6A.2: Category of Undetermined Deaths 37
B. AUTOPSY NEGATIVE (NOT SLEEP-RELATED INFANT DEATH) 37
C. RECOMMENDATIONS 38
NATURAL DEATHS | SECTION SEVEN 39
A. OVERVIEW 39
Figure 7A.1: Natural Deaths by Age, Gender, and Race/Ethnicity 39 Figure 7A.2: Category of Natural Deaths 39
B. ASTHMA DEATHS 39
Figure 7B: Asthma Deaths by Age, Gender, and Race/Ethnicity 39
C. CANCER DEATHS 40
Figure 7C: Cancer Deaths by Age, Gender, and Race/Ethnicity 40
D. CARDIAC CONDITIONS (INCLUDING CONGENITAL) 40
Figure 7D: Cardiac Deaths by Age, Gender, and Race/Ethnicity 40
E. SICKLE CELL DISEASE 40 Figure 7E: Sickle Cell Disease Deaths by Age, Gender, and Race/Ethnicity 40
F. RECOMMENDATIONS 41
APPENDIX | REFERENCES 42

3
EXECUTIVE SUMMARY
The death of a child, particularly an infant, is a sentinel event and an indicator of the health of a community as a whole. While most child deaths are unexpected, every child death is a tragic event that leaves a large wake of pain and suffering for the many people who had been involved in that child’s life.
Child death review is a process where a multi-disciplinary team discusses the circumstances of a child’s death in order to gain a better understanding of any shortfalls or gaps in the community’s systems and resources. Qualitative information is coupled with quantitative data gathering in order to develop data-driven recommendations. The ultimate goal of child death review is to prevent future child deaths, decrease child morbidity, and improve the general health and wellbeing of the child population being reviewed.
DAUNTING NUMBERS AND DISPROPORTIONALITY
With an estimated population of 1.58 million people, approximately 446,000 are children aged 21 years and under, Philadelphia experienced an average of 373 child deaths per year from 2011 to 2017. [Child, as defined per Pennsylvania Act 87 of 2008, is an individual 21 years and under.]
Black and Hispanic children, while making up 60% of Philadelphia’s child population, accounted for 85% or more of child deaths for 8 of the top 15 categories of death, including 96% of all homicides (not due to child abuse), 100% of all asthma deaths, and 83% of total Philadelphia child deaths.
Four hundred thirty-eight children died from gunshot wounds, either due to homicide, suicide, accident, or by an undetermined manner.
INFANT DEATHS
High infant mortality rates are a persistent problem in Philadelphia, albeit an improving one. Of the 2011-2017 deaths:
Infant deaths accounted for 55% of the 2609 Philadelphia child deaths, and nearly two-thirds of the infant deaths were due to complications of prematurity or other perinatal conditions.
An average of approximately 32 infants per year (almost three infants every month) suffered a sleep-related death (includes SIDS, accidental suffocation, and undetermined deaths).
Sleep-related deaths were the third most common category of death among Philadelphia children, greater than motor vehicle crashes, drowning, fire, and asthma deaths combined.
UNINTENTIONAL INJURY DEATHS
116 children died from transportation-related injuries:
o Alcohol or drug use was a contributing factor in 23% of these 116 deaths.
o Speeding was a contributing factor in 59% of these 116 deaths.
o A large majority (85%) of the 85 non-pedestrian fatalities were not using proper safety equipment at the time of injury (helmets with motorcycles, ATV or bicycles; seatbelts with other motorized vehicles).
24 children died in 18 house fires
o Not a single house fire fatality had documentation of a working smoke detector, but 50% of the households had documentation of no working smoke detector.
95 children died from accidental drug intoxications
o White, Non-Hispanic children made up 66%, and 75% were males.
o Opioids (including fentanyl, oxycodone and heroin) were implicated in 85%, benzodiazepines (Valium-type drugs) in 48%, and cocaine in 35%.
4
INTENTIONAL INJURY DEATHS
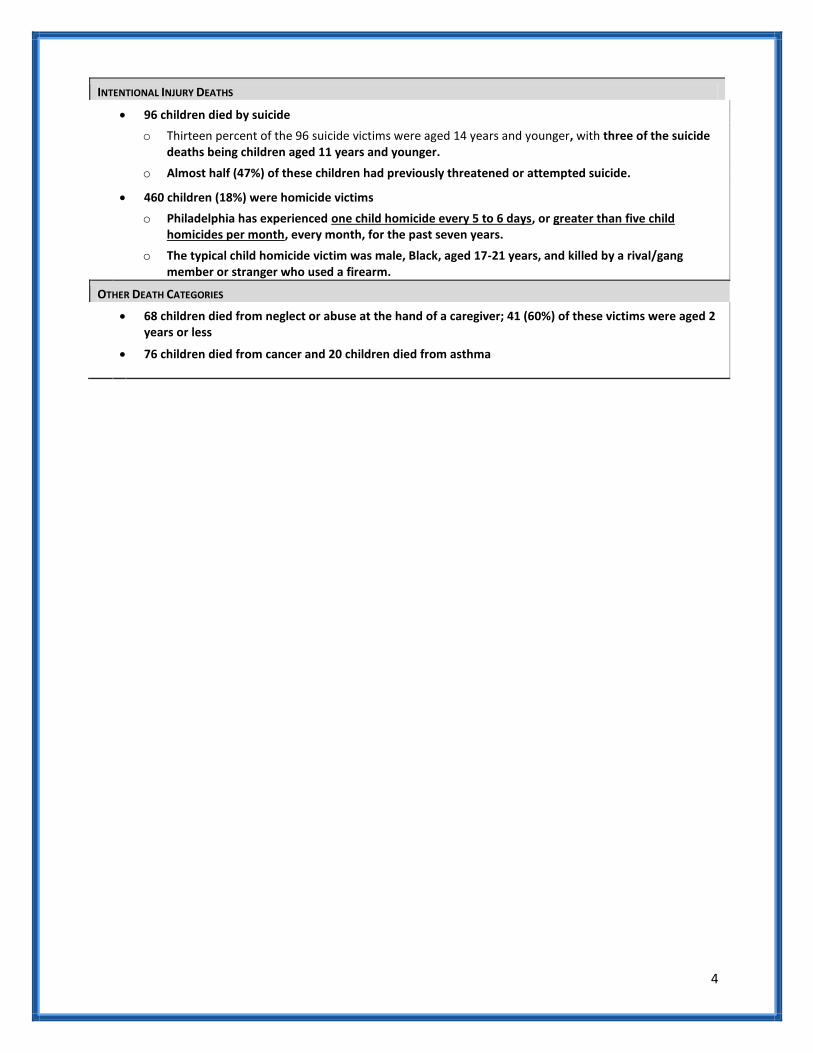
96 children died by suicide
o Thirteen percent of the 96 suicide victims were aged 14 years and younger, with three of the suicide deaths being children aged 11 years and younger.
o Almost half (47%) of these children had previously threatened or attempted suicide.
460 children (18%) were homicide victims
o Philadelphia has experienced one child homicide every 5 to 6 days, or greater than five child homicides per month, every month, for the past seven years.
o The typical child homicide victim was male, Black, aged 17-21 years, and killed by a rival/gang member or stranger who used a firearm.
OTHER DEATH CATEGORIES
68 children died from neglect or abuse at the hand of a caregiver; 41 (60%) of these victims were aged 2
years or less
76 children died from cancer and 20 children died from asthma

5
A. THE HISTORY AND PURPOSE OF CHILD DEATH REVIEW While the concept of conducting death reviews dates back almost 90 years, it wasn’t until 1978 that the
first child death review process was started in Los Angeles, where a local team convened in order to
identify deaths caused by child abuse and neglect. Over the ensuing 40+ years, child death review teams
have been established and maintained throughout the country.
According to the National Center for Fatality Review and Prevention, the purpose of child death review
is to “…conduct a comprehensive, multidisciplinary review of child deaths, to better understand how and
why children die, and use the findings to take action that can prevent other deaths and improve the
health and safety of children.” (1)
Philadelphia’s Child Death Review (CDR) is a data-driven process, meaning that data are used to guide
and focus the recommendations that are presented herein. In addition to the end-goal of preventing
future child deaths, the CDR process is able to accomplish many short-term or immediate goals, such as
improved collaboration across city agencies, hospitals, and non-governmental organizations; improved
coordination of public health, child protection, and law enforcement efforts; and improved surveillance
in order to create a rich, accurate, and quality dataset of Philadelphia child deaths.
B. THE CITY OF PHILADELPHIA AND ITS CHILD DEATH REVIEW PROCESS The City of Philadelphia is a large, multi-racial, multi-ethnic city with an estimated population of 1.58
million people. According to the 2015 Philadelphia Vital Statistics Report, the racial and ethnic
breakdown of the overall population is approximately 41% Black Non-Hispanic, 35% White Non-
Hispanic, 7% Asian Non-Hispanic, and 14% Hispanic (of any race). (2)
The Philadelphia Department of Public Health established its own CDR process in June 1993, and it is
currently run by the Fatality Review Program (FRP), which has been based at the Medical Examiner’s
Office (MEO) since 2009. The multidisciplinary CDR teams meet at the MEO on a monthly basis, and they
consist of separate homicide and non-homicide teams. The CDR teams review the death of any
Philadelphia resident, from birth through 21 years, regardless of where the death occurred and
regardless of the cause or manner of death. The FRP has been successful at identifying and reviewing
over 99% of eligible cases since 2011, and the average child death is reviewed by the Philadelphia CDR
teams within five months of the date of death.
BACKGROUND AND OVERVIEW | SECTION ONE

6
C. PHILADELPHIA CHILD DEATH REVIEW – OVERALL NUMBERS There were a total of 2625 child deaths, from birth through 21 years, which occurred in the years
between 2011 and 2017 and were ultimately identified by the FRP. This report describes the 2609 child
deaths that were reviewed by the Philadelphia CDR teams. The 16 cases that have been identified but
never reviewed were typically identified anywhere from 2 to 4 years after the date of death, and consist
entirely of cases where the child died outside of Philadelphia and often outside the state of
Pennsylvania.
There was an average of 373 Philadelphia child deaths
per year over the seven year period. However, if we look
at child death over a ten year period, we get a better
sense that the situation is improving in Philadelphia. The
average annual number of Philadelphia child deaths has
declined by greater than 120 deaths per year over the
past decade.
Figure 1C.2: Child Deaths by Gender and Race/Ethnicity, 2011-2017 (N=2609)
GENDER RACE/ETHNICITY Male Female Unk/Undet† White, NH Black, NH Asian, NH Hispanic
1649 953 7 352 1724 101 432
63% 37% 0% 13% 66% 4% 17%
† the gender of seven decedents could not be classified: three were undetermined and four were unknown.
Philadelphia child deaths are not distributed equally along age, gender, and racial breakdowns. The child
deaths are predominantly of infants (55%) who are male (63%) and Black, Non-Hispanic (66%).
Figure 1C.3: Child Deaths by Age Groups, 2011-2017 (N=2609)
AGE CATEGORIES Infants – Day(s) Children –Year(s)
<1 1-27 28-364 1-4 5-9 10-14 15-19 20-21
750 292 397 137 86 107 430 410
29% 11% 15% 5% 3% 4% 16% 16%
Figure 1C.1: Annual Average of Child Deaths by Year Groupings, 2008-2017

7
Natural deaths, which can be thought of as
deaths due to medical causes (such as all
cancers, heart conditions, and infectious
diseases), typically account for the majority
of deaths for all age groups. For
Philadelphia children, natural deaths
accounted for 1439 deaths (59% of total).
Homicides and accidents (unintentional
injuries), were the next two common
manners of death and accounted for 460
deaths (18% of total) and 363 deaths (13%
of total) respectively.
There were 96 suicides of Philadelphia
children from 2011 to 2017, which
accounted for 4% of all child deaths.
Undetermined manner, which indicates
either an unknown manner or an unclear determination of one vs. another manner of death (e.g.
accident vs. suicide), accounted for 164 death (6% of total), and is predominantly used in describing
infant deaths – particularly sleep-related infant deaths.
Deaths caused by gunshot
wounds accounted for 438
deaths, or 16% of all child
deaths. Of the 401
homicides, 17 were not the
intended target, 4 were
victims of intimate partner
violence, and one was a
victim of a mass shooting
(the Pulse nightclub shooting
in Orlando, FL in 2016). In
addition, 37 children died of
gunshot wounds that were
not homicides: 28 by suicide,
5 by accident, and 4 by
undetermined manner.
Figure 1C.4: Manner of Child Deaths, 2011-2017 (N=2609)
Table 1C.5: Child Deaths Due to Gunshot Wounds, 2011-2017 (n=438)

8
When the top 15 categories of
child deaths in Philadelphia are
ranked, deaths due to prematurity
and perinatal conditions stand out
and accounted for 956 deaths (37%
of total). Homicides not due to
child abuse are the second most
common category, and they
accounted for 420 deaths (16% of
total).
The third most common category
of death in Philadelphia, however,
may be a surprise for many: sleep-
related infant deaths. This group
consists of babies who were
considered to be healthy, but they
went to sleep and unexpectedly died from a cause other than an explained medical illness/condition, or
from an injury other than accidental suffocation. These deaths will be looked at in more detail in Section
II.
In view of the racial and ethnic breakdown, the top categories of death portray an overwhelming picture
of disparity. Black and Hispanic children make up a disproportionate percentage of most nearly all
categories of death. According to the 2015 Philadelphia Vital Statistics Report, Blacks and Hispanics
make up about 60% of children ages 21 and under. (2)
However, some of the top categories of death are made up almost entirely of minorities – such as
homicides and asthma deaths. In fact, every one of the 20 asthma youth deaths during this seven year
period were Black, Non-Hispanic, and all 52 asthma youth deaths identified by the Philadelphia CDR
since 2005 have been either Black or Hispanic.
Table 1C.6: Top Categories of Child Deaths, 2011-2017
Total Deaths
Black or Hispanic Deaths
Rank Category n % of Total
1 Prematurity and Perinatal Conditions 956 87%
2 Homicides† 420 96%
3 Sleep-related Infant Deaths 227 86%
4 Congenital Anomalies‡ 152 88%
5 Cardiac Conditions* 118 80%
6 Accidental Motor Vehicle Crashes 116 71%
7 Suicides 96 65%
8 Accidental Drug Intoxications 95 28%
9 Cancer 76 71%
10 Infectious Diseases 51 88%
11 Child Abuse 40 85%
12 Accidental Drowning 30 70%
13 Accidental Fire 28 86%
14 Asthma 20 100%
15 Seizure Disorders 16 81%
†Does not include homicide by child abuse; ‡ Does not include those of cardiac origin *Includes congenital, cardiomyopathies and other
9
FOCUS ON INFANT DEATHS | SECTION TWO
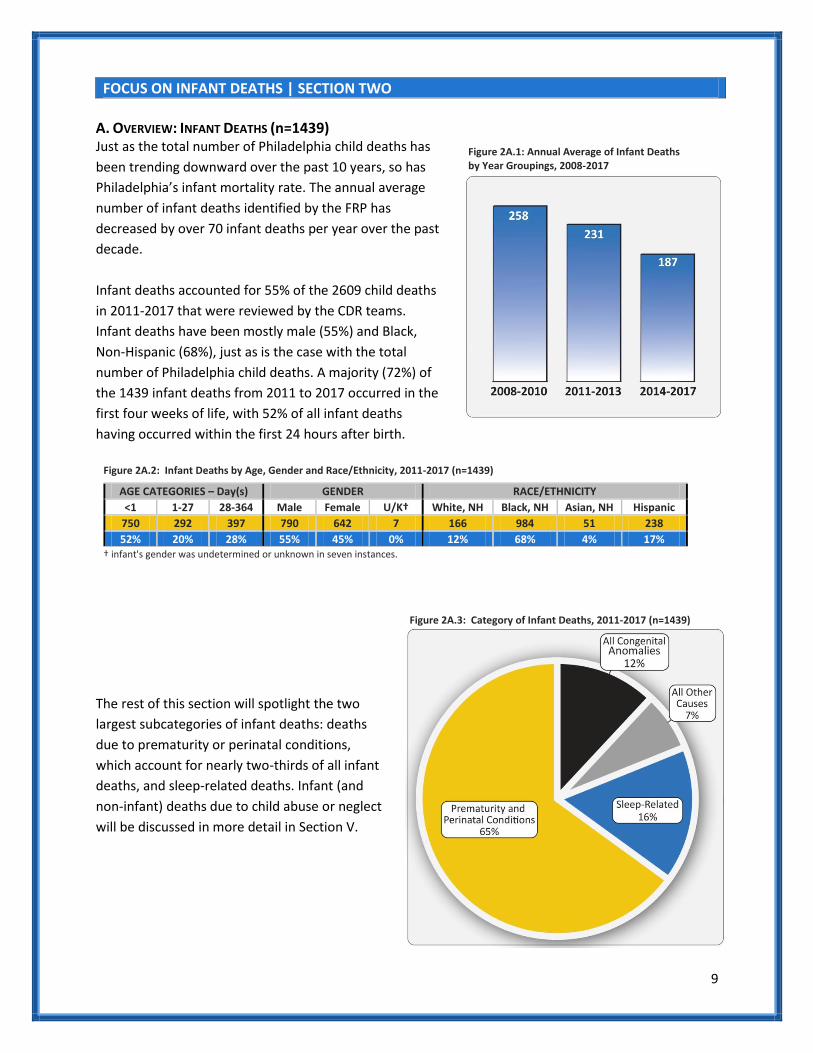
A. OVERVIEW: INFANT DEATHS (n=1439) Just as the total number of Philadelphia child deaths has
been trending downward over the past 10 years, so has
Philadelphia’s infant mortality rate. The annual average
number of infant deaths identified by the FRP has
decreased by over 70 infant deaths per year over the past
decade.
Infant deaths accounted for 55% of the 2609 child deaths
in 2011-2017 that were reviewed by the CDR teams.
Infant deaths have been mostly male (55%) and Black,
Non-Hispanic (68%), just as is the case with the total
number of Philadelphia child deaths. A majority (72%) of
the 1439 infant deaths from 2011 to 2017 occurred in the
first four weeks of life, with 52% of all infant deaths
having occurred within the first 24 hours after birth.
Figure 2A.2: Infant Deaths by Age, Gender and Race/Ethnicity, 2011-2017 (n=1439)
AGE CATEGORIES – Day(s) GENDER RACE/ETHNICITY
<1 1-27 28-364 Male Female U/K† White, NH Black, NH Asian, NH Hispanic
750 292 397 790 642 7 166 984 51 238
52% 20% 28% 55% 45% 0% 12% 68% 4% 17% † infant's gender was undetermined or unknown in seven instances.
The rest of this section will spotlight the two
largest subcategories of infant deaths: deaths
due to prematurity or perinatal conditions,
which account for nearly two-thirds of all infant
deaths, and sleep-related deaths. Infant (and
non-infant) deaths due to child abuse or neglect
will be discussed in more detail in Section V.
Figure 2A.1: Annual Average of Infant Deaths by Year Groupings, 2008-2017
Figure 2A.3: Category of Infant Deaths, 2011-2017 (n=1439)
10
B. SLEEP-RELATED INFANT DEATHS (n=227) When an infant dies suddenly and unexpectedly and there is no immediately obvious manner and cause
of death prior to investigation, it is called a Sudden Unexpected Infant Death (SUID). Only after a
thorough investigation and autopsy is conducted can a pathologist make an assessment of the manner
and cause of death.
The most common category of death that typically results from a SUID investigation is a sleep-related
death (SRD). Other possible but much less frequent categories of death that may result from a SUID
investigation include child abuse or neglect or other natural processes (e.g. pneumonia, congenital heart
defect, or an inborn error of metabolism).
While there is no official definition of a SRD, this report employs a commonly used definition: cases in
which the cause of death was certified as (1) accidental suffocation, (2) SIDS (Sudden Infant Death
Syndrome), or (3) undetermined.
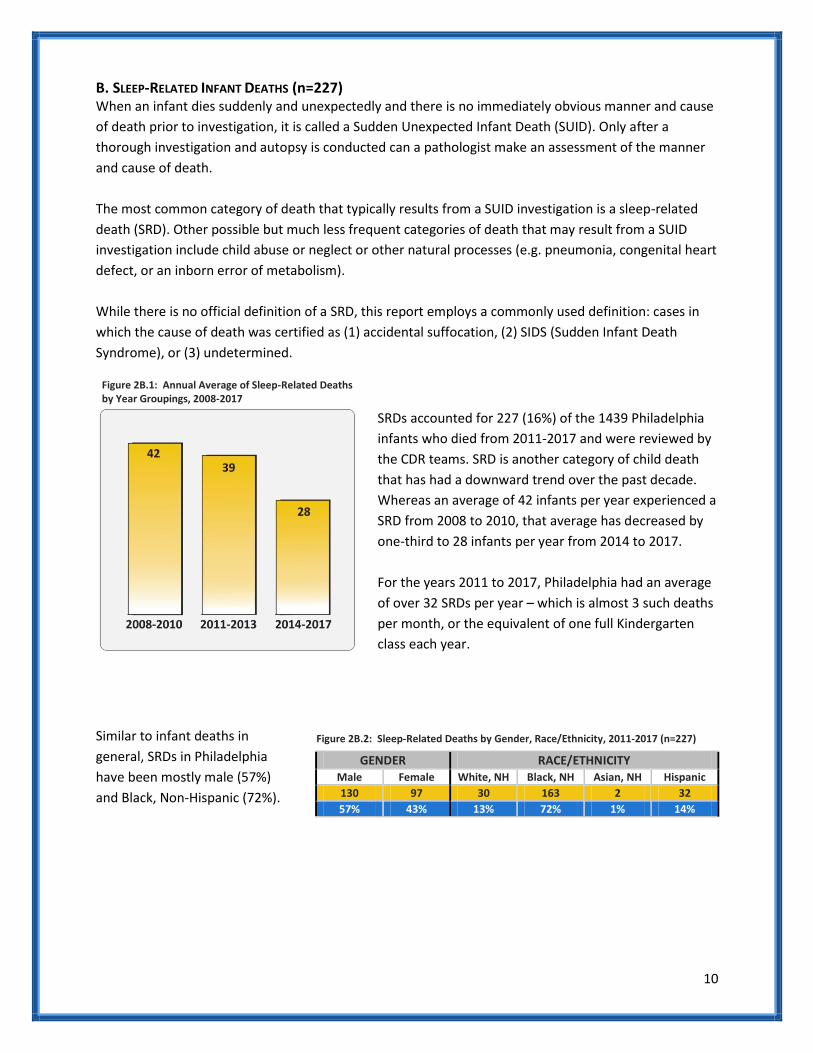
SRDs accounted for 227 (16%) of the 1439 Philadelphia
infants who died from 2011-2017 and were reviewed by
the CDR teams. SRD is another category of child death
that has had a downward trend over the past decade.
Whereas an average of 42 infants per year experienced a
SRD from 2008 to 2010, that average has decreased by
one-third to 28 infants per year from 2014 to 2017.
For the years 2011 to 2017, Philadelphia had an average
of over 32 SRDs per year – which is almost 3 such deaths
per month, or the equivalent of one full Kindergarten
class each year.
Similar to infant deaths in
general, SRDs in Philadelphia
have been mostly male (57%)
and Black, Non-Hispanic (72%).
Figure 2B.1: Annual Average of Sleep-Related Deaths by Year Groupings, 2008-2017
Figure 2B.2: Sleep-Related Deaths by Gender, Race/Ethnicity, 2011-2017 (n=227)
GENDER RACE/ETHNICITY Male Female White, NH Black, NH Asian, NH Hispanic
130 97 30 163 2 32
57% 43% 13% 72% 1% 14%

11
SRDs occur predominantly in the first six months of
life (89% of total), although the peak level of risk is
between 1 and 3 months of age.
There are many theories as to the underlying
causes of SRDs. One theory is that the majority of
these deaths are due to accidental suffocation,
which is something that is hard to prove based on
investigation and autopsy. This theory, however, is
in part supported by the fact that as an infant gains
overall strength as she ages, she is able to move her
head, neck and body out of situations that could
otherwise cause asphyxiation. This might explain
why the number of SRDs trails off so dramatically
after 6 months of age, and why most causes of
accidental suffocation beyond 6 months occur
when an infant gets wedged or trapped after
crawling or falling into a situation that they can’t
escape from.
Almost all (97%) of the SRDs occurred within the city limits of Philadelphia and were thus autopsied
here, so that helps with uniformity of classifying cause and manner of death for these cases. But in
general, there is no uniformity among pathologists and coroners, and differing styles and opinions vary
not just from one jurisdiction to the next, but from doctor to doctor at the same institution and perhaps
even from year to year by the same doctor.
In Philadelphia, undetermined deaths
accounted for 125 (55%) of the SRDs that
occurred from 2011-2017. While admittedly a
dissatisfying explanation for many grieving
parents, undetermined manner of death is the
most common outcome in a SRD. Part of the
reason is because most SRDs have very few or
no physical findings on autopsy. Diagnosis of
accidental suffocation is therefore reliant upon
the statements of the caretaker. So unless a
co-sleeping parent both sees and admits to
seeing something that obstructed the infant’s
airway or breathing, the forensic pathologist
may have little other choice but to call the SRD
an undetermined death.
Figure 2B.3: Sleep-Related Deaths by Age, 2011-2017 (n=227)
Figure 2B.4 Category of Death for Sleep-Related Deaths, 2011-2017 (n=227)

12
SIDS is defined by the CDC as “the sudden death of an infant less than one year of age that cannot be
explained after a thorough investigation is conducted, including a complete autopsy, examination of the
death scene, and review of the clinical history.” In Philadelphia, SIDS is typically ruled for an infant who
dies in a generally safe sleep environment, and accounted for 45 (20%) of the SRDs.
Accidental suffocations (e.g. positional asphyxia, mechanical asphyxia, wedging, overlay), however,
accounted for 57 (25%) of the SRDs. Since all accidental suffocations are presumed to be preventable,
SRDs are a common focus of public health prevention efforts.
A high percentage of SRDs occurred in Philadelphia families experiencing either poverty, child protective
service involvement, drug use, or some combination thereof. A previous report on Philadelphia SRDs has
shown that nearly half of all SRDs from 2011 to 2015 occurred in the quarter of census tract where
median household incomes were the lowest.(3)
Almost 30% of the infants who
experienced a SRD had had a history
as a victim child with the Philadelphia
Department of Human Services
(DHS). Likewise, 48% of the primary
caregivers of these infants had a DHS
history as a perpetrator of child abuse or neglect prior to the infant’s death. In addition, 22% of these
infants were known to have been exposed to drugs while in utero, and at least 43% of the birth mothers
had a past or current drug or alcohol history.
A safe sleeping environment for an infant is
often the best protection from SRDs. Such
an environment consists of a safe sleep
location (e.g. a crib or bassinet), proper
sleep position (placed to sleep on the back),
a proper sleep surface (e.g. a firm mattress),
no bed sharing with people or animals, and
no other objects in the sleep area that could
obstruct the nose or mouth (e.g. pillows,
stuffed animals, comforters, bumper pads).
When looking more closely at the 227 SRDs,
only 16 of them (7%) qualified as having a
fully safe sleep environment.
Figure 2B.5: Child Protection History of Sleep-Related Deaths, 2011-17 (n=227)
CHILD PROTECTION SERVICE CONTACT n %
Infant with History as a Victim 65 29%
Caregiver with Previous History as a Perpetrator 109 48%
Mother with a Positive Drug Screen at Infant’s Birth 50 22%
Figure 2B.6: Degree of Safety in Sleep-Related Death Sleep Environment, 2011-2017 (n=227)

13
One of the most common forms of unsafe
sleep environment was sharing a sleep
surface with at least one other person (132
or 58% of the SRDs). In addition, most of
the deceased infants were not placed to
sleep in an appropriate sleep location. In
fact, only 68 of these 227 deaths (30%) had
a history of last being placed to sleep in a
crib, bassinet, or a pack-n-play. The
majority (64%) of the others were last
placed to sleep directly on an adult bed or
couch, or on top of another person who
was on a bed or couch. There were only
several cases reviewed where the infant
was placed somewhere other than the
locations already described (e.g. car seat,
infant swing, bouncy seat, floor, or
unknown).
The reasons why caregivers bed-share with their infants are many and varied, with availability of a safe
sleep location not being the only reason or
even the main reason. When looking more
closely at those 132 SRDs where an infant
died while bed-sharing, we see that 95 of
the households (72%) had a proper sleep
location available on the day of death,
numbers that have been slowly but
gradually rising in Philadelphia since we
began tracking them in 2006. Too often,
Medical Examiner investigators have found
that pack-n-plays were being used as
storage bins while the infant would sleep on
an adult bed.
Therefore, the issue for public health or
social service agencies is not simply getting
a bassinet or pack-n-play into a household
that lacks one, but understanding the
families’ needs and concerns about infant
sleep environment (presence of working utilities, vermin, violence) – and helping families understand
the importance of using those safe sleep environments.
Figure 2B.7: Last Place of Sleep for Sleep-Related Deaths, 2011-2017 (n=227)
Figure 2B.8: Bed-Sharing Sleep-Related Deaths with an Appropriate Sleep Location Available (n=132)

14
A safe sleep environment also includes
proper sleep position placement. The Back
to Sleep campaign, which was formally
introduced in the U.S. in 1994, has helped
lower the rate of SIDS. Despite the dramatic
progress that has been made against SIDS
and the widespread knowledge of the
importance of sleeping supine, nearly one-
third of the infants who suffered SRDs were
reported to have been placed on their
stomach or side to sleep. According to
parental reports, 145 of the infants (64%)
were last placed to sleep on their backs,
while 75 of the caregivers (33%) admitted
that they last placed their infant to sleep on
their side or stomachs. Progress has been
made on this front, but additional progress
is still needed for Philadelphia.
Figure 2B.9: Last Sleep Position Placement of Sleep-Related Deaths, 2011-2017 (n=227)

15
C. INFANT DEATHS DUE TO PREMATURITY AND PERINATAL CONDITIONS (n=940) Deaths due to perinatal conditions are included with other prematurity deaths in this subsection
because most of these deaths co-occur with prematurity. For example, maternal conditions such as
chorioamnionitis, cervical insufficiency, or premature rupture of membranes might be the underlying
factor that led an infant to be born too soon. But when the infant dies, it is sometimes hard to
determine if the death were due to the prematurity
alone or other factors. Since many physicians are
not properly trained to fill out a death certificate
and because there is so much variability from one
certifier to another, we group these two categories
together.
Deaths due to prematurity and perinatal conditions
are by far the most common category of death of
Philadelphia children, accounting for 940 infant
deaths, or 36% of the total deaths. Just as happened
with total deaths and infant deaths, deaths due to
prematurity and perinatal conditions have been
trending downward over the last ten years, and it is
likely the lead force driving the downward trend of
the others. The annual average number of deaths
from prematurity and perinatal conditions that were
identified by the FRP has decreased by almost 50 infant deaths per year over the past decade.
Many causes of prematurity are considered preventable, but just how to prevent prematurity is still not
fully understood. One of FRP’s previous goals to improve the CDR process had been to analyze the
prenatal care of infants who died. The FRP now routinely obtains >95% of the long-form birth certificate
files on all infant deaths we review (up from 50% of infants who died in 2008), but even these case files
are not always complete or filled out accurately by the hospitals.
Figure 2C.2: Deaths due to Prematurity and Perinatal Conditions, by Age, Gender, Race/Ethnicity, 2011-17 (n=940) †
AGE – Day(s) GENDER RACE/ETHNICITY 0-27 28-364 Male Female U/K‡ White, NH Black, NH Asian, NH Hispanic
870 70 511 423 6 93 670 34 143
93% 7% 54% 45% 1% 10% 71% 4% 15% † 8 non-infants who died due to sequelae of prematurity are not included here ‡ infant's gender was undetermined or unknown in six instances
Figure 2C.1: Annual Average Deaths due to Prematurity and Perinatal Conditions by Year Groupings, 2008-2017

16
D. RECOMMENDATIONS
Continue to promote safe-sleep through a multi-pronged city-wide campaign that assists with the availability of a safe sleep location (pack-n-plays, mini pack-n-plays, boxes, bassinets) and communicates to parents the importance of safe sleep practices
Rationale: SRDs are a leading cause of preventable death. Many parents and occasional caregivers are still unaware of what constitutes an unsafe sleep environment, and most Philadelphians are unaware of the extent of this public health problem.
Continue to support women’s ability to choose and use birth planning methods by helping to remove financial barriers to LARC (Long-Acting Reversible Contraception - such as IUDs and implantable devices) and other more traditional forms of birth control, and by increasing the availability of LARC at different locations (such as at Labor & Delivery suites immediately post-partum and at pediatric outpatient centers).
Rationale: In an ideal world, women should become pregnant if and only when they want to become pregnant. Birth control planning should not be limited to those with better health insurance plans or more resources. Adequate pregnancy spacing is healthier both for mothers and for babies.
The Philadelphia Department of Public Health should create a SUID/Safe Sleep Module for pediatric and family medicine residents that residency programs could carry out themselves; such a module could eventually be adapted for use with nursing staff and DHS workers
Rationale: Having a message and knowing how to effectively deliver it are two different things. While hospitals and outpatient centers are doing more and more screenings for all sorts of health issues, most are not properly trained to ask patients – especially if it’s a subject that may be uncomfortable to discuss. In addition, many healthcare providers are not equipped with answers to patients who are resistant to the message. Having a module and allowing for role play of medical residents will help insure that they’re truly educating their patients and not simply checking off a box about a task getting done.

17
UNINTENTIONAL INJURY DEATHS | SECTION THREE
A. OVERVIEW: UNINTENTIONAL INJURY DEATHS (n=351) Unintentional injuries (also referred to as accidents) accounted for 351 deaths, or 13% of all Philadelphia deaths ages 21 years and under, from 2011 to 2017. Among children under 15 years, unintentional injuries happen most commonly with infants (19%), mainly due to accidental suffocation in sleep-related deaths. Starting at age 15, unintentional injury deaths increase with age, and in general are more likely to involve males (73%). The documented propensity for risk-taking among males, combined with the milestones of obtaining a driver’s license and having increased access to alcohol and drugs, creates a potentially dangerous mix for this demographic group. Figure 3A.1: Unintentional Injury Deaths by Age, Gender, and Race/Ethnicity, 2011-2017 (n=351)
AGE Year(s) GENDER RACE/ETHNICITY <1 1-4 5-9 10-14 15-19 20-21 Male Female White, NH Black, NH Asian, NH Hispanic
65 37 23 25 100 101 246 105 114 162 13 62
19% 11% 7% 7% 28% 29% 70% 30% 32% 46% 4% 18%
Transportation-related deaths are the most common category of unintentional injury deaths in Philadelphia children and accounted for 33% of the total, closely followed by drug-related deaths (27%). Infant sleep-related asphyxia deaths, which have already been described in Section II, are the third most common category of unintentional injury deaths and accounted for 17% of the total. Figure 3A.2: Category of Unintentional Injury Deaths, 2011-2017 (n=351)
TOTALS CATEGORY AGE CATEGORIES – Year(s) <1 1-4 5-9 10-14 15-19 20-21
n % n n n n n n
116 33% Motor vehicle/Other Transport 3 11 8 8 51 35
95 27% Drug-related 0 0 0 1 33 61
58 17% Infant Sleep-related Asphyxia 58 0 0 0 0 0
30 9% Drowning 1 6 5 8 8 2
28 8% Fire, Burn, Electrocution 1 8 8 6 4 1
7 2% Fall 1 3 1 0 1 1
6 2% Foreign Body Obstructions/ Ingestions 1 4 1 0 0 0
5 1% Weapon 0 2 0 0 3 0
6 2% Other 0 3 0 2 0 1

18
B. TRANSPORTATION-RELATED DEATHS (n=116) Unintentional transportation-related deaths include drivers and passengers in motor vehicle crashes as
well as pedestrians and bicyclists struck by another vehicle. Seventy-four percent of fatalities in this
category are among 15-21 year olds, while the remaining transportation-related deaths are distributed
fairly equally across the other age groups.
Figure 3B.1: Transportation-Related Deaths by Age, Gender, and Race/Ethnicity, 2011-2017 (n=116)
AGE Year(s) GENDER RACE/ETHNICITY <1 1-4 5-9 10-14 15-19 20-21 Male Female White, NH Black, NH Asian, NH Hispanic
3 11 8 8 51 35 83 33 26 54 7 29
3% 9% 7% 7% 44% 30% 72% 28% 22% 47% 6% 25%
When looking at the role the child played in a
transportation-related death, 36% were
passengers inside a vehicle and 34% were
driving the vehicle itself at the time of the
event. Twenty-seven percent were walking on
foot, and just 3% of the children involved in a
transportation-related death were operating
a bicycle at the time of event. Thirteen (42%)
of the pedestrian deaths occurred in children
less than 10 years of age, and 7 of them were
struck by a vehicle when they darted out into
the street from between two parked cars.
Figure 3B.2: Decedent's Role in Transportation-related Deaths, 2011-2017 (n=116)
Figure 3B.3: Decedent’s Role in Transportation-related Deaths by Age Groups, 2011-2017 (n=116)
TOTALS CATEGORY AGE CATEGORIES – Year(s) <1 1-4 5-9 10-14 15-19 20-21
n % n n n n n n
39 34% Driver 0 0 0 2 19 18
42 36% Passenger 2 3 4 1 19 13
31 27% Pedestrian 1 8 4 4 10 4
4 3% On Bicycle 0 0 0 1 3 0

19
When looking specifically at the type of vehicle involved in the 85 non-pedestrian deaths, cars/SUVs/trucks accounted for 74% of the vehicles being driven. Motorcycles accounted for 20% of the vehicles involved in a child fatality, and ATVs in 1% of the events.
Figure 3B.4 illustrates the extent of seat belt usage in transportation-related deaths. It includes the 63 children who were in a car, SUV or truck, not those that were using forms of transportation not requiring a seat belt (bicycle, ATV, motorcycle, or pedestrian fatalities). Incorrect or lack of use of available safety features was a highly prevalent factor in fatal crashes. Only 11 (17%) of the 63 children who died in automobile accidents were known to be properly using a safety belt or infant/booster seat at the time of their death.
The majority (82% or 51 children) were not wearing any safety belts or child or booster seats at the time of the event. Only two (9%) of the 22 children who died while riding on motorcycles, ATVs or bicycles were wearing the required or recommended head protection.
Figure 3B.4: Vehicle Type Involved in Non-Pedestrian Deaths, 2011-2017 (n=85)
Figure 3B.5: Belt Usage in Transportation-Related Deaths, 2011-2017 (n=63)

20
Speeding and recklessness (Figure 3B.5) were the two most common factors identified in transportation-related fatalities, and they often occurred simultaneously in a fatal crash. Drug and alcohol use was present in 23% of the crashes, while running red lights and driver experience were the next most common factor cited, accounting for 14% each. Prior to the 1990s, “driver distraction” meant talking to someone else in the car or being engaged with the car radio. Now, driver distraction can also include talking on cell phones, texting, and using the internet. While increased focus on driver distraction is a valid concern, it was not identified with as much frequency as one might have presumed (just 13%). However, this data is limited by many factors, and it’s not always obvious or easy to prove that a driver was looking at a screen or talking on the phone just prior to a fatal crash. Environmental factors are closely studied when considering preventive measures for motor vehicle crashes. Figure 3B.6 shows that 29% of all crash fatalities partly resulted from poor road conditions (wetness or snow, inadequate lighting, or road hazard). However, road conditions were never indicated as the primary cause in any of these child deaths. Rather, it was individual behavioral factors that were identified as primarily responsible for all transportation-related deaths of Philadelphia children.
Figure 3B.6: Behavioral Factors in Transportation-Related Deaths, 2011-2017 (n=116)†
†Each fatal incident may involve more than one contributing factor.
Figure 3B.7: Environmental Conditions Present in Transportation-Related Deaths, 2011-2017 (n=116)†
†Each fatal incident may involve more than one environmental condition. In incidents occurring under “Normal” conditions, no other conditions were known to be present.

21
For the purposes of engineering safe transportation corridors, city officials and prevention advocates are interested in the location where crashes occur. As can be seen in Figure 3B.8, 65% of crash events took place on city streets, and 19% occurred on highways. Rural roads are included in these deaths because the CDR teams review all Philadelphia resident deaths, even if the child died outside Philadelphia – which happened to be the case for 19 (16%) of the unintentional transportation-related deaths that were reviewed.
Figure 3B.8: Street Type for Transportation-Related Deaths, 2011-2017 (n=116)

22
C. DRUG-RELATED DEATHS (n=95)
For purposes of this report,
unintentional drug-related deaths
refer to accidental overdoses of a
recreational drug that was taken by
the child or youth himself. In the
general population, unintentional
drug-related deaths have
skyrocketed in recent years across
the nation and in Philadelphia in
particular. Unintentional drug-
related deaths among Philadelphia
children and youth have fluctuated
from year to year, but when looking
over a 13-year window, it has
actually remained relatively level.
Drug-related deaths of the general
population in Philadelphia started a rapid
rise beginning in 2014 and continuing
through 2017 – driven by a combination of
over-prescribing of pharmaceutical opioids,
the availability of inexpensive illicit heroin
and the introduction of illicit fentanyl.
Despite this large increase, the number of
drug-related deaths in those ages 14 to 21
years increased at a much slower pace. And
when looking at the decedents’ toxicology
results, it appears that any excess child and
youth deaths can be attributed to fentanyl
use.
Figure 3C.1: Unintentional Drug-Related Deaths, by Age Groups, 2005-2017
Figure 3C.2: Fentanyl Presence in Toxicology Reports of Unintentional Drug-Related Deaths, 2011-2017 (n=95)

23
The majority of the unintentional drug-related deaths occurred in White, Non-Hispanics (66%) and in
males (71%). All but five of the 95 deaths occurred in youths aged 18 years or older, several of whom
were college students. (For death certificate purposes, a person attending college is a resident where he
is currently living – whether that’s in on-campus or off-campus housing.)
Figure 3C.3: Unintentional Drug-Related Deaths by Age, Gender, and Race/Ethnicity, 2011-2017 (n=95)
AGE Year(s) GENDER RACE/ETHNICITY <1 1-4 5-9 10-14 15-19 20-21 Male Female White, NH Black, NH Asian, NH Hispanic
0 0 0 1 33 61 71 24 63 19 3 10
0% 0% 0% 1% 35% 64% 75% 25% 66% 20% 3% 11%
The most common drugs found were opioids of any kind (e.g. fentanyl, oxycodone, heroin), which were detected in 85% of the deaths. Benzodiazepines (especially alprazolam) were detected in 48% of the deaths, and cocaine was detected in 35%.
Figure 3C.4: Substances Detected in Toxicology Reports† of Unintentional Drug-Related Deaths, 2011-2017 (n=95)
†cannabinoids are not included in routine testing for drug-related deaths.

24
D. FIRE, BURN, AND ELECTROCUTION DEATHS (n=28) In Philadelphia, fire and electrocution caused the death of 28 children from 2011-2017. Approximately
two-thirds (68%) of the victims were male and 71% were of Black, Non-Hispanic. Most of the fatalities
(79%) occurred to children between 1 and 14 years of age, and within this group, fires claimed nearly
equally from each age subgroup (1-4, 5-9, and 10-14 years).
Figure 3D.1: Fire and Electrocution Deaths by Age, Gender, and Race/Ethnicity, 2011-2017 (n=28)
AGE Year(s) GENDER RACE/ETHNICITY <1 1-4 5-9 10-14 15-19 20-21 Male Female White, NH Black, NH Asian, NH Hispanic
1 8 8 6 4 1 19 9 2 20 2 4
4% 29% 29% 21% 14% 4% 68% 32% 7% 71% 7% 14%
Eighteen house fires resulted in 24 child deaths. Five (28%) of the house fire events originated from
lighters or candles, another five (28%) originated from electrical wiring or extension cords, and three
(17%) were due to cooking stoves or grease fires resulting from their use.
Of the 18 fatal house fire events, there was documentation that half of the households did not have a
working smoke detector (either no smoke detector was found, or the smoke detectors found did not
have a battery present). For the remaining half, it was unclear (33% did have a smoke detector but it
was not clear if batteries were present, and for the remaining 17% it was simply listed as ‘Unknown’).
Figure 3D.2: Source for House Fire Deaths, 2011-2017 (n=18 events)
Figure 3D.3: Fire Detector Status of House Fire Deaths, 2011-2017 (n=18 events)

25
E. DROWNING DEATHS (n=30) There were 30 unintentional drowning deaths reviewed for years of death 2011-2017. A majority (77%)
was male, half were Black, Non-Hispanic children, and the deaths were spread out across every age
group.
Figure 3E.1: Accidental Drowning Deaths by Age, Gender, and Race/Ethnicity, 2011-2017 (n=30)
AGE Year(s) GENDER RACE/ETHNICITY <1 1-4 5-9 10-14 15-19 20-21 Male Female White, NH Black, NH Asian, NH Hispanic
1 6 5 8 8 2 23 7 9 15 0 6
3% 20% 17% 27% 27% 7% 77% 23% 30% 50% 0% 20%
Precisely where drowning deaths occur is of
great interest to prevention teams, since
patterns in location help to prioritize and
formulate prevention efforts. Among the
cases reviewed for years of death 2011-
2017, 11 (37%) occurred in open waters –
ocean, river or creek. Eight deaths (27%)
occurred inside the home or residence, all
inside a bathtub. The remaining 11 deaths
(36%) took place in pools – in public pools
at recreation centers or parks (5), at
hotel/motel pools (3), and in residential
pools (3). Eleven (37%) of these incidents
occurred outside Philadelphia’s borders, in
neighboring counties and states.
Factors that contributed to these drowning deaths included a combination of lack of adequate
supervision (especially for infants and toddlers in bathtubs), a child who is unable to swim and is not
wearing the necessary flotation devices, and a child playing in open water (ocean, river, creek) and
getting overpowered by the current or undertow.
Figure 3E.2: Water Location of Accidental Drowning Deaths, 2011-2017 (n=30)

26
F. RECOMMENDATIONS
Philadelphia-area hospitals should work with local partners to include a 10-year lithium battery smoke detector in their newborn baby welcome basket.
Rationale: Most home fire deaths occur due to the lack of a working smoke detector (i.e. no smoke detector at all or missing batteries). 10-year lithium battery smoke detectors work for 10 years, cannot have their batteries removed for use by another device (such as a remote control), and are relatively inexpensive. There are nearly 23,000 births in Philadelphia every year, and hospitals used to employ a tradition of giving out a welcome gift for every new baby. Having hospitals include a long-lasting smoke detector as a welcome gift would likely have widespread acceptance by hospitals and families, and it would protect not only the infants but their family members too. Partial funding of such an effort could be sought from other partners. If successful, additional efforts could be made to further broaden the approach to larger segments of the population.
Support the Mayor’s Task Force to Combat the Opioid Epidemic in Philadelphia and its many recommendations therein (www.phila.gov/opioids).
Rationale: The Mayor’s Task Force has convened over 100 experts, stakeholders and community members since 2017 and developed 18 actionable and evidence-based recommendations to combat the opioid epidemic.
Remove the option for a junior license in Pennsylvania. Rationale: In Pennsylvania, a junior license can be obtained at age 16 and 6 months, while a full license can be obtained at age 17 and 6 months. A child with a junior license can drive unaccompanied between the hours of 5am and 11pm. Adolescents are at increased risk for distracted driving and causing car crashes.
Philadelphia police should continue to place emphasis on enforcement of safety seat, booster seat, and seat belt laws.
Rationale: CDR data shows that proper use of passenger safety equipment saves children lives. Or put another way, children who die in motor vehicle crashes are very unlikely to have used proper passenger safety equipment.
Support local Vision Zero goals for transportation fatalities; further protect existing bicycle lanes and make sure new bicycle lanes are better separated from cars.
Rationale: “Vision Zero is a strategy to eliminate all traffic-related deaths and severe injuries…” that has been adapted to many cities in the United States, including Philadelphia. Philadelphia’s child death data corroborates the findings of the Vision Zero Task Force and their Three-Year Action Plan which outlines goals to reduce transportation-related deaths and injuries that primarily occur in neighborhoods where Philadelphia residents live below the poverty line. Areas such as these would benefit from the safeguards that exist in less-impoverished neighborhoods.
(4)

27
INTENTIONAL INJURY DEATHS | SECTION FOUR
A. OVERVIEW: INTENTIONAL INJURY DEATHS (n=556) Intentional injury deaths result from the willful act of an individual to cause harm, which includes deaths
due to suicide and homicide. Youth deaths due to intentional injury are of great importance in the
United States, where violent injury deaths disproportionately affect adolescents compared to other age
groups.
For Philadelphia children who died in 2011-2017 and were reviewed by the CDR teams, intentional
injury accounted for 556 deaths, or 21% of all child deaths. Victims were mostly male (87%), ages 15 to
21 years (88%), and Black or Hispanic (90%). It is important to note that these trends vary when
comparing suicides to homicides. These differences will be described in detail in the sections to follow.
Figure 4A: Intentional Injury Deaths by Age, Gender, and Race/Ethnicity, 2011-2017 (n=556) †
AGE Year(s) GENDER RACE/ETHNICITY <1 1-4 5-9 10-14 15-19 20-21 Male Female White, NH Black, NH Asian, NH Hispanic
21 16 6 25 248 240 481 75 45 415 15 81
4% 3% 1% 4% 45% 43% 87% 13% 8% 75% 3% 15%
†40 homicides due to child abuse were included in this graphic but are discussed separately in Section V
Thorough reviews of each fatality by the CDR teams advance an understanding of the scope of fatal
victimization, abuse, and self-injury, and also uncover the antecedents to these tragic events. During the
reviews, every aspect of the child’s life bearing on the outcome is considered when answering the
following questions: Why did this happen? What could have been done to prevent this? And moving
forward: How can this knowledge be implemented to prevent the deaths of other children in
Philadelphia?
In order to answer these questions, all major systems touching a child’s life are involved in the process.
This includes institutions such as schools, hospitals, child protective services, behavioral health
representatives, police departments, delinquency courts, and general supportive service providers.
Review discussions generally are guided by the risk factors for violence that include prior history of
violence (court history, delinquency, detention), drug and alcohol use, poor family functioning, school
performance (grades, truancy, suspensions), and poverty-related issues.

28
B. SUICIDES (n=95) Ninety-six suicides (less than 4% of all child deaths) were reviewed by the CDR teams for years of death
2011-2017. As shown in Figure 4B.1, 66% of the victims were male, 88% were 15-21 years of age, and
42% were Black, Non-Hispanic. Compared to all intentional injury deaths, suicide victims included a
higher percentage of 10-14 year olds, accounting for 13% of all suicide deaths. White, Non-Hispanic
children comprised 27% of all suicide fatalities, and half of the suicide victims were 20-21 years of age.
Figure 4B.1: Suicide Deaths by Age, Gender, and Race/Ethnicity, 2011-2017 (n=96)
AGE – Years GENDER RACE/ETHNICITY 10-14 15-19 20-21 Male Female White, NH Black, NH Asian, NH Hispanic
12 36 48 63 33 26 40 11 19
13% 38% 50% 66% 34% 27% 42% 11% 20%
The majority of suicides were by asphyxia
(predominantly due to hanging), and this was the
most common method of suicide for every age
group. The next most common method for children
of all groups was by weapons, almost exclusively
firearms. Intentional drug overdose or toxic
substance ingestion/exposure was the next most
common method of suicide.
In general, every child death reviewed represents a
fraction of the number of children who were
hospitalized but survived, which is a fraction of the
number of children who sought medical care
through an emergency room
or primary care office, which
is a fraction of the number of
children who never sought
medical care for an illness or
injury. For suicides, the
deaths reviewed also
represent just the tip of the
iceberg.
According to some estimates,
there are nearly 30 suicide
attempts for every death by
suicide. (5)
Figure 4B.2: Suicide Deaths by Method, 2011-2017 (n=96)
Figure 4B.3: Method of Suicide by Age Group, 2011-2017 (n=96)
29
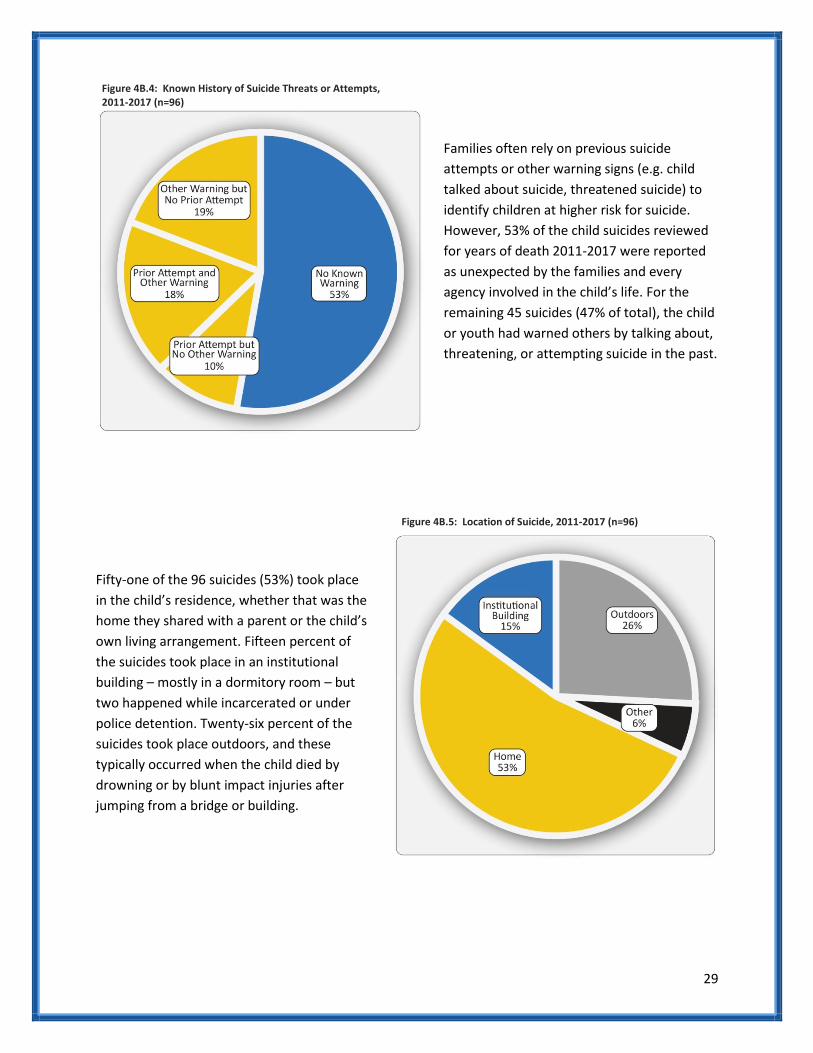
Families often rely on previous suicide
attempts or other warning signs (e.g. child
talked about suicide, threatened suicide) to
identify children at higher risk for suicide.
However, 53% of the child suicides reviewed
for years of death 2011-2017 were reported
as unexpected by the families and every
agency involved in the child’s life. For the
remaining 45 suicides (47% of total), the child
or youth had warned others by talking about,
threatening, or attempting suicide in the past.
Fifty-one of the 96 suicides (53%) took place
in the child’s residence, whether that was the
home they shared with a parent or the child’s
own living arrangement. Fifteen percent of
the suicides took place in an institutional
building – mostly in a dormitory room – but
two happened while incarcerated or under
police detention. Twenty-six percent of the
suicides took place outdoors, and these
typically occurred when the child died by
drowning or by blunt impact injuries after
jumping from a bridge or building.
Figure 4B.4: Known History of Suicide Threats or Attempts, 2011-2017 (n=96)
Figure 4B.5: Location of Suicide, 2011-2017 (n=96)

30
More than half of the children who died by
suicide were students: 21% were attending
elementary, middle or high school, and another
34% were attending a college or university. Of
the remaining 38% who were not students, 19%
were employed at the time of their death, and
19% were unemployed.
Identifying the reasons children commit suicide offers insight into the risk factors for child suicide.
Knowing and recognizing the red flags for high-risk behavior might allow parents, caretakers and the
larger community to intervene. There are many questions within our database that delve into the
possible triggers, such as bullying, break-ups with a boyfriend or girlfriend, parents’ divorce, recent
suicide of a friend, etc. Figure 4B.7 below depicts the reasons captured by 91 of the 96 suicides covered
in this report. In 5 cases, no factor was able to be identified by family or service agencies.
Figure 4B.7: Percent of Suicide Deaths with Known Reasons/Factors that May Have Contributed to Suicide, 2011-2017 (n=91) †
†more than one factor can be selected per suicide; for 5 deaths there was no known risk factor identified
Figure 4B.6: School and Employment Status, 2011-2017 (n=96)
31
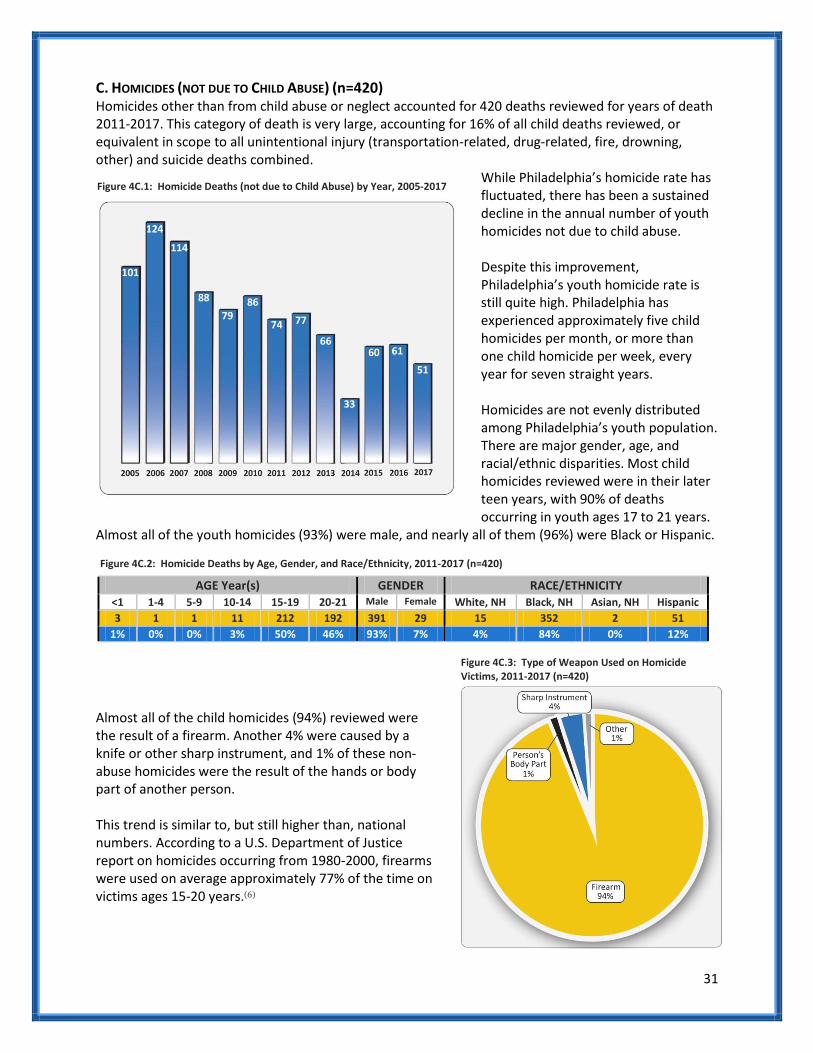
C. HOMICIDES (NOT DUE TO CHILD ABUSE) (n=420) Homicides other than from child abuse or neglect accounted for 420 deaths reviewed for years of death 2011-2017. This category of death is very large, accounting for 16% of all child deaths reviewed, or equivalent in scope to all unintentional injury (transportation-related, drug-related, fire, drowning, other) and suicide deaths combined.
While Philadelphia’s homicide rate has fluctuated, there has been a sustained decline in the annual number of youth homicides not due to child abuse. Despite this improvement, Philadelphia’s youth homicide rate is still quite high. Philadelphia has experienced approximately five child homicides per month, or more than one child homicide per week, every year for seven straight years. Homicides are not evenly distributed among Philadelphia’s youth population. There are major gender, age, and racial/ethnic disparities. Most child homicides reviewed were in their later teen years, with 90% of deaths occurring in youth ages 17 to 21 years.
Almost all of the youth homicides (93%) were male, and nearly all of them (96%) were Black or Hispanic.
Figure 4C.2: Homicide Deaths by Age, Gender, and Race/Ethnicity, 2011-2017 (n=420)
AGE Year(s) GENDER RACE/ETHNICITY <1 1-4 5-9 10-14 15-19 20-21 Male Female White, NH Black, NH Asian, NH Hispanic
3 1 1 11 212 192 391 29 15 352 2 51
1% 0% 0% 3% 50% 46% 93% 7% 4% 84% 0% 12%
Almost all of the child homicides (94%) reviewed were the result of a firearm. Another 4% were caused by a knife or other sharp instrument, and 1% of these non-abuse homicides were the result of the hands or body part of another person. This trend is similar to, but still higher than, national numbers. According to a U.S. Department of Justice report on homicides occurring from 1980-2000, firearms were used on average approximately 77% of the time on victims ages 15-20 years.(6)
Figure 4C.1: Homicide Deaths (not due to Child Abuse) by Year, 2005-2017
Figure 4C.3: Type of Weapon Used on Homicide Victims, 2011-2017 (n=420)

32
Most children undergoing an autopsy at a Medical Examiner's Office will have a toxicology screen performed. Twenty-nine percent of the homicide victims were under the influence of drugs or alcohol at the time of death. Opioids (mostly oxycodone) were the most common drugs found in the homicide victims, followed by benzodiazepines (mostly alprazolam). A large percentage of the youth homicide victims reviewed had juvenile delinquent and criminal histories of their own. Almost half of the homicide victims of 2011-2017 had a juvenile detention history, and 72% had either a juvenile or adult criminal history prior to their death. In addition, 74% of the homicide victims had a documented history of truancy problems in school.
Of the 162 homicides in which a perpetrator was identified by police and conveyed to the CDR team, 12% were very well known to the victim (e.g. a family member, friend, or romantic partner), 30% were an acquaintance of the victim, 25% were a member of a rival gang, and 33% were strangers. Figure 4C.6: Relationship of Primary Perpetrator to Homicide Victim, 2011-2017 (n=162) †
Figure 4C.7: Age Groups of Primary Perpetrator to Homicide Victim, 2011-2017 (n=162) †
†only where a perpetrator was known or described
The age groups of the homicide perpetrators tended to be older than the decedents. Thirty-four percent were aged 15-19 years, 29% were 20-24 years, and 20% of the perpetrators were aged 25 years and older. These results were fairly similar to what was found among perpetrators of Philadelphia youth homicides from previous years.
Figure 4C.4: Toxicology Screen Results of Homicide Victims, 2011-2017 (n=420)
Figure 4C.5: Detention, Criminal and Truancy History of Homicide Victims Ages >10, 2011-2017 (n=415)
CAUSES/ CONTRIBUTORS instances %
Juvenile Detention History 204 49%
Juvenile/Adult Criminal History 297 72%
School Problems 328 79%
Truancy 306 74%

33
D. RECOMMENDATIONS Suicide:
Public safety and health care professionals should discourage parents from keeping a gun in the household as well as educate parents with guns about the importance of safety devices to prevent children from using them. Rationale: Described in Section A of this report were 37 children who died from gunshot wounds other than by homicide: 28 by suicide and 9 by either accident or undetermined manner. While the CDR teams often have incomplete and limited knowledge about the source of guns, at least 18 of the 28 suicides by gunshot were done with a household gun.
DBHIDS should create a mechanism for follow-up to the Philadelphia Crisis Line about involuntary commitments (302s) that do not get served at a Crisis Response Center (a 24/7 facility that is equipped to assess and treat mental health crises) within one week of getting issued. Rationale: The Philadelphia Crisis Line is responsible for issuing 302s outside of a hospital setting, but they have no way of knowing if a child issued one is seen. Follow-up is an important part of ensuring the safety of a child at risk for suicide, and even well-meaning parents can fail to follow through with necessary behavioral health interventions.
DBHIDS should expand its program of pediatric mobile teams that can provide home-based assessment for children in a behavioral health crisis. Rationale: The Children’s Mobile Crisis Team was started in 2018 with three teams, and operates on a 24/7 scheduled. Children are evaluated in the home rather than in a stressful hospital, services can be provided both to the child and the family, and the intervention appears to be effective at reducing the number of 302s getting issued to children and preventing future crises from happening.
The School District of Philadelphia should broaden its work with Prevent Suicide PA Learning center in order to develop and implement a suicide safety plan for students it has already identified as higher risk for suicide. Rationale: The Suicide Safety Planning Intervention (Stanley & Brown, 2012) has demonstrated effectiveness in reducing suicidal behavior across a number of populations and in various settings. Through a statewide youth suicide prevention grant in Pennsylvania, the Prevent Suicide PA Online Learning center has begun to work with schools to develop suicide safety plans for students that they identify as higher risk for suicide – but there is no mandate that currently requires any school district to implement this effective intervention.
Philadelphia hospitals and Crisis Response Centers should send ‘caring texts’ to youths (and their parents) following a suicide attempt. Rationale: The only intervention that has ever demonstrated an actual reduction in suicide deaths is the caring letters study conducted by Dr. Jerry Motto in the early 1970s in San Francisco (Motto, 1976). The intervention involved a series of 24 postcards mailed to patients after discharge from the hospital simply stating they were cared for and were welcome to drop the hospital a line about their well-being should they choose to do so. More recently, Dr. Greg Carter in Australia and a few others across the globe have shown that a text message version of this intervention is effective for youth in reducing repeated self-harm and suicidal behavior.
DBHIDS should continue to partner with the School District of Philadelphia to provide Mental Health First Aid training for all school staff. Rationale: the School District of Philadelphia has lost many health and behavioral health-related positions over the years, but depression and suicidality can sometimes be identified by someone who spends a lot of time with the child (e.g. school staff) and has had some training in identifying mental health concerns (e.g. Mental Health First Aid).

34
Pennsylvania should increase the age that a child can refuse mental health treatment from age 14 to age 16 or perhaps age 18.
Rationale: This Pennsylvania law is an outlier among most states. It places too much power in the hands of an immature adolescent who may be at risk for suicide in making important health care decisions over the say of their parents.
Homicide:
Expand the scope of YVRP (Youth Violence Reduction Program) to additional police districts.
Rationale: YVRP is a multi-agency (Police, Probation, District Attorney’s Office, and Managing Director’s Office) anti-violence initiative that provides intensive services and supervision. The program targets young adults ages 14-24 at greatest risk of killing or being killed.
The District Attorney’s Office, School District of Philadelphia and Department of Human Services (DHS) should continue to invest in truancy prevention programs.
Rationale: Truancy, especially early-onset truancy, is often correlated with later risk of violence. While there is no strong evidence base for truancy reduction and future reduction of violence, families of truant youth can often benefit from prevention services.
Support the Philadelphia Roadmap to Safer Communities, with additional specific interventions from reducing the availability and accessibility of firearms to increasing trauma-informed care in the schools to developing a citywide violence prevention initiative. (7)
Rationale: The Philadelphia Roadmap to Safer Communities is a comprehensive plan to establish a strategy for gun violence prevention by using a public health approach to violence. The plan involved stakeholders from multiple city agencies, community organizations, and community members.

35
FOCUS ON CHILD ABUSE AND NEGLECT DEATHS | SECTION FIVE
A. OVERVIEW: CHILD ABUSE AND NEGLECT DEATHS (n=68) Child abuse and neglect is defined by the Federal Child Abuse Prevention and Treatment Act (CAPTA) as
“any recent act or failure to act on the part of a parent or caretaker which results in death, serious
physical or emotional harm, sexual abuse or exploitation.” In 2016, there were 676,000 children in the
United States who were reported as victims to child protection services, and 1,750 were fatal.(8)
From 2011-2017, there were 68 Philadelphia
fatalities due to child abuse or neglect that were
reviewed by the CDR teams. Figure 5A.1 describes
the victims as young children (37% were infants
and 75% were under the age of 5 years); 65% were
male; and 87% of the deaths occurred to those of
Black, non-Hispanic (65%) and Hispanic (22%)
race/ethnicity.
Suspicion of child abuse and neglect prompts a
review of the family involvement with the
Philadelphia Department of Human Services (DHS).
For child abuse and neglect deaths from 2011-2017,
CDR reviews discovered that 65% of the victims’
families had no previous contact with DHS, either as
victims or perpetrators. Thirteen percent of the
deaths had had a prior contact with DHS, but the
case had been closed at the time of the death, and
22% of the families had had an open case with DHS
at the time of the child’s death.
Figure 5A.1: Child Abuse & Neglect Deaths by Age, Gender, and Race/Ethnicity, 2011-2017 (n=68)
AGE – Year(s) GENDER RACE/ETHNICITY
<1 1-4 5-9 10-14 Male Female White, NH Black, NH Asian, NH Hispanic
25 26 10 7 44 24 7 44 2 15
37% 38% 15% 10% 65% 35% 10% 65% 3% 22%
Figure 5A.2: Child Abuse & Neglect Deaths by Year, 2011-2017 (n=68)
Figure 5A.3: Child Abuse & Neglect Deaths by DHS Contact with Family, 2011-2017 (n=68)

36
B. CHILD ABUSE DEATHS (n=35) Homicides that are due to child abuse are relatively few but consistent in Philadelphia. From 2011-2017,
there was an average of five child abuse homicides per year. The deaths tended to occur predominantly
in infants and toddlers (83%), and were more frequent among males (71%) than among females.
Figure 5B.1: Child Abuse Deaths by Age, Gender, and Race/Ethnicity, 2011-2017 (n=35)
AGE – Year(s) GENDER RACE/ETHNICITY <1 1-4 5-9 10-14 Male Female White, NH Black, NH Asian, NH Hispanic
17 12 5 1 25 10 3 20 2 10
49% 34% 14% 3% 71% 29% 9% 57% 6% 29%
Child abuse homicides typically occur through blunt trauma:
hitting, beating, or shaking infants and toddlers, usually by a
parent or parent’s paramour.
C. CHILD NEGLECT DEATHS (n=33) Deaths due to child neglect can be quite difficult for child protective service investigators, let alone CDR teams, to properly identify. As opposed to child abuse, when a parent or other caregiver performed an act, child neglect is usually due to failure to perform an act – such as lack of supervision, failure to keep a dangerous object out of the reach of a child, or failure to provide the child with appropriate medical care. There have been 33 deaths from 2011-2017 that the CDR teams considered child neglect, with the deaths having occurred more frequently in children ages 1-4 years (42%), males (58%) and Black, Non-Hispanics (73%). Figure 5C.1: Child Neglect Deaths by Age, Gender, and Race/Ethnicity, 2011-2017 (n=33)
AGE – Year(s) GENDER RACE/ETHNICITY <1 1-4 5-9 10-14 Male Female White, NH Black, NH Asian, NH Hispanic
8 14 5 6 19 14 4 24 0 5
24% 42% 15% 18% 58% 42% 12% 73% 0% 15%
Failure to provide for a child’s medical needs accounted for seven deaths (21%). The most common medical conditions cited were asthma and infectious diseases.
However, lack of adequate adult supervision was the most common omission noted among the 33 deaths. Lack of supervision was determined to have played the main factor in most of the injury deaths (drowning, gunshot wounds, drug ingestions/poisoning, fires and falls) that occurred.
Figure 5B.2: Categories of Child Abuse Deaths, 2011-2017 (n=35)
CHILD ABUSE TYPE n %
Blunt Trauma 23 66%
Asphyxia/Suffocation 4 11%
Drug Administration 4 11%
Gunshot Wound 2 6%
Stab Wound 2 6%
Figure 5C.2: Categories of Child Neglect Deaths, 2011-2017 (n=35)
NEGLECT TYPE n %
Medical Neglect 7 27%
Drowning 6 23%
Undetermined 5 19%
Gunshot Wound 4 15%
Drug Ingestion 4 15%
Fire 3 12%
Starvation 2 8%
Fall 2 8%

37
UNDETERMINED DEATHS | SECTION SIX
A. OVERVIEW: UNDETERMINED DEATHS (n=164)
Undetermined “is a classification used when the information pointing to one manner of death is no
more compelling than one or more competing manners of death in thorough consideration of all
available information.” When it comes to child death review, undetermined manner tends to be most
often used in classifying sleep-related infant deaths.(9)
Of the Philadelphia child deaths between 2011 and 2017, 164 (6%) were classified as undetermined.
Ninety-one percent of these deaths occurred in children under five years of age, with 99 (60%) male and
121 (74%) Black, non-Hispanic (Fig 6A.1).
Figure 6A.1: Undetermined Deaths by Age, Gender, and Race/Ethnicity, 2011-2017 (n=164)
AGE Year(s) GENDER RACE/ETHNICITY <1 1-4 5-9 10-14 15-19 20-21 Male Female White, NH Black, NH Asian, NH Hispanic
137 11 4 2 10 0 99 65 18 121 1 24
84% 7% 2% 1% 6% 0% 60% 40% 11% 74% 1% 15%
Sleep-related deaths accounted for 124 (76%)
of Philadelphia’s undetermined child deaths
(and are explored in greater detail in Section
II). The next most frequent categories of death
typically involved causes of death due to an
injury, in which the Medical Examiner could
not determine if it was due to an intentional or
unintentional action (e.g. unclear if a house fire
was due to arson or some other cause; unclear
if a teenager was playing with a gun that
accidentally misfired or was purposefully fired; unclear if the toddler was able to get hold of mother’s
methadone on her own or if someone administered the drug to her on purpose).
B. AUTOPSY NEGATIVE UNDETERMINED DEATHS (NOT SLEEP-RELATED DEATHS) (n=17) There are also undetermined deaths because the case is essentially ‘autopsy negative’: there are no
signs of disease or injury that can explain the death. Specifically, toxicology is negative, the organs
appear grossly normal to the naked eye and when viewed under the microscope, tests for infectious
diseases are negative, and nothing else in the child’s medical history, social history, family history, and
scene investigation clearly suggest a cause of death.
In the category of autopsy negative causes of death are cardiac channelopathies and sudden
unexplained death in epilepsy. These causes (e.g. Long QT Syndrome, Wolff-Parkinson-White Syndrome,
Brugada syndrome) result in a fatal arrhythmia, and once the heart stops beating, there is no ongoing
proof of dysfunction .(10-14) These conditions may be present on an electrocardiogram when alive, but
are undetectable after death.
Figure 6A.2: Category of Undetermined Deaths, 2011-2017 (n=164)
CATEGORY n %
Sleep-Related Infant Death 124 76%
Child Abuse & Neglect 10 6%
Fire 5 3%
Gunshot Wound 3 2%
Suffocation 3 2%
Fall 1 1%
Drugs 1 1%
Other Undetermined, Infant and Toddler 14 9%
Other Undetermined, Teen 3 2%
38
After death, the only way to determine if an autopsy negative death was due to an underlying genetic
condition, such as a cardiac channelopathy, is through genetic analysis. There are many disease-causing
mutations, that if found, would explain the cause of death despite a negative autopsy, and is referred to
as a molecular autopsy.(14) Importantly, the majority of these genetic causes of death is inherited in an
autosomal dominant fashion, and up to half of living family members may carry the same gene.
There were seventeen ‘autopsy negative’ deaths that were not considered a sleep-related death during
the years 2011 to 2017. Future cases like this would qualify for the CDC’s SDY (Sudden Death in the
Young) Case Registry, and the option will exist for those families to consent to perform a full genomic
sequencing of the child’s DNA. This will enable researchers to amass a greater bank of DNA samples
across the country in order to discover genetic variants that are associated with (and perhaps causal of)
sudden, unexpected deaths.
C. RECOMMENDATIONS
Ensure that Philadelphia’s partnership with the CDC’s SDY Registry is a productive one, both in consenting families for DNA banking and genomic sequencing, as well as in conducting effective advance reviews so that all SDY cases are properly classified and entered in the National Fatality Review Case Reporting System.
Rationale: Relatively little is still known about Sudden Death of the Young, such as the true incidence. Researchers have relatively few DNA samples of SDY cases for their registry, particularly of minority children. Philadelphia is well-equipped to contribute to the national registry due to its large population, higher than national average rates of child deaths, and large percentage of minority children.
Organizations that work on behalf of child public health issues, especially those that deal with cardiac health issues, should create grants for local MEOs to help pay for full genomic sequencing of child deaths where a certain channelopathy or sudden unexpected death in epilepsy is suspected.
Rationale: Genomic sequencing is not included in an MEO’s arsenal of tests they can order, and is often not covered by health insurance companies. Families with fewer resources will find it difficult to afford such testing, which can put current or future siblings and half-siblings at increased risk for sudden death.
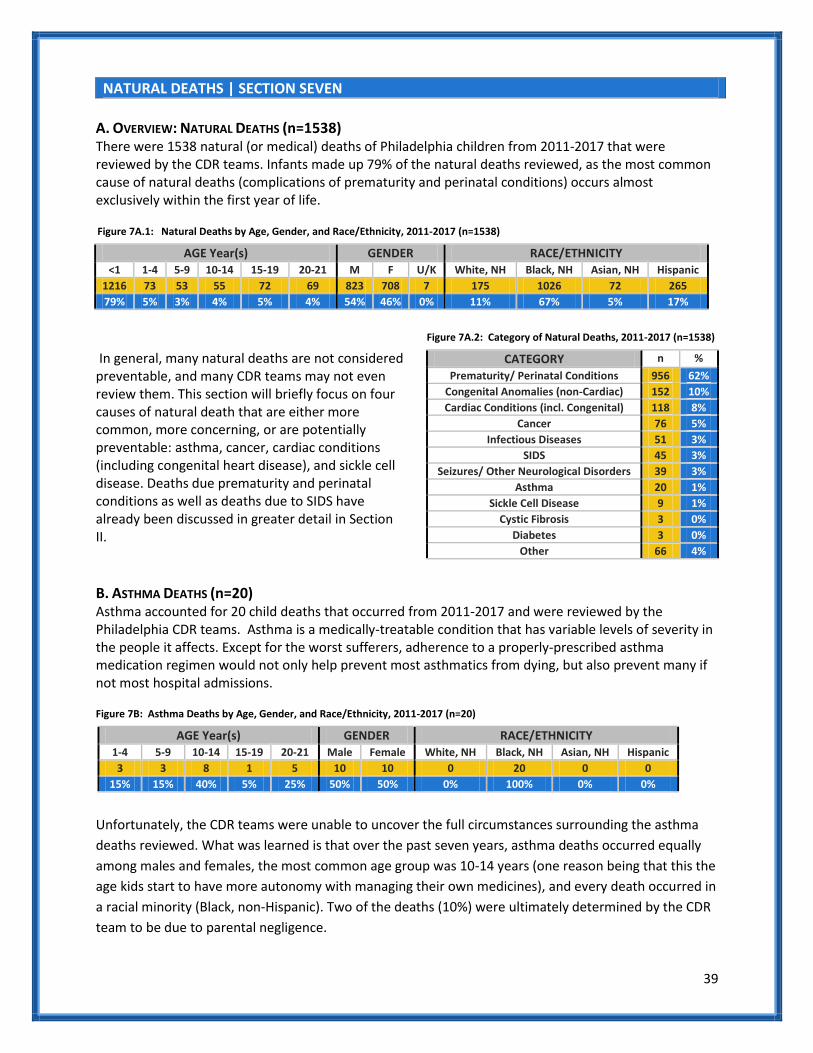
39
NATURAL DEATHS | SECTION SEVEN
A. OVERVIEW: NATURAL DEATHS (n=1538) There were 1538 natural (or medical) deaths of Philadelphia children from 2011-2017 that were reviewed by the CDR teams. Infants made up 79% of the natural deaths reviewed, as the most common cause of natural deaths (complications of prematurity and perinatal conditions) occurs almost exclusively within the first year of life.
In general, many natural deaths are not considered preventable, and many CDR teams may not even review them. This section will briefly focus on four causes of natural death that are either more common, more concerning, or are potentially preventable: asthma, cancer, cardiac conditions (including congenital heart disease), and sickle cell disease. Deaths due prematurity and perinatal conditions as well as deaths due to SIDS have already been discussed in greater detail in Section II.
B. ASTHMA DEATHS (n=20) Asthma accounted for 20 child deaths that occurred from 2011-2017 and were reviewed by the Philadelphia CDR teams. Asthma is a medically-treatable condition that has variable levels of severity in the people it affects. Except for the worst sufferers, adherence to a properly-prescribed asthma medication regimen would not only help prevent most asthmatics from dying, but also prevent many if not most hospital admissions.
Figure 7B: Asthma Deaths by Age, Gender, and Race/Ethnicity, 2011-2017 (n=20)
AGE Year(s) GENDER RACE/ETHNICITY 1-4 5-9 10-14 15-19 20-21 Male Female White, NH Black, NH Asian, NH Hispanic
3 3 8 1 5 10 10 0 20 0 0
15% 15% 40% 5% 25% 50% 50% 0% 100% 0% 0%
Unfortunately, the CDR teams were unable to uncover the full circumstances surrounding the asthma
deaths reviewed. What was learned is that over the past seven years, asthma deaths occurred equally
among males and females, the most common age group was 10-14 years (one reason being that this the
age kids start to have more autonomy with managing their own medicines), and every death occurred in
a racial minority (Black, non-Hispanic). Two of the deaths (10%) were ultimately determined by the CDR
team to be due to parental negligence.
Figure 7A.1: Natural Deaths by Age, Gender, and Race/Ethnicity, 2011-2017 (n=1538)
AGE Year(s) GENDER RACE/ETHNICITY <1 1-4 5-9 10-14 15-19 20-21 M F U/K White, NH Black, NH Asian, NH Hispanic
1216 73 53 55 72 69 823 708 7 175 1026 72 265
79% 5% 3% 4% 5% 4% 54% 46% 0% 11% 67% 5% 17%
Figure 7A.2: Category of Natural Deaths, 2011-2017 (n=1538)
CATEGORY n %
Prematurity/ Perinatal Conditions 956 62%
Congenital Anomalies (non-Cardiac) 152 10%
Cardiac Conditions (incl. Congenital) 118 8%
Cancer 76 5%
Infectious Diseases 51 3%
SIDS 45 3%
Seizures/ Other Neurological Disorders 39 3%
Asthma 20 1%
Sickle Cell Disease 9 1%
Cystic Fibrosis 3 0%
Diabetes 3 0%
Other 66 4%
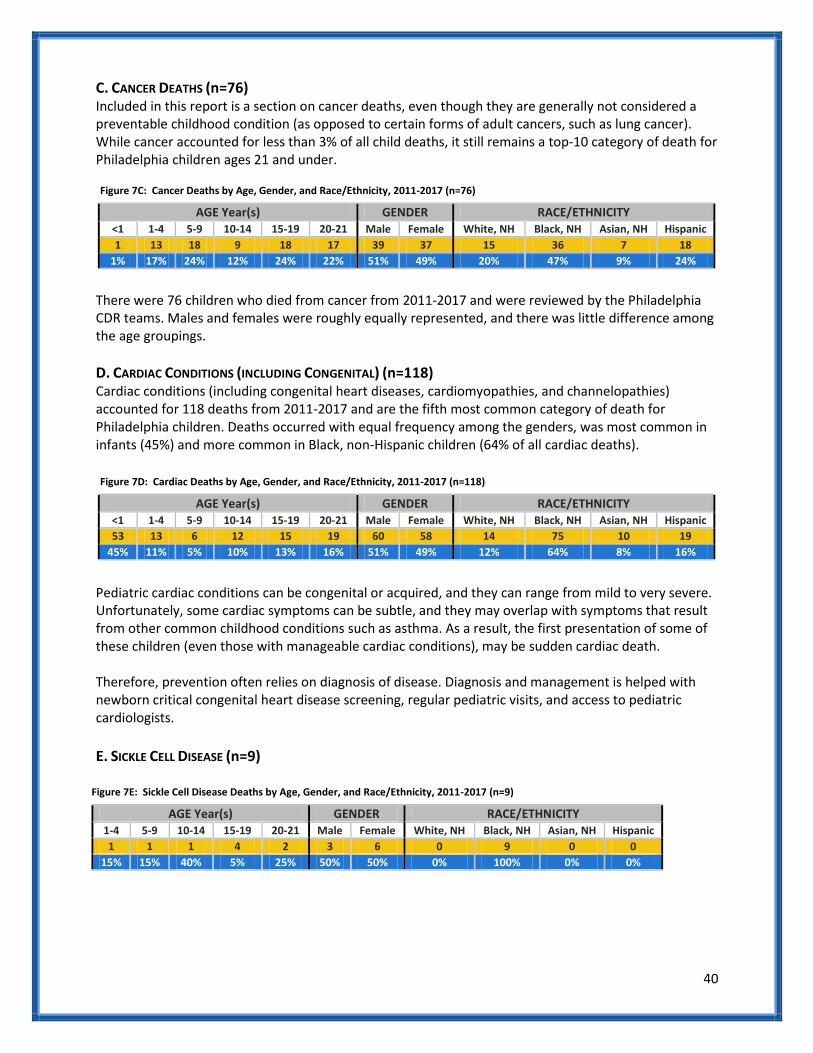
40
C. CANCER DEATHS (n=76) Included in this report is a section on cancer deaths, even though they are generally not considered a preventable childhood condition (as opposed to certain forms of adult cancers, such as lung cancer). While cancer accounted for less than 3% of all child deaths, it still remains a top-10 category of death for Philadelphia children ages 21 and under.
Figure 7C: Cancer Deaths by Age, Gender, and Race/Ethnicity, 2011-2017 (n=76)
AGE Year(s) GENDER RACE/ETHNICITY <1 1-4 5-9 10-14 15-19 20-21 Male Female White, NH Black, NH Asian, NH Hispanic
1 13 18 9 18 17 39 37 15 36 7 18
1% 17% 24% 12% 24% 22% 51% 49% 20% 47% 9% 24%
There were 76 children who died from cancer from 2011-2017 and were reviewed by the Philadelphia CDR teams. Males and females were roughly equally represented, and there was little difference among the age groupings.
D. CARDIAC CONDITIONS (INCLUDING CONGENITAL) (n=118) Cardiac conditions (including congenital heart diseases, cardiomyopathies, and channelopathies) accounted for 118 deaths from 2011-2017 and are the fifth most common category of death for Philadelphia children. Deaths occurred with equal frequency among the genders, was most common in infants (45%) and more common in Black, non-Hispanic children (64% of all cardiac deaths).
Pediatric cardiac conditions can be congenital or acquired, and they can range from mild to very severe. Unfortunately, some cardiac symptoms can be subtle, and they may overlap with symptoms that result from other common childhood conditions such as asthma. As a result, the first presentation of some of these children (even those with manageable cardiac conditions), may be sudden cardiac death. Therefore, prevention often relies on diagnosis of disease. Diagnosis and management is helped with newborn critical congenital heart disease screening, regular pediatric visits, and access to pediatric cardiologists.
E. SICKLE CELL DISEASE (n=9)
Figure 7E: Sickle Cell Disease Deaths by Age, Gender, and Race/Ethnicity, 2011-2017 (n=9)
AGE Year(s) GENDER RACE/ETHNICITY 1-4 5-9 10-14 15-19 20-21 Male Female White, NH Black, NH Asian, NH Hispanic
1 1 1 4 2 3 6 0 9 0 0
15% 15% 40% 5% 25% 50% 50% 0% 100% 0% 0%
Figure 7D: Cardiac Deaths by Age, Gender, and Race/Ethnicity, 2011-2017 (n=118)
AGE Year(s) GENDER RACE/ETHNICITY <1 1-4 5-9 10-14 15-19 20-21 Male Female White, NH Black, NH Asian, NH Hispanic
53 13 6 12 15 19 60 58 14 75 10 19
45% 11% 5% 10% 13% 16% 51% 49% 12% 64% 8% 16%
41
F. RECOMMENDATIONS
Health professionals in Philadelphia need to find a better way to improve children’s asthma medication adherence and reduce asthma triggers in the home. Rationale: Despite ongoing efforts by Philadelphia’s Healthy Home Program and local pediatric hospitals and primary care offices, many asthmatic patients continue to have persistent exposure to asthma triggers in the home, many do not take their daily preventers as prescribed, and many overuse their rescue medicine (Albuterol). Supporting and perhaps expanding the scope of the Healthy Homes Program might reduce the overall burden of pediatric asthma in our most vulnerable populations. Another possibility to improving medication adherence could be helping physicians track through their electronic health record systems if, when and where a prescription is filled (and re-filled).
Pediatric and adult sickle cell specialists from Philadelphia hospitals should get together to conduct their own severe morbidity and mortality reviews of sickle cell patients aged 17 to 25 years. Rationale: Death from sickle cell disease is relatively rare in Philadelphia children (9 deaths from 2011-2017). However, 5 of the 9 deaths (56% of total) occurred in those aged 18 to 21 years. There is a particular problem of properly transitioning children with complex medical conditions from the pediatric to the adult specialists, and it is specifically during these transitioning years that some children get lost to ongoing specialist care. Special review teams that would involve the pediatric and adult sickle cell specialists in Philadelphia could help improve the transition process.

42
APPENDIX | REFERENCES
1. CDR Principles. The National Center for Fatality Review and Prevention.
http://www.https://www.ncfrp.org/cdr-process/cdr-principles/#Purpose Accessed January 31, 2019. 2. Vital Statistics Report, Philadelphia: 2015[PDF file]. The City of Philadelphia.
https://www.phila.gov/media/20181105161054/2015_Vital_Statistics_Report.pdf Accessed January 31, 2019. 3. CHART: Sleep-related infant deaths in Philadelphia. The City of Philadelphia.
https://www.phila.gov/media/20181106124904/CHART-v2e4.pdf Accessed January 31, 2019. 4. Vision Zero Philadelphia. City of Philadelplhia Vision Zero. http://visionzerophl.com/ Accessed January 31,
2019. 5. Suicide Statistics. American Foundation for Suicide Prevention. https://afsp.org/about-suicide/suicide-
statistics/ Accessed January 31, 2019. 6. Harms PD, Snyder HN. Trends in the Murder of Juveniles: 1980-2000. Juvenile Justice Bulletin. 2004;
https://www.ncjrs.gov/pdffiles1/ojjdp/194609.pdf Accessed January 31, 2019. 7. The Philadelphia Roadmap to Safe Communities. The City of Philadelphia.
http://www.https://www.ncfrp.org/cdr-process/cdr-principles/#Purpose Accessed January 31, 2019. 8. Child Abuse and Neglect Prevention. Centers for Disease Control and Prevention.
https://www.cdc.gov/violenceprevention/childabuseandneglect/index.html Accessed January 31, 2019. 9. Hanzlick R, Hunsaker JC, Davis GJ. National Association of Medical Examiners: Manner of Death Classification,
First Edition[PDF file]. http://www.charlydmiller.com/LIB03/2002NAMEmannerofdeath.pdf Accessed January 31, 2019.
10. Adabag AS, Peterson G, Apple FS, Titus J, King R, Luepker RV. Etiology of sudden death in the community: results of anatomical, metabolic, and genetic evaluation. Am Heart Jour, 2010; 159(1), 33-39.
11. Badheka A, Kizibash RA, Mohamad T, Shah A, Afonso L, Jacob S. Epileptic patients who survived sudden cardiac death have increased risk of recurrent arrhythmias and death. Jour of Cardiov Med (Hagerstown), 2010; 11(11), 810-814.
12. Stattin EL, Westin IM, Cederquist K, Jonasson J, Jonsson BA, Morner S, Norberg A, Krantz P, Wisten A. Genetic screening in sudden cardiac death in the young can save future lives. International Journal of Legal Medicine, 2016; 130(1), 59-66.
13. Deo R, Albert CM. Epidemiology and genetics of sudden cardiac death. Circulation. 2012; 125(4), p. 620-37. 14. Torkamani A, Muse ED, Spencer EG, Rueda M, Wagner GN, Lucas JR, Topol EJ. Molecular Autopsy for Sudden
Unexpected Death. Journal of the American Medical Association, 2016; 316(14), 1492-1494.