phalaris arundinacea control and riparian restoration within agricultural watercourses in
TRANSCRIPT
Phalaris arundinacea Control and Riparian Restoration within
Agricultural Watercourses in King County, Washington
Lizbeth Ann Seebacher
A dissertation submitted in partial fulfillment of the requirements for the degree of
Doctor of Philosophy
University of Washington
2008
Program Authorized to Offer Degree:
College of Forest Resources
1
CHAPTER 1. INTRODUCTION
The biological and economical threat of invasive non-indigenous species has been well
established over the past two decades (Facon et al. 2006, Pysek and Richardson 2006,
Richardson 2004, Reichard and White 2001, Sakai et al. 2001, D'Antonio and Vitousek
1992, Rejmànek and Richardson 1996, and many others). Indeed, almost one half (42%)
of the threatened or endangered species listed under the US Endangered Species Act are
in jeopardy due to competition or predation by non-indigenous species. This proportion
balloons to as much as 80% in other regions of the world (Pimentel et al. 2000). Invasive
organisms incur losses and damages, resulting in annual costs of $136,630 billion
including control (Pimentel et al. 2000). Invasive non-indigenous plants are estimated to
encroach upon roughly 700,000 hectares of native habitat per year. These invasives then
threaten the native plants and wildlife on the site, biodiversity on a grand scale, as well as
negatively impact entire ecosystems (Pimentel et al. 2000). In addition to diminishing
biodiversity and disrupting ecosystem functions, invasive species seriously impact
agricultural systems and can be hazardous to livestock and humans (Facon et al. 2006).
S.L Mitchill (1810), L.D. de Schwenitz (1832) and Asa Gray (1879), provided some of
the earliest documentation of biological invasions. Within their essays, the authors
describe the condition of urban, rural, agricultural and natural settings within the eastern
United States with regard to “weedy” plants, and the aggressive nature of many of these
species, most from Europe (Stuckey 1978). Charles Darwin also makes note of the “large
proportional addition” of genera to the United States when commenting on the false
assumption that successful introduced species would be of similar genera to those species
found at the site of introduction (Darwin 1858). Charles Elton published the first book on
invasive species in 1958, alerting the public to the serious topic of invasive species,
predicting homogenization of flora and fauna by the breaking down the biogeographic
barriers via human-mediated transport.

2
Even our National Parks, habitats which we feel are generally safe from harm, and well
taken care of by stewards, are heavily impacted. Current estimates indicate that more
than 2.6 million acres (3-5%) are dominated by invasive plants (Welch et al. 2007).
Locally, the exotic plant management team for the North Cascades National Park reports
that of the 13,587 acres inventoried, 13,228 acres have invasive species with 3,311 of
those acres completely infested (Welch et al. 2007). Our national forest and grasslands
are not faring any better, with approximately 420,000 acres in the Pacific Northwest
Region being degraded by invasive plants (USDA Forest Service 2007).
Many of these invasive plants are capable of forming monocultures on a given site,
completely displacing native plants as well as altering the structure, productivity, fire and
flooding regimes and soil nutrient properties (Reichard and White 2001, D'Antonio and
Vitousek 1992, Booth et al. 2003). The results from a survey of restoration ecologists
within western Washington revealed that invasive non-indigenous plants were the leading
cause of failure of restoration projects (Seebacher 1999, unpublished data).
In addition to direct competition, herbivory/predation, and parasitism, additional impacts
of non-indigenous species include physical or chemical alteration of the habitat and soil,
and introduction of pathogens. van der Velde et al. (2006) asserts that the impacts of the
introduced species are especially problematic when the impacted species are keystone
species, causing disturbance of the food web structure and biodiversity functions.
Additionally, by removing the natural barriers between non-indigenous and native
species as humans are doing at a phenomenal rate, we are altering the genetic diversity of
the native species and native community. If the introduced invasive species hybridizes
with a native species, these hybridizing events are potentially triggering outbreeding
depression. Consequently, this introduction can also influence allopatric speciation and
therefore, increase biodiversity within the bioregion (van der Velde et al. 2006). The
potential escalation in biodiversity due to hybridization events may alter the genetic
integrity and local adaptation of the native species involved.

3
Non-indigenous species have many labels; aliens, non-natives, exotics, introduced,
immigrants, biological pollution and an additional term for plants, noxious weeds. Non-
native species as defined by Boersma et al. (2006) refers to those that have been “moved
to new places by humans.” From the same publication, an invasive species is determined
to be a “non-native organism that causes harm to native habitats or species.” Official
U.S. definitions for invasive species provided in Executive Order 13112 signed by
President William Clinton in 1999 state that "Invasive species means an alien species
whose introduction does or is likely to cause economic or environmental harm or harm to
human health.” "Alien species means, with respect to a particular ecosystem, any
species, including its seeds, eggs, spores, or other biological material capable of
propagating that species, that is not native to that ecosystem” (Federal Register V 64 - 25
1999).
Pysek and Richardson (2006) go even further classifying invasive plants into three
categories: “casual alien plants” as those that flourish and reproduce occasionally out of
cultivation, but do not form self-replacing populations; “naturalized plants” as those with
self-replacing populations and capable of independent growth; and “invasive plants”
which are a subset of naturalized plants that reproduce in large numbers able to spread
quickly over large areas. For the duration of this dissertation, “invasive plants” refer to
those non-indigenous species that cause harm to native habitats or species and fall into
the invasive category.
My dissertation focuses on a challenging invasive perennial, reed canarygrass (RCG),
(Phalaris arundinacea) that is capable of forming monocultures within freshwater
wetlands, riparian areas and agricultural fields. This invasive is responsible for
generating substantial acreage (some infestations over 100 ha) of monocultures degrading
biodiversity, displacing wildlife (Tu 2006) and altering invertebrate assemblages on the
site (WSU Research Team 2006, unpublished data). Additional negative impacts of
Phalaris arundinacea include changes in hydrology, which can increase the risk of
flooding nearby agricultural fields and adjacent areas; and increasing the elevation of a

4
site, eliminating ponds and watercourses utilized by waterfowl, amphibians and
invertebrates.
Chapter One discusses the biology and ecology of invasive species, susceptibility of
receiving sites, and the impacts of invasive plants on the community and ecosystems
involved.
Chapter Two covers a field research project on Phalaris arundincaea control, and the
restoration of the riparian zones within agricultural systems. This research project is
associated with and a component of a comprehensive agricultural watercourse project
allied with WSU researchers and King County. Three RCG control treatments were
applied and replicated on three sites within eastern King County along agricultural
watercourses. These treatments were followed for two consecutive seasons for successful
RCG reduction and control. The data collected included the returning stem count of
RCG as well as the native plant survival and density based on percent cover.
Chapter Three introduces the prospect that a native emergent sedge, Scirpus microcarpus
(small fruited bulrush, (SFB)) could be able to effectively compete with the invasive
RCG. A controlled greenhouse study was carried out to determine whether Scirpus
microcarpus would reduce the above and/or below ground biomass of the reed
canarygrass when grown together within one gallon pots for one growing season (inter-
specific competition versus intra-specific competition).
Chapter Four covers the energy storage mechanism for reed canarygrass and how this
strategy allows for increased aggressiveness and negatively impacts control methods for
this species. Forty-five randomly chosen rhizome pieces were placed within one gallon
pots which were buried in the field. These were then covered with an opaque fabric fixed
in place. Fifteen were removed after three months, the next fifteen after six months and
the last fifteen after nine months. The rhizomes were then stored within a freezer until
being analyzed with a near-infrared spectrophotometer (NIRS) for fructosans. The time
necessary to cover RCG rhizomes to achieve depletion of carbohydrates was then
extrapolated from these data.
5
1.1 INVASIVE SPECIES BIOLOGY
1.1.1 Stages of Species Invasions
There are several stages involved in species invasions (Allendorf and Lundquist 2003).
The first is the introduction of the species. The first records of species introductions in
the United States dates back to 1628 when species such as Isatis tinctoria and Cannabis
sativa were brought back to the US on the Endicott expedition. Many other common
invasives were transported into the Plymouth colony and New England throughout the
1600’s, such as Rumex acetosella, Tanacetum vulgare, Foeniculum vulgare, Hypericum
perforatum, Polygonum persicaria and Salvia sclarea, all of which are still problematic
throughout North America today (Mack 2003).
Generally, the pathways of these species to their new locations have been primarily
horticultural, especially for woody species (Reichard 1997). Herbaceous invasive species
have been introduced largely as crop seed contaminants, through ship ballast (Reichard
and White 2001), as ornamentals, and for medicinal and/or for fodder purposes. These
species are then further spread by: impure crop seeds, adhering to domestic and wild
animals and birds; within the soil of ornamentals from nurseries; (Sakai et al. 2001) as
seed traded and sold via arboreta, garden and horticultural clubs and the internet;
(Reichard and White 2001), attached to vehicles along roadways (Von der Lippe and
Kowarik 2007), as well as innocently attached to the clothing or boots of natural resource
workers and hikers as shown by an anecdotal study by Reichard (1998).
After the introduction stage the species must become established and continue to survive
and reproduce. Propagule pressure, the number of individuals introduced and/or the
number of introduction events becomes significant in the establishment of the species. A
larger number of introduced individuals would allow for a greater amount of genetic
variation, which would in turn reduce any potential impacts of a population or founding
bottleneck due to the original introduction. Multiple introductions may create the same

6
results, especially when the plants are from different source populations. This may
release genetically diverse individuals allowing for greater heterozygosity of the founding
population and a higher chance of adaptation to the novel environment (Allendorf 2003).
The exchange of genetic material between the introduced populations may also result in
the distribution of an invasive genotype (Sakai et al. 2001) or the swamping of locally
beneficial alleles (Allendorf 2003).
The second stage of invasiveness would be the dispersal and spread into new habitats and
the replacement of native species by the introduced species. Range expansion is
facilitated by high dispersal rates, which could potentially bring a high amount of gene
flow and the probability of spreading into novel conditions within the new ranges.
However, this gene flow from the central site of initial colonization to the periphery of
the range may prevent local adaptation, impacting further range expansion (Sakai et al.
2001) causing the boundaries to this species to remain static. This same scenario can take
place when this peripheral population is deficient in the phenotypic variation necessary
for local adaptation (Lavergne and Molofsky 2007).
Beginning in the mid 1980s, Williamson and Brown (1986) employed a statistical
approach to analyze the success of invaders, (that successful invasions are rare), which is
referred to as the “tens rule.” This statistical rule states that one in ten species that are
imported will become casual or “introduced”, one in ten of those casual species will
become established, and one in ten of those established species will become a “pest.”
(Williamson and Fitter 1996). The definitions for these terms are important for
understanding the principles of the rules. Imported species are those “found in
collections or accidentally brought into the country,” introduced (casual) species are
found outside of cultivation in the wild, established species are those forming self
sustaining populations, and pest species are those species that have a “negative economic
impact. The transitions between these potential stages are identified as escaping,
establishing and becoming a pest. Williamson and Fitter (1996) emphasize that an
acceptable variation would mean between 5 and 20 percent for the tens rule.
7
There is often “lag time” or a delay between the initial introduction and colonization and
the expansion of the species to surrounding habitats. This may occur because of the
introduced species requires time to adatpt to the new environment and/or the evolution of
invasive traits, or the “purging of a genetic load responsible for inbreeding depression”
(Sakai et al. 2001). Founder effects, genetic drift and the rapid evolution generated by
stressful conditions in the new environment may all initiate swift evolution of a non-
indigenous species allowing for an increase in spread and invasiveness (Allendorf 2003).
1.1.2. Archetypical traits of invasive species
One of the most perplexing questions within the field of invasion biology is why some
species become invasive while other introduced species remain benign? A list of the
traits one might expect to find in the “ideal weed” that is commonly cited was generated
in 1965 by Herbert Baker. This list (with minor modifications added by Baker a decade
later) is as follows: 1) germination requirements fulfilled in many environments; 2)
discontinuous germination (high seed longevity); 3) rapid growth through vegetative
phase to flowering (short vegetative phase); 4) continuous seed production during
adequate growing conditions; 5) ability to be self-compatible; 6) unspecialized or wind
cross pollination; 7) high seed output; 8) able to produce at least some seed in range of
environmental conditions (tolerant and plastic); 9) short and long dispersal adaptations;
10) vigorous vegetative reproduction and/or regeneration from fragments for perennials;
11) brittleness, not easily extracted; 12) ability to compete interspecifically via a rosette
and/or allelochemicals. There is, of course, a wide spectrum within these traits and the
invasiveness of a plant (Baker 1974). Two of these traits were also found to be correlated
with invasiveness by Reichard and Hamilton (1997); absence of germination
requirements and vegetative reproduction. Basu et al. (2004) added just a few additional
traits: 1) deep root system, allowing the weed to thrive during a drought; 2)
environmentally plastic, changing growth form in response to environmental factors; and
as noted by Baker, Reichard and Hamilton, 3) the ability to reproduce both sexually and
asexually.
8
Successful colonists typically employ r-selected life histories, such as short generation
time, high fecundity and growth rates, as well as the ability to transfer between r-selected
and K-selected strategies (Sakai et al. 2001). Grime (1977) expanded on this method of
characterizing plant strategies by placing plants at any point within a triangle based on
the morphology, life history and physiology of the plant. At the extreme of the triangular
tips one would find those plants that are predominantly competitive, stress tolerant or
ruderal. Weedy species are considered to be either (R) ruderals, those species that tolerate
frequent disturbance by short reproductive times, or a (C) competitor, which can be found
in undisturbed habitats with a reduced amount of resources being allocated to
reproduction and more to vegetative biomass, or a mixture of the two (CR). Both the (C)
strategist and the (R) strategist generally indicate productive habitats (Booth et al. 2003).
Baker (1953) introduced the idea of the formation of local races for introduced species.
These ecological races or ecotypes would be selected for and would show genetically
fixed characters based on the situation at the site. For example, continuing disturbance
would select for a local adaptation by the species, perhaps existing as low growing
rosettes during the season the site is usually mowed, if it is to survive and thrive at the
site. Species capable of cross pollination would be able to adapt more quickly. However,
multiple introductions and therefore, the availability of differing genotypes also allows
for rapid race formation to develop. An example would be crop mimics that have
adapted its growth and reproduction period, and even seed size for dispersal assistance,
with the crop that they invade. Weedy species that have adapted to roads and railways
are typically low growing with flat rosette leaves which are finely divided and pubescent.
The stems are soft and flexible, not brittle, allowing for treading, and the fruits are dry
and can be dispersed by adhesion to shoes or wheels. For invasives that tend to invade
agricultural communities which are regularly mowed or grazed are selected for those
species that can reproduce via rhizomes or stolons and eventually over many generations,
rely on this means of reproduction and may even produce only sterile seed (Baker 1974).
9
As noted above in section 1.1.1, commercial horticulture is a primary pathway for
invasive species. The traits which are selected by the breeders of floriculture have a
propensity to also apply to invasive species. These include “disease and pest resistance,
drought tolerance, high fertility, lack of seed dormancy, rapid germination, high yield
potential, short generation, hybrid vigor and large plant size” (Anderson 2006).
When comparing six previous studies using numerous plant traits to predict invasiveness
(Reichard 1997) found that those species that had “invaded elsewhere” were positively
correlated to becoming an invasive species in a new range. Those species for which the
native range would match the climatic conditions (precipitation and temperature regime)
of the introduced region may also be a good indicator. A wide latitudinal range may also
imply an ability to adapt to a wide range of environmental conditions. Other species
attributes tested in the same studies that were found to be good predictors were: a short
juvenile period (a positive trait in four out of the six studies); seed bank type or longevity
(for Pinus sp. and annuals); and seed mass and size (smaller seeds allowing for greater
dispersal).
Many invasive species have the ability to reproduce asexually via agamospermy or
vegetatively and are able to avoid the complications of potential inbreeding depression
associated with a small initial colonizing population (Allendorf 2003). Baker previously
observed this connection, especially for annuals, stating that autogamy or agamospermy
is a prominent feature for many weeds. This trait allows the plant to reproduce, creating
a colony from a single immigrant or from the regeneration of a single plant left after
weed removal operations. For perennial species, vegetative reproduction accomplishes
the same goal, “rapid multiplication of individuals with appropriate genotypes”. This
also allows for the rapid expansion of a population which would be as well adapted to the
new environment as the founder individual (Baker 1974). Allendorf (2003) asserts that
local adaptation of the native species may not be necessary except for during periodic
episodes, such as long term extreme environmental situations such as serious flooding
events or episodic fires or droughts. Additionally, numerous invasives are polyploids and
therefore, this genetic variation is retained as fixed heterozygosity (Allendorf 2003).
10
About half of the studies Bossdorf et al. (2005) reviewed showed that the invasive
species were more “plastic” than the native species. Phenotypic plasticity as defined by
Pigliuccci (2002) can be defined as “the property of a genotype to produce different
phenotypes when exposed to different environments. Plasticity is a property of the
reaction norm of a genotype.”
Some invasive species may be fundamentally better competitors as they have evolved in
highly competitive environments (Allendorf 2003). One hypothesis concerning plant
invasions is the “Evolution of Increased Competitive Ability (EICA).” This hypothesis
states that the plant is released from pressure of certain pest in its native habitat that
would keep that species “in check.” In turn, the plant evolves the ability to reallocate the
resources it used to draw on for defense into elevated reproduction rates and increased
growth (Bossdorf et al. 2005). After reviewing field studies of various native and
introduced plants and the impacts of herbivores, plant size and fecundity, Bossdorf et al.
(2005) found that 56% and 55% of the studies found increased growth and decreased
resistance for the introduced species, providing moderate support for EICA.
Invasive species may possess similar traits with the native species or conversely, possess
different traits than the native species, thereby finding an empty niche (Sakai et al. 2001).
Those introduced species with native congeners may share characters which allow for the
plant to be more adapted to the site of introduction. In contrast, Darwin’s theory on plant
invasions was that the more successful invaders would have traits that were distinct from
the native species (van der Velde et al. 2006). This theory plays well with the EICA
theory noted above in which the non-native genera success can be at least in part due to
the fact that many of the resident herbivores and pathogens would not be able to switch to
species that are phylogenetically distant from the native host (Rejmànek 1996). One
example reported by Rejmànek is a common aggressive and highly detrimental invasive
species in the PNW as well as in California, Cytisus scoparius (scotch broom). There are
no native phytophagous insects found on scotch broom in North America, yet there are at
least thirty five phytophagous species in its native England.
11
Callaway and Aschehoug (2000) maintain some invasive species are successful due to
“novel mechanisms” that they bring to the new environment and native plant community.
They compared the impacts of Centaurea diffusa on the biomass and phosphorus uptake
of North American grass species found in the native communities in which the C. diffusa
invades, and its native Eurasian species. They found that the C. diffusa had decreased the
biomass and P uptake of the North American species far more so than the Eurasian
species. Centaurea diffusa produces allelochemicals which the Eurasian plant
community neighbors had become somewhat adapted to but the new plant community in
North America had not. A similar result was found by Prati and Bossdorf (2005), when
looking at the interactions between native and introduced Alliaria and Geum sp.,
indicating that the origin of the plants within the impacted community can be significant
when allelochemicals are at play (Bossdorf et al. 2005).
1.1.3 Community susceptibility
Elton introduced the theory that highly diverse ecosystems have been predicted to have
greater resistance to invasion than those with lower diversity (Elton 1958). Intuitively,
the greater the number of species within a community, the fewer resources and space
available for newcomers, which coincides with the “empty niche” theory (van der Velde
et al. 2006). Additionally, a higher number of species in a system increases the chance
that a plant species would be available that could out-compete and exclude one which
was recently introduced (Booth et al. 2003). Furthermore, a more diverse community
would include a greater number of predators that could also prey on the new species
(Levine and D’Antonio 1999). However, researchers have found differing results for
different ecosystems and communities. For example, aquatic communities tend to be
vulnerable if appropriate abiotic and dispersal conditions exist (van der Velde et al.
2006).
Conversely, van der Velde et al. (2006) suggests that a more diverse community may
increase invasion susceptibility via the act of “facilitating” an invader, whether the
12
facilitator is a native or non-native species. This may include measures such as a non-
native species pollinating or dispersing seeds of an invasive species, or by amending the
local biotic conditions (van der Velde et al. 2006) or more indirectly by competing with
shared competitors (Levine and D’Antonio 1999). This new invasive may in turn allow
additional non-indigenous species to invade, triggering an “invasional meltdown,” a term
introduced by Simberloff and van Holle (1999).
Another explanation for the discovery that many highly diverse communities were
actually more invasible could be that the site has biotic and abiotic conditions, such as
suitable moisture, nutrients and “habitat heterogeneity” that make it advantageous
(Levine and D’Antonio 1999). Stohlgren et al. (2003) use the term, “the rich get richer”,
when refuting the long held belief that highly diverse plant communities are less likely to
be invaded. After evaluating independent data sets, they found a positive relationship
between native and non-native species richness, a trend which intensified as the spatial
scale grew. The researchers make the conclusion that an elevated level of resources
correlated with habitat heterogeneity may lead to high native species richness. Generally,
high species richness is linked to high species turnover leading to amplified pulses of
available nutrients, light and water and therefore more opportunities for the non-natives
to edge in (Stohlgren et al. 2003).
Levine and D’Antonio (1999) state that “the factors controlling native diversity should
similarly control invaders, indicating conditions favorable to invasion,” factors such as
disturbance level and intervals, competition, and accessibility of resources. Furthermore,
“the diversity of the native community is insignificant if the invader is satisfied with a
different set of resources along the niche axis than the natives.” Most researchers agree
that most systems are not found in the “stable state” that is necessary for the diversity
hypothesis above to occur, and that frequent indirect abiotic and biotic interactions are
more responsible for the invasive susceptibility of a community (Levine and D’Antonio
1999).
13
Levine (2000) determined that the native species diversity, the scale and the degree of
disturbance can all make natural communities uniformly susceptible to invasions. The
process of disturbance generally leads to an upsurge in the availability of light, nutrients
and vacant areas for establishment (van der Velde et al. 2006) or may eradicate a
potential successful competitor (Booth et al. 2003). When conditions exist for
hybridization between the introduced species and a locally adapted native species, this
allows for a potential increase in the fitness of the invasive, and the native community
becomes even more susceptible (Sakai et al. 2001).
An alternative hypothesis for community vulnerability to invasive species is called the
“fluctuating resource availability” theory which takes place when the community is
exposed to increased resources either by reduced consumption or increased accessibility
of unused resources. Contrary to the high diversity theory noted above, predictions of
fluctuation resources indicate that high species diversity and risk of invasion are not
correlated as both “species rich” and “species poor” communities are both capable of
incomplete resource consumption (van der Velde et al. 2006).
Competition with the native species and the resource levels available for the introduced
species can interact to affect the invasibility of a particular site. Low resource levels may
prevent invasions, as the resource level may be below the threshold of the introduced
species (Tilman 1999). Indeed, many researchers have found a connection between the
levels of nitrogen and invasive species (Green and Galatowitsch 2002, Brooks 2003,
Kercher and Zedler 2004).
Facon et al. (2006) discusses three scenarios from which invasion of a new species may
arise. The first, “migration change” would occur when a match between the introduced
species and the new environment exist, but the species does not reside in that region until
introduced by human interference. In the second scenario, the species may have been
introduced, yet has not “invaded” the site. The invasion takes place when the abiotic or
biotic conditions at the site change to better suit the new species, thus allowing the

14
proliferation even without adapting to the new conditions. Global warming is a
potential perfect example of this scenario for many species. Under the third scenario, the
invader has adapted to the new environment as a consequence of evolutionary forces, and
is referred to as the “evolutionary change” scenario.
Zedler and Kercher (2004) maintain that wetlands provide opportunities for plant
invasions by the numerous invasive opportunists that are available. Wetlands are
particularly susceptible to invasion since they tend to accumulate materials from both
terrestrial and upstream wetland disturbances. These substances would include excess
water and debris, nutrients and sediments as well as pollutants such as heavy metals and
contaminants. As a landscape sinks, invaded wetlands differ from invaded uplands in
that they have to contend with flowing water, canopy gaps due to inflowing material,
anoxic soils, and nutrient fluxes. Additionally, many wetland sites are continuously
disturbed, especially riparian wetlands, by flood pulses creating bare areas by erosion and
debris deposition, and are positioned within the dispersal routes of any invasive species
upstream or upland from the site. Van der velde et al. (2006) agreed, stating that
temperate freshwater, estuarine and coastal wetlands tend to be the most invaded systems
due to the ample amount of introduction conduits and disturbance factors such as
shipping, recreation and water diversions. Invasive wetland plant species tend to be
water dispersed either via seed or plant fragments and most have copious aerenchyma
cells. These species may also allow for the rapid uptake of the available nutrients during
the high nutrient pulses permitting high growth rates (Zedler and Kercher 2004).
As noted above, many successful wetland invaders develop aerenchyma cells and
wetland plants with a elevated amount of aerenchyma cells are able to attain “high plant
volume per biomass investment,” and grow tall very quickly. Roots with aerenchyma are
able to expand “further per unit biomass,” therefore allowing for greater nutrient uptake
(Zedler and Kercher 2004).
15
1.1.4 Clonal Species Biology
There are benefits and costs for clonal organisms. A clonal, or asexual plant multiplies
vegetatively generating a genetic duplicate of itself, or a ramet. Some of the advantages
of this could be resource acquisition and storage and the ability to establish in a new site
with a single individual. If a particular genotype is successful, vegetative reproduction
allows this genotype to flourish in time and space as long as the habitat and
environmental conditions remain analogous. If these conditions are not met, this
genotype may not be successful (Sebens and Thorne 1985). Other disadvantages include
a reduction in the available resources for sexual reproduction and therefore, potential
valuable recombinations within a stochastic environment, the spread of any diseases for
linked clonal plants (Klimes et al. 1997) and the increased potential for a pathogen to
eliminate a genetically similar population.
A few of the traits of clonal organisms which contribute to the success of these species
throughout many habitats include: the ability to seize and monopolize the available
nitrogen with copious rooting systems and high growth rates, increasing the competitive
impacts on neighboring species; and their capability to dominate a site by expanding
relatively quickly laterally via stolons and rhizomes into a site, displacing other species
(de Kroon and Bobbink 1997). This same ability to quickly expand into new areas
forming a dense cover, allowing for dominance of the system, also gives clonal species
an additional advantage from agricultural runoff within nitrogen rich habitats.
Furthermore, by translocating the nitrogen withdrawn from senescing shoots to the
rhizomes at the end of the season and reallocating the reserves to new growth the next
season, the nitrogen attained each year is effectively exploited (de Kroon and van
Groenendael 1997).
While researching clonal plant species and whether this trait permits a plant to become
more invasive, Pysek (1997) identifies a variety of “pros and cons” for each phase of
invasion for both clonal and non-clonal species. The favorable characters for clonal
16
species are numerous. Firstly, the plants can be easily fragmented and dispersed and
above ground removal procedures does not necessitate death of the individual. There are
also no dormancy issues for reproduction. The plant can successfully and immediately
reproduce even when only one individual is introduced. Therefore, due to this same
characteristic, there is no need for specialized pollinators or dispersers for reproduction.
If the clonal organism, especially one whose genotype may be somewhat adapted to the
site, will benefit from a reduced lag phase and a rapid invasion and “occupation of the
site.” Additionally, once established, clonal species can persist and spread into
conditions that are more stressful than those where it colonized (D'Antonio and Vitousek
1992).
Basically, clonal species can make up anywhere between 1% to 66.7% of the most
aggressive invasive species worldwide. Pysek concluded that based on the available data,
clonal and non-clonal species were equal with respect to invasiveness on a regional and
global scale. One trend that did emerge was that clonal species, which were “less
favoured by disturbance,” were more likely to be found invading natural areas and in
general, within wet and cooler habitats. Once established in these habitats, clonal species
tend to be more competitive successfully occupying the site (Pysek 1997).
1.2 PHALARIS ARUNDINACEA BIOLOGY
Phalaris arundinacea (reed canarygrass), a C3 cool season grass, is a perennial with
robust, hollow culms that reach up to 2 meters tall. These stems are ~1 cm. in diameter,
with a reddish tinge at the top during the growing season. The leafblades are flat with
prominent ligules. This species spreads predominantly by creeping rhizomes which can
be stout with 6-10 nodes (Comes 1971). RCG is an obligate outcrosser exhibiting self-
sterility (Lavergne and Molofsky 2004).

17
Reed canarygrass is one of 15-20 species of Phalaris distributed throughout the world
within the northern temperate regions of five continents. It is reported to tolerate annual
precipitation of 3-26 cm, annual temps of 5-23 C, and a soil pH of 4.5 to 8.2. RCG does
not however, perform well in subtropical or tropical climates. Southern Virginia marks it
southern boundary on east coast and across to southern California on the west coast
(Lyons 1998).
This species is listed as a noxious weed by the US Federal government and is a class C
noxious weed in Washington State. It is a notorious weed globally as well, cited as a
serious or principle weed in numerous countries throughout the world.
Ecologically, RCG has the ability to exclude native species through competition. This
species is extraordinarily successful at out-competing other vegetation due to several
factors. There are no known dormancy requirements, and the seeds germinate
immediately after ripening with a very high (97%) viability rate (Apfelbaum and Sams
1987). As noted above, the primary means of reproduction is by vegetative growth, i.e.,
spreading by aggressive rhizomes and stems (Naglich 1994). Each plant can produce a
dense mat of rhizomes within one growing season (Apfelbaum and Sams 1987), and even
seven to eight week old seedlings produce these rhizomes (Crockett 1996). RCG can
reach heights of six feet or greater (Antieau 1998), easily shading out smaller, slower-
growing shrubs and tree saplings.
Reed canarygrass also is well known for slowing water velocities, thereby inducing
sediment deposition and resulting in a positive feedback loop of more flooding and
increased sedimentation rates within affected channels. This is in large part due to the
density of the shoots and is increased by a dense shallow root mass. A study of RCG
growth characteristics found that at least 88 percent of the emergent shoots on established
plants in the field originated from rhizome or tiller buds located in the top 5 cm of the soil
(Apfelbaum and Sams 1987).

18
Within the introduced range of North America, RCG generally dominates anywhere
from 50% to 100% of the site. Within just ten years, monitoring of restoration projects in
the Midwest found that 66% of the sites had been invaded or re-invaded by RCG with
almost 100% cover (Lavergne and Molofsky 2004). Additionally, as these stands of
RCG dominate a site, not only does the biodiversity of the site decline, but the
heterogeneity of microhabitats on the site is diminished as the lower voids are filled in
with RCG biomass and sediment trapped by the RCG (Werner and Zedler 2002).
Schooler et al. (2006) found that the native species in Pacific Northwest wetlands were
impacted to a greater extent than other introduced species by RCG and purple loosestrife.
This species is particularly menacing in the Pacific Northwest (PNW), the northern
Midwest and Northeastern states. The largest infestations within the PNW tend to be
found within the wetlands, river floodplains, agricultural ditches, roadsides and pastures
where it was planted for forage on the westside of the Cascades (Tu 2006).
An additional significant trait of RCG is the ability to take advantage of an extended
growing season. It initiates growth very early in the spring, or late winter and continues
growth late into the fall, usually October. Species that are capable of an extended
growing season are typically able to out-compete surrounding species without having a
higher photosynthetic rate. Not only is RCG able to capture maximum sunlight when it
emerges in January, but it is able to successfully compete with its neighbors by
photosynthesizing for a longer period of time each year (Zedler and Kercher 2004).
Many researchers consider RCG to be native to the inland Pacific Northwest, Europe and
Asia, while others reason that it was introduced from Europe. A third view is that the
aggressive North American genotypes are hybrids of native populations and the
introduced European cultivars (Merigliano and Lesica 1998). Early collectors found
RCG throughout the inland northwest between 1825 and 1911. Ten herbarium specimens
predate Euro-American settlement in that region or were collected from remote,
undeveloped areas. Of those specimens that were collected from riverine habitats, many
indicated that RCG was abundant while several specimens from meadows and springs
indicated that the plant was uncommon or rare (Merigliano and Lesica 1998).

19
RCG is known to have three cytotypes in Eurasia, mostly represented by an
allotetraploid, with the subspecies name of arundinacea, along with a hexapoid form,
subspecies, oehleri. There is also a diploid cytotype, rotgesii. Merigliano and Lesica,
(1998) stated that the herbarium specimens from the inland northwest most closely
resembled the diploid, but recent evidence by Lavergne and Molofsky (2004) shows that
the invasive plants occurring in Vermont and North Carolina, are tetraploid and more
similar to the cytotype in Eurasia. The cytotype of the aggressive RCG within the Pacific
Northwest is unknown at this time.
Repeated introductions of RCG cultivars for a variety of purposes have been documented
in the US. Cultivation for agronomic purposes began in Sweden in 1749. The first trials
in the United States took place in the mid 1830s, using the picta form due to its higher
palatibility. During the 1850s, RCG received a great deal of attention for reclamation
projects and was recommended for reclaiming peatlands and marshes. Most of the stands
on the Pacific coast are attributed to a cultivated stand in Coos County, Oregon
established in 1885 (Comes 1971, Merigliano and Lesica 1998).
As noted, the aggressive RCG found in the Midwest and PNW may be a hybrid or
hybrids of the native and introduced cultivars. Generally, hybridization events allow for
the rapid reshuffling of varying adaptations. Elements of an entirely foreign genetic
adaptive system can be carried over into a previously stabilized one. Each hybrid
produced by these species may deliver different recombinations, each of which may be
able to adjust to different niches. The ever increasing heterozygosity brought in by
hybridization would be capable of generating increased variation generation after
generation. This genotypic diversity would confer an advantage as the different
genotypes could allow greater adaptive response to environmental influences and new
niches which would allow a selective advantage for the hybrids (Anderson and Stebbins
1954). Hence, a hybridization event with RCG would allow a mixture of a native that has
become very well adapted to the environmental conditions within the PNW with cultivars
20
that have been bred to be vegetatively vigorous and drought tolerant. Ellstrand and
Schierenbeck (2006) presented evidence of 28 examples of hybridization events which
preceeded invasiveness, such as with Spartina anglica x S. alterniflora producing S.
foliosa in CA, Typha x glauca, and some of the Tamarix spp.
Lavergne and Molofsky (2007) performed genetic testing on the invasive Phalaris
arundinacea (RCG) from the eastern United States, (Vermont and North Carolina)
verifying what many researchers have suspected. European strains of RCG were
introduced into North America on many occasions as a large number of alleles unique to
French and Czech populations were found within the populations from North America.
Additionally, new genotypes have been created in North America through widespread
recombination events with 85% of the total allelic diversity being shared between North
American and European strains but only 1.5% of the NA genotypes occurring in the
European populations. The researchers determined that evolution of many phenotypic
traits may have been responsible for the observed invasiveness in the NA strains of RCG
based on consistent differences between the European and NA genotypes.
Several processes can trigger the evolution of invasive traits. The first could be hybrid
vigor where recombination would create a genotype more invasive than the parents. The
second process might be the increase in genetic variation due to the large number of
introductions and subsequent recombinations, followed by natural selection for those
traits leading to invasiveness. A third process would bring about a great amount of
phenotypic plasiticity, allowing the population to thrive within a wide range of
environmental conditions (Lavergne and Molofsky 2007) as well as survive stochastic
events. The researchers did not find evidence for hybrid vigor, but did find that the North
American strains displayed superior heritability which would allow for a “greater
response to natural selection for a number of phenotypic traits such as emergence time,
tillering rate, and root biomass” (Lavergne and Molofsky 2007).
21
Reed canarygrass (RCG) is the classic opportunist of the many prospects for invasion
that are presented within many wetland communities. A list provided by Zedler and
Kercher (2004) illustrate that RCG is able to take advantage of almost every opportunity
provided by a wetland to invade. Some of the more noteworthy would be the canopy
gaps from flooding and debris. RCG with its rapid height growth via hollow stems would
flourish. Another is the availability of fresh sediment from scouring or sediment
deposition. RCG possesses the ability to rapidly anchor and has viable floating
propagules. RCG acquires adventitious roots and allows for floating rhizome mats
allowing this species to manage the increased water depth and moving water conditions
found in wetlands. Another common situation, standing water does not seem to deter
RCG. RCG is able to emerge above standing water with the use of adventitious roots and
by producing copious amounts of above ground biomass (Zedler and Kercher 2004) and
this species has a sizeable percentage of aerenchyma cells available for gas exchange
(Miller and Zedler 2003).
Phenotypic plasticity seems to also play a role in the invasiveness of reed canarygrass in
North America. Lavergne and Molofsky (2007) found that the invasive genotypes were
more phenotypically plastic than the European strains for stem height, leaf number and
for a variety of morphological traits examined. The observed aggressiveness of RCG
may be due to fact that the RCG introduced into North America was bred for agronomic
purposes, and therefore, with the traits discussed by Anderson (2006) such as drought
tolerance, high fertility, rapid germination, high yield potential, hybrid vigor and large
plant size. However, if this were the case, one would expect to see low genotypic
diversity within the populations in the introduced range, yet, the opposite is true for the
RCG strains examined in their study. The research by Lavergne and Molofsky (2007)
was performed on RCG populations from the east coast of North America, Vermont and
North Carolina only. There is no evidence that a native RCG strain existed on the east
coast as there is here in the Pacific Northwest (Merigliano and Lesica 1998).

22
A study by Coops et al. (1996) also found evidence of both genetic diversity and
phenotypic plasticity within RCG populations. The researchers examined biomass
allocation patterns of RCG and how this allocation changed in response to vegetative
cover. RCG allocated more resources to belowground biomass when grown within dense
vegetative cover. This is probably giving the plant a competitive advantage in the next
growing season, as it over-winters as root stock and is one of the first perennials to
emerge in the spring. This morphological plasticity was also important for surviving
within various water depths. Plants grown in deeper water allocated more biomass to
elongating the stem, while plants grown in up to five cm of water allocated more biomass
to the roots (Coops et al. 1996).
Maurer and Zedler (2002) also found morphologically plastic behavior by RCG when
testing root:shoot ratios and the lateral expansion rates in different nutrient conditions.
RCG spread nearly 50% farther and produced twice as many tillers under high nutrient
conditions and produced fewer tillers closer to the parent clone under low nutrient
conditions. This combination of the “guerilla” and “phalanx” strategies (consolidation
strategy) allows RCG to dominate the vegetation year after year by maintaining its
position in poor conditions and/or years and spreading into new areas during high
nutrient conditions and favorable years. High levels of genetic diversity increase the
likelihood that a particular genotype will flourish and spread into new areas. Thus,
genetic diversity coupled with suitable environmental conditions frequently enable reed
canary grass to aggressively take over entire plant communities.
The plant architecture of this species may also play a significant role in its competitive
abilities. Grime and Hodgson (1987) listed characteristics of species with high
competitive ability: “(1) a robust perennial life form with a strong capacity to ramify
vegetatively; (2) the rapid commitment of captured resources to the construction of new
leaves and roots; (3) high morphological plasticity during the differentiation of leaves and
roots; and (4) short life spans of individual leaves and roots.” Gaudet and Keddy (1988)
found that tall shoots, leaf shape (length:width ratio), and large canopy diameter were

23
morphological characteristics that were significantly correlated with increased
competitive ability in wetland plants.
The horizontally oriented leaves and tall culms of RCG improve the efficiency of light
utilization. Wetzel and van der Valk (1998) found that Carex stricta and Typha latifolia
were both heavily impacted when grown with RCG. In this study, RCG maximized the
capture of light and nutrient resources by maximizing vegetative growth, even under low
nutrient or soil moisture conditions. RCG is a superior competitor, producing
exceptional biomass despite the environmental conditions, is consistent with theories of
Grime (1979).
1.3 PHALARIS ARUNDINACEA CONTROL LITERATURE REVIEW
The majority of researchers confirm that invasive species threaten the continued survival
of endangered species, and are one of the leading causes in the loss of biodiversity.
Invasive species are also extremely costly, both monetarily through losses in agricultural
and due to the cost of controlling the invasives. Prevention of the introduction of
potentially invasive species is paramount and continued research is needed for the
reliable and cost effective means of controlling our current invasive species (Allendorf
2003).
In spite of decades of study, there is currently no comprehensive strategy for the effective
removal of existing RCG and establishment of alternative native vegetation (Perry and
Galatowitsch 2004, Perry et al. 2004, and Forman et al. 2000). The management
techniques utilized to date include chemical control (glyphosate), mowing and grazing,
excavation of the substrate, water level manipulation, micronutrient management (boron),
macronutrient management (nitrogen), burning, and shading (black plastic mulching
and/or competitive exclusion).
24
Reed canarygrass responds quickly after mechanical removal by growing back from
rhizomes and seeds remaining in the soil (Apfelbaum and Sams 1987). However,
repeated shoot removal damages plants via stress when disturbance events are frequent.
Available carbohydrate reserves are greatest during the winter months, declining to a low
point in mid-summer. Depletion events happen as the growing point is elevated in spring
and as the seed heads develop in early summer (Comes 1971).
Green and Galatowitsch (2002) found that agricultural runoff and the associated nitrogen
addition contributes to the increasing colonization and dominance of reed canary grass.
After testing three comparable levels of nitrogen on RCG and native species, they found
that the total shoot and root biomass of the native community was suppressed by RCG, at
all levels, and that shoot growth of the native community was reduced by nearly one-half
at the highest N level. Kercher and Zedler (2004) had similar results with inorganic
nitrogen additions. RCG reduced a native sedge biomass by 91% while the sedge did not
impact the RCG. In contrast, in a carbon enriched soil, the competition by the sedge
reduced the RCG biomass by 82% while RCG competition reduced the sedge biomass by
only 32%.
Adding carbon sources has been proven to have a negative effect on the nitrogen
availability within the soil where they have been applied in combination with shading
undesirable species (Duryea, et al. 1999, Stout 2002). There have been many successful
studies utilizing some form of carbon, such as wood chips and/or sawdust and sucrose, to
reduce nitrogen, trying to give native species an competitive edge on exotics. However,
these have generally been practiced in prairie and grassland systems (D’Antonio 2004,
Blumenthal 2003, Reever-Morghan and Seastedt 1999). Davis (2000) found that carbon
additions were effective in suppressing weed biomass and promoting native species
within a wetland prairie system in Oregon. Generally, the optimum carbon to nitrogen
ratios is approximately 10:1. Examples of a few amendments and their carbon to
nitrogen ratios include corn stalks at 60:1, sawdust (weathered 2 months) at 625:1 and
Douglas fir bark at 491:1.

25
Shade material has been frequently utilized to control weeds. There are several
inadequacies when using shading fabrics with a species such as RCG. Most fabrics have
the tendency to break down as a result of prolonged exposure to sunlight, allowing the re-
growth of RCG from underground rhizomes and seed (Stannard and Crowder 2001).
Additionally, typically the material is too light to remain in place, thus allowing RCG re-
growth to literally push up the fabric from underneath due to the extensive amount of
carbohydrate storage within the rhizomes (Naglich 1994, Wisconsin DNR 2002).
Therefore, simply using a typical manufactured shade cloth, has not been shown to be
effective over the long term.
Mixed canopy layers allow for a reduced transmittance of light with a lower red:far-red
light ratio than direct sunlight. Lindig-Cisneros and Zedler (2001) exposed RCG seeds to
low red:far-red ratios and found that germination decreased by nearly 30 percent.
Canopy gaps were shown to increase invisibility in this study, as RCG did not germinate
in no-gap treatments, regardless of species richness. RCG did germinate under a canopy
with only one species, but was 43 percent lower in mixed canopy treatments.
However, during a greenhouse experiment with three-month-old reed canarygrass clones,
Maurer and Zedler (2002) tested the effects of shading on the expansion of new tillers.
They found that new growth was not significantly affected for those that remained
attached to an un-shaded parental clone. Therefore, it is noteworthy, that after a clonal
invader such as RCG establishes, the shade cast by neighboring plants may no longer
inhibit growth or vegetative spread.
Based on consultations with King County DNR employees and landowners as well as the
constraints of working on operating agricultural land, I established a set of objectives for
this research project that complied with King County’s regulations for farm land. The
control methods examined for Phalaris arundinacea control and riparian restoration were
founded on the RCG literature review and supplementary perennial invasive species
control literature.

26
The following chapters will focus on developing methods for controlling RCG and
restoring infested riparian zones using carbon reduction, multiple canopy layers,
competition from native species and techniques for depleting the RCG carbohydrate
reserves.

27
CHAPTER 2. PHALARIS ARUNDINACEA CONTROL AND
RIPARIAN RESTORATION
2.1 INTRODUCTION AND PROJECT BACKGROUND
The agricultural industry in western Washington can be traced back as early as the 1820s
(Kantor 1998). A majority of the agricultural land within King County lies within river
valleys and floodplains which are subject to frequent flooding and saturated soils. The
watercourses utilized for drainage of the floodplains typically flood due to the
accumulation of fine sediment, associated with the spread of the invasive grass species,
Phalaris arundinacea (reed canarygrass (RCG)). The RCG biomass and dominance is
increased due to nitrogen enriched agricultural runoff (Green and Galatowitsch 2002).
This in turn, leads landowners to clear the channels by dredging, a practice which
decreases the quality of habitat for native birds, wildlife, invertebrates and salmonids.
The re-establishment of vegetated riparian buffers along agricultural watercourses is a
significant challenge, in large part due to competition by dense monocultures of RCG. In
addition to clogging watercourses, RCG does not provide sufficient shade or instream
habitat structure in the form of large woody debris (LWD) needed to constitute high
quality riparian and in-stream habitat. Furthermore, it is believed that RCG may harbor a
different and perhaps less desirable assemblage of invertebrates when compared to native
woody streamside vegetation (WSU & UW Coop Research Team, unpublished data
2007). Thus, finding effective and economical control measures for reed canarygrass is
imperative for these watercourses.
Reed canarygrass can alter the surrounding habitat by: 1) constricting flow in
watercourses; 2) filling shallow lakes and ponds, degrading fish and wildlife habitat; 3)
greatly increasing evapotranspiration, which can affect local shallow groundwater
characteristics (Antieau 2002); 4) degrading water quality particularly by elevating

28
biological oxygen demand (BOD) during the dieback of excessive biomass each year
(WSU & UW Coop Research Team, unpublished data 2007); and 5) arresting natural
plant succession on the site (Antieau 2002). These alterations can result in a complete
passage blockage (physically and due to high temperature and/or low dissolved oxygen
(DO)) for anadromous salmonids during a portion of the year, generally late-summer and
early-autumn (WSU & UW Coop Research Team 2007).
2.2 PHALARIS ARUNDINACEA CONTROL RESEARCH PROJECT OBJECTIVES
The objectives of the riparian vegetation enhancement section of this project include:
a) finding a Best Management Practices (BMP) protocol for the effective
control/eradication of reed canary grass, and;
b) determining a method for providing native ground cover and woody riparian
vegetation that is vigorous, shade producing and provides habitat for insects that
constitute prey for salmonids.
2.3 PILOT PROJECT DESCRIPTION
As a part of this research project, a successful method for reducing the vigor of RCG and
eventually removing RCG was investigated. To test numerous treatments of interest on
the potential suppression of RCG, a pilot project was implemented in the fall of 2002 and
spring of 2003. Response data were collected throughout the spring, summer and early
fall of 2003.
Study Questions and Hypotheses:
1. Will the application of steam provide a significant kill of the RCG?
29
2. Does the allelopathic plant, Gaultheria shallon effectively compete with
reed canary grass?
3. Will the cover crop Trifolium repens/pretense effectively suppress RCG?
4. Will an allelopathic mulch placed on top of RCG successfully suppress RCG?
5. Will shading RCG with a heavy opaque material effectively suppress the
RCG?
Ho: The treatments of steam, a cover crop, an allelopathic plant, an allelopathic mulch
and shading do not successfully suppress reed canary grass as measured by stem density
compared to untreated sample plots.
Ha: The treatments of steam, a cover crop, an allelopathic plant, an allelopathic mulch
and shading do successfully suppress reed canary grass as measured by stem density
compared to untreated sample plots.
Steam has been proven to be an effective treatment for numerous weedy species (Norberg
et al. 1997, Quarles 2001). In most cases, the efficiency of steam has been equal to the
use of herbicides. Most annual species are killed immediately, however, as with
herbicide, perennial species typically require additional applications (Quarles 2001). The
use of steam has not been attempted on RCG to date. Most studies have been completed
with a system from the Waipuna Company (http://www.waipuna.com/), whose steamers
reach a temperature of 98º C (~208º F). This study employed a steamer that is
programmed to reach much higher temperatures. The steam was at 149º C (300º F)
within the pressurized machine and exited the hose at 138º C (~280º F).
The native shrub, Gaultheria shallon (salal), is an allelopathic plant that releases an
allelochemical called tannins from the flowers, leaves and roots (Preston 2002). Various
studies have indicated that salal has a negative impact on the re-growth of conifer
seedlings after logging (Preston 2002), sometimes called a “salal complex” (Boateng and
Comeau 2002). Tannins are able to bind proteins in a manner that negatively impacts the

30
availability of nitrogen (Cornell University 2001). Salal was used in this study to
gauge the impact that tannins and nitrogen reduction may have on the re-growth of the
RCG. Salal is also evergreen and could provide year round shade after establishment
within the drier areas of the agricultural sites along the top of the bank where the soil is
generally much drier, especially during the later part of the growing season.
Additionally, a variety of wildlife species consume the leaves, flowers and berries of salal
(Boateng and Comeau 2002).
Clover was tested in the pilot project due to a direct observation from a site visit during
the summer of 2002 where it seemed to be surviving in the presence of surrounding RCG.
Planting fast growing cover crops to compete with and suppress aggressive invasive
species while the desired species become established has been utilized in some
agriculture and prairie restorations (Perry and Galatowitsch 2003). Gunti et al. (1999)
found that red clover (Trifolium pratense) reduced the biomass of the invasive hedge
bindweed (Calystegia sepium) in a greenhouse experiment.
Adding carbon sources have been proven to reduce nitrogen availability within the soil,
resulting in weed suppression where they have been applied in addition to shading weeds
(Stout 2002; Duryea et al. 1999). At the time of this study, mulch has been tested
(Reever-Morghan and Seastedt 1999, Davis 2000, Zink and Allen 1998, Davis 2000,
Blumenthal et al. 2003, Corbin and D’Antonio 2004) however, the use of a potentially
allelopathic mulch for weed suppression has not been reported from a scientific study.
Hogfuel is the debris which falls off of the first saw in a sawmill (the hog). This usually
includes strips of bark as well as an array of wood chip sizes. This allows for a more
densely packed material. Red Cedar Hogfuel was also tested for allelopathic tendencies
on lettuce seed germination, seedling growth and RCG rhizome regrowth.
Shade material has been frequently utilized to control weeds. The principle drawback
with using most shading fabrics with a species such as RCG is the propensity for the
material to either break down as a result of prolonged exposure to sunlight, allowing the
31
re-growth of RCG from underground rhizomes and seed, or that the material is too
light to remain in place, thus allowing RCG re-growth from underneath. RCG stores an
extensive amount of carbohydrates within the rhizomes. Therefore, simply using a
typical manufactured shade cloth has not been shown to be effective over the long term.
Carpet was tested in this study due to the weight of the material and resistance to break
down in ultraviolet light. A biodegradable material of equal weight and density will be
generated if this material is successful.
2.3.1 Field Pilot Project Methods
The pilot project took place along a watercourse at an agriculture site within the
Sammamish Valley Agriculture Production District in Woodinville, WA.
Each plot was placed linearly along a watercourse at the pilot study project site during the
fall of 2002. Each plot is one treatment cell (subplot) wide and 10 cells long. There were
three replicates of these 10 treatment cells. The cells are 1.5 meters by 1.5 meters. The
RCG within all three plots and all treatment cells was mowed and tilled to remove the
aboveground biomass and loosen the rhizomes in the top ~15 cm of soil. A trench of ~30
cm was placed around each cell and a rhizome barrier placed in each trench to remove
any rhizomatous connection with the surrounding parental clones. The treatments were
assigned randomly within each replicated plot. Examples of the treatments are listed
below in Figure 2.1.

32
Steam Red Cedar
Hogfuel –
25 cm deep
Densely planted
salal -
Plugs / 90 per
cell / 1 per 10
cm sq
Cover Crop – Trifolium
repens/pratense
seed mix, 0.5 pd
per cell
Shade
Control
No Steam
Red Cedar
Hogfuel –
25 cm deep
Densely planted
salal –
Plugs / 90 per
cell / 1 per 10
cm sq
Cover Crop - Trifolium
repens/pratense
seed mix, 0.5 pd
per cell
Shade Control
Figure 2.1. Reed canary grass treatment design. Three replicates of each
treatment were placed linearly along the watercourse.
The Steam Machine (Stinger 1) was mounted on the back of a pickup truck, along with a
generator and a water tank. The water was heated within the steamer and steam was
sprayed on the plots assigned to this treatment. After one week, the additional treatments
noted were installed.
The cells assigned to the densely planted salal treatment were divided into 10 cm squares.
One salal plug was planted within each square. Those cells designated for the cover crop
treatment had Trifolium repens / pratense seeds spread on top, ~0.5 pounds per cell.
The allelopathic mulch composed of red cedar hog fuel was applied in an undecomposed
condition in order to maximize the concentrations of allelochemicals within the wood and
bark. A 25 cm layer of mulch was placed on top of the cells.
The shading material utilized for this pilot project was carpet cut in 2.25 meter squares to
test whether carpet material provides both the strength and weight needed to suppress the
re-growth of the RCG rhizomes. This fabric was used due to the low cost (free) and the
33
density. With favorable results, a biodegradable fabric of similar density and weight
could potentially be developed.
RCG stem density was measured bi-weekly to determine the success of each applied
treatment. A one meter square was placed in the middle of each treatment. Dowels were
permanently placed in each cell to verify that the measurements were taken in the same
place. By counting the returning RCG stems within each plot, the stem density of the
RCG was determined throughout the spring and summer of 2003.
2.3.2 Red Cedar Hogfuel Allelopathy Study Methods
To determine whether the red cedar hogfuel is allelopathic, lettuce seeds and seedlings
were watered with either hogfuel tea for those in the hogfuel (HF) treatment or fresh tap
water for the control treatment. Red cedar hogfuel was inundated with water for 72 hours
to make the hogfuel tea. Ten replicates of five lettuce seeds were placed on filter paper
and watered daily with either hogfuel tea or water for five weeks. The treatments were
continued on the seedlings as the seedling radicle was measured from the point of
germination until the end of the five week period.
Additionally, ten soil sample trays (~20 cm x ~20 cm) containing field soil and RCG
rhizomes were collected from the experimental site for use in the green house at the
Center for Urban Horticulture. The RCG rhizomes were equally divided and randomly
placed within the trays with field soil. Five were chosen to be randomly watered with
hogfuel tea and the other five were watered with fresh tap water.
The data were analyzed using a two sample paired t-Test for means. The seeds,
seedlings and RCG rhizomes watered with hogfuel tea were compared with those watered
with fresh water. The data included in the analysis were: 1) the number of lettuce seeds
germinated; 2) the final lettuce seedling radicle length; and 3) the final number of RCG
stems grown from the rhizomes which were present in that tray.
34
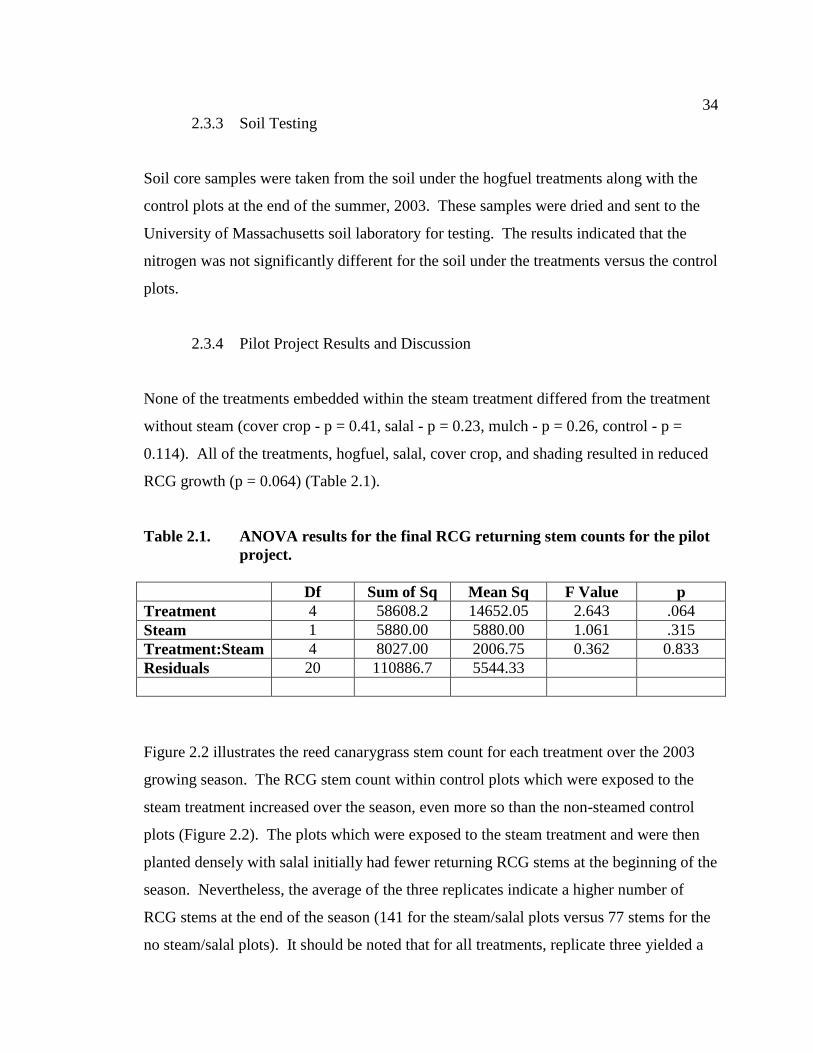
2.3.3 Soil Testing
Soil core samples were taken from the soil under the hogfuel treatments along with the
control plots at the end of the summer, 2003. These samples were dried and sent to the
University of Massachusetts soil laboratory for testing. The results indicated that the
nitrogen was not significantly different for the soil under the treatments versus the control
plots.
2.3.4 Pilot Project Results and Discussion
None of the treatments embedded within the steam treatment differed from the treatment
without steam (cover crop - p = 0.41, salal - p = 0.23, mulch - p = 0.26, control - p =
0.114). All of the treatments, hogfuel, salal, cover crop, and shading resulted in reduced
RCG growth (p = 0.064) (Table 2.1).
Table 2.1. ANOVA results for the final RCG returning stem counts for the pilot
project.
Df Sum of Sq Mean Sq F Value p
Treatment 4 58608.2 14652.05 2.643 .064
Steam 1 5880.00 5880.00 1.061 .315
Treatment:Steam 4 8027.00 2006.75 0.362 0.833
Residuals 20 110886.7 5544.33
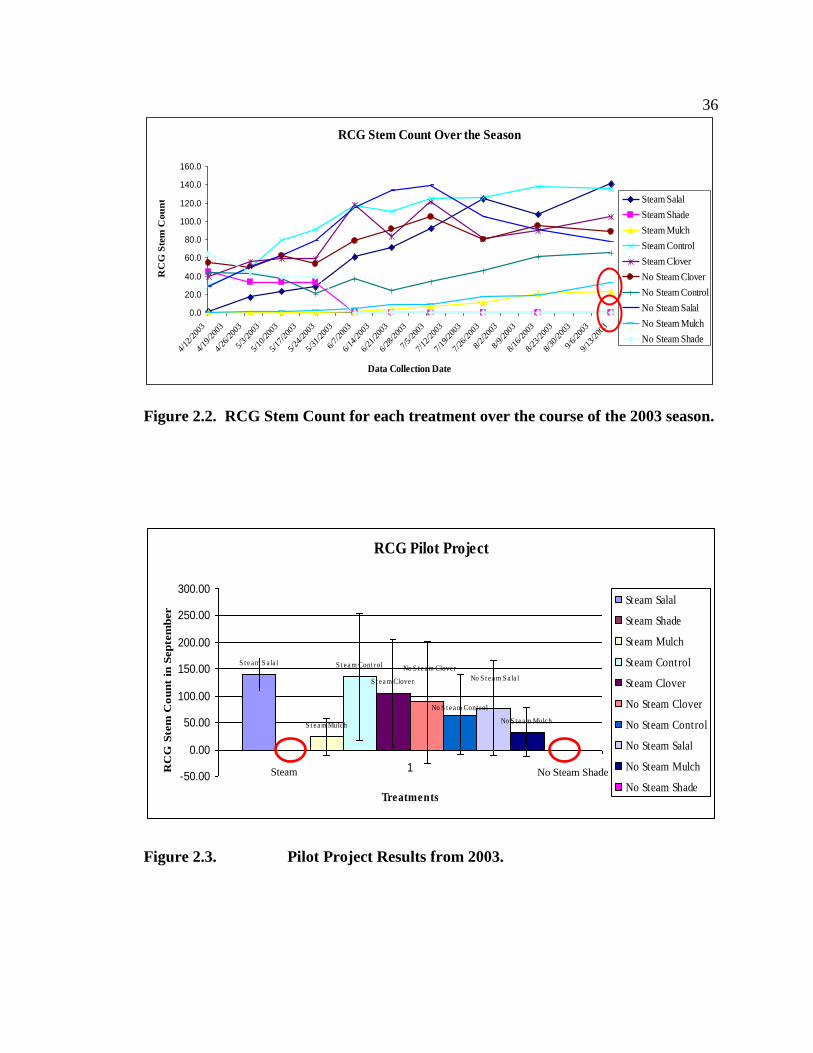
Figure 2.2 illustrates the reed canarygrass stem count for each treatment over the 2003
growing season. The RCG stem count within control plots which were exposed to the
steam treatment increased over the season, even more so than the non-steamed control
plots (Figure 2.2). The plots which were exposed to the steam treatment and were then
planted densely with salal initially had fewer returning RCG stems at the beginning of the
season. Nevertheless, the average of the three replicates indicate a higher number of
RCG stems at the end of the season (141 for the steam/salal plots versus 77 stems for the
no steam/salal plots). It should be noted that for all treatments, replicate three yielded a

35
higher number of RCG stems than the other two replicates, for almost every treatment.
This higher value does not change the results of which treatments were more successful,
however. As expected, those cells covered with the shade treatment resulted in no live
RCG stems by the end of the season (p = .03)(Figure 2.3). The mulch/hogfuel treatment
began the season completely covered with the hogfuel and with zero live RCG stems but
producing a few RCG stems by the end of the season, an average of 23 for the steamed
plots and 33 for the non-steamed plots (p=.10 compared to control plots).
The final stem count took place on September 13th
giving the average results for each
treatment used within the pilot project for the end of the 2003 season (Figure 2.3). Stem
count data from the growing season of 2003 indicate that two treatments were
particularly successful. With the high rate of variation (again, predominantly due to
replicate #3), only two of the treatments were significantly different from the control
cells. The hogfuel and shade material treatments (whether used with or without steam)
suppressed the reed canarygrass significantly when compared to the control plots and the
other treatments. These two treatments have been expanded upon and utilized within the
principal project discussed in the next section, along with riparian vegetation restoration
treatments. Again, the grass was mowed and tilled before each treatment, allowing for a
reduction of live RCG after one season than what would be available if the site had not
been tilled.
36
RCG Stem Count Over the Season
0.0
20.0
40.0
60.0
80.0
100.0
120.0
140.0
160.0
4/12
/200
3
4/19
/200
3
4/26
/200
3
5/3/
2003
5/10
/200
3
5/17
/200
3
5/24
/200
3
5/31
/200
3
6/7/
2003
6/14
/200
3
6/21
/200
3
6/28
/200
3
7/5/
2003
7/12
/200
3
7/19
/200
3
7/26
/200
3
8/2/
2003
8/9/
2003
8/16
/200
3
8/23
/200
3
8/30
/200
3
9/6/
2003
9/13
/200
3
Data Collection Date
RC
G S
tem
Co
un
t Steam Salal
Steam Shade
Steam Mulch
Steam Control
Steam Clover
No Steam Clover
No Steam Control
No Steam Salal
No Steam Mulch
No Steam Shade
Figure 2.2. RCG Stem Count for each treatment over the course of the 2003 season.
Figure 2.3. Pilot Project Results from 2003.
RCG Pilot Project
S t eam S a la l
S t eam Mulch
S t eam Cont rol
S t eam Clove r
No S t eam Mulch
No S t eam Clove r
No S t eam Cont rol
No S t eam S a la l
-50.00
0.00
50.00
100.00
150.00
200.00
250.00
300.00
1
Treatments
RC
G S
tem
Co
un
t in
Sep
tem
ber
Steam Salal
Steam Shade
Steam Mulch
Steam Control
Steam Clover
No Steam Clover
No Steam Control
No Steam Salal
No Steam Mulch
No Steam Shade
Steam
Shade
No Steam Shade
37
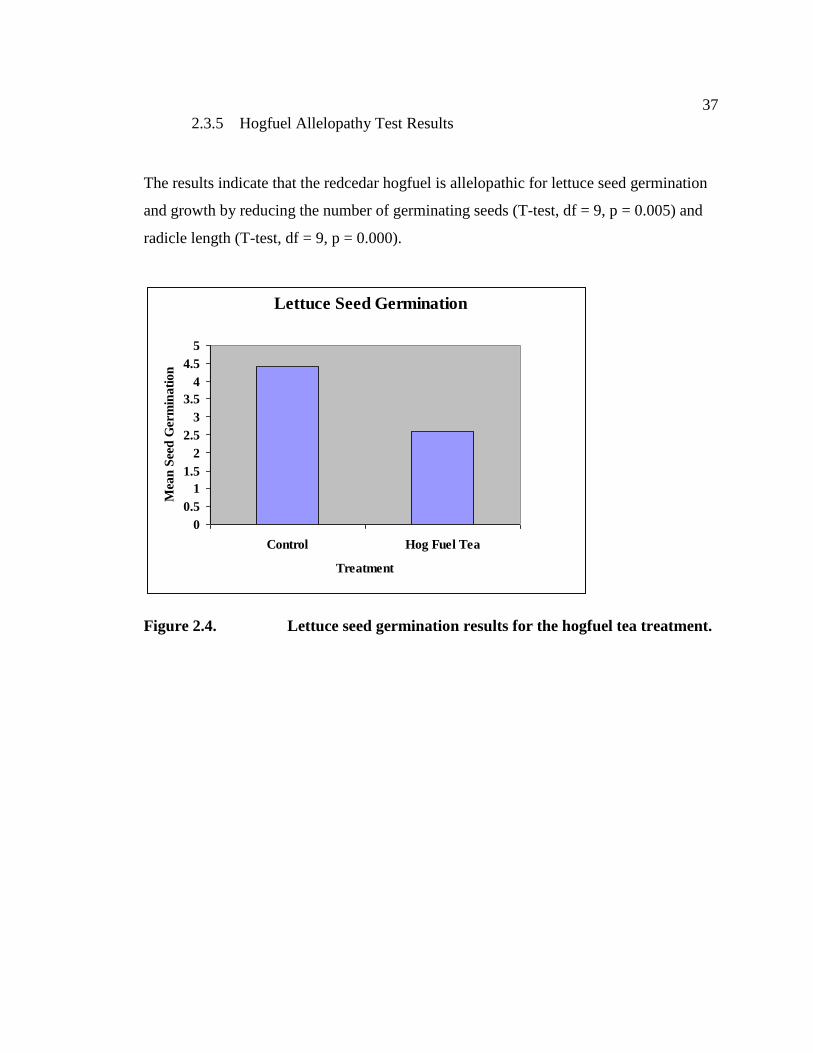
2.3.5 Hogfuel Allelopathy Test Results
The results indicate that the redcedar hogfuel is allelopathic for lettuce seed germination
and growth by reducing the number of germinating seeds (T-test, df = 9, p = 0.005) and
radicle length (T-test, df = 9, p = 0.000).
Lettuce Seed Germination
0
0.5
1
1.5
2
2.5
3
3.5
4
4.5
5
Control Hog Fuel Tea
Treatment
Mea
n S
eed
Ger
min
ati
on
Figure 2.4. Lettuce seed germination results for the hogfuel tea treatment.

38
Lettuce Seedling Growth
0
5
10
15
20
25
30
35
40
1 2 3 4 5 6 7 8 9 10
Replicate
Rad
icle
Len
gth
(m
m)
HF Treatment
Control
Figure 2.5. Lettuce seedling radicle length for the hogfuel tea treatment.
The red cedar hogfuel tea also reduced the RCG rhizome regrowth when comparing the
stem count of the rhizomes grown with hogfuel tea versus those grown with water (T-
test, df = 4, p = 0.05).
Red Cedar Hog Fuel Allelopathy
0
1
2
3
4
5
6
7
8
9
12/1
0/20
04
12/1
3/20
04
12/1
5/20
04
12/1
7/20
04
12/2
0/20
04
12/2
3/20
04
1/5/
2005
1/7/
2005
1/10
/200
5
1/12
/200
5
1/15
/200
5
1/17
/200
5
1/19
/200
5
1/21
/200
5
1/24
/200
5
1/26
/200
5
1/28
/200
5
1/31
/200
5
2/2/
2005
2/4/
2005
Treatment
RC
G S
tem
Cou
nt
Tea
Control
Figure 2.6. RCG returning stem count within the hogfuel tea treatment.

39
2.4 PRINCIPAL FIELD PROJECT DESCRIPTION
The treatments from the pilot project with significant RCG reduction were modified and
re-developed for further study. These treatments included: 1) a red cedar hogfuel
treatment and 2) a dense, heavy shade-cloth treatment, both of which were combined
with the planting of native species for re-vegetating the watercourse as directed in the
second objective (B) noted at the beginning of Chapter Two. Objective B is listed as:
“determining a method for providing native ground cover and woody riparian vegetation
that is vigorous, shade producing and provides habitat for insects that constitute prey for
salmonids.” These new treatments have been applied within the principal project
implemented in the fall of 2003 and are described in further detail below.
The following research question was addressed in this field research section of my
project:
1) Will the following treatments negatively affect the density of returning reed
canarygrass?
a) burlap/compost layers densely planted with native species providing multiple
canopies (RCG barrier)
b) red cedar hogfuel densely planted with willow species (Salix sitchensis)
c) red cedar hogfuel placed on top of RCG with the RCG barrier on top of the
hogfuel
The following two research questions were addressed in response to observations in the
field from the first research season and are addressed in Chapters Three and Four:
2) Is Scirpus microcarpus an effective competitor with reed canarygrass?
3) How long do reed canarygrass rhizomes need to be covered with a weed block fabric
to deplete the carbohydrate reserves?

40
2.4.1 Field Project Methods
2.4.1.1 Study Sites – Three sites were chosen within the Snoqualmie and
Sammamish Agricultural Production Districts (APD) of King County (Figure 2.7). These
are an agricultural farm (Woodinville, Sammamish APD) (Figure 2.8), a livestock site
(Woodinville/Redmond, Sammamish APD) (Figure 2.9) and a “natural” site (Duvall,
Snoqualmie APD) (Figure 2.10). These sites were chosen due to the occurrence of thick
and continuous swards of RCG along the agricultural waterbody, ease of access, and the
lack of planned dredging by the other researchers participating in this project.
Figure 2.7. King County Agricultural Production Districts.
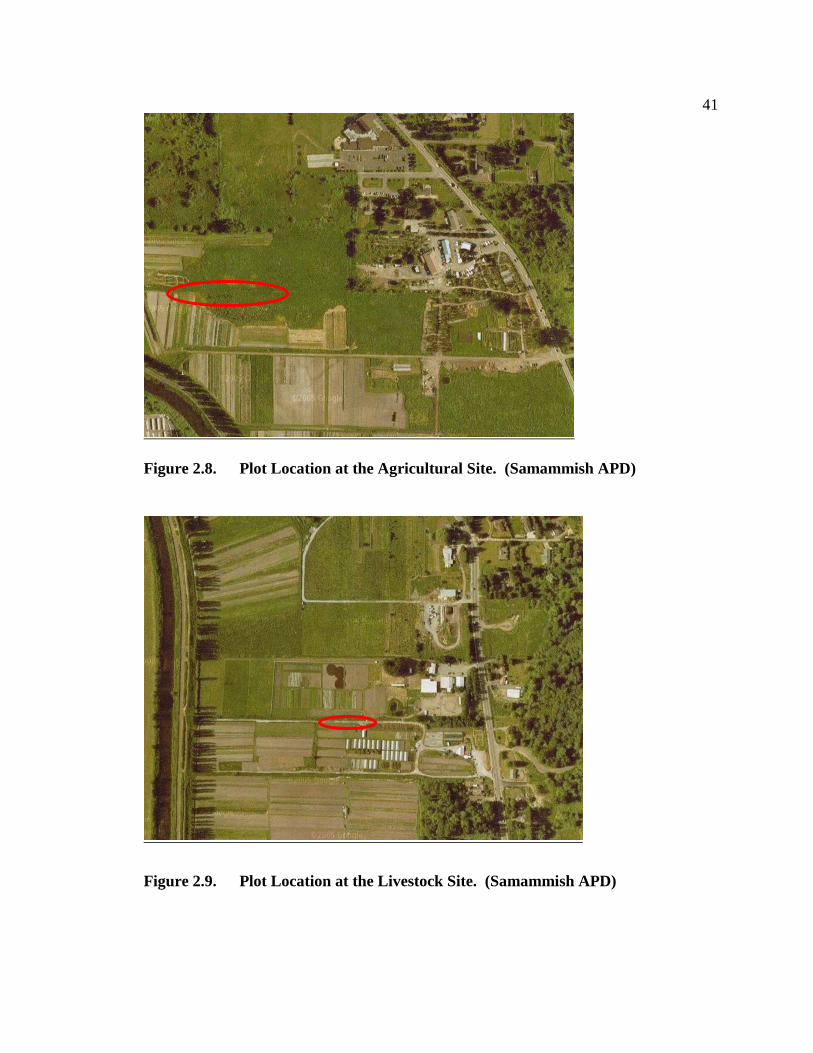
41
Figure 2.8. Plot Location at the Agricultural Site. (Samammish APD)
Figure 2.9. Plot Location at the Livestock Site. (Samammish APD)

42
Figure 2.10. Plot Location at the Natural Site. (Snoqualmie APD)
2.4.1.2 Treatment Design
Treatment #1 - Reed canarygrass barrier - treatments for the field project consisted of
employing a RCG barrier that was developed specifically for this study. Burlap fabric
was placed on top of mowed RCG and compost (~25 cm deep) was placed on top of the
fabric within two by three meter plots. Burlap fabric was then placed on top of the
compost and staked on each side. The burlap/compost “pillows” were used as a
biodegradable alternate to carpet and due to the weight and shade that they provide (as
shown by the carpet in the pilot project to suppress RCG) as well as the ability to plant
within the compost allowing for re-vegetation of the watercourse and additional
competition for RCG. Carpet is predominantly comprised of nylon, olefin (a
polypropylene material), and/or polyester (Moxy Media 2007), most of which are not
biodegradable, or certainly not within a sufficient period of time, for example, nylon
takes 30-40 years to biodegrade.

43
When plants or stakes are placed within the fabric, RCG competes with the plant/stake,
and grows up through the hole and again on top of the fabric. With this design, the RCG
underneath the mat will not be exposed for many years and is not capable of competing
with the more desirable planted vegetation. Therefore, RCG seed and rhizome fragments
from elsewhere are the chief concern for re-growth on top of the mat. In accordance with
objective B, and in order to provide a habitat which will be competitive with the potential
available RCG seeds and rhizome fragments, plants were chosen for re-vegetation that
will provide the maximum shade possible and numerous canopy layers. As noted in the
RCG control literature review, multiple canopy layers were proven to be successful in
preventing RCG germination under mixed canopy layers (Lindig-Cisneros and Zedler
2001). Maurer and Zedler (2002) also found that RCG regeneration and growth from
rhizome fragments was limited by 95 percent (25 percent reduction in survival) under
heavy shading.
Based on the results from Dr. Zedler and her students and from the RCG control section
in Chapter One, the plant species for the RCG barrier treatment were chosen due to their
ability to: a) provide two or three canopy layers at any point within the plot; b) emerge
early in the season, as does RCG; and c) tolerate wet to dry conditions depending on
placement on the bank. Additionally, three species (Rubus spectabilis, Vaccinium
ovalifolium and Ribes bracteosum) were chosen due to their ability to attract
invertebrates to the site. Allan et al. (2003) noted that these understory species tended to
harbor a high percentage of invertebrate biomass, many of the taxa were also found in the
stomach samples of juvenile salmon. The species that will be used within the “RCG
barrier” treatment of the principal project are listed below in Figure 2.12.
In addition to the RCG barrier treatment, two additional treatments were tested.
Treatment #1 – RCG Barrier treatment = Burlap fabric was placed on mowed RCG with
25 cm of compost and another layer of burlap placed on top with a designated planting
design.

44
Treatment #2 – Hogfuel/Willow treatment = Burlap fabric was placed on top of
mowed reed canarygrass with 25 cm of hogfuel and another layer of burlap on top with
90 cm willow stakes (three foot) placed within at a density of 12 stakes per plot. The
willow stakes were planted 25-30 cm.
Treatment #3 – Hogfuel/RCG Barrier treatment - Twenty five centimeters of hogfuel was
placed on top of the RCG with the same barrier used in Treatment #1 placed on top of the
hogfuel.
Figure 2.11. Treatment description and layout example.
The three treatments (plus one control) for the principal project are illustrated in Figure
2.11. Three replicates of the four plots were placed at each of three different sites in two
Agricultural Product Districts.
Plots at the natural site and agricultural sites, were 2 x 3 meters and the plots at the
livestock site were 1 x 2 meters. A randomized block experimental design was
implemented with three treatments (plus control) within three blocks (or replicates)
chosen randomly at each site, or nine replicates of each treatment in total. The reed
Plantings
Burlap Fabric
Compost, 25 cm
Burlap Fabric
Plantings
Burlap fabric Compost,25 cm Burlap fabric
Willow stakes 1.5ft ctr
Burlap Fabric
25 cm Hogfuel
Burlap Fabric
Plantings
Burlap Fabric
Compost, 25 cm
Burlap Fabric
25 cm Hogfuel
#1 - RCG Barrier #2 - Hogfuel /
Willow #3 - Hogfuel /
RCG Barrier #4 - Control

45
canarygrass was mowed with string trimmers to height of ~5 cm and a trench of ~30
cm was placed around each cell and a rhizome barrier placed within the trench to remove
any rhizomatous connection with the surrounding parental clones.
2.4.1.3 Data Collection
RCG Stem density was measured bi-weekly during the growing season (February
through November) for two years, 2004 and 2005, to determine the success of each
applied treatment within the principal project over two growing seasons. Appendix A
displays the treatment arrangement at each site.
Percent cover of vegetation within each plot was recorded at the end of the second
growing season to determine survival and competitive efficacy of the planted native
species with the RCG.
Data were analyzed using a Two Way Analysis of Variance. The Tukey HSD procedure
was utilized to guarantee the overall alpha level of 0.05.
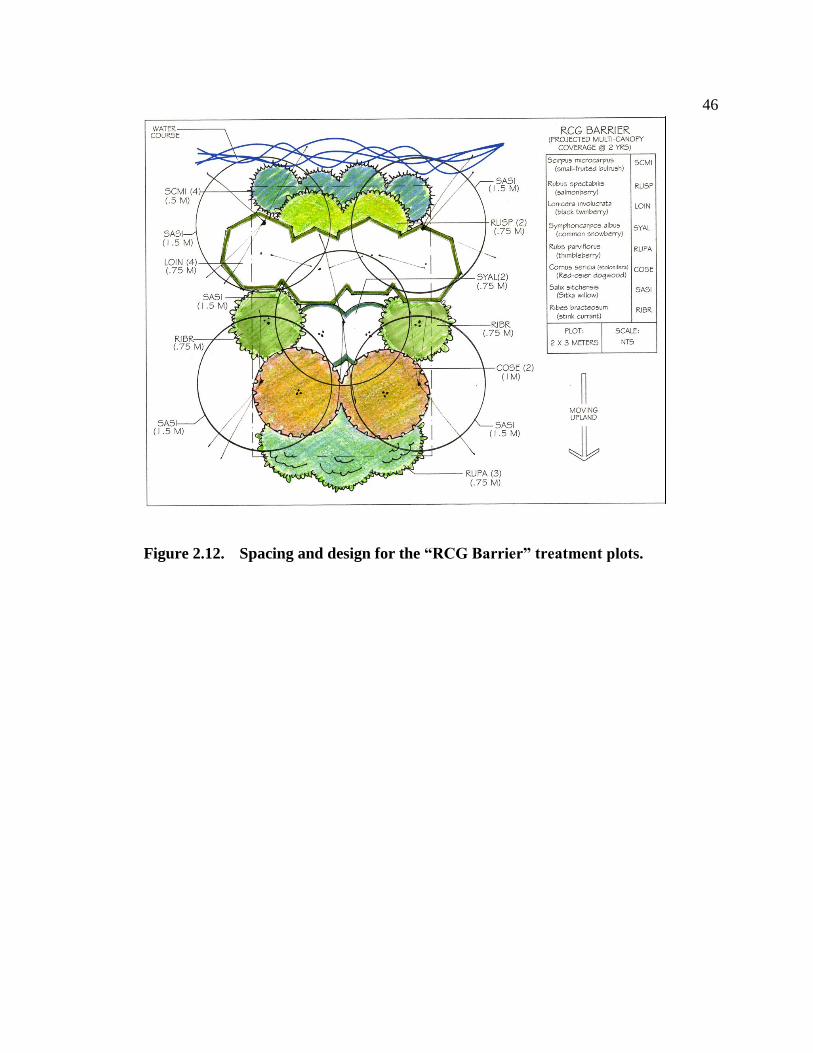
46
Figure 2.12. Spacing and design for the “RCG Barrier” treatment plots.
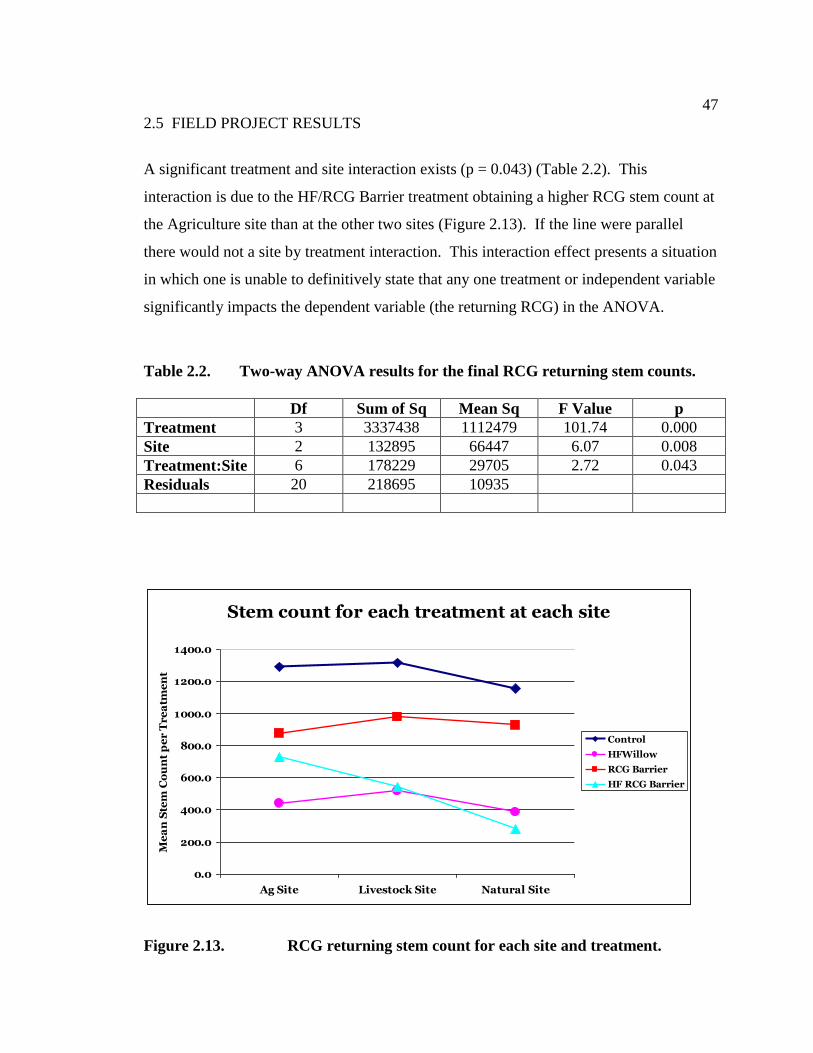
47
2.5 FIELD PROJECT RESULTS
A significant treatment and site interaction exists (p = 0.043) (Table 2.2). This
interaction is due to the HF/RCG Barrier treatment obtaining a higher RCG stem count at
the Agriculture site than at the other two sites (Figure 2.13). If the line were parallel
there would not a site by treatment interaction. This interaction effect presents a situation
in which one is unable to definitively state that any one treatment or independent variable
significantly impacts the dependent variable (the returning RCG) in the ANOVA.
Table 2.2. Two-way ANOVA results for the final RCG returning stem counts.
Df Sum of Sq Mean Sq F Value p
Treatment 3 3337438 1112479 101.74 0.000
Site 2 132895 66447 6.07 0.008
Treatment:Site 6 178229 29705 2.72 0.043
Residuals 20 218695 10935
Stem count for each treatment at each site
0.0
200.0
400.0
600.0
800.0
1000.0
1200.0
1400.0
Ag Site Livestock Site Natural Site
Me
an
Ste
m C
ou
nt
pe
r T
re
atm
en
t
Control
HFWillow
RCG Barrier
HF RCG Barrier
Figure 2.13. RCG returning stem count for each site and treatment.
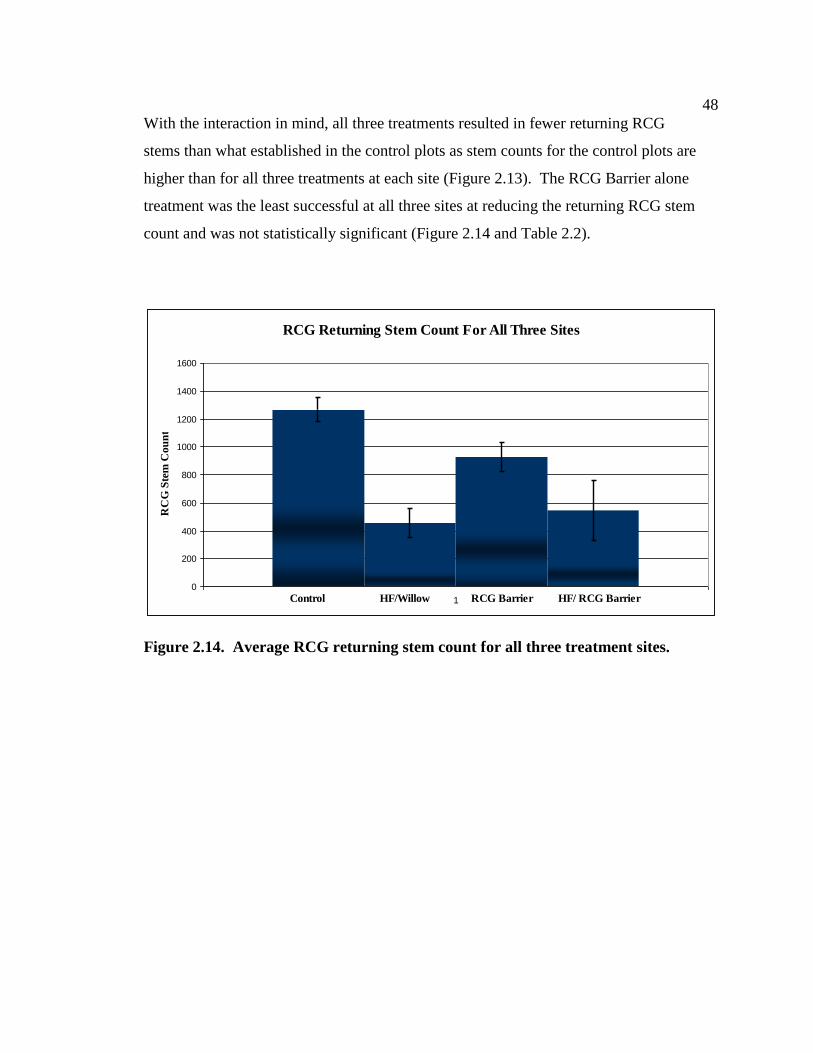
48
With the interaction in mind, all three treatments resulted in fewer returning RCG
stems than what established in the control plots as stem counts for the control plots are
higher than for all three treatments at each site (Figure 2.13). The RCG Barrier alone
treatment was the least successful at all three sites at reducing the returning RCG stem
count and was not statistically significant (Figure 2.14 and Table 2.2).
RCG Returning Stem Count For All Three Sites
0
200
400
600
800
1000
1200
1400
1600
1
RC
G S
tem
Cou
nt
Control HF/Willow RCG Barrier HF/ RCG Barrier
Figure 2.14. Average RCG returning stem count for all three treatment sites.

49
Figure 2.15. RCG Final Stem Count From The Three Sites Grouped by Treatment.
The treatments, Hogfuel/Willow (HF/Willow) and the HF/RCG Barrier were the most
successful overall, but varied by site. The HF/Willow treatment was more successful at
the Agriculture site (Figure 2.16) and the HF/RCG Barrier treatment was the most
successful at the Natural site (Figure 2.18). The HF/Willow and HF/RCG Barrier
treatments were not significantly different at the Livestock site (Figure 2.17).
Additionally, except for the HF/RCG Barrier treatment at the Agriculture site, the
Livestock site had higher stem counts than the other two sites for the control and the
other two treatments.
The HF/Willow treatment reduced the returning RCG stem count when compared to each
of the other two treatments at the Agriculture Site, but was not statistically significant due
to the variation at the Livestock and Natural Sites (Figures 2.16, 2.17, 2.18). However,
the HF/Willow treatment was the most successful treatment at two of the three sites, the
Agriculture and Livestock sites.
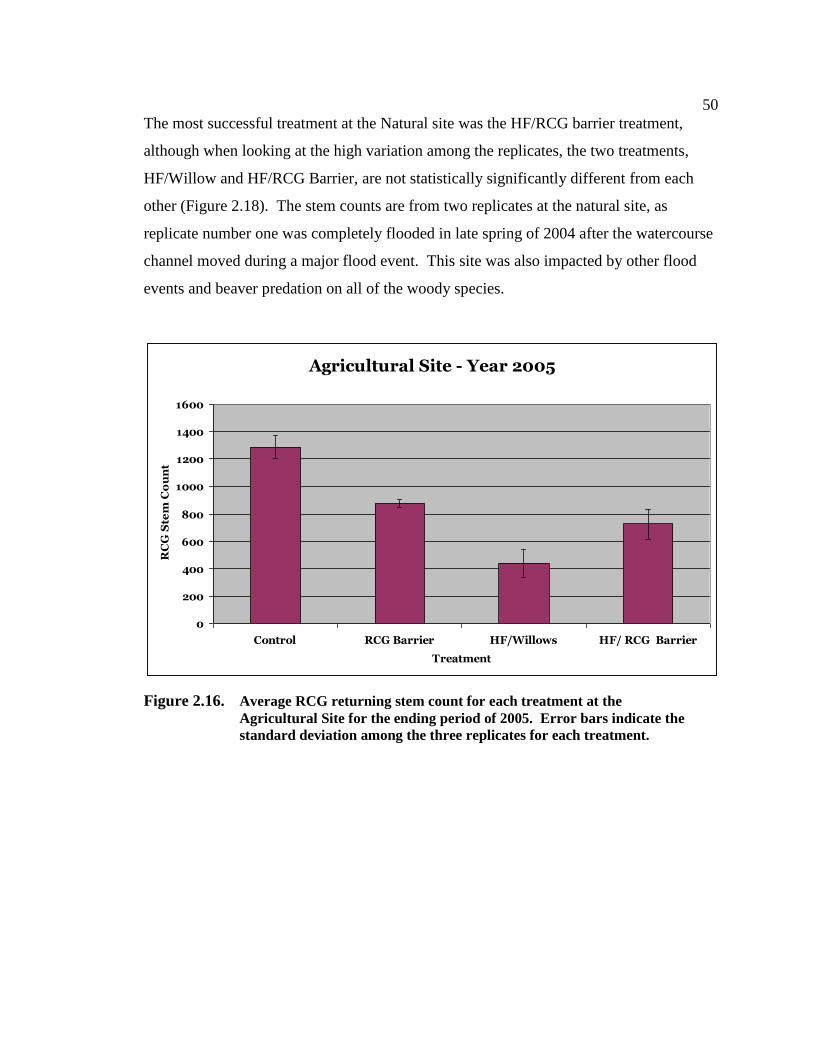
50
The most successful treatment at the Natural site was the HF/RCG barrier treatment,
although when looking at the high variation among the replicates, the two treatments,
HF/Willow and HF/RCG Barrier, are not statistically significantly different from each
other (Figure 2.18). The stem counts are from two replicates at the natural site, as
replicate number one was completely flooded in late spring of 2004 after the watercourse
channel moved during a major flood event. This site was also impacted by other flood
events and beaver predation on all of the woody species.
Figure 2.16. Average RCG returning stem count for each treatment at the
Agricultural Site for the ending period of 2005. Error bars indicate the
standard deviation among the three replicates for each treatment.
Agricultural Site - Year 2005
0
200
400
600
800
1000
1200
1400
1600
Control RCG Barrier HF/Willows HF/ RCG Barrier
Treatment
RC
G S
tem
Co
un
t
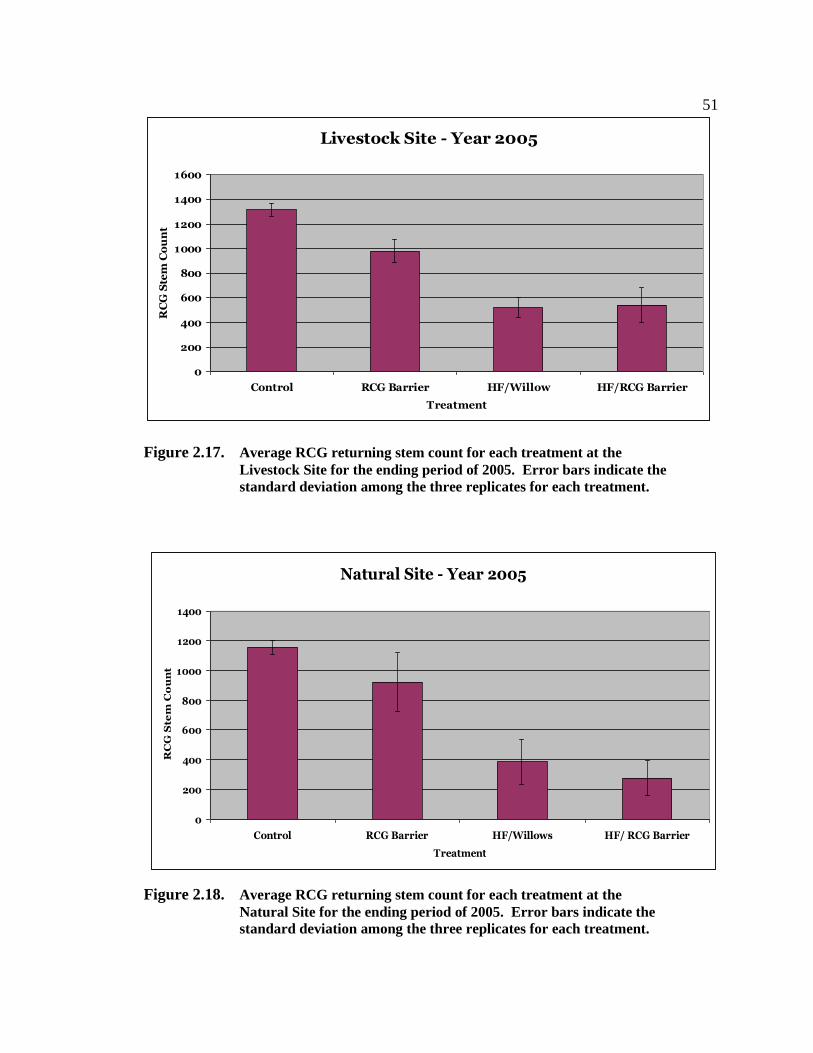
51
Livestock Site - Year 2005
0
200
400
600
800
1000
1200
1400
1600
Control RCG Barrier HF/Willow HF/RCG Barrier
Treatment
RC
G S
tem
Co
un
t
Figure 2.17. Average RCG returning stem count for each treatment at the
Livestock Site for the ending period of 2005. Error bars indicate the
standard deviation among the three replicates for each treatment.
Figure 2.18. Average RCG returning stem count for each treatment at the
Natural Site for the ending period of 2005. Error bars indicate the
standard deviation among the three replicates for each treatment.
Natural Site - Year 2005
0
200
400
600
800
1000
1200
1400
Control RCG Barrier HF/Willows HF/ RCG Barrier
Treatment
RC
G S
tem
Co
un
t

52
A Two-way Analysis of Variance (ANOVA) was used to examine the treatment main
effect, site main effect and their interaction effect on the stem count. The ANOVA
results are presented in Table 2.2 and the Tukey HSD pos hoc results are listed in Table
2.3.
Each of the treatments were statistically significant when compared to the control RCG
stem count return and when compared to the other treatments overall (p-value = 0.000).
Both treatment and site have a statistically significant effect on the stem count (p=0.000
for treatment and p=0.008 for site). Post hoc comparisons shown below illustrate the pair
wise difference among all of the combinations of treatment and site.
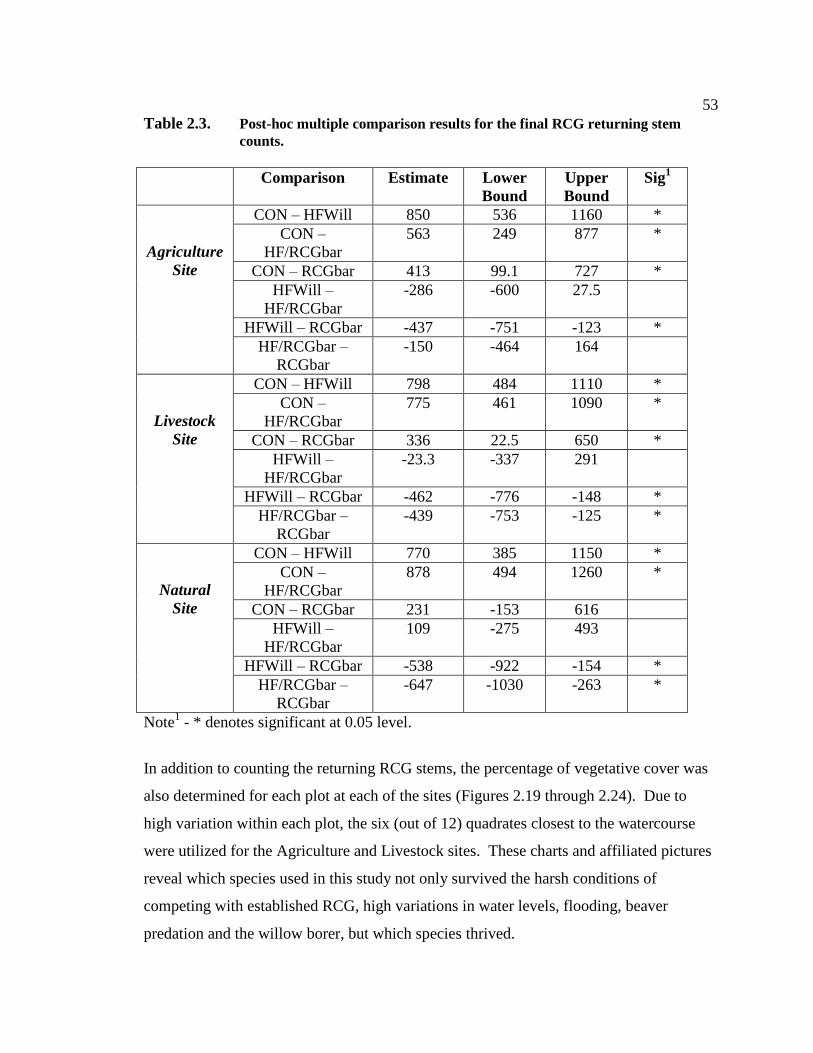
53
Table 2.3. Post-hoc multiple comparison results for the final RCG returning stem
counts.
Comparison Estimate Lower
Bound
Upper
Bound
Sig1
Agriculture
Site
CON – HFWill 850 536 1160 *
CON –
HF/RCGbar
563 249 877 *
CON – RCGbar 413 99.1 727 *
HFWill –
HF/RCGbar
-286 -600 27.5
HFWill – RCGbar -437 -751 -123 *
HF/RCGbar –
RCGbar
-150 -464 164
Livestock
Site
CON – HFWill 798 484 1110 *
CON –
HF/RCGbar
775 461 1090 *
CON – RCGbar 336 22.5 650 *
HFWill –
HF/RCGbar
-23.3 -337 291
HFWill – RCGbar -462 -776 -148 *
HF/RCGbar –
RCGbar
-439 -753 -125 *
Natural
Site
CON – HFWill 770 385 1150 *
CON –
HF/RCGbar
878 494 1260 *
CON – RCGbar 231 -153 616
HFWill –
HF/RCGbar
109 -275 493
HFWill – RCGbar -538 -922 -154 *
HF/RCGbar –
RCGbar
-647 -1030 -263 *
Note1 - * denotes significant at 0.05 level.
In addition to counting the returning RCG stems, the percentage of vegetative cover was
also determined for each plot at each of the sites (Figures 2.19 through 2.24). Due to
high variation within each plot, the six (out of 12) quadrates closest to the watercourse
were utilized for the Agriculture and Livestock sites. These charts and affiliated pictures
reveal which species used in this study not only survived the harsh conditions of
competing with established RCG, high variations in water levels, flooding, beaver
predation and the willow borer, but which species thrived.
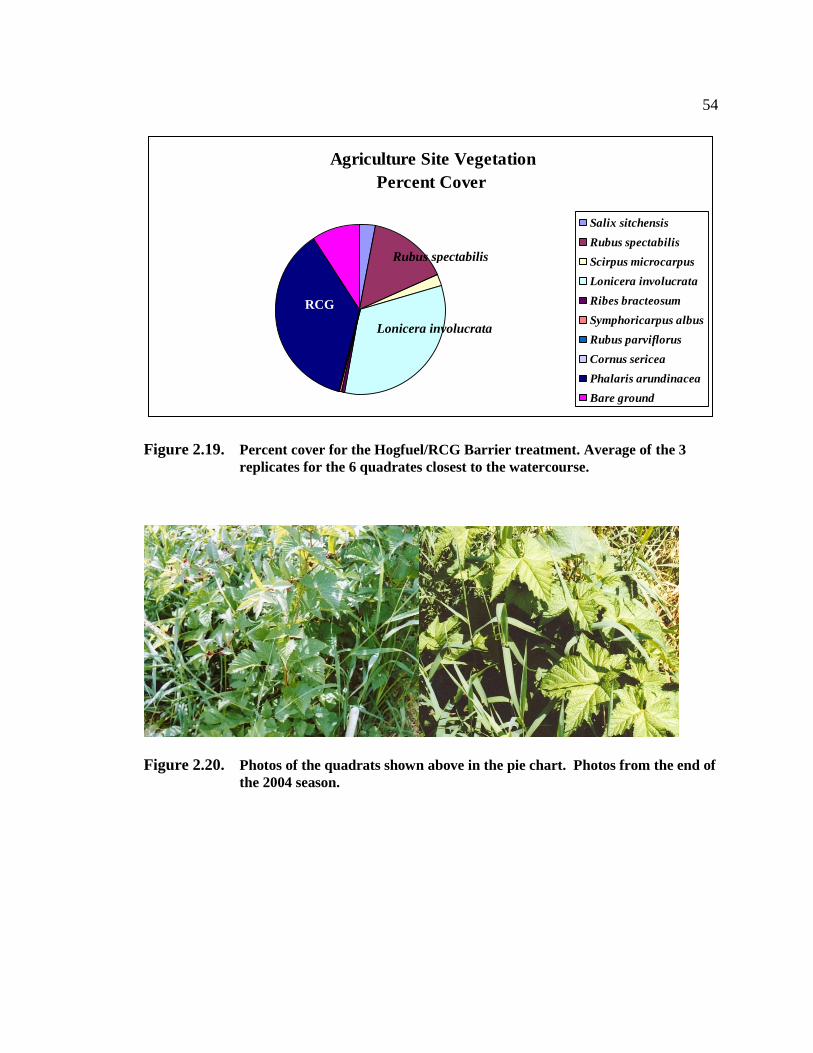
54
Agriculture Site Vegetation
Percent Cover
Salix sitchensis
Rubus spectabilis
Scirpus microcarpus
Lonicera involucrata
Ribes bracteosum
Symphoricarpus albus
Rubus parviflorus
Cornus sericea
Phalaris arundinacea
Bare ground
Figure 2.19. Percent cover for the Hogfuel/RCG Barrier treatment. Average of the 3
replicates for the 6 quadrates closest to the watercourse.
Figure 2.20. Photos of the quadrats shown above in the pie chart. Photos from the end of
the 2004 season.
Lonicera involucrata
Rubus spectabilis
RCG
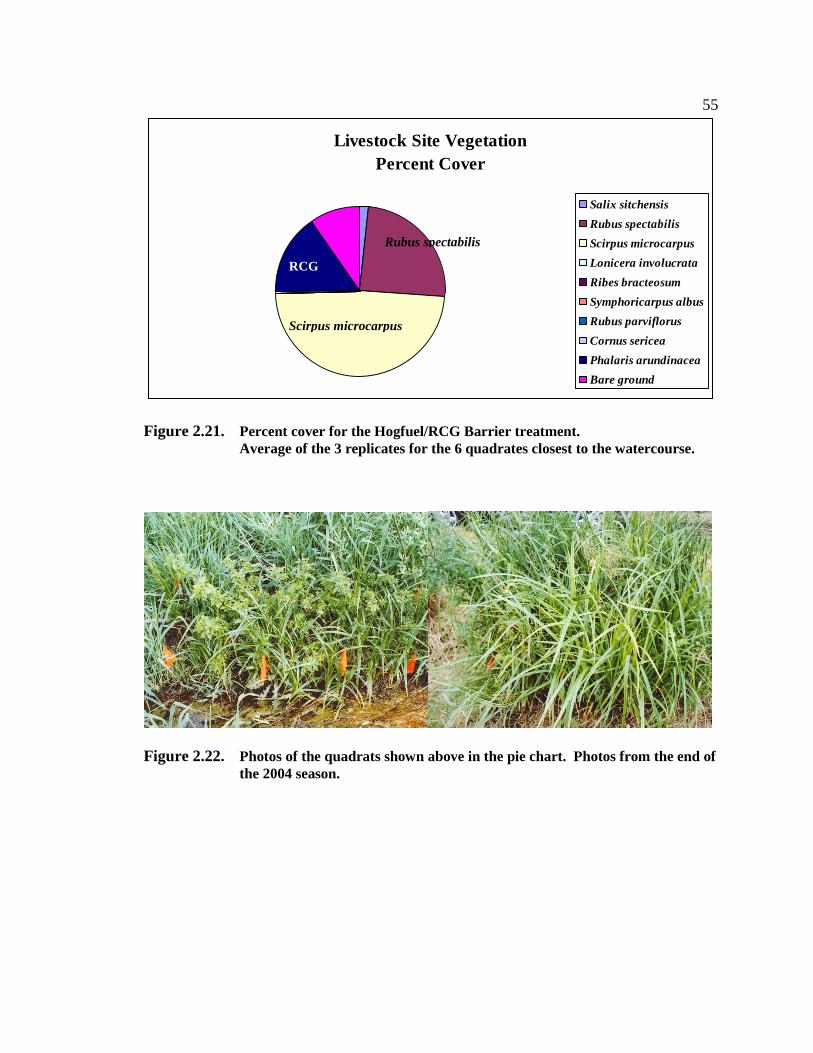
55
Livestock Site Vegetation
Percent Cover
Salix sitchensis
Rubus spectabilis
Scirpus microcarpus
Lonicera involucrata
Ribes bracteosum
Symphoricarpus albus
Rubus parviflorus
Cornus sericea
Phalaris arundinacea
Bare ground
Figure 2.21. Percent cover for the Hogfuel/RCG Barrier treatment.
Average of the 3 replicates for the 6 quadrates closest to the watercourse.
Figure 2.22. Photos of the quadrats shown above in the pie chart. Photos from the end of
the 2004 season.
Scirpus microcarpus
Rubus spectabilis
RCG
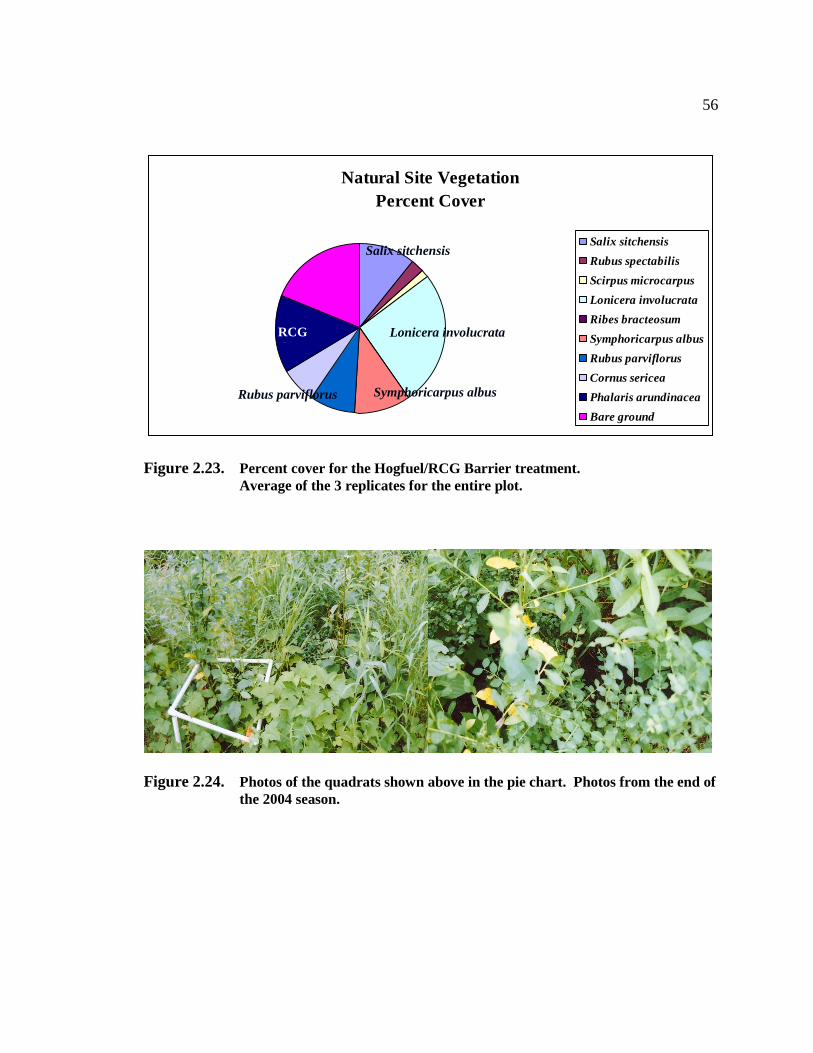
56
Natural Site Vegetation
Percent Cover
Salix sitchensis
Rubus spectabilis
Scirpus microcarpus
Lonicera involucrata
Ribes bracteosum
Symphoricarpus albus
Rubus parviflorus
Cornus sericea
Phalaris arundinacea
Bare ground
Figure 2.23. Percent cover for the Hogfuel/RCG Barrier treatment.
Average of the 3 replicates for the entire plot.
Figure 2.24. Photos of the quadrats shown above in the pie chart. Photos from the end of
the 2004 season.
Lonicera involucrata
Symphoricarpus albus Rubus parviflorus
RCG
G
Salix sitchensis

57
2.6. PROJECT DISCUSSION AND CONCLUSIONS
Both the treatment and the site affected RCG stem count (RCG regrowth). The treatment
effect varied by site for one treatment (the HF/RCG Barrier treatment at the Agriculture
site). The post hoc comparisons quantified the differences among treatments at each site.
These tests indicate that the control stem counts were significantly higher than all three
treatments at all sites, except at the livestock site, where control count is not significantly
different than the RCG Barrier alone treatment.
However, the HF/Willow treatment has lower stem count numbers overall (Figures 2.16-
2.18). This may be due to the unexpected positive effects provided by the compost added
to the RCG Barrier and HF/RCG Barrier treatment for planting within. The compost
most likely provided additional moisture and possibly nitrogen for the RCG.
One of the objectives of this research project was to provide maximum shade and
preferred invertebrates for salmonids, whether to benefit salmonids within the
watercourse itself or downstream within the main channel into which the watercourse
flows. The HF/Willow treatment alone would not be able to adequately meet this
objective. Past research by Joy Zedler and many of her students have shown that RCG
responds negatively to numerous canopy layers (Lindig-Cisneros and Zedler 2001,
Maurer and Zedler 2002). Stem count results from my mixed canopy layer plots echo
those results. Additionally, a more diverse herbaceous and woody plant species
assemblage would allow for a more diverse invertebrate community (Allan et al. 2003).
My recommendation for controlling RCG and restoring agricultural watercourses would
be the Hogfuel/RCG Barrier treatment with the multiple species plantings. Providing
multiple canopy layers would allow for lower light levels and the additional species
(Rubus spectabilis, Vaccinium ovatum and Ribes bracteosum) would assist in providing
preferred prey for salmonids.

58
Salix sp. generally do not leaf out until mid to late spring (~mid April) while RCG
generally begins growth in January or February in the PNW. If other species are utilized
within the restoration/replanting, there is a greater chance for a few of the species to leaf
out earlier in the spring (for example, the Scirpus microcarpus, Rubus spectabilis and
Lonicera involucrata) providing some shade to the early returning RCG and
supplementary shade for the water course. The use of conifers may also be desirable but
were inappropriate for this study due to the height requirement of the Farm Preservation
Program (FPP) program in King County under which this land operates.
With the Hogfuel/Willow treatment, the success of the restoration could be heavily
impacted by the poplar and willow borer (Cryptorhynchus lapathi), an introduced species
now ubiquitously established throughout western Washington. This weevil attacked the
Agriculture and Livestock sites, at the end of the 2005 season and destroyed up to 80% of
the willows at both sites (See Figure 2.25). The damaged willows were cut off, removed
from the premises and destroyed so that the larvae inside would not mature. Many of the
willows recovered from the rootstock, however, the shade supplied for RCG control was
reduced dramatically and would not recover for at least 2-3 years.
Figure 2.25. An adult willow borer (Cryptorhynchus lapathi) on an impacted willow stem.
Placing woodchips / mulch within wetland and/or riparian settings, even for restoration
projects, is considered the filling of a wetland and the project is therefore subject to
inspection by the US Army Corps of Engineers. The Corp will evaluate the project, and
unless the some aspect of the filling does not comply with the Endangered Species Act,
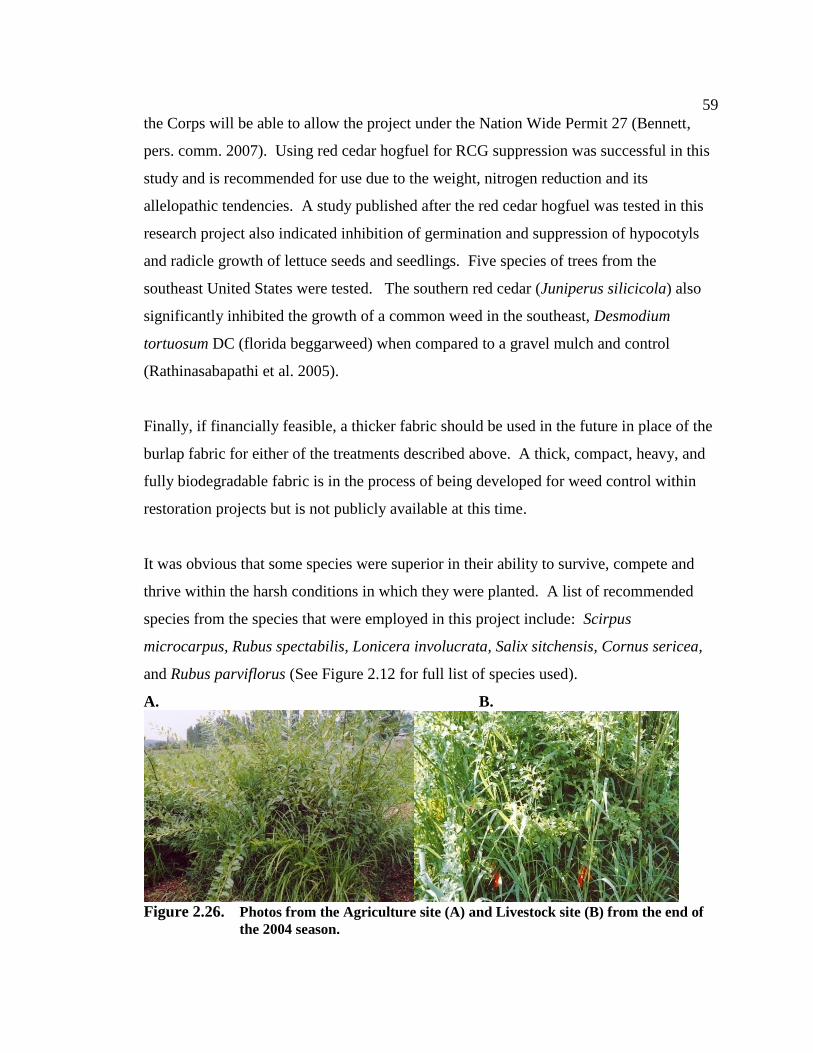
59
the Corps will be able to allow the project under the Nation Wide Permit 27 (Bennett,
pers. comm. 2007). Using red cedar hogfuel for RCG suppression was successful in this
study and is recommended for use due to the weight, nitrogen reduction and its
allelopathic tendencies. A study published after the red cedar hogfuel was tested in this
research project also indicated inhibition of germination and suppression of hypocotyls
and radicle growth of lettuce seeds and seedlings. Five species of trees from the
southeast United States were tested. The southern red cedar (Juniperus silicicola) also
significantly inhibited the growth of a common weed in the southeast, Desmodium
tortuosum DC (florida beggarweed) when compared to a gravel mulch and control
(Rathinasabapathi et al. 2005).
Finally, if financially feasible, a thicker fabric should be used in the future in place of the
burlap fabric for either of the treatments described above. A thick, compact, heavy, and
fully biodegradable fabric is in the process of being developed for weed control within
restoration projects but is not publicly available at this time.
It was obvious that some species were superior in their ability to survive, compete and
thrive within the harsh conditions in which they were planted. A list of recommended
species from the species that were employed in this project include: Scirpus
microcarpus, Rubus spectabilis, Lonicera involucrata, Salix sitchensis, Cornus sericea,
and Rubus parviflorus (See Figure 2.12 for full list of species used).
A. B.
Figure 2.26. Photos from the Agriculture site (A) and Livestock site (B) from the end of
the 2004 season.
60
CHAPTER 3. INTERSPECIFIC COMPETITION BETWEEN
PHALARIS ARUNDINACEA AND SCIRPUS MICROCARPUS
3.1 INTRODUCTION
Field observations from both the experimental field sites and in some natural areas
indicate that Scirpus microcarpus (small fruited bulrush (SFB)) is capable of thriving and
competing effectively with Phalaris arundinacea (reed canarygrass) (Ewing and
Seebacher, personal observation). A competition study between reed canarygrass (RCG)
and small fruited bulrush was conducted within the greenhouse at the Center for Urban
Horticulture (CUH), University of Washington to test the competitive abilities of these
two species in a controlled setting.
3.2 PLANT COMPETITION ECOLOGY
Plant competition, specifically inter-specific competition is defined by Tilman (1997) as
“an interaction in which an increase in the population density or biomass of one species
leads to the decrease in the population growth rate and the population density or biomass
of another species.” The extent of growth inhibition by the adjacent species determines
the degree of competition (Crawley 1997). The biodiversity of a plant community and
site is largely determined by inter and intra-specific competition among the plant species
involved. The effects of this competition on the plant community and biodiversity are
modified however, by herbivores, pathogens and parasites (Crawley 1997).
Species such as RCG are typically found in monocultures and are faced with intra-
specific competition. Bonsall (2007) partitions intra-specific competition into two
categories; scramble, which takes place when resources are allocated in a uniform
manner, and contest, when the resources are unequally divided. Intra-specific
61
competition takes place when two or more plants or clones in the case of RCG, of the
same species vie for the same resource (Bonsall 2007). Many clonal species have been
found to dominate a site with one or two of the most fit clones covering literally hundreds
of kilometers or hectares (Sebens and Thorne 1985). There are several consequences of
intra-specific competition. The first could be a diminished size of the plant as the number
of individuals mount, referred to as the density effect (Park et al. 2003). Another could
be a shift in the gradient of sizes of individuals within the population, and thirdly, the
potential loss of individuals as population density in the population increases, referred to
as self-thinning.
Plants compete for one main above-ground resource, light, and numerous below ground
resources from within the soil. These below ground resources include water, mineral
nutrients, valence and oxidation state and space (Casper and Jackson 1997). There are
several conflicting theories in resource competition. One such theory states that
competition intensifies in habitats with higher productivity due to the high growth rates
and subsequent biomass. This in turn increases the competition for space and light. Less
productive habitats would tend to be less competitive, attracting those species that have a
lower competitive ability (Wilson and Tilman 1991). Another theory advocates that
more intense competition may take place in less productive habitats, primarily for soil
resources as they would tend to be limited (Wilson and Tilman 1991).
If one species is to prohibit the survival of another or exclude another species, there are
several prerequisites. First, the essential resources must be restricted. Second, interaction
between the two species must overlap for space and resources, and third, one of the
species would need to be better at capturing the shared resources (Aarssen 1983).
Connell (1983) proposed ranking species based on competitive ability. He defines
competition as when a particular species has a harmful impact on another, but when only
one species is impacted, the term “asymmetrical competition” should be used. When this
asymmetry is strong, the species involved are able to be ranked based on superiority of
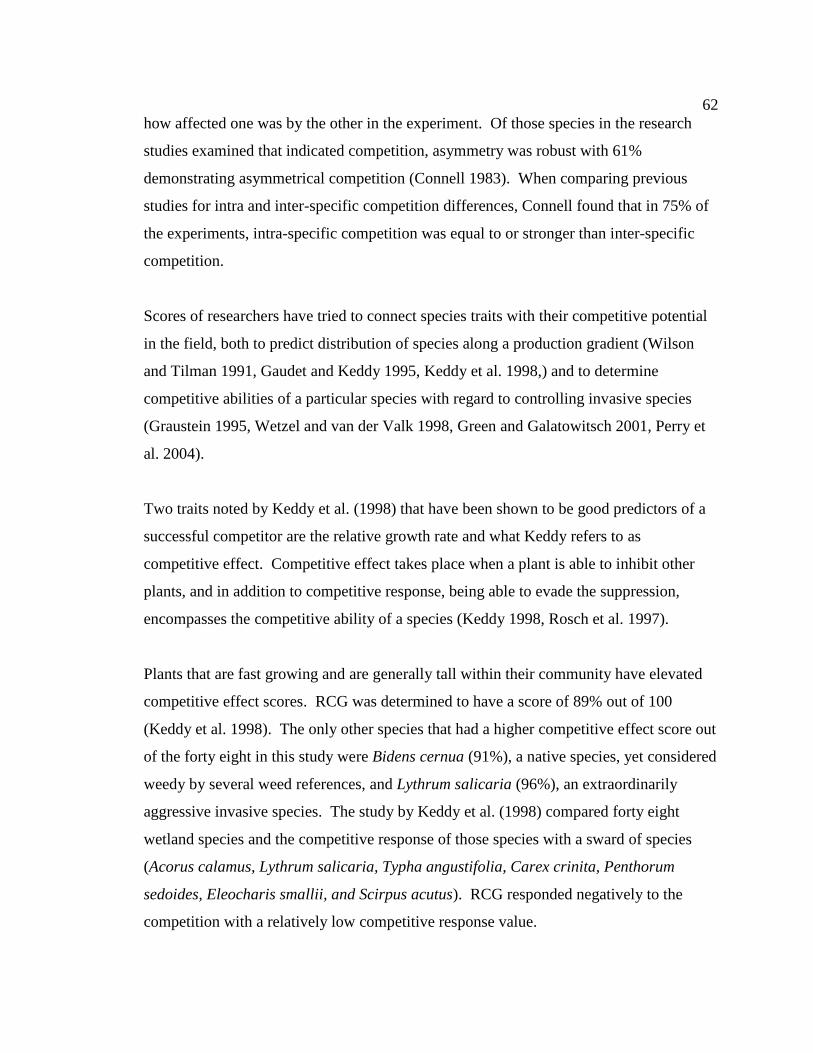
62
how affected one was by the other in the experiment. Of those species in the research
studies examined that indicated competition, asymmetry was robust with 61%
demonstrating asymmetrical competition (Connell 1983). When comparing previous
studies for intra and inter-specific competition differences, Connell found that in 75% of
the experiments, intra-specific competition was equal to or stronger than inter-specific
competition.
Scores of researchers have tried to connect species traits with their competitive potential
in the field, both to predict distribution of species along a production gradient (Wilson
and Tilman 1991, Gaudet and Keddy 1995, Keddy et al. 1998,) and to determine
competitive abilities of a particular species with regard to controlling invasive species
(Graustein 1995, Wetzel and van der Valk 1998, Green and Galatowitsch 2001, Perry et
al. 2004).
Two traits noted by Keddy et al. (1998) that have been shown to be good predictors of a
successful competitor are the relative growth rate and what Keddy refers to as
competitive effect. Competitive effect takes place when a plant is able to inhibit other
plants, and in addition to competitive response, being able to evade the suppression,
encompasses the competitive ability of a species (Keddy 1998, Rosch et al. 1997).
Plants that are fast growing and are generally tall within their community have elevated
competitive effect scores. RCG was determined to have a score of 89% out of 100
(Keddy et al. 1998). The only other species that had a higher competitive effect score out
of the forty eight in this study were Bidens cernua (91%), a native species, yet considered
weedy by several weed references, and Lythrum salicaria (96%), an extraordinarily
aggressive invasive species. The study by Keddy et al. (1998) compared forty eight
wetland species and the competitive response of those species with a sward of species
(Acorus calamus, Lythrum salicaria, Typha angustifolia, Carex crinita, Penthorum
sedoides, Eleocharis smallii, and Scirpus acutus). RCG responded negatively to the
competition with a relatively low competitive response value.

63
If RCG has a high competitive effect score (the ability to suppress others), but a low
competitive response score (the ability to avoid being suppressed), a symmetrical species
which has a high score for both competitive effect and response may be able to out
compete RCG in certain field conditions. Scirpus microcarpus was not one of the species
included in the study and therefore, the competitive effect and response score for this
species is unknown.
RCG and SFB are both long lived perennials which are highly rhizomtatous, similar in
height, up to 2m for RCG, up to 1.5m for SFB, (Fern 2004) have similar rooting depth,
25 cm for RCG, 30 cm for SFB (Comes 1971, Azim et al. 2001) and similar specific leaf
area ratios (SFB blades 23–60 cm × 5–15 mm (Flora of North America) and RCG leaf
blades 10–35 cm × 10–18 mm and tapering (Flora of China)).
3.3 SCIRPUS MICROCARPUS BIOLOGY
Scirpus microcarpus is an obligate wetland herbaceous perennial sedge, predominately
found in freshwater wetlands. This species has two synonyms, S. sylvaticus and S.
rubrotinctus, (Guard 1995), and two varieties, Scirpus microcarpus var. longispicatus
and var. rubrotinctus, and three common names, Small fruited bulrush (Guard 1995),
Small flowered bulrush (Pojar and Mackinnon 1994) and Panicled bulrush (USDA,
NRCS 2007). As with the reed canarygrass, I will use the acronym of the common name
of the small fruited bulrush, SFB. SFB is found along the entire west coast throughout
the upper Midwest and in the Northeast (USDA, NRCS 2007). The plants may grow as
tall as 1.5 meters tall with plump, triangular stems arising from thick rhizomes (Pojar and
Mackinnon 1994). Small mammals, such as the wandering shrew, use this species for
cover (Ingles 1961), muskrat eat the seeds, while waterfowl, geese and swans consume
the shoots and rhizomes (Guard 1995). Unlike RCG, which has been the subject of
numerous research studies undertaken and articles written on biology and control, SFB is
generally only referred to in vegetation surveys and in species lists within a few articles

64
(Mallik et al. 2001, Jurries 2003, Lee et al. 2001, La Force et al. 2002, Schuller 2006,
Patterson and Cooper 2007, Treberg and Husband 1999, Schuyler 1976, Magee and
Kentula 2005, Mockler et al. 1998, Stevens and Vanbianchi 1993).
3.4 COMPETITION PROJECT DESCRIPTION AND OBJECTIVES
The objective of the greenhouse competition experiment was to determine if SFB is an
effective competitor with the aggressive, invasive RCG. An effective competitor was
defined as a species that negatively impacts the performance of its neighbor by limiting
growth. In this case, limiting growth is considered the reduction of above-ground and/or
belowground biomass of RCG when grown with SFB (with inter-specific competition)
versus with intra-specific competition. In this experiment, I looked at resource
competition. The ecosystem for the field experiment is a high resource ecosystem
(agricultural fields with drainage watercourses). This system experiences generally high
levels of nitrogen from fertilizer and livestock and high soil moisture levels close to the
watercourse and high levels of disturbance due to mowing and flooding. It is assumed
that the species with high relative growth rates will be the most effective competitor as
rapid growth would allow them to dominate the available space, produce more biomass
and acquire the most resources while doing so.
Along with the observations that the planted SFB was thriving and competing with RCG,
it was observed that SFB was most successful when placed closer to the watercourse and
within a site with higher nitrogen due to the adjacent livestock farm (Seebacher, personal
observation). The competitive ability of a species typically changes with differing
nutrient and environmental conditions, the neighboring species and developmental stage.
In addition to testing the competitive abilities of SFB with RCG, two soil moisture and
nitrogen regime treatments were tested. This allowed me to determine if SFB is as
competitive with RCG within a wide range of environmental and nutrient conditions or
only within particular conditions and therefore, more site specific.

65
The goal of this restoration project is to control RCG along and within watercourses on
agricultural land in King County. Within these systems, the RCG is mature, heavily
clonal and in most every case, a monoculture on the site. Hence, testing the competitive
abilities of the seedlings of these two species does not coincide with the current
conditions of many impacted sites nor the conditions found for the majority of the
restoration projects in the PNW. I therefore, used more mature bare-root plants for each
species for this experiment.
3.4.1. Competition Experiment Methods
Sixty SFB plants were purchased from Storm Lake Growers and 140 RCG plants were
collected from the field. The plants were chosen based on similarity in number of nodes
and rhizome length. Ten plants were randomly chosen for an initial dry weight analysis.
These data were compared with the mean dry weight analysis for each treatment at the
end of the study. Of the remaining plants, the RCG and SFB were randomly chosen for
each treatment (two soil moisture regimes plus two nitrogen regimes), the above-ground
stems were clipped at 10 cm and the plants were weighed. Past experience with planting
bare root RCG and SFB has shown that the above ground biomass (stem length) of the
plants can be quite variable and generally dies immediately after planting. It was
therefore, removed before weighing and planting. After weighing, the clipped plants
were assigned a number for tracking purposes. This information was used to determine if
there is a correlation between the initial fresh weight of each plant and the final biomass.
An additional tagging method was used within the control pots (RCG/RCG) where one of
the RCG plants was randomly chosen to be the RCG plant weighed at the end of the
experiment. Using bare-root plants that are of a similar size based on number of nodes,
root length, and same length of above ground biomass reduced the variation at the
beginning of the experiment. Randomly choosing which plants were placed in each
treatment provided a Gaussian distribution among the treatments.

66
Each two gallon pot with either two RCG plants or one RCG plant and one SFB plant
was placed independently within its own tray for watering and fertilizing. The trays were
placed in a complete randomized block design on a table within zone 2 of the CUH
greenhouse (~21◦C daytime, ~17◦C night, 14 hour photoperiod/1/8 full sunlight). There
were 10 blocks with one of each of the eight treatments placed randomly in each block
(Figure 3.1).
3.4.1.1. Treatments - Nutrient, Soil Moisture and Competition
The high nitrogen level for this experiment was 66.08 mg per kg (mean from three
samples with the NH4 and NO
3 added together from the site) based on soil samples from
the livestock site in Woodinville. The low nitrogen level was 9.46 mg per kg based on
soil samples from the “natural” site in Duvall.
For the high soil moisture regime, the water level within the tray was kept at a depth of
~2.5 cm. The low soil moisture regime was determined by averaging the precipitation
data from the Monroe and Tolt South Fork Reserve weather stations (Monroe for its
proximity to the Sammamish sites and Tolt for its proximity to the Snoqualmie site). I
used the data for typical summer months, June through August, averaged over the last six
years, from 2000 through 2005. The average rain per day for the two sites was 2.15mm.
Adjusting this to the surface area of the pots used for this experiment allows for 800 mL
of water per week for the low soil moisture treatment watering regime.
The plants were planted immediately after receiving. Two RCG plants were planted per
pot (two gallon pots) for the control pots and one RCG plus one SFB plant were placed
together for the competition treatment (two gallon pots). The soil moisture and nitrogen
treatments were applied once each week. The plants were grown together for 22 weeks.
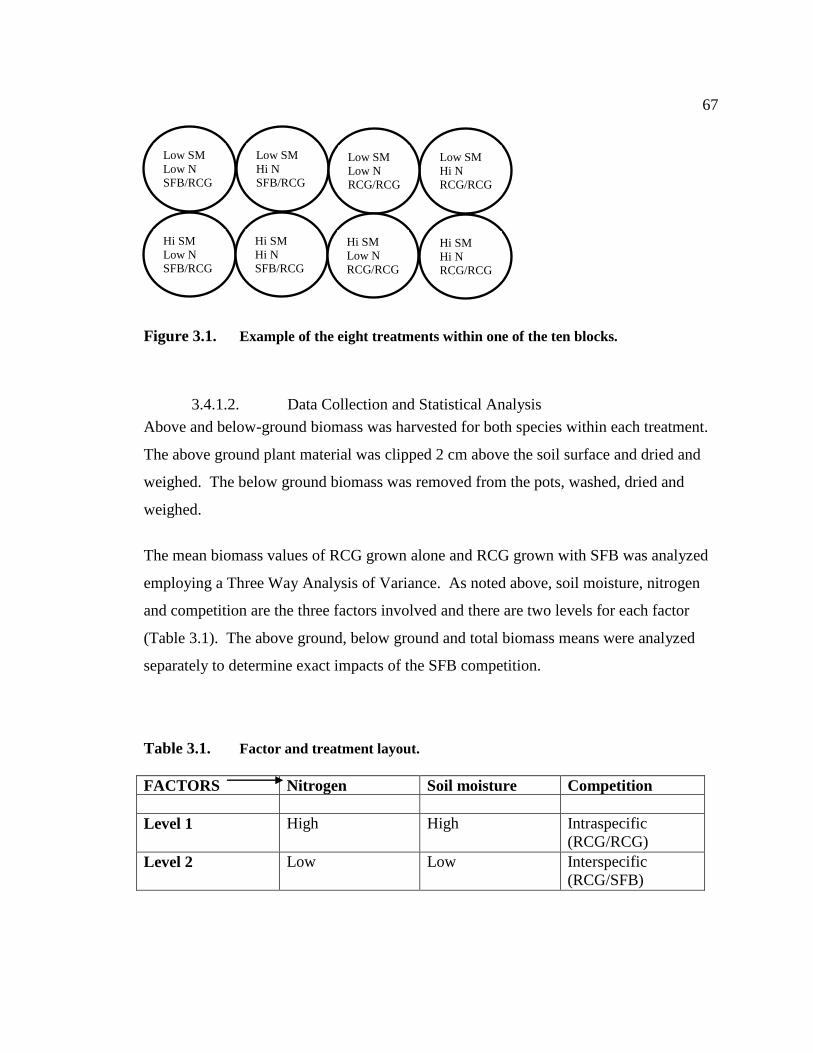
67
Figure 3.1. Example of the eight treatments within one of the ten blocks.
3.4.1.2. Data Collection and Statistical Analysis
Above and below-ground biomass was harvested for both species within each treatment.
The above ground plant material was clipped 2 cm above the soil surface and dried and
weighed. The below ground biomass was removed from the pots, washed, dried and
weighed.
The mean biomass values of RCG grown alone and RCG grown with SFB was analyzed
employing a Three Way Analysis of Variance. As noted above, soil moisture, nitrogen
and competition are the three factors involved and there are two levels for each factor
(Table 3.1). The above ground, below ground and total biomass means were analyzed
separately to determine exact impacts of the SFB competition.
Table 3.1. Factor and treatment layout.
FACTORS Nitrogen Soil moisture Competition
Level 1 High High Intraspecific
(RCG/RCG)
Level 2 Low Low Interspecific
(RCG/SFB)
Low SM
Low N
SFB/RCG
Hi SM
Low N
SFB/RCG
Hi SM
Hi N
RCG/RCG
Low SM
Hi N
SFB/RCG
Hi SM
Hi N
SFB/RCG
Low SM
Hi N
RCG/RCG
Low SM
Low N
RCG/RCG
Hi SM
Low N
RCG/RCG
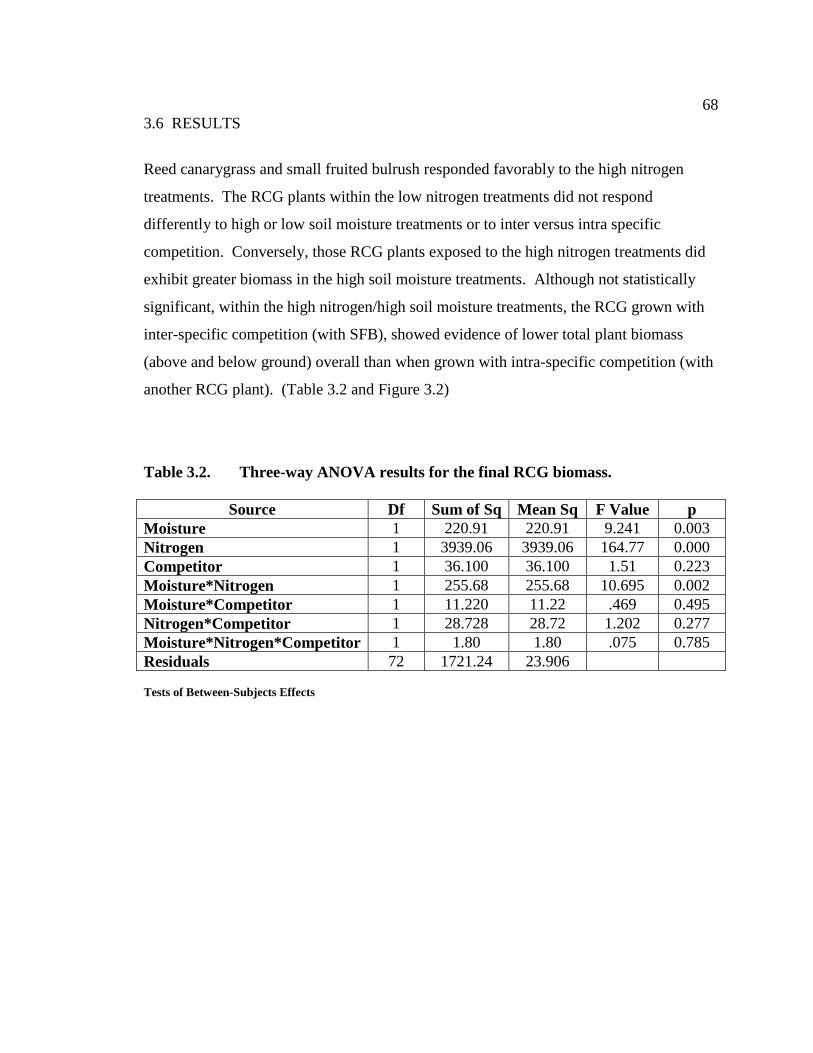
68
3.6 RESULTS
Reed canarygrass and small fruited bulrush responded favorably to the high nitrogen
treatments. The RCG plants within the low nitrogen treatments did not respond
differently to high or low soil moisture treatments or to inter versus intra specific
competition. Conversely, those RCG plants exposed to the high nitrogen treatments did
exhibit greater biomass in the high soil moisture treatments. Although not statistically
significant, within the high nitrogen/high soil moisture treatments, the RCG grown with
inter-specific competition (with SFB), showed evidence of lower total plant biomass
(above and below ground) overall than when grown with intra-specific competition (with
another RCG plant). (Table 3.2 and Figure 3.2)
Table 3.2. Three-way ANOVA results for the final RCG biomass.
Source Df Sum of Sq Mean Sq F Value p
Moisture 1 220.91 220.91 9.241 0.003
Nitrogen 1 3939.06 3939.06 164.77 0.000
Competitor 1 36.100 36.100 1.51 0.223
Moisture*Nitrogen 1 255.68 255.68 10.695 0.002
Moisture*Competitor 1 11.220 11.22 .469 0.495
Nitrogen*Competitor 1 28.728 28.72 1.202 0.277
Moisture*Nitrogen*Competitor 1 1.80 1.80 .075 0.785
Residuals 72 1721.24 23.906
Tests of Between-Subjects Effects
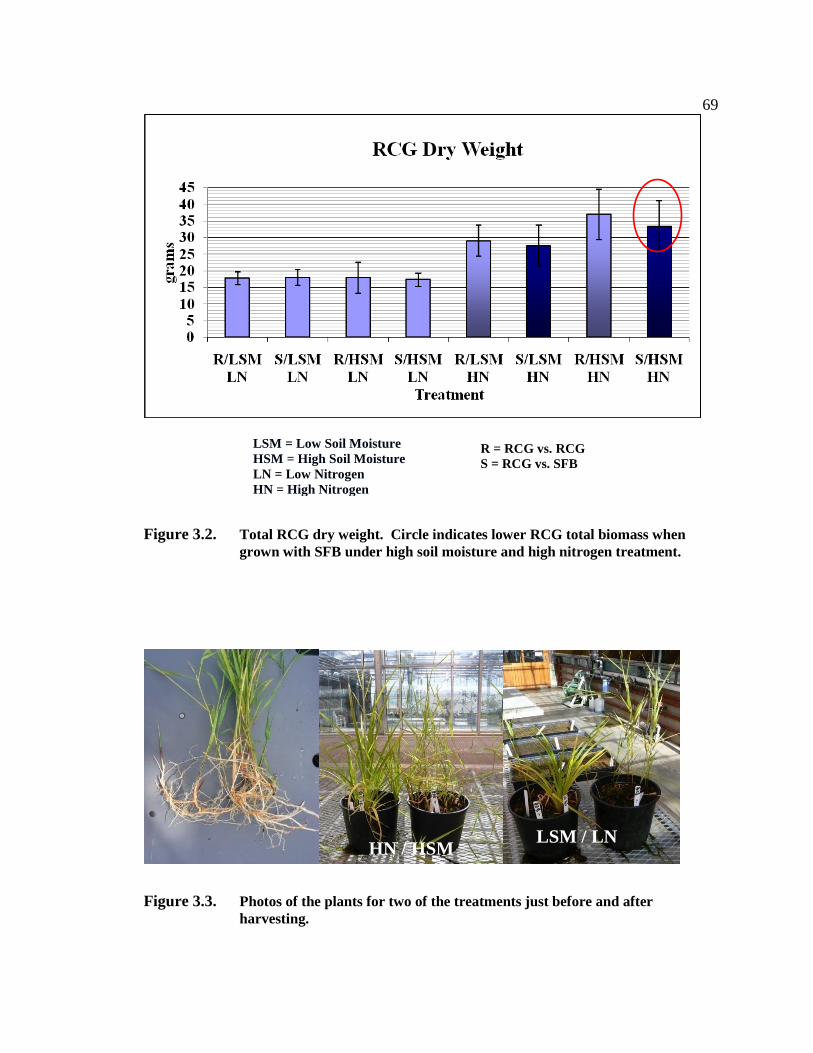
69
Figure 3.2. Total RCG dry weight. Circle indicates lower RCG total biomass when
grown with SFB under high soil moisture and high nitrogen treatment.
Figure 3.3. Photos of the plants for two of the treatments just before and after
harvesting.
R = RCG vs. RCG
S = RCG vs. SFB
HN / HSM LSM / LN
LSM = Low Soil Moisture
HSM = High Soil Moisture
LN = Low Nitrogen
HN = High Nitrogen
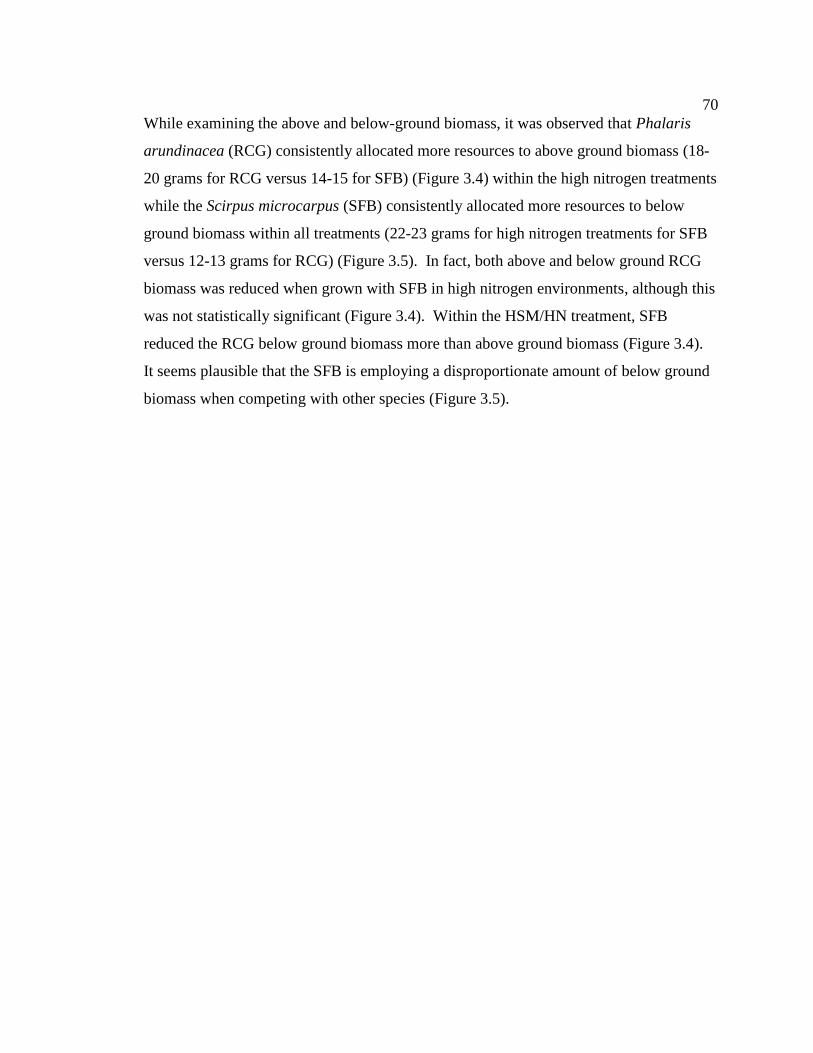
70
While examining the above and below-ground biomass, it was observed that Phalaris
arundinacea (RCG) consistently allocated more resources to above ground biomass (18-
20 grams for RCG versus 14-15 for SFB) (Figure 3.4) within the high nitrogen treatments
while the Scirpus microcarpus (SFB) consistently allocated more resources to below
ground biomass within all treatments (22-23 grams for high nitrogen treatments for SFB
versus 12-13 grams for RCG) (Figure 3.5). In fact, both above and below ground RCG
biomass was reduced when grown with SFB in high nitrogen environments, although this
was not statistically significant (Figure 3.4). Within the HSM/HN treatment, SFB
reduced the RCG below ground biomass more than above ground biomass (Figure 3.4).
It seems plausible that the SFB is employing a disproportionate amount of below ground
biomass when competing with other species (Figure 3.5).
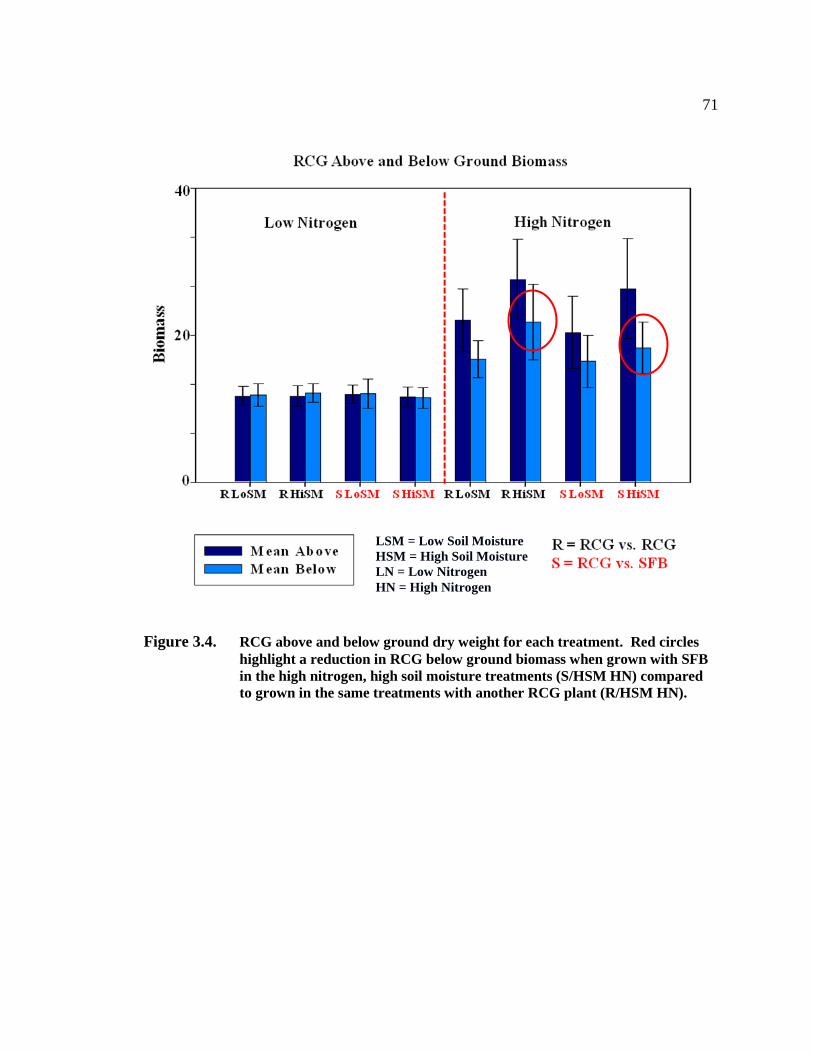
71
Figure 3.4. RCG above and below ground dry weight for each treatment. Red circles
highlight a reduction in RCG below ground biomass when grown with SFB
in the high nitrogen, high soil moisture treatments (S/HSM HN) compared
to grown in the same treatments with another RCG plant (R/HSM HN).
LSM = Low Soil Moisture
HSM = High Soil Moisture
LN = Low Nitrogen
HN = High Nitrogen

72
LSM = Low Soil Moisture
HSM = High Soil Moisture
LN = Low Nitrogen
HN = High Nitrogen
Figure 3.5. SFB above and below ground dry weight for each treatment.

73
3.6 DISCUSSION AND CONCLUSIONS
Both species in this study responded negatively to the low nitrogen treatments, whether
grown with high or low soil moisture or with inter or intra specific competition. SFB did
show slightly higher biomass levels under low nitrogen/low soil moisture treatments, but
did not suppress RCG under these conditions any more than the RCG plant grown with
intra-specific competition.
An interaction effect between the nitrogen and soil moisture treatments was due to the
nitrogen level impacts on soil moisture, ie., the soil moisture level impacted the resulting
plant biomass only within the high nitrogen treatments.
A similar study by Perry et al. (2004) provided a different result. In their study, they
enriched the soil with carbon, reducing available nitrogen and then added four NH4-N
treatments up to 1.25 grams per week (the high nitrogen treatment for my study was 66
milligrams for comparison). They found that the native sedge they tested, Carex
hystericina (bottlebrush sedge) was successful at competing with RCG when grown from
seed in a carbon enriched soil, reducing the RCG biomass by 82%. When both species
were grown together in soil that was not enriched with carbon and at the highest nitrogen
treatment level noted above, RCG suppressed the bottlebrush sedge by 91% (Perry et al.
2004).
The difference in results could be due to the fact they there were comparing the two
species grown from seed whereas in my study, I tested two species grown from bare root
specimens, which is more indicative of the conditions one would find in restoration
projects in the field. Additionally, SFB may not have the same nitrogen uptake efficiency
under nitrogen poor conditions as does the sedge tested in the above mentioned study and
therefore may be less able to provide the suppression of RCG. Carex hystericina tested
had an uptake efficiency almost twenty times greater than RCG nitrogen uptake
efficiency in the lower nitrogen level treatments (Perry et al. 2004).
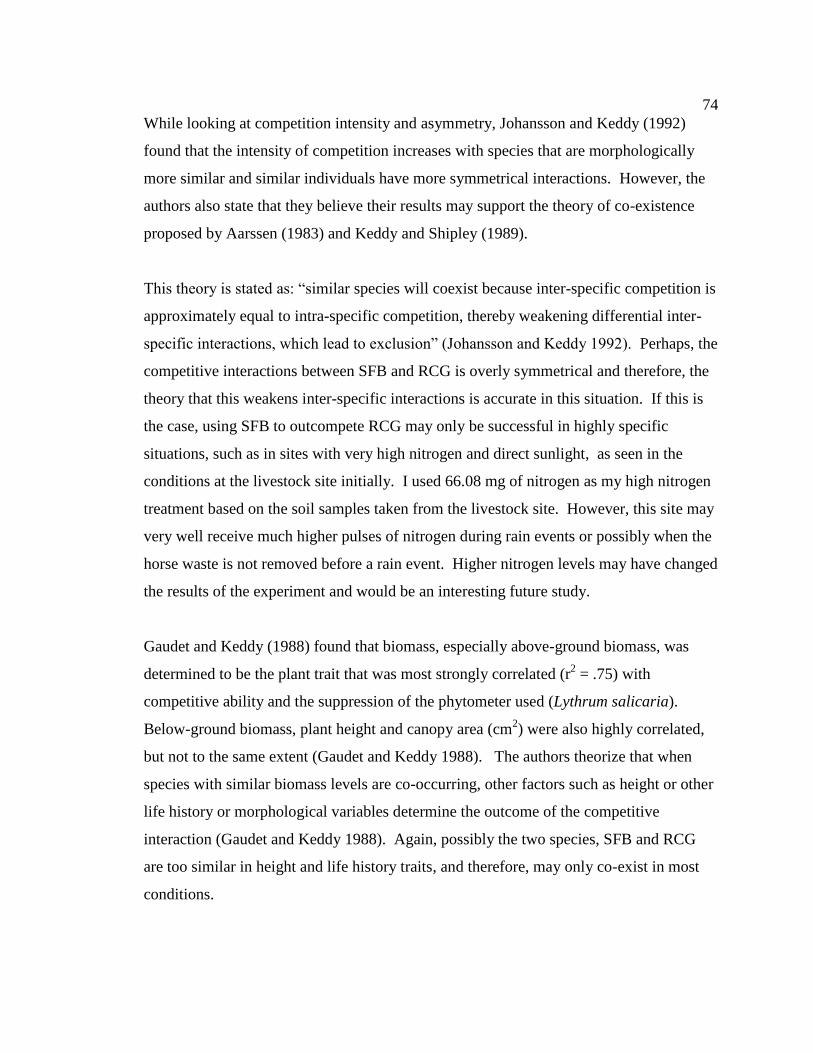
74
While looking at competition intensity and asymmetry, Johansson and Keddy (1992)
found that the intensity of competition increases with species that are morphologically
more similar and similar individuals have more symmetrical interactions. However, the
authors also state that they believe their results may support the theory of co-existence
proposed by Aarssen (1983) and Keddy and Shipley (1989).
This theory is stated as: “similar species will coexist because inter-specific competition is
approximately equal to intra-specific competition, thereby weakening differential inter-
specific interactions, which lead to exclusion” (Johansson and Keddy 1992). Perhaps, the
competitive interactions between SFB and RCG is overly symmetrical and therefore, the
theory that this weakens inter-specific interactions is accurate in this situation. If this is
the case, using SFB to outcompete RCG may only be successful in highly specific
situations, such as in sites with very high nitrogen and direct sunlight, as seen in the
conditions at the livestock site initially. I used 66.08 mg of nitrogen as my high nitrogen
treatment based on the soil samples taken from the livestock site. However, this site may
very well receive much higher pulses of nitrogen during rain events or possibly when the
horse waste is not removed before a rain event. Higher nitrogen levels may have changed
the results of the experiment and would be an interesting future study.
Gaudet and Keddy (1988) found that biomass, especially above-ground biomass, was
determined to be the plant trait that was most strongly correlated (r2 = .75) with
competitive ability and the suppression of the phytometer used (Lythrum salicaria).
Below-ground biomass, plant height and canopy area (cm2) were also highly correlated,
but not to the same extent (Gaudet and Keddy 1988). The authors theorize that when
species with similar biomass levels are co-occurring, other factors such as height or other
life history or morphological variables determine the outcome of the competitive
interaction (Gaudet and Keddy 1988). Again, possibly the two species, SFB and RCG
are too similar in height and life history traits, and therefore, may only co-exist in most
conditions.

75
I found that SFB consistently produced more below-ground biomass over all
treatments and less above ground biomass over all treatments than RCG. RCG did the
opposite, at least in the high nitrogen treatments, producing more above-ground biomass
than below-ground. Conceivably, the limitation of the pots in the greenhouse did not
allow the SFB to produce sufficient below ground biomass to support additional growth
above ground to effectively compete with RCG as this species did in the field for the first
two seasons.
Small fruited bulrush competition impacted the RCG total plant biomass within the high
nitrogen/high soil moisture treatment, although the difference was not statistically
significant. These results also contradict a study by Green and Galatowitsch (2002)
where total shoot and root biomass of the native community was suppressed by RCG, at
all three levels of nitrogen used.
The SFB planted at the Agriculture site thrived and competed effectively with RCG,
especially in the first season of this experiment, (Figure 3.6B) and even more so at the
Livestock site during the 2005 season, (Figure 3.6A). These observations prompted the
controlled competition experiment in the greenhouse. However, after several years, the
shade from the surrounding vegetation and RCG on the other side of the bank seemed to
negatively impact the SFB.
Grime (1977) would consider RCG to be a C-selected species or a competitive species.
This study contradicts Grimes’ hypothesis that regardless of environmental conditions,
species that exhibit competitive characteristics produce a greater amount of biomass. SFB
produced more below ground biomass under the low nitrogen, low soil moisture
treatments, yet SFB may be considered a C-selected species as well.
RCG possesses other attributes that are typical for Grimes’ competitive species. These
attributes include: early growth in the late winter; along with rapid expansion of stems
and leaf canopy due to the mobilization of carbohydrate reserves from the previous

76
season. Coops et al. (1996) found that RCG allocates more resources to below ground
biomass when grown in dense vegetative cover adding to the belowground biomass.
These traits provide the plant a competitive advantage from the additional height and
canopy produced early in the season (Grime 1979) and additional carbohydrate reserve to
draw from (Coops et al. 1996). This could also explain the initial domination by the SFB
at the livestock site but then the drop in SFB and increase of RCG three years later.
Even with the contradictory results, I recommend using SFB in certain re-vegetation
situations. The livestock site received higher nitrogen levels than what was found at the
other two sites and was the only site where the plots were facing south, getting direct, full
sunlight throughout the day. Since SFB is a shade intolerant species, only using this
species for restoring watercourses in situations where this emergent would be able to get
full sunlight within high nitrogen environments is recommended.
Additionally, herbaceous wetlands, also referred to as Palustrine emergent wetlands by
Cowardin et al. (1979) are in serious decline nationally and within the Pacific Northwest.
Although protected federally by the Section 404 of the Clean Water Act and in
Washington State by the Shoreline Management Act and State Water Pollution Control
Act (Granger et al. 2005), emergent wetlands have been extensively filled and drained for
development, farming and for livestock. Excessive loss of acreage by non-native species
invasions adds to this loss of acreage. Restoring impacted wetlands with woody
vegetation in order to control exotics only exacerbates the loss of herbaceous wetlands by
creating forested wetlands in their place. Adding emergent species to the re-vegetation of
these agricultural watercourses would allow for the intended diversity one could obtain
from multiple canopy layer situations.
77
A. B.
Figure 3.6. A. Scirpus microcarpus growth at the Livestock site in 2005.
B. Scirpus microcarpus growth at the Agriculture site in 2004.
78
CHAPTER 4. PHALARIS ARUNDINACEA CARBOHYDRATE RESERVES
4.1 INTRODUCTION
Perennial grasses use underground storage organs for absorption of water and nutrients,
stabilization of the plant, storing nutrient reserves for winter survival, and for the initial
growth in the spring and re-growth after grazing (Weinmann 1948, White 1972). This
energy source is used for new growth until there is sufficient photosynthesis available for
the respiration of the plant (White 1973). Many researchers agree that the total available
carbohydrates (TAC) within the belowground biomass of a weedy perennial is the best
way to gauge the fitness of the plant with regard to managing environmental conditions
and control techniques by humans (Comes 1971).
Weinmann, 1947 clarifies the term total available carbohydrates to be those
carbohydrates used by the plant “as a source of energy or as building material, either
directly or indirectly after having been broken down by enzymes.” Total Nonstructural
Carbohydrates (TNC) is considered to be those carbohydrates that are immediately
available to the plant, mobilized for metabolism or translocated throughout the plant
(Smith 1969). Smith (1969) prefers the term total nonstructural carbohydrates (TNC) as
it is applicable for both plant and animal researchers.
4.2 CARBOHYDRATE STORAGE AND UTILIZATION
Those carbohydrates that are considered to provide the majority of reserves, the
nonstructural carbohydrates are the reducing sugars (glucose and fructose), a non-
reducing sugar (sucrose) and the fructosans and starches (White 1973). Fructose and
glucose are monosaccharides, while sucrose and maltose are disaccharides, all of which
are the prevailing sugars found in grasses. The storage carbohydrates, starches and

79
fructosans, are nonstructural polysaccharides (Smith 1969). The structural
carbohydrates which do not supply significant reserves include hemicellulose, the
pentosans and hexosans, and cellulose (White 1973).
In general, the prevailing reserve constituent for temperate region grasses are sucrose and
fructosans and sucrose and starch for tropical grasses (White 1973). In addition to the
Poaceae, fructans are also the main reserve constituent of the Compositae (Duffus and
Duffus 1984).
In plants, carbohydrates are typically transported as sucrose while in animals
carbohydrates are transported as glucose. It is believed that this is due to the fact that
sucrose is “less reactive and less easily metabolized than glucose” and therefore, not as
easily metabolized during herbivory by the herbivore or other stressful event by the
plants enzymes (Duffus and Duffus 1984). The degradation of these polysaccharides for
use by the plant takes place through various enzymes, particularly fructan and other
polysaccharide hydrolases. Regulation of this degradation by the numerous enzymes is
usually determined by either pH, phosphate concentration and/or light activation (Duffus
and Duffus 1984).
The chief storage regions for these grasses are not necessarily only in the underground
organs, but also in the stem bases which include the rhizomes, stolons and corms.
Although the nonstructural carbohydrates can be stored in all plant parts provisionally
(White 1973).
Several grass species demonstrate a noticeable diurnal variation of carbohydrate reserves,
increasing during the day to a highest point just before sunset and are at a lowest point
just before sunrise. Seasonal variation of these reserves vary by species. For instance,
many species with a low reserve level a month or so after first emergence obtain the
lowest reserve level during or after seed ripening. The seasonal variation as well as the
reserve rate are dependent on environmental conditions such as water and nutrient

80
availability and temperature in addition to the development stage of the given plant
(White 1973).
Temperate grass species and tropical grass species have different optimum growth and
photosynthesis temperature levels. Optimum temperate species temperatures are 20 –
25○ C and for tropical species, temperatures of 30 to 35
○ C are the most favorable. This
dissimilarity is based on the different temperature optima of the major CO2 fixing
enzymes involved, given that tropical grasses contain both C3 and C4 pathways and the
temperate grasses possess only C3 pathways (White 1973).
4.3 PHALARIS ARUNDINACEA RHIZOME CARBOHYDRATE STORAGE
Several researchers have determined that the predominate polysaccharide reserves for
reed canarygrass (RCG) are fructosans (Smith 1968, Reinhardt 2004). Smith (1968)
specified that longchain fructosans prevail in RCG, however, many species that
accumulate fructosans in this manor tend to contain short chain molecules during the time
in the storage cycle where the TNC’s are at their lowest point. Fructosans are fructose
polymers found in two forms, inulins and levans, containing a terminal glucose residue
and are water soluble (Smith 1969).
Reed canarygrass rhizomes predominately originate from buds at the nodes of other
rhizomes below the soil surface. In a study from northern Ohio, new shoots for this
species develop early in the season, around April and May in the mid-west, probably
earlier here in the PNW, and in August until the end of the season. The shoots which
developed early in the season are from rhizomes which developed late the prior year.
Rhizomes which developed in mid season, such as May and June terminate into shoots
that same season. New rhizome growth reached a maximum, double of any other month,
in June of each year during this study as seen also by Evans and Ely (1935).

81
The rhizomes of RCG originate at a bud and grow outward, then turning upward to the
surface producing an aboveground shoot. At this point, a new rhizome develops from a
bud near the tip of the original rhizome or from a leaf axil and tends to grow in the same
direction as the older one and a third rhizome also follows this same pattern. When
comparing rhizome growth of five different species, one of which was RCG, Evans and
Ely (1935) found that quackgrass was superior in the final diameter of the plant and
rhizome length, showing the relationship between rhizome length and the area occupied
by the plant. However, reed canarygrass was found to make up for less length by
developing seven orders (number of branching events from the original rhizome) of new
rhizomes during which most of the other species only formed four orders of rhizomes
(Evans and Ely 1935). This may also explain the substantial density of the rhizome mass
of reed canarygrass.
Restoration of wetlands invaded by RCG is particularly problematic as this species is
extremely difficult to eradicate or control. In addition to the highly competitive nature of
RCG and other plant characteristics described in Chapter One, the predisposition of the
rhizomes to persist with stored energy and produce new shoots after treatment makes
control exceptionally arduous (Lyons 2002, Apfelbaum and Sams 1987, Lavergne and
Molofsky 2004, Reinhardt 2004). The ability to store the nonstructural carbohydrates in
the rhizomes also allows RCG to successfully overwinter and produce new tillers early
the next season as well as continue productivity later in the season, which increases the
competitiveness of this species (Lavergne and Molofsky 2004). This mat of rhizomes
can also produce a sod layer up to ½ a meter thick, making the establishment of native
species challenging (Tu 2004). Additionally, the energy stored allows for the new tillers
to actually lift and break through standard weed fabrics permitting continued growth of
the plant from underneath.
Depleting the carbohydrate storage capacity of the RCG rhizomes is vital. Reducing the
capability of the rhizomes to produce new plants after mechanical or chemical treatment
would be advantageous for wetland restoration projects throughout western Washington.

82
The objective of this project is to determine how long a land manager should cover
RCG rhizomes with opaque material for complete depletion of the carbohydrate reserves
before removing the material for planting or before planting within the material.
4.4 CARBOHYDRATE RESERVE PROJECT DESCRIPTION
4.4.1 Carbohydrate Reserve Project Methods
Reed canarygrass rhizomes were analyzed for total nonstructural carbohydrate (TNC)
reserves, or fructosans. Samples were taken during mid June of 2005 during anthesis,
when the reserves are at their lowest point (Comes 1971, Reinhardt and Galatowitsch
2004). Forty-five rhizome samples of similar length and weight were randomly chosen
and removed from the agriculture site.
Five gallon containers were placed in holes that had been excavated at the agriculture
site, with the top of the containers level with the surrounding soil. The forty five
rhizomes were placed within sterile potting soil in two gallon containers set within the
five gallon containers with a root barrier placed at the bottom of the larger container so
that any roots or rhizomes from potential growth could not escape. A thick, dense fabric
was placed on top to inhibit any photosynthesis and stakes were used around the edges of
the fabric. Fifteen samples were removed after three months and frozen. Another fifteen
samples were removed after six months and the last fifteen after nine months and was
stored in a frozen condition below 0○ C.
A Fructan Assay Kit was obtained from Megazyme International Ireland Ltd., Wicklow,
Ireland. This kit includes sucrose, fructanase, fructan control flour, sucrose control flour,
and fructose standard solution. Additional chemicals required were ingredients for two
buffers, a sodium maleate buffer and a sodium acetate buffer and several reagents; a
PAHBAH reducing sugar assay reagent and alkaline borohydride (Megazyme Intl.
2004).

83
The samples were removed from the freezer, rinsed and dried at 70○
C in a forced air
oven at the Center for Urban Horticulture to a constant weight. The rhizomes were
ground in a Wiley mill with a 0.5 mm screen for analysis. The samples for each of the
three time frames (3,6,9 months) were combined and 10 replicates were analyzed for
each time frame. Randomly selected samples were used to calibrate the NIRS identifying
fructosan specific wavelength spectra.
The Megazyme kit employs purified enzymes to hydrolyse sucrose, starch and fructans.
The sucrase enzyme “hydrolyses sucrose but has negligible activity on I-kestose and
other fructo-oligosaccharides.” The final reading solution is measured with the near-
infrared spectrophotometer (NIRS) at the absorbance level of λ= 409.64 nm (Megazyme
International Ireland Ltd., Wicklow, Ireland). The data were then calculated with the
following equation: A x F x 5 x V s 1.1/0.2 x 100/W x 1/1000 x 162/180
Where: A = sample absorbance – sample blank absorbance (read against reagent
blank)
F = factor to convert absorbance values to μg of D-fructose (54.5 μg D-fructose) /
(absorbance for 54.5 μg D-fructose)
5 = factor to convert from 0.2 mL as assayed to 1.0 mL
V = volume (mL) of extractant used
1.1/0.2 = 0.2 mL was taken from 1.1 mL of enzyme digest for analysis
W = weight (mg) of sample extracted
100/W = factor to express fructan as a percentage of flour weight
1/1000 = factor to convert from μg to mg
162/180 = factor to convert from free
D-fructose, as determined, to anhydrofructose (and anhydroglucose), as occurs in fructan
This analysis took place at the Center for Urban Horticulture, University of Washington.

84
4.5. CARBOHYDRATE RESERVE PROJECT RESULTS
The results indicate an extensive variation of the fructosan levels within the rhizomes
which were covered for three months among ten replicates analyzed. Five replicates
were able to be analyzed for the six month batch and three replicates for the nine month
batch. The average percent of fructosans for those rhizomes covered for three months is
2.25%, for the six month rhizomes, 1.65% and for the nine month rhizomes, 0.773%
(Figure 4.1).
Figure 4.1. Average Percent Fructosan Level for three, six and nine months.
Due to the variability among individuals, the R2 value of the regression of fructosan
levels over time is very low (R2 - 0.1262) (Figure 4.2).

85
Figure 4.2. Percent Rhizome Fructosan Levels for three, six and nine months.
One rhizome sample within the six month batch was almost black after being removed
from the field, while every other rhizome was tan or tanish pink. I read this sample out of
curiosity. It did indeed give me a skewed fructosan result with a negative number of
-0.18. After removing this sample as it was obviously a dead rhizome that had desiccated
in the field, the R value decreasing further to a 0.11 (Figure 4.3). Also, after removing
the dead rhizome, the means of the three and six month samples become equal at 2.25%
compared to the 0.77% for nine month sample.

86
Figure 4.3. Percent Rhizome Fructosan Levels for three, six and nine months after
removing the dead rhizome (negative) data point.
Log transforming the data does not improve the R value (R2=
.2) indicating that the
variability is too high and there are not enough data to show a significant non-linear fit of
the data to the line. However, log transforming the data for a Single Factor Analysis of
Variance test (Single Factor ANOVA, df = 2, p = 0.08) indicated the lack of a difference
between the three month mean and the six month mean. Yet, there is enough of a
difference between the three and six month mean when compared to the nine month mean
to provide a p-value that is marginally significant (Figure 4.4).
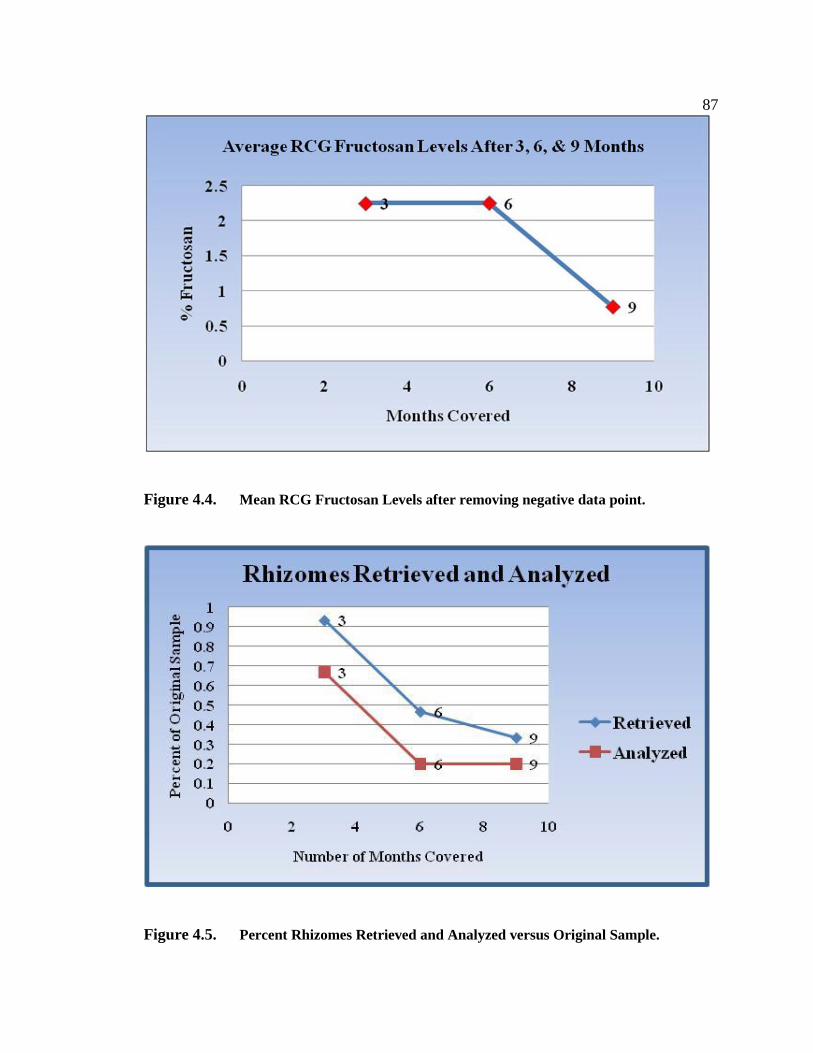
87
Figure 4.4. Mean RCG Fructosan Levels after removing negative data point.
Figure 4.5. Percent Rhizomes Retrieved and Analyzed versus Original Sample.
88
4.6. CARBOHYDRATE RESERVE PROJECT DISCUSSION
One six month sample, replicate number two was considered an outlier with a value of
18.16% fructosans and was removed as it meets the standards of outliers for regressions,
with eleven standard deviations above the mean. When examining the raw data for this
sample, the sample absorbance was 1.5089% and 1.4635% which was much higher than
every other sample absorbance in this experiment, ranging from 0.001 to 0.6 percent. All
of the other rhizome samples that were analyzed in the same batch as this sample, with
the same fructose and sucrose cellulose and 4D-Fructan standards, were normal.
Reinhardt (2004) analyzed RCG rhizomes every two weeks throughout the growing
season in Minnesota to determine the seasonal variation and the most favorable time for
herbicide application. As with many perennial species, the pattern of RCG reserves
illustrated a decrease early in the season as the new shoots developed, followed by a
leveling off in reserves as the plant matured and increased photosynthesis levels. Each
year showed a marked decrease in reserves in early July at which point the plants were
flowering and setting seed. At the end of July, the reserves began to increase until the
end of the season. All three years strongly varied in the levels of carbohydrate content
for Reinhardt’s study, yet the carbohydrate levels followed a similar pattern. The
rhizome content at flowering was estimated to be ~5% for the year 2000, ~ 33% for the
year 2001, and ~17% for the year 2002 (Reinhardt 2004).
Comes (1971) also found the lowest seasonal carbohydrate level for RCG took place at
the time of anthesis, increasing gradually in the fall. While looking at the TAC levels in
the roots and rhizomes of RCG for plants treated with herbicide versus plants that were
not treated, the untreated plants averaged between 26 and 33% of the total dry matter. It
should be noted that this researcher used a different extraction method, sulfuric acid
solution and it is therefore, difficult to compare the TAC levels with the levels that I
obtained.

89
Although a decreasing trend in fructosan levels was observed over time, there was no
significant difference between the three time periods that the rhizomes were covered.
However, when averaging the data points for each of the three time frames, there is a
significant drop in fructosan levels after the six month time frame from just over two
percent to just under one percent for those rhizomes covered for nine months. The
rhizome carbohydrate levels seem to persevere through the first six month period but
after that time frame, when removed from the parent clone, the fructosan levels begin to
drop consistently.
RCG rhizome health diminished as time separated from the parent clone passed from
three months to nine months. The number of rhizomes found in the pots decreased over
time, and the size of many of the rhizomes found dwindled from ~ten cm long with
several nodes to some less than half of the original size (Figure 4.5).
The degradation of the rhizomes once separated from the clone indicates that tilling the
rhizomes seems to weaken their ability to survive over time, especially when keeping the
rhizomes from exposure to solar radiation. The reduction in rhizome numbers and size
may indicate that the wounds caused by breaking apart the rhizome mat may permit entry
of microorganisms which in turn could instigate decay of the rhizome. This type of
infection is well known with wounds in the bark of trees potentially causing the death of
the individual (Harris et al. 1999).
Additionally, the propensity of a rhizome fragment to degrade without the connection to a
parental clone may signify that the connections are important during periods of stress.
The connection would allow for the rhizome or ramet to draw from a larger resource
supply permitting endurance rather than disintegration as with stressed isolated
individuals (Tomasko and Dawes 1989). When examining the TNC levels in grazed and
un-grazed Carex lyngbyei by Canadian geese, Crandell (2001) did not find a significant
difference between the samples. She noted that overall belowground biomass may be a
better indicator of fitness than TNC concentrations. In other words, the sum of

90
carbohydrate reserves available to the RCG clone from the entire rhizome biomass
may be more significant than the concentration of reserves. If this is accurate, removing
the rhizomes from the parent clone and reducing the size of the rhizome material is
paramount in winning the battle with RCG domination due to rhizome re-growth after
typical control methods such as mowing or herbicide treatments.
The results from this project support that covering the tilled rhizomes for at least one year
without disturbance or degradation of the shade material should significantly reduce the
viability of the RCG rhizomes in the soil and most rhizomes should be completely
depleted of fructosans. This should allow for the re-vegetation of the site with
significantly reduced competition from reed canarygrass rhizome regeneration.
91
CHAPTER 5.0 CONCLUSIONS AND RECOMMENDATIONS
A flooding event took place in 1999 in which numerous salmon became trapped within
agricultural and rural man made and/or maintained watercourses filled with the
aggressive invasive plant, Phalaris arundinacea (reed canarygrass). This invasive also
creates monocultures in riparian areas displacing native plants. Much of this agricultural
and grazing land lies within river valleys and floodplains connected via these
watercourses to major river systems within western Washington, most of which sustain
salmon and trout (Washington Dept of Fisheries et al. 1993). Reed canarygrass (RCG)
biomass and dominance in these watercourses is likely augmented by the nitrogen
enriched agricultural runoff (Green and Galatowitsch 2002, Kercher and Zedler 2004).
The accumulation of RCG biomass and subsequent sediment also cause flooding of the
nearby agricultural fields increasing the practice of dredging. This escalation of
disturbance by the landowner decreases habitat quality for native wildlife, invertebrates
and fish as well as increasing the ability of RCG to flourish as shown by Kercher and
Zedler (2004).
Two of the treatments tested in this research project were successful in reducing the RCG
biomass on the site and re-establishing a vegetated riparian buffer dominated by native
wetland species. As Blumenthal et al. (2003) found in prairie systems and Davis (2000)
found in wetland systems, the application of mulch as a nitrogen reducer and invasive
plant suppressor was significant. The hogfuel added, densely planted willow treatment
and hogfuel added and the densely planted multi-canopy treatment (RCG barrier) reduced
the returning RCG biomass by 64% and 56% respectively compared to the control RCG
stem counts. The RCG barrier alone treatment was different than the controls and
therefore, adding the hogfuel delivered the additional weight and solar radiation reduction
necessary to suppress RCG re-growth.

92
The red cedar hogfuel did show allelopathic tendencies in the greenhouse, however
whether allelopathy played a role in the reduction of the returning RCG count in the field
was not tested.
Two species in particular were found to be reasonably competitive in the field with RCG,
Salix sitchensis and Scirpus microcarpus. During the first two years of the research
project, it was observed that Scirpus microcarpus, (small fruited bulrush (SFB)) covered
almost the entire half of the plot next to watercourse at the livestock site and successfully
straddled the watercourse, yet in a thinner band at the agriculture site. After testing for
competitive interactions with RCG in a controlled setting, the results were too variable to
obtain statistically significant results. However, positive trends were certainly observed
within the high nitrogen treatments with a notable reduction of RCG total biomass. In
situations with high nitrogen and sunlight, using SFB in emergent wetland restoration
projects is suggested. As noted in Chapter Three, the competitive interactions between
SFB and RCG may be overly symmetrical and SFB may only outcompete RCG in
specific situations, but in the very least, SFB should be able to co-exist with RCG
retaining space in the wetland for a native emergent.
Salix willow stakes (Salix sitchensis) planted densely at 0.5 meter centers within the
hogfuel was the most successful treatment overall for this study for two of the three sites.
Kim et al. (2006) also found significant results when testing Salix lasiandra and Salix
scouleriana competitively against RCG at the 0.60 and 0.91 meter spacing. These
treatments reduced the RCG biomass by 68% and 56% respectively.
Two of my field sites were impacted heavily by the willow borer (Cryptorhynchus
lapathi). Ewing (personal communication, 2008) also affirmed that willows used in
restoration projects at the University of Washington’s Union Bay Natural Area have been
attacked by the willow borer. Newly emerged adults consume the bark, primarily of
young stems. In the larvae stage, this weevil bores into the bark, wood and into the pith
of the tree, for feeding excavating tunnels (Rosetta 2006). This causes many of the
93
branches and in some cases, the entire main stem to break completely off of the tree.
However, these willows are so robust that most grew back, with dense low branches. It
took two years for the trees to get as tall as they were before the attack at the sites in this
study, yet, it only took about a year for the trees at the UW UBNA site. The non-native
willow borer is something to consider when using willows for RCG control and
restoration projects. Furthermore, several of the landowners considered the willows to be
quite “weedy” within the watercourses and difficult to eradicate (Galoach personal
communication 2008, Quigley personal communication 2005, Calhoun personal
communication 2005).
Carbohydrate reserves seem to vary for the first six months, yet after nine months of
being covered by an opaque material, drop to less than one percent. These levels indicate
the drop in fructosans when the rhizomes are removed from the parent plant, or tilled, at
flowering, which is mid July here in the Pacific Northwest. If one is able to till the site,
the results imply that the reserves should be depleted after one year of being covered.
Tilling is also important as this management technique breaks the individual plants away
from the connection with other clones. When looking at the effects of shading on RCG
tiller expansion, Maurer and Zedler (2002) detected that those plants which were
connected to parental clones were not impacted by the shading treatment.
The hogfuel added, RCG barrier treatment proved to be significant in this study. The
multi-canopy layers suppressed the RCG re-growth while providing higher biodiversity
and structural diversity for the site. Lindig-Cisneros and Zedler (2002) established that a
treatment of 15 species reduced RCG survival and growth from seed by 48% when
compared to a single species treatment, especially when canopy gaps exist. Maurer and
Zedler (2002) verified similar results when looking at the re-growth of rhizome fragments
under dense canopies versus a more open canopy. Other factors which favor a multi-
canopy treatment are consideration for wildlife and invertebrate habitat quality.

94
Wipfli (1997) found that terrestrial invertebrates were as important for certain
salmonid species as aquatic invertebrates during the spring, summer and fall and that the
riparian vegetation influences the terrestrial invertebrates available for salmonids. A
compact and diverse lower canopy layer with a broadleaf alder upper canopy provided a
more diverse and productive terrestrial invertebrate community. Alan et al. (2003) went
further in looking at specific over and understory species and their contribution of
invertebrate mass. Salmonberry (Rubus spectabilis), currant (Ribes sp.) and blueberry
(Vaccinium ovalifolium and V. alaskaense) and alder (Alnus rubra) were all noted as
contributing a high level of invertebrate biomass and therefore should be considered
when looking at species for re-vegetation projects in the PNW. Alder was not used in
this project as it is a nitrogen fixer and RCG is understood to be a nitrophilic plant, yet
alder could be used after the RCG is under control or in other re-vegetation situations.
Based on the conclusions from this research, other research projects, relevant literature
and observations in the field, my recommendations for RCG control and riparian re-
vegetation and restoration are as follows:
Recommendations:
1) If tilling is possible on the site, till the site and cover with a thick and dense
opaque material for at least one year without disturbing. This fabric should not
break down for several years and should be staked down securely with stakes or
mulch/hogfuel. Tilling the site will also allow for increased microtopography
which will also allow for increased species diversity (Maurer et al. 2003).
2) Using hogfuel is recommended. The thick, dense, potentially allelopathic
material suppressed RCG re-growth in this study.
3) Plant a dense multi-canopy of native vegetation. Species should be chosen which
will supply multiple canopies providing dense shade for additional invasive plant
control, a preferred assembly of invertebrates and habitat diversity.

95
4) Plant species that have characteristics which allow the species to compete
effectively with RCG. These characteristics include: fast growing, leafing out
early in the season, high leaf area index for shading.
96
LITERATURE CITED
Aarssen, L.W. 1983. Ecological Combining Ability and Competitive Combining Ability
in Plants: Toward a General Evolutionary Theory of Coexistence in Systems of
Competition. The American Naturalist 122:6 707-731.
Allan, J.D., Wipfli, M.S., Caouette, J.P., Prussian, A. and J. Rodgers. 2003. Influence of
streamside vegetation on inputs of terrestrial invertebrates to salmonid food webs.
Canadian Journal of Fish and Aquatic Science 60: 309-320.
Allendorf, F and L.L. Lundquist. 2003. Introduction: Population Biology, Evolution,
and Control of Invasive Species. Conservation Biology 17:1 24
Anderson, E. and G.L. Stebbins, Jr. 1954. Hybridization as an Evolutionary Stimulus.
Evolution 8: 378-388.
Anderson, N.O. 2006. Prevention of Invasiveness in Floricultural Crops. In Flower
Breeding and Genetics: Issues, Challenges and Opportunities for the 21st Century.
Springer Publications, Netherlands 177-214.
Antieau, C.J. 1998. Biology and Management of Reed Canarygrass, and Implications
for Ecological Restoration. Washington State Department of Transportation.
Apfelbaum, S.I. and C.E. Sams. 1987. Ecology and Control of Reed Canarygrass
(Phalaris arundinacea L.). Natural Areas Journal 7:2 69-73.
Baker, H.G. 1953. Race formation and reproductive method in flowering plants. Syrup
Soc. Exp. Biology 7: 114-145.
Baker, H.G. 1974. The Evolution of Weeds. Annual Reviews Ecol. Syst. 5: 1-24.
Basu, C., Halfhill, M.D., Mueller, T.C. and C.N Stewart Jr. 2004. Weed genomics: new
tools to understand weed biology. Trends in Plant Science 9:8 391-398.
Blumenthal, D.M., Jordan, N.R. and M.P. Russelle. 2003. Soil Carbon Addition
Controls Weeds and Facilitates Prairie Restoration. Ecological Applications 13:3 605-
615.
Boateng, J.O. and P. Comeau. 2002. Operational Summary for Vegetation Complexes,
Salal Complex
http://www.for.gov.bc.ca/hfp/publications/00052/salal.pdf
Boersma, P.D, Reichard, S.H. and A.N. Van Buren. 2006. Invasive Species in the
Pacific Northwest. University of Washington Press. Seattle, Washington.
97
Bonsall, M, PhD. 2007. Dept of Biological Sciences, Imperial College of London.
http://www.bio.ic.ac.uk/research/mbbon/Ecology.html
Booth, B.D., Murphy, S.D. and J. Swanton. 2003. Plant Invasions, In: Weed Ecology in
Natural and Agricultural Systems. CABI Publishing
Bossdorf, O., Auge, H., Lafuma, L., Rogers, W.E., Siemann, E. and D. Prati. 2005.
Phenotypic and genetic differentiation between native and introduced plant populations.
Oecologia 144:1 1-11.
Callaway, R.M. and Aschehoug, E.T. 2000. Invasive Plants Versus Their New and Old
Neighbors: A Mechanism for Exotic Invasion. Science 290 521-523.
Casper, B.B. and R.B. Jackson. 1997. Plant Competition Underground. Annual Rev.
Ecol. Syst. 28 545-570.
Comes, R.D. 1971. The Biology and Control of Reed Canarygrass (Phalaris
arundinacea L.) on Irrigation Ditchbanks. Doctoral Dissertation. Oregon State
University.
Connell, J.H. 1983. On the Prevalence and Relative Importance of Interspecific
Competition: Evidence From Field Experiments. The American Naturalist. 122:5 661-
696.
Coops, H., van der Brink, F.W.B., and van der Velde, G. 1996. Growth and
morphological responses of four helophyte species in an experimental water depth
gradient. Aquatic Botany 54: 11-24.
Corbin, J.D. and C.M. D’Antonio. 2004. Can Carbon Addition Increase
Competitiveness of Native Grasses? A Case Study from California. Restoration Ecology
12:1 36-46.
Cowardin, L.M., Carter, V., Golet, F.C., and E.T. LaRoe. 1979. Classification of
wetlands and deepwater habitats of the United States. U.S. Department of the Interior.
Fish and Wildlife Service, Washington, D.C. Jamestown, ND: Northern Prairie Wildlife
Research Center Home Page. http://www.npwrc.usgs.gov/resource/1998/classwet.htm
(Version 04DEC98).
Crandell, C. 2001. Effect of Grazing by Branta canadensis (Canada Geese) on the
Fitness of Carex lyngbyei (Lyngbye’s sedge) at a Restored Wetland in the Duwamish
River Estuary. M.S. Thesis. University of Washington.
Crawley, M.J. 1990. The Population Dynamics of Plants. Philosophical Transactions:
Biological Sciences. 330: 125-140
98
Crockett, R.P. 1996. Biology and Control of Reed Canarygrass (Phalaris
arundinacea L.) PNW EPPC Newsletter, Summer/Fall 1996.
D'Antonio, Carla M. and P. M. Vitousek. 1992. Biological invasions by exotic grasses,
the grass/fire cycle, and global change. Annual Review of Ecology and Systematics 63-
87.
Darwin, C. 1958. The Autobiography of Charles Darwin, with original omissions
restored. Edited with Appendix and Notes by his grand-daughter, Nora Barlow. Collins
Clear-Type Press, London and Glasgow.
Davis, K.J. The Effects of Nitrogen Manipulation and Hydrology on the Establishment
and Competitive Abilities of Wetland Prairie Plant Species (Western Oregon). 2000.
Doctor of Philosophy Dissertation. Oregon State University.
de Kroon, H. and Bobbink, R. 1997. Clonal Plant Dominance Under Elevated Nitrogen
Deposition, With Special Reference to Brachypodium pinnatum in Chalk Grassland. In:
The Ecology and Evolution of Clonal Plants. Edited by: de Kroon, H. and van
Groenendael, J. Backhuys Publishers, Leiden.
Duffus, C.M. and J.H. Duffus. 1984. Carbohydrate metabolism in plants. Longman
Press, London, New York.
Duryea, M.L., English, R.J. and L.A. Hermansen. 1999. A Comparison of Landscape
Mulches: Chemical, Allelopathic, and Decomposition Properties. Journal of
Arboriculture 25;2 88-96.
Ellstrand NC, and K.A. Schierenbeck. 2006. Hybridization as a stimulus for the
evolution of invasiveness in plants. Euphytica 148:1-2 35-46.
Elton, C.S. 1958. The ecology of invasions by animals and plants. Methuen Press,
London.
Evans, M.W. and Ely, J.E. 1935. The Rhizomes of Certain Species of Grasses. Journal
of the American Society of Agronomy 791-797.
Facon, B., Genton, B.J., Shykoff, J., Jarne, P., Estoup, A., David, P. 2006. A general
eco-evolutionary framework for understanding bioinvasions. Trends in Ecology and
Evolution 21:3 130-135.
Federal Register V 64-No. 25, February 8, 1999 / Presidential Documents. Executive
Order 13112 of February 3, 1999.
http://frwebgate.access.gpo.gov/cgi-bin/getdoc.cgi?dbname=1999_register&docid=99-
3184-filed.pdf
99
Flora of North America Association. 2007.
http://www.efloras.org/florataxon.aspx?flora_id=1&taxon_id=242357969
Forman, D.J., L.H. Hardesty and R.D. Sayler. 2000. Reed Canarygrass Working Group
Conference. March 15, 2000.
Gaudet, C.L. and P.A. Keddy. 1988. A comparative approach to predicting competitive
ability from plant traits. Nature 334: 242-243.
Gaudet, C.L. and P.A. Keddy. 1995. Competitive Performance and Species Distribution
in Shoreline Plant Communities: A Comparative Approach. Ecology 76:1 280-291.
Granger, T., Hruby, T., McMillan, A., Peters, D., Rubey, J., Sheldon, D., Stanley, S., and
E. Stockdale. 2005. Wetlands in Washington State – Volume 2: Guidance for Protecting
and Managing Wetlands. Washington State Department of Ecology. Publication #05-06-
008. Olympia, Washington.
Graustein, J.S. 1995. Competitive Effect of an Invasive Grass, Phalaris arundinacea L.
on the Growth of a Rhizomatous Sedge, Carex stricta LAM. M.S. Thesis, Northern
Illinois University.
Green, E.K. and Galatowitsch, S.M. 2001. Differences in wetland plant community
establishment with additions of nitrate-N and invasive species (Phalaris arundinacea and
Typha xglauca). Canadian Journal of Botany 79:2 170-178.
Green, E.K. and Galatowitsch, S.M. 2002. Effects of Phalaris arundinacea and nitrate-
N addition on the establishment of wetland plant communities. Journal of Applied
Ecology 39:1 134.
Grime, J.P. 1977. Evidence for the Existence of Three Primary Strategies in Plants and
its Relevance to Ecological and Evolutionary Theory. The American Naturalist 111:
1169-1194.
Grime, J.P. 1979. Plant strategies and vegetation processes. John Wiley, New York,
New York.
Grime, J.P. and J.G. Hodgson. 1987. Botanical Contributions to Contemporary
Ecological Theory. New Phytologist 106:1 283-295.
Guard, B.J. 1996. Wetland Plants of Oregon and Washington. Lone Pine Publishing.
Redmond, Washington.

100
Gunti, D., Burgos, S., Kump, I., Heeb, M., Pfirter, HA and Defago, G. 1999.
Biological control of hedge bindweed (Calystegia sepium) with Stagonospora convolvuli
strain LA39 in combination with competition from red clover (Trifolium pretense).
Biological Control 15:3 252-258.
Harris, R.W., Clark, J.R. and N.P. Matheny. 1999. Aboriculture, Integrated
Management of Landscape Trees, Shrubs, And Vines. Prentice-Hall, Inc., New Jersey.
Ingles, L.G. 1961. Home Range and Habitats of the Wandering Shrew. Journal of
Mammalogy 42:4 455-462.
Johansson, M.E. and P.A. Keddy. 1991. Intensity and asymmetry of competition
between plant pairs of different degrees of similarity: an experimental study on two
guilds of wetland plants. Oikos 60: 27-34.
Jurries, D. 2003. State of Oregon, Dept of Environmental Quality, Biofilters –
Bioswales, Vegetative Buffers, & Constructed Wetlands For Storm Water Discharge
Pollution Removal.
http://www.deq.state.or.us/wq/stormwater/docs/nwr/biofilters.pdf
Kantor, Sylvia. 1998. Farming in King County: A Treasure in Peril. WSU Cooperative
Extension, King County
http://king.wsu.edu/foodandfarms/documents/FarmInKC.pdf
Keddy, P. and B. Shipley. 1989. Competitive hierarchies in herbaceous plant
communities. Oikos 54: 234-241.
Keddy, P., Fraser, L.H. and I.C. Wisheu. 1998. A comparative approach to examine
competitive response of 48 wetland plant species. Journal of Vegetation Science 9: 777-
786.
Kercher, S.M. and J.B. Zedler. 2004. Multiple disturbances accelerate invasion of reed
cnaarygrass (Phalaris arundinacea L.) in a mesocosm study. Oecologia 138: 455-464.
Kim, K.D., Ewing, K. and D.E. Giblin. 2006. Controlling Phalaris arundinacea (reed
canarygrass) with live willow stakes: A density-dependent response. Ecological
Engineering 27:3 219-227.
Klimes, L, Klimesova, J. Hendriks, R. and J. van Groenendael. 1997. Clonal Plant
Architecture: A Comparative Analysis of Form and Function. In: The Ecology and
Evolution of Clonal Plants. Edited by: de Kroon, H. and van Groenendael, J. Backhuys
Publishers, Leiden.

101
La Force, M.J., Hansel, C.M. and S. Fendorf. 2002. Seasonal Transformations of
Manganese in a Palustrine Emergent Wetland. Soil Science Society of America Journal
66: 1377-1389.
Lavergne, S. and J. Molofsky. 2004. Reed Canary Grass (Phalaris arundinacea) as a
Biological Model in the Study of Plant Invasions. Critical Reviews in Plant Sciences 23:
5 1-15.
Lavergne, S. and J. Molofsky. 2007. Increased genetic variation and evolutionary
potential drive the success of an invasive grass. PNAS 104:10 3883-3888.
Lee, B.D., Graham R.C., Laurent, T.E., Amrhein, C. and R. M. Creasy. 2001.
Spatial Distributions of Soil Chemical Conditions in a Serpentinitic Wetland and
Surrounding Landscape. Soil Science Society of America Journal 65: 1183-1196.
Levine, J.M. and D’Antonio, C.M. 1999. Elton revisited: a review of evidence linking
diversity and invisibility. Oikos 87:1 15-26.
Lindig-Cisneros, R. and J.B. Zedler. 2001. Phalaris arundinacea seedling
establishment: effects of canopy complexity in fen, mesocosm, and restoration
experiments. Canadian Journal of Botany 80: 617-624
Lyons, K.E. 1998. Elemental Stewardship Abstracts for Reed Canarygrass. Edited by:
J.M. Randall, M. Robison, T. Morisawa, B. Meyers-Rice. The Nature Conservancy,
Wildland Invasive Species Program.
http://tncweeds.ucdavis.edu/esadocs/documnts/phalaru.pdf
Magee, T.K. and Kentula M.E. 2005. Response of wetland plant species to hydrologic
conditions. Wetlands Ecology and Mangement 13: 163-181.
Mallik, A.U., Lamb, E.G. and H. Rasid. 2001. Vegetation zonation among the
microhabitats in a lacustrine environment: analysis and application of belowground
species trait patterns. Ecological Engineering 18:2 135-146
Maurer, D.A. 2001. Effects of light availability and resource subsidy on the vegetative
spread of Phalaris arundinacea L. (Reed Canarygrass) in wetlands. M.S. University of
Wisconsin-Madison.
Maurer, D.A. and J.B Zedler. 2002. Differential invasion of a wetland grass explained
by tests of nutrients and light availability on establishment and clonal growth. Oecologia
131: 279-288.
Maurer, D.A., Lindig-Cisneros, R., Werner, K.J., Kercher, S., Miller, R. and J.B. Zedler.
2003. The Replacement of Wetland Vegetation by Reed Canarygrass (Phalaris
arundinacea) Ecological Restoration 21:2 116-119.
102
Megazyme International. 2004. Fructan Assay Procedure for the measurement of
Fructo-oligosaccharides (FOS) and Fructan Polysaccharide. AOAC Method 999.03,
AACC Method 32.32.
Merigliano, M.F. and P. Lesica. 1998. The Native Status of Reed Canarygrass (Phalaris
arundinacea L.) in the Inland Northwest, USA. Natural Areas Journal 18:3 223-230.
Mockler, A. Casey, L. Bowles, M, Gillen, N., Hansen, J. 1998. Results of Monitoring
King County Wetland and Stream Mititgations. King Conty Dept of Development and
Environmental Services.
Moxy Media. 2007. The Carpet Site. An Online Consumers’ Guide to Carpet and Other
Flooring Products. http://www.thecarpetsite.com/about.aspx
Naglich, F.G. 1994. Reed Canarygrass (Phalaris arundinacea L.) in the Pacific
Northwest: Growth Parameters, Economic Uses, and Control. Master’s Thesis. The
Evergreen State College.
Norberg, G. Jaderlund, A., Zackrisson, O., Nordfjeli, T., Wardle, D.A., Nilsson, M.C. and
A. Dolling. 1997. Vegetation control by steam treatment in boreal forests: a comparison
with burning and soil scarification. Canadian Journal Forest Res. 2026-2033.
Park, S.E., Benjamin, L.R. and Watkinson, A.R. 2003. The Theory and Application of
Plant Competition Models: an Agronomic Perspective. Annals of Botany 92: 741-748.
Patterson, L. and D.J. Cooper. 2007. The use of hydrologic and ecological indicators for
the restoration of drainage ditches and water diversions in a mountain fen, cascade range,
California. Wetlands 27:2 290-304.
Perry, L.G. and S.M. Galatowitsch. 2003. A Test of Two Annual Cover Crops for
Controlling Phalaris arundinacea Invasion in Restored Sedge Meadow Wetlands.
Restoration Ecology 11:3 297-307.
Perry, L.G. and S.M. Galatowitsch. 2004. The influence of light availability on
competition between Phalaris arundinacea and a native wetland sedge. Plant Ecology
170: 73-81.
Perry, L.G., Galatowitsch, S.M. and C.J. Rosen. 2004. Competitive control of invasive
vegetation: a native wetland sedge suppresses Phalaris arundinacea in carbon-enriched
soil. Journal of Applied Ecology 41: 151-162.
Pigliucci, M. 2002. Distributed by the Pigliucci Lab. University of Tennessee.
http://fp.bio.utk.edu/pgl, http://www.bio.unc.edu/biol258/fall02/Plasticity_101.pdf.
103
Pimentel, D., Lach, L, Zuniga, R. and D. Morrison. 2000. Environmental and
Economic Costs of Nonindigenous Species in the United States. Bioscience 50:1 53-61.
Plants for a Future. 2007.
http://www.ibiblio.org/pfaf/cgi-bin/arr_html?Scirpus+microcarpus
Pojar, J. and A MacKinnon. 1994. Plants of the Pacific Northwest Coast: Washington,
Oregon, British Columbia & Alaska. Lone Pine Publishing, Redmond, Washington.
Pysek, P. 1997. Clonality and plant invasions: Can a trait make a difference?
The ecology and evolution of clonal plants 405-427.
Pysek, P. and D.M. Richardson 2006. The biogeography of naturalization in alien
plants. Journal of Biogeography 33:12 2040.
Quarles, W. 2001. Improved Hot Water Weed Control System. The IPM Practitioner
23:1 1-4.
Rathinasabapathi, B. 2005. Evaluation of allelopathic potential of wood chips for weed
suppression in horticultural production systems. HortScience 40:3 711-713.
Reever Morghan, K.J. and T.R. Seastedt. 1999. Effects of Soil Nitrogen Reduction on
Nonnative Plants in Restored Grasslands. Restoration Ecology 7: 1 51-58.
Reichard, S.E. 1997. Prevention of Invasive Plant Introductions on National and Local
Levels. In Assessment and Management of Plant Invasions. Edited By: J.O. Luken and
J.W. Thieret. Springer Publications.
Reichard, S.H. and Hamilton, C.W. 1997. Predicting Invasions of Woody Plants
Introduced into North America. Conservation Biology 11:1 193-203.
Reichard, S. 1998. Reducing the Spread of Invasive Weeds. Hortus West 9:1 pg 22.
Reichard, S.H. and P. White. 2001. Horticulture as a Pathway of Invasive Plant
Introductions in the United States. Bioscience 51:2 103-113.
Reichard, S.H. and P. White. 2003. Invasion Biology: An Emerging Field of Study.
Annals of Missouri Bot. Gard. 90: 64-66.
Reinhardt, C. and S.M. Galatowitsch. 2004. Best Management Practices for the Invasive
Phalaris arundinacea L. (Reed canarygrass) in Wetland Restorations. Final Report for
the Minnesota Department of Transportation, Office of Research Services.
Rejmànek, M. 1996. A Theory of Seed Plant Invasiveness: The First Sketch. Biological
Conservation 78 171-181.
104
Rejmànek, M. and Richardson, D.M. 1996. What Attributes Make Some Plant
Species More Invasive. Ecology 77:6 1655-1661.
Richardson, D.M. 2004. Plant invasion ecology – dispatches from the front line.
Diversity and Distributions 10, 315-319.
Rosch, H., Van Rooyen, M.W. and G.K. Theron. 1997. Predicting competitive
interactions between pioneer plants by using plant species traits. Journal of Vegetation
Science 8: 489-494.
Rosetta, R. 2006. Oregon State University, Horticulture Dept., Pacific Northwest
Nursery IPM. http://oregonstate.edu/dept/nurspest/poplar_and_willow_borer.htm
Sakai, A.K., Allendorf, F.W., Holt, J.S., Lodge, D.M., Molofsky, J., With, K.A.,
Baughman, S., Cabin, R.J., Cohen, J.E., Ellstrand, N.C., McCauley, D.E., O’Neil, P.,
Parker, I.M., Thompson, J.N. and S.G. Weller. 2001. The Population Biology of
Invasive Species. Ecology and Systematics 32:1 305
Schuller, R. 2006. High Peak/Moon Creek Research Natural Area, Guidebook
Supplement 30, USDA, FS PNW Research Station. General Tech Report PNW-GTR-
673.
Schuylerae. 1976. Chromosome Numbers of Some Eastern North American Species of
Scirpus. Bartonia 44: 27-31.
Sebens, K.P. and B.L. Thorne. 1985. Coexistence of Clones, Clonal Diversity, and the
Effects of Disturbance. In: Population Biology and Evolution of Clonal Organisms.
Edited by: J. Jackson, L.W. Buss, R.E. Cook. Yale University Press, New Haven and
London.
Seebacher, L. 1999. Unpublished data. Survey of Restoration Ecologist in Western
Washington.
Simberloff, D. and B. Von Holle. 1999. Positive Interactions of Nonindigenous Species:
Invasional Meltdown? Biological Invasions 1:1 21-32.
Smith, D. 1968. Classification of Several Native North American Grasses as Starch or
Fructosan Accumulators in Relation to Taxonomy. Journal of the British Grassland
Society 23:4 306-309.
Smith, D. 1969. Removing and Analyzing Total Nonstructural Carbohydrates From
Plant Tissue. Research Division, college of Agriculture and Life Sciences, Madison,
Wisconsin. Research Report 41, 11p.
105
Stannard, M. and W. Crowder. 2001. Biology, History, and Suppression of Reed
Canarygrass (Phalaris arundinacea L.). U.S. Department of Agriculture, Natural
Resources Conservation Service, Plant Materials #43.
Stevens, M.L. and Vanbianchi, R. 1993. Restoring Wetlands in Washington. A
Guidebook for Wetland Restoration Planning and Implementation. Publication #93-17.
Washington Dept of Ecology.
Stohlgren, T.J., Barnett, D.T. and J.T. Kartesz. 2003. The rich get richer: patterns of
plant invasions in the United States. Front Ecol Environ 1:1 11-14.
Stout, T. 2002. Potential Problems Associated with Mulches. Center for Urban
Horticulture, University of Washington.
http://students.washington.edu/tls2/Potential%20Problems%20Associated%20with%20M
ulch.
Stuckey, R.L. 1978. Essays on North American Plant Geography from the Nineteenth
Century. New York Arno Press New York, New York.
Tilman, D. 1997. Mechanisms of Plant Competition. In: Plant Ecology, Edited by: M.J.
Crawley p 239. Humana Press.
Tilman, D. 1999. The Ecological Consequences of Changes in Biodiversity: A Search
for General Principles. Ecology 80:5 1455-1474.
Tomasko, D.A. and C.J. Dawes. 1989. Evidence for physiological integration between
shaded and unshaded short shoots of Thalassia testudinum. Marine Ecology Progress
Series, 54: 299-305.
Treberg, M.A. and B.C. Husband. 1999. Relationship between the abundance of
Lythrum salicaria (purple loosestrife) and plant species richness along the Bar River,
Canada. Wetlands 19:1 118-125.
Tu, M. 2004. Reed Canarygrass (Phalaris arundinacea L.) Control & Management in the
Pacific Northwest. The Nature Conservancy’s Wildland Invasive Species Team. The
Nature Conservancy, Oregon Field Office.
http://tncweeds.ucdavis.edu/moredocs/phaaru01.pdf
Tu, M. 2006. Phalaris arundinacea L. In: Invasive Species in the Pacific Northwest.
Edited by: Boersma, D., Reichard, S.H. and An Van Buren.
Van der Velde, G., Rajagopal, S., Kuyper-Kollenaar, M., bij de Vaate, A., Thieltges,
D.W. and MacIsaac, H.J. 2006. Ecological Studies 191, In: Wetlands: Functioning,
Biodiversity Conservation, and Restoration. Edited by: Bobbink, B., Beltman, B.,
106
Verhoeven, J.T.A., Whigham, D.F. Springer Publishing – Verlag Berlin Heidelbirg,
New York.
Washington Department of Fisheries, Washington Department of Wildlife and the
Western Washington Treaty of Indian Tribes. 1993.
Weinmann, H. 1947. Determination of total available carbohydrates in plants. Plant
Physiolgy 22: 279-280.
Weinmann, H. 1948. Underground development and reserves of grasses. A review.
Journal of British Grassland Society. 3: 115-140.
Welch, B., Geissler, P., Latham, P., Beard, K., Brooks, M., Cutler, R., Edwards, T.,
Klinger, R., Loope, L., O’Neil, S., Sarr, D., Schrader, S. and K. Young. 2007. Early
Detection of Invasives Handbook. USGS – NPS Inventory and Monitoring.
Wetzel, P.R. and A.G. van der Valk. 1998. Effects of nutrient and soil moisture on
competition between Carex stricta, Phalaris arundinacea, and Typha latifolia. 1998.
Plant Ecology 138: 179-190.
White, L.M. 1972. Carbohydrate Reserves of Grasses: A Review. Journal of Range
Management 26:1 13-18.
Williamson, M. H., and K. C. Brown. 1986. The analysis and modelling of British
invasions. Philosophical Transactions of the Royal Society 314: 505-522.
Williamson, M.H. and A. Fitter. 1996. The Characters of Successful Invaders.
Biological Conservation 78 163-170.
Williamson, M.H. and A. Fitter. 1996. The Varying Success of Invaders. Ecology 77:6
1661-1666.
Wilson, S.D. and D. Tilman. 1991. Components of Plant Competition Along an
Experimental Gradient of Nitrogen Availability. Ecology 72:3 1050-1065.
Wipfli, M.S. 1997. Terrestrial invertebrates as salmonid prey and nitrogen sources in
streams: contrasting old-growth and young-growth riparian forests in southeastern
Alaska, U.S.A. Canadian Journal of Fish. Aquatic Science 54: 1259-1269.
Zedler, J.B. and S. Kercher. 2004. Causes and Consequences of Invasive Plants in
Wetlands: Opportunities, Opportunists, and Outcomes. Critical Reviews in Plant
Sciences 23:5 431-452.
Zink, T. A. and M. F. Allen. 1998. The effects of organic amendment on the restoration
of a disturbed coast sage scrub habitat. Restoration Ecology 6: 52– 58.

107
APPENDIX A:
Schematic flow of the research project development and process.

108
Field Project: RCG Barrier
HF/ Dense Willow
HF / RCG Barrier
Objective:
BMP for controlling reed
canarygrass and re-establishing
native riparian vegetation.
Pilot Project: Steam
Cover crop
Dense Salal
Heavy, opaque material
Hogfuel Conclusions: Steam – Not significant
Cover crop – Not significant
Dense salal- Not significant
Material – Significant
Hogfuel - Significant
Develop barrier that
blends weight &
density of material
with re-vegetating
bank
RCG rapidly re-
colonizes from
rhizome fragments.
Determine length of
time needed to deplete
reserves
Keep hogfuel for
suppression, add
vegetation for
revegetating bank
Lab: RCG rhizome
carbohydrate
depletion
experiment
Greenhouse: Based on SFB
performance in the
field, controlled
competition
experiment
Conclusions: Positive results increase if
rhizome base is tilled.
Rhizomes should be covered
for at least one year.
Conclusions: RCG Barrier – Not significant
HF/Willow – Significant
HF/RCG Barrier - Significant
Conclusions: Under high nitrogen , high
light conditions, SFB
reduces RCG total biomass.

109

110
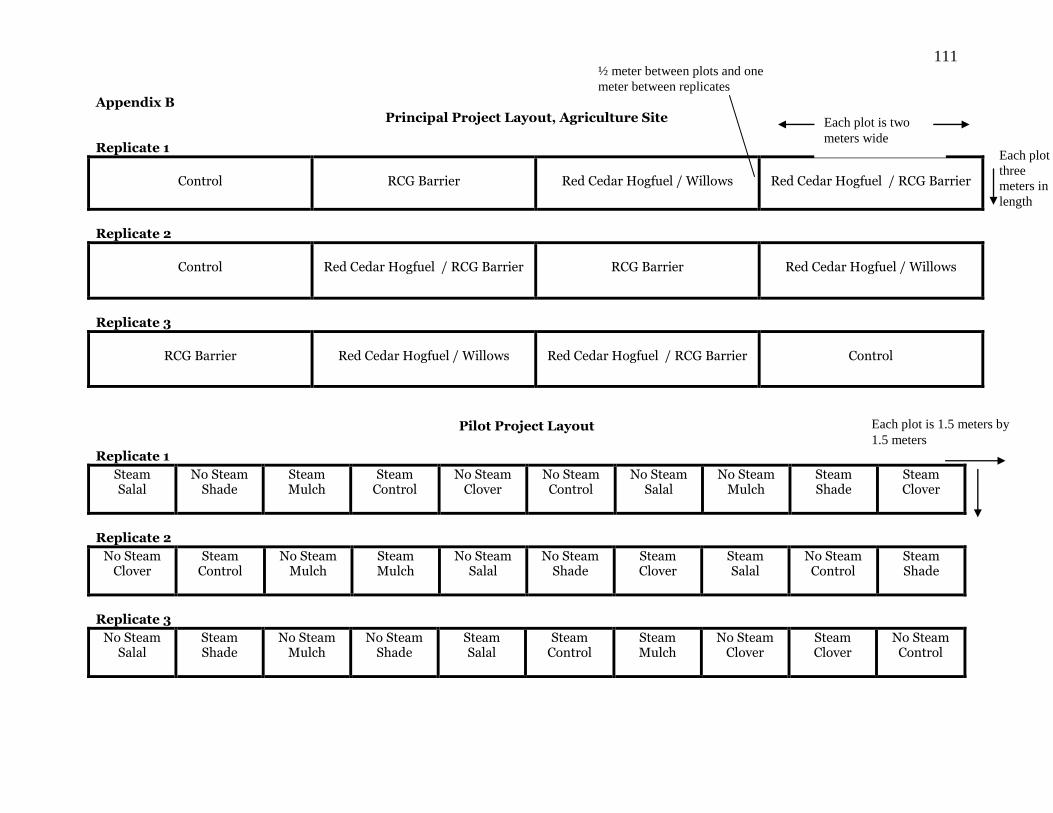
111
Appendix B Principal Project Layout, Agriculture Site
Replicate 1
Control
RCG Barrier
Red Cedar Hogfuel / Willows
Red Cedar Hogfuel / RCG Barrier
Replicate 2
Control
Red Cedar Hogfuel / RCG Barrier
RCG Barrier
Red Cedar Hogfuel / Willows
Replicate 3
RCG Barrier
Red Cedar Hogfuel / Willows
Red Cedar Hogfuel / RCG Barrier
Control
Pilot Project Layout Replicate 1
Steam Salal
No Steam Shade
Steam Mulch
Steam Control
No Steam Clover
No Steam Control
No Steam Salal
No Steam Mulch
Steam Shade
Steam Clover
Replicate 2
No Steam Clover
Steam Control
No Steam Mulch
Steam Mulch
No Steam Salal
No Steam Shade
Steam Clover
Steam Salal
No Steam Control
Steam Shade
Replicate 3
No Steam Salal
Steam Shade
No Steam Mulch
No Steam Shade
Steam Salal
Steam Control
Steam Mulch
No Steam Clover
Steam Clover
No Steam Control
Each plot is two
meters wide
Each plot is
three
meters in
length
½ meter between plots and one
meter between replicates
Each plot is 1.5 meters by
1.5 meters