pharmaceutical industry in oic countries
DESCRIPTION
Pharma Industry trends in OIC (organization of Islamic Countries).Growth,trends,Disease patterns,Market indicators.demographic trends etc.TRANSCRIPT
0
Pharmaceutical Industry in OIC
Member Countries: Production,
Consumption and Trade
ORGANISATION OF ISLAMIC COOPERATION
STATISTICAL ECONOMIC AND SOCIAL RESEARCH AND
TRAINING CENTRE FOR ISLAMIC COUNTRIES (SESRIC)
PHARMACEUTICAL INDUSTRY
PRODUCTION, CONSUMPTION AND TRADE
IN OIC MEMBER COUNTRIES
1
Pharmaceutical Industry in OIC Member Countries:
Production, Consumption and Trade
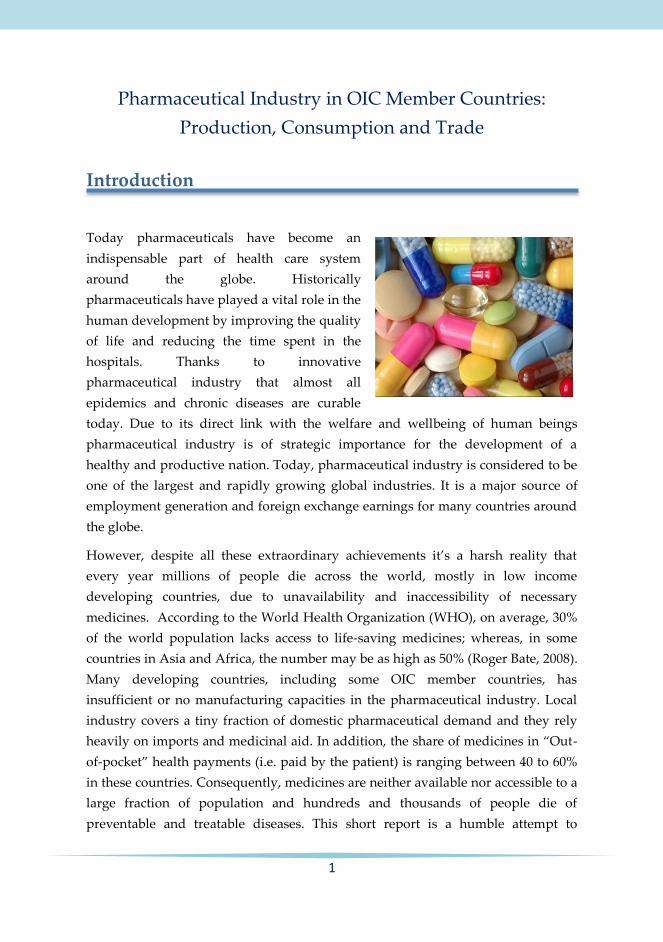
Introduction
Today pharmaceuticals have become an
indispensable part of health care system
around the globe. Historically
pharmaceuticals have played a vital role in the
human development by improving the quality
of life and reducing the time spent in the
hospitals. Thanks to innovative
pharmaceutical industry that almost all
epidemics and chronic diseases are curable
today. Due to its direct link with the welfare and wellbeing of human beings
pharmaceutical industry is of strategic importance for the development of a
healthy and productive nation. Today, pharmaceutical industry is considered to be
one of the largest and rapidly growing global industries. It is a major source of
employment generation and foreign exchange earnings for many countries around
the globe.
However, despite all these extraordinary achievements it’s a harsh reality that
every year millions of people die across the world, mostly in low income
developing countries, due to unavailability and inaccessibility of necessary
medicines. According to the World Health Organization (WHO), on average, 30%
of the world population lacks access to life-saving medicines; whereas, in some
countries in Asia and Africa, the number may be as high as 50% (Roger Bate, 2008).
Many developing countries, including some OIC member countries, has
insufficient or no manufacturing capacities in the pharmaceutical industry. Local
industry covers a tiny fraction of domestic pharmaceutical demand and they rely
heavily on imports and medicinal aid. In addition, the share of medicines in “Out-
of-pocket” health payments (i.e. paid by the patient) is ranging between 40 to 60%
in these countries. Consequently, medicines are neither available nor accessible to a
large fraction of population and hundreds and thousands of people die of
preventable and treatable diseases. This short report is a humble attempt to
2
investigate the availability of medicines in OIC member countries by focusing on
the production, consumption and trade patterns of pharmaceuticals in these
countries during the period 2005-2010.
Pharmaceutical Production and Consumption:
Worldwide Trends
The global pharmaceutical industry has shown rapid growth over the years and
emerged as one of the fastest growing industries in the world. However, world
pharmaceutical production and consumption is still unevenly dispersed around
the world with the developed countries as the leading producers and consumers of
pharmaceuticals.
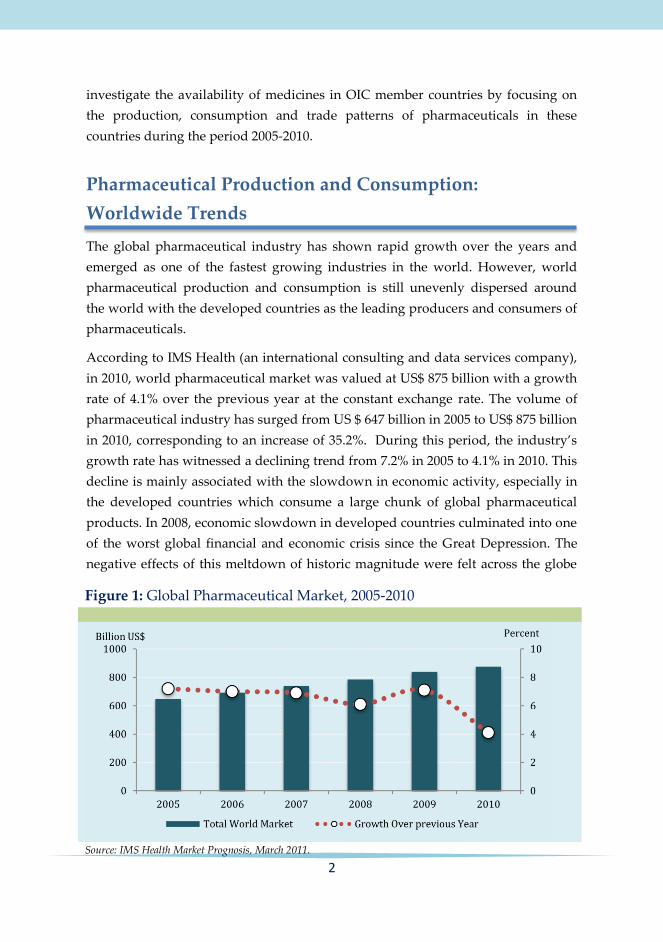
According to IMS Health (an international consulting and data services company),
in 2010, world pharmaceutical market was valued at US$ 875 billion with a growth
rate of 4.1% over the previous year at the constant exchange rate. The volume of
pharmaceutical industry has surged from US $ 647 billion in 2005 to US$ 875 billion
in 2010, corresponding to an increase of 35.2%. During this period, the industry’s
growth rate has witnessed a declining trend from 7.2% in 2005 to 4.1% in 2010. This
decline is mainly associated with the slowdown in economic activity, especially in
the developed countries which consume a large chunk of global pharmaceutical
products. In 2008, economic slowdown in developed countries culminated into one
of the worst global financial and economic crisis since the Great Depression. The
negative effects of this meltdown of historic magnitude were felt across the globe
Figure 1: Global Pharmaceutical Market, 2005-2010
Source: IMS Health Market Prognosis, March 2011.
3
and all sectors were hard hit. The pharmaceutical industry was not an exception
and it has witnessed one of the lowest year-on-year growth rates of 6.1% in 2008. In
2009, however, the negative effects of the crisis subsided and global economy has
started to recover. These positive developments helped the global pharmaceutical
industry to rebound to its pre-crisis level and its growth rate climbed to 7.1% in
2009 (Figure 1).
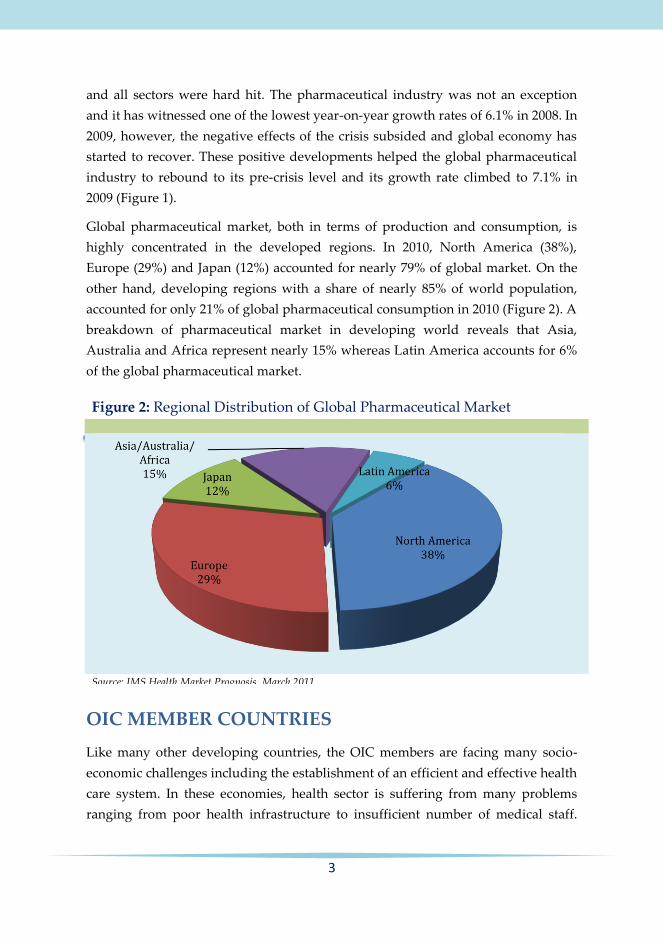
Global pharmaceutical market, both in terms of production and consumption, is
highly concentrated in the developed regions. In 2010, North America (38%),
Europe (29%) and Japan (12%) accounted for nearly 79% of global market. On the
other hand, developing regions with a share of nearly 85% of world population,
accounted for only 21% of global pharmaceutical consumption in 2010 (Figure 2). A
breakdown of pharmaceutical market in developing world reveals that Asia,
Australia and Africa represent nearly 15% whereas Latin America accounts for 6%
of the global pharmaceutical market.
OIC MEMBER COUNTRIES
Like many other developing countries, the OIC members are facing many socio-
economic challenges including the establishment of an efficient and effective health
care system. In these economies, health sector is suffering from many problems
ranging from poor health infrastructure to insufficient number of medical staff.
Figure 2: Regional Distribution of Global Pharmaceutical Market
Source: IMS Health Market Prognosis, March 2011.
4
However the shortage of and inaccessibility to necessary medicines are among the
most challenging problems. Due to the unavailability of the relevant data for most
of the OIC member countries, comprehensive analysis on production capacity of
pharmaceutical industry at the OIC level is not possible. However, an overview of
pharmaceutical industry in the OIC member countries, for which data are
available, in terms of their geographical regions is given in the following section.
MIDDLE EAST AND NORTH AFRICA (MENA)
Pharmaceutical market in the MENA region accounted for about 1.8 per cent of the
world market, or around US$12 billion in 2006 [Pharmaceutical & Biotechnology
Middle East (PABME)]. Most of the countries in MENA region are characterized by
low domestic pharmaceutical base. According to the Arab Organization for
Industry and Mining, local production accounts for 45 % of consumption, with
more than 220 manufacturing units. In MENA region GCC countries have highest
per capita medicines consumption estimated at US$ 52 while in other countries, the
figure is estimated at about US$20 in 2004.
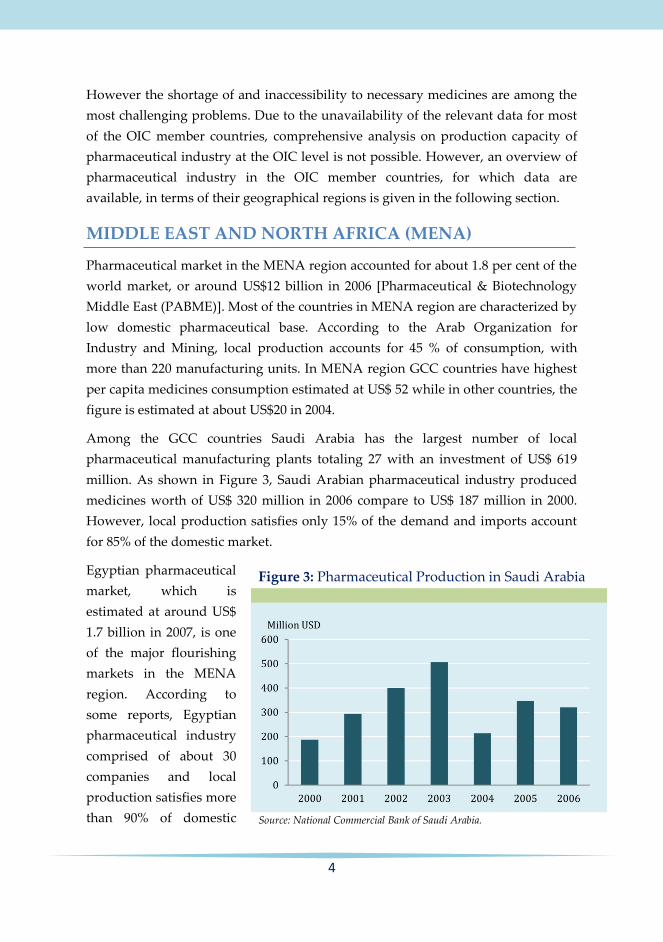
Among the GCC countries Saudi Arabia has the largest number of local
pharmaceutical manufacturing plants totaling 27 with an investment of US$ 619
million. As shown in Figure 3, Saudi Arabian pharmaceutical industry produced
medicines worth of US$ 320 million in 2006 compare to US$ 187 million in 2000.
However, local production satisfies only 15% of the demand and imports account
for 85% of the domestic market.
Egyptian pharmaceutical
market, which is
estimated at around US$
1.7 billion in 2007, is one
of the major flourishing
markets in the MENA
region. According to
some reports, Egyptian
pharmaceutical industry
comprised of about 30
companies and local
production satisfies more
than 90% of domestic
Figure 3: Pharmaceutical Production in Saudi Arabia
Source: National Commercial Bank of Saudi Arabia.
5
demand .On the other hand, Egypt is contributing 30% of supply in the MENA
pharmaceutical market.
Jordan is another major market in the MENA region. Jordanian pharmaceutical
industry consists of 17 factories and accounts for 3.5% of the total workforce
employed in the country’s industrial sector and is second largest export earning
industry after garment manufacturing. In 2005, Jordanian pharmaceutical industry
produced US$ 350 million worth of medicines compare to US$ 185 million in 2003.
Local production satisfies about 50 % of domestic market.
In the MENA region, UAE is one of the most expensive pharmaceutical markets
with per capita medicine expenditure estimated at about US$ 80. There are eight
pharmaceutical manufacturing units in UAE which presently satisfy around 10 %
of local demand (Dubai International Pharmaceuticals and Technologies
Conference and Exhibition, DUPHAT December 2008).
ASIA
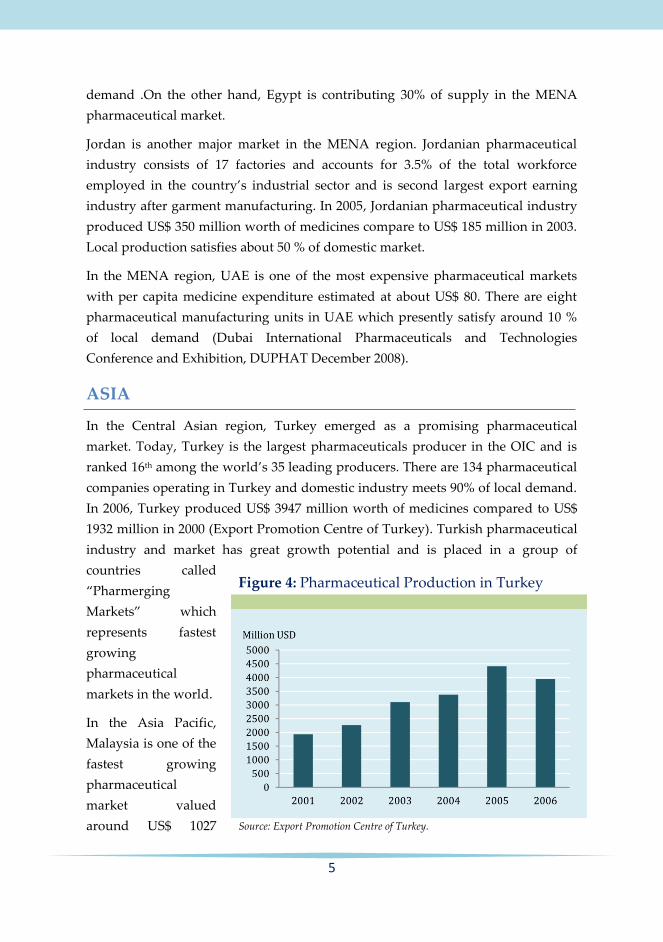
In the Central Asian region, Turkey emerged as a promising pharmaceutical
market. Today, Turkey is the largest pharmaceuticals producer in the OIC and is
ranked 16th among the world’s 35 leading producers. There are 134 pharmaceutical
companies operating in Turkey and domestic industry meets 90% of local demand.
In 2006, Turkey produced US$ 3947 million worth of medicines compared to US$
1932 million in 2000 (Export Promotion Centre of Turkey). Turkish pharmaceutical
industry and market has great growth potential and is placed in a group of
countries called
“Pharmerging
Markets” which
represents fastest
growing
pharmaceutical
markets in the world.
In the Asia Pacific,
Malaysia is one of the
fastest growing
pharmaceutical
market valued
around US$ 1027
Figure 4: Pharmaceutical Production in Turkey
Source: Export Promotion Centre of Turkey.
6
million in 2007 [Frost & Sullivan estimates 2008]. According to Malaysian Drug
Control Authority, in 2006, there were 246 registered pharmaceutical companies in
the country and local manufacturer produced about 25-30% of domestic demand.
Provided the rich natural resources (flora and fauna), Malaysia is envisaged as an
important biogeneric (herbal medicines and vitamins) market in the region.
Indonesia is another growing pharmaceutical market in the region estimated at
US$ 1.29 billion in 2006. According to Drug and Food Control Agency (BPOM),
Indonesia has a strong pharmaceutical manufacturing industry based on 108
companies. In 2005, local companies accounted for 90% of sales of medicines in the
country.
SUB-SAHARAN AFRICA (SSA)
The region of SSA accounts for 24% of global burden
of disease and represents less than 1% of global
health expenditures. Nearly 50% of SSA’s total health
expenditures are being financed by the patients.
According to World Health Survey 2003, the average
share of medicines in out-of-pocket health payments
in SSA (14 countries) is 37%, while at country level,
this share varies from 11% in Chad to 62.2 % in
Burkina Faso. In 2006, pharmaceutical market in SSA
was valued at US$ 3.8 billion, corresponding to 0.6 % of global market. In SSA, 37
out of 44 countries have some pharmaceutical production and local manufacturer
account for 25-30% of local demand. However, pharmaceutical production is
highly concentrated among a few countries. In 2006, SSA produced US $ 1.07
billion worth of pharmaceuticals out of which more than 70% (i.e. US$ 735 million)
was contributed by South Africa alone. Nigeria was the second leading producer
with a share of 10% (i.e. US$ 107 million). Among other OIC member countries,
Senegal produced US$ 22 million, Côte d’Ivoire produced US$ 14 million and
Uganda produced US$ 9 million worth of medicines in 2006.
PHARMACEUTICAL TRADE
Global pharmaceutical trade has shown an upward trend during the period 2005-
2010. According to the available data, world trade volume has increased from US$
556 billion in 2005 to US$ 824 billion in 2010. This corresponds to an increase of
7
over 48%. In 2010, Global pharmaceutical exports were valued at US$ 417 billion
while pharmaceutical imports were valued at US$ 407 billion. However, like the
production, pharmaceutical trade also remained highly concentrated in developed
world which accounted for about 93 % of world exports and absorbed nearly 82%
of pharmaceutical imports in 2010. As a group, developed countries are net
exporters of pharmaceutical products. On the other hand, the share of developing
countries in global pharmaceutical trade remained very low and they accounted for
only 7% of exports and 18 % of pharmaceutical imports in 2010. As a group,
developing countries are net importers of pharmaceutical products.
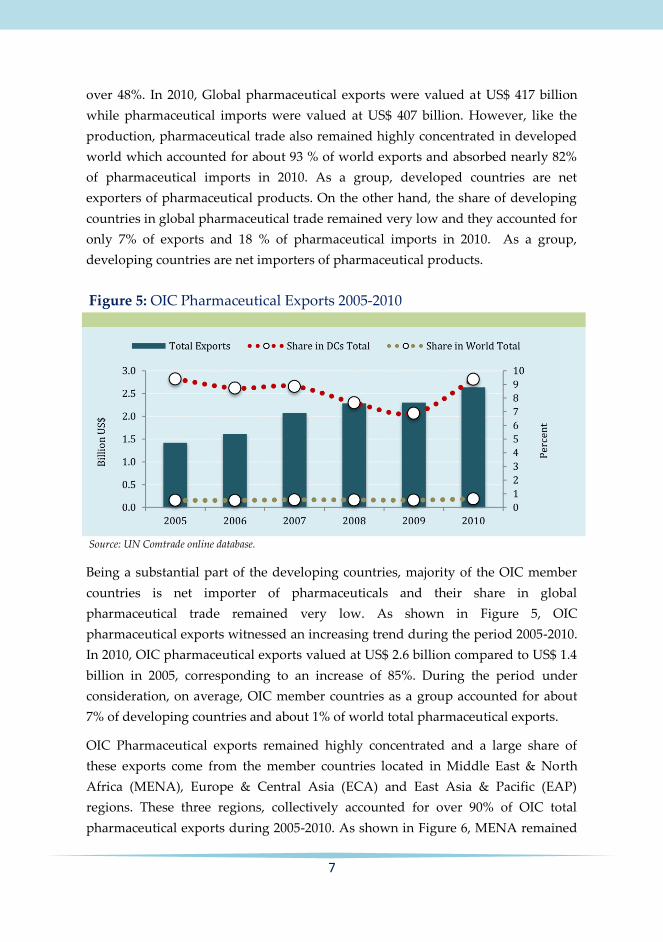
Being a substantial part of the developing countries, majority of the OIC member
countries is net importer of pharmaceuticals and their share in global
pharmaceutical trade remained very low. As shown in Figure 5, OIC
pharmaceutical exports witnessed an increasing trend during the period 2005-2010.
In 2010, OIC pharmaceutical exports valued at US$ 2.6 billion compared to US$ 1.4
billion in 2005, corresponding to an increase of 85%. During the period under
consideration, on average, OIC member countries as a group accounted for about
7% of developing countries and about 1% of world total pharmaceutical exports.
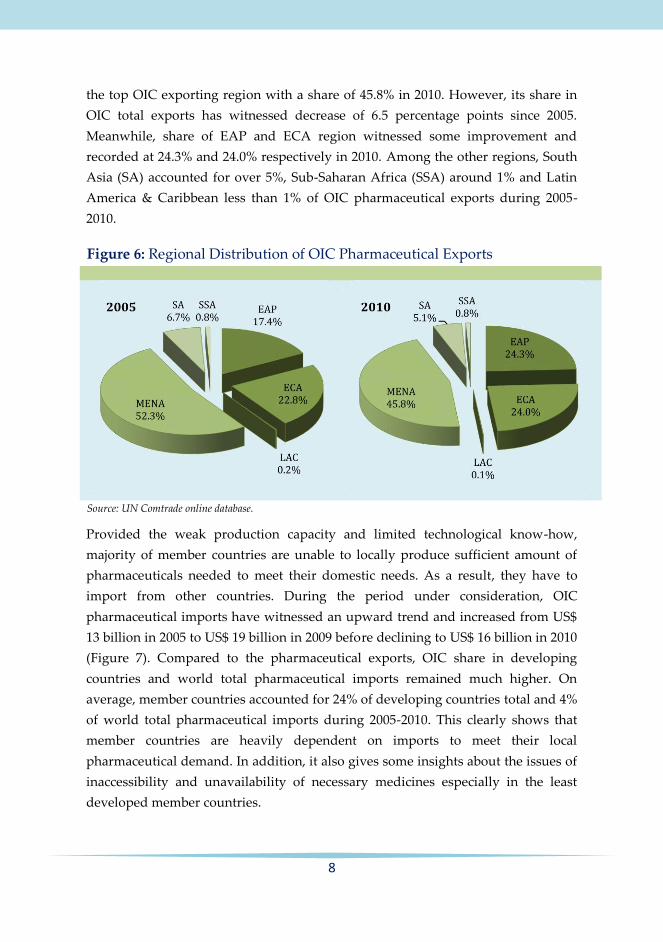
OIC Pharmaceutical exports remained highly concentrated and a large share of
these exports come from the member countries located in Middle East & North
Africa (MENA), Europe & Central Asia (ECA) and East Asia & Pacific (EAP)
regions. These three regions, collectively accounted for over 90% of OIC total
pharmaceutical exports during 2005-2010. As shown in Figure 6, MENA remained
Figure 5: OIC Pharmaceutical Exports 2005-2010
Source: UN Comtrade online database.
8
the top OIC exporting region with a share of 45.8% in 2010. However, its share in
OIC total exports has witnessed decrease of 6.5 percentage points since 2005.
Meanwhile, share of EAP and ECA region witnessed some improvement and
recorded at 24.3% and 24.0% respectively in 2010. Among the other regions, South
Asia (SA) accounted for over 5%, Sub-Saharan Africa (SSA) around 1% and Latin
America & Caribbean less than 1% of OIC pharmaceutical exports during 2005-
2010.
Provided the weak production capacity and limited technological know-how,
majority of member countries are unable to locally produce sufficient amount of
pharmaceuticals needed to meet their domestic needs. As a result, they have to
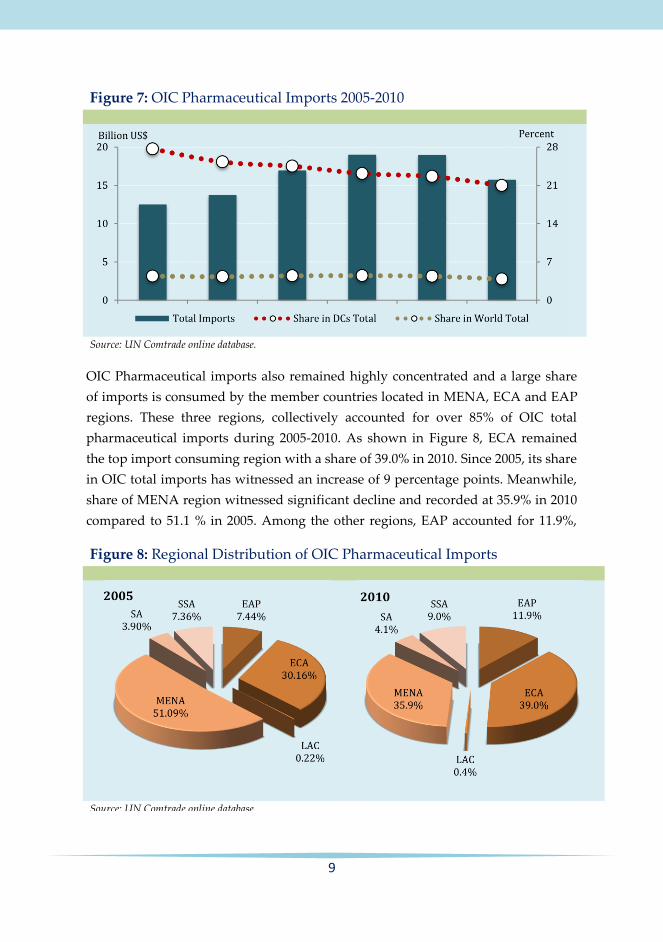
import from other countries. During the period under consideration, OIC
pharmaceutical imports have witnessed an upward trend and increased from US$
13 billion in 2005 to US$ 19 billion in 2009 before declining to US$ 16 billion in 2010
(Figure 7). Compared to the pharmaceutical exports, OIC share in developing
countries and world total pharmaceutical imports remained much higher. On
average, member countries accounted for 24% of developing countries total and 4%
of world total pharmaceutical imports during 2005-2010. This clearly shows that
member countries are heavily dependent on imports to meet their local
pharmaceutical demand. In addition, it also gives some insights about the issues of
inaccessibility and unavailability of necessary medicines especially in the least
developed member countries.
Figure 6: Regional Distribution of OIC Pharmaceutical Exports
Source: UN Comtrade online database.
9
OIC Pharmaceutical imports also remained highly concentrated and a large share
of imports is consumed by the member countries located in MENA, ECA and EAP
regions. These three regions, collectively accounted for over 85% of OIC total
pharmaceutical imports during 2005-2010. As shown in Figure 8, ECA remained
the top import consuming region with a share of 39.0% in 2010. Since 2005, its share
in OIC total imports has witnessed an increase of 9 percentage points. Meanwhile,
share of MENA region witnessed significant decline and recorded at 35.9% in 2010
compared to 51.1 % in 2005. Among the other regions, EAP accounted for 11.9%,
Figure 8: Regional Distribution of OIC Pharmaceutical Imports
Source: UN Comtrade online database.
Figure 7: OIC Pharmaceutical Imports 2005-2010
Source: UN Comtrade online database.
10
SSA for 9%, SA for 4% and LAC less than 1% of OIC pharmaceutical imports in
2010.
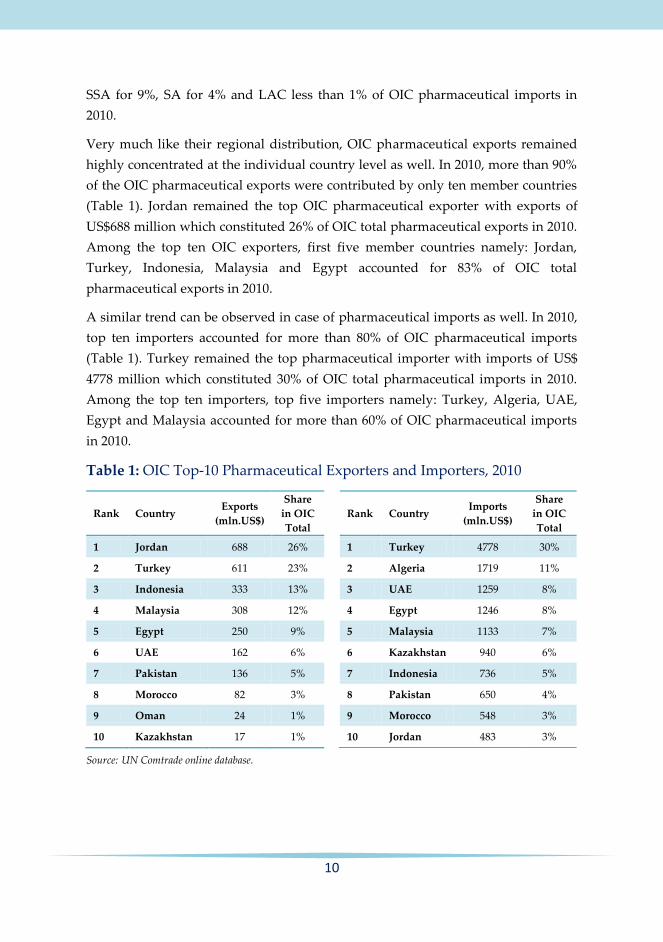
Very much like their regional distribution, OIC pharmaceutical exports remained
highly concentrated at the individual country level as well. In 2010, more than 90%
of the OIC pharmaceutical exports were contributed by only ten member countries
(Table 1). Jordan remained the top OIC pharmaceutical exporter with exports of
US$688 million which constituted 26% of OIC total pharmaceutical exports in 2010.
Among the top ten OIC exporters, first five member countries namely: Jordan,
Turkey, Indonesia, Malaysia and Egypt accounted for 83% of OIC total
pharmaceutical exports in 2010.
A similar trend can be observed in case of pharmaceutical imports as well. In 2010,
top ten importers accounted for more than 80% of OIC pharmaceutical imports
(Table 1). Turkey remained the top pharmaceutical importer with imports of US$
4778 million which constituted 30% of OIC total pharmaceutical imports in 2010.
Among the top ten importers, top five importers namely: Turkey, Algeria, UAE,
Egypt and Malaysia accounted for more than 60% of OIC pharmaceutical imports
in 2010.
Table 1: OIC Top-10 Pharmaceutical Exporters and Importers, 2010
Rank Country Exports
(mln.US$)
Share
in OIC
Total
1 Jordan 688 26%
2 Turkey 611 23%
3 Indonesia 333 13%
4 Malaysia 308 12%
5 Egypt 250 9%
6 UAE 162 6%
7 Pakistan 136 5%
8 Morocco 82 3%
9 Oman 24 1%
10 Kazakhstan 17 1%
Rank Country Imports
(mln.US$)
Share
in OIC
Total
1 Turkey 4778 30%
2 Algeria 1719 11%
3 UAE 1259 8%
4 Egypt 1246 8%
5 Malaysia 1133 7%
6 Kazakhstan 940 6%
7 Indonesia 736 5%
8 Pakistan 650 4%
9 Morocco 548 3%
10 Jordan 483 3%
Source: UN Comtrade online database.
11
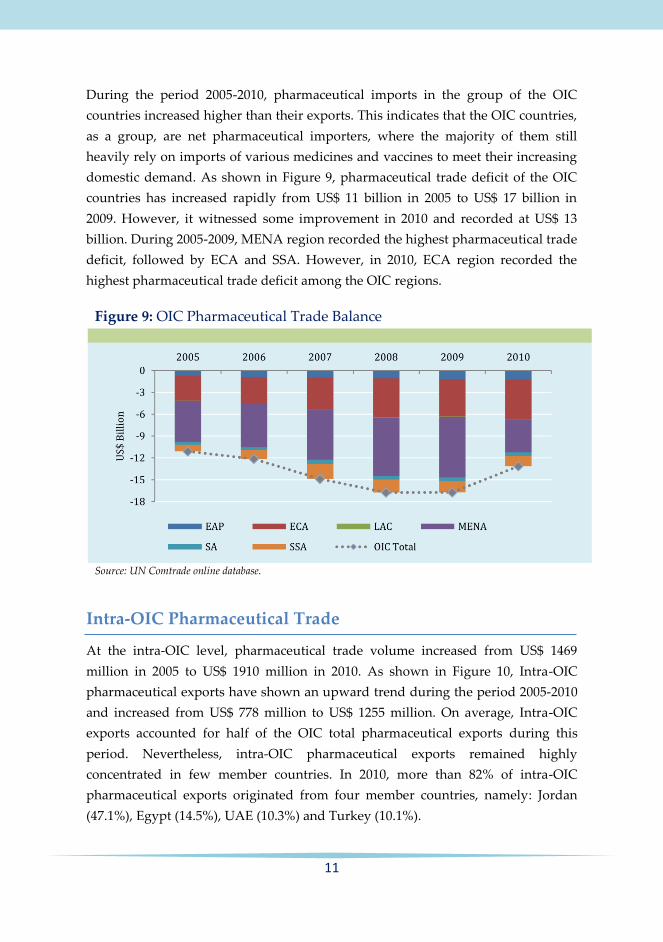
During the period 2005-2010, pharmaceutical imports in the group of the OIC
countries increased higher than their exports. This indicates that the OIC countries,
as a group, are net pharmaceutical importers, where the majority of them still
heavily rely on imports of various medicines and vaccines to meet their increasing
domestic demand. As shown in Figure 9, pharmaceutical trade deficit of the OIC
countries has increased rapidly from US$ 11 billion in 2005 to US$ 17 billion in
2009. However, it witnessed some improvement in 2010 and recorded at US$ 13
billion. During 2005-2009, MENA region recorded the highest pharmaceutical trade
deficit, followed by ECA and SSA. However, in 2010, ECA region recorded the
highest pharmaceutical trade deficit among the OIC regions.
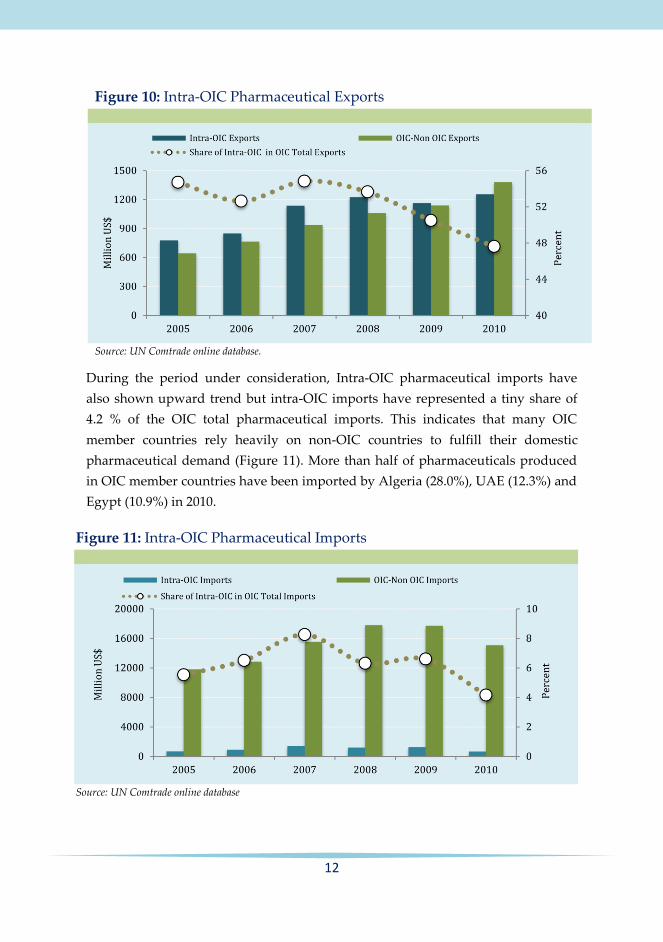
Intra-OIC Pharmaceutical Trade
At the intra-OIC level, pharmaceutical trade volume increased from US$ 1469
million in 2005 to US$ 1910 million in 2010. As shown in Figure 10, Intra-OIC
pharmaceutical exports have shown an upward trend during the period 2005-2010
and increased from US$ 778 million to US$ 1255 million. On average, Intra-OIC
exports accounted for half of the OIC total pharmaceutical exports during this
period. Nevertheless, intra-OIC pharmaceutical exports remained highly
concentrated in few member countries. In 2010, more than 82% of intra-OIC
pharmaceutical exports originated from four member countries, namely: Jordan
(47.1%), Egypt (14.5%), UAE (10.3%) and Turkey (10.1%).
Figure 9: OIC Pharmaceutical Trade Balance
Source: UN Comtrade online database.
12
During the period under consideration, Intra-OIC pharmaceutical imports have
also shown upward trend but intra-OIC imports have represented a tiny share of
4.2 % of the OIC total pharmaceutical imports. This indicates that many OIC
member countries rely heavily on non-OIC countries to fulfill their domestic
pharmaceutical demand (Figure 11). More than half of pharmaceuticals produced
in OIC member countries have been imported by Algeria (28.0%), UAE (12.3%) and
Egypt (10.9%) in 2010.
Figure 10: Intra-OIC Pharmaceutical Exports
Source: UN Comtrade online database.
Figure 11: Intra-OIC Pharmaceutical Imports
Source: UN Comtrade online database
13
CONCLUDING REMARKS
Despite showing rapid growth over the years,
global pharmaceutical industry remained
highly concentrated in the developed
countries, which dominate the global
pharmaceutical production, consumption and
trade. Although some developing countries
emerged as major contributor, the share of
developing countries in global pharmaceutical
industry remained very low.
OIC countries, as a group, remained net
importer of pharmaceuticals and with few
exceptions, the majority of them have very low pharmaceutical production base.
Considering the relatively high cost of health care and unavailability of medicines,
many OIC member countries have to make some serious efforts to boost the
pharmaceutical industry in their economies. To this end, the following related
concluding remarks can be made:
Pharmaceutical production requires skilled human resources like
scientists, pharmacists, biologists and lab technicians. Therefore, OIC
member countries should encourage and empower their education
system to impart quality knowledge in academic disciplines like
Chemistry, Biology, Medicines and other natural sciences. On the other
hand member countries should also give due attention to convert the
brain drain of highly skilled people into brain gain by facilitating the
national Diaspora to return their countries.
Pharmaceutical industry relies heavily on research and development
(R&D) activities. Hence proper R&D facilities should be built and
researchers and technicians should be provided with necessary financial
resources to develop an innovative pharmaceutical industry in the
member economies.
At the intra-OIC level, member countries should collaborate with each
other by sharing expertise for the development of pharmaceutical
industry. At the same time students mainly from least developed
countries can be enrolled in pharmaceutical related academic disciplines
in member countries with substantial pharmaceutical base like Turkey,
14
Egypt, Jordan and Malaysia to equip them with necessary knowledge
and expertise in this field.
At the international level, OIC member countries should collaborate with
the international agencies like WHO and World Bank to benefit from
their expertise and financial contribution to build their domestic
pharmaceutical industry.
REFERENCES
Bate Dr. Roger (2008) , Local Pharmaceutical Production in Developing Countries.
Dara Carr (2004), Improving the Health of the World’s Poorest People, Health Bulletin 1,
Population Reference Bureau Washington DC.
European Federation of Pharmaceutical Industries and Associations (EFPIA), The
Pharmaceutical Industry in Figures 2008.
European Federation of Pharmaceutical Industries and Associations (EFPIA), Medicines for
Mankind - Medicines for Developing Countries, 2007.
Export Promotion Centre of Turkey, Pharmaceutical Industry 2008.
House of Commons Health Committee Report 2004-2005 Session, The Influence of the
Pharmaceutical Industry.
IMS Health Market Prognosis, March 2011
Kaplan Warren and Richard Laing (2005), HNP discussion paper, Local Production of
Pharmaceuticals: Industrial Policy and Access to Medicines.
NCB , In Focus Report: Saudi Health Care Services Sector Review, December 2007.
World Health Organization (WHO), The World Medicine Situation 2004.
World Health Organization (WHO), The World Health Report 2008.
15
SESRIC Kudüs Caddesi No 9, Diplomatik Site:
06450 Çankaya, Ankara, Turkey Tel: +90-312-468 6172 (4 Lines) Fax: +90-312-467 3458
E-mail: [email protected] Web: www.sesric.org