pharmacokinetics and pharmacodynamics of the short-acting - bja
TRANSCRIPT

NEUROSCIENCES AND NEUROANAESTHESIA
Pharmacokinetics and pharmacodynamics of theshort-acting sedative CNS 7056 in sheepR. N. Upton 1*, A. A. Somogyi 2, A. M. Martinez 1, J. Colvill 1 and C. Grant 2
1 Discipline of Anaesthesia and Intensive Care, Royal Adelaide Hospital and 2 Discipline of Pharmacology, Faculty of Health Sciences,University of Adelaide, Adelaide, Australia
* Corresponding author. E-mail: [email protected]
Key points
† Methods were developedfor assessingpharmacokinetics andpharmacodynamics ofthe new benzodiazepineCNS 7056 using a sheepmodel.
† The drug has highmetabolic clearance,small distributionvolumes, and rapid onsetrecovery of sedativeeffect.
† CNS 7056 has thepotential to be a usefulsedative in clinicalpractice.
Background. CNS 7056 is a new short-acting esterase-metabolized benzodiazepine. Wereport the first pharmacokinetic (PK) and pharmacodynamic (PD) study of CNS 7056 andits inactive metabolite CNS 7054 in sheep.
Methods. The stability of CNS 7056 in blood samples was examined ex vivo. Six sheep wereprepared with physiological instrumentation, and were given doses of 0.37, 0.74, and 1.47mg kg21 (2 min infusion) of CNS 7056 in alternating order on separate days.
Results. CNS 7056 was degraded in warm whole sheep blood (23% over 2 h), but not inplasma or blood stored on ice. Using non-compartmental analysis (NCA), CNS 7056 had amean (SD) clearance of 4.52 (0.96) litre min21 and a terminal half-life of 21.3 (10.9) min.There was a rapid conversion of CNS 7056 to its metabolite CNS 7054, which had aterminal half-life of 22.5 (3.4) min. The arterial kinetics of CNS 7056 could be describedby a three-compartment model, with volumes of 1.9, 3.9, and 79 litre, a clearance of 4.2litre min21, and inter-compartmental clearances of 2.85 and 1.44 litre min21, while themetabolite could be described by a two-compartment model. Cardiac output was animportant covariate. Sedation as measured by the alpha power band of the EEGshowed rapid onset and offset. The t1/2,ke0 for sedation was 1.78 min, and the EC50 was0.10 mg ml21.
Conclusions. CNS 7056 has PK–PD properties compatible with its potential human use as ashort-acting i.v. sedative.
Keywords: benzodiazepine; cardiac output; CNS 7056; pharmacodynamics;pharmacokinetics; sedation; sheep
Accepted for publication: 9 August 2010
CNS 7056 is a selective benzodiazepine sedative with a highaffinity for all subtypes of the benzodiazepine gamma-aminobutyric acid A (GABAA) receptor,1 and is currentlyundergoing development. Doses of 25 mg kg21 of CNS7056 caused loss of righting reflex for �10 min in rats.1 Insheep, CNS 7056 doses in the range 0.37–2.21 mg kg21 pro-duced sedation with loss of consciousness for 9–25 min. Thepower in the alpha frequency band (8–13 Hz) of the EEG wasshown to be a continuous quantitative measure of sedationcaused by CNS 7056.2 In a subsequent study in sheep, thedynamic effects of CNS 7056 were compared with those ofmidazolam or propofol over a range of doses.3 CNS 7056was found to produce sedation with more rapid rates ofonset and offset than the other two sedatives. The cardiovas-cular and respiratory changes produced by all three sedativeswere approximately proportional to the depth of sedationproduced.
CNS 7056 is a methyl ester, and its hydrolysis product CNS7054 has low activity at the GABAA receptor.1 It is presumedthat ester hydrolysis of CNS 7056 to CNS 7054 is an importantmechanism, limiting the duration and intensity of sedativeeffect in vivo. However, the pharmacokinetic (PK) and phar-macodynamic (PD) properties of CNS 7056 have not beenreported in animals. This paper describes a PK–PD study ofCNS 7056 in sheep using three doses (0.37, 0.74, and 1.47mg kg21) corresponding to low, medium, and high doses inthe clinically useful range for this species.
The aims of the study were to develop methods formeasuring CNS 7056 and its metabolite CNS 7054 inplasma and to develop methods of studying the PKs of CNS7056 unaffected by ex vivo ester hydrolysis. In addition, weaimed to define the systemic PKs using non-compartmentalanalysis (NCA) of CNS 7056 and CNS 7054 in arterialblood and to develop a descriptive population-based
British Journal of Anaesthesia 105 (6): 798–809 (2010)Advance Access publication 6 October 2010 . doi:10.1093/bja/aeq260
& The Author [2010]. Published by Oxford University Press on behalf of the British Journal of Anaesthesia. All rights reserved.For Permissions, please email: [email protected]
Dow
nloaded from https://academ
ic.oup.com/bja/article/105/6/798/324109 by guest on 10 D
ecember 2021

compartmental model of the arterial kinetics and dynamicsof CNS 7056 and CNS 7054 in sheep.
MethodsEthical approval
The study was approved by the Animal Ethics Committee ofthe Institute of Medical and Veterinary Science and compliedwith the National Health and Medical Research Council ofAustralia Code of Conduct for the Care and Use of Animals.
Analysis of CNS 7056 in sheep plasma
In vitro studies and initial development of methods for con-ducting PK studies of CNS 7056 made use of an assay withsolvent extraction and ultraviolet (UV) detection. This assaycould not measure the metabolite CNS 7054. The final PKstudies made use of a liquid chromatograph mass spec-trometer (LCMS) assay with greater sensitivity and theability to quantitate the CNS 7054 metabolite.
UV assay method
The high-pressure liquid chromatograph (HPLC) (ShimadzuVP series with an SPD-M10A detector) used a C18 column(LUNA, 150×4.6 mm, Phenomenex, California, USA) with aflow rate of 1 ml min21 and the detector wavelength set at235 nm. The mobile phase was a 70:30 (v/v) mixture of Aand B, where A was a 90:10 methanol:water solution and Bwas a 10:90 methanol:water 2 mM with ammoniumacetate. Diazepam was used as the internal standard.
Plasma samples were processed as follows: 500 ml ofblood or plasma were stored in 1.5 ml Eppendorfw tubes.To each tube was added 12 ml of diazepam internal standardsolution, 200 ml of saturated sodium carbonate solution (pH13), and 500 ml of dichloromethane. The tubes were vortexmixed for 1 min and centrifuged (at 4200g, 5 min). Thelower organic phase was transferred into new Eppendorfw
tubes to evaporate under nitrogen gas for �10 min. Mobilephase buffer (100 ml) was added to the tube; the tube wasvortex mixed for 1 min and allowed to stand before injectioninto the HPLC (50 ml).
The retention time for CNS 7056 was 8.3 min and theinternal standard 9.7 min. Peak areas were quantitatedusing a data acquisition system. To assess the quality ofthe assay, six standard curves were prepared in blanksheep plasma over the concentration range of 0.1–2 mgml21, with quality control samples assayed in triplicate at0.5 and 2 mg ml21.
LCMS assay method
The LCMS system (Shimadzu, Kyoto, Japan) consisted of anLC-10AD pump, a DGU-12A solvent degasser, a SIL-10ADauto-injector, an SPD-10A UV–VIS detector, and anLCMS-2010A liquid chromatograph mass spectrometer withan electro-spray probe in the positive ionization mode. Thesystem was controlled using an SCL-10A system controller,and LCMS solutions software (v2.04-H3, Shimadzu). High
purity (99.99%) nitrogen gas (BOC Gases, Salisbury, Australia)was used for the nebulization and drying gases.
CNS 7056 and CNS 7054 were assayed concurrently, withalprazolam as an internal standard. Seven-point standardcurves were constructed for both CNS 7056 and CNS 7054over the concentration range of 0.2–20 mg ml21. Blankplasma obtained from the sheep before drug administration(5–10 ml) was thawed at room temperature then centri-fuged for 10 min at 2250 RCF. Each standard sample was pre-pared in a 1.5 ml Eppendorfw tube by spiking 100 ml of theblank sheep plasma with 20 ml of internal standard stock sol-ution (10 mg ml21 alprazolam in acetonitrile as weight offreebase) and 20 ml of CNS 7056 or CNS 7054 calibration orquality control stock solutions prepared in acetonitrile.These samples were then diluted with 260 ml of acetonitrilefor analysis. Each assay run also included a duplicate set ofindividually prepared quality control standards (0.7, 2, and7 mg ml21), and a blank standard comprising 300 ml of aceto-nitrile and 100 ml of blank sheep plasma. The peak areaoutput of the LCMS was non-linear. Plotting the outputagainst log concentration produced a linear relationship.4
Unknown concentrations from the study were interpolatedfrom these transformed standard curves.
The plasma samples were processed by thawing at roomtemperature and 250 ml aliquots were transferred into 1.5ml Eppendorfw tubes preloaded with 50 ml of internal stan-dard stock solution and 700 ml of acetonitrile. The standardand sample preparations were vortex mixed for 1 min fol-lowed by centrifugation for 10 min at 3250 RCF. Supernatant(112 ml) was transferred into injection vials preloaded with98 ml of Milli-Q H2O. Injection order was randomized withthe exception of a calibration standard (excluding thehighest and lowest) placed at the beginning and end ofeach injection sequence. Each sample (40 ml) was injectedonto a 2.0×150 mm C18 column with a mobile phase con-sisting of milli-Q H2O:acetonitrile:formic acid (60:40:0.1)running at 0.15 ml min21 (total run time 11 min). MS detec-tion utilized an APCI probe in SIM positive mode with thesedetection parameters: APCI probe: 400oC/4.5 kV, CDL:250oC/210 V, Block: 200oC, Detector: 1.5 kV, Q-array: 5.0 V(DC), nebulizing gas: N2 (2.5 litre min21), and drying gas: N2
(�10 litre min21). Target ions were acquired under these par-ameters according to the following mass:charge ratios, CNS7054: 425.10, CNS 7056: 439.10, and alprazolam: 309.10.
In vitro stability studies
As CNS 7056 (but not CNS 7054) may be subject to esterhydrolysis ex vivo, particular care was taken to ensure thatCNS 7056 did not degrade in blood samples obtained fromanimals during the time-course of a typical PK study (i.e.on the bench before the samples could be processed andfrozen). It was also important to ensure that plasmasamples stored in a freezer before analysis were notsubject to degradation. The following studies tested thesescenarios.
Pharmacokinetics and pharmacodynamics of CNS 7056 BJA
799
Dow
nloaded from https://academ
ic.oup.com/bja/article/105/6/798/324109 by guest on 10 D
ecember 2021

Bench stability
Fresh sheep blood was collected in Eppendorfw tubes andCNS 7056 added to give final concentrations of 0.5 mg ml21
(n¼6) or 2 mg ml21 (n¼6). The tubes were left at room temp-erature, then after 0, 60, or 120 min; duplicate samples wereassayed immediately for CNS 7056 using the UV assaydescribed above. Blank sheep blood was used to make stan-dard curves and quality controls. A similar study was con-ducted but using plasma rather than whole blood. A finalstudy used whole blood but with the tubes stored on ice,and with the time-scale reduced to 0, 10, and 20 min. Thedata were analysed using a linear mixed-effect model withthe ratio of observed to expected concentration as thedependent variable.
Freezer stability
Sheep blood was collected in heparinized tubes. The blood(1 ml) was placed into 32 Eppendorfw tubes and CNS 7056added to give final concentrations of 0.5 mg ml21 (n¼16)or 2 mg ml21 (n¼16). The tubes were centrifuged toharvest plasma. For each concentration, half of the plasmasamples were stored in a 2208C freezer (n¼8), the otherhalf in a 2808C freezer (n¼8). After 1, 30, 60, or 90 days inthe freezers, two tubes were taken from each group andassayed for CNS 7056 using the UV assay described above.Fresh sheep blood was used to make standard curves andquality controls for each new assay day. The data were ana-lysed using a linear mixed-effect model with the ratio ofobserved to expected concentration as the dependent vari-able. Freezer type, expected concentration, and days instorage were independent variables and replicate numberwas a random factor (repeated measure).
In vivo studies
General methods for sheep preparation
The general methods for the sheep preparation have beendescribed in detail previously.2 In brief, female Merinosheep of 1–3 yr age were prepared surgically under isoflur-ane anaesthesia with instrumentation for blood samplingand physiological measurements. No neuromuscular block-ing agent was used, and the adequacy of anaesthesia wasassessed by the absence of movement to stimuli. Eachsheep was prepared with: two aortic catheters (for bloodsampling and arterial pressure), one Swan–Ganz pulmonaryartery thermodilution catheter [for blood sampling andcardiac output (CO) measurement], one sagittal sinus cath-eter (to sample effluent blood from the brain), and threecatheters outside the right atrium (for central venouspressure, CO injectate, and drug administration). A Dopplerflow probe for measuring an index of cerebral blood flowwas secured above the dorsal sagittal sinus via a trephinehole.5 6 For EEG measurements, two silver electrodes wereplaced under the skull but above the dura on either side ofthe trephine hole, and a reference electrode was placedunder the scalp. Studies commenced 2 days after surgery.
Sheep breathed room air with unassisted ventilation duringthe studies.
Experimental design and PK measurements
CNS 7056 besylate (MW 597.5, chemical purity 97.6%, chiralpurity 98.3%) was supplied by PAION UK Limited, Cambridge,UK. Six sheep with an average weight of 45 kg (range 39–55.5 kg) were administered doses of 0.37, 0.74, and 1.47mg kg21 CNS 7056 base infused i.v. over 2 min on consecu-tive days and in alternating order (e.g. high-dose first or high-dose last). The sixth sheep did not receive the 1.47 mg kg21
dose due to limited compound availability. CO was measuredin triplicate using a thermodilution method immediatelybefore drug administration. During and after the infusion,blood was sampled rapidly from the aortic catheter atsample times of 0.25, 0.5, 0.75, 1, 1.25, 1.5, 1.75, 2, 2.5, 3,4, 5, 7.5, 10, 15, 20, 25, 30, 35, 40, 45, 60, and 90 min. Whole-blood samples (1.5 ml) were placed into Eppendorfw tubes inice, and were centrifuged to obtain plasma within 20 min ofsampling. The plasma was transferred to a second set ofEppendorfw tubes, and stored at 2808C until assay usingthe LCMS method.
PD measurements
In all studies, the raw EEG was measured using a Datex-Ohmeda S/5 monitor for 5 min before the start of the druginfusion, and after the administration of the drug until EEGreadings had returned to baseline for at least 10 min. Thepower spectrum of 8 s EEG epochs was calculated usingthe fast Fourier transform and used to calculate theaverage power in the alpha frequency band (8–13 Hz). Thealpha power has previously been shown to be a reliable con-tinuous measure of sedation for CNS 7056 in the sheep.2 EEGprocessing was performed using scripts written for the ‘R’data analysis software, Version 2.4.1.7
Data analysis
Non-compartmental PK analysis
NCA PK analysis was performed using the R data analysis andstatistical language.7 The integration of the area under theconcentration–time curve (AUC) used the ‘linear up, logdown’ method.8 The extrapolation of the terminal concen-trations used between three and six data points, as deter-mined by the linear regression of the log concentrationthat gave the highest R2 value. PK parameters were calcu-lated using standard equations.8
Compartmental PK modelling
The parent compound (CNS 7056) and metabolite (CNS 7054)were modelled concurrently using an NMQUAL (http://metruminstitute.org/index.html) validated installation ofthe NONMEMw (Version VI, level 2.0; GloboMax, Hanover,MD, USA). NONMEM was used in conjunction with theWings For NONMEMw interface (http://wfn.sourceforge.net/).Population parameters were assigned log-normal distri-butions for between-subject variability (BSV). Separate
BJA Upton et al.
800
Dow
nloaded from https://academ
ic.oup.com/bja/article/105/6/798/324109 by guest on 10 D
ecember 2021

additive and proportional residual error models were used forparent and metabolite. The conversion ratio of CNS 7056 toCNS 7054 was assumed to be 100%. The YLO functionalityof NONMEM was used to reduce the bias introduced by cen-soring of the data due to samples below the lower limit ofquantification (LLOQ) of the assay.9 The Laplacian estimationmethod with the interaction option was used for the finalmodels, but the faster first-order conditional method wasused for initial model development.
Combined PK models with combinations of two or three com-partments for CNS 7056 and one or two compartments for CNS7054 were examined using a modified two-stage approach thatallowed the parameters for each study to be estimated separ-ately. Models were tried with and without a lag term for thecentral compartment of the parent drug representing the lagin appearance of drug in blood due to vascular transit times.The best configuration of compartments was carried forwardto examine the need for between-occasion variability (BOV) inthe parameters and the influence of covariates. The availablecovariates were: dose (to test linearity), the order of thestudies in each sheep, body weight, and the CO measuredimmediately before the dose. Covariates were selected forexamination in the model in one of the two ways. First, using atraditional statistically based approach, covariate relationshipswere assessed by graphical inspection of plots of the post hocindividual parameter estimates vs covariates and screeningusing a regression-based technique. A covariate relationshipwas carried forward if it produced a statistically significant R2
value of .0.05 (i.e. the covariate explained at least 5% of thevariability in the parameter). These selected covariates werethen added to the parameter as a power model. The secondapproach used underlying mechanistic and allometric prin-ciples. The covariates body weight and CO were added tovolume parameters (e.g. V1, V2, and V3) and/or flow parameters(e.g. CL, Q12, and Q13) based on power models, with the powercoefficient being either 0.75, 1, or fitted from the data. Forexample, the following NONMEM code shows a power modelfor CO on clearance (CL) with a fitted power coefficient.
CL¼THETA(1)*EXP(ETA (1))*((CO/COSTD)**THETA(2)).
COSTD is the standard reference CO taken to be the meanbaseline CO across all studies, THETA(1) is the populationvalue of clearance and THETA(2) the power coefficient.
For both methods of covariate selection, models with andwithout covariates were compared using the Bayesian infor-mation criteria (BIC). This adjusts the objective function ofNONMEM for the number of parameters and observationsin the model (lower BIC implies a better model fit and/orfewer parameters for an equally good fit). The BIC can beused to compare un-nested models, and models with thesame number of parameters.
PD modelling
The concentration–effect (EEG alpha power) relationship wasexamined using a sequential PK–PD approach with NONMEM.This used the best Bayesian estimate of PK model parameter
values for each individual subject (i.e. post hoc parameters)to generate the arterial concentration input for a separatepopulation PD model. The base dynamic model used aneffect compartment and a sigmoid concentration–effectrelationship with the effect being either additive or pro-portional to the baseline EEG. Parameters for this modelwere examined for evidence that a reduced model wouldsuffice:
(i) Effect compartment could be removed (ke0 valuetends to a large number).
(ii) An Emax model preferred over a sigmoid Emax model[Hill coefficient (n) tends to 1].
(iii) A linear model is preferred over an Emax model (EC50
tends to a large value).
Statistical analysis
For the final PK and PD models, the precision of the par-ameter estimates (SE%) were obtained from the covariancestep of NONMEM. If the model did not pass the covariancestep, the parameter precision was determined from fitting200 bootstrap samples of the original data.
Linear mixed-effect modelling was used where appropri-ate.10 11 The significance level was P¼0.05. All data wereanalysed using the ‘R’ data analysis software,7 Version 2.4.1.
ResultsUV assay performance
Regression coefficients (R2) of the six validation standardcurves had median value of 0.998 (range 0.993–0.999),and the median intercept value was 0.05 mg ml21. Themedian inter-assay variability at 0.5 mg ml21 was 3.9%(range 1.7–8.7%) and at 2.0 mg ml21 was 3.6% (range0.2–13.1%). It was concluded that the assay was of suffi-cient quality to conduct initial studies of the stability ofCNS 7056.
LCMS assay performance
The transformed standard curves for all LCMS assays had amedian R2 value of 0.999 (range 0.990–1.000) for CNS7056, and a median R2 value of 0.999 (range 0.993–1.000)for CNS 7054. For CNS 7056, the median and 95% confidenceintervals of the deviation of the quality control samples fromthe expected values were 2.64% (27.37 to 15.01), 5.50%(27.92 to 12.75), and 6.49% (23.68 to 13.99) at concen-trations of 0.7, 2, and 7 mg ml21, respectively. For CNS7054, these values were 2.64% (210.78 to 14.68), 6.42%(211.17 to 17.70), and 6.33% (28.50 to 13.96) at concen-trations of 0.7, 2, and 7 mg ml21, respectively. The LLOQwas set at 0.2 mg ml21 and the limit of detection (LOD)was �0.02 mg ml21.
In vitro studies
Bench stability
Blood samples to which CNS 7056 had been added showed areduction (P,0.001) in CNS 7056 concentration with time
Pharmacokinetics and pharmacodynamics of CNS 7056 BJA
801
Dow
nloaded from https://academ
ic.oup.com/bja/article/105/6/798/324109 by guest on 10 D
ecember 2021

(Fig. 1). The average loss after 120 min was 23%. However,plasma samples with CNS 7056 added showed no such loss(P¼0.66) under the same conditions (Fig. 1), suggestingthat the degradation of CNS 7056 in blood samples couldbe attributed to cellular components of blood. The degra-dation could be minimized by storing blood samples on icefor short periods—there was minimal reduction in concen-trations with time under these conditions (P¼0.58; Fig. 1).The PK study protocol minimized ex vivo loss by rapidlystoring samples on ice, and separating plasma into asecond tube within 20 min of sampling.
Freezer stability
Freezer temperature (P¼0.34) and expected concentration(0.5 or 2 mg ml21, P¼0.23) did not affect the ratio of observedto expected concentration of CNS 7056 in the sample tubesafter storage. The number of days in storage was not signifi-cant (P¼0.78). These data show that plasma samples con-taining CNS 7056 could be stored in a 2208C or less freezerfor up to 3 months with minimal degradation. The samplesfor the PK study were stored at 2808C and the assays wereperformed within 3 months of the study.
PK data
The peak concentrations of CNS 7056 in arterial blood wereachieved at the end of the 2 min infusion, and the concen-trations thereafter declined rapidly (Fig. 2). Many samples(49.8%) had CNS 7056 concentrations between the LLOQ
1.47 mg kg–1
0.74 mg kg–1
0.38 mg kg–1
0
2
4
6
8
Con
cent
ratio
n (m
g m
l–1)
0 5 10 15 20Minutes
●●●
●●
●●
●
●
●●
● ●●
●
●●
1.47 mg kg–1
0.74 mg kg–1
0.38 mg kg–1
0 5 10 15 20
0
1
2
3
4
5
6
Minutes
Con
cent
ratio
n (m
g m
l–1)
● ●●●●
●
●●●
● ●
●
●● ● ● ● ● ●●
Fig 2 Arterial concentrations of CNS 7056 and CNS 7054 in thefirst 20 min. Data are mean (symbols) and SEM (error bars, n¼6low and medium dose, n¼5 for high dose).
0.6
0.8
1.0
1.2
1.4
0.6
0.8
1.0
1.2
1.4
0.6
0.8
1.0
1.2
1.4
0 20 40 60 80 100 120
Minutes
Con
cent
ratio
n ra
tioCNS 7056 stability in warm blood
●
●
●
0 20 40 60 80 100 120
Minutes
Con
cent
ratio
n ra
tio
CNS 7056 stability in plasma
● ●●
0 5 10 15 20
Minutes
Con
cent
ratio
n ra
tio
CNS 7056 stability in iced blood
●●
●
Fig 1 Stability of CNS 7056 samples stored on the bench. Thedata were pooled across expected concentration for plotting.The concentration in each sample is expressed as the ratioof the CNS 7056 concentration measured by assay (observed)and the concentration expected by the addition of a knownamount of CNS 7056 to the sample. There were statistically signifi-cant reductions in concentration for samples left on the bench aswarm blood (P,0.001), but not for plasma samples (P¼0.66) orblood stored on ice (P¼0.58) for short periods. Data are meanand SD (n¼4); the horizontal dashed line is the ratio at time zero.
BJA Upton et al.
802
Dow
nloaded from https://academ
ic.oup.com/bja/article/105/6/798/324109 by guest on 10 D
ecember 2021

and LOD of the assay, and the LOD was often reached beforethe last 90 min sample (Fig. 3). There was a rapid conversionof CNS 7056 to CNS 7054, with the peak concentrations ofthe metabolite being achieved at �5 min after the start ofthe infusion of CNS 7056 (Fig. 2). The CNS 7054 concen-trations declined less rapidly than the parent, with only13.3% of samples having concentrations between the LLOQ
and LOD, and there were generally quantifiable concen-trations in the 90 min samples.
Non-compartmental analysis
The NCA summary of CNS 7056 in arterial blood after the1.47 mg kg21 doses is shown in Table 1. The mean (SD)
Compound
CNS 7054
CNS 7056
Dose
0.37 mg kg–1
0.74 mg kg–1
1.47 mg kg–1
Time after dose (min)
log
Con
cent
ratio
n (µ
g m
l–1)
10−2
10−1.5
10−1
10−0.5
100
100.5
101
10−2
10−1.5
10−1
10−0.5
100
100.5
101
10−2
10−1.5
10−1
10−0.5
100
100.5
101
Sheep 233
Sheep 237
Sheep 239
0 20 40 60 80
Sheep 236
Sheep 238
Sheep 240
0 20 40 60 80
Fig 3 Observed and fitted arterial concentrations of CNS 7056 and CNS 7054. Each panel is data from one sheep. Observed data are symbols;the fits of the best combined model of parent and metabolite (Table 2) are shown by the solid lines.
Pharmacokinetics and pharmacodynamics of CNS 7056 BJA
803
Dow
nloaded from https://academ
ic.oup.com/bja/article/105/6/798/324109 by guest on 10 D
ecember 2021
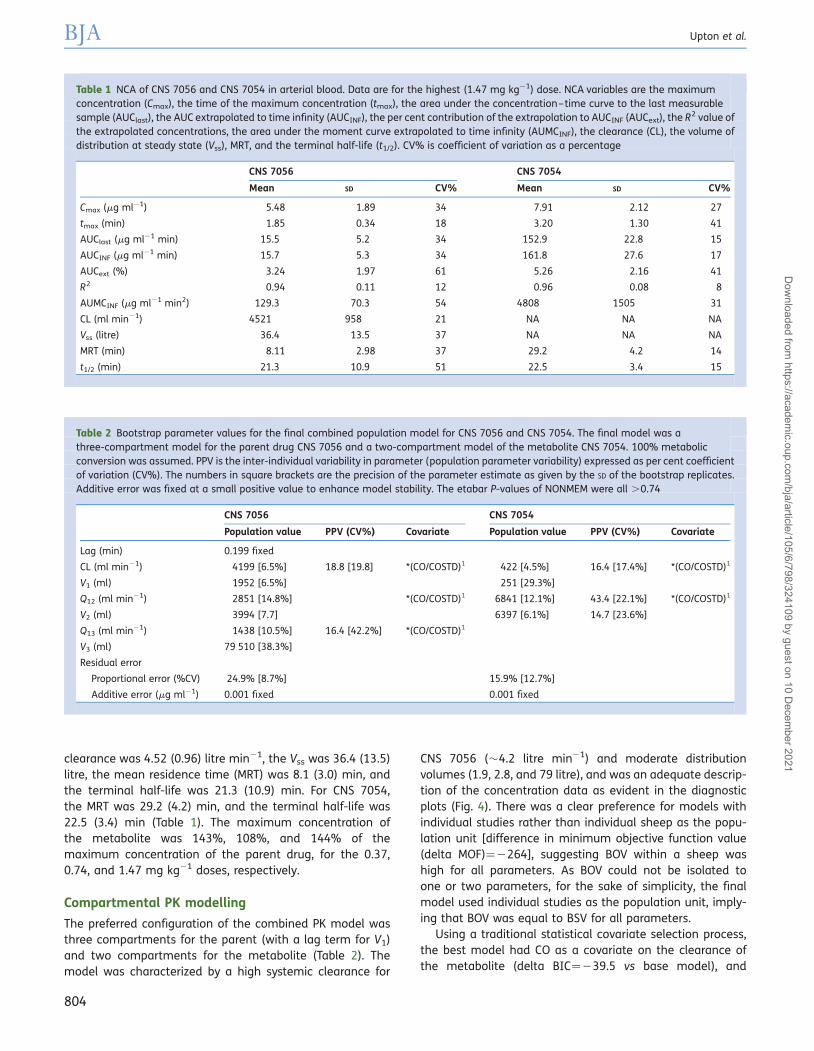
clearance was 4.52 (0.96) litre min21, the Vss was 36.4 (13.5)litre, the mean residence time (MRT) was 8.1 (3.0) min, andthe terminal half-life was 21.3 (10.9) min. For CNS 7054,the MRT was 29.2 (4.2) min, and the terminal half-life was22.5 (3.4) min (Table 1). The maximum concentration ofthe metabolite was 143%, 108%, and 144% of themaximum concentration of the parent drug, for the 0.37,0.74, and 1.47 mg kg21 doses, respectively.
Compartmental PK modelling
The preferred configuration of the combined PK model wasthree compartments for the parent (with a lag term for V1)and two compartments for the metabolite (Table 2). Themodel was characterized by a high systemic clearance for
CNS 7056 (�4.2 litre min21) and moderate distributionvolumes (1.9, 2.8, and 79 litre), and was an adequate descrip-tion of the concentration data as evident in the diagnosticplots (Fig. 4). There was a clear preference for models withindividual studies rather than individual sheep as the popu-lation unit [difference in minimum objective function value(delta MOF)¼2264], suggesting BOV within a sheep washigh for all parameters. As BOV could not be isolated toone or two parameters, for the sake of simplicity, the finalmodel used individual studies as the population unit, imply-ing that BOV was equal to BSV for all parameters.
Using a traditional statistical covariate selection process,the best model had CO as a covariate on the clearance ofthe metabolite (delta BIC¼239.5 vs base model), and
Table 2 Bootstrap parameter values for the final combined population model for CNS 7056 and CNS 7054. The final model was athree-compartment model for the parent drug CNS 7056 and a two-compartment model of the metabolite CNS 7054. 100% metabolicconversion was assumed. PPV is the inter-individual variability in parameter (population parameter variability) expressed as per cent coefficientof variation (CV%). The numbers in square brackets are the precision of the parameter estimate as given by the SD of the bootstrap replicates.Additive error was fixed at a small positive value to enhance model stability. The etabar P-values of NONMEM were all .0.74
CNS 7056 CNS 7054
Population value PPV (CV%) Covariate Population value PPV (CV%) Covariate
Lag (min) 0.199 fixed
CL (ml min21) 4199 [6.5%] 18.8 [19.8] *(CO/COSTD)1 422 [4.5%] 16.4 [17.4%] *(CO/COSTD)1
V1 (ml) 1952 [6.5%] 251 [29.3%]
Q12 (ml min21) 2851 [14.8%] *(CO/COSTD)1 6841 [12.1%] 43.4 [22.1%] *(CO/COSTD)1
V2 (ml) 3994 [7.7] 6397 [6.1%] 14.7 [23.6%]
Q13 (ml min21) 1438 [10.5%] 16.4 [42.2%] *(CO/COSTD)1
V3 (ml) 79 510 [38.3%]
Residual error
Proportional error (%CV) 24.9% [8.7%] 15.9% [12.7%]
Additive error (mg ml21) 0.001 fixed 0.001 fixed
Table 1 NCA of CNS 7056 and CNS 7054 in arterial blood. Data are for the highest (1.47 mg kg21) dose. NCA variables are the maximumconcentration (Cmax), the time of the maximum concentration (tmax), the area under the concentration–time curve to the last measurablesample (AUClast), the AUC extrapolated to time infinity (AUCINF), the per cent contribution of the extrapolation to AUCINF (AUCext), the R2 value ofthe extrapolated concentrations, the area under the moment curve extrapolated to time infinity (AUMCINF), the clearance (CL), the volume ofdistribution at steady state (Vss), MRT, and the terminal half-life (t1/2). CV% is coefficient of variation as a percentage
CNS 7056 CNS 7054
Mean SD CV% Mean SD CV%
Cmax (mg ml21) 5.48 1.89 34 7.91 2.12 27
tmax (min) 1.85 0.34 18 3.20 1.30 41
AUClast (mg ml21 min) 15.5 5.2 34 152.9 22.8 15
AUCINF (mg ml21 min) 15.7 5.3 34 161.8 27.6 17
AUCext (%) 3.24 1.97 61 5.26 2.16 41
R2 0.94 0.11 12 0.96 0.08 8
AUMCINF (mg ml21 min2) 129.3 70.3 54 4808 1505 31
CL (ml min21) 4521 958 21 NA NA NA
Vss (litre) 36.4 13.5 37 NA NA NA
MRT (min) 8.11 2.98 37 29.2 4.2 14
t1/2 (min) 21.3 10.9 51 22.5 3.4 15
BJA Upton et al.
804
Dow
nloaded from https://academ
ic.oup.com/bja/article/105/6/798/324109 by guest on 10 D
ecember 2021

more complex covariate models using up to five of the bestcovariate relationships determined from the post hoc par-ameters were not supported by objective function changeswhen included in the model. However, covariate modelsembodying mechanistic and allometric principles were gen-erally superior to those based on the traditional statistical
approach. The best model overall had CO as a covariate forthe flow parameters (e.g. CL or Q) with a fitted power coeffi-cient (delta BIC¼270.3 vs base model). However, this modelwas only marginally better than a model in which the powercoefficient for CO on flow parameters was fixed at 1 (deltaBIC¼266.4 vs base model). As this latter model embodies
PRED Concentration (µg ml–1)
OB
S C
once
ntra
tion
(µg
ml–1
)
0
2
4
6
8
10
0 2 4 6 8 10IPRED Concentration (µg ml–1)
OB
S C
once
ntra
tion
(µg
ml–1
)
0
2
4
6
8
10
0 2 4 6 8 10
Time (min)
CW
RE
S
−4
−2
0
2
4
0 20 40 60 80
Concentration (µg ml–1)
CW
RE
S
−4
−2
0
2
4
1 2 3 4 5 6 7
Fig 4 Diagnostic plots for the final combined PK model. In all plots, the data for CNS 7056 are shown by +, while CNS 7054 is shown by x. Thesolid line is a line with slope of 1 or 0, and the dashed line is a loess smoothed line for the data. Upper left: observed concentration plottedagainst population predicted (PRED) concentration. Data are evenly distributed about the line of identify, indicating no major bias in the popu-lation component of the model. Upper right: observed concentration plotted against individual population predicted (IPRED) concentration.Data are evenly distributed about the line of identify, indicating an appropriate structural model could be found for each individual. Middle:conditional weighted residual (CWRES) plotted against time. Data are evenly distributed about zero, indicating no major bias in the structuralmodel. Lower: conditional weighted residual (CWRES) plotted against the population predicted (PRED) concentration. Data are evenly distrib-uted about zero, indicating no major bias in the residual error model.
Pharmacokinetics and pharmacodynamics of CNS 7056 BJA
805
Dow
nloaded from https://academ
ic.oup.com/bja/article/105/6/798/324109 by guest on 10 D
ecember 2021

the underlying physiological principle that changes in sys-temic clearance (CL) and inter-compartmental clearance(Q) are directly proportional to CO for a high clearancedrug,12 this model was chosen as the final model. Therewas no support for body weight, dose, or study order as cov-ariates for the model parameters. There was no support fornon-linear elimination. This together with the fact thatdose was not a covariate imply that the kinetics of CNS7056 were linear.
Compartmental PD modelling
A sigmoid Emax dynamic model was an adequate descriptionof the data (Table 3). The observed and fitted time-courses ofthe EEG alpha power for the three dose groups are summar-ized in Figure 5, and the model diagnostic plots in Figure 6.Increasing the dose increased the duration of action, butall three doses were characterized by rapid onset andoffset of sedation. The effect compartment rate constantwas 0.39 min21, giving a t1/2,ke0 of 1.78 min. The modelwas characterized by a steep concentration–effect relation-ship (Hill factor¼5.2); however, the magnitude of themaximum effect (Emax) was highly variable betweenanimals. As the onset and offset times for sedation weresimilar between sheep, this may reflect between-animalvariability in the EEG response or measurement rather thanthe underlying level of sedation.
Discussion and conclusionWe present the first report of the PKs and PDs of CNS 7056and its major metabolite CNS 7054 in a large animalspecies. While a relatively rapid decline in the blood concen-tration of CNS 7056 was anticipated, it was found that therate of decline and standard curve values chosen for thisinitial study was such that a disproportionate number ofblood samples had CNS 7056 (but not CNS 7054) concen-trations between the LLOQ and LOD of the assay, particularlyfor the lower doses. This could be rectified to some extent insubsequent studies by using a lower range for the standardcurve. CNS 7056 concentrations from this ‘uncalibrated’
Table 3 Parameter values for the population PD model for CNS 7056. The final equation describing the time-course of the EEG alpha power was:EEGalpha¼base×[1+(Emax×Ceff
n )/(EC50n +Ceff
n )], where Ceff is the effect compartment concentration. PPV is the inter-individual variability inparameter (population parameter variability) expressed as per cent coefficient of variation (CV%). The numbers in square brackets are theprecision of the parameter estimate (SE%) returned by the covariance step of NONMEM. An omega block was used in NONMEM to allowcorrelation between all population parameters. The etabar P-values of NONMEM were all .0.80
Parameter Description Population value PPV (CV%)
ke0 (min21) Effect compartment rate constant 0.392 [7.1%] 21.0 [30.8%]
Base (mV2) Baseline (pre-drug) EEG alpha power 1.51 [5.7%] 58.4 [39.8%]
Emax (mV2) Maximum EEG alpha power 4.19 [12.0%] 419 [27.7%]
EC50 (mg ml) Concentration corresponding tohalf-maximum EEG alpha power
0.10 [7.2%] 50.0 [40.9%]
n Hill (steepness) coefficient 5.18 [2.8%]
Proportional error (%CV) 38.2 [25.5%]
Time after dose (min)
EE
G a
lpha
pow
er (
mV2
)
0
5
10
15
20
25
0
5
10
15
20
25
0
5
10
15
20
25
0.37 mg kg–1
●●●●●●
●
●
●
●
●
●
●
●
●● ● ● ●
0.74 mg kg–1
●● ●
●
●
●
●
●
●
●●●●●
●
●
●
●
●
1.47 mg kg–1
●
● ●
● ●●●
●
●
●
●
●
●
●
●
●
●
●
0 10 20 30 40
Sheep● 233
236237238239240
Fig 5 Observed and fitted EEG alpha power. Each panel is datafor one dose group. Observed data are symbols; the fits of thebest PD model (Table 3) are shown by the solid or dashed line.
BJA Upton et al.
806
Dow
nloaded from https://academ
ic.oup.com/bja/article/105/6/798/324109 by guest on 10 D
ecember 2021

PRED EEG alpha power (mV2)
OB
S E
EG
alp
ha p
ower
(mV
2 )
0
5
10
15
20
25
0 5 10 15 20 25IPRED EEG alpha power (mV2)
OB
S E
EG
alp
ha p
ower
(mV
2 )
0
5
10
15
20
25
0 5 10 15 20 25
Time (min)
CW
RE
S
−5
0
5
0 10 20 30 40
IPRED EEG alpha power (mV2)
CW
RE
S
−5
0
5
2 3 4 5 6 7
Fig 6 Diagnostic plots for the final PD model. The solid line is a line with slope 1 or 0, and the dashed line is a loess smoothed line for the data.Upper left: observed EEG alpha power plotted against population predicted (PRED) EEG alpha power. Data are evenly distributed about the lineof identify, indicating no major bias in the population component of the model. Upper right: observed EEG alpha power plotted against indi-vidual population predicted (IPRED) EEG alpha power. Data are evenly distributed about the line of identify, indicating an appropriate structuralmodel could be found for each individual. Middle: conditional weighted residual (CWRES) plotted against time. Data are evenly distributedabout zero, indicating no major bias in the structural model. Lower: conditional weighted residual (CWRES) plotted against the population pre-dicted (PRED) EEG alpha power. Data are evenly distributed about zero, indicating no major bias in the residual error model.
Pharmacokinetics and pharmacodynamics of CNS 7056 BJA
807
Dow
nloaded from https://academ
ic.oup.com/bja/article/105/6/798/324109 by guest on 10 D
ecember 2021

part of the standard curve were included in the analysis aspost hoc investigation showed the response of the trans-formed standard curve was linear over these lower rangesof concentrations. However, two steps were taken toensure that the uncalibrated CNS 7056 concentrations didnot unduly influence the derived PK parameters. First, theNCA analysis was restricted only to the highest dose given(1.47 mg kg21), so that the extrapolated AUC favoured CNS7056 concentrations in the calibrated range of the standardcurve. Secondly, the PK model was developed for parent drugand metabolite concurrently. For the model to simul-taneously describe the data for both CNS 7056 and CNS7054, the measured concentrations needed to be internallyconsistent between the two concentration sets (i.e. theinferred rate of formation of CNS 7054 at any given timemust match the inferred rate of loss of CNS 7056). The factthat an unbiased model could be developed suggests thatthe lower uncalibrated CNS 7056 concentrations did notdeviate greatly from those implied by all other calibratedmeasurements.
The development of the PK model of CNS 7056 and CNS7054 presented an opportunity to examine the role ofpre-dose CO on model parameters. There is growing recog-nition of the influence of CO on the kinetics of high clearancedrugs.13 – 15 A traditional covariate selection process basedon statistical principles favoured a model with CO as a covari-ate on only one parameter (CL of the metabolite). While stat-istically plausible, this isolated influence of CO is difficult torationalize if it is considered that CO can affect drug distri-bution and elimination in many organs of the body.However, covariate models based on underlying physiologi-cal principles were found to be a better fit of the data, andneeded fewer fitted parameters. The final model (Table 2)used CO as a parameter on the ‘flow’ related parametersCL and Q. Although the physiological identities of compart-ments in traditional mamillary models are ambiguous, thisconfiguration of the covariate model is consistent with theconcept of CO affecting the rate of delivery of drugs tosites of drug distribution and elimination. The present datasuggest that there is merit in incorporating the relationshipbetween blood flow and compartmental model parametersusing underlying physiological principles—a process thathas been termed ‘bottom-up’ rather than ‘top-down’ covari-ate model building.16
The ideal PK profile of drugs given i.v. for sedation andanaesthesia is different from that of most other drugs.Drugs given by the oral route ideally have a low hepatic clear-ance for enhanced bioavailability and a long persistence inthe body. In contrast, it is recognized that the key to effectivei.v. sedation and anaesthesia is having a drug that is rapidlyremoved from the blood, so that titration of effect can beachieved through rapid dose adjustment. Persistence ofaction can be readily achieved by the use of a continuousi.v. infusion.
For drugs given as an i.v. bolus, the post-injection declinein blood concentration occurs due to a combination ofmetabolic elimination (as described by clearance) and
redistribution into peripheral tissues (as described by the per-ipheral distribution volumes). While the two processes arefunctionally indistinguishable after a single dose, the redistri-bution process diminishes with repeated doses or longerinfusions as the peripheral tissues become ‘full’ of drug.Drugs that rely on redistribution (high distribution volumes)to lower their blood concentration and terminate theireffect suffer from the problem that the longer the drug isinfused, the slower the recovery at the end of an infusion.This phenomenon has been described by the concept of‘context sensitive half-times’.17 The present study suggeststhat the high clearance of CNS 7056 is responsible for itsshort duration of action. In sheep, the total body clearancewas very high (�4 litre min21) and was much higher thanthe hepatic blood flow of sheep (�2.6 litre min21),18 indicat-ing significant extra-hepatic metabolism. The in vitro studiesshowed that some of this metabolism occurred directly in theblood (but not plasma), suggesting a role for the red bloodcell in metabolism. High extra-hepatic clearance alsoconfers the theoretical advantages of kinetics unduly influ-enced by hepatic and renal failure, and little scope for meta-bolic interactions with other drugs in the liver.
We conclude that in sheep CNS 7056 showed the PK andPD properties of a useful i.v. sedative: high metabolic clear-ance, small distribution volumes, rapid onset and offset ofsedative effect, and predictable effects over a range ofdoses. Collectively, these properties would favour its clinicaluse as an i.v. sedative if they were also displayed inhumans. Initial clinical data suggest that rapid recoveryafter sedation with CNS 7056 is also seen in men.19
AcknowledgementsThe authors acknowledge the contribution of the staff andinfrastructure of the Surgical Research Facility of the Instituteof Medical and Veterinary Science, Adelaide, Australia. BenDavies is thanked for assistance with assay development.
Conflict of interestNone declared.
FundingThis research was funded by PAION UK Limited, Histon,Cambridge, UK, the developers of CNS 7056.
References1 Kilpatrick GJ, McIntyre MS, Cox RF, et al. CNS 7056: a novel
ultra-short-acting benzodiazepine. Anesthesiology 2007; 107:60–6
2 Upton RN, Martinez AM, Grant C. A dose escalation study in sheepof the effects of the benzodiazepine CNS 7056 on sedation, theEEG, and the respiratory and cardiovascular systems. Br J Pharma-col 2008; 155: 52–61
3 Upton RN, Martinez AM, Grant C. Comparison of the sedativeproperties of CNS 7056, midazolam, and propofol in sheep. Br JAnaesth 2009; 103: 848–57
BJA Upton et al.
808
Dow
nloaded from https://academ
ic.oup.com/bja/article/105/6/798/324109 by guest on 10 D
ecember 2021

4 Georgita C, Albu F, David V, Medvedovici A. Nonlinear calibrationson the assay of dilitiazem and two of its metabolites from plasmasamples by means of liquid chromatography and ESI/MS detec-tion: application to a bioequivalence study. Biomed Chromatogr2008; 22: 289–97
5 Upton R, Grant C, Ludbrook G. An ultrasonic Doppler venousoutflow method for the continuous measurement of cerebralblood flow in conscious sheep. J Cereb Blood Flow Metab 1994;14: 680–8
6 Doolette DJ, Upton RN, Grant C. Agreement between ultrasonicDoppler venous outflow and Kety and Schmidt estimates ofcerebral blood flow. Clin Exp Pharmacol Physiol 1999; 26:736–40
7 R Development Core Team. R: A Language and Environment forStatistical Computing. Vienna, Austria: R Foundation for StatisticalComputing, 2005
8 Gabrielsson J, Weiner D. Pharmacokinetic and PharmacokineticData Analysis: Concepts and Applications, 3rd Edn. Stockholm:Swedish Pharmaceutical Press, 2000
9 Bergstrand M, Karlsson MO. Handling data below the limit ofquantification in mixed effect models. AAPS J 2009; 11: 371–80
10 Venables WN, Ripley BD. Modern Applied Statistics with S-plus, 4thEdn. Germany: Springer, 2002
11 Shafer SL, Struys MM. Mixed effect modeling in analgesia trials.Anesth Analg 2008; 107: 9–10
12 Upton RN. Relationships between steady state blood concen-trations and cardiac output during intravenous infusions. Bio-pharm Drug Dispos 2000; 21: 69–76
13 Upton RN, Ludbrook GL, Grant C, Martinez AM. Cardiac outputis a determinant of the initial concentrations of propofol aftershort-infusion administration. Anesth Analg 1999; 89: 545–52
14 Kuipers JA, Boer F, Olofsen E, et al. Recirculatory and compart-mental pharmacokinetic modeling of alfentanil in pigs: the influ-ence of cardiac output. Anesthesiology 1999; 90: 1146–57
15 Minto CF, Schnider TW. Contributions of PK/PD modeling tointravenous anesthesia. Clin Pharmacol Ther 2008; 84: 27–38
16 Jamei M, Dickinson GL, Rostami-Hodjegan A. A framework forassessing inter-individual variability in pharmacokinetics usingvirtual human populations and integrating general knowledgeof physical chemistry, biology, anatomy, physiology and genetics:a tale of ‘bottom-up’ vs ‘top-down’ recognition of covariates.Drug Metab Pharmacokinet 2009; 24: 53–75
17 Bailey JM. Context-sensitive half-times: what are they and howvaluable are they in anaesthesiology? Clin Pharmacokinet 2002;41: 793–9
18 Upton RN. Organ weights and blood flows of sheep and pig forphysiological pharmacokinetic modelling. J Pharmacol ToxicolMethods 2008; 58: 198–205
19 Sneyd JR, Rigby-Jones AE. New drugs and technologies, intravenousanaesthesia is on the up (again). Br J Anaesth 2010; 105: 246–54
Pharmacokinetics and pharmacodynamics of CNS 7056 BJA
809
Dow
nloaded from https://academ
ic.oup.com/bja/article/105/6/798/324109 by guest on 10 D
ecember 2021