pharmacy benefit management discussion - wespath€¦ · pharmacy benefit management discussion...
TRANSCRIPT

Pharmacy Benefit Management
Discussion
October 25, 2017
Presented by: Seth Friedman, National Pharmacy Practice Leader
Proprietary and Confidential

PBM 101
The Basics
The Market
The Flow of Money
Copay Coupons
Open Discussion

PBM 101

PBM 101

AWP
• The “Average Wholesale Price”
• Is a list price, not what is paid (similar to a car MSRP)
• First DataBank and Medi-Span were the two primary suppliers of
this information
• Ongoing Litigation with First Databank has now forced FDB to
stop publishing
• PBMs/MCOs typically offer a discount off of AWP (“AWP – 15%”)

MAC
• MAC stands for “the Maximum Allowable Cost”
• Represents the maximum cost per unit of medication (tablet,
capsule, etc.) that a plan will pay for that product
• Primarily used to set pricing for similar generic products
• While Medicaid’s old Federal Upper Limit is often credited with
being one of the earliest and most well known MAC lists, it is no
longer the industry standard.
Is a PBM
allowed to
have more
than one
MAC?

U&C
• U&C stands for the “Usual and Customary” price
• Very different from the Medical term “U&C”
• U&C represents the price a pharmacy would sell a product to an
individual consumer that did not have a prescription insurance
card.
• Commonly referred to as the “cash price” for the prescription
• Each individual pharmacy sets it’s own U&C price
• Costco and Sam’s Club represent pharmacy chains that still offer
deep U&C pricing discounts
• As network rates have gotten deeper, U&C has recently had less
impact

GDR
• GDR is the “generic dispensing rate”
• Also known as GFR (Generic Fill Rate)
• The generic dispensing rate is calculated by taking the total
number of generic prescriptions divided by the total number of all
prescriptions
• Example:
42 Brand Rx
58 Generic Rx
100 Total Rx
58/100 = 58% Generic Dispensing Rate
GSR
• GSR is the generic substitution rate (measures the plan’s
effectiveness of moving to a generic, when possible)
• Measures effectiveness in switching to a generic product
when a brand prescription is written for a product that has a
generic available
• Brand drugs that have a generic available in the market are
commonly referred to as “Multi-Source Brand Products”
• The GSR is calculated by taking the number of generic products
and dividing by the combined total of generic products plus
multisource brands
• Example: 45 Generics / (45 Generics + 5 Multisource Brands) =
90%
• Most plans will average well over 90% in terms of GSR

What are Brand Drugs?
• Compounds discovered by Brand pharmaceutical manufacturers
• Marketing Names are given to chemical compounds
• Brand Drugs are typically very expensive due the time and money
needed to research product and get it approved by the FDA
• Only a fraction of the cost is actually attributable to the manufacturing of
the product
What’s the
average
undiscounted
cost of a 30
day brand
drug?

What are Generic Drugs?
• Manufactured when the patent expires on the Brand drug
• Per the FDA website, the FDA requires that:
“A generic drug is identical, or bioequivalent to a brand name drug in dosage form, safety,
strength, route of administration, quality, performance characteristics and intended use.”
• First to file gets a six month exclusivity period (Single Source
Generic)
• Trademark laws prohibit the generic from looking exactly like the brand
product.
What percent
of drugs
dispensed
are generics?
How much do
they cost?
Brand Zocor Generic
simvastatin

Why are Generic Drugs so Inexpensive?
• No substantial funding of drug discovery
• Increased competition
• Do not bear the burden of proving safety
• Residual benefits of marketing from Brand companies
• Generic companies will sometimes strike deals with Brand Companies to
have them manufacture the product for them
• Some popular Brand Name Drugs that are now generic
• Some argue generics are safer, as they have been market tested!
Brand Name Generic Name (Equivalent to the
Brand)
Zocor simvastatin
Prozac fluoxetine
Norvasc amlodipine
Zoloft sertraline
Prilosec omeprazole

What are Specialty Products (Drugs)?
• Very high cost medicines
• Used to treat complex diseases
• Rheumatoid Arthritis, Hemophilia, MS and Hepatitis C are examples
• Historically billed through medical and given in doctors office
• PBM is building capabilities in this area
• Sometimes require special handling (refrigeration)
• Commonly, Specialty products are thought of as “Biotech” or “Injectible”
products
• Biotech –Drugs are result of companies genetically altering
micro-organisms
• Injectibles –Injected into the bloodstream directly
• Limited Distribution arrangements are starting to grow in popularity
• Orphan Drugs

Common Specialty Drugs
Drug Class Average Cost
Per Rx
Enbrel Rheumatoid Arthritis $4,500
Copaxone Multiple Sclerosis $4,000
Avonex Multiple Sclerosis $3,600
Humira Rheumatoid Arthritis $5,000
Cellcept Transplant $1,300
Xolair Asthma $4,000
Betaseron Multiple Sclerosis $4,000
Gleevec Cancer $9,400

What are “Therapeutic Alternatives?” • Occurs when multiple drugs are available to treat
the same condition
• Typically are just as safe and effective, and
save the plan money
Description Example
Brand to Generic
Alternative
A generic drug is available to
treat the same condition as a
more expensive brand name
product (i.e. this is not the same
product, but is in the therapeutic
class to treat the same condition)
Generic oxybutinin xl is
given to a patient instead
of Brand Name Detrol LA
to treat overactive bladder
Brand To Brand
Alternative
A plan switches a member from
a non-formulary product to a
formulary product within the
same formulary category
Brand Name Cozaar is
substituted for Brand Name
Benicar as a more cost
effective product for the
treatment of high blood
pressure

PBM 101
Drug Development
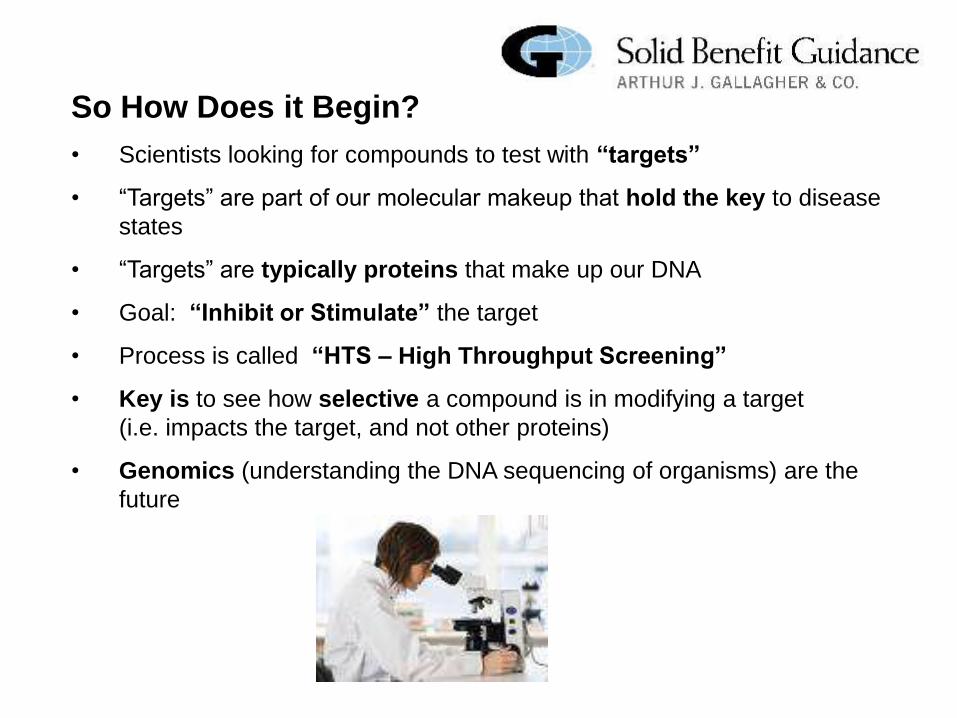
So How Does it Begin?
• Scientists looking for compounds to test with “targets”
• “Targets” are part of our molecular makeup that hold the key to disease
states
• “Targets” are typically proteins that make up our DNA
• Goal: “Inhibit or Stimulate” the target
• Process is called “HTS – High Throughput Screening”
• Key is to see how selective a compound is in modifying a target
(i.e. impacts the target, and not other proteins)
• Genomics (understanding the DNA sequencing of organisms) are the
future

Drug Development is a slow process, with low success rates…..
…. but huge rewards.
Odds of…
• Audited by the IRS: 1 in 100
• Dying in a car accident: 1 in 113
• Being born with 11 fingers and toes:
1 in 500
• Being diagnosed with cancer: 1 in 2
for men and 1 in 3 for women
A potential compound from the drug
discovery process actually becomes a
marketable FDA approved product:
4000:1

About the FDA and Labeling
• Formed in 1906, current budget of $2.1B
• Fees collected from pharma… conflict of interest?
• FDA will review and approve product and monitor product post launch
• Acts as watchdog of product marketing
• FDA becoming much more conservative
• Key to FDA approval is the labeling (listing of uses and warnings)
• Black Box warns of drugs with potentially serious side effects
• Pharmaceutical companies push to be assigned to a new therapeutic
category

• Sales “Armies”: 35k in 1995, 100k today
• Stat: 1 US Doctor for every 1,000 citizens, but 1 Drug Rep for every 3
Doctors
• Tier 2 Formulary Access critical component of launch
• Formulary Access involves providing rebates to managed care
organizations
• DTC (Direct to Consumer) Advertising heavily utilized, but with much
scrutiny
How many
countries
allow DTC
advertising
for RX?

PBM 101
Express Scripts 30%
CVS Health 25%
OptumRx 23%
Humana 7%
Prime Therapeutics 6%
MedImpact 5%
Envision 1%
All Other 3%
Estimated PBM Market Share, 2016
SOURCE: Deutsche Bank Markets Research, Company Reports
PBM 101
The Flow of Money


MANUFACTURER
$
Wholesaler
Payment
WHOLESALER $
Retailer
Payment RETAILER
$
Cash
Price PATIENT
Infographic is reflective of typical monetary flow for an oral, single-source, branded product under a usual and customary (cash price) arrangement.
Flow of money may vary considerably based on type of drug (i.e. generic, specialty) and unique prescription characteristics (i.e. mail order, 340B).

MANUFACTURER
Multiple Revenue Streams: • Formulary & Market Share Rebates
• Rebate Administrative Fees
• Clinical Program Funding
• Inflation Protection Payments
• Data Sale & Research Payments
Claims Costs
(AWP-based)
& Fees
Rebates
(Partial Pass-Thru)
PLAN SPONSOR
(EMPLOYER)
Monthly
Contribution
PATIENT
Flow of Product
Member
Cost Share
RETAILER
Claims
Reimbursements
(AWP-based)
Flow of Product
Retailer
Payment
(WAC-based) WHOLESALER
Flow of Product
Wholesaler
Payment
(WAC-based)
WAC = Wholesale Acquisition Cost (determined by Manufacturer).
AWP = Average Wholesale Price (multiplier of WAC).
Infographic is reflective of typical monetary flow for an oral, single-source, branded product under a traditional PBM deal with partial pass-through of rebate revenue.
Flow of money may vary considerably based on type of drug (i.e. generic, specialty) and unique prescription characteristics (i.e. mail order, 340B).

CLIENT FEES
PHARMA REVENUE
RETAIL NETWORK
DISPENSING ASSETS
PBMs: A Diversified Revenue Model

What We Are Thinking About

Specialty drug costs are spiraling out of control, with no easy solutions in sight.
The delivery system is convoluted, and incentives are misaligned.
A highly consolidated PBM sector leaves fewer vendor options and diminished competition.
Questionable pricing and promotion tactics have deteriorated trust in the supply chain.
A shifting political and regulatory climate creates uncertainty about the future.
Common Themes for
Plan Sponsors Managing a Pharmacy
Benefit in 2016

SOURCE: 2015-2016 PBMI Prescription Drug Benefit Cost and Plan Design Report

New Brand Drug Spend Growth, By Drug Class In US $Billion

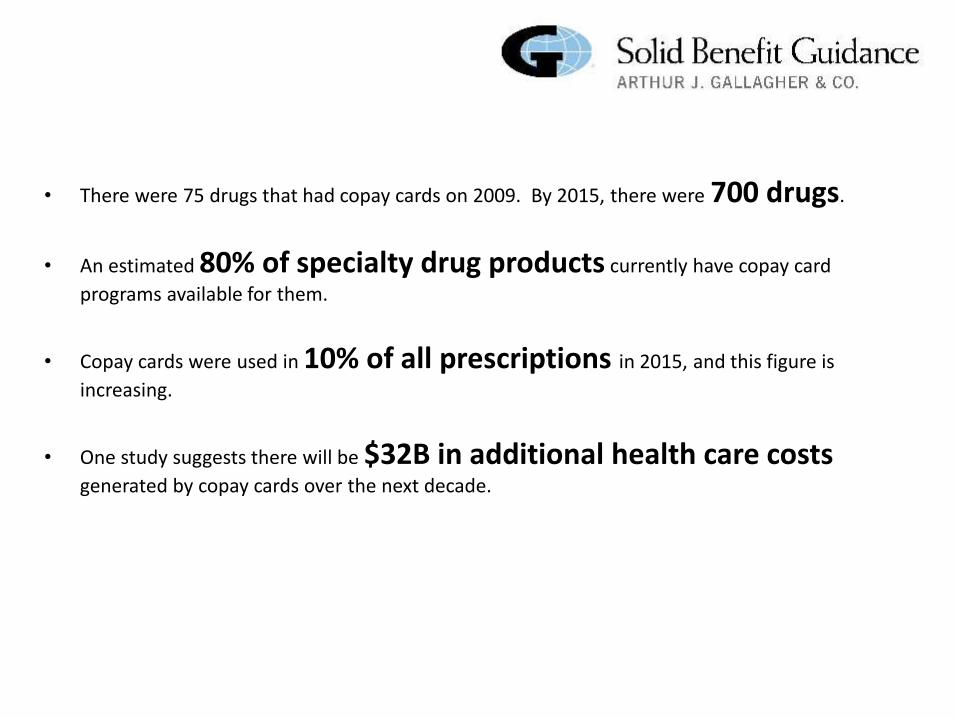
• There were 75 drugs that had copay cards on 2009. By 2015, there were 700 drugs.
• An estimated 80% of specialty drug products currently have copay card
programs available for them.
• Copay cards were used in 10% of all prescriptions in 2015, and this figure is
increasing.
• One study suggests there will be $32B in additional health care costs generated by copay cards over the next decade.

Type of Funding Copay Card Programs Patient Assistance Programs (PAPs)
Needs-Based? Not needs-based, available to all patients (no income or financial hardship criteria).
Typically needs-based (i.e. income criteria, evidence may be required).
Target Market Targeted at commercially-insured patients. Cannot be used for government-funded programs (Medicare, Medicaid).
Targeted at uninsured, underinsured, or those with financial hardship. Can typically be used for commercial or government-funded plans.
Source of Funding Funding comes directly from pharmaceutical companies.
May be funded directly by pharmaceutical company foundations, or indirectly by independent foundations.
Types of Funding

Total Annual Assistance Value of Specialty Drug Copay Cards (Examples)
Copay Card Programs are offered for an estimated
80% of specialty drugs and 50% of traditional drugs.
Exhibit is courtesy of CVS Health

In 2014, 10 of the top 15 charitable foundations in the country were pharmaceutical company PAPs.
Largest Foundations in the U.S. by Total Giving, 2014
“Under current law, corporations can deduct charitable contributions of up to 10% of their income… Companies rarely approach this limit, except in one industry — large pharmaceutical companies consistently take the maximum deduction and often exceed it.” Frerick, Austin. “The Cloak of Social Responsibility: Pharmaceutical Corporate Charity.” Tax Notes 153, no. 9 (2016): 1151–64.

1. DTC funding subverts plan design strategy
Encourages use of less cost-effective therapies through copay manipulation.
When a generic drug is available, coupons can increase brand drug utilization by more than 60%.*
Eliminates financial barriers to off-label or inappropriate usage.
2. DTC funding distorts plan accumulator outcomes
Processes as a member cost share from the PBM’s perspective.
Accumulates to deductibles and OOP maximums, despite the member not incurring OOP costs.
3. DTC Funding contributes to drug cost inflation
Pharma must recoup costs of offering copay cards and PAPs through increases to AWP.
Pharma is less inclined to offer rebate/discount incentives to PBMs for preferred tier placement.
* Dafny L, Ody C, Schmitt M. When discounts raise costs: the effect of copay coupons on generic utilization. NBER Working Paper No. 22745. National Bureau of Economic Research. http://www.hbs.edu/faculty/Publication%20Files/DafnyOdySchmitt_CopayCoupons_32601e45-849b-4280-9992-2c3e03bc8cc4.pdf
But are they good…?

We know Optum Rx is not perfect but….
• Wespath has a very strong financial and contractual terms with Optum
• Optum has been a very flexible partner to work with
• Significant dollars being spent on point-of-care technology so your doctor is prepared before
you go to the pharmacy
• Optum is a very stable PBM, unlike some of the others
• Optum continues to strive for service improvements by leveraging Net Promotor Score culture
• High level auditing results prove that Optum is providing strong results
