phase i: a plan for indiana’s logistics...
TRANSCRIPT

PHASE I:
A PLAN FOR INDIANA’S LOGISTICSFUTURE
MARCH 2010
www.conexusindiana.com 111 Monument Circle, Suite 1800, Indianapolis, IN 46204

Conexus Indiana is the state’s advanced manufacturing
and logistics initiative, dedicated to making Indiana
a global leader in these high-growth, high-tech industries.
Chair of Executive CommitteeMr. J. Mark HowellPresidentBrightpoint Americas, Inc.Plainfi eld
Vice Chair of Executive CommitteeMr. Michael N. SodrelPresident and CEOSodrel Truck Lines, Inc. Indianapolis Division
Mr. Dave AdamsCOO
Schneider Corporation
Indianapolis
Mr. Timothy W. Almack, CPA
Partner-in-Charge of
Transportation Group
Katz, Sapper & Miller, LLP
Indianapolis
Mr. James S. BirgePartner and Chair of Advanced
Manufacturing and Logistics
Practice
Baker & Daniels, LLP
Indianapolis
Mr. Scott A. Brown, CPAPartner Katz, Sapper & Miller, LLPIndianapolis
Mr. Barry E. CoxPresident and COO The Cox GroupMount Vernon
Mr. Mark DeFabisPresident and CEO Integrated Distribution Services Plainfi eld
Mr. Chip E. EdgingtonEVP OperationsRed Cats USAIndianapolis
Mr. Dennis Faulkenberg(Chair/Infrastructure Task Force)
President and CEO
Appian
Indianapolis
Mr. Reggie HendersonPresident – Automotive Group
Telamon Corporation
Carmel
Mr. Thomas HobackPresident & CEO
Indiana Rail Road Company
Indianapolis
Mr. Paul JamesPresident
Hiner Logistics
Huntington
Mr. Kevin J. Kelly(Chair/Public Policy Task Force)
President
Walsh & Kelly, Inc.
South Bend
Mr. Andre B. Lacy(Chair/Human Capital Task Force)
Chairman of the Board
LDI, Ltd.
Indianapolis
Mr. Henry B. LampePresident
Chicago SouthShore & South Bend
Railroad
Michigan City
Ms. Catherine A. LanghamPresident
Langham Logistics, Inc.
Indianapolis
Mr. Keith LochmuellerChairman & CEO
Bernardin, Lochmueller &
Associates, Inc.
Evansville
Mr. Ramon LoucksPresident
IOM Grain, LLC
Portland
Mr. Christofer A. MatneyAir Service Director
Indianapolis Airport Authority
Indianapolis
Mr. Don W. Miller, Jr.President
Mt. Vernon Barge Service
a division of TPG
Mt. Vernon Marine, LLC
Mt. Vernon
Mr. Craig C. NewlinPresident
Keystone Terminals, Ryki Logistics
agent of Keystone Lines
Indianapolis
Mr. Robert A. PalmerVice President, AGFS-Central
FedEx Corporation
Indianapolis
Mr. Bruce PaytonAirport Director
Monroe County Airport
Bloomington
* represents Aviation Association of Indiana
Mr. Charlie PodellSenior Vice President
Duke Realty Corporation
Indianapolis
Ms. Dawn M. Replogle, PEVice President, Branch Manager
URS Corporation
Indianapolis
Mr. Nathan SandersRegional Vice President
OHL
Plainfi eld
Mr. Mark A. SellPrincipal
MD Logistics
Plainfi eld
Ms. Bridget Shuel-WalkerPresident & CEO
HP Products
Indianapolis
Mr. Steve A. SpauldingVice President – Engine Business
Purchasing & Supply Chain
Cummins, Inc.
Columbus
Mr. Kerry M. Stemler(Chair/Public Awareness Task
Force)
President
KM Stemler General Contractors
New Albany
Mr. Jeffrey S. WagonerManager Regional Development
CSX Transportation
Indianapolis
Mr. David L. WitzermanPresident
Wheaton World Wide Moving
Indianapolis
Mr. M. Douglas WilliamsPresident
Venture Logistics, Inc.
Indianapolis
Mr. Dan ZuernerDirector, Client Services Group
Garmong Construction Services
Terre Haute
Mr. Brian R. ZurawskiPrincipal
Summit Realty Group
Indianapolis
CONEXUS INDIANA LOGISTICS COUNCIL EXECUTIVE COMMITTEE
1

2
Letter from Conexus IndIana LogIstICs CounCIL exeCutIve CommIttee ChaIr “Phase I: A Plan for Indiana’s Logistics Future” was created by leading members of the
logistics user community throughout the state of Indiana (please review page 1 for all
participating executives). What you will read in this document is the culmination of two years
of hard work by the logistics industry.
the logistics community, made up of air; infrastructure; rail; trucking; warehousing/
distribution; waterborne; advanced manufacturing and service firms, has rarely agreed
so unanimously upon measures of common impact. Conexus Indiana was the catalyst in
creating a forum for logistics executives to discuss issues affecting their industry and to build
a common agenda across all sectors, including both public and private. We believe that by
achieving alignment on priorities in the areas of infrastructure; public awareness; public policy;
and workforce development, Indiana will be able to maximize short-term and long-term
success for the logistics industry.
“Phase I: A Plan for Indiana’s Logistics Future” has ownership by the logistics industry,
ensuring that those things necessary for Indiana’s logistics success are in place to enhance
the environment for companies to grow their business, create a more attractive business
environment to locate in Indiana, and create high paying jobs for hoosiers.

3
If the strategies, goals, and tactics envisioned in this plan are implemented by the public
and private sectors, we believe that Indiana will leverage its position as the “Crossroads of
america,” and become a logistics magnet as the “Logistics destination of america.”
volunteer leadership from our executives provides Conexus Indiana with a strong base to
make the goals of this plan a reality. a talented and dedicated staff will carry out these
initiatives, and in the end will help us drive the tactics necessary to ensure the plan’s success.
We look forward to continuing the dialogue on opportunities for optimization for the logistics
industry in Indiana, and we will continue our work by releasing Phase II of the plan sometime
in 2011.
together, we –the logistics industry– make a difference in Indiana. We will continue
to do so through innovation, engagement, and our tremendous economic impact this year
and beyond.
J. mark howell
J. mark howell
President, Brightpoint americas, Inc.
Chair, Logistics Council executive Committee


5
executive summary. . . . . . . . . . . . . . .6
Problem statement . . . . . . . . . . . . .6
mission statement . . . . . . . . . . . . . .7
objectives . . . . . . . . . . . . . . . . . . . .7
definitions . . . . . . . . . . . . . . . . . . . .8
Logistics strategies . . . . . . . . . . . . . . .9
Infrastructure goals . . . . . . . . . . . . .9
Public Policy goals . . . . . . . . . . . . .10
Public awareness goals . . . . . . . . .10
Workforce development goals . . . . 11
Implementation tactics. . . . . . . . . . . . 12
Infrastructure . . . . . . . . . . . . . . . . . 12
Public Policy . . . . . . . . . . . . . . . . . . 12
Public awareness . . . . . . . . . . . . . .13
Workforce development . . . . . . . . .13
summary of Logistics skills
Identification Process . . . . . . . . . 13-17
Logistics market analysis . . . . . . . . . .18
transportation mode sWot analysis . . . . . . . . . . . . .18-30
summary of Indiana’s Infrastructure data. . . . . . . . . . . 31-34
summary of financing. . . . . . . . .35- 37
appendix. . . . . . . . . . . . . . . . . . .37-127
aviation funding . . . . . . . . . . . . 38-44
maritime funding . . . . . . . . . . . 45-57
rail funding . . . . . . . . . . . . . . . 58-62
roadway funding . . . . . . . . . . . 62-78
exhibits. . . . . . . . . . . . . . . . . . . 79-85
Indiana’s Logistics Industry data. . . . . . . . . . . . . . . . . . . . . . .86-127
Indiana’s general Industry data 86-90
Indiana’s air transportation Industry data . . . . . . . . . . . . . . 91-97
Indiana’s rail transportation Industry data . . . . . . . . . . . . . . 97-108
Indiana’s truck transportation Industry data . . . . . . . . . . . . . 109-110
Indiana’s Waterborne shipping Industry data . . . . . . . . . . . . . .111-114
Indiana’s Warehousing Industry data . . . . . . . . . . . . . . . . 115
Indiana regional Bottlenecks. . . . . . . . . . . . . . . 116-117
ohio river Lock and dam data . . . 117
Priority Locks and dams on the ohio river. . . . . . . . . . . . . . . . 117-125
Priority Locks and dams on the great Lakes system . . . . . . . . 126-127
taBLe of Contents

the Conexus Indiana Logistics Council executive Committee (LCeC) is a forum of
36 logistics executives and thought leaders from throughout Indiana representing the
following logistics sectors: air; infrastructure; rail; trucking; warehousing/distribution;
waterborne; advanced manufacturing and service firms. Logistics users are manufacturers;
distributors/warehousing; and third-party providers.
LCeC is working to:
• Enhancetheenvironmentforcompaniesinadvancedmanufacturingandlogisticsto
grow their business, taking advantage of Indiana’s position at the heart of the global
supply chain;
• Createamoreattractiveenvironmentformanufacturingandlogisticscompaniesto
relocate to or expand in Indiana, thereby creating jobs and increasing state and local
revenue; and
• CreatehighpayingjobsforHoosiers–theaveragewageofIndianamanufacturingand
logistics jobs is more than 33% higher than the state’s median income.
A. PROBLEM STATEMENT
Indiana’s transportation network has opportunities for improvement due to transportation
“bottlenecks;” lack of direct rail service; underutilized air facilities with little international
freight movement; lack of efficient mode-to-mode connectivity (e.g. road to rail; road
to water; road to air; rail to water); a decaying lock and dam infrastructure; and lack of
6
exeCutIve summary

dredging that prohibits barges/ships to maximize capacity. this disconnect has
created higher costs, potential environmental impacts, inefficient freight movement,
loss of productivity for Indiana business, and safety impacts.
B. MiSSiON STATEMENT
the mission of the Conexus Indiana LCeC is to work with a sense of urgency to strengthen
the logistics sector in Indiana by identifying and acting on concrete opportunities for
enhancement, which better positions the state to grow existing business, attract new
business, and thereby create new jobs.
c. OBjEcTivES
1. executive forum: Provide a forum for logistics executives to discuss issues affecting
the industry;
2. Infrastructure: develop a comprehensive plan to strengthen our public and private
logistics infrastructure;
3. Public awareness: develop paid and earned media to promote the sector;
4. Public Policy: Identify state and federal public policy areas that impact the logistics
industry and work with state and federal thought leaders from government, academia
and associations to enhance the sector;
5. Workforce development: develop and implement strategies to build the human capital
needed to support the growing demand for logistics services through innovative
workforce programs.
7

d. dEfiNiTiONS
the logistics definition comes from a Conexus presentation to the Indiana general
assembly in october of 2009.
a. Logistics: the management of the flow of products, information and resources from
origin to consumption. the flow of goods accomplished by integrating:
- Information
- transportation
- Inventory
- Warehousing
- material-handling
- Packaging
- tracking
- advanced manufacturing
- many other high-tech services
b. Infrastructure: the underlying foundation or network of roads, railroads, airports,
inland waterways, energy transmission pipelines, and fiber optics that enable
the transfer of goods and information and the economic growth of a community,
state, or country.
c. Freight: all goods, merchandise or commodities transported by aircraft, train,
truck, or boat.
8
• Increasetheflowofgoodsoriginating,terminating,andaddingvaluewithintheState
of Indiana over the next three years, thereby, creating an increase of net new jobs and
growing the logistics sector.
• Provideabroad-basedforum,consistingofstatewidebusinessexecutivesthroughout
the logistics industry, for collectively vetting critical relevant logistics public policy issues
of commonality, therefore optimizing the business climate.
• Strengthenandgrowthelogisticsqualifiedworkforcebycreatingportableskills
curricula leading to academic degrees/certifications that will increase the pipeline of
qualifiedworkersoverthenextthreeyears.
• Increasethepublic’sawarenessoftheimportanceofthelogisticsindustryonthe
state of Indiana’s economy.
A. iNfRASTRucTuRE GOALS
1. reduce bottlenecks to improve the reliability and efficiency of freight movement leading
to less congestion, reduce infrastructure repairs, and lower emissions.
2. ensure global access by connecting Indiana cities based on impact and potential to
Interstate-like access.
3. Create better connectivity of Indiana’s water ports via roads and rail modes and improve
the reliability and efficiency of water freight movement.
9
LogIstICs strategIes

4. develop a fast and efficient process for unplanned economic development
infrastructure needs.
5. develop and implement transportation networks that provide direct rail, truck access
and air cargo expansion leading to the improvement and establishment of multimodal
and intermodal service and air cargo facilities.
B. PuBLic POLicy GOALS
1. ensure state and federal government does not legislate or regulate barriers to the
safe, efficient, and innovative movement of goods and resources that are necessary
to support the growth of the logistics sector.
2. ensure state and federal government provides the necessary funding for the public
infrastructure needed to support the efficient and cost effective operation of Indiana’s
logistics sector.
3. ensure Conexus is recognized by governmental entities as a resource of first resort
and the voice for the logistics industry.
c. PuBLic AwARENESS GOALS
1. develop brand awareness of Conexus Indiana.
2. Create general public understanding of logistics by ensuring that the population has
a basic understanding of logistics.
3. Increase the perception of the need to improve/expand Indiana’s infrastructure.
4. highlight Indiana’s logistics companies by bringing awareness to their products
and services.
10

5. Increase the public’s understanding of the positive impact of global trade on Indiana’s
economy and jobs.
d. wORkfORcE dEvELOPMENT GOALS
1. Increase the skill levels of Indiana logistics workers through workforce
education programs.
2. Increase the upward mobility and job prospects of current and future Indiana
logistics workers.
11

ImPLementatIon taCtICs
A. TAcTicS iN SuPPORT Of AchiEviNG iNfRASTRucTuRE GOALS
1. develop 2 or 3 large intermodal/multimodal facilities for Indiana.
2. support the construction and redesign of key locks.
3. develop a plan to attract air freight business to Indiana.
4. support the completion of key infrastructure projects in bottleneck regions.
5. Identify and create a plan to improve/provide infrastructure-like access to regions/cities
with limited accessibility based on impact and potential.
➢ on page 29, LCeC has identified potential current infrastructure projects that will meet
the tactics above. the list does not preclude important statewide projects that have not
yet been identified or might be in process.
B. TAcTicS iN SuPPORT Of AchiEviNG PuBLic POLicy GOALS
1. develop a public policy package to be provided to the governor and general assembly
representing the needs of the logistics industry.
2. Becomearesourcetopublicandprivatesectorstofacilitateadequatefundingthat
drives logistics growth and global competitiveness.
12
c. TAcTicS iN SuPPORT Of AchiEviNG PuBLic AwARENESS GOALS
1. “did you Know stories” by Indiana economic region to educate the public on the
importance of the logistics industry to Indiana and therefore the need for a world-class
logistics infrastructure.
2. newspaper/magazine/online opinion pieces by Indiana economic region to educate
the public on the importance of the logistics industry to Indiana.
3. editorial boards by Indiana economic region to educate the public on the importance
of the logistics industry to Indiana.
4. strategic plan launch press conferences; editorial boards; newspaper/online opinion
pieces to educate the public on the importance of the logistics industry to Indiana.
5. tv/radio interviews to educate the public on the importance of the logistics industry
to Indiana.
d. TAcTicS iN SuPPORT Of AchiEviNG wORkfORcE dEvELOPMENT GOALS
1. Identify logistics job skills gap areas.
2. Work with postsecondary education to develop curriculum for portable
logistics credential.
3. Identify a company that will create a logistics online educational program using new
curriculum leading to portable credential.
a. Summary of Logistics Skills Identification Process
Indiana has a strong business climate for the logistics industry and possesses many
competitive advantages, such as location and low cost of doing business. the logistics
13

industry faces a challenge in the near future that could undermine Indiana’s economic
momentum:anundereducatedworkforce.Indiana’sneedforaqualifiedworkforcehas
been well documented:
− department of Workforce development shows that 3 of the top 10 skill gaps identified
by state-wide Indiana employers are in logistics occupations
− 35th in adult population with associate’s degrees
− 47th in adult population with bachelor’s degrees
− 20,000+ high school dropouts every year
− only 2 out of 10 students entering college ever finish
Conexus Indiana assembled a group of 21 human resources and operations executives
fromaroundIndianatodeterminetheskillsrequiredforthesuccessfulmiddle-level
logistics employee. the logistics skills identification group consisted of representatives
from automotive and pharmaceutical manufacturing companies, logistics companies,
and service providers. Companies represented ranged in size from 50 to over
1,000 employees.
over the course of several sessions totaling six hours, the group identified and defined
the skills a successful employee at their respective companies must possess. the skills
identification sessions were facilitated by an industry representative from Brightpoint.
the following companies participated:
1. Brightpoint
2. Ceva Logistics
3. Convergys Corporation
4. Cummins, Inc.
14

5. fedex Corporation
6. Integrated distribution services
7. Katz, sapper, & miller, LLP
8. Langham Logistics
9. LdI, Ltd., LLC
10. md Logistics
11. ozburn-hessey Logistics, LLC (ohL)
12. redCats usa
13. roche diagnostics
14. ryki Logistics/Keystone terminals
15. uPs
16. venture Logistics
17. Wheaton World Wide moving
b. Skill Differentiation
the competencies identified through the skills identification sessions were categorized
intofivesequentiallevelsoflearning:Introductory, Basic/Fundamental, Intermediate,
Advanced, and Mastery. each level corresponds to the degree of detailed knowledge
requiredbytheemployee.Thelevelsprovideapathwayfortheemployeetolearnthe
necessary information for ensured success in the logistics industry, starting with a broad
foundation which narrows into specific areas within the supply chain.
15

AdvANcEd MANufAcTuRiNG ANd LOGiSTicS SkiLLS TEMPLATE: REviSiON A
Level 1Introductory
Level 2Basic
Level 3Intermediate
Level 4Intermediate
Level 5Advanced
Level 6Mastery
Advanced Manufacturing and Logistics
History of Manufacturing
History of Logistics
Introduction to Manufacturing– Design– Engineering– Materials– Processing/Equipment– Quality Control– Assembly– Technologies– Safety
Introduction to Logistics– Material Handling– Material Control Planning– Shipping/Transportation– Value Added Services– The Importance of Safety/Product/People
Basic Business Principles:– Profits and Losses– Business Structure
- Marketing- Operations- Accounting/Finance
Advanced Manufacturing and Logistics
– Awareness of Process Flow Principles – Systems Understanding– Basic Machine Operation Skills– Basic Mechanical Skills– Basic Understanding of Tooling– Basic Understanding of Machining– Basic Understanding of Assembly
Processes– Basic Understanding of Materials– Basic Electrical Skills
– Material Movement – Internal and Global Level
– Basics of Inventory Principles– Basics of MSDS– Basics of Chart and Graph Reading– General Understanding of Shipping/
Receiving Processes– Global Understanding of Markets
Advanced Manufacturing
Concepts of:– Quality Systems/Regulatory Testing (e.g.,
ISO/TS, FDA, etc.)– Blueprints/Schematics– Mfg. Instructions– Teaming with Engineers/ Workforce– Lean Mfg. Principles– Facility Maintenance– CNC Controls– Engineering Principles– Design Drawing & Interpretation
Advanced Manufacturing
Competence with:– Variation Control Techniques– Machine Controlling Devices– Basic Statistical Process Control– Information Technology on the Shop Floor– Inventory Management
Working Knowledge of:– Geometric Dimensioning and Tolerancing
(GDT) Skills– Shop Floor Metrics– OSHA Regulations– MSDS Requirements
Advanced Manufacturing
– Ability to Use CAD/CAM Software– Specific Knowledge of Process Testing
and Quality Checks– Specific Knowledge of Total Quality
Systems– Ability to Translate a Design into
Requirements– CNC Programming Skills– Awareness of Regulatory Testing– Ability to Read/Interpret Diagnostic
Reports– Introduction to Six Sigma Tools– Introduction to Lean Mfg. Principles
Advanced Manufacturing
Proficiency in:– Reading and Interpreting:
- Schematics & Blueprints- Systems Diagnostic Reports
– Six Sigma Tools– Lean Manufacturing Principles– Regulatory Compliance– Total Quality Management (TQM)
Logistics
Concepts of:– Material Requirements Planning– Process Design– Quality Control– Warehouse Logistics– Outbound Shipping– Outbound Processing– Reverse Logistics– Inventory Control– Cost/Price Management– Safety in the Workplace
Logistics
Competence with:– Inventory Accountability– Regulatory Compliance– Intermodal Operators– Import/Export Control– Customs Procedures– Transportation Management– Order Management Systems– MSDS Requirements– Value Added Services
Logistics
Understanding of:– Import/Export Control Laws– Regulatory Compliance– Scheduling– Lean Principles– Six Sigma Tools– Total Quality Management (TQM)– Material Requirements Planning and
Systemic Product Movement– Process Designs, i.e. Stream Mapping
and Process Flows– Working Knowledge Homeland Security
and TSA regulations
Logistics
Proficiency in:– Import/Export Control Laws– Regulatory Compliance– Master Scheduling– Lean Principles– Six Sigma Tools– Total Quality Management (TQM)
Basic Foundation Intermediate Foundation Intermediate Foundation Advanced Foundation
– Mathematic Skills (e.g., Time & Distance, Ratio Conversion, Weight & Balance)
– Computer Skills (e.g., Microsoft Office Suite, Search Engines)
– Attendance/Work Ethic/Accountability– Personal Hygiene– Initiative/Drive– Attention to Detail
– Communication Skills (e.g., Reading Comprehension, Writing, Speaking)
– Core Values & Ethics– Teamwork– Interpersonal Skills– Decision Making Skills– Problem Solving Skills– Chemistry Principles– Basic Geography
– Algebra I and Geometry– Ability to Set and Achieve Individual and
Team Goals
– Leadership Skills– Basic Physics Principles– Basic ERP System Understanding
– Mathematics Skills (e.g., Algebra II, Trigonometry, Statistics)
– Computer Skills (e.g., Excel formulas and macros)
– Ability to Communicate with Engineers– Problem Solving Skills– Motivational Skills– Ability to Set and Achieve Goals for Both
Workforce and Team
-Advanced Understanding of ERP Systems
Principles of:– Business Law/Organizational Structure– Business Ethics– Basic HR/Management Skills– Leadership/Supervisor Skills
Industry Recognized Certification Associate’s Degree
16

AdvANcEd MANufAcTuRiNG ANd LOGiSTicS SkiLLS TEMPLATE: REviSiON A
Level 1Introductory
Level 2Basic
Level 3Intermediate
Level 4Intermediate
Level 5Advanced
Level 6Mastery
Advanced Manufacturing and Logistics
History of Manufacturing
History of Logistics
Introduction to Manufacturing– Design– Engineering– Materials– Processing/Equipment– Quality Control– Assembly– Technologies– Safety
Introduction to Logistics– Material Handling– Material Control Planning– Shipping/Transportation– Value Added Services– The Importance of Safety/Product/People
Basic Business Principles:– Profits and Losses– Business Structure
- Marketing- Operations- Accounting/Finance
Advanced Manufacturing and Logistics
– Awareness of Process Flow Principles – Systems Understanding– Basic Machine Operation Skills– Basic Mechanical Skills– Basic Understanding of Tooling– Basic Understanding of Machining– Basic Understanding of Assembly
Processes– Basic Understanding of Materials– Basic Electrical Skills
– Material Movement – Internal and Global Level
– Basics of Inventory Principles– Basics of MSDS– Basics of Chart and Graph Reading– General Understanding of Shipping/
Receiving Processes– Global Understanding of Markets
Advanced Manufacturing
Concepts of:– Quality Systems/Regulatory Testing (e.g.,
ISO/TS, FDA, etc.)– Blueprints/Schematics– Mfg. Instructions– Teaming with Engineers/ Workforce– Lean Mfg. Principles– Facility Maintenance– CNC Controls– Engineering Principles– Design Drawing & Interpretation
Advanced Manufacturing
Competence with:– Variation Control Techniques– Machine Controlling Devices– Basic Statistical Process Control– Information Technology on the Shop Floor– Inventory Management
Working Knowledge of:– Geometric Dimensioning and Tolerancing
(GDT) Skills– Shop Floor Metrics– OSHA Regulations– MSDS Requirements
Advanced Manufacturing
– Ability to Use CAD/CAM Software– Specific Knowledge of Process Testing
and Quality Checks– Specific Knowledge of Total Quality
Systems– Ability to Translate a Design into
Requirements– CNC Programming Skills– Awareness of Regulatory Testing– Ability to Read/Interpret Diagnostic
Reports– Introduction to Six Sigma Tools– Introduction to Lean Mfg. Principles
Advanced Manufacturing
Proficiency in:– Reading and Interpreting:
- Schematics & Blueprints- Systems Diagnostic Reports
– Six Sigma Tools– Lean Manufacturing Principles– Regulatory Compliance– Total Quality Management (TQM)
Logistics
Concepts of:– Material Requirements Planning– Process Design– Quality Control– Warehouse Logistics– Outbound Shipping– Outbound Processing– Reverse Logistics– Inventory Control– Cost/Price Management– Safety in the Workplace
Logistics
Competence with:– Inventory Accountability– Regulatory Compliance– Intermodal Operators– Import/Export Control– Customs Procedures– Transportation Management– Order Management Systems– MSDS Requirements– Value Added Services
Logistics
Understanding of:– Import/Export Control Laws– Regulatory Compliance– Scheduling– Lean Principles– Six Sigma Tools– Total Quality Management (TQM)– Material Requirements Planning and
Systemic Product Movement– Process Designs, i.e. Stream Mapping
and Process Flows– Working Knowledge Homeland Security
and TSA regulations
Logistics
Proficiency in:– Import/Export Control Laws– Regulatory Compliance– Master Scheduling– Lean Principles– Six Sigma Tools– Total Quality Management (TQM)
Basic Foundation Intermediate Foundation Intermediate Foundation Advanced Foundation
– Mathematic Skills (e.g., Time & Distance, Ratio Conversion, Weight & Balance)
– Computer Skills (e.g., Microsoft Office Suite, Search Engines)
– Attendance/Work Ethic/Accountability– Personal Hygiene– Initiative/Drive– Attention to Detail
– Communication Skills (e.g., Reading Comprehension, Writing, Speaking)
– Core Values & Ethics– Teamwork– Interpersonal Skills– Decision Making Skills– Problem Solving Skills– Chemistry Principles– Basic Geography
– Algebra I and Geometry– Ability to Set and Achieve Individual and
Team Goals
– Leadership Skills– Basic Physics Principles– Basic ERP System Understanding
– Mathematics Skills (e.g., Algebra II, Trigonometry, Statistics)
– Computer Skills (e.g., Excel formulas and macros)
– Ability to Communicate with Engineers– Problem Solving Skills– Motivational Skills– Ability to Set and Achieve Goals for Both
Workforce and Team
-Advanced Understanding of ERP Systems
Principles of:– Business Law/Organizational Structure– Business Ethics– Basic HR/Management Skills– Leadership/Supervisor Skills
Industry Recognized Certification Associate’s Degree
17

LogIstICs marKet anaLysIs
A. TRANSPORTATiON MOdE SwOT ANALySiS
strengths, Weaknesses, opportunities and threats (sWot) for Indiana’s Logistics sector
INFRASTRUCTURE SWOT
Strengths:
air:
- strong network of airport facilities
- 4 of top 125 cargo airports: Indianapolis is #6; fort Wayne #102; Louisville #3;
Cincinnati #93
- existing excess air capacity
- #2 fedex hub at Indianapolis airport
- 3 airports with 11,900 feet or more of runway – ft. Wayne, grissom and Indianapolis
- midwest location
- strategic geographic coverage of aviation facilities located around the state
rail:
- 9th in rail miles
- 4th nationally with 41 freight railroads
- 4 small intermodal facilities
- heavy presence of tier 1 railroads – Canadian national, Csx and norfolk southern
18

- 6 of top 10 commodities originating in Indiana – coal; farm products; food products;
primarymetalproducts;waste&scrapmaterial;andtransportationequipment
- 4 of top 10 commodities terminating in Indiana – coal; primary metal products;
petroleum products; and waste & scrap material
trucking (roads):
- reputation as Crossroads of america
- #1 in nation for interstates with 14
- #1 in Interstate highway miles
Waterborne:
- 15th nationally in total foreign & domestic waterborne shipping
- 3 public ports – 1 on Lake michigan and 2 on the ohio river
- Indiana Congressional district one #1 in steel shipping in u.s. with 31 million
tons of commodities and 77% of the nation’s iron ore/steel
general:
- Indiana has a trade surplus
- Leader in exports/imports of important commodities (coal, iron/steel products,
grain, food products, scrap metal, etc.)
Weaknesses:
air:
- 7th of 8th compared to midwest/great Lakes region states in air transport as a
share of state transportation/warehousing gdP
- Indiana airports have minimal international/domestic business; other than the
domestic cargo shipping at Indianapolis airport
- Bottlenecks due to airport congestion at Chicago o’hare airport
- reliant on Chicago o’hare airport for international/domestic air cargo
19

rail:
- Primarily pass through state for rail intermodal
- reliant on Chicago intermodal rail service
- Lack of large volume intermodal facility(ies)
- Limited railroad access to ports
trucking (roads):
- Bottlenecks or traffic congestion – northwest Indiana; south Bend to Indianapolis;
Indianapolis; Jeffersonville/new albany
- no Interstate access to southwest Indiana
- no Interstate/highway access to southwest Indiana Port
- LackofadequatecapacityonIndiana’sInterstatehighways
Waterborne:
- decaying lock infrastructure on great Lakes; ohio & mississippi rivers
- dredging issues for ports and waterways on great Lakes; ohio & mississippi rivers
- Lack of area for disposal of dredged material from Lake michigan
- Limited railroad access to ports
general:
- Lack of import/export diversification
Opportunities:
air:
- Position Indiana as a reliever (avoiding congestion in Chicago) airport for domestic/
international air cargo by utilizing our excess capacity
- actively recruit fedex to bring entire domestic business to Indianapolis allowing
fedex to grow their international business in memphis
20

- Create a southern Indiana strategy to better utilize the Louisville airport
- airports have capacity to expand
- several airports currently have runways & facilities to accommodate air shipping
opportunities
rail:
- freight tonnage will nearly double by 2035 according to the u.s. department of
transportation (usdot)
- Complete upgrades or additions to Indiana’s multimodal rail system
- Create large volume intermodal facility(ies) decreasing Indiana’s reliance on Chicago
- Build additional/better railroad access to Indiana ports
trucking (roads):
- freight tonnage will nearly double by 2035 according to the usdot
- Work to relieve the bottlenecks around northwest Indiana; south Bend to
Indianapolis; Indianapolis; Jeffersonville/new albany
- upgrade statewide strategic bridges that are structurally deficient or functionally
obsolete
- Build Interstate access to southwest Indiana
- Build Interstate/highway access to southwest Indiana port
- dedicated truck lanes – separation of trucks from passenger cars
- allow increase in truck weight limits
Waterborne:
- reengineer and repair the decaying lock infrastructure on great Lakes; ohio &
mississippi rivers
- dredge the areas around ports and waterways on the great Lakes; ohio &
mississippi rivers
21
- Create a solution for disposing of dredged material from Lake michigan
- Build additional/better railroad access to Indiana ports
general:
- tonnage will nearly double by 2035 according to the usdot
- ThevalueofU.S.importsandexportsisexpectedtobeequivalentto60percent
of gdP by 2030
- Position Indiana as an international freight gateway
- Work for diversification of exports/imports
Threats:
air:
- Continued underutilization of Indiana airports
- dependent on increasing bottlenecks in Chicago leading to inefficient air cargo service
- Lack of state funding to meet infrastructure needs
rail:
- Continuation of Indiana as a pass through state for rail
- reliance on Chicago for intermodal services
- Lack of intermodal service bypassing Chicago
- Lack of ownership by public entities of intermodal opportunities
- surrounding states push for rail investment
trucking (roads):
- Lack of funding to build roads necessary to relieve bottlenecks or traffic congestion
- Lack of funding to upgrade statewide strategic bridges that are structurally deficient
or functionally obsolete
- Lack of funding and attempts to stop Interstate access to southwest Indiana
- Lack of Interstate/highway access to southwest Indiana port
22
Waterborne:
- failure of decaying lock infrastructure leading to stoppage of all barge traffic on
ohio river and lack of access to Lake michigan for iron ore to steel mills
- Inability to provide necessary access by not dredging Lake michigan, mississippi &
ohio rivers
- Lossofbusinessduetoinadequaterailroadaccesstoports
general:
- Lack of diversification of exports/imports
- Lack of funding for all infrastructure modes
- Impact of federal government energy policy on all modes of transportation
PUBLIC POLICY SWOT
Strengths:
air:
- strong university aviation programs
- Federalgovernmentreimbursesupto95%ofcostsforqualifiedairportprojects
rail:
- Ports of Indiana bonding authority for rail facilities
trucking (roads):
- major moves funding for Indiana highways and roads
- state of Indiana focus on road building
Waterborne:
- Ports of Indiana (public and private)
- Ports of Indiana bonding authority for port activity
23

general:
- Indiana’s use of public/private partnerships to facilitate the funding of key projects
- adoption of daylight saving time
Weaknesses:
air:
- Lack of “ownership” by public entities on air cargo movement
- Lack of federal/state air funding
rail:
- Lack of private rail investment compared to surrounding states
- Lack of “ownership” by public entities on rail freight movement
- Lack of federal/state funding
trucking (roads):
- federal/state use of gas taxes for other general federal/state revenue needs
- Lower truck weight limits compared to surrounding states
- Inefficiencies in collection of fuel taxes
Waterborne:
- Lack of “ownership” by public entities of waterborne shipping
- Lack of federal/state funding
- Lack of public and legislator understanding of importance of locks infrastructure
Warehousing/distribution:
- Increase in unemployment insurance (uI) tax on state level
general:
- Lack of a coordinated logistics agenda at the Indiana general assembly
- Lack of a logistics association representing members
24

Opportunities:
air:
- dedicated air fund creating more federal funding
rail:
- federal and state investment tax credit incentivizing private rail investment
- funding for inter/multimodal rail development
trucking (roads):
- federal and state firewall on gas taxes for highway use only
- dedicated truck lanes
- allow increase of truck weight limits
Waterborne:
- harbor assistance Program to incentivize ports and private investment
- Adequatefundingforlocksprojects
Warehousing/distribution:
- Lower uI tax on state level
- Lower capital gains tax on federal level
general:
- Creation of a logistics association facilitating and advocating for policy changes
Threats:
air:
- surrounding states of michigan, tennessee and Wisconsin offer grants/loans/tax
credits for air economic development/private investment
- Loss of matching dollars from federal government because of lack of state investment
- federal cap and trade legislation
25

rail:
- surrounding states of Illinois, Kentucky, michigan, ohio, tennessee, and Wisconsin
offer grants/loans/tax credits for rail economic development/private investment
- Loss of private rail investment to surrounding states
- federal cap and trade legislation
trucking (roads):
- surrounding states of Illinois, michigan, tennessee and Wisconsin offer grants/
loans/tax credits for trucking economic development/private investment
- Lack of federal/state highway dollars for new/existing roads
- Continued use of gas taxes for other general federal/state revenue needs
- Competitiveness issues due to lower truck weight limits
- Continued inefficient collection of fuel taxes
- federal cap and trade legislation
Waterborne:
- surrounding states of michigan, tennessee and Wisconsin offer grants/loans/tax
credits for waterborne economic development/private investment
- Lack of federal/state funding for locks infrastructure repair
Warehousing/distribution:
- surrounding states of Kentucky, michigan, ohio and Wisconsin offer grants/loans/tax
credits for warehousing/real estate economic development/private investment
- further state tax increases for uI
- Increase from 15% capital gains to 28% in 2010
general:
- Lack of policy action leading to loss of private investment
26

- Lack of a state fund for unexpected economic development infrastructure needs
- Continued lack of growth in national economy
WORKFORCE DEVELOPMENT SWOT
Strengths:
- Public/private postsecondary institutions with ability to reach mass of workers
- entrepreneurs creating online curriculum programs
- governor, superintendent of Public Instruction and Commissioner for higher
education who understand importance of upskilling hoosier workers
- growth of logistics firms in Indiana
Weaknesses:
- Lack of skilled workers
- Public misconception of dirty warehouse jobs
- assorted logistics education curriculum not meeting industry needs
Opportunities:
- Identify logistics job skills gap areas
- Curriculum development with postsecondary education to meet job skills gap areas
- Create online program to upskill Indiana logistics worker from places of employment
- Continued growth of logistics jobs in Indiana
27

Threats:
- Loss of logistics economic development due to workforce gaps
- Continued perception of logistics industry as undesirable work
- Lower skill workers remaining in lower level positions
PUBLIC AWARENESS SWOT
Strengths:
- view of Indiana as Crossroads of america
- Positive visibility of trucking
- viewed as a center for surrounding major cities
Weaknesses:
- Lack of public understanding of logistics
- Lack of public understanding of need for infrastructure expansion/improvement
- Public misperception of logistics jobs
- Public misperception of global trade & positive impact on Indiana
- Lack of awareness of importance for air, rail & water transportation modes
Opportunities:
- educate public on positive impacts of logistics industry
- explain the facts on how the logistics industry impacts everyday life
- educate public on need for infrastructure expansion/improvement
- educate public on high-skill, high-wage jobs in logistics
- educate public on positive impacts of global trade
- Increase understanding of importance for air, rail & water transportation modes
28
Threats:
- Continued public misperception of the importance of the logistics industry
- Lack of awareness of need for infrastructure expansion/improvement
- Continued public misperception of logistics jobs
- Continued public belief of negative impacts of global trade
KEY PROjECTS WITh STATEWIDE IMPLICATIONS:
Illiana Expressway
− a proposed 25-mile to 30-mile, 8-lane connector between I-57 in Will County, Illinois,
and I-65 in Lake County, Indiana
− Would help relieve roadway congestion on I-80/94, us-30, and I-90 and ease the
Chicago freight bottleneck
US 31 from Plymouth to South Bend
− Limited access highway between Plymouth, Indiana, and south Bend, Indiana
− this project is a segment of the major moves initiative to reduce congestion and
improve safety and mobility on us 31 from Indianapolis to south Bend
SR 25 – “Indiana hoosier heartland highway”
− a 99-mile limited access highway between Lafayette and fort Wayne connecting
I-65 and I-69
− this project is a segment of the larger 200-mile initiative to link Lafayette, Indiana,
and fort Wayne, Indiana, with toledo, ohio
I-69 – Evansville to Indianapolis
− a new 142-mile segment of I-69 to connect evansville and Indianapolis
− the project will spur economic development and better connect southwest Indiana
to major urban areas
29

Commerce Connector
− an outer loop of “highways” connecting the counties surrounding Indianapolis
− the Commerce Connector would provide Interstate-to-Interstate access as well as
quicktraveltoandfromI-65,I-74,I-70andI-69
− the Commerce Connector includes the extension of the existing ronald reagan
Parkway from I-70 in hendricks County to I-65 in Boone County and an expansion
of 146th street in hamilton and Boone County to connect I-69 and I-65
− AnupgradeofMt.ComfortRoadinHancock/HamiltonCountywouldberequired
to connect I-69 and olio road in hamilton County with I-70 in hancock County and
I-74 in shelby County
− a clear route from shelby to Johnson to morgan counties needs to be developed to
connect I-74, I-65, I-70 and the future I-69 route in Johnson and morgan Counties
Ohio River Bridges
− a partnership between Indiana and Kentucky to build two new bridges between
Jeffersonville, Indiana and Louisville, Kentucky and reconfigure Louisville’s Kennedy
Interchange
− a new bridge will be built where I-65 crosses the ohio river into Louisville
− I-265 in Indiana and Kentucky will be connected by a new bridge over the ohio
river 8 miles upstream of the I-65 Bridge
US 30 from Fort Wayne to Valparaiso
− a limited access highway from fort Wayne to valparaiso
− this provides a connection between I-69 and I-65
30

B. iNdiANA’S iNfRASTRucTuRE dATA
INDIANA INFRASTRUCTURE DATA
Airports
• 633CivilandJoint-UseAirports,Heliports,STOLports(ShortTake-OffandLanding),
and seaplane Bases
- 477 civil and joint-use airports
o 67 are included in the national Plan of Integrated airport systems (nPIas)
and are eligible for federal funding
- 133 civil and joint-use heliports
- 3 civil and joint-use stoLports
- 20 civil and joint-use seaplane bases
• 2ofthetop125cargoairportsintheUnitedStateswithinIndiana’sborders
- Indianapolis International airport – 6th nationally
- fort Wayne International airport – 102th nationally
• 2ofthetop125cargoairportsareacrossIndiana’sbordersinKentuckyandOhio
- Louisville International-standiford field – 3rd nationally
- Cincinnati/northern Kentucky International – 93rd nationally
• 4commercialserviceairports
- Indianapolis International airport – 46th nationally
- evansville regional airport – 141st nationally
- fort Wayne International airport – 159th nationally
- south Bend regional airport – 179th nationally
Source: Federal Aviation Administration
31

Railroads
• 4,446milesofrailroadoperatedinIndiana(excludingtrackagerights)(9thNationally)
- Class I railroads operate 2,791 miles of railroad in Indiana
- regional railroads operate 430 miles of railroad in Indiana
- Local railroads operate 1,051 miles of railroad in Indiana
- switching and terminal railroads operate 174 miles of railroad in Indiana
• 41freightrailroadsinIndiana(4thNationally)
- 5 class I railroads
- 3 regional railroads
- 20 local railroads
- 13 switching and terminal railroads
• IntermodalFacilities
- avon yard, Indianapolis – Csx transportation
- howell yard, evansville – Csx transportation
- triple Crown services, Inc. fort Wayne – norfolk southern
- hoosier Lift, remington – toledo, Peoria & Western railway
Sources: American Association of Railroads; Indiana Department of Transportation
Roads
• PublicRoads
- 95,472 miles of public road in Indiana (excludes 788 miles of federal agency
owned roads)
- 1,172 miles of interstate highway in Indiana
- 14 interstate highways in Indiana (1st nationally)
o I-64, I-69, I-70, I-74, I-80, I-90, I-94, I-164, I-265, I-275, I-465, I-469, I-865
32

• 2007IndianaRoadConditions
- 18.49% of Indiana department of transportation (Indot) maintained roads
are in very good condition
- 36.99% of Indot maintained roads are in good condition
- 33.05% of Indot maintained roads are in fair condition
- 6.34% of Indot maintained roads are in mediocre condition
- 5.11% of Indot maintained roads are in poor condition
• 2008RoadBridgeData
- 18,543 bridges in Indiana
o 2,005 (10.81%) Indiana bridges are structurally deficient
o 2,172 (11.71%) Indiana bridges are functionally obsolete
Source: U.S. Department of Transportation, Federal Highway Administration
Waterways
• OhioRiver
- 358 miles of Indiana border the ohio river
- two public ports/docks operated by the Ports of Indiana
o Jeffersonville, In
- mg rail provides onsite rail switching services. mg provides interchanges
with Csx, Louisville & Indiana railroad Co., and norfolk southern.
o mount vernon, In (southwind maritime Center)
- served by the evansville Western railway. offers interchanges with union
Pacific, Bnsf, Csx, Canadian national, and norfolk southern.
• LakeMichigan
- 43 miles of Indiana border Lake michigan
33

- one public port/dock operated by the Ports of Indiana
o Burns harbor, In
- rail access provided by norfolk southern and Indiana harbor Belt
railroad with interchanges to all major railroads in Chicago.
- three private ports/docks
o Buffington harbor
o Indiana harbor
o gary harbor
Source: Bureau of Transportation Statistics; American Association of Port Authorities; Ports of Indiana; Army Corps of Engineers
34

summary of Current fInanCIng
Aviation
federal revenue is generated through passenger taxes, cargo taxes and fuel taxes.
spending allocation for generated revenue is distributed federally through the airport
Improvement Plan (aIP), federal guidelines and in some instances to larger airports that
have minimal discretion to use the funds as necessary. the federal aviation association
prioritizes where and how much of the funds are disbursed based upon its goals. Indiana
only matches a minimum portion of the federal grants and has little input as to what
projects are funded. aviation is the only mode that is under Indot’s jurisdiction that does
not have a dedicated source of funds.
Maritime
revenue is generated through a fuel tax, cargo tax and allocations from the federal
general fund. spending of generated revenue is allocated by the army Corps of
engineers. the army Corps disburses the funds based upon priority project needs, annual
government budget and fund balances.
Rail
revenue is generated through state sales tax allocations and federal general fund
allocation. the spending allocation for generated revenue is determined at the federal level
by the u.s. department of transportation (usdot) and is disbursed through loans to be
35
used for capital improvements. at the state level the spending allocation is determined by
Indiana department of transportation (Indot) and is disbursed through grants which can
be used for the rehabilitation of railroad infrastructure or railroad construction.
Roadways
revenue is generated through fuel taxes, tire sales, truck and trailer sales, heavy-use
vehicle sales and allocations from the federal general fund. spending allocation for
generated revenue is determined at the state level with federal guidance to twelve
categories: Interstate maintenance; national highway system; surface transportation
Program; highway Bridge; Congestion mitigation and air Quality Improvement;
recreational trails; metropolitan Planning; highway safety Improvement; railway-highway
Crossing; safe routes to schools; appalachian highway system and Coordinated Border
Infrastructure. also, a small portion of revenue is allocated to research and planning at the
state and federal level.
a more detailed explanation of each mode of transportation’s revenue generation and
spending allocation follows.
36

aPPendIx
37
AviATiON
Airport Capital Improvement Plan (ACIP) General Information
aviation is defined in this context as public airports eligible for government funding within a
designated region. the airport Capital Improvement Plan (aCIP) determines the distribution
of grant funds under the airport Improvement Program (aIP). also, aCIP is used to identify
critical development and capital needs for the national airspace system. the funds
determined by aCIP under aIP are awarded by the federal aviation administration (faa)
to airports based on priority level. the faa allocates the funds into nine regions and are
prioritized based upon the goals set by faa.
Nine Regions:
− alaskan - (aK)
− Central – (Ia, Ks, mo, ne)
− eastern – (de, md, nJ, ny, Pa, va, Wv)
− great Lakes – (IL, In, mI, mn, nd, oh, sd, WI)
− new england – (Ct, me, ma, nh, rI, vt)
− northwest mountain – (Co, Id, mt, or, ut, Wa, Wy)
− southern – (aL, fL, ga, Ky, ms, nC, Pr, sC, tn, vI)
− southwest – (ar, La, nm, oK, tx)
− Western-Pacific – (aZ, Ca, hI, nv)
FAA Goals:
1. ensure that the air transport of people, services and goods is provided in a safe and
secure environment
2. Preserve and upgrade the existing airport system in order to allow for increased
capacity as well as to ensure reliable and efficient use of existing capacity
3. Improve the compatibility of airports with the surrounding communities
4. Provide sufficient access to an airport for the majority of american public
38

i. AviATiON fuNdiNG
Tax Table
Aviation Taxes Comment Tax Rate
FREIGhT/MAIL
domestic Passengerticket tax
ad valorem tax 7.5% of ticket price (10/1/99 through 9/30/2007)
domestic flightsegment tax
domestic segment = a flight leg consisting of one takeoff and one landing by a flight
rate is indexed by the Consumer Price Index starting 1/1/02$3.00 per passenger per segment during calendar year (Cy) 2003$3.10 per passenger per segment during Cy04$3.20 per passenger per segment during Cy05$3.30 per passenger per segment during Cy06$3.40 per passenger per segment during Cy07
Passenger ticket tax for rural airports
assessed on tickets on flights that begin/end at a rural airport
7.5% of ticket price (same as passenger ticket tax)flight segment fee does not apply
rural airport: <100K enplanements during 2nd preceding Cy, and either 1) not located within 75 miles of another airport with 100K+ enplanements, 2) is receiving essential air service subsides, or 3) is not connected by paved roads to another airport.
International arrival & departure tax
head tax assessed on passenger arriving or departing for foreign destinations (& u.s. territories) that are not subject to passenger ticket tax
flights between continental u.s. and alaska or hawaii
rate is indexed by the Consumer Price Index starting 1/1/99$6.70 international facilities tax + applicable domestic tax rate (during Cy03)$6.90 international facilities tax + applicable domestic tax rate (during Cy04)$7.00 international facilities tax + applicable domestic tax rate (during Cy05)$7.30 international facilities tax + applicable domestic tax rate (during Cy06)$7.50 international facilities tax + applicable domestic tax rate (during Cy07)
FrequentFlyerTax ad valorem tax assessed on mileage awards (e.g. credit cards)
7.5% of value of miles
39
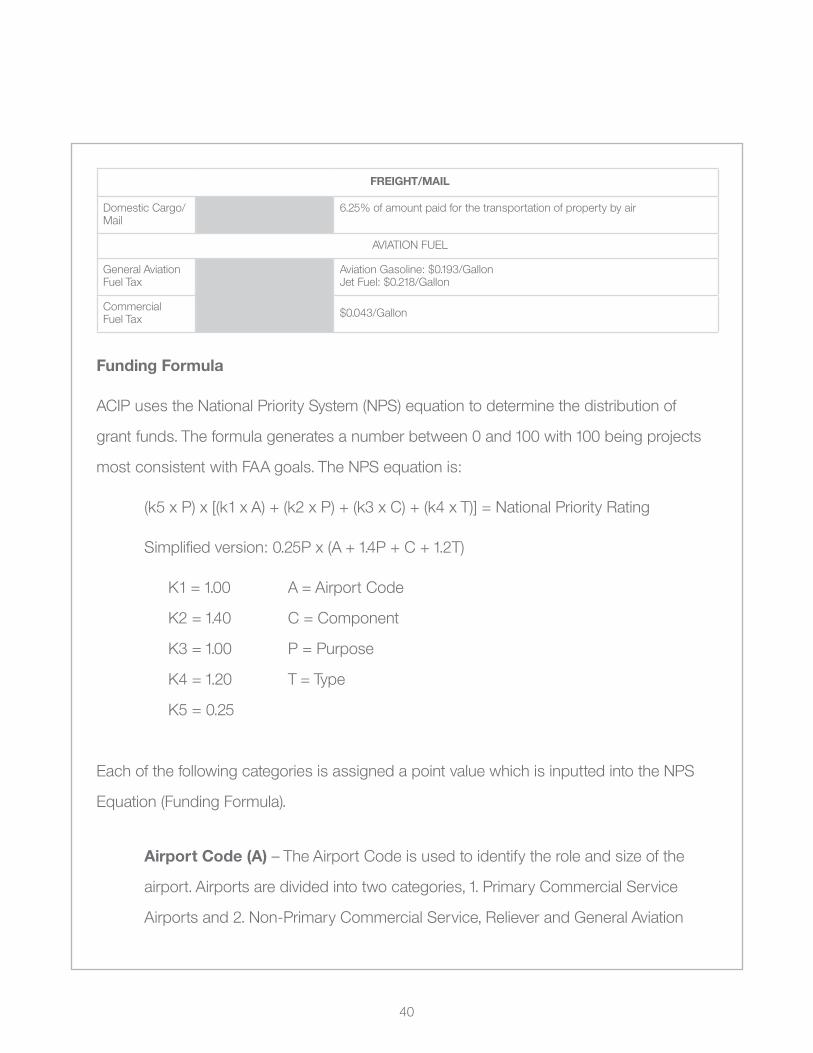
FREIGhT/MAIL
domestic Cargo/mail
6.25% of amount paid for the transportation of property by air
avIatIon fueL
general aviation fuel tax
aviation gasoline: $0.193/gallonJet fuel: $0.218/gallon
Commercial fuel tax $0.043/gallon
Funding Formula
ACIPusestheNationalPrioritySystem(NPS)equationtodeterminethedistributionof
grant funds. the formula generates a number between 0 and 100 with 100 being projects
mostconsistentwithFAAgoals.TheNPSequationis:
(k5 x P) x [(k1 x a) + (k2 x P) + (k3 x C) + (k4 x t)] = national Priority rating
simplified version: 0.25P x (a + 1.4P + C + 1.2t)
K1 = 1.00 a = airport Code
K2 = 1.40 C = Component
K3 = 1.00 P = Purpose
K4 = 1.20 t = type
K5 = 0.25
each of the following categories is assigned a point value which is inputted into the nPs
Equation(FundingFormula).
Airport Code (A) – the airport Code is used to identify the role and size of the
airport. airports are divided into two categories, 1. Primary Commercial service
airports and 2. non-Primary Commercial service, reliever and general aviation
40

airports. the latter are further broken down by size and based on aircraft or
itinerant operations.
Component (C) – the Component identifies the physical component of the project
(e.g., runway, terminal) for which the development is intended.
Purpose (P) – the Purpose identifies the objective of the project (e.g.,
reconstruction, safety/security).
Type (T) – the type identifies the actual work being done (e.g., extension/expansion,
improvements).
*See Exhibit 1 for point system breakdown
Distribution of AIP Funds
FromtheACIPNPSequationtheAIPdistributesfundsintotwocategories;1.Apportioned
funds also known as entitlement funds, and 2. discretionary funds. entitlement funds are
allocated each year to specific airport sponsors, types of airports or states. funds are available
to large, medium, small hubs and non-hub airport sponsors. unused funds remain available
for 2 fiscal years with the exception of non-hub primary and non-primary airports, which
are available for 3 fiscal years. once entitlement funds have been distributed, the remaining
balance becomes the discretionary fund. the amount is determined by assuring specified
minimum funding levels are maintained. discretionary funds are limited and distribution is
directed by the faa. the minimum allocation for discretionary funds is $520 million per year. a
breakdown of how entitlement and discretionary funds are distributed as follows:
41

Apportioned Funds (Entitlement Funds)
Primary airports funding is based upon number of passenger boardings at each airport.
the minimum per fiscal year is $650,000 with maximum of $22,000,000 for airport
sponsors. the funding level for individual airports is calculated as follows:
− $7.80 for each passenger boarding up to 50,000 passengers
− $5.20 for each additional passenger boarding up to 100,000 passengers
− $2.60 for each additional passenger boarding up to 500,000 passengers
− $0.65 for each additional passenger boarding up to 1,000,000 passengers
− $0.50 for each additional passenger boarding up from 1,000,000 passengers plus
Individual apportionments are doubled (minimum of $1,000,000, maximum of $26,000,000),
if aIP funding in a fiscal year is at least $3.2 billion.
small airport fund is funded by aIP apportioned fund reduction, due to Passenger facility
Charge (PfC) revenues.
Cargo service airport funding allows the faa to set aside 3.5% of the aIP funds to cargo
service airports. each cargo airport receives funds as the airport’s proportion of total landed
weightofcargoaircraft,tothetotallandedweightofcargoaircraftatallqualifyingairports.
Cargo service funds =
total Landed Weight of Cargo aircraft at Individual Qualifying airport
total Landed Weight of Cargo aircraft at all Qualifying airports
state/Insular areas: 20% of the annual aIP grants from congress are apportioned for use
at non-primary commercial service, general aviation and reliever airports within states
42
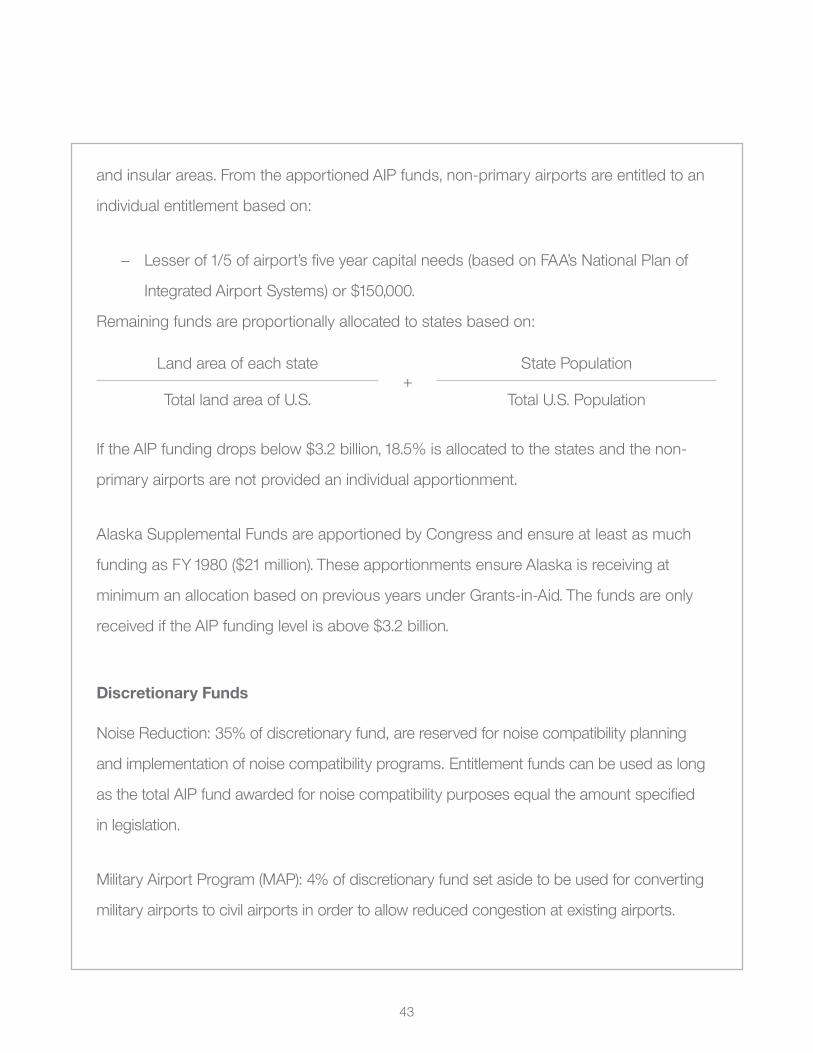
and insular areas. from the apportioned aIP funds, non-primary airports are entitled to an
individual entitlement based on:
− Lesser of 1/5 of airport’s five year capital needs (based on faa’s national Plan of
Integrated airport systems) or $150,000.
remaining funds are proportionally allocated to states based on:
Land area of each state+
state Population
total land area of u.s. total u.s. Population
If the aIP funding drops below $3.2 billion, 18.5% is allocated to the states and the non-
primary airports are not provided an individual apportionment.
alaska supplemental funds are apportioned by Congress and ensure at least as much
funding as fy 1980 ($21 million). these apportionments ensure alaska is receiving at
minimum an allocation based on previous years under grants-in-aid. the funds are only
received if the aIP funding level is above $3.2 billion.
Discretionary Funds
noise reduction: 35% of discretionary fund, are reserved for noise compatibility planning
and implementation of noise compatibility programs. entitlement funds can be used as long
asthetotalAIPfundawardedfornoisecompatibilitypurposesequaltheamountspecified
in legislation.
military airport Program (maP): 4% of discretionary fund set aside to be used for converting
military airports to civil airports in order to allow reduced congestion at existing airports.
43

reliever: .66% of the discretionary fund is set aside for use at airports that meet specific
requirements.Therequirementsareasfollows:
1. more than 75,000 annual operations
2. a minimum usable runway length of at least 5,000 feet
3. a precision instrument landing procedure
4. a minimum of 100 based aircraft
Capacity/safety/security/noise (C/s/s/n): 75% of the remaining discretionary funds are
allocated for C/s/s/n projects. this amount includes 75% of 12.5% from PfC reduction.
the remaining discretionary funds (25% remaining from C/s/s/n usage) are available for
any project at any airport in the national Plan of Integrated airport systems (nPIas).
Passenger Facility Charge (PFC)
aIP funds are reduced by 50% if a PfC of $1 to $3 is charged at large or medium hub
airports. a reduction up of to 75% can be imposed for PfC’s above $3. the reduction is
redistributed as follows:
− 87.5% to small airport fund (entitlement fund)
− 12.5% to Capacity/safety/security/noise (discretionary fund)
of the 87.5% received by the small airport fund, it is further distributed by the following:
− small hub airports receive 1/7 of the 87.5%
− non-hub airports receive 2/3 of the reminder
− non-commercial services receive 1/3 of the reminder
44

ii. MARiTiME fuNdiNG
maritime is defined as all domestic inland waterways, channels, ports, locks, dams and
harbors. maritime receives funding from three sources; Inland Waterway trust fund (IWtf),
harbor maintenance trust fund (hmtf) and general revenues (gr) from the government
treasury. funding levels are determined by priority project needs, annual government
budget and balances within each respective trust fund. each year Congress apportions a
certain amount of funds that will be administered to the u.s. army Corps of engineers to be
used at their discretion on project selection.
the IWtf, created in 1978, pays half the cost of the construction and major rehabilitation
costs for specified federal inland waterways projects. It receives money from a tax on fuel,
currently set at 20 cents per gallon, and on vessels engaged in commercial transportation
on inland waterways. the army Corps maintains more than 12,000 miles (19,200 kilometers)
of inland waterways, and owns or operates 257 locks at 212 sites on inland waterways.
the hmtf and its harbor maintenance tax were authorized in the Water resources
development act of 1986. the purpose of this tax, a 0.125% ad valorem tax levied on cargo
imported or domestically moved through federally maintained channels and harbors, is to
pay for army Corps operations and maintenance of these ports and harbors. the tax is
collected by the Bureau of Customs and Border Protection and directed to the trust fund.
45

a breakdown of project funding is as follows:
Commercial Projects
Federal Share of Feasibility Study
Federal Share of Construction
Federal Share of O&M
Coastal Ports<20 foot harbor20-45 foot harbor>45 foot harbor
Inland Waterways
50% (gr)50% (gr)50% (gr)
100% (gr)
80% (gr)65% (gr)40% (gr)
100%(50% IWtf; 50% gr)
100% (hmtf)100% (hmtf)50% (hmtf)
100% (gr)
* The shortages in feasibility studies and construction for coastal ports must be made up by a non-federal agency
a further break down of apportionment to the army Corps for fy09 is as follows:
Requested Appropriations:
Investigations $91,000,000
Construction $1,402,000,000*
operation and maintenance (o&m) $2,475,000,000**
regulatory Program $180,000,000
mississippi river and tributaries $240,000,000
expenses $177,000,000
flood Control and Coastal emergencies $40,000,000
formerly utilized sites remedial action Program $130,000,000
assistant secretary of the army, Civil Works $6,000,000
TOTAL APPROPRIATION REQUEST $4,741,000,000(total expense allocations)
46

Sources of Appropriations:
general fund $(3,844,000,000)
harbor maintenance trust fund $(729,000,000)
Inland Waterways trust fund $(167,000,000)
disposal facilities user fees $(1,000,000)
TOTAL APPROPRIATION REQUEST $(4,741,000,000)(total expense allocations)
* Includes $157,000,000 from the IWtf.
**Includes $729,000,000 from the hmtf and $10,000,000 from the IWtf.
47

a listing of Indiana projects slated for fiscal year 2010:
Project Type Preconstruction Construction Operation Maintenance Total O&M
Brookville Lake, In f&Csdr $818,000 $44,000 $862,000
Burns Waterway harbor, In
n $165,000 $165,000
Cagles mill Lake, In f&Csdr $888,000 $4,000 $892,000
Calumet harbor & river, IL & In (see Illinois)
Cecil m harden Lake, In
f&Csdr $1,020,000 $7,000 $1,027,000
great Lakes nav system study, mI, IL, In, mn, ny, oh, Pa & WI (see michigan)
Illinois Waterway (mvs Portion), IL & In (see Illinois)
Indiana harbor, Confined disposal facility, In
n $13,500,000 $13,500,000
Indiana harbor, In e / n $300,000 $2,330,000 $2,330,000
Inspection of Completed Works, In
f&Csdr $709,000 $709,000
Interbasin Control of great Lakes-mississippi river AquaticNuisancespecies, IL, In, oh & WI (see Illinois)
J. edward roush Lake, In
f&Csdr $942,000 $2,000 $944,000
Little Calumet river, In f&Csdr $20,000,000
markland Locks & dam, Ky & IL (see Kentucky)
mississinewa Lake, In f&Csdr $934,000 $40,000 $974,000
monroe Lake, In f&Csdr $1,098,000 $3,000 $1,101,000
48

ohio river Locks & dam, Ky, IL, In & oh (see Kentucky)
ohio river open Channel Work, Ky, IL, In, oh, Pa & Wv (see Kentucky)
Patoka Lake, In f&Csdr $884,000 $3,000 $887,000
Project Condition surveys, In
n $185,000 $185,000
salamonie Lake, In f&Csdr $901,000 $3,000 $904,000
surveillance of northern Boundary Waters, In
f&Csdr $126,000 $126,000
a listing of Illinois projects slated for fiscal year 2010:
Project Type Survey Preconstruction Construction Operation Maintenance Total O&M
alton to gale organized Levee district, IL & mo
f&Csdr $300,000
Calumet harbor & river, IL & In
n $310,000 $4,311,000 $4,621,000
Carlyle Lake, IL f&Csdr $3.499,000 $1,672,000 $5,171,000
Chain of rocks Canal, mississippi river, IL (def Corr)
f&Csdr $6,500,000
Chicago harbor, IL n $1,851,000 $2,038,000 $3,889,000
Chicago river, IL f&Csdr $493,000 $493,000
Chicago sanitary & ship Canal dispersal Barrier, IL
e $5,000,000
des Plaines river, IL f&Csdr $3,300,000 $13,500,000 $13,500,000
des Plaines river, IL (Phase II)
f&Csdr $500,000
east st. Louis, IL f&Csdr $2,000,000
49
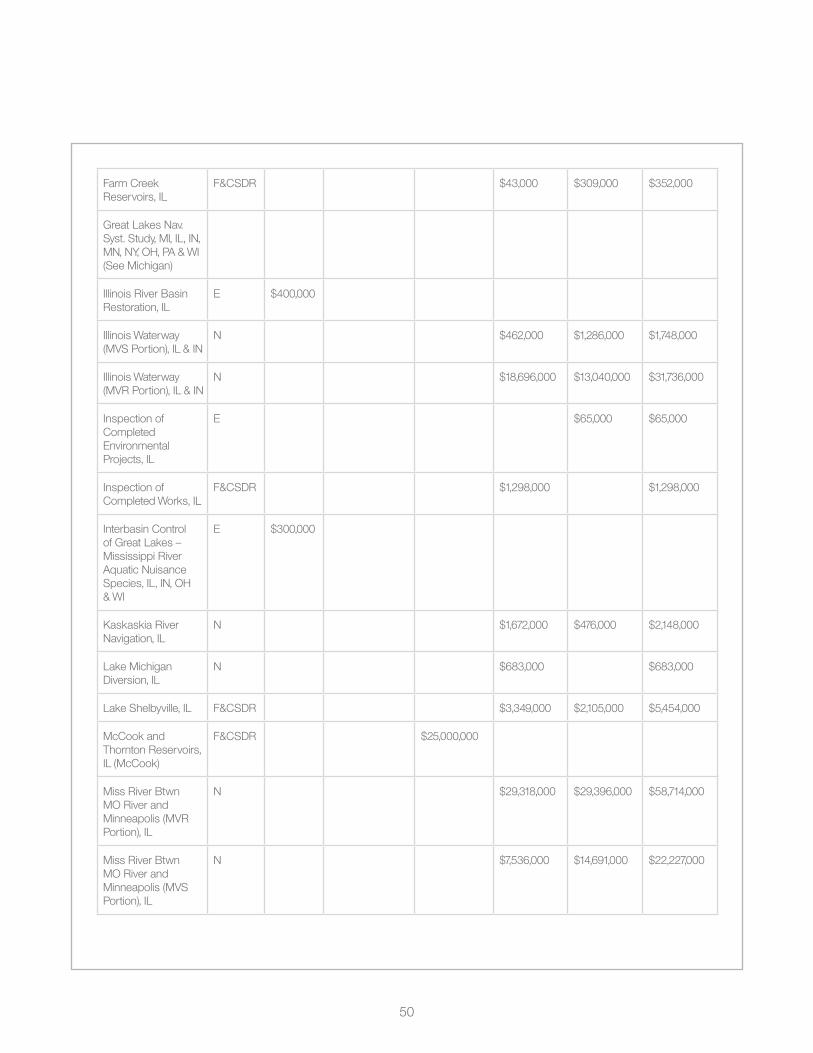
farm Creek reservoirs, IL
f&Csdr $43,000 $309,000 $352,000
great Lakes nav. syst. study, mI, IL, In, mn, ny, oh, Pa & WI (see michigan)
Illinois river Basin restoration, IL
e $400,000
Illinois Waterway (mvs Portion), IL & In
n $462,000 $1,286,000 $1,748,000
Illinois Waterway (mvr Portion), IL & In
n $18,696,000 $13,040,000 $31,736,000
Inspection of Completed environmental Projects, IL
e $65,000 $65,000
Inspection of Completed Works, IL
f&Csdr $1,298,000 $1,298,000
Interbasin Control of great Lakes – mississippi river AquaticNuisancespecies, IL, In, oh & WI
e $300,000
Kaskaskia river navigation, IL
n $1,672,000 $476,000 $2,148,000
Lake michigan diversion, IL
n $683,000 $683,000
Lake shelbyville, IL f&Csdr $3,349,000 $2,105,000 $5,454,000
mcCook and thornton reservoirs, IL (mcCook)
f&Csdr $25,000,000
miss river Btwn mo river and minneapolis (mvr Portion), IL
n $29,318,000 $29,396,000 $58,714,000
miss river Btwn mo river and minneapolis (mvs Portion), IL
n $7,536,000 $14,691,000 $22,227,000
50

miss river Btwn the ohio and mo rivers (reg Works), mo & IL (see missouri)
ohio river Locks and dams, Ky, IL, In & oh (see Kentucky)
ohio river open Channel Work, Ky, IL, In, oh, Pa & Wv (see Kentucky)
olmsted Locks and dam, ohio river, IL & Ky
n $109,790,000
Project Condition surveys, IL
n $104,000 $104,000
rend Lake, IL f&Csdr $3,724,000 $1,662,000 $5,386,000
surveillance of northern Boundary Waters, IL
f&Csdr $685,000 $685,000
upper mississippi river restoration, IL, Ia, mn, mo & WI
e $20,000,000
Waukegan harbor, IL n $492,000 $492,000
Wood river Levee, IL f&Csdr $1,170,000
51

a listing of Kentucky projects slated for fiscal year 2010:
Project Type Survey Preconstruction Construction Operation Maintenance Total O&M
Barkley dam and Lake Barkley, Ky & tn
mP $6,460,000 $3,933,000 $10,393,000
Barren river Lake, Ky
f&Csdr $2,496,000 $18,000 $2,514,000
Big sandy harbor, Ky
n $1,710,000 $1,710,000
Buckhorn Lake, Ky f&Csdr $1,576,000 $9,000 $1,585,000
Carr Creek Lake, Ky f&Csdr $1,737,000 $1,737,000
Cave run Lake, Ky f&Csdr $926,000 $926,000
dewey Lake, Ky f&Csdr $1,775,000 $1,775,000
elvis stahr (hickman) harbor, Ky
n $40,000 $40,000
fishtrap Lake, Ky f&Csdr $1,971,000 $200,000 $2,171,000
grayson Lake, Ky f&Csdr $1,709,000 $1,709,000
green and Barren rivers, Ky
n $1,829,000 $51,000 $1,880,000
green river Lake, Ky
f&Csdr $2,182,000 $20,000 $2,202,000
green river Watershed, Ky
e $200,000
Inspection of Completed Works, Ky
f&Csdr $665,000 $665,000
Kentucky Lock and dam, tennessee river, Ky
n $18,696,000 $13,040,000 $31,736,000
Kentucky river, Ky n $10,000 $10,000
Laurel river Lake, Ky
mP $898,000 $1,029,000 $1,927,000
52

markland Locks and dam, Ky & In (rehab)
n $1,000,000
martins fork Lake, Ky
f&Csdr $674,000 $140,000 $814,000
middlesboro Cumberland Basin, Ky
f&Csdr $93,000 $20,000 $113,000
nolin Lake, Ky f&Csdr $2,468,000 $9,000 $2,477,000
ohio river Locks and dams, Ky, IL, In & oh
n $20,376,000 $20,372,000 $40,748,000
ohio river Locks and dams, Wv, Ky & oh (see West virginia)
ohio river open Channel Work, Ky, IL, In, oh, Pa & Wv
n $5,836,000 $5,836,000
ohio river open Channel Work, Wv, Ky & oh (see West virginia)
olmsted Locks and dam, ohio river, IL & Ky (see Illinois)
ohio river open Channel Work, Ky, IL, In, oh, Pa & Wv (see Kentucky)
Paintsville Lake, Ky f&Csdr $1,231,000 $1,231,000
rough river Lake, Ky
f&Csdr $2,732,000 $10,000 $2,742,000
taylorsville Lake, Ky f&Csdr $1,104,000 $1,104,000
Wolf Creek dam, Lake Cumberland, Ky
f&Csdr $123,000,000 $4,722,000 $3,113,000 $7,835,000
yatesville Lake, Ky f&Csdr $1,143,000 $1,143,000
53
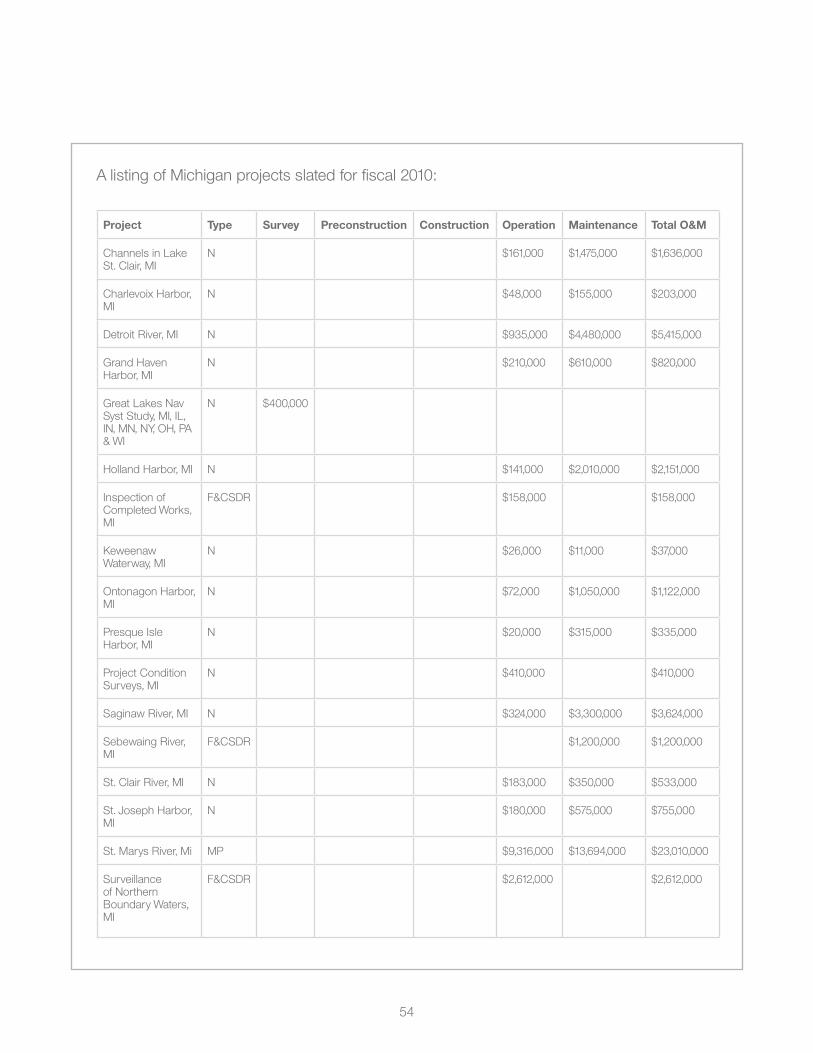
a listing of michigan projects slated for fiscal 2010:
Project Type Survey Preconstruction Construction Operation Maintenance Total O&M
Channels in Lake st. Clair, mI
n $161,000 $1,475,000 $1,636,000
Charlevoix harbor, mI
n $48,000 $155,000 $203,000
detroit river, mI n $935,000 $4,480,000 $5,415,000
grand haven harbor, mI
n $210,000 $610,000 $820,000
great Lakes nav syst study, mI, IL, In, mn, ny, oh, Pa & WI
n $400,000
holland harbor, mI n $141,000 $2,010,000 $2,151,000
Inspection of Completed Works, mI
f&Csdr $158,000 $158,000
Keweenaw Waterway, mI
n $26,000 $11,000 $37,000
ontonagon harbor, mI
n $72,000 $1,050,000 $1,122,000
PresqueIsleharbor, mI
n $20,000 $315,000 $335,000
Project Condition surveys, mI
n $410,000 $410,000
saginaw river, mI n $324,000 $3,300,000 $3,624,000
sebewaing river, mI
f&Csdr $1,200,000 $1,200,000
st. Clair river, mI n $183,000 $350,000 $533,000
st. Joseph harbor, mI
n $180,000 $575,000 $755,000
st. marys river, mi mP $9,316,000 $13,694,000 $23,010,000
surveillance of northern Boundary Waters, mI
f&Csdr $2,612,000 $2,612,000
54

a listing of ohio projects slated for 2010:
Project Type Survey Preconstruction Construction Operation Maintenance Total O&M
alum Creek Lake, oh
f&Csdr $1,545,000 $1,545,000
ashtabula harbor, oh
n $840,000 $840,000
Berlin Lake, oh
f&Csdr $2,198,000 $2,198,000
Caesar Creek Lake, oh
f&Csdr $1,478,000 $22,000 $1,500,000
Clarence J Brown dam, oh
f&Csdr $1,095,000 $50,000 $1,145,000
Cleveland harbor, oh
n $975,000 $6,382,000 $7,357,000
Conneaut harbor, oh
n $55,000 $1,136,000 $1,191,000
deer Creek Lake, oh
f&Csdr $1,481,000 $1,481,000
delaware Lake, oh
f&Csdr $1,322,000 $1,322,000
dillon Lake, oh
f&Csdr $1,366,000 $1,366,000
dover dam, muskingum river, oh (dam safety assurance)
f&Csdr $18,500,000
great Lakes nav syst study, mI, IL, In, mn, ny, oh, Pa & WI (see michigan)
Inspection of Completed Works, oh
f&Csdr $555,000 $555,000
55

Interbasin Control of great Lakes-mississippi RiverAquaticnuisance species, IL, In, oh & WI (see Illinois)
Lorain harbor, oh
n $50,000 $830,000 $880,000
massillon Local Protection Project, oh
f&Csdr $37,000 $37,000
michael J Kirwan dam and reservoir, oh
f&Csdr $1,089,000 $1,089,000
mississippi flood Control, oh
f&Csdr $1,727,000 $1,727,000
MosquitoCreek Lake, oh
f&Csdr $995,000 $995,000
muskingum river Lakes, oh
f&Csdr $7,306,000 $7,306,000
north Branch Kokosing river Lake, oh
f&Csdr $274,000 $274,000
ohio river Locks and dams, Ky, IL, In & oh (see Kentucky)
ohio river Locks and dams, Pa, oh & Wv (see Pennsylvania)
ohio river Locks and dams, Wv, Ky & oh (see West virginia)
56

Paint Creek Lake, oh
f&Csdr $1,216,000 $1,216,000
Project Conditions surveys, oh
n $295,000 $295,000
roseville Local Protection Project, oh
f&Csdr $35,000 $35,000
sandusky harbor, oh
n $65,000 $1,400,000 $1,465,000
surveillance of northern Boundary Waters, oh
f&Csdr $234,000 $234,000
toledo harbor, oh
n $535,000 $4,499,000 $5,034,000
tom Jenkins dam, oh
f&Csdr $894,000 $894,000
West fork of mill Creek Lake, oh
f&Csdr $698.000 $47,000 $745,000
William h harsha Lake, oh
f&Csdr $1,019,000 $10,000 $1,029,000
Key To Abbreviations
e - environmental restoration
f&Csdr - flood and Coastal storm damage reduction
h - hydropower
n - navigation
rec - recreation
mp - multi-Purpose
57
III. RAILWAYS
railways is defined as domestic commercial railroads, cars and connecting facilities.
Indiana railway funding comes in the form of either grants or loans to operating entities.
specifically grants are funded through the Indiana Industrial rail service fund (Irsf) while
loans are funded through the federal transportation Infrastructure finance and Innovation
act (tIfIa) and the railroad rehabilitation and Improvement financing (rrIf).
State
grants are distributed through the Indiana Industrial rail service fund program (Irsf).
the Irsf receives its funding from Indiana sales tax of which 0.029% is designated for the
grants. to be eligible for a grant the operators must be Class II or Class III railroads, and port
authorities. these railroad class designations are set by the surface transportation Board
(stB) and are based upon annual revenues adjusted for inflation.
grants through the Industrial rail service fund program can be used for the rehabilitation of
railroad infrastructure or railroad construction. examples of projects include bridge deck repair,
new ties and ballast and accepted track upgrades. railroads are limited to a grant award that
does not exceed 75% of the total cost of the project. the maximum grant award for a railroad
in fiscal year 2009, July 1, 2008 – June 30, 2009, is $375,000.00. Port authorities are limited
to a grant award not to exceed 20% of the gross sales tax receipts deposited in the state
fiscal year (2008) before the fiscal year (2009) the grant is made. the maximum grant amount
available for Port authorities for fy09 is $373,000.00.
58

Indiana Irsf grants awarded for 2009 is as follows:
railroad AmountRequested Project County award amount
Central Indiana & Western $299,545.56 madison $299,545.56
hoosier southern railroad $373,000.00 Perry $373,000.00
Indiana eastern railroad $100,000.00 Wayne $100,000.00
Indiana northeastern railroad Co.
$300,000.00 Lagrange/steuben $300,000.00
Indiana southwestern railway
$176,708.00 vanderburgh $176,708.00
Winamac southern railway $266,727.00 Cass $266,727.00
Kankakee, Beaverville & southern
$375,000.00 Benton $184,019.44
Funds Exhausted $1,700,000.00
*A breakdown of the Indiana IRSF grant funding point system is in Exhibit 3
Federal
Loans are administered through two programs: the transportation Infrastructure finance and
Innovation act (tIfIa) and railroad rehabilitation and Improvement financing (rrIf).
TIFIA
tIfIa is a federal credit program for eligible transportation projects of national or regional
significance under which the us department of transportation may provide three forms of
credit assistance: secured (direct) loans, loan guarantees, and standby lines of credit. the
usdot awards credit assistance to eligible applicants, which include state departments of
transportation, transit operators, special authorities, local governments, and private entities.
through tIfIa, the dot provides federal credit assistance to eligible highway, transit,
59

rail, and intermodal freight projects, including access to seaports. through safetea-Lu,
Congress authorized $122 million for each federal fiscal year from 2005 through 2009. this
funding amount can support more than $2 billion of average annual credit assistance.
dot will initially approve project and determine its subsidy based up the following criteria:
• ProjectCost
• RatingOpinion
• PlanningRequirements
• CreditAssistanceRequest
• RepaymentSource
• EnvironmentalReview
• TIFIAComplianceCertifications
• OtherComplianceIssues
dot concurrently evaluates the strength of applications based up the following criteria
and weights:
• Significance(20%)
• PrivateParticipation(20%)
• Environment(20%),
• ProjectAcceleration(12.5%)
• Creditworthiness(12.5%)
• UseofTechnology(5%)
• ConsumptionofBudgetAuthority(5%)
• ReducedFederalGrantAssistance(5%)
60
RRIF
the rrIf program is intended to make funding available through loans and loan
guarantees for railroad capital improvements. the funds may be used by the following
entities:
• StateandLocalGovernments
• GovernmentSponsoredAuthorities
• Corporations,Railroads,JointVenturesthatIncludeatLeastOneRailroad,and
limited option freight shippers who intend to construct a new rail connection
the following purposes are eligible for direct loans and loan guarantees:
• Acquire,improve,orrehabilitateintermodalorrailequipmentorfacilities,including
track, components of track, bridges, yards, buildings, and shops
• Refinanceoutstandingdebtincurredforthepurposedescribedabove
• Developorestablishnewintermodalorrailroadfacilities
• Directloansandloanguaranteesarenottobeusedforrailroadoperatingexpenses
under the rrIf, direct loans and loan guarantees of up to $35 billion at any one time are
available. of this amount, at least $7 billion is solely available for projects primarily benefiting
freight railroads other than Class I carriers. direct loans can fund up to 100% of a railroad
projectwithrepaymentperiodsofupto35yearsandinterestratesequaltothecostof
borrowing to the government.
61

Project Selection
Loansaretobeusedtoacquire,improve,developorrehabilitateintermodalorrail
equipmentfacilities,includingtrack,bridges,yards,andshops.Proposedprojectshaveto
meet the following criteria:
• Enhancepublicsafetyandtheenvironment
• Promoteeconomicdevelopment
• EnableUScompaniestobemorecompetitiveininternationalmarkets
• Areendorsedinstateandlocaltransportationplans
• Preserveorenhancerailorintermodalservicetosmallcommunitiesorruralareas
• Enhanceserviceandcapacityinthenationalrailsystem
• Wouldmateriallyalleviaterailcapacityproblemswhichdegradetheprovisionof
service to shippers and would fulfill a need in the national transportation system
iv. ROAdwAy fuNdiNG
roadways are defined as domestic interstates, highways, roads, bridges, rail-highway
crossings and recreational trails. roadways are funded through the federal legislation;
Safe,Accountable,Flexible,Efficient,TransportationEquityAct–aLegacyforUsers
(safetea-Lu), that was passed in 2005 which guarantees funding for highways, highway
safety and public transportation in the amount of $180 billion for fiscal years 2005 – 2009.
62

Tax Revenues
safetea-Lu is funded by the highway account of the highway trust fund, which is in turn
funded by the motor fuel tax (gas tax). a breakdown of the gas tax and its distribution is as
follows:
highway Trust Fund Accounts
user fee tax rate effective date highway Account**
Mass Transit Account
Leaking underground storage tank trust fund
general fund
fuel taxes (Cents per gallon)
gasoline 18.318.4
1/1/199610/1/1997
1215.44
22.86
-0.1
4.3-
diesel fuel 24.324.4
1/1/199610/1/1997
1821.44
22.86
-0.1
4.3-
* Additional tax revenue generated in: Special Fuels, Neat Alcohol, Compressed Natural Gas and Gasohol
** Other taxes funding Highway Account, Tire Sales, Truck and Trailer Sales and Heavy- use Vehicle Sales
gasoline, diesel and Kerosene tax revenue is generated when the fuels are removed from
a refinery or registered pipeline or barge terminal. typically, these fuels are transferred
bypipelineorbargeinlargequantities(bulk)toterminalstoragefacilitiesthatare
geographically located closer to destination retail markets. a fuel is taxed when it breaks
bulk, i.e., when it is removed from the refinery or terminal, typically by truck or rail car, for
delivery to a smaller wholesale facility or a retail outlet. once at the retail outlet the gas tax
is then passed to the consumer at the pump.
63

tax is also imposed on the entry into the united states of any taxable fuel for
consumption, use, or warehousing. this tax does not apply to any entry of a taxable fuel
transferred in bulk to a terminal or refinery if the person entering the taxable fuel and the
operator of such terminal or refinery are registered. as with non-imported fuel, the fuel is
taxed once it breaks bulk.
Funding Formulas
the united states department of transportation federal highway administration
apportions the safetea-Lu funds into twelve categories for roadway transportation and
anadditionalequitybonusprogram.Eachofthetwelvecategorieshasitsownfunding
formula that determines how much Indiana receives for each particular category. the 12
apportionment categories include:
1. Interstate maintenance
2. national highway system
3. surface transportation Program
4. highway Bridge
5. Congestion mitigation and air Quality Improvement
6. recreational trails
7. metropolitan Planning
8. highway safety Improvement
9. railway-highway Crossing
10. safe routes to schools
11. appalachian highway system*
12. Coordinated Border Infrastructure*
64
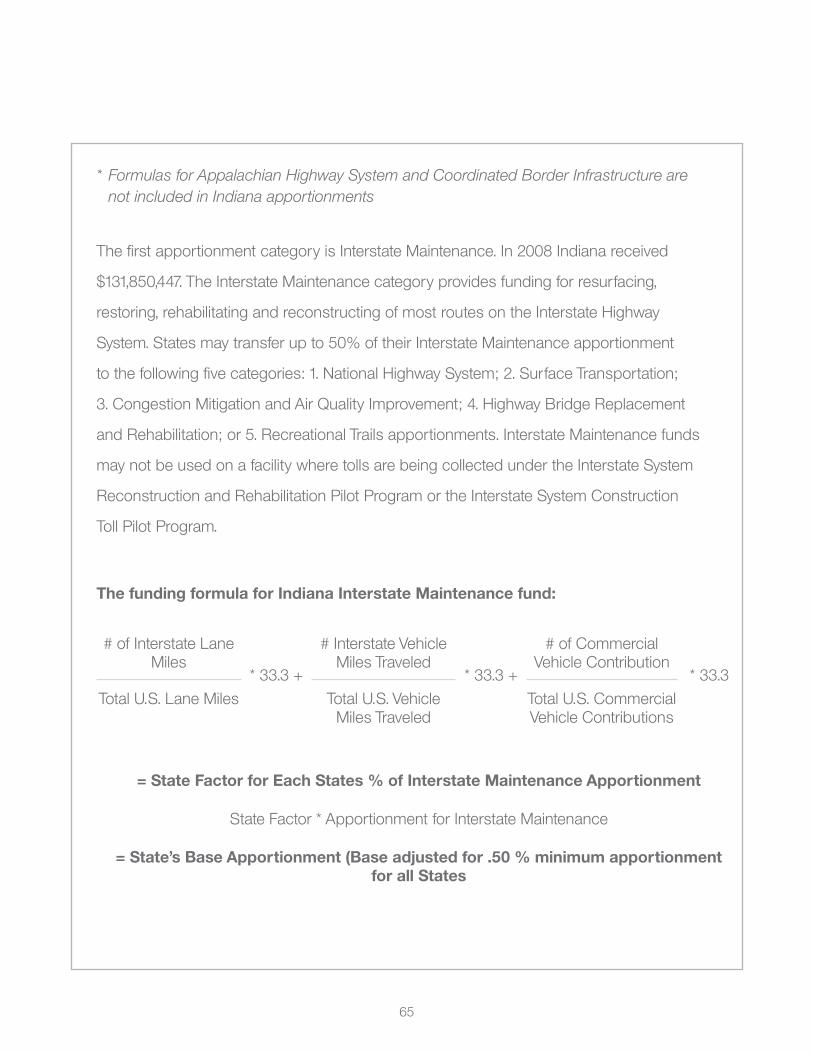
* Formulas for Appalachian Highway System and Coordinated Border Infrastructure are not included in Indiana apportionments
the first apportionment category is Interstate maintenance. In 2008 Indiana received
$131,850,447. the Interstate maintenance category provides funding for resurfacing,
restoring, rehabilitating and reconstructing of most routes on the Interstate highway
system. states may transfer up to 50% of their Interstate maintenance apportionment
to the following five categories: 1. national highway system; 2. surface transportation;
3. Congestion mitigation and air Quality Improvement; 4. highway Bridge replacement
and rehabilitation; or 5. recreational trails apportionments. Interstate maintenance funds
may not be used on a facility where tolls are being collected under the Interstate system
reconstruction and rehabilitation Pilot Program or the Interstate system Construction
toll Pilot Program.
The funding formula for Indiana Interstate Maintenance fund:
# of Interstate Lane miles
* 33.3 +
# Interstate vehicle miles traveled
* 33.3 +
# of Commercial vehicle Contribution
* 33.3
total u.s. Lane miles total u.s. vehicle miles traveled
total u.s. Commercial vehicle Contributions
= State Factor for Each States % of Interstate Maintenance Apportionment
state factor * apportionment for Interstate maintenance
= State’s Base Apportionment (Base adjusted for .50 % minimum apportionment for all States
65

Adjusted Base
(-) Less .205% for fshrP
(+)PlusEquityBonus
(-) Less 2% to sPr
(-) Less 10% Limiting amount
(=) apportionment available for Indiana use
* Definitions for Interstate Lane Miles, Interstate Vehicle Miles Traveled, Commercial Vehicle Contributions, FSHRP and SPR are in Exhibit 2.
2008 Example for Indiana:
5,015* 33.3 +
16,290* 33.3 +
461,246* 33.3= 0.026668
211,595 727,566 13,600,520
Initial factor = 0.026681
total u.s. apportionment for Interstate maintenance = $4,959,606,157
0.0266681 * $4,959,606,157 = Base apportionment
Base apportionment = $132,130,279
the second apportionment is the national highway system (nhs). In 2008 Indiana
received $134,880,355. the program provides funding for improvements to rural and
urban roads that are part of the nhs, including the Interstate system and designated
connections to major intermodal terminals. under certain circumstances, nhs funds may
also be used to fund transit improvements in nhs corridors. additional uses of the fund are
environmentalrestoration,pollutionabatementandcontrolofterrestrialandaquaticnoxious
weeds and establishment of native species.
66

The funding formula for Indiana National highway System fund:
# of state other Principle arterial Lane miles * 25%+
total u.s. other Principle Lane miles
# of state other Principle arterial miles traveled * 25%+
total u.s. other Principle Lane miles
amount of state diesel fuel usage * 35%+
total u.s. diesel fuel usage
(state Principal Lane miles ÷ state Population) *10%
total for u.s.
= Factor for Each States % of National highway System Apportionment
state factor * apportionment for national highway system
= State’s Base Apportionment (base adjusted for .50% minimum apportionment for all States)
Adjusted Base
(-) Less .205% for fshrP
(+)PlusEquityBonus
(-) Less 2% to sPr
(-) Less 10% Limiting amount
67

(=) apportionment available for Indiana use
* Definitions of Other Principal Arterial Lane Miles, Other Principal Arterial Vehicle Miles Traveled, State Principle Lane Mile, FSHRP and SPR are in Exhibit 2.
the third apportionment is the surface transportation Program. In 2008 Indiana received
$152,778,230. the surface transportation Program provides flexible funding that may be
used by states and localities for projects on any federal-aid highway (highways that cross
state lines), including the national highway system, bridge projects on any public road,
transit capital projects, and intracity and intercity bus terminals and facilities.
The funding formula for Indiana Surface Transportation Program fund:
# of state federal-aid Lane miles
* 25% +
# of state federal-aid vehicle miles traveled
* 33.3% +
amount of state highway account
Contributions
total u.s. federal-aid Lane miles
total u.s. federal-aid vehicle miles traveled
total u.s. highway account Contributions
= Factor for each state’s percentage of Surface Transportation Apportionment
state factor * apportionment for surface transportation
= State’s Base Apportionment (Base adjusted for .50 % minimum apportionment for all States
Adjusted Base
(-) Less .205% for fshrP
(+)PlusEquityBonus
(-) Less 2% to sPr
68

(-) Less 10% Limiting amount
(=) apportionment available for Indiana use
(-) Less Limiting amounts usC
0.25% sec 143
0.50% sec 140
0.50% sec 504
0.10% sec 120
0.10% sec 1502
(-) Less 10% for transportation enhancement
(=) stP available for distribution by Population
62.5% distributed to stP population focus based upon 2000 Census. Populations 1.) over 200k, 2.) 200k to 5k and 3.) 5k and under
1. Population over 200k apportionment: apportionment available for Indiana
use * percent of population in area over 200k
2. Population between 200k and 5k: apportionment based on % of population
200k and 5k in total residence
3. Population under 5k: minimum apportionment based on fy91
apportionments for secondary systems * 1.10
37.5% distributed to all other areas of the state
* Definitions of Other Principal Arterial Lane Miles, Other Principal Arterial Vehicle Miles Traveled, State Principle Lane Mile, FSHRP and SPR are in Exhibit 2.
the fourth apportionment is the highway Bridge Program. In 2008 Indiana received
$53,888,776. the highway Bridge Program provides funding to enable states to improve
the condition of their highway bridges through replacement, rehabilitation, and systematic
preventive maintenance.
69

The funding formula for Indiana highway Bridge fund:
state repair/replace Cost of highway Bridges= Initial factor of apportionment
total repair/replace Cost for u.s.
factor redistribute to ensure .25 minimum factor for all states
(=) EqualsFinalFactorforApportionment
(*) times total u.s. highway Bridge apportionment
(=) EqualsStatesBaseApportionment
(-) Less .205% for fshrP
(+)PlusEquityBonus
(-) Less 2% to sPr
(=) EqualsApportionmentAvailableforIndianaUse
15% of apportionment for mandatory use off-system
85% of apportionment for optional use on/off-system
the fifth apportionment is the Congestion mitigation and air Quality Improvement Program
(CmaQ). In 2008 Indiana received $31,203,124. the CmaQ provides funding for projects
andprogramsinairqualitynonattainmentandmaintenanceareasforozone,carbon
monoxide (Co), and particulate matter (Pm-10, Pm-2.5) which reduce transportation
related emissions. a state may transfer CmaQ funds to its surface transportation,
national highway system, Interstate maintenance, Bridge, highway safety Improvement,
and/or recreational trails apportionment. the amount that may be transferred may not
exceed 50% of the amount by which the state’s CmaQ apportionment for the fiscal year
exceeds the amount the state would have been apportioned if the program had been
funded at $1.35 billion annually. states and mPos will give priority in distributing funds
70

for projects and programs to diesel retrofits and other cost-effective emission reduction
activities,andcost-effectivecongestionmitigationactivitiesthatprovideairqualitybenefits.
The funding formula for Indiana Congestion Mitigation and Air Quality Improvement fund:
Weighted Population of state
total Population for u.s.
(=)EqualsInitialFactor
factor redistributed to ensure .50% minimum factor for all state
(=) final factor for apportionment
(x) times CmaQ total u.s. apportionment
(=)EqualsStatesBaseCMAQApportionment
(-) Less .205% for fshrP
(+)PlusEquityBonus
(-) Less 2% to sPr
(-) Less Limiting amount
10% 23 usC; sec. 120
10% P.L. 109-59; sec. 1502
(=)EqualsApportionmentAvailableforIndianaUse
the sixth apportionment is the recreational trail Program (rtP). In 2008 Indiana received
$1,301,307. the rtP provides funds to the states to develop and maintain recreational
trails and trail-related facilities for both non-motorized and motorized recreational trail
uses.Examplesoftrailusesincludehiking,bicycling,in-lineskating,equestrianuse,cross-
country skiing, snowmobiling, off-road motorcycling, all-terrain vehicle riding, four-wheel
driving, or using other off-road motorized vehicles.
71

The funding formula for Indiana Recreational Trails fund:
states eligible for factor of 1.9807843
each state gets Initial Partial apportionment of $776,078
off road recreational fuel usage
total us off-road recreational fuel usage
(=) EqualsStatesBaseFactor
(x) times total u.s. recreational trails apportionment
(+) Plus Partial apportionment of $776,078
(=) states Base apportionment
(-) Less Limiting amount
7% for 23 usC; 206
5% for 23 usC; 206
10% for 23 usC; 120
(=) EqualApportionmentAvailableforIndianaUse
the seventh apportionment is metropolitan Planning. In 2008 Indiana received
$5,068,929. the metropolitan planning process establishes a cooperative, continuous,
and comprehensive framework for making transportation investment decision in
metropolitan areas. Program oversight is a joint federal highway administration/federal
transit administration responsibility.
The funding formula for Indiana Metropolitan Planning fund:
amount of state Population in urbanized areas
total u.s. Population in urbanized areas
72
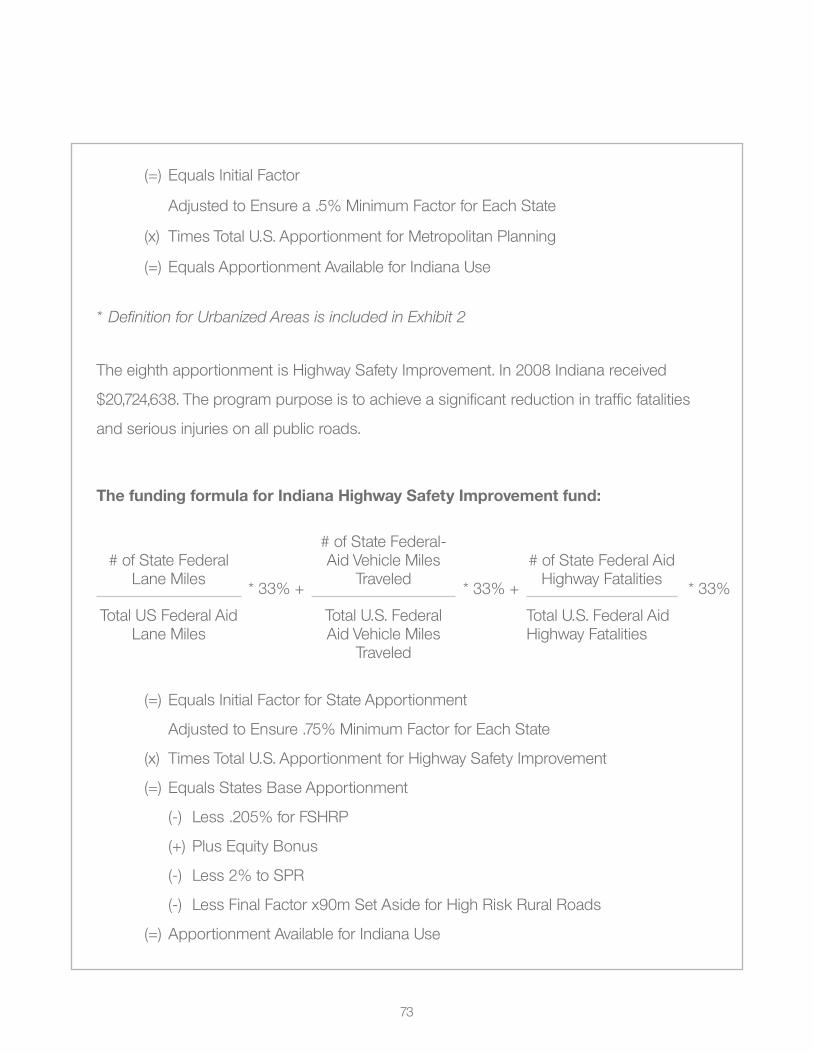
(=) EqualsInitialFactor
adjusted to ensure a .5% minimum factor for each state
(x) times total u.s. apportionment for metropolitan Planning
(=) EqualsApportionmentAvailableforIndianaUse
* Definition for Urbanized Areas is included in Exhibit 2
the eighth apportionment is highway safety Improvement. In 2008 Indiana received
$20,724,638. the program purpose is to achieve a significant reduction in traffic fatalities
and serious injuries on all public roads.
The funding formula for Indiana highway Safety Improvement fund:
# of state federal Lane miles
* 33% +
# of state federal-aid vehicle miles
traveled* 33% +
# of state federal aid highway fatalities
* 33%
total us federal aid Lane miles
total u.s. federal aid vehicle miles
traveled
total u.s. federal aid highway fatalities
(=) EqualsInitialFactorforStateApportionment
adjusted to ensure .75% minimum factor for each state
(x) times total u.s. apportionment for highway safety Improvement
(=) EqualsStatesBaseApportionment
(-) Less .205% for fshrP
(+)PlusEquityBonus
(-) Less 2% to sPr
(-) Less final factor x90m set aside for high risk rural roads
(=) apportionment available for Indiana use
73

the ninth apportionment is railway-highway Crossing. In 2008 Indiana received $7,204,490.
the purpose is to reduce the number of fatalities and injuries at public highway-rail grade
crossings through the elimination of hazards and/or the installation/upgrade of protective
devices at crossings.
The funding formula for Indiana Railway-highway Crossing fund:
# of state Public railway-highway Crossings/total u.s. Public railway-highway Crossings
2
+
Initial surface transportation factor
2
(=) EqualtoInitialFactorforStateApportionment
adjusted to ensure .50% minimum factor for each state
(x) times total u.s. apportionment for Public railway-highway Crossings
(=) states Base apportionment
50% for Protective devices
50% for flexible spending
2% Limiting amount for data Compilation and analysis
(=) EqualsApportionmentAvailableforIndianaUse
* Definition for Railway-Highway Crossings is in Exhibit 2
74

the tenth apportionment is safe route to school. In 2008 Indiana received $2,994,241.
the program is set up to enable and encourage children, including those with disabilities,
to walk and bicycle to school; to make walking and bicycling to school safe and more
appealing; and to facilitate the planning, development and implementation of projects that
will improve safety, and reduce traffic, fuel consumption, and air pollution in the vicinity
of schools.
The funding formula for Indiana Safe Route to School fund:
# of state Public and Private school enrollments
total u.s. Public and Private school enrollments
(=)EqualsBaseFactorforApportionments
(x) times total u.s. apportionments for safe routes to school
(=) Initial state apportionment
adjusted to ensure each state receives minimum of $1,000,000
(=)EqualsApportionmentAvailableforIndianaUse
10% mandatory spending on non-Infrastructure Projects
70% mandatory spending on Infrastructure Projects
20% optional spending on either
Thefinalapportionment,EquityBonus,isanapportionmentbasedoffthecore
programs of Interstate maintenance (Im), national highway system (nhs), Bridge, surface
transportation (stP), highway safety Improvement (hsIP) and Congestion mitigation
and air Quality Improvement (CmaQ). this apportionment is divided amongst these core
programs based upon the percentage of each core programs apportionment compared
75

to the state’s total apportionment. selected states are guaranteed a share of
apportionments and high Priority Projects not less than the state’s average annual share
under tea-21. In 2008 Indiana received $372,207,495.
The funding formula for Indiana Equity Bonus fund:
Previous fy state Contribution to highway trust fund
total u.s. highway trust fund Contributions
(x) times 92% minimum share
(=) Initial factor
each state is then graded against Criteria to determine if eligibility to tea-21
Program share
Criteria Based upon % of
Population density Less than (<) 40
federal Land ownership greater than (>) 1.25%
Population Less than (<) 1 million
median household Income Less than (<) $35,000
2002 fatalities Per 100 vehicle miles traveled Less than (>) 1
Indexed state motor fuel tax greater than (>) 150%
If yes to 2 or more of the Criteria above; average from tea-21 Program used
as % share
If no state Criteria, use Initial factor
tea-21 average apportionments
(x) times 120%
(=)EqualsFloorforApportionments
76

state apportionments for all Categories
total u.s. apportionments for all Categories
(=) EqualsApportionmentShare
If Initial factor is greater than apportionment share, use Initial factor
Initial factor
(x) times Iteration #1
(=) EqualsTargetApportionment -Formula continued on next page
If minimum shares are Below apportionment share, use tea-21 floor for
target apportionment
Iterate five times to get all state below minimum apportionment share by using
floor apportionment
(=) EqualsFinalTargetApportionment
(-) Less total state apportionment with all Categories
(=) EqualsEquityBonusDistribution
EquityBonusDistribution
(-) Less exemption from Limitation
$639Millionx%ShareofEquityBonus(StateEquityBonus/TotalforU.S.
EquityBonus)
(-) Less special Limitation
$2Billionx%ofEquityBonus
77

(=) EqualsAmountforProgrammaticDistribution(CoreProgram)
Interstate maintenance
national highway system
surface transportation Program
highway Bridge Program
Congestion mitigation and air Quality Improvement
highway safety Improvement
The%ShareofeachCategorytheState’sEntireApportionmentusedtoDistributeEquity
Bonus to Core Programs
* Definition for TEA-21 is in Exhibit 2
the grand total for Indiana’s 2008 apportionments is $914,102,032.
Legislation mandates each state receive a minimum percentage regardless of what their
true factor is calculated as. once the initial factor has been calculated the minimum
percentage is added to states initial factor below minimum. after which the initial factor for
all other states is recalculated (decreased) to cover this adjustment.
Note on SAFETEA-LU
With safetea-Lu set to expire this year, there is a risk that these funding formulas
could be obsolete. If Congress decides to reauthorize or extend safetea-Lu then,
these formulas will remain constant. If Congress determines to change the safetea-Lu
program in favor of a new law, the formulas could change. therefore these formulas will no
longer remain valid. the other item to note is that safetea-Lu is not set up to fund major
projects. major projects are anything other than normal wear, minor repairs and upkeep.
78

safetea-Lu’s primary function is to maintain the current roadway’s upkeep of minor
projects of the roadway systems. for Indiana, major projects will need other government
funding sources such as: major moves, ear marks and government stimulus money.
v. EXhiBiTS
Exhibit 1 – Aviation Point System Break Down
a = airport Code
this is used to identify the role and size of the airport. each airport is assigned points
between 2 and 5.
Primary Commercial Service Airports
a – Large and medium hub = 5 pointsB – small and non hub = 4 points
Non-Primary Commercial Service, Reliever, and General Aviation Airports
Based Aircraft/Itinerant Operations
a - 100 or 50,000 = 5 pointsB - 50 or 20,000 = 4 pointsC - 20 or 8,000 = 3 pointsd - <20 or < 8,000 = 2 points
P = Purpose Points (0 to 10 points)Identifies the underlying objective of an airport development project.
Ca = Capacity = 7 pointsen = environment = 8 points
79

ot = other = 4 pointsPL = Planning = 8 pointsre = reconstruction = 8 pointssa = safety/security = 10 pointssP = statutory emphasis Programs = 9 pointsst = standards = 6 points
C = Component Points (0 to 10 points)Identifies the physical component (e.g., runway), for which the development is intended.
aP = apron = 5 pointsBd = Building = 3 pointsEQ=Equipment =8pointsfI = financing = 0 pointsgt = ground transportation = 4 pointshe = helipad = 9 pointsho = homes = 7 pointsLa = Land = 7 pointsna = new airport = 4 pointsot = other = 7 pointsPB = Public Building = 7 pointsPL = Planning = 7 points
t = type Points (0 to 10 points)Identifies the actual work being done (e.g., extension).
60 = outside 65 dnL = 0 points65 = 65-69 dnL = 4 points70 = 70-74 dnL = 7 points75 = Inside 75 dnL = 10 pointsaC = access = 7 pointsad = administration Costs = 0 pointsAQ=AcquireAirport =5pointsBo = Bond retirement = 0 pointsCo = Construction = 10 pointsdI= de-Icing facilities = 6 pointsdv = development Land = 6 points
80

ex = extension/expansion = 6 pointsff = fuel farm development = 2 pointsfr = rW friction = 9 pointsIm = Improvements = 8 pointsIn = Instrument approach aid = 7 pointsLI = Lighting = 8 pointsma = master Plan = 9 pointsme = metropolitan Planning = 7 pointsms = miscellaneous = 5 pointsmt = mitigation = 6 pointsno = noise Plan/suppression = 7 pointsoB = obstruction removal = 10 pointsPa = Parking = 1 pointsPm = People mover = 3 pointsrf = arff vehicle = 10 pointsrL = rail = 3 pointsse = security Improvement = 6 pointssf = rW safety area = 8 pointssg = rW/tW signs = 9 pointsSN=SnowRemovalEquipment =9pointssr = sensors = 8 pointsst = state Planning = 8 pointssv = service = 6 pointssZ = safety Zone (rPZ) = 8 pointsvI = visual approach aids = 8 pointsvt = Construct/tol rW/vert Plan = 2 pointsWX=WeatherReportingEquipment =8points
Exhibit 2 – Definitions
Interstate Lane Miles – number of miles in a state designated for interstate driving use
Commercial Vehicle Contributions – Payments made to the highway trust fund for truck and trailer interstate usage
Interstate Vehicle Miles Traveled – estimate usage of interstate miles per year in millions
81

Other Principle Arterial Lane Miles – highways that provide access between arterials and a major port, airport, public transportation facility or other intermodal transportation
Other Principle Arterial Vehicle Miles Traveled – estimated usage of in miles per year (millions) for other principle arterial lanes
Federal-Aid Lane Miles – as all roads minus local roads and rural minor collectors
Federal-Aid Vehicle Miles Traveled – estimate usage of federal-aid miles per year in millions
Urbanized Area – having a population of five thousand or more and not within any urbanized area, within boundaries to be fixed by responsible state and local officials in cooperation with each other
TEA-21–TransportationEquityActforthe21stCenturywasenactedJune9,1998,authorizes the federal surface transportation programs for highways, highway safety, and transit for the 6-year period 1998-2003
FShRP – future strategic highway research Program. federal program for highway planning
SPR – state Planning research. each state is allowed to use 2% of apportionment for planning and research
Exhibit 3 – Railway Point System
Industrial Rail Service Fund Scorecard
Project Description – Select from Section A or B (25 points maximum)
a.) Project Improves a rail segment to 286k Capacity
>10 miles 25 pts
5 – 9.99 miles 23 pts
1 – 4.99 miles 21 pts
< 1 mile 19 pts
82

B.) Construct a new Industrial sidetrack or siding for a Business 17 pts
rehab Project Increasing Class I to Class II track 15 pts
rehab Project Increasing excepted to Class I track 13 pts
other rehab Projects on Corridor Class I track 7 pts
other rehab Projects on Corridor Class II track 5 pts
existing economic Indicators (40 points maximum)
Class II Three Year Average Annual Rail Cars Moved per Track Mile
<30 30-60 61-100 101-300 301 +
2 points 10 points 7 points 4 points 2 points
Class II Railroad Is not eligible for additional points based on carloads/mile
job Growth of Business on Line in Last Year (excluding FY08 IRSF awardees)
Less than 6 0 pts
6 -20 jobs 3 pts
21 – 50 jobs 5 pts
51 – 100 jobs 7 pts
101 – 200 jobs 10 pts
201 – 400 jobs 15 pts
401 – 700 jobs 20 pts
> 700 jobs 25 pts
Railroad Organization Individual railroad
subsidiary-3 or Less railroads subsidiary-4 or Less railroads
operating in Indiana 5 points 3 points 1 points
INDOT’s Mission Statement Alignment (15 points maximum)
fra reportable derailments and/or injuries
1 or less 5 pts 1.1 to 4 3 pts >4 0 pts
Is the Project in an ozone attainment area
non-attainment 4 pts maintenance 2 pts attainment 0 pts
83

does the dept. of agriculture support the Project
yes 6 pts no
Other Considerations (10 points maximum)
Compliant with filings or Irsf Loan Payments on time and Crossing surfaces in good Condition 3 pts
Late with filings or Irsf Loan Payments and Crossing surfaces in good Condition 2 pts
Late with filings or Irsf Loan Payments or one Crossing surfaces in Poor Condition 1 pts
Late with filings or Irsf Loan Payments or multiple Crossing surfaces in Poor Condition 0 pts
railroad Contribution 25% - 30% 31% - 40% 41% - 50% 51% or higher
1 pts 3 pts 5 pts 7 pts
84

85
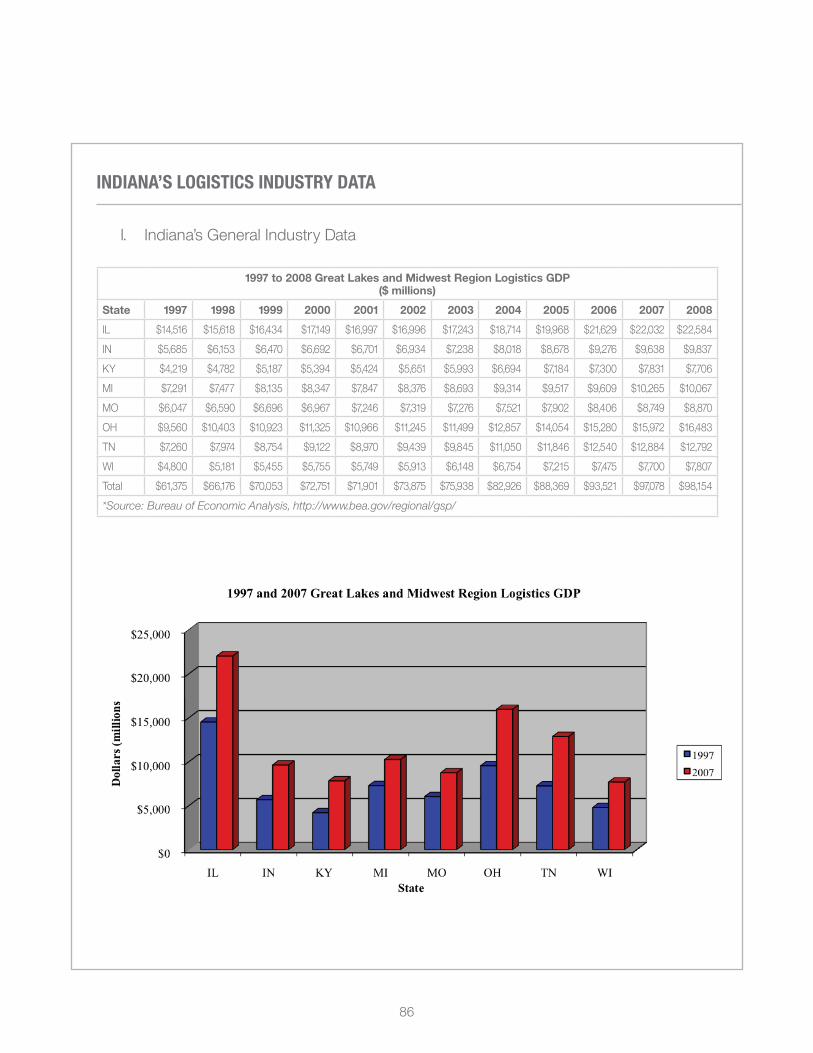
iNdiANA’S LOGiSTicS iNduSTRy dATA
I. Indiana’s general Industry data
1997 to 2008 Great Lakes and Midwest Region Logistics GDP($ millions)
State 1997 1998 1999 2000 2001 2002 2003 2004 2005 2006 2007 2008
IL $14,516 $15,618 $16,434 $17,149 $16,997 $16,996 $17,243 $18,714 $19,968 $21,629 $22,032 $22,584
In $5,685 $6,153 $6,470 $6,692 $6,701 $6,934 $7,238 $8,018 $8,678 $9,276 $9,638 $9,837
Ky $4,219 $4,782 $5,187 $5,394 $5,424 $5,651 $5,993 $6,694 $7,184 $7,300 $7,831 $7,706
mI $7,291 $7,477 $8,135 $8,347 $7,847 $8,376 $8,693 $9,314 $9,517 $9,609 $10,265 $10,067
mo $6,047 $6,590 $6,696 $6,967 $7,246 $7,319 $7,276 $7,521 $7,902 $8,406 $8,749 $8,870
oh $9,560 $10,403 $10,923 $11,325 $10,966 $11,245 $11,499 $12,857 $14,054 $15,280 $15,972 $16,483
tn $7,260 $7,974 $8,754 $9,122 $8,970 $9,439 $9,845 $11,050 $11,846 $12,540 $12,884 $12,792
WI $4,800 $5,181 $5,455 $5,755 $5,749 $5,913 $6,148 $6,754 $7,215 $7,475 $7,700 $7,807
total $61,375 $66,176 $70,053 $72,751 $71,901 $73,875 $75,938 $82,926 $88,369 $93,521 $97,078 $98,154
*Source: Bureau of Economic Analysis, http://www.bea.gov/regional/gsp/
86

2008 Great Lakes and Midwest Region Logistics Industry Employment
Illinois 580,460
Indiana 309,470
Kentucky 183,290
michigan 341,800
missouri 230,900
ohio 528,440
tennessee 309,030
Wisconsin 252,620
Source: Bureau of Labor Statistics
2006 Transportation and Warehousing Establishments and Employment
statenumber of
establishments ranknumber of employees rank
annual payroll (thousands) rank
Illinois 11,188 5 224,871 4 $9,486,301 3
Indiana 5,188 14 113,377 12 $3,948,600 14
Kentucky 3,185 25 80,529 18 $3,377,087 17
michigan 5,611 11 105,341 14 $4,179,675 12
missouri 5,041 15 88,083 16 $3,237,061 18
ohio 7,562 7 174,327 7 $6,665,712 9
tennessee 4,398 18 120,491 10 $4,558,242 10
Wisconsin 5,577 12 103,047 15 $3,577,654 16
sourCe: u.s. department of Commerce, u.s. Census Bureau, 2006 County Business Patterns, Washington, dC: 2008
87
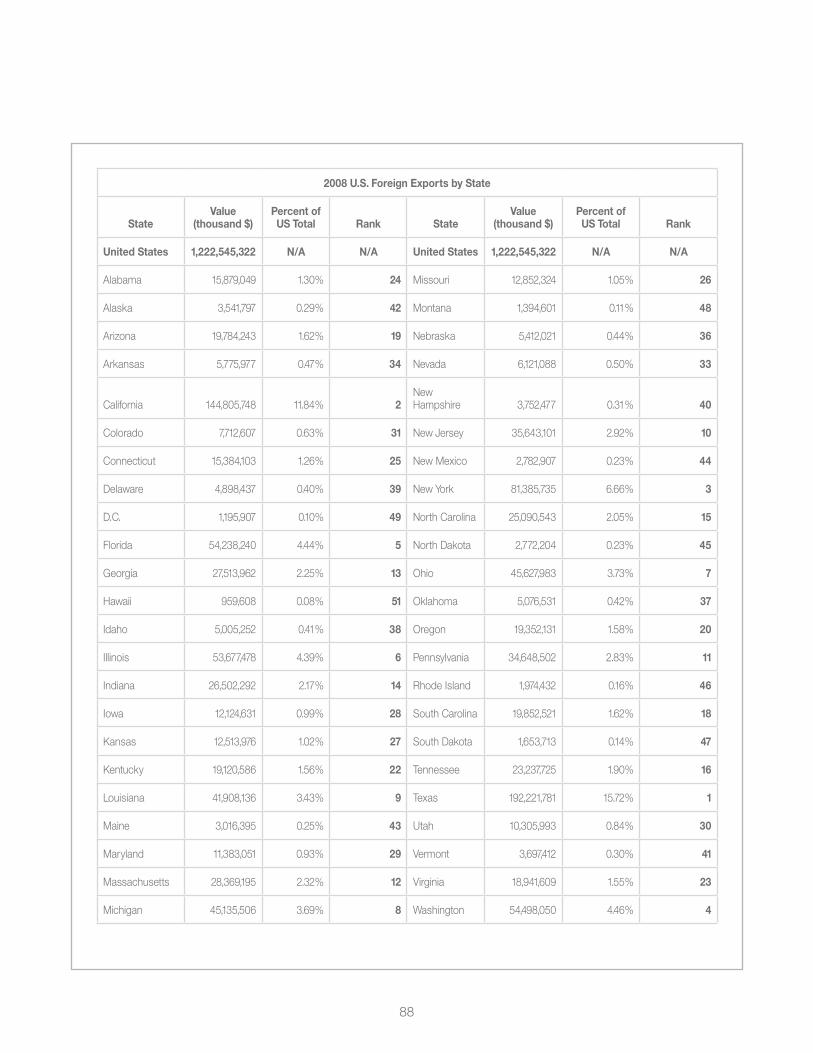
2008 U.S. Foreign Exports by State
StateValue
(thousand $)Percent of US Total Rank State
Value (thousand $)
Percent of US Total Rank
United States 1,222,545,322 N/A N/A United States 1,222,545,322 N/A N/A
alabama 15,879,049 1.30% 24 missouri 12,852,324 1.05% 26
alaska 3,541,797 0.29% 42 montana 1,394,601 0.11% 48
arizona 19,784,243 1.62% 19 nebraska 5,412,021 0.44% 36
arkansas 5,775,977 0.47% 34 nevada 6,121,088 0.50% 33
California 144,805,748 11.84% 2new hampshire 3,752,477 0.31% 40
Colorado 7,712,607 0.63% 31 new Jersey 35,643,101 2.92% 10
Connecticut 15,384,103 1.26% 25 new mexico 2,782,907 0.23% 44
delaware 4,898,437 0.40% 39 new york 81,385,735 6.66% 3
d.C. 1,195,907 0.10% 49 north Carolina 25,090,543 2.05% 15
florida 54,238,240 4.44% 5 north dakota 2,772,204 0.23% 45
georgia 27,513,962 2.25% 13 ohio 45,627,983 3.73% 7
hawaii 959,608 0.08% 51 oklahoma 5,076,531 0.42% 37
Idaho 5,005,252 0.41% 38 oregon 19,352,131 1.58% 20
Illinois 53,677,478 4.39% 6 Pennsylvania 34,648,502 2.83% 11
Indiana 26,502,292 2.17% 14 rhode Island 1,974,432 0.16% 46
Iowa 12,124,631 0.99% 28 south Carolina 19,852,521 1.62% 18
Kansas 12,513,976 1.02% 27 south dakota 1,653,713 0.14% 47
Kentucky 19,120,586 1.56% 22 tennessee 23,237,725 1.90% 16
Louisiana 41,908,136 3.43% 9 texas 192,221,781 15.72% 1
maine 3,016,395 0.25% 43 utah 10,305,993 0.84% 30
maryland 11,383,051 0.93% 29 vermont 3,697,412 0.30% 41
massachusetts 28,369,195 2.32% 12 virginia 18,941,609 1.55% 23
michigan 45,135,506 3.69% 8 Washington 54,498,050 4.46% 4
88

minnesota 19,186,171 1.57% 21 West virginia 5,643,487 0.46% 35
mississippi 7,323,468 0.60% 32 Wisconsin 20,569,622 1.68% 17
missouri 12,852,324 1.05% 26 Wyoming 1,081,014 0.09% 50
Source: Foreign Trade Division, U.S. Census Bureau
Foreign Exports from Indiana in Thousands ($ USD)
2008 Rank Partner 2004 2,005 2006 2,007 2008
1 Canada 8,633,850 9,662,139 9,892,140 10,804,407 10,566,909
2 mexico 2,542,566 2,619,743 2,424,781 2,605,398 2,112,605
3 united Kingdom 1,281,824 1,517,509 1,889,682 1,899,881 1,978,968
4 france 1,179,796 1,467,659 1,378,189 1,500,531 1,419,475
5 germany 579,719 691,524 733,523 1,099,876 1,270,644
6 China 294,495 419,645 559,243 758,658 929,503
7 Japan 719,493 770,418 830,899 737,285 863,571
8 Brazil 252,063 237,915 292,078 511,749 636,666
9 australia 267,294 333,974 397,424 470,235 544,392
10 netherlands 369,317 427,512 472,792 461,960 480,731
World Total 19,212,414 21,593,813 22,666,268 25,956,346 26,502,292
Source: Foreign Trade Division, U.S. Census Bureau.
89

2002 Domestic Imports and Exports To and From Indiana
Trading Partner
value Exported($ millions)
Tons Exported(thousands)
value imported($ millions)
Tons imported(thousands)
Trading Partner
value Exported($ millions)
Tons Exported(thousands)
value imported($ millions)
Tons imported(thousands)
AL 2,094 3,989 2,463 1,689 MT s 87 77 1,309
AK 30 1 - - NE 2,147 1,165 1,058 437
AZ 1,186 342 2,031 37 NV 358 52 670 39
AR 1,679 1,746 1,673 886 Nh 271 39 316 s
CA 10,122 3,793 9,979 1,055 Nj 4,501 1,487 2,774 426
CO 1,643 401 556 192 NM 391 s 153 121
CT 1,329 270 851 162 NY 5,989 3,460 2,943 1,312
DC 86 s - - NC 3,769 2,447 4,644 1,533
DE s 190 190 47 ND 731 s 90 60
FL 7,408 3,545 2,161 1,026 Oh 22,343 15,823 27,270 22,200
GA 6,002 s 2,746 1,216 OK 2,145 s 838 499
hI 27 2 - - OR 1,606 421 487 s
ID s s 156 196 PA 6,498 3,842 5,653 2,550
IL 21,980 24,373 25,974 52,005 RI 370 s 218 24
IA 3,382 2,865 2,252 1,249 SC 2,476 s 2,218 869
KA 2,378 1,172 953 380 SD s 64 s 59
KY 16,924 12,461 9,807 7,840 TN 6,296 7,187 6,567 2,032
LA 1,396 3,922 871 690 TX 13,831 4,575 4,486 2,655
ME 562 125 322 196 UT 755 138 1,058 s
MD 2,706 1,550 671 760 VT 58 s 195 65
MA 2,583 618 1,726 s VA 4,079 1,195 1,956 3,047
MI 24,532 14,201 16,496 10,902 WA 1,597 527 520 74
MN 3,602 1,899 2,705 18,562 WV 1,173 1,493 877 11,764
MS s s 993 686 WI 4,387 4,472 5,019 3,611
MO 7,005 2,933 4,988 5,148 WY s 4 148 14,668
IN Total
204,427 128,876 160,799 174,278 IN Total
204,427 128,876 160,799 174,278
Source: U.S. Census Bureau 2002 Commodity Flow Survey S = Not Disclosed
90

II. Indiana’s air transportation Industry data
1997 to 2007 Great Lakes and Midwest Region Air Transportation GDP($ millions)
State 1997 1998 1999 2000 2001 2002 2003 2004 2005 2006 2007
IL $3,711 $3,971 $4,157 $4,349 $4,229 $4,017 $3,809 $3,720 $3,732 $4,533 $4,161
In $431 $487 $545 $565 $511 $552 $540 $454 $460 $461 $508
Ky $516 $559 $670 $689 $617 $691 $882 $939 $848 $552 $698
mI $1,653 $1,392 $1,687 $1,786 $1,313 $1,502 $1,810 $1,726 $1,623 $1,436 $1,753
mo $889 $933 $847 $902 $1,200 $1,268 $1,120 $739 $673 $684 $735
oh $974 $1,057 $1,154 $1,200 $868 $947 $977 $1,027 $1,091 $1,309 $1,393
tn $587 $504 $589 $675 $411 $499 $616 $587 $582 $571 $695
WI $276 $290 $332 $335 $306 $295 $339 $312 $324 $329 $380
total $11,034 $11,191 $11,980 $12,501 $11,456 $11,773 $12,096 $11,508 $11,338 $11,881 $12,330
*Source: Bureau of Economic Analysis, http://www.bea.gov/regional/gsp/
91

2006 Air Transportation Establishments and Employment
StateNumber of
establishments RankNumber of employees Rank*
Annual payroll (thousands) Rank*
Illinois 222 6 36,403 3 $2,307,684 3
Indiana 59 29 5,017 24 $221,707 25
Kentucky 63 28 W n/a W n/a
michigan 136 9 14,340 12 $675,835 13
missouri 89 21 7,972 19 $390,517 18
ohio 130 11 12,218 14 $655,283 14
tennessee 100 18 5,561 22 $193,364 26
Wisconsin 86 22 4,055 28 $156,785 28
KEY: W = data withheld to avoid disclosure.
*national rank of states that disclosed information
SOURCE: U.S. Department of Commerce, U.S. Census Bureau, 2006 County Business Patterns, Washington, DC: 2008
Size of Air Establishments based on Employment
total establishments ‘1-4’ ‘5-9’ ‘10-19’ ‘20-49’ ‘50-99’
‘100-249’
‘250-499’
‘500-999’
‘1000 or more’
Illinois 236 104 47 38 21 10 7 2 1 6
Indiana 59 24 8 6 8 4 5 2 2 0
Kentucky 65 27 9 10 11 1 3 1 0 3
michigan 148 55 25 19 28 10 4 1 4 2
missouri 111 58 9 8 11 12 5 4 3 1
ohio 118 54 9 16 13 13 3 1 5 4
tennessee 101 46 14 8 20 4 5 2 0 2
Wisconsin 86 32 6 15 20 4 5 1 2 1
Source: U.S. Census Bureau; 2007 County Business Patterns
92

Airports by Landed Weight of All-Cargo Operations 2007-2008
Rank ST City Airport Name
Preliminary 2008 Landed Weight
2007 Landed Weight % Change
1 tn memphis memphis International 19,392,933,674 19,543,815,307 -0.77%
3 Ky Louisville Louisville International-standiford field 10,445,498,827 10,431,225,402 0.14%
6 IN Indianapolis Indianapolis International 5,128,484,161 5,304,551,447 -3.32%
8 IL Chicago Chicago o’hare International 3,668,314,900 4,401,472,100 -16.66%
19 IL Chicago/rockford Chicago/rockford International 1,415,944,932 1,474,574,465 -3.98%
26 oh toledo toledo express 940,893,800 942,836,600 -0.21%
33 oh Columbus rickenbacker International 730,520,067 814,028,898 -10.26%
34 mI detroit detroit metropolitan Wayne County 693,705,580 795,592,101 -12.81%
42 mo Kansas City Kansas City International 588,239,556 682,719,416 -13.84%
44 WI milwaukee general mitchell International 558,569,580 537,089,612 4.00%
59 tn Knoxville mcghee tyson 410,567,290 319,503,795 28.50%
63 oh Cleveland Cleveland-hopkins International 376,314,190 394,509,324 -4.61%
74 mI grand rapids gerald r. ford International 291,555,700 263,132,500 10.80%
91 Ky Covington Cincinnati/northern Kentucky International 207,350,722 194,138,700 6.81%
97 IN Fort Wayne Fort Wayne International 179,571,500 497,610,000 -63.91%
98 IL Peoria greater Peoria regional 179,182,550 206,699,320 -13.31%
100 mI Lansing Capital City 176,909,075 206,106,570 -14.17%
106 mI detroit Willow run 143,162,584 294,864,273 -51.45%
113 mI flint Bishop International 103,775,600 109,804,817 -5.49%
93

115 oh dayton James m Cox dayton International 53,380,800 52,155,800 2.35%
117 mo Kansas City Charles B. Wheeler downtown 17,756,802 0 n/a
Source: Federal Aviation Administration - Current as of 7/15/2009
2006 Scheduled and Nonscheduled Air Freight and Mail Enplaned (short tons)
Freight Mail
State Scheduled Nonscheduled Scheduled Nonscheduled
Illinois 489,673 84,573 58,533 0
Indiana 593,553 62,303 2,574 1,413
Kentucky 1,120,183 10,574 7,866 57
michigan 123,655 2,846 3,841 0
missouri 109,977 24,643 7,314 0
ohio 353,472 320,297 4,951 6
tennessee 2,080,327 32,015 2,367 5,210
Wisconsin 50,104 4,412 3,951 0
NOTES: Shipments by foreign carriers and intrastate shipments are excluded. Shipments destined for foreign airports and by small certificated and commuter carriers are included.
SOURCE: U.S. Department of Transportation, Research and Innovative Technology Administration, Bureau of Transportation Statistics, Office of Airline Information, special tabulation, February 26, 2008.
94

2008-2007 Passenger Enplanements at Midwest and Great Lakes Commercial Airports
Rank ST Airport NamePreliminary 2008
Enplanements 2007 Enplanement % Change
2 IL Chicago o’hare International 33,668,545 36,521,585 -7.81%
14 mIdetroit metropolitan Wayne County 16,993,820 17,495,135 -2.87%
29 IL Chicago midway International 8,019,338 9,132,836 -12.19%
31 moLambert-st Louis International 6,644,199 7,130,801 -6.82%
32 KyCincinnati/northern Kentucky International 6,488,422 7,728,069 -16.04%
34 tn memphis International 5,386,706 5,546,321 -2.88%
35 mo Kansas City International 5,360,716 5,833,064 -8.10%
36 ohCleveland-hopkins International 5,291,599 5,571,219 -5.02%
40 tn nashville International 4,637,801 4,887,925 -5.12%
46 In Indianapolis International 4,039,477 4,097,398 -1.41%
50 WI general mitchell International 3,838,583 3,751,345 2.33%
52 oh Port Columbus International 3,297,249 3,827,349 -13.85%
68 KyLouisville International-standiford field 1,820,866 1,912,495 -4.79%
76 ohJames m Cox dayton International 1,446,941 1,412,758 2.42%
92 mI gerald r. ford International 902,937 992,539 -9.03%
95 tn mcghee tyson 838,155 888,995 -5.72%
101 WIdane County regional-truax field 723,847 783,937 -7.67%
102 oh akron-Canton regional 717,490 691,603 3.74%
115 mI Bishop International 526,498 532,621 -1.15%
118 Ky Blue grass 494,880 520,760 -4.97%
121 IL Quad City International 476,533 481,595 -1.05%
127 WI austin straubel International 410,051 440,176 -6.84%
95

134 mo springfield-Branson national 380,435 433,232 -12.19%
141 In south Bend regional 346,198 398,500 -13.12%
150 tn Lovell field 296,832 301,803 -1.65%
157 IL greater Peoria regional 278,426 271,366 2.60%
159 In fort Wayne International 276,926 289,210 -4.25%
161 ILCentral IL regional airport at Bloomington-normal 262,840 262,980 -0.05%
162 WI outagamie County regional 259,344 288,180 -10.01%
170 mI Capital City 217,465 256,563 -15.24%
177 tn tri-Cities regional tn/va 198,356 212,809 -6.79%
179 In evansville regional 189,048 222,654 -15.09%
181 mI Cherry Capital 183,384 202,048 -9.24%
187 mIKalamazoo/Battle Creek International 164,520 188,992 -12.95%
188 mI mBs International 162,732 186,739 -12.86%
191 WI Central Wisconsin 154,316 158,747 -2.79%
208 oh toledo express 124,464 169,679 -26.65%
210 WI La Crosse municipal 111,458 121,243 -8.07%
213 ILChicago/rockford International 110,153 110,835 -0.62%
221 IL university of Illinois-Willard 98,243 112,440 -12.63%
258 IL abraham Lincoln Capital 56,786 62,138 -8.61%
259 mI sawyer International 56,172 67,999 -17.39%
307 mI muskegon County 30,061 34,268 -12.28%
318 IL scott afB/midamerica 26,968 29,019 -7.07%
321 mIPellston regional airport of emmet County 26,246 29,609 -11.36%
322 WI rhinelander-oneida County 26,196 37,608 -30.34%
328 mI houghton County memorial 25,354 26,767 -5.28%
96
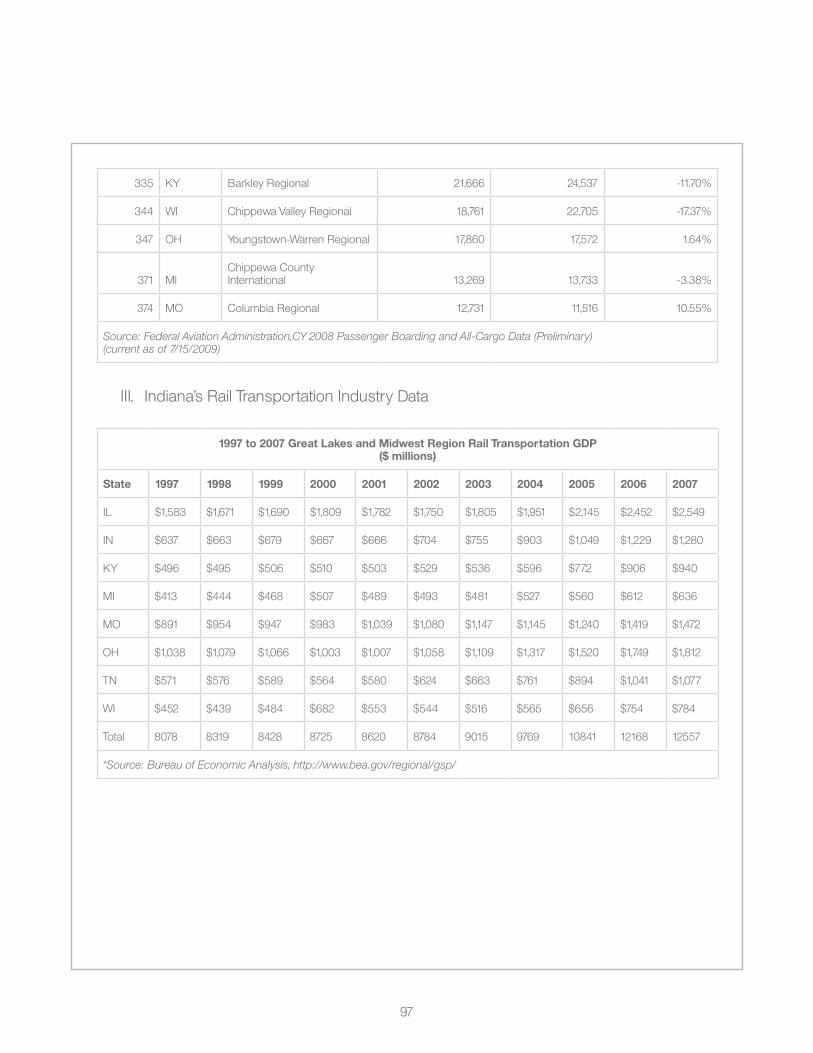
335 Ky Barkley regional 21,666 24,537 -11.70%
344 WI Chippewa valley regional 18,761 22,705 -17.37%
347 oh youngstown-Warren regional 17,860 17,572 1.64%
371 mIChippewa County International 13,269 13,733 -3.38%
374 mo Columbia regional 12,731 11,516 10.55%
Source: Federal Aviation Administration,CY 2008 Passenger Boarding and All-Cargo Data (Preliminary) (current as of 7/15/2009)
III. Indiana’s rail transportation Industry data
1997 to 2007 Great Lakes and Midwest Region Rail Transportation GDP($ millions)
State 1997 1998 1999 2000 2001 2002 2003 2004 2005 2006 2007
IL $1,583 $1,671 $1,690 $1,809 $1,782 $1,750 $1,805 $1,951 $2,145 $2,452 $2,549
In $637 $663 $679 $667 $666 $704 $755 $903 $1,049 $1,229 $1,280
Ky $496 $495 $506 $510 $503 $529 $536 $596 $772 $906 $940
mI $413 $444 $468 $507 $489 $493 $481 $527 $560 $612 $636
mo $891 $954 $947 $983 $1,039 $1,080 $1,147 $1,145 $1,240 $1,419 $1,472
oh $1,038 $1,079 $1,066 $1,003 $1,007 $1,058 $1,109 $1,317 $1,520 $1,749 $1,812
tn $571 $576 $589 $564 $580 $624 $663 $761 $894 $1,041 $1,077
WI $452 $439 $484 $682 $553 $544 $516 $565 $656 $754 $784
total 8078 8319 8428 8725 8620 8784 9015 9769 10841 12168 12557
*Source: Bureau of Economic Analysis, http://www.bea.gov/regional/gsp/
97

2007 Railroad Employee Compensation
State WagesFringe Benefi ts
Total Compensation
Number of Employees Rank Annual payroll Rank
Illinois $69,700 $27,800 $97,500 12,483 2 $870,175,000 2
Indiana $64,700 $25,800 $90,500 6,141 9 $397,577,000 10
Kentucky $65,500 $26,100 $91,600 4,554 13 $298,089,000 15
michigan $69,900 $27,800 $97,700 3,617 19 $252,939,000 19
missouri $70,400 $28,000 $98,400 7,168 7 $504,887,000 6
ohio $64,400 $25,600 $90,000 7,983 5 $513,772,000 5
tennessee $67,000 $26,700 $93,700 4,310 15 $288,956,000 16
Wisconsin $73,200 $29,100 $102,300 3,213 23 $235,101,000 21
Source: American Association of Railroads
98

2007 Railroad Establishments
State Number of establishments Rank
Illinois 44 3
Indiana 41 4
Kentucky 13 27
michigan 24 11
missouri 17 19
ohio 36 6
tennessee 25 8
Wisconsin 10 30
source: american association of railroads
2007 Total Rail Miles (excludes trackage rights)
State Total Rail Miles Rank
Illinois 7,336 2
Indiana 4,446 9
Kentucky 2,558 28
michigan 3,699 12
missouri 4,077 10
ohio 5,307 4
tennessee 2,649 26
Wisconsin 3,503 14
Source: American Association of Railroads
99
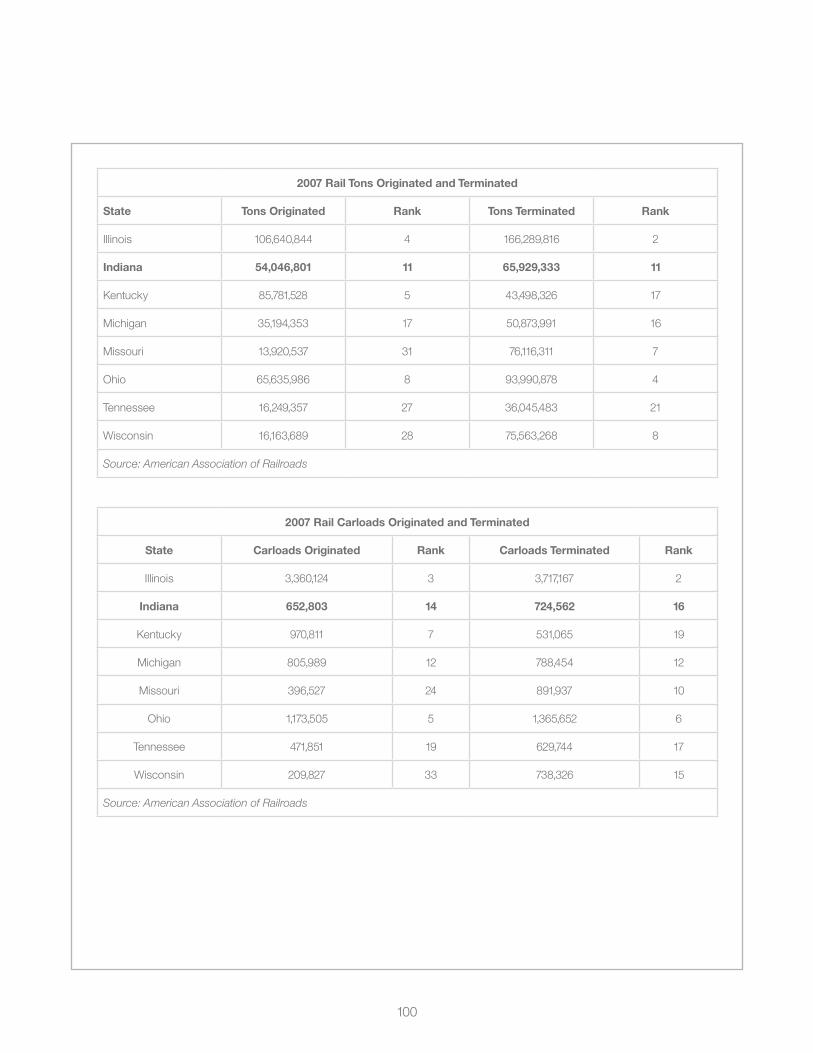
2007 Rail Tons Originated and Terminated
State Tons Originated Rank Tons Terminated Rank
Illinois 106,640,844 4 166,289,816 2
Indiana 54,046,801 11 65,929,333 11
Kentucky 85,781,528 5 43,498,326 17
michigan 35,194,353 17 50,873,991 16
missouri 13,920,537 31 76,116,311 7
ohio 65,635,986 8 93,990,878 4
tennessee 16,249,357 27 36,045,483 21
Wisconsin 16,163,689 28 75,563,268 8
Source: American Association of Railroads
2007 Rail Carloads Originated and Terminated
State Carloads Originated Rank Carloads Terminated Rank
Illinois 3,360,124 3 3,717,167 2
Indiana 652,803 14 724,562 16
Kentucky 970,811 7 531,065 19
michigan 805,989 12 788,454 12
missouri 396,527 24 891,937 10
ohio 1,173,505 5 1,365,652 6
tennessee 471,851 19 629,744 17
Wisconsin 209,827 33 738,326 15
Source: American Association of Railroads
100

2007 Rail Tons and Carloads Carried
State Tons Carried Rank Carloads Carried Rank
Illinois 513,694,154 3 11,706,611 1
Indiana 306,872,820 9 6,769,892 5
Kentucky 291,942,691 10 4,146,131 16
michigan 109,174,537 33 2,143,981 28
missouri 409,966,852 4 7,802,231 3
ohio 311,226,977 8 6,698,844 6
tennessee 265,121,411 12 4,273,388 14
Wisconsin 172,461,080 22 2,848,131 22
Source: American Association of Railroads
2007 Tons Originated by Commodity
Illinois Indiana
Commodity Tons Originated Commodity Tons Originated
Intermodal 24.7 Coal 17.6
grain and other field crops 23.1 Iron and steel products 11.9
Coal 16.3 grain and other field crops 10.5
food products 13.1 food Products 4.9
Chemicals 6.3 scrap paper and scap metals 2.3
Crushed stone, gravel, sand 4.8 autos and auto parts 1.6
Iron and steel products 3.7 Chemicals 1.6
autos and auto parts 3.2 Petroleum and coal products 1.1
Petroleum and coal products 2.2 Cement 0.9
all other 9.3 all other 1.8
101

Kentucky Michigan
Commodity Tons Originated Commodity Tons Originated
Coal 67 Iron ore 13
Petroleum and coal products 7.8 autos and auto parts 6.5
autos and auto parts 2.8 grain and other field crops 2.9
Iron and steel products 2.4 scrap paper and scrap metals 2.3
Chemicals 1.6 gravel, crushed stone, sand 1.8
scrap paper and scrap metals 0.8 Iron and steel products 1.5
Pulp and paper products 0.5 Pulp and paper products 1.3
Intermodal 0.5 Intermodal 1.2
Lumber and wood products 0.4 Chemicals 1.1
all other 1.9 all other 3.7
Missouri Ohio
Commodity Tons Originated Commodity Tons Originated
food products 2.6 Coal 10.6
grain and other field crops 2.5 Iron and steel products 10.5
autos and auto parts 2 Iron ore 10.1
Intermodal 1.4 grain and other field crops 9.3
scrap paper and scrap metals 1.2 Crushed stone, gravel, sand 6
Concrete and gypsum products 1 autos and auto parts 3.6
Chemicals 0.8 food Products 3.2
Crushed stone, gravel, sand 0.5 Intermodal 2.7
Cement 0.4 scrap paper and scrap metals 2.7
all other 1.6 all other 7
102
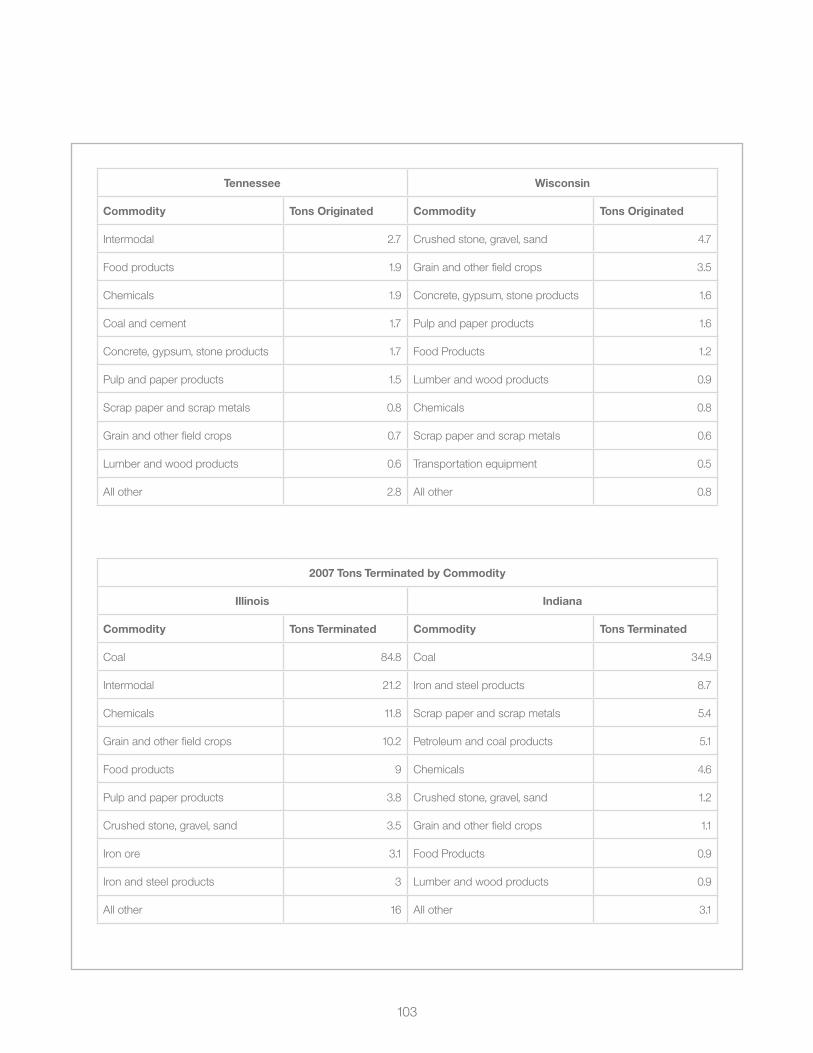
Tennessee Wisconsin
Commodity Tons Originated Commodity Tons Originated
Intermodal 2.7 Crushed stone, gravel, sand 4.7
food products 1.9 grain and other field crops 3.5
Chemicals 1.9 Concrete, gypsum, stone products 1.6
Coal and cement 1.7 Pulp and paper products 1.6
Concrete, gypsum, stone products 1.7 food Products 1.2
Pulp and paper products 1.5 Lumber and wood products 0.9
scrap paper and scrap metals 0.8 Chemicals 0.8
grain and other field crops 0.7 scrap paper and scrap metals 0.6
Lumber and wood products 0.6 Transportationequipment 0.5
all other 2.8 all other 0.8
2007 Tons Terminated by Commodity
Illinois Indiana
Commodity Tons Terminated Commodity Tons Terminated
Coal 84.8 Coal 34.9
Intermodal 21.2 Iron and steel products 8.7
Chemicals 11.8 scrap paper and scrap metals 5.4
grain and other field crops 10.2 Petroleum and coal products 5.1
food products 9 Chemicals 4.6
Pulp and paper products 3.8 Crushed stone, gravel, sand 1.2
Crushed stone, gravel, sand 3.5 grain and other field crops 1.1
Iron ore 3.1 food Products 0.9
Iron and steel products 3 Lumber and wood products 0.9
all other 16 all other 3.1
103

Kentucky Michigan
Commodity Tons Terminated Commodity Tons Terminated
Coal 28.3 Coal 20
Chemicals 3.3 Iron and aluminum ore 12.5
Iron and steel products 1.6 Petroleum and coal products 2.9
Iron and aluminum ore 1.6 Chemicals 2.6
Petroleum and coal products 1.1 Iron and steel products 2.5
Pulp and paper products 1.1 Crushed stone, gravel, sand 1.8
autos and auto parts 1.1 Intermodal 1.7
scrap paper and scrap metals 0.9 autos and auto parts 1.6
food products 0.9 Lumber and wood products 1.4
all other 3.6 all other 4
Missouri Ohio
Commodity Tons Terminated Commodity Tons Terminated
Coal 57.9 Coal 42
grain and other field crops 3.7 Iron and steel products 8.6
Chemicals 3.1 Chemicals 7.6
food products 2.4 scrap paper and scrap metals 6.4
autos and auto parts 2.3 Crushed stone, gravel, sand 5.9
Intermodal 1.1 Iron ore 4.8
Pulp and paper products 1.1 Intermodal 3.7
Lumber and wood products 1 food Products 3.3
Iron and steel products 1 Petroleum and coal products 2.9
all other 2.6 all other 8.7
104

Tennessee Wisconsin
Commodity Tons Terminated Commodity Tons Terminated
Coal 11 Coal 42.7
Chemicals 5 metallic ores 11.9
grain and other field crops 4.3 grain and other field crops 4.7
food products 4 Pulp and paper products 4.2
Intermodal 2.8 Lumber and wood products 2.8
Pulp and paper products 1.7 Chemicals 2.7
Lumber and wood products 1.6 food Products 1.2
Crushed stone, gravel, sand 1.3 Petroleum and coal products 0.9
Iron and steel products 1.1 Crushed stone, gravel, sand 0.8
all other 3.3 all other 3.6
Indiana’s National Rank of Commodity Shipments by Rail
2007 Tons Originated
− 8th in coal; 17,559,862 tons; 2.0% of u.s. total
− 6th in farm products; 10,505,633; 6.4% of u.s. total
− 7th in food products; 4,923,255; 5.2% of u.s. total
− 1st in primary metal products; 11,941,962; 20.2% of u.s. total
− 6th in waste & scrap material; 2,278,960; 4.8% of u.s. total
− 8thintransportationequipment;1,704,144;4.6%ofU.S.Total
105

2007 tons terminated
− 8th in coal; 34,921,301; 4.2% of u.s. total
− 1st in primary metal products; 8,827,824; 13.4% of u.s. total
− 2nd in petroleum products; 5,105,437; 7.9% of u.s. total
− 2nd in waste & scrap material; 5,371,876; 10.8% of u.s. total
Source: American Association of Railroads; 2007 STB Waybill Sample
2007 Miles of Class I Railroad Operated (including trackage rights)
State BNSf cSX Grand Trunk
kansas city Southern
Railway co. NS corp.Soo Line
Railroad co. uP cNTotal
Mileage
Illinois 1,552 924 1,518 182 1,260 363 2,237 0 8,036
Indiana 0 1,693 81 0 1,541 197 4 0 3,516
Kentucky 99 1,644 107 0 431 0 12 0 2,293
Michigan 0 569 1,016 0 644 342 0 1 2,572
Missouri 1,756 13 0 394 409 0 1,528 0 4,100
Ohio 0 1,912 7 0 2,233 30 0 0 4,182
Tennessee 144 1,010 145 5 848 0 18 0 2,170
Wisconsin 273 0 1,514 0 0 607 932 0 3,326
Totals 3,824 7,765 4,388 581 7,366 1,539 4,731 1 30,195
Total US Operations
32,094 21,054 6,738 3,151 20,589 3,267 32,205 48 119,146
***Class I Railroad - Railroad w/ 2007 operating revenues of at least $359.6 million
Source: American Association of Railroads
106
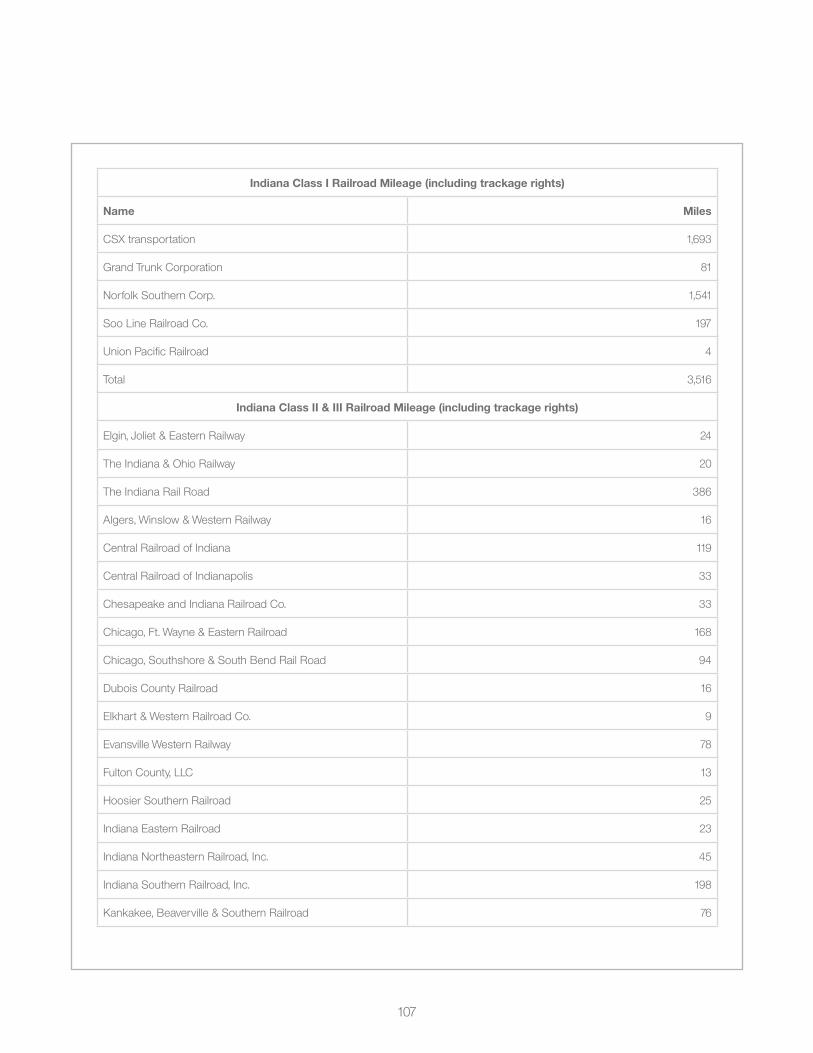
Indiana Class I Railroad Mileage (including trackage rights)
Name Miles
Csx transportation 1,693
grand trunk Corporation 81
norfolk southern Corp. 1,541
soo Line railroad Co. 197
union Pacific railroad 4
total 3,516
Indiana Class II & III Railroad Mileage (including trackage rights)
elgin, Joliet & eastern railway 24
the Indiana & ohio railway 20
the Indiana rail road 386
algers, Winslow & Western railway 16
Central railroad of Indiana 119
Central railroad of Indianapolis 33
Chesapeake and Indiana railroad Co. 33
Chicago, ft. Wayne & eastern railroad 168
Chicago, southshore & south Bend rail road 94
dubois County railroad 16
elkhart & Western railroad Co. 9
evansville Western railway 78
fulton County, LLC 13
hoosier southern railroad 25
Indiana eastern railroad 23
Indiana northeastern railroad, Inc. 45
Indiana southern railroad, Inc. 198
Kankakee, Beaverville & southern railroad 76
107

Louisville & Indiana railroad Co. 116
madison railroad 26
ohio valley railroad Company 3
southern Indiana railway 5
toledo, Peoria & Western railway Corp. 86
C&nC railroad Corp. 28
Central Indiana & Western railroad 9
Indian Creek railroad 5
Indiana harbor Belt railroad 41
Indiana southwestern railway Co. 23
Isg south Chicago & Indiana harbor rwy. 6
Kendalville terminal railway Co. 2
Louisville, new albany & Corydon railroad 8
maumee & Western railroad Corp. 2
mg rail, Inc. 11
vermillion valley railroad Corp. 6
Wabash Central railroad Corp. 26
Winamac southern railway Co. 52
Total 1,831
Source: American Association of Railroad
108

Iv. Indiana’s truck transportation Industry data
1997 to 2007 Great Lakes and Midwest Region Truck Transportation GDP($ millions)
State 1997 1998 1999 2000 2001 2002 2003 2004 2005 2006 2007
IL $4,391 $4,823 $4,977 $5,076 $5,015 $5,039 $5,262 $5,920 $6,325 $6,504 $6,714
In $2,936 $3,184 $3,222 $3,301 $3,305 $3,370 $3,457 $3,968 $4,248 $4,432 $4,587
Ky $1,224 $1,369 $1,451 $1,435 $1,436 $1,506 $1,539 $1,749 $1,882 $1,953 $2,046
mI $2,416 $2,662 $2,789 $2,818 $2,752 $2,873 $2,864 $3,226 $3,397 $3,471 $3,738
mo $2,519 $2,845 $2,890 $2,915 $2,846 $2,857 $2,937 $3,399 $3,568 $3,731 $3,842
oh $3,985 $4,358 $4,507 $4,596 $4,597 $4,819 $4,885 $5,545 $5,923 $6,039 $6,343
tn $2,794 $3,291 $3,671 $3,908 $3,926 $3,902 $3,984 $4,557 $4,851 $4,983 $5,095
WI $2,630 $2,899 $2,983 $3,045 $3,084 $3,196 $3,324 $3,786 $4,055 $4,124 $4,138
total $22,895 $25,431 $26,490 $27,094 $26,961 $27,562 $28,252 $32,150 $34,249 $35,237 $36,503
*Source: Bureau of Economic Analysis, http://www.bea.gov/regional/gsp/
109

Size of Trucking Establishments based on Employment
total establishments ‘1-4’ ‘5-9’ ‘10-19’ ‘20-49’ ‘50-99’ ‘100-249’ ‘250-499’ ‘500-999’
‘1000 or more’
Illinois 7,211 5,204 778 543 427 135 99 16 5 4
Indiana 3,619 2,160 480 423 338 124 62 23 7 2
Kentucky 2,085 1,294 328 207 165 56 24 8 2 1
michigan 3,523 2,317 402 360 270 96 64 6 7 1
missouri 3,262 2,176 422 324 208 61 52 13 4 2
ohio 4,720 2,756 663 568 450 160 92 23 7 1
tennessee 2,394 1,242 384 315 248 112 60 21 8 4
Wisconsin 3,797 2,442 502 363 314 107 45 16 4 4
Source: U.S. Census Bureau; 2007 County Business Patterns
2006 Truck Transportation Establishments and Employment
StateNumber of
establishments RankNumber of employees Rank
Annual payroll (thousands) Rank
Illinois 6,874 3 69,724 4 $2,933,107 3
Indiana 3,650 10 58,082 7 $2,266,047 7
Kentucky 2,123 21 24,433 22 $870,404 23
michigan 3,437 12 42,557 16 $1,744,022 13
missouri 3,309 14 42,715 15 $1,650,121 15
ohio 4,774 5 70,963 3 $2,868,549 4
tennessee 2,398 19 57,890 8 $2,260,160 8
Wisconsin 3,845 8 56,659 11 $2,283,416 6
SOURCE: U.S. Department of Commerce, U.S. Census Bureau, 2006 County Business Patterns, Washington, DC: 2008
110

v. Indiana’s Waterborne shipping Industry data
1997 to 2007 Great Lakes and Midwest Region Waterborne Shipping GDP($ millions)
State 1997 1998 1999 2000 2001 2002 2003 2004 2005 2006 2007
IL $163 $166 $170 $209 $215 $196 $233 $245 $254 $268 $258
In $205 $211 $204 $237 $254 $239 $302 $302 $296 $341 $376
Ky $65 $65 $66 $82 $87 $86 $122 $129 $153 $175 $194
mI $36 $40 $41 $48 $46 $50 $61 $62 $63 $62 $55
mo $59 $63 $60 $65 $54 $46 $49 $84 $93 $121 $123
oh $206 $218 $198 $229 $206 $179 $194 $145 $147 $135 $106
tn $98 $112 $109 $122 $121 $120 $162 $204 $248 $299 $278
WI $7 $8 $7 $8 $8 $7 $8 $9 $9 $9 $9
total $839 $883 $855 $1,000 $991 $923 $1,131 $1,180 $1,263 $1,410 $1,399
*Source: Bureau of Economic Analysis, http://www.bea.gov/regional/gsp/
111

Size of Water Establishments based on Employment
total establishments ‘1-4’ ‘5-9’ ‘10-19’ ‘20-49’ ‘50-99’ ‘100-249’ ‘250-499’ ‘500-999’
‘1000 or more’
Illinois 42 17 8 7 5 4 0 1 0 0
Indiana 9 5 0 2 1 0 0 0 0 1
Kentucky 27 5 3 5 5 1 6 1 1 0
michigan 33 19 5 2 5 2 0 0 0 0
missouri 16 8 1 1 1 1 1 3 0 0
ohio 30 17 4 4 1 1 2 1 0 0
tennessee 17 3 4 1 2 3 2 1 0 1
Wisconsin 7 2 2 2 1 0 0 0 0 0
Source: U.S. Census Bureau; 2007 County Business Patterns
2006 Water transportation establishments and employment
statenumber of
establishments ranknumber of employees rank*
annual payroll (thousands) rank*
Illinois 45 11 W n/a W n/a
Indiana 9 30 W n/a W n/a
Kentucky 27 17 2,138 9 103,234 9
michigan 34 13 415 19 30,836 19
missouri 14 28 1,185 12 63,770 13
ohio 33 14 1,265 11 58,131 14
tennessee 15 27 2,285 8 126,569 8
Wisconsin 8 32 92 21 5,143 21
KEY: W = data withheld to avoid disclosure.
*national rank of states that disclosed information
SOURCE: U.S. Department of Commerce, U.S. Census Bureau, 2006 County Business Patterns, Washington, DC: 2008
112

State Waterway Mileage
State Navigable Rivers Navigable Inland Waterway Mileage
Lock and Dams within or on state border
Illinois ohio; mississippi; Kaskaskia; Calumet; Illinois Waterway
1,095 28
Indiana Ohio 358 5
Kentucky ohio; mississippi; Kentucky; green; Cumberland; tennessee; Big sandy; Licking
1,591 14
michigan none 0 0
missouri missouri; mississippi 1,033 7
ohio ohio; muskingum 444 9
tennessee mississippi; Cumberland; tennessee; hiwassee; Clinch; holston; Little Pigeon
946 9
Wisconsin mississippi; st. Croix 231 10
Source: Army Corps of Engineers; USGS; Bureau of Transportation Statistics
2007 Waterborne Tonnage by State (units of 1000 tons)
Shipping Receiving
State Total Rank domestic Rank foreign Rank domestic Rank foreign Rank intrastate Rank
IL 120,970 7 85,809 2 1,058 24 17,692 14 2,297 27 14,114 8
IN 67,534 15 13,494 20 139 31 50,113 4 1,468 30 2,319 22
KY 100,374 10 52,202 3 0 32 29,068 7 0 32 19,104 3
MI 69,252 14 23,506 10 5,070 16 23,128 11 6,005 21 11,543 11
MO 28,729 28 15,671 15 0 32 6,117 25 0 32 6,941 14
Oh 112,493 8 21,618 11 10,184 13 62,994 2 8,246 20 9,452 13
TN 48,404 20 6,900 24 0 32 37,509 5 0 32 3,996 16
WI 46,210 21 24,023 9 11,075 12 8,654 22 1,952 28 506 32
U.S. Army Corps of Engineers, Waterborne Commerce Statistics Center, CY 2007 Waterborne Commerce of the United States
113

2007 Indiana Principle Port Foreign Trade (short tons)
Imports Tons Rank Exports Tons Rank Total Foreign Trade Tons Rank
Buffington 233,273 98 Burns harbor 55,894 109 Buffington 233,273 116
Burns harbor 603,232 77 gary 41,769 113 Burns harbor 659,126 92
gary 138,409 107 Indiana harbor 41,554 114 gary 180,178 125
Indiana harbor 493,196 82 Indiana harbor 534,75 98
Source: American Association of Port Authorities; U.S. PORT RANKING BY CARGO VOLUME 2007
1997 to 2007 Great Lakes and Midwest Region Warehousing GDP($ millions)
State 1997 1998 1999 2000 2001 2002 2003 2004 2005 2006 2007
IL $1,220 $1,331 $1,434 $1,537 $1,517 $1,668 $1,717 $1,961 $2,246 $2,391 $2,582
In $503 $545 $641 $701 $702 $748 $833 $912 $1,045 $1,097 $1,118
Ky $402 $439 $477 $523 $526 $569 $586 $631 $794 $829 $902
mI $927 $976 $1,043 $1,042 $1,018 $1,135 $1,206 $1,194 $1,292 $1,269 $1,257
mo $420 $446 $490 $558 $584 $621 $651 $694 $783 $810 $863
oh $843 $930 $992 $1,056 $1,020 $1,082 $1,223 $1,422 $1,752 $1,959 $2,191
tn $290 $302 $359 $425 $433 $460 $517 $631 $717 $754 $819
WI $373 $400 $449 $428 $498 $561 $600 $578 $626 $675 $763
total $4,978 $5,369 $5,885 $6,270 $6,298 $6,844 $7,333 $8,023 $9,255 $9,784 $10,495
*Source: Bureau of Economic Analysis, http://www.bea.gov/regional/gsp/
114

vI. Indiana’s Warehousing Industry data
Size of Warehousing and Storage Establishments based on Employment
total establishments ‘1-4’ ‘5-9’ ‘10-19’ ‘20-49’ ‘50-99’ ‘100-249’ ‘250-499’ ‘500-999’
‘1000 or more’
Illinois 679 205 110 96 130 57 53 18 7 3
Indiana 340 99 58 43 67 30 26 5 7 5
Kentucky 226 58 31 38 56 18 10 10 4 1
michigan 364 124 55 64 67 30 15 4 3 2
missouri 337 90 67 71 61 23 17 3 4 1
ohio 629 164 106 101 118 58 51 15 11 5
tennessee 419 128 56 57 86 37 37 10 5 3
Wisconsin 314 116 54 63 35 25 11 6 1 3
Source: U.S. Census Bureau; 2007 County Business Patterns
115

vII. regional Bottleneck data
Indiana Regional Bottlenecks
Chicago, IL-IN
- 8,140,000 people
- 202,835,000 hours of delay per year
- 25 hours of delay per person per year
- $3,968,000,000 cost of congestion per year
- $487 cost of congestion per person per year
Indianapolis, IN
- 1,035,000 people
- 24,318,000 hours of delay per year
- 23 hours of delay per person per year
- $478,000,000 cost of congestion per year
- $462 cost of congestion per person per year
Louisville, KY-IN
- 905,000 people
- 20,559,000 hours of delay per year
- 23 hours of delay per person per year
- $395,000,000 cost of congestion per year
- $436 cost of congestion per person per year
Cincinnati, Oh-KY-IN
- 1,620,000 people
- 24,377,000 hours of delay per year
116

- 15 hours of delay per person per year
- $459,000,000 cost of congestion per year
- $283 cost of congestion per person per year
SOURCE: Texas Transportation Institute, 2007 Urban Mobility Report, College Station, TX: 2007
vIII. ohio river Lock and dam data
Lock and Dams:
- the average age of locks and dams on the ohio river is 47 years old
- the average year locks were opened on the ohio river is 1962
- In 2007, navigation locks were unavailable a total of 157,430 hours or 6,560 days due
to repairs or mechanical breakdowns (Waterways Council, Inc.)
- 95,877 of the hours were for scheduled repairs
- 42,530 of the hours were for unscheduled repairs
Ix. Priority Lock and dams on the ohio river
Locks and Dams 52 and 53
- Location
- Located on Illinois/Kentucky Border at river mile 938.9 and 962.6
- existing structures
- Both have a 110’ x 600’ lock chamber and wicket dam that were built in 1929
- In 1969 a temporary 110’ x 1200’ lock was built at Lock and dam 52
- In 1979 a temporary 110’ x 1200’ lock was built at Lock and dam 53
117

- 2008 tonnage
- In 2008 89,660,443 tons of commodities passed through Lock and dam 52 38%
of traffic was coal
- In 2008 77,823,840 tons of commodities passed through Lock and dam 53 29%
of traffic was coal
- summary of Lock Issues
- Locks 52 and 53 are deteriorating structurally, have no steel reinforcements and
are 50 to 100% stressed under normal operating conditions
- the temporary locks are inefficient, often shut down and are past their
15-year life
- replacement
- In 1996 the army Corps of engineers broke ground on olmsted Lock and dam
Locks and dam 52 and 53 will be replaced by a single facility consisting of twin
110’ x 1200’ lock chambers and a wicket dam for a total cost of $1.4 billion
- funding
- olmsted Lock and dam is cost-shared 50/50 with the Inland Waterways
trust fund
- the benefit to cost ratio is 10.8 to 1 based on an interest of 7%
- average annual navigation benefits for this project are $591,008,641
(in december 2007 dollars)
- the completion date of olmsted Lock and dam has moved back to
2020 from 2014. the 6-year delay will result in $2.7 billion in transportation
benefits foregone
- If funding continues to be constrained the project could be delayed an additional
2 years and result in $683 million more forgone navigation benefits
118

- transportation Importance to the Inland Waterways system
- Locks and dams 52 and 53 on the ohio river provide a connection between the
mississippi river, tennessee river and Cumberland river
- more tonnage passes this point than any other place in america’s inland
navigation system
- In 2004 $20 billion worth of goods passed through Locks and dam 52
- 25% of all coal on the inland waterways utilizes Locks and dam 52
- olmsted’s traffic is projected to range between 113 million and 130 million tons
by 2020
- In 2004 5,450,167 tons of commodities valued at $904 million shipped from
Indiana went through the future site of olmstead Locks and dam. the top
commodity was grain
- In 2004 6,562,960 tons of commodities valued at $1.016 billion shipped to
Indiana went through the future site of olmstead Locks and dam. the top
commodity was coal
john T. Myers Locks and Dam
- Location
- Located on the Indiana/Kentucky border in Posey County, Indiana and union
County, Kentucky at river mile 846. John t. myers in 16 miles down river from
mount vernon, Indiana
- existing structures
- 110’ x 1200’ main lock and 110’ x 600’ auxiliary lock that was built in 1975
- 2008 tonnage
- In 2008 69,506,212 tons of commodities passed through John t. myers Lock
and dam. 52% of traffic was coal
119

- summary of Lock Issues
- major repairs on the main chamber associated with heavy use and age force
greaterfuturerelianceontheinadequatelysizedauxiliarychamber
- replacement
- a 600’ extension of the existing 110’ x 600’ auxiliary lock to relieve traffic on the
existing 110’ x 1200’ main lock
- the project cost is estimated to be $342.2 million
- funding
- the project is cost-shared 50/50 with the Inland Waterways trust fund
- the benefit to cost ratio is 1.1 to 1 based on an interest rate of 7%
- ThroughFY2007$8.2millionofthe$342.2millionrequiredtocompletethe
project was spent. the fy 2008 omnibus appropriations Bill included $984,000
John t. myers Lock improvements
- Before a lock extension contract can be awarded, the lock design and
construction of the preparatory features needs to be completed. Lock
preparationforextensionwillrequire$47.5million
- transportation Importance to the Inland Waterways system
- the John t. myers Locks and dam pass the highest tonnage of all ohio river
high lift locks with a 600-foot auxiliary chamber
- Projections indicate that John t. myers Locks and dam annual tonnage will
exceed 99 million tons by 2010
- In 2003 4,180, 886 tons of commodities valued at $914 million shipped from
Indiana passed through the John t. myers Locks. the top commodity was coal
- In 2003 14,732,280 tons of commodities valued at $1.182 billion shipped to
Indiana passed through the John t. myers Locks. the top commodity
was coal
120

Markland Locks and Dam
- Location
- Located on the Indiana/Kentucky border in at river mile 531.5. markland is 3.5
miles down river from Warsaw, Kentucky
- existing structures
- markland Locks and dam consist of a main 110’ x 1200’ lock and an auxiliary
110’ x 600’ lock built in 1959
- 2008 tonnage
- In 2008 53,191,406 tons of commodities passed through markland Lock and
dam. 51% of traffic was coal
- summary of Lock Issues
- Current level of performance is rated as d, based primarily upon the risk of
failure due to unreliability of miter gates. Improvements to target level of a will
occur after the new main chamber miter gates are installed
- the risk is very high that a failure of the lock gates will occur, forcing traffic
through the auxiliary lock for an extended period of time
- the auxiliary lock miter gates are now showing signs of fatigue cracking
- replacement
- the markland Locks and dam rehabilitation would cost $30.518 million
- Construction will take approximately four years. a 60-day closure of the
1200’mainlockisrequiredtoinstallcomponentsandwillbebrokenintotwo
phases with about 30 days in between
- funding
- the benefit to cost ration is 3.5 to 1 based on an interest rate of 7%
the average annual benefits for this project are $4.3 million
121

- the project was funded 6.72 million (50% from the Inland Waterway trust fund)
in the fy 2008 consolidated appropriations bill
- $10.6 million for fy 2009 was proposed and would be the efficient funding level
for this project
- transportation Importance to the Inland Waterways system
- from 2001 to 2008 markland Locks and dam passed an average of 50.8 million
tons of waterborne commerce annually
- Between 2001 and 2008 approximately 41% of the tonnage that passed through
markland Locks and dam was coal
Greenup Locks and Dam
- Location
- Located at river mile 341 in greenup County, Kentucky and scioto County,
ohio. greenup Locks and dam is 24 miles downstream from huntington,
West virginia
- existing structure
- 110’ x 1200’ main lock and 110’ x 600’ auxiliary lock, constructed in 1959
- 2008 tonnage
- In 2008 59,757,367 tons of commodities passed through greenup Lock and
dam. 59% of traffic was coal
- By 2030 greenup Locks and dam are projected to pass 113 million
tons annually
- summary of Lock Issues
- major repairs of greenup’s main chamber associated with heavy use and age
forcegreaterrelianceontheinadequately-sizedauxiliarychamber
- the combination of age and usage has resulted in four major closures and
122

numerous shorter closures within the last 15 years causing transportation delays
costing towing companies in excess of $26 million. one event alone, a 2003
main lock chamber closure in excess of 52 days, resulted in transportation delay
costs of $13.2 million and another $28.7 million in production, transportation
mode shift, and other ancillary costs
- replacement
- Greenup’sauxiliarylockwouldbeextended600’,amitergatequickchange
system would be installed, and the main lock would be rehabilitated
- the total project cost excluding the main lock rehabilitation is $254.4 million
- funding
- the project will be cost-shared 50/50 with the Inland Waterways trust fund, but
to date has been funded 100% federal in the general Investigations account
- the benefit to cost ratio is 4.9 to 1 based on an interest rate of 7%
- The John T. Myers and Greenup Locks Improvement Interim Feasibility Report
of the Louisville and Huntington Districts recommended the auxiliary lock
extension be complete by 2008. the project completion date has been delayed
until 2014 due to insufficient funding
- transportation Importance to the Inland Waterways system
- In 2001, greenup Locks and dam was the eight busiest inland navigation lock in
the country.
- Between 2001 and 2008 greenup handled an average of 65,628,396 tons of
commerce annually
- Between 2001 and 2008 greenup handled an average of 38,916,955 tons of
coal annually
123
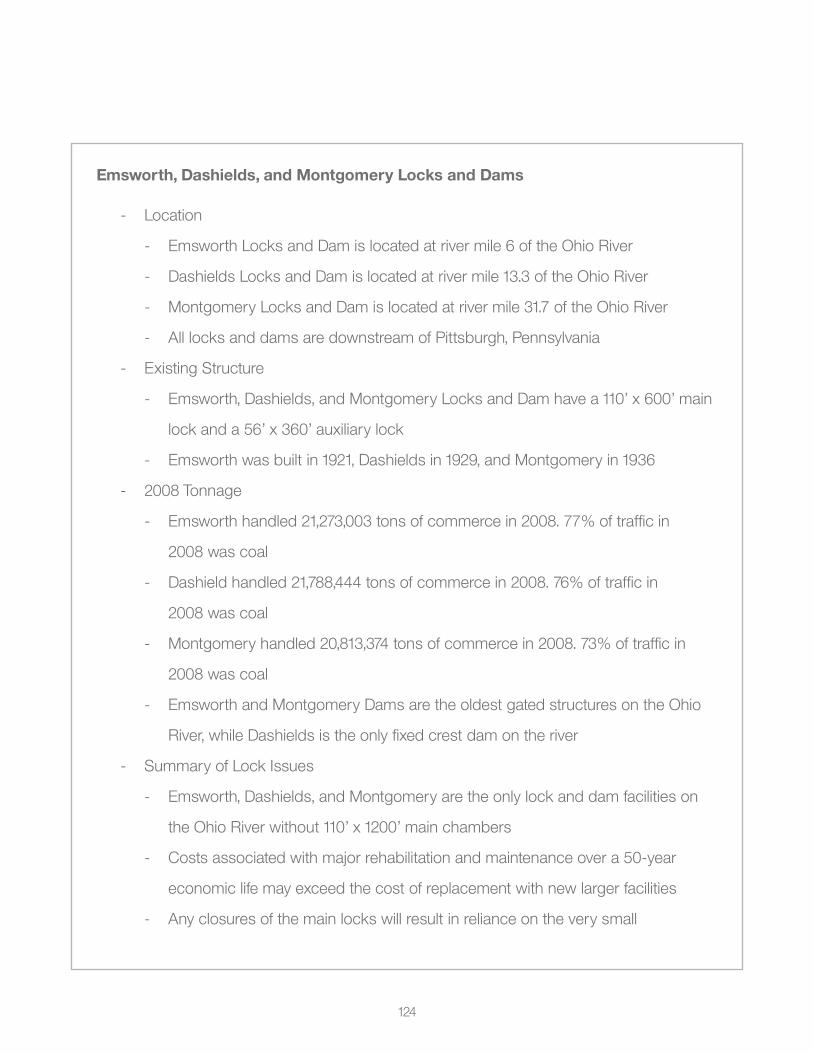
Emsworth, Dashields, and Montgomery Locks and Dams
- Location
- emsworth Locks and dam is located at river mile 6 of the ohio river
- dashields Locks and dam is located at river mile 13.3 of the ohio river
- montgomery Locks and dam is located at river mile 31.7 of the ohio river
- all locks and dams are downstream of Pittsburgh, Pennsylvania
- existing structure
- emsworth, dashields, and montgomery Locks and dam have a 110’ x 600’ main
lock and a 56’ x 360’ auxiliary lock
- emsworth was built in 1921, dashields in 1929, and montgomery in 1936
- 2008 tonnage
- emsworth handled 21,273,003 tons of commerce in 2008. 77% of traffic in
2008 was coal
- dashield handled 21,788,444 tons of commerce in 2008. 76% of traffic in
2008 was coal
- montgomery handled 20,813,374 tons of commerce in 2008. 73% of traffic in
2008 was coal
- emsworth and montgomery dams are the oldest gated structures on the ohio
river, while dashields is the only fixed crest dam on the river
- summary of Lock Issues
- emsworth, dashields, and montgomery are the only lock and dam facilities on
the ohio river without 110’ x 1200’ main chambers
- Costs associated with major rehabilitation and maintenance over a 50-year
economic life may exceed the cost of replacement with new larger facilities
- any closures of the main locks will result in reliance on the very small
124

auxiliary chambers
- each of three facilities are showing significant signs of structural operational
degradation increasing risk of structural and/or operational failure which would
halt navigation
- funding
- approximately $4.6 million was expended from fy 2003 to fy 2007 to perform
a study of improvements on the upper ohio river
- $10 million is left to complete the study in fy 2011
- transportation Importance to the Inland Waterways system
- In 2003 460,875 tons of commodities valued at $54,844,978 were shipped
to Indiana through emsworth, dashields, and montgomery Locks. the top
commodity was coal
- Between 2001 and 2008, an average of 20,837,262 tons of commodities were
shipped annually through emsworth Locks and dam. 16,041,853 tons of coal
were handled by emsworth between 2001 and 2008
- Between 2001 and 2008, an average of 21,632,606 tons of commodities were
shipped annually through dashields Locks and dam. 16,052,330 tons of coal
were handled by dashields between 2001 and 2008
- Between 2001 and 2008, an average of 21,632,606 tons of commodities were
shipped annually through dashields Locks and dam. 16,052,330 tons of coal
were handled by dashields between 2001 and 2008
- Between 2001 and 2008, an average of 22,199,833 tons of commodities were
shipped annually through montgomery Locks and dam. 16,043,710 tons of coal
were handled by montgomery between 2001 and 2008
Source: Waterways Council, Inc.; Army Corps of Engineers
125

x. Priority Locks and dams on the great Lakes system
Soo Locks and Dams
- Location
- st. marys river at sault ste. marie michigan
- existing structure
- Consists of two canals and four locks. Poe is 110’ x 1200’ constructed in
1968, macarthur is 80’ x 800’ constructed in 1943, davis (Closed) is
80’ x 1350’ constructed in 1914 and sabine (Closed) 180’ x 1350’ constructed
in 1919
- 2007 tonnage
- In 2007, over 75 million tons of commerce transited soo Locks, of which 61%
was iron ore. other important commodities included coal, aggregates, grains
and other commodities. total commodity value was over $3.7 billion
- summary of Lock Issues
- u.s. flag vessels restricted to the Poe Lock represent two-thirds of fleet carrying
capacity. transportation costs savings derived from Poe class vessel commodity
movements not being diverted to more costly transportation alternatives during
periods of Poe Lock closures
- an existing problem at soo Locks is the surge in the downstream approach
channel during lock emptying. vessels must now remain some 1,000 feet
downstream of the lock during emptying cycles. It was suggested that
consideration be given to using the existing lock chambers as a discharge bay
instead of emptying the lock into the lower approach
- another concern is the design loads for the wall and fendering system caused
byvesselimpacts.Vesselsfrequentlybecomemisalignedintheapproach
126

because of winds and a doglegged approach channel, and strike the
approach walls
- funding
- the Corps of engineers is evaluating replacing the davis and sabine Locks
with a single 110’ x 1,200 lock. this replacement was first authorized by Congress
intheWaterResourceDevelopmentAct(WRDA)1986andsubsequently
reauthorized in Wrda 1990. In 2002, $3m in Ped was appropriated for the
replacement lock
- transportation Importance
- traffic is projected to grow to 112.6 million tons by 2027
- In 2007 17.8 million tons of commodities valued at $558 million passed through
the soo Locks and dam to Indiana’s
Source: Army Corps of Engineers
127

128
FOR MORE INFORMATION
Contact:
David W. Holt
Vice President Operations & Business Development
Conexus Indiana
111 Monument Circle
Suite 1800
Indianapolis, IN 46204
Phone: (317)638-2108
email: [email protected]
www.conexusindiana.com
Brought to you in part by


www.conexusindiana.com 111 Monument Circle, Suite 1800, Indianapolis, IN 46204