phd chap 6 final 25 april 2006 - unisa
TRANSCRIPT

151
CHAPTER 6
A LARGE-SCALE READING INTERVENTION PROGRAMME
6.1 Introduction
At school, it is usually assumed that children learn to read. By the time they enter tertiary level
education, they need to be able to read in order to learn. From interaction with students, and from
the results obtained in Phases I and II of the reading intervention programme described in Chapter
5, it became clear that many Mathematics Access Module students entered their studies with
severe reading difficulties. Phase I (2000) was an exploratory phase, and in Phase II (2001) a
contact intervention programme for volunteer students was introduced. The results of Phases I
and II suggested that reading remediation could be a means of improving performance in
mathematics.
Results obtained from a face-to-face intervention programme involving a small group of
volunteer students are not necessarily transferable to an entire group of dispersed students
studying through the medium of print. This led to the introduction of Phase III of the reading
intervention, and to the third and fourth cycles in the set of action research cycles focusing on the
relationship between reading and mathematics.
Chapter 6 now describes Phase III, and the related research. The aim of this phase was to
investigate whether and how a reading intervention programme could be extended to all
Mathematics Access Module students, via official tuition channels. Phase III was started in 2001
and implemented in 2002. Two separate research cycles were related to this phase, following
from the two cycles described in Chapter 5. One cycle related to the activities that took place in
2002, and the other to the activities of 2003.
In Chapter 6 we consider the reasons for choosing video as an intervention medium, and note
some of the limitations regarding the use of video in the UNISA context. We then consider the
methodology for the next two action research cycles in this set: methods used to obtain relevant
background information, the design and production of the video and video workbook, the
provision of related reading activities, and methods used to obtain information to evaluate the
video and students’ reading skills in 2002 (Video 1 and related reading activities) and 2003
(Video 2 and related reading activities). Finally an attempt was made to measure the impact of the
152
video by establishing whether the student cohorts in 2001 (no exposure to video) and 2002 (first
exposure to video) were comparable, and to then consider the examination performance of the
two groups (since all other parameters were unchanged as far as possible1). The results of the
evaluations are discussed, leading to a further action research cycle.
6.2 Choice of intervention medium for Phase III
6.2.1 Reasons for using video as an educational medium
In order to implement a reading remediation strategy, it seemed illogical to give weak readers
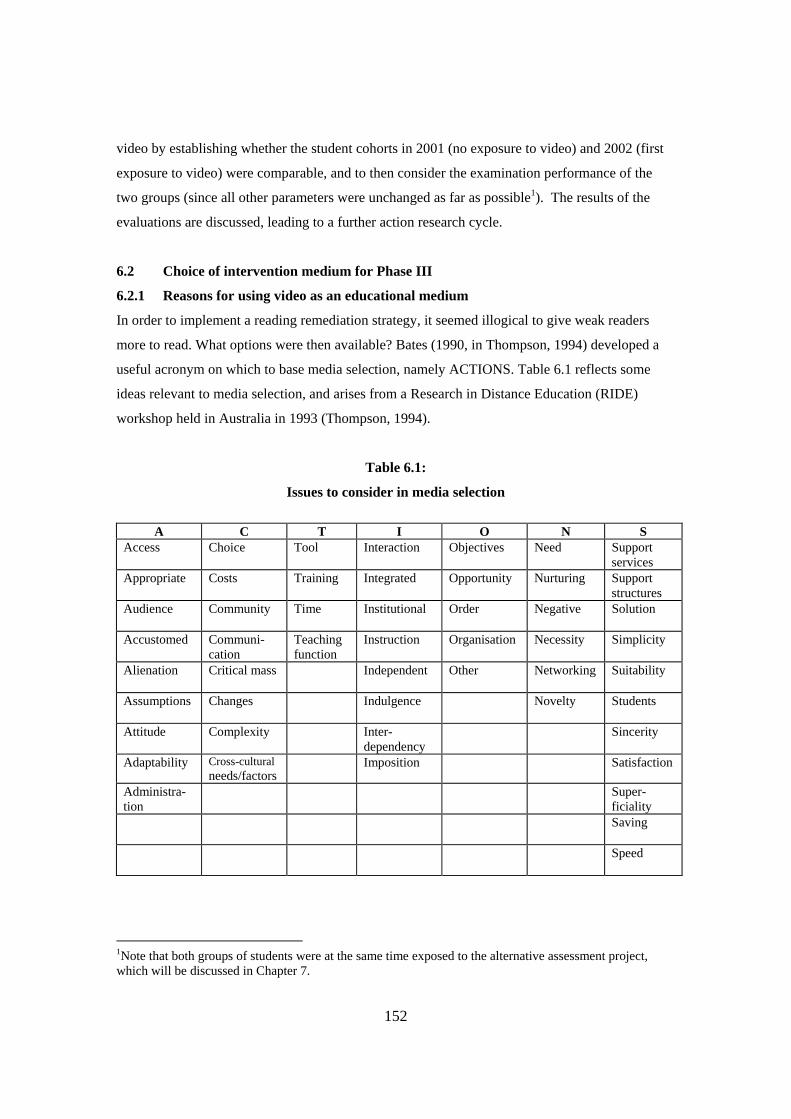
more to read. What options were then available? Bates (1990, in Thompson, 1994) developed a
useful acronym on which to base media selection, namely ACTIONS. Table 6.1 reflects some
ideas relevant to media selection, and arises from a Research in Distance Education (RIDE)
workshop held in Australia in 1993 (Thompson, 1994).
Table 6.1:
Issues to consider in media selection
A C T I O N S Access Choice Tool Interaction Objectives Need Support
services Appropriate Costs Training Integrated Opportunity Nurturing Support
structures Audience Community Time Institutional Order Negative Solution
Accustomed Communi-
cation Teaching function
Instruction Organisation Necessity Simplicity
Alienation Critical mass Independent Other Networking Suitability
Assumptions Changes Indulgence Novelty Students
Attitude Complexity Inter-dependency
Sincerity
Adaptability Cross-cultural needs/factors
Imposition Satisfaction
Administra-tion
Super-ficiality
Saving
Speed
1Note that both groups of students were at the same time exposed to the alternative assessment project, which will be discussed in Chapter 7.

153
Comparing the issues noted in the table with the characteristics of the target group led to the
identification of certain relevant combinations. For example, it would be important for students to
have access to the medium chosen; the costs involved should be taken into consideration so as not
to exclude anyone; the time involved should not be too severe, given the time demands inherent
in the existing study programme, and so on.
Rowntree (1997) provided a set of criteria for the evaluation of available media, among them the
following. Do the desired learning objectives dictate certain media? Which media can be
physically available to the students concerned? Will some media in particular motivate students
more than others? Do students have the skills required to use the media? Which media are
affordable (for students and the institution)?
There are many available media apart from print, such as audio cassettes, web-based teaching,
video, and computer-mediated instruction. Taking into account considerations such as those
mentioned above, video appeared to be the most applicable way of teaching reading to large
numbers of dispersed students from a wide variety of socio-economic backgrounds, in a cost-
effective way.
Video is recognised as an effective tool for reaching dispersed students, and for teaching those
who have limited English language skills (Adams & Hamm, 2000). Furthermore, video as an
educational medium is widely used in distance education (see for example Bates, 1991; Kulandai
Swamy, 1995).
A further reason for considering video for Phase III was the fact that Video Supplemental
Instruction (VSI) had been effectively used at the University of Port Elizabeth (UPE). The phrase
‘Video Supplemental Instruction’ was used to describe an intervention at the University of
Missouri-Kansas City, which was then introduced at UPE with the assistance of the Delta
Foundation (Koch & Snyders, 2001). VSI is based on student involvement, collaborative and
active learning, and requires the use of interactive technology. Video can be used most effectively
when the power of video technology and the skills of appropriately trained facilitators are
combined to assist students in mastering difficult concepts and developing reasoning and learning
skills (Delta Foundation, 2001). At UPE the learning benefits of the group using video material
under the guidance of a non-subject specialist were equivalent to the benefits of those in contact
sessions with the lecturer (Koch & Snyders, 2001).

154
One of the attractions of video is its potential interactivity. Interactive strategies are the
techniques designed to encourage students to become involved and participate actively. While
watching a video, students may want help, may want to ask for directions or clarification, or may
want to review a certain section. The extent to which user-initiated requests have been anticipated
and provided for determines the level of interactivity achieved (Bergman & Moore, 1990). Video
has, however, not necessarily lived up to expectations, and although it is a potentially interactive
medium, it is often used in a passive way (Ramsden, 1992). Video has the potential to be
interactive, but it is recognised that students may need assistance in using the medium optimally.
Some of the more useful characteristics of video, and the implications these have for interactivity,
are shown in Table 6.2 (Bates, 1990).
Table 6.2:
Video characteristics and their implications
Characteristic Implications
Pause, rewind, replay Interaction with ‘substitute’ real life experience
Fast forward, search, stop/start Pace adjustability, and option to repeat, enhances
comprehension of visually dense material
Short sequences Facilitates reflection, analysis, integration
Distinction between different sections Enhances student control
6.2.2 Some limitations relating to the use of video in the UNISA context
Production constraints
Budgetary constraints imposed certain limitations on the video production process. The video was
produced twice, the first time in 2001. Lessons learned in the process were applied in the
production of the second video, in 2002. For convenience the videos will be referred to as Video
1 and Video 2. Video 1 suffered from a lack of expertise from all concerned (neither the lecturers,
nor the audio-visual staff, nor the students who volunteered to assist, had been involved in a video
of this nature before); furthermore, funds for a suitably trained video presenter were not available
and the lecturers involved in writing the video script were required to take on this role.
Student use of video
Although students are familiar with video, it cannot be assumed that they can make the switch
from video as an entertainment medium, to video as an educational medium. The characteristics
155
noted in Table 6.2 suggest a number of responses in the viewer, but the activities necessary to
take full advantage of video would need to be explained to students beforehand. It was felt that
some additional clarification would also be necessary, such as providing upfront an outline of the
video’s purpose and main components, explaining how it should be used, relating video material
to content with which students are already familiar, and providing opportunities for students to
collaborate (in pairs or small groups) in discussions related to the video material after viewing it
(Adams & Hamm, 2000).
Ideally a video should be used frequently and interactively, but in the knowledge that not all
students would have easy and regular access to a video cassette player, the video was designed so
that it was possible to watch it in one sitting. However, the introductory part of the video
attempted to explain to students that this was not the ideal situation, and that they needed to be
actively involved in the process, by stopping, restarting, rewinding, etc.
Since easy access to video cassette players could not be guaranteed for all students it was
necessary to create a supplementary video workbook as well. The workbook attempted to explain
in writing the reading activities that were discussed by the video presenters. In some cases
graphics used in the video could also be reproduced for the workbook, but the two products were
essentially different. The video was theoretically easier for students to follow, in that video
footage could show movement and direction in a way that was not possible in the written version;
the presenters’ tone of voice and body language could also add an emphasis that was difficult to
capture in a written format.
Lack of facilitation
In the UNISA context it was unlikely that students would have the benefit of facilitators to help
them work through the video. However, the fact that the University of Port Elizabeth had used
VSI effectively for similar students, to promote aspects of mathematical thinking and English
language proficiency as well as actual content knowledge (Koch & Snyders, 2001), suggested
that it was an experiment worth considering for Access Module students, in spite of the
limitations inherent in the UNISA situation.
6.3 Methodology for Phase III
This section describes the materials used and the procedures undertaken in the different action
research cycles related to Phase III of the reading intervention. It also deals with student
156
perceptions of this phase. Phase III consisted of a preliminary evaluation of students’ reading
skills, the production of a video, and the design of reading activities to reinforce the video
material. The first action research cycle relating to Phase III involved planning and evaluating the
video (Video 1) and the reading activities implemented in 2002. The results of the research led to
modifications in the video (resulting in the production of Video 2), and changes in the way
reading skills were assessed. The second action research cycle relating to Phase III involved an
evaluation of the modified video (Video 2) and the reading activities implemented in 2003.
6.3.1 Acquiring background information
Before implementing a wider intervention programme it was important to consider some way in
which the effectiveness of such a programme might be measured. It was thus necessary to
determine, in advance of the intervention, whether the group of students who would be exposed
to the intervention in 2002 was in any way comparable to the 2001 group, who had not been
exposed to the intervention. If the groups could be shown to be comparable, and examination
results improved after a year of study in which other aspects of the module were as far as possible
unchanged, it would seem that an improvement in results could be attributed to the intervention.
This was the particular focus in 2002, when the intervention was first introduced.
For a large group of dispersed students it was not possible to carry out the kind of pre-testing that
had been undertaken during Phase II. However, it was nevertheless important to try to obtain
information about all students regarding reading speed, comprehension, and different aspects of
reading skill, before they were exposed to the intervention. It was also felt that some biographical
information might be useful. An attempt made to obtain this information in 2002 proved to be of
limited value. This led to a more concerted effort to obtain additional information in 2003. The
information reflected the competence of students on entry, and complemented the growing
amount of data available regarding the reading skills of Access Module students.
6.3.2 Producing video material
For Phase III a video entitled ‘Read to Learn Maths’ was produced. The primary purpose of the
video was to focus on reading skills situated in a mathematical context. This would have the
added advantage of giving students an opportunity of hearing how mathematical language,
notation and symbols are verbalised.
157
Structure of the video
The video was divided into eight segments, respectively called the Introduction, and Segments 1
to 7. At the end of each segment students were referred to a section in the video workbook
containing activities so that they could practise the skills discussed in that segment. The answers
for all the segments were grouped together at the end of the video workbook.
Based on the results of the face-to-face intervention programme it was decided that the different
segments should incorporate the components that had formed the basis of the content used in the
face-to-face sessions. Most of these are described in more detail in the previous chapter.
At the beginning of the video it was explained to students that they should take note of all
instructions and use the pause/rewind function when a particular aspect was not clear. To promote
interactivity the students were encouraged to stop the video at specific points, find the sections in
the study guides that were being referred to, do activities, check answers (given in the back of the
workbook) and watch parts of the video again where necessary. It was emphasised that students
needed to be active participants in the process, and not merely view the video passively, as one
would normally watch a video for entertainment. The video consisted of eight parts, referred to as
the Introduction, and Segments 1 to 7, described below.
The Introduction included the following aspects:
- The rationale for the reading intervention programme and the use of video
- The importance of reading
- The BICS/CALP distinction
- Vocabulary: low-frequency words, mathematical words and academic words
- Kinds of reading: skimming, scanning, reading for meaning and study reading
- An outline of the extensive reading activities that should be undertaken in order
to improve reading skills
- An overview of the different segments that would follow
- The passage of text used to assess reading speed and comprehension, as well as
the comprehension questions, answers and a data sheet on which students could
record their performance in the two tests. (Once Video 2 had been produced this
was omitted, and similar activities were provided in an assignment.)
Segment 1: This segment dealt with text structure, particularly the macro structure of text,
including text-previewing techniques, and the microstructure of text, namely the form and
158
function of various statement types, such as statements that ask questions, give instructions, or
provide information.
Segment 2: Anaphoric references were explained and illustrated first using general texts that
students would be familiar with, and then using mathematical texts from the Access Module
study guides.
Segment 3: Causal relations (including conditional causal relations) were explained and
illustrated, again first in a general way, and then in a mathematical context.
Segment 4: In this segment contrastive relations were explained. Once again examples were
based on everyday text, and on mathematical text.
Segment 5: This segment dealt with using and interpreting tables and geometric shapes.
Video 1 did not include the section on geometric shapes, but by the time production of Video 2
was under way it had become evident that this was a necessary addition.
Segment 6: The focus of this segment was on understanding and using graphs, in a general sense
rather than the specific mathematical graphs which were dealt with in the study guides. The
activities given in the workbook to reinforce the video content were based on specific types of
graphs that the students would encounter in their studies.
Segment 7: This segment was entitled ‘Reading and problem solving’ and attempted to
consolidate the aspects that had been dealt with in the previous segments, considering specifically
the application of the PQ4R technique to two specific contexts, namely learning a new concept,
and solving a problem.
Modifications made for Video 2
Video 2 was about two thirds of the length of the first. The revision of the video necessitated
some restructuring of the video workbook. To make it easier to refer to sections in the study
guide, in Video 2 students were told at the beginning of each segment what they would need
during that segment, so that they could pause the video and fetch relevant study guides, pens and
paper, etc., if necessary.
The video workbook
The reason for the creation of a workbook as well as a video has already been given. The video
workbook has the same structure as video. The workbook also contains activities based on all the
video segments, in which the reading strategies discussed can be applied to various mathematics
texts. The added availability of the video workbook gives students the choice of using only the
video (and referring to the workbook for the activities), only the video workbook, or both.

159
The first edition of the workbook (supplementary to Video 1) contained a diagnostic reading skill
test which could be self-assessed. It was intended to help students identify aspects of reading that
might need remediation. Once Video 2 had replaced Video 1 it was also no longer necessary to
include the reading speed and comprehension test in the video workbook, as this became part of
Assignment 1 in 2003.
Giving students with poor reading skills even more to read was somewhat self-defeating, but an
alternative option had to be provided in the interests of equity and access. The video workbook,
with the same title as the video, was Book 72 in the series of study guides for the Mathematics
Access Module.
6.3.3 Related reading activities
Students tend not to take activities seriously unless they are assessed in some way. For this reason
three of the six assignments set for the Access Module in 2002 included some questions featuring
activities similar to those given in the video workbook (related to Video 1). In 2003 only one of
the assignments contained reading activities. In order to answer the assignment questions students
would probably have needed to watch the video at least once, or to refer to the workbook.
Segment 6 of the video related to concepts that were dealt with in Book 4, and several of the
workbook activities in that segment reflected the extent to which reading is an important aspect of
interpreting graphs. It was possible for students to make sense of Segment 6 regardless of when
they viewed that segment, but it was suggested that they would derive greater benefit if they
viewed it while they were studying the relevant topics in Book 4.
6.4 Evaluations undertaken in the third and fourth research cycles
The third cycle in this set related to determining the impact of the video, and was also based to
some extent on measuring students’ reading skills. Various methods were used to obtain the
required information. Phase III of the reading intervention involved the production of two
different videos, and thus spans a two-year period: 2002, in which Video 1 was used, and 2003, in
which Video 2 was used. It was necessary to gather information about students’ perception of the
video, and its impact. Analysis of these results led to two consecutive action research cycles, in
these two years.
2 With the restructuring of the Access Module study material in 2003, from 2004 this became Book 6.

160
6.4.1 Evaluating Video 1 and Video 2
Attempts were made to gather some information on the viewing practices of the students, and
feedback regarding the content and its presentation. In 2002 a questionnaire was included in one
of the tutorial letters that contained the assignment questions (see Appendix E). Students were
asked to complete the questionnaire and return it with the assignment. Student feedback on the
content of Video 1, together with the experience of those involved in making the video, was
useful in identifying aspects that needed attention. Where possible these comments were taken
into account in the production of Video 2.
Students were asked to rate the different segments of the video (from the Introduction through to
Segment 7, and the workbook activities) on a scale from 1 to 4, where
1 represents not at all helpful
2 represents helped a little
3 represents helped quite a lot
4 represents helped very much.
The questionnaire also asked several yes/no questions regarding students’ experiences of the
video, for example probing whether they had used only the video, both the video and the
workbook, or only the workbook; whether they had watched parts of the video more than once;
whether they perceived that the video/video workbook had helped them ‘read to learn’ better.
There were also two open-ended questions relating to what they considered to be the best and
worst aspects of the video.
In 2003 students were again asked to complete a video questionnaire and return it, either with an
assignment or separately.
6.4.2 Evaluating reading
Reading skills were determined in different ways over the three cycles (2000 to 2003), for
obvious reasons. In 2000, the overall reading scores of all respondents (308) was determined
towards the end of the year, by means of a questionnaire completed under a variety of conditions
(the mean reading score was 63,8%, and no reading speed data was obtained). In 2001, different
aspects of the reading skills of students in a volunteer group (33 students) were investigated
before they were exposed to the reading intervention (the overall mean reading score in the
pretest was 46% and the mean reading speed was 92 words per minute (wpm)). In 2002 and 2003

161
an attempt was made to assess some of these aspects in a diagnostic test that was voluntarily
submitted by students (discussed below), also in advance of their exposure to the intervention.
Clearly the reading speed and comprehension data obtained under such diverse conditions could
not be used as a basis of comparison of the different groups of students; neither could the data
obtained in 2001 and 2002 be assumed to be an accurate reflection of the student group as a
whole. The tests themselves were also not comparable. However, it was thought that the data
would provide some insight into student reading skills at entry level.
A further reason for evaluating reading skills, both in the ‘pre-test’ and in the assessment of
reading skills carried out via certain assignments (see 6.3.3), was to provide students with
information on possible reading problems, to motivate them to make use of the video.
Investigation of reading skills in 2002
The third phase of the reading intervention was chiefly based on the results obtained from Phase
II. In the face-to-face intervention programme it had been possible to use pre- and posttests to
assess the impact of the intervention. Although desirable, it was not feasible to use such a pretest
in Phase III. No information regarding reading attitudes and practices was thus obtained in 2002.
However, the video workbook contained a data sheet on which students could record some of the
required information. The only biographical information obtained related to the last level (Grades
9, 10, 11 or 12) and grade (Higher Grade, Standard Grade) of mathematics studied at school
(since not all students had taken mathematics up to Grade 12) and the symbol achieved; as well as
the grade on which English was studied and the symbol achieved.
An attempt was also made to assess reading speed and comprehension. In the video workbook, a
passage of text was provided, as well as a data sheet on which students could record the required
information. The students were instructed to record the time at which they began reading the
passage, and the time at which they finished reading. A list of 12 comprehension questions was
provided as well. Again, students were asked to record the time they began answering these
questions, and the time they completed the questions. The answers to the comprehension
questions were provided over the page, and obviously there was no way of determining whether
students consulted these answers beforehand. The data sheet could be cut out of the workbook
without damaging any other pages. The students were asked to submit the information, but there
were no special incentives for doing so.

162
On the basis of the completed data sheets, for each student the total reading time was calculated
(by finding the difference3 between the starting and finishing times), and hence the reading speed
in terms of words per minute (the number of words divided by the number of minutes). The time
taken to answer all the questions was calculated in the same way, and the number of correct
answers was recorded. So as not to prejudice the results, students were given information
regarding acceptable reading speeds and comprehension levels later, in a separate tutorial letter.
Students who performed below acceptable levels were strongly advised to take the video (Video
1) seriously.
As noted above, three of the six assignments contained reading questions. These were marked by
the lecturer and by external markers4, according to the memorandum provided.
Investigation of reading skills in 2003
In 2003 the passage used to test reading speed, the subsequent comprehension test, and various
questions assessing different aspects of reading were all incorporated into the first assignment.
These questions were modified from the questions that had been included in the reading questions
in the three assignments in 2002. (See Appendix F.) Table 6.3 summarises the components of the
test.
Table 6.3:
Components of the diagnostic test included in the first assignment
Assignment section Purpose Score
A: Part 1 Biographical information 25 credits for completion
A: Part 2
Reading speed
Comprehension
No. of words per minute (wpm)
20
A: Part 3 Anaphors
Vocabulary
Sequencing; main/secondary ideas
Causal & contrastive relations
17
12 Total: 54
16
9
B Mathematics (Book 2:
Number Skills and Simple Algebra)
50 marks (25 credits)
3The calculations were checked by the markers, and corrected where necessary: in several cases students added the starting and finishing times. 4 External markers were employed under contract to assist with the marking of Access Module assignments.

163
Section A of the assignment consisted of three parts. The aim of Part 1 was to obtain some
biographical information, such as students’ perceptions of their English reading ability, how often
they needed to read sections in the study guides before answering assignment questions, specific
reading problems, numbers of books in the home, etc. Part 2 assessed reading speed and
comprehension. Students were asked to note their reading times, from which reading speed could
be calculated, and to answer a comprehension test based on the passage, noting their start and
finish times. They were not given the correct answers at that stage, so that a more accurate picture
of comprehension scores could be determined. The maximum score for the comprehension was
20. Part 3 assessed different components of reading skill, namely anaphoric referencing,
vocabulary (low-frequency words), main/secondary ideas and sequencing, and causal and
contrastive relations, for which the maximum totals were 17, 12, 16, and 9, respectively, giving a
total score of 54. All answers for Section A could be filled in on the questions, for example by
circling an option, filling in missing words, etc. Students were asked to cut out these pages and
submit them with Section B of the assignment, which related to the mathematical concepts taught
in Book 2.
The majority of the assignments were marked by external markers. They also marked the section
of the assignment dealing with reading. It was more streamlined than the reading sections in the
2002 assignments, and hence easier to ensure uniformity and objectivity in the marking. Since
this section was part of a credit-bearing assignment, students had greater motivation to submit it.
This assignment yielded a large amount of data pertaining to the reading skills of the 2003
students (1 363 students submitted the assignment, out of approximately 1 600 registered
students).
6.5 Results of the video evaluations
6.5.1 Video 1
It seemed that students had not fully understood what was required in order for them to obtain
optimal benefit from the video. Several responses to the open-ended questions highlighted the
fact that some students had misunderstood the nature and purpose of the video. For example, in
response to the question asking what the worst aspect of the video/workbook was, one student
wrote

164
To read things while you are not going to write about in the exams – as it is stated in
Tutorial letter 1105. It was totally disgusting, maybe for your contributors it was just to
read and know all about it. What a waste of time!
This attitude was not altogether unexpected. Rowntree (1997) points out that in most educational
contexts students are pressed for time, and will often only focus on aspects that will be assessed,
since ‘as in most areas of life, it’s the squeaky wheel that gets the grease’ (p. 16).
There was no clarity regarding the number of students who used the video, or, for those who did,
whether they used it effectively. Tutors had been asked to emphasise the potential benefits of the
video. However, since their prime concern (and the students’, as well) was to try to deal with the
subject content suggested for each session, it is unlikely that they mentioned the video often, or at
all. Discussions with tutors underscored the difficulties they had in finding enough time in the
tutorial sessions to deal with the mathematical problems of diverse students, and the fact that they
felt pressurised to deal with concepts the students perceived to be relevant, often related to the
next assignment.
Student feedback (n = 165) from the video evaluation questionnaire provided valuable
information, even though the response rate was relatively low (about 11,6%). The results appear
in Table 6.4. In the last column the total number of positive responses (either 3 or 4) is converted
to a percentage (shown in brackets) of the total number of responses.
5 In this tutorial letter students were told that the examination would focus on the mathematical content of their study guides, and that there would be no questions on reading activities.

165
Table 6.4:
Evaluation of Video 1
Video component Rated 3
(helpful)
Rated 4
(very helpful)
Total number of 3 or 4
responses (approx %)
Introduction 56 36 92 (60)
Segment 1 (text structure) 55 37 92 (60)
Segment 2 (anaphors) 62 62 104 (68)
Segment 3 (causal relations) 59 68 117 (76)
Segment 4 (contrastive rel.) 59 64 123 (80)
Segment 5 (tables) 64 44 108 (71)
Segment 6 (graphs) 59 55 114 (69)
Segment 7 (problems) 65 51 116 (70)
Workbook activities 61 72 133 (81)
In each category 40% or less of the respondents either found the segments relatively or totally
unhelpful (responses of 1 or 2), or did not comment on the component. Students were assured of
confidentiality, and informed that the video questionnaire was for research purposes only;
however, as in the case with all such questionnaires, it is not possible to know whether students
were providing ‘acceptable’ answers, particularly since student numbers were included.
Apart from the quantitative data regarding the ranking of the video segments, the yes/no and
open-ended questions provided useful information. Not unexpectedly, students felt that the time
demands of dealing with reading skills as well as with mathematical issues were excessive. Some
comments were positive, for example ‘It is perfect. It has zero defect.’, and ‘It helped me to pay
attention to some of the thing I never took serious.’
There were also negative remarks, some of which were useful in the video revision process. Some
of the negative remarks related to the content (e.g. boring for L1 students, too difficult for L2
students, easy examples but difficult questions in activities); other comments related to the
presenters, such as speaking too softly or being boring (one student wrote ‘It is too boarding, try
to make it more interesting’), and others related to structural and technical problems, such as
difficulty with the stop/rewind instructions when trying to locate items, too great a focus on the
presenters with correspondingly less focus on other aspects, page number references for the study
guides or the video workbook were not given, there was occasionally a lack of text and graphic

166
clarity (font too small or not easy to read), the zoom option was too infrequently used, and the
video was too long.
The students who completed the video questionnaire comprised approximately 20,3% of the
students who obtained examination admission6, and approximately 11,7% of those who had
registered. As the number of students who could be considered in terms of all possible variables
(namely reading speed and comprehension, video feedback, submission of assignments, and final
examination mark) was very low (n = 31), statistical analysis of this group seemed unlikely to be
helpful and was not undertaken.
6.5.2 Video 2
Student response to the questionnaire provided was very low (89 students, about 5,5% of
registered students). Of the 89 students who responded, 20 indicated that they had not used either
the video or the video workbook. (Of these, five were repeat students.) The results, in respect of
the students who actually used the video and/or the workbook, are shown in Table 6.5.
Table 6.5:
Evaluation of Video 2
Video component Rated 3 (helpful) Rated 4
(very helpful)
Total number of 3 or 4
responses (approx %)
Introduction 21 14 35 (51)
Segment 1 (text structure) 26 17 43 (62)
Segment 2 (anaphors) 26 26 52 (75)
Segment 3 (causal relations) 26 26 52 (75)
Segment 4 (contrastive rel.) 22 24 46 (67)
Segment 5 (tables) 24 20 44 (64)
Segment 6 (graphs) 28 18 46 (67)
Segment 7 (problems) 23 25 48 (70)
Workbook activities 27 24 51 (74)
The segment that was rated lowest was the Introduction (38% of the respondents rated it as either
1 or 2). The workbook activities obtained the least number of 1 or 2 scores: only a quarter of the
respondents felt that the workbook activities were relatively or totally unhelpful.
6 Examination admission is discussed in Chapter 8.

167
The quantitative data regarding the ranking of the video segments was again complimented by
yes/no and open-ended questions. The data showed that 39% of those who used the material used
only the video workbook. The data also showed that 58% of the respondents used the video, and
referred to the activities in the workbook; 43% watched parts of the video more than once, and
90% felt that the video/video workbook had helped them ‘read to learn’ more effectively.
The positive comments included references to specific segments that had been particularly
helpful, as well as general comments regarding improved reading speed, improved vocabulary,
and greater ability to keep track of a topic being discussed. Students also appreciated the links
between the video segments and the topics dealt with in the study guides. On the negative side,
there were again comments about the presenters being boring; however, there were fewer
comments about technical aspects than in 2002. The increased workload brought about by having
to study another book and take time to do additional activities was again seen as a problem. One
student commented that students should be expected ‘to watch it as an alternative after they
finished the 6 prescribed books’ (the comment again reflects a lack of understanding regarding
the purpose of the video, but highlights the problem of finding additional time).
In spite of attempts in the Introduction to make the purpose of Video 2 even clearer, there were
still students who did not understand that the video was not intended to deal with specific
mathematical concepts, but with reading skills. Many students rated the material negatively for
not providing greater assistance with specific mathematical topics, dealing with assignment
questions, examination assistance, etc. There also seemed to be a misconception regarding the
need for a video workbook as well as a video: one student felt that the pace of the video should be
slower so that it would be possible to read the text in the workbook and simultaneously follow the
discussion on the video, which was of course not the intention.
6.5.3 Results of the reading evaluations, 2002
Reading speed and comprehension
The number of students who submitted the reading speed and comprehension test was small
(n = 78), although it is possible that students completed the task but chose not to submit the
results. It was not possible to determine whether the feedback students were given motivated
them to take the video seriously. It was however abundantly clear that there was a need for them
to do so. The mean reading speed was 128 wpm, ranging from as low as 14 wpm (this student
obtained 11% in the final examination) to as high as 344 wpm (although this may have been an

168
inflated figure: this student only submitted two assignments, and obtained 39% in the
examination). Of the 78 students who completed the data sheets, 28 (just over one third) took
more than 6,5 minutes to read the article (which should not have taken even L2 students more
than three to four minutes to read). It should not have taken more than about three minutes to
answer the questions based on the passage; students reported times from two to 67 minutes for
this activity. Twelve students took longer than 25 minutes. The mean score for the comprehension
was approximately 8,5 out of 12 (approximately 71%, but the answers were readily available, in
that they appeared in the workbook just after the passage on which the questions were based).
Assignment activities
The three assignments which tested aspects of reading as well as mathematical concepts
illustrated other problems associated with reading mathematics, and highlighted some of the
findings in the project assignment, in which students demonstrated limited awareness of the need
for answers to make sense (discussed later, in Chapter 7). In Chapter 7 the sense making was
more related to everyday situations; in this chapter it relates to making sense when ideas are
expressed in mathematical notation. In one of the assignment questions students were required to
fill in the words that appear in the highlighted sections below:
By the vertical line test f is a function since any vertical line cuts the graph of f in
at most one place.
Students gave the following responses (highlighted):
Student 2: By the vertical line test f is a function since f(x) > 0 cuts the x-axis of f in 2 parts.
Student 3: By the vertical line test f is a function since f(x)g(x) > 0 cuts the x-axis of f in −1
< x > 4
Student 5: By the vertical line test f is a function since parabola cuts x-axis at −1, 2 and 4
cuts the graph of f in three times.
Student 6: By the vertical line test f is a function since g(x) cuts the centre of f in f(x).
Student 7: By the vertical line test f is a function since we have x > 0 and x < 0 cuts the
value of f in two points.
Student 8: By the vertical line test f is a function since it intersects the graph twise cuts the
graph of f in two places.
Student 10: By the vertical line test f is a function since it touches the graph cuts the x-axis of
f in 1 place.

169
It is clear that Students 8 and 10 did not realise that the word ‘it’ was used ambiguously;
Student 5 did not realise that ‘in’ made no sense in this context; Students 2 and 3 were not able
(or did not attempt) to ‘read’ or ‘translate’ what they had written and hence did not realise that
what they had written did not make sense (e.g. Student 2: ‘… the value of the function at x is
greater than zero cuts the x-axis …’ ); Student 6 seemed to have a problem with orientation: it
was not clear what was meant by ‘centre’.
If the students had read in words what these statements really say, they would possibly have
realised that most of them are illogical, meaningless or ambiguous. Should we assume that they
could not translate from symbols to words, did not try to do so, did not recognise the lack of
meaning if they did translate? Or did they not expect mathematics to make sense?
6.5.4 Results of the reading evaluations, 2003
Reading speed and comprehension
The number of students who completed both the reading skill assessment and the comprehension
test was much larger than in 2002 (n = 1 371). The marked assignments showed students how
they had scored in the various reading components that were tested. The completed data sheets
showed the reading time for each student, from which their individual reading speeds were
calculated. The information regarding acceptable time frames within which to read the set
passage and answer the questions, and explanations of answers to reading questions were sent to
all students in a follow-up letter. Students were encouraged to take the video seriously if their
performance was below acceptable levels.
Reading speed data is included with other relevant information in Table 6.7.
Biographical information
Not all the biographical questions were analysed, for several reasons. There was insufficient time
to analyse all the questions. It also appeared that students had misunderstood several questions.
For example, the first five questions related to levels and grades of secondary mathematics and
English, and superficial scanning of the questionnaires confirmed that in many cases students
misread the first question, which related to the last grade of mathematics studied at school, and
answered either Higher Grade or Standard Grade, instead of Grade 9, 10, etc. Question 6 (other
languages studied at school) was interesting but not particularly informative in this context (and
here too students misunderstood and listed many subjects other than languages). Question 7
170
related to previous qualifications, and students misinterpreted this to mean any course or subject
they had ever attempted, formal or informal, whether they had passed or not. Question 9
suggested that most students did most of their reading in English, as a result of which Question 13
(dealing with students’ perceptions of their reading skills in a language other than English) was
largely irrelevant. Questions 14 and 15 related to dictionary usage, which had been important in
Phase II, where it was possible to follow up students who were not assiduously compiling mini-
dictionaries of their own. Question 19 (attitude to reading) was technically incorrect. One of the
options involved two different aspects, which resulted in ambiguity: ‘I really enjoy reading and I
read a lot.’
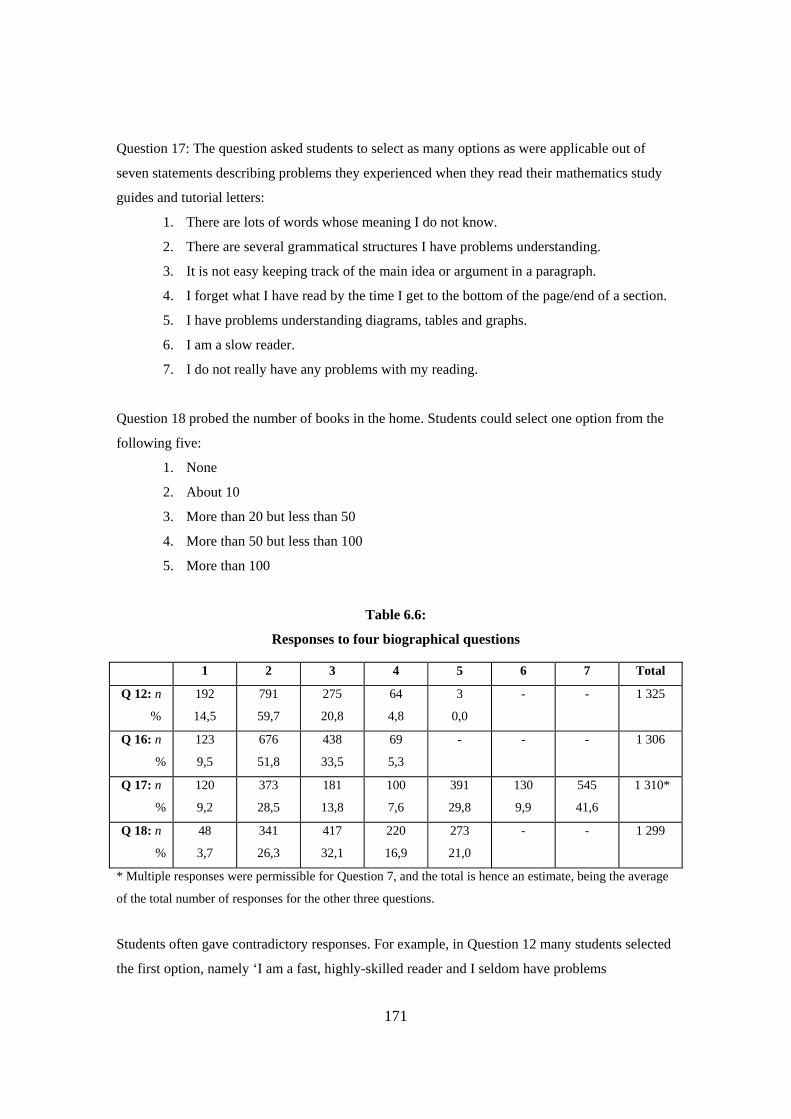
Table 6.6 summarises the biographical information obtained from four specific questions (12, 16,
17 and 18). For each question the total number of students selecting options 1, 2, etc. is given,
first as a number and then as a percentage of the total number of responses. Not all students
answered all questions, and in Question 17 more than one response was permissible. The selected
questions and the possible responses are given below.
Question 12: Students described their perceptions of their own reading ability by selecting one of
the following five options:
1. I am a fast, highly-skilled reader and I seldom have problems understanding what I
read.
2. I regard myself as an average reader – I understand most of what I read.
3. I read quite slowly but I usually understand most of what I read.
4. I read quite slowly and I often have problems understanding what I read.
5. I struggle to read in English. I read slowly and most of the time I do not really
understand what I have read.
Question 16: Students were asked: When preparing for an assignment, how often do you read
through the relevant sections of your study guides? The possible options were:
1. Once
2. 2 times
3. 3 – 4 times
4. 5 times or more
171
Question 17: The question asked students to select as many options as were applicable out of
seven statements describing problems they experienced when they read their mathematics study
guides and tutorial letters:
1. There are lots of words whose meaning I do not know.
2. There are several grammatical structures I have problems understanding.
3. It is not easy keeping track of the main idea or argument in a paragraph.
4. I forget what I have read by the time I get to the bottom of the page/end of a section.
5. I have problems understanding diagrams, tables and graphs.
6. I am a slow reader.
7. I do not really have any problems with my reading.
Question 18 probed the number of books in the home. Students could select one option from the
following five:
1. None
2. About 10
3. More than 20 but less than 50
4. More than 50 but less than 100
5. More than 100
Table 6.6:
Responses to four biographical questions
1 2 3 4 5 6 7 Total
Q 12: n
%
192
14,5
791
59,7
275
20,8
64
4,8
3
0,0
- - 1 325
Q 16: n
%
123
9,5
676
51,8
438
33,5
69
5,3
- - - 1 306
Q 17: n
%
120
9,2
373
28,5
181
13,8
100
7,6
391
29,8
130
9,9
545
41,6
1 310*
Q 18: n
%
48
3,7
341
26,3
417
32,1
220
16,9
273
21,0
- - 1 299
* Multiple responses were permissible for Question 7, and the total is hence an estimate, being the average
of the total number of responses for the other three questions.
Students often gave contradictory responses. For example, in Question 12 many students selected
the first option, namely ‘I am a fast, highly-skilled reader and I seldom have problems
172
understanding what I read’ and yet reflected several contradictory characteristics For example,
two students (S1, S27) who also selected ‘I do not really have problems with my reading’ in
Question 17, took 17 minutes and 60 minutes, respectively, to read the passage. The first student
obtained 34% in the examination and did not write the supplementary examination; the second
did not write the examination, and claimed that s/he needed to read through the study material
five times or more when preparing for an assignment. A student (S3) who claimed, in Question
17, that ‘there are lots of words whose meaning I do not know’, took 20 minutes to read the
passage, obtained an assignment average of 33% out of seven assignments, and although he
obtained examination admission8 he did not write the examination. Another student who obtained
78% for English on Higher Grade in Grade 12, selected the option ‘I forget what I have read by
the time I get to the bottom of the page/end of a section’ for Question 17. In the examination this
student (S4) got 41%, and 43% in the supplementary examination. A student (S5) claimed to have
taken 90 minutes to read the passage, and she obtained 14% in the examination. None of these
responses answers warrant the selection of the first option for Question 12.
The following example possibly reflects a more realistic response. Student S6 selected options 3
for Questions 12 and 16, all options except option 7 for Question 17, took 15 minutes to read the
passage and claimed to have no books in the home. This student did not write the examination.
The data highlight a number of issues. The study material for the Mathematics Access Module
consisted of 7 study guides (including the Video Workbook). For students who read slowly, this
constitutes an enormous workload: 38,8% of the students (those who selected options 3 or 4 in
Question 16) needed to read the material three times or more in order to prepare for their
assignments. The number of students who have fewer than 10 books in the home (29,9%)
illustrates the limited opportunity for intellectual stimulation afforded by many home
environments. On the whole the majority of the students regarded themselves as average readers
(59,7% of the students selected option 2 for Question 12), and felt that they did not have any
problems with their reading (41,6% of the students selected option 7 for Question 17). This does
not agree with the reading speed data: the mean reading speed was approximately 115 wpm9, less
than the accepted minimum of 160 wpm (see Table 6.7).
7 The labels S1, S2, etc., are used in place of the student numbers. 8 Examination admission is discussed in Chapter 8. 9 This figure would have been inflated by students who reported very high figures, such as 470 wpm and 300 wpm, which seemed unlikely. Experience with students suggests that figures at the lower end of the range are more credible.

173
Assignment activities
The data pertaining to the reading section in Assignment 1 were recorded on data sheets, and later
captured. The results in Phase II (see Chapter 5) suggested that students seemed to have particular
difficulty with anaphors, vocabulary and logical relations. There was some doubt as to the value
of the questions in the vocabulary section of Part 3 in Assignment 1(it only contained 12 items,
attempting to assess knowledge of both academic and technical words) and in the sequencing
items (it seemed that students generally either scored full marks or no marks). It was thus decided
to take into account only one of the individual reading components, namely anaphoric reference,
and the overall reading score (i.e. the total for Part 3) for further analysis.
Analysis of results
Table 6.7 gives the mean scores for anaphoric reference, overall reading ability, reading speed
and comprehension, and for two mathematical variables, namely the assignment mark and
examination mark, all given as percentages. A comparison of the numbers of students shows that
not all students had scores in all categories.
Table 6.7:
Mean scores in reading and mathematical variables
Variable Number Mean (to one decimal)
Overall reading score (%) 1 276 59,9
Reading speed (wpm) 1 371 114,7
Comprehension (%) 1 371 66,5
Anaphoric reference (%) 1 371 66,7
Assignment mean (%) 1 543 44,0
Final examination mark (%) 577 34,4
A picture emerges of students with reading scores below optimal levels, who were reading very
slowly, and who performed poorly in their assignments and in their examinations.
Table 6.8 shows the relationships between different components of reading, the assignment mean
and the final examination mark. Table 6.9 shows, in addition, the relationships between the
different reading components.

174
Table 6.8:
Pearson correlations between components of reading skill,
and performance in mathematics assignments and examination
Assignment mean Examination mark
Assignment mean Pearson corr Sig. (2-tailed)
n
- .
1 543
0,525 0,000 577
Exam mark Pearson corr Sig. (2-tailed)
n
0,525 0,000 577
- .
577 Comprehension Pearson corr
Sig. (2-tailed) n
0,283 0,000 1 345
0,305** 0,000 551
Anaphoric reference Pearson corr Sig. (2-tailed)
n
0,293 0,000 1 345
0,383** 0,000 551
Overall reading score Pearson corr Sig. (2-tailed)
n
0,382 0,000 1 345
0,455** 0,000 551
Reading speed Pearson corr Sig. (2-tailed)
n
0,160 0,000 1 254
0,254** 0,000 520
Table 6.9:
Pearson correlations between reading skill components and mathematics performance
Assignment
mean Exam mark
Compre-hension
Anaphoric reference
Overall reading
score
Reading speed
Assign-ment mean
Pearson corr Sig. (2-tailed)
n
- .
1 543
0,525 0,000 577
0,283 0,000 1 345
0,293 0,000 1 345
0,382 0,000 1 345
0,160 0,000 1 254
Exam mark
Pearson corr Sig. (2-tailed)
n
0,525 0,000 577
- .
577
0,305** 0,000 551
0,383** 0,000 551
0,455** 0,000 551
0,254** 0,000 520
Compre-hension
Pearson corr Sig. (2-tailed)
n
0,283 0,000 1 345
0,305** 0,000 551
- .
1 371
0,427** 0,000 1 371
0,581** 0,000 1 371
0,277** 0,000 1 276
Anaphor-ic ref.
Pearson corr Sig. (2-tailed)
n
0,293 0,000 1 345
0,383** 0,000 551
0,427** 0,000 1 371
- .
1 371
0,830** 0,000 1 371
0,229** 0,000 1 276
Overall reading
score
Pearson corr Sig. (2-tailed)
n
0,382 0,000 1 345
0,455** 0,000 551
0,581** 0,000 1 371
0,830** 0,000 1 371
- .
1 371
0,371** 0,000 1 276
Reading speed
Pearson corr Sig. (2-tailed)
n
0,160 0,000 1 254
0,254** 0,000 520
0,277** 0,000 1 276
0,229** 0,000 1 276
0,371** 0,000 1 276
- .
1 276 ** Correlations highly significant at the 0,01 level

175
Since the section on anaphoric reference comprised almost one third of the total it could have
been predicted that the correlation between anaphoric reference and overall reading score would
be high, which it was (0,830). The other correlations greater than 0,5 are between the examination
mark and the assignment mean (0,525), and between the overall reading score and comprehension
(0,581). There was a moderate correlation between comprehension and anaphoric reference
(0,427), and between the final examination mark and the overall reading score (0,455).
Once again it is important to note that the students who were exposed to Video 1 (2002) and
Video 2 (2003) were also exposed to the project assignment as it was implemented in these two
years. No attempt was made to try to consider separately the impact of the two distinct
interventions on the pass rate.
The video and video workbook emphasise the fact that poor reading skills are likely to undermine
mathematical performance. This may have persuaded students in 2003 to take the video more
seriously, since the examination results improved10.
6.5.5 Reading mathematical symbols
In the video evaluation questionnaires in 2001 and 2002 many students commented that they
found the section on graphs especially difficult. In the biographical section of the first assignment
in 2003 many students (391) selected option 5 for Question 17 (‘I have problems understanding
diagrams, tables and graphs.’).
During Phase II it had become evident that students have difficulty with prepositions, and this
difficulty is possibly one of the factors contributing to the problems they have regarding the
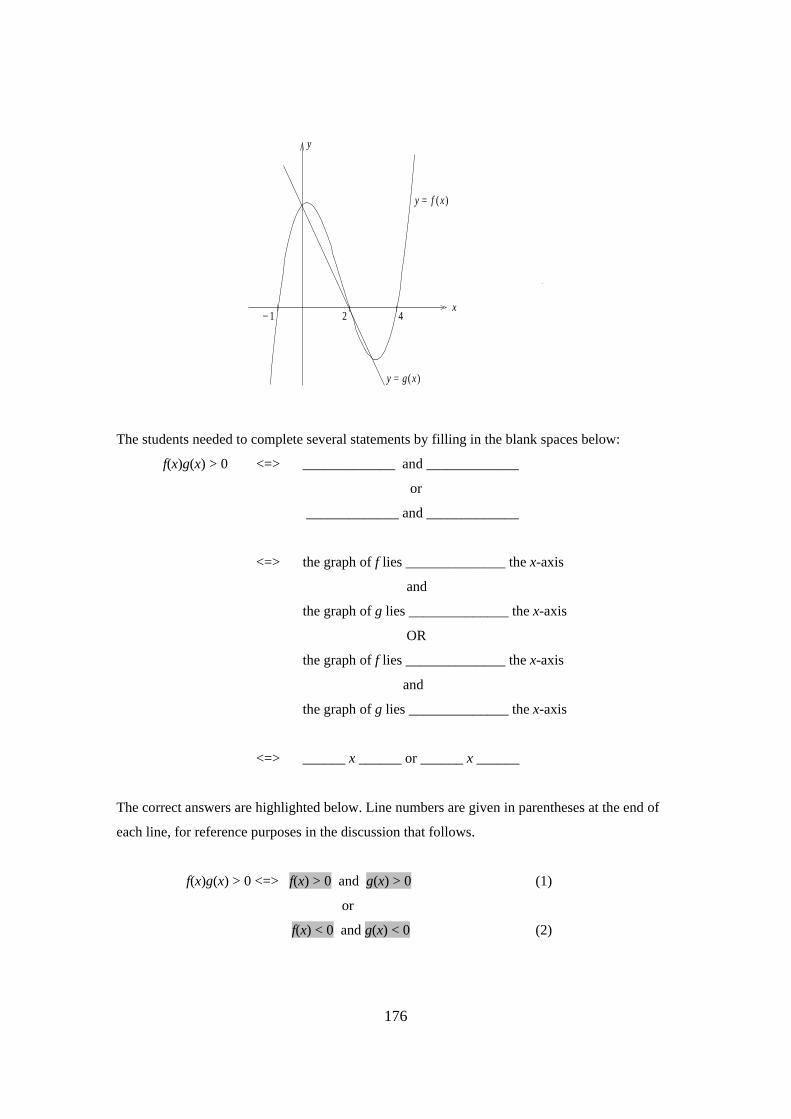
interpretation of graphs. In 2002 one of the questions in Assignment 4 dealt with the concepts of
greater than, less than, above, below, etc. in relation to a generic graph, called the graph of some
function f, shown on the next page.
10 Examination results are discussed in Chapter 8 (see Table 8.9).
176
1_
y = f ( )x
y = ( )xg
2 4
y
x
The students needed to complete several statements by filling in the blank spaces below:
f(x)g(x) > 0 <=> _____________ and _____________
or
_____________ and _____________
<=> the graph of f lies ______________ the x-axis
and
the graph of g lies ______________ the x-axis
OR
the graph of f lies ______________ the x-axis
and
the graph of g lies ______________ the x-axis
<=> ______ x ______ or ______ x ______
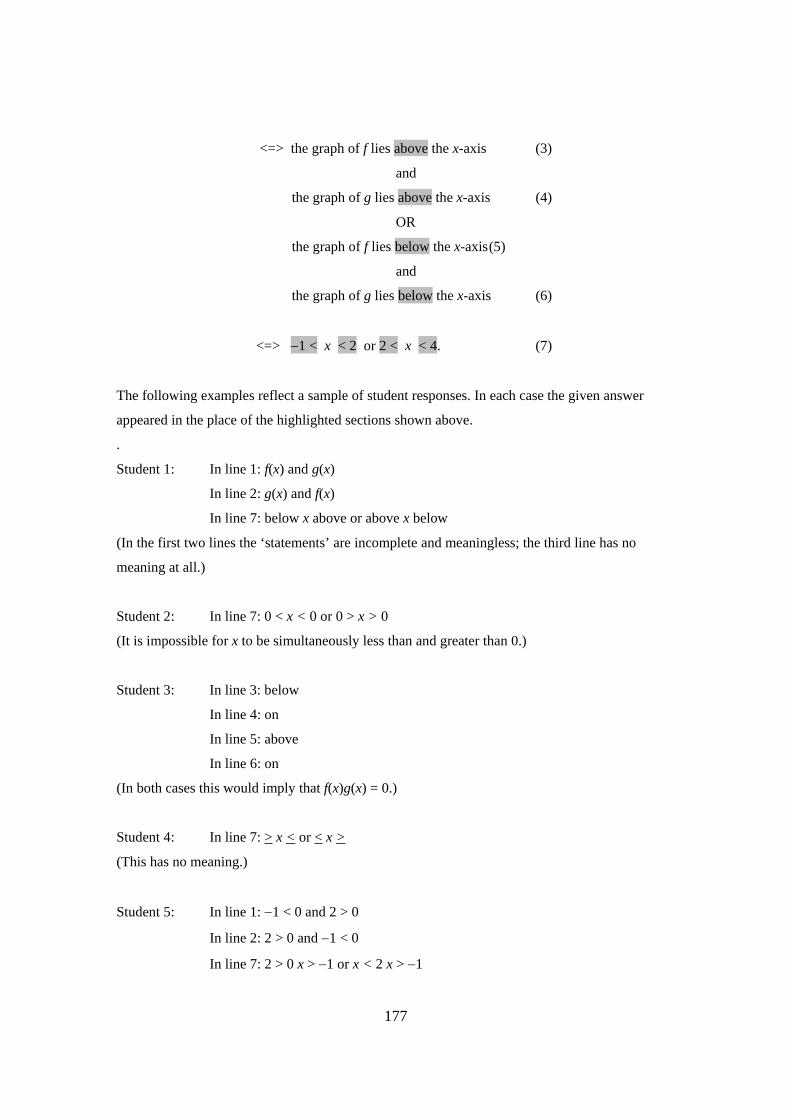
The correct answers are highlighted below. Line numbers are given in parentheses at the end of
each line, for reference purposes in the discussion that follows.
f(x)g(x) > 0 <=> f(x) > 0 and g(x) > 0 (1)
or
f(x) < 0 and g(x) < 0 (2)
177
<=> the graph of f lies above the x-axis (3)
and
the graph of g lies above the x-axis (4)
OR
the graph of f lies below the x-axis (5)
and
the graph of g lies below the x-axis (6)
<=> −1 < x < 2 or 2 < x < 4. (7)
The following examples reflect a sample of student responses. In each case the given answer
appeared in the place of the highlighted sections shown above.
.
Student 1: In line 1: f(x) and g(x)
In line 2: g(x) and f(x)
In line 7: below x above or above x below
(In the first two lines the ‘statements’ are incomplete and meaningless; the third line has no
meaning at all.)
Student 2: In line 7: 0 < x < 0 or 0 > x > 0
(It is impossible for x to be simultaneously less than and greater than 0.)
Student 3: In line 3: below
In line 4: on
In line 5: above
In line 6: on
(In both cases this would imply that f(x)g(x) = 0.)
Student 4: In line 7: > x < or < x >
(This has no meaning.)
Student 5: In line 1: −1 < 0 and 2 > 0
In line 2: 2 > 0 and −1 < 0
In line 7: 2 > 0 x > −1 or x < 2 x > −1
178
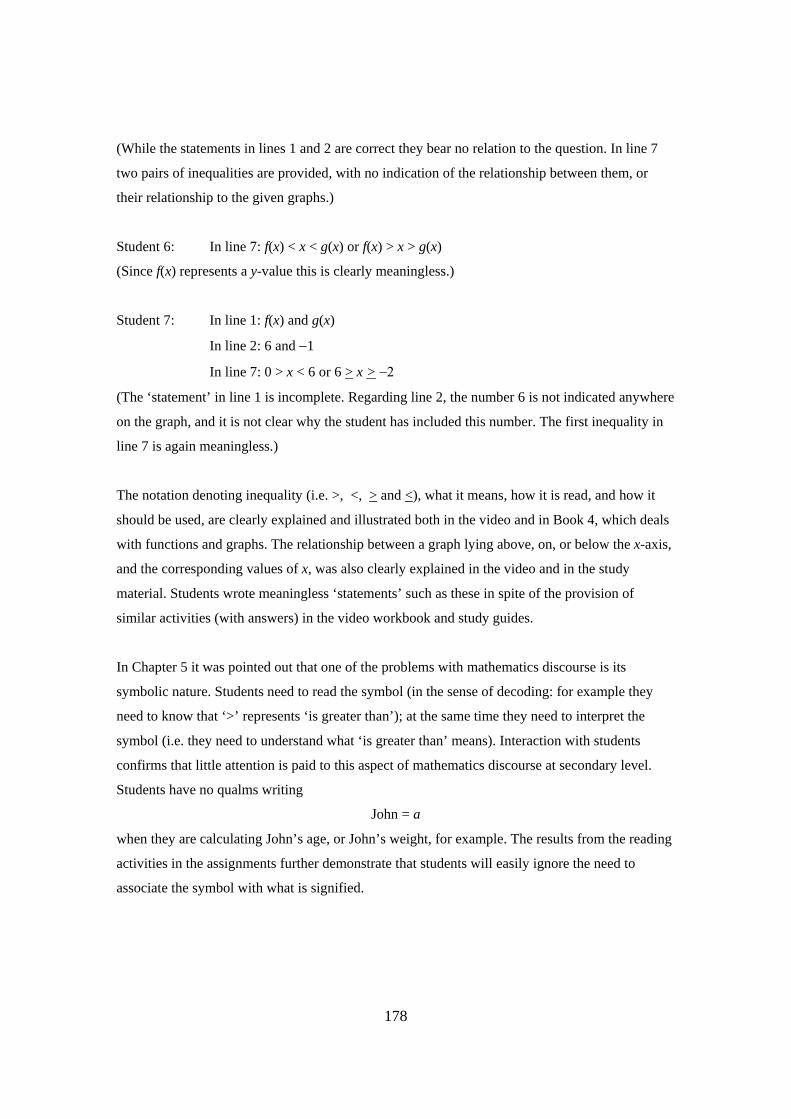
(While the statements in lines 1 and 2 are correct they bear no relation to the question. In line 7
two pairs of inequalities are provided, with no indication of the relationship between them, or
their relationship to the given graphs.)
Student 6: In line 7: f(x) < x < g(x) or f(x) > x > g(x)
(Since f(x) represents a y-value this is clearly meaningless.)
Student 7: In line 1: f(x) and g(x)
In line 2: 6 and −1
In line 7: 0 > x < 6 or 6 > x > −2
(The ‘statement’ in line 1 is incomplete. Regarding line 2, the number 6 is not indicated anywhere
on the graph, and it is not clear why the student has included this number. The first inequality in
line 7 is again meaningless.)
The notation denoting inequality (i.e. >, <, > and <), what it means, how it is read, and how it
should be used, are clearly explained and illustrated both in the video and in Book 4, which deals
with functions and graphs. The relationship between a graph lying above, on, or below the x-axis,
and the corresponding values of x, was also clearly explained in the video and in the study
material. Students wrote meaningless ‘statements’ such as these in spite of the provision of
similar activities (with answers) in the video workbook and study guides.
In Chapter 5 it was pointed out that one of the problems with mathematics discourse is its
symbolic nature. Students need to read the symbol (in the sense of decoding: for example they
need to know that ‘>’ represents ‘is greater than’); at the same time they need to interpret the
symbol (i.e. they need to understand what ‘is greater than’ means). Interaction with students
confirms that little attention is paid to this aspect of mathematics discourse at secondary level.
Students have no qualms writing
John = a
when they are calculating John’s age, or John’s weight, for example. The results from the reading
activities in the assignments further demonstrate that students will easily ignore the need to
associate the symbol with what is signified.

179
6.6 The impact of the video on mathematics performance
6.6.1 Methods used to compare results in 2001 (without video) and 2002 (with video)
In order to determine whether the reading strategies (as taught by means of Video 1) had any
impact on mathematics performance, it was planned that the third phase of the reading
intervention project would involve a comparison of the examination results of the Access Module
students in 2001, and in 2002. To find out whether such a comparison was at all meaningful,
performance in Assignment 1 in 2001 and in 2002 was compared (with the two assignments kept
as similar as possible). In this context ‘similar’ meant that the proportion of recall, procedural
skill, application, higher order thinking skills, etc., was maintained in both assignments. In the
previous chapter it was pointed out that in the group of students in the intervention programme,
matriculation performance did not correlate in any significant way with the final examination
result. For this reason it was decided not to take school-leaving results into account for the
comparison: students have extremely diverse school backgrounds; furthermore, the impact of
school results is affected by the number of years out of school and the influence of post-school
experience.
The hypothesis was that if the student groups in 2001 and 2002 were comparable, then an
improvement in examination performance could be attributed to an improvement in reading skills
(provided all other parameters were unchanged as far as possible). To ensure that students in 2002
did not use the video before submitting Assignment 1 (thereby giving them a potential advantage
over the 2001 students), the video was only distributed from the beginning of April, by which
time students were expected to have posted the first assignment (due towards the end of April).
An additional factor that could have been taken into account was the number of repeat students.
The presence of repeat students should, theoretically, have inflated the first assignment mean in
both cases. The proportion of repeat students in 2001 and in 2002 may have been different, and
this could have affected the conclusions. Initially this aspect was not taken into account.
A further factor which may have played a role was the exposure of the students to the project
assignment (discussed in Chapter 7). However, students were exposed to this project in 2001 and
in 2002. The two tasks involved in the project were the same in both years, apart from minor
modifications; however students could choose to do only one of the tasks in 2001, whereas they
were expected to do both in 2002. As is always the case, assignment submission is voluntary, and
each year there were thus some students who chose not to undertake the project. The possible

180
influence of this project on the assessment of the impact of the video has not been considered.
The comparability of the students (described below) would not have been specifically influenced
by the project.
6.6.2 Comparability of 2001 and 2002 students
Table 6.10 summarises the relevant information.
Table 6.10:
Comparability of students in 2001 and 2002
Year Number registered
Assignment 1 mean
Number wrote
Number passed
Examination pass rate11 (pass/wrote)
2001 1 279 57,2% 726 179 24,7%
2002 1 457 63,7% 700 104 14,9%
In 2002 there were 1 457 students who registered for the Access Module. After initial
cancellations the number dropped to 1 425. The total number of students who passed (either in
the year-end or supplementary examination) was 104. The actual pass rate (those who passed
relative to those who wrote) was 14,9%.
In contrast, in 2001 there were 179 students who passed (either in the October or in the January
examination), out of 1 279 registered students, giving a pass rate of almost 14%, roughly double
that of 2002. In Chapter 5 it was pointed out that 11 of the 33 students in the face-to-face reading
intervention passed. To what extent did the results of these students have an impact on the overall
results of the group? If the results of these students are excluded, the pass rate becomes
marginally lower (23,1%) but still considerably higher than the 2002 figure. Far from an
improvement in results, there was a considerable decline in the pass rate. The main purpose of the
video was to help students read better in order to learn mathematics more effectively. The
examination results in 2002 suggest that this did not take place.
The mean mark for the first assignment in 2002 (out of 1 186 assignments marked) was 63,7%
(with a standard deviation of 20,9); in 2001 the mean (out of 1 074 assignments marked) was
57,2% (with a standard deviation of 20,4). The difference between the two assignment means was
11 Discussed in Chapter 8.

181
6,5%, suggesting that the 2002 group may have actually been slightly ‘better’ than the 2001
group. All other parameters during 2002, other than a greater focus on reading skill in three of the
seven assignments, were unchanged.
These results relate to the student group as a whole. What is the situation if we consider
separately the results of the students who submitted or did not submit the video evaluation
questionnaire? The only reason for doing so would be an assumption that those who submitted
the questionnaire actually used the video, while those who did not submit the questionnaire
possibly did not use it. Table 6.11 summarises this information.
Table 6.11:
Comparison of results of students who submitted/did not submit
the video evaluation questionnaire
Wrote exam (n = 700)
Number who passed (n = 104)
% passed/wrote
Questionnaire submitted (n = 165)
132 23 17,4
Questionnaire not submitted (n = 568)
568 81 14,3
Of the 165 students who completed video questionnaires, 23 passed out of the 132 who wrote the
examination, giving a pass rate of approximately 17,4%. The total number of passes was 104, and
hence 81 of the students who passed did not use the video. Of the 700 who wrote the
examination, 132 had submitted the video questionnaire, and hence 568 of the students who wrote
the examination did not submit the questionnaire. A higher percentage of those who submitted the
questionnaire passed, however, analysis of the data shows that this difference in performance is
not statistically significant.
6.7 Discussion of the results
6.7.1 Video
In 2002 there were 166 students who submitted video evaluation questionnaires, equivalent to
20,4% of the students who obtained examination admission and 23,7% of the students who wrote
the examination. In 2003, 89 students completed the video questionnaire, comprising
approximately 13,7% of the students who obtained examination admission, and 15,6% of those
who wrote. In 2003, since the video content was not directly assessed in any of the assignments, it
was possible for students who did not recognise their need for remediation, or who misunderstood

182
the purpose of the video, to simply watch it early in the year and then ignore it for the rest of the
year. If that was the case, it is unlikely that they would have taken the trouble to respond to the
questionnaire. It is also possible that repeat students ignored the video.
In spite of poor examination results, it is probably not a good idea to conclude, after two years of
using the video, that it is ineffective. It must be remembered that although in theory UNISA
caters for adult distance learners, many of the students taking access modules are not
academically mature, and have not yet developed the learning skills that enable them to function
effectively in a distance-learning environment. Even in the best-case scenarios some contact
support is seen as an essential element of distance learning. For example, particularly for
foundation courses at the United Kingdom Open University (UKOU), some courses included
compulsory attendance at summer schools held on the campuses of a variety of different
universities (Harry, 1990). Other studies showed similar practices. In Pakistan, at the Allama
Iqbal Open University, students were regularly in touch with trained tutors (one tutor to a group
of about 30 students) (Satyanarayana & Koul, 1990). At Deakin University in Australia student
advisors contacted students regularly (Moran, 1990). Contact is even more essential in the context
of educational disadvantage.
Video 1 was used in 2002; in that year several assignments focused on aspects of the video and
the results were extremely poor: the pass rate was 14,9%, and the attrition rate was approximately
50%. The video was revised, and Video 2 was used in 2003. In that year only one assignment
dealt with reading issues; it was an attempt to gauge initial reading skills, and to encourage
students with identified reading problems to take the video seriously. The pass rate was
considerably higher: 27%, but the attrition rate was worse: about 65%. It is difficult to gauge to
what extent either of these figures could have been influenced by student use of the video.
6.7.2 Additional reading activities
‘Reading’ mathematics requires the integration of decoding and comprehension skills with
respect to English words as well as mathematical symbols, aspects of visual literacy, and a level
of meta-cognitive awareness where students will recognise the necessity of ensuring that they
actively make sense of what they read. It did not appear that students were able to grasp the
possible potential of the video to enhance these skills.
183
There could be many reasons for the apparent lack of enthusiasm for additional video material
dealing with reading. None of the video components were specifically assessed in the
examination, and discussions with students suggested that many simply ignored the material. The
sheer volume of work was possibly greater than students could manage, and the video the easiest
component to leave out.
In 2002 there was little evidence that the assignment questions, which were designed to reinforce
the activities given after each video segment, and persuade students to take the workbook
activities seriously, had the desired effect. There were large numbers of students, resulting in 941,
733 and 682 submissions for Assignments 2, 4 and 5, respectively12. It was thus necessary to
involve external markers who had not been involved in the face-to-face intervention programme.
It was also clear from the first round of marking (i.e. after the first assignment containing reading
activities) that the markers would have benefited from additional training in order to understand
better the nature of the reading difficulties exhibited by students. As a result of a limited grasp of
the aspects of reading being investigated, mark allocation was very variable, dependent also on
markers’ time constraints and motivation. Marking questions such as these was extremely time-
consuming. It was difficult to ensure a high standard of marking, and it is thus doubtful whether
these sections of the assignments played a meaningful role. There thus seemed little point in
keeping records of specific occurrences of reading problems, or trying to relate performance in
the reading skill sections with performance in the mathematics sections.
In 2003 the moderate correlation between comprehension and anaphoric reference possibly
suggests that competent anaphoric resolution may make it easier for students to keep track of
what they read, and hence understand more clearly what they have read. The moderate correlation
between the final examination mark and the overall reading score is nevertheless important in that
it does reinforce the notion of a relationship between academic performance in mathematics and
the ability to read efficiently. What the results cannot show is the extent to which weak reading
skills may or may not have had an impact for students who dropped out during the course of the
year.
In trying to gauge the impact of the video on mathematical performance, there is no guarantee
that the two groups of students were comparable, even though performance in the first assignment
in the two years suggests that they may have been. However, if they were in any way comparable, 12 These were the assignments that contained reading activities.

184
it would seem that the video intervention in 2002 (Video 1) did not have a marked effect on the
pass rate. There is also no evidence to relate the improved pass rate in 2003 to Video 2.
6.8 Conclusion
6.8.1 Potential use of video
Phase I of the reading intervention identified aspects of reading that relate to constructing
meaning in mathematics, and showed that students whose reading levels are below 60% appear to
be academically at risk (thereby answering the first research question). Phase II suggested that an
intervention programme has potential, but unless students can improve beyond the 60% threshold
they are unlikely to be successful in studying mathematics in a distance-learning environment.
The results of Phase III suggest that an intervention programme for distance learners may require
facilitation for it to be effective. The third research question posed in the reading project was the
following: Does explicit attention given to reading improve the reading ability and academic
performance of mathematics students? In Phase II the answer to this question seemed to be
related to the degree of support needed to raise the ‘reading threshold’ to at least a 60% level. In
Phase III it is suggested that facilitation may be able to play a role. The qualified answer to the
third research question thus forms a basis for further research.
It was clear from students’ comments (in informal discussions, and from the video evaluation
questionnaires) that those who were strongly in need of reading remediation were often unlikely
to have the time to attend to reading problems while simultaneously coping with the mathematical
content. The video was specifically designed to focus on the reading skills that are needed to
make sense of the complex language of mathematics, but it was being used while students were
studying the mathematics. It seems possible that the use of video per se may be beneficial, but
using it in conjunction with, rather than prior to, learning the mathematical content of the module
may have undermined its potential.
6.8.2 Pre-registration diagnostic assessment of reading skills
From Chapter 5 it appears that many potential Access Module students need to upgrade their
academic reading skills before studying mathematics. The data discussed in this chapter
reinforces the view that students with impaired reading ability should first be assisted to upgrade
their reading skills before embarking their studies. The results obtained suggest that students with
reading difficulties are unlikely to be able to upgrade their reading skills and simultaneously cope
with their studies. They may be more successful if problems are diagnosed and remedial activities
185
undertaken before they begin studying the mathematical content of the module. Fundamental to
any intervention is that students need to have reached an academic ‘threshold’ (in terms of
academic skills, meta-cognitive skills, reading ability, language proficiency, and general
knowledge) from which further learning can take place.
6.9 Summary
This chapter has focused on the design, production and use of video to address the problem of
limited reading skills of Mathematics Access Module students on a large scale. The process was
carried out twice, and resulted in the production of two videos. Associated activities involved the
design and production of a supplementary workbook, and the provision of a number of reading
activities, used to evaluate reading skills, and to reinforce the reading skills taught in the video.
Research into the different activities that were involved led to modifications and improvements,
with respect to both the video and the related reading activities. Phase III of the reading
intervention incorporated two action research cycles. Analysis of the impact of Video 1 and the
related reading activities led to adaptations and modifications which resulted in the second cycle,
which involved Video 2 and other reading activities. Furthermore, the chapter describes an
attempt that was made to measure the impact of the video, by investigating possible
comparability of two student cohorts (pre and post video) and considering the examination
performance of the two cohorts.
The data obtained during the implementation and evaluation of the video and related reading
activities, as well as the data obtained over the three years of the alternative assessment project
(which will be described in the next chapter), together culminated in the final cycle in the action
research process, which will be described in Chapter 8.