phe food and water pt schemes€¦ · microbiology 0006 public health england ... the allocation of...
TRANSCRIPT
FEPTU562.12 Page 1 of 30
PHE Food and Water PT Schemes: A guide to the scoring systems and statistics used for the PHE proficiency testing schemes for food and water microbiology
0006
Public Health England Food and Environmental Proficiency Testing Unit (FEPTU) 61 Colindale Avenue London NW9 5EQ Tel: +44 (0) 20 8327 7119 Fax: +44 (0) 20 8200 8264 Email: [email protected] Website : https://www.gov.uk/government/collections/external-quality-assessment-eqa-and-proficiency-testing-pt-for-food-water-and-environmental-microbiology
FEPTU562.12 Page 2 of 30
Index
Section Page
1.0 General introduction 4
1.1 PHE scores for on-going performance assessment 6
1.2 Z-scores 9
2.0 Standard Scheme 11
3.0 European Food Microbiology Legislation Scheme 13
4.0 Shellfish Scheme 15
5.0 Non-Pathogen Scheme 18
6.0 Environmental Swab Scheme 19
7.0 Shiga toxin-producing Escherichia coli Scheme 20
8.0 Norovirus and Hepatitis A Virus Scheme 21
9.0 Legionella Isolation Scheme 22
10.0 Legionella Molecular Scheme 24
11.0 Recreational and Surface Water Scheme 25
12.0 Drinking Water Scheme 26
13.0 Bottled and Mineral Water Scheme 27
14.0 Hospital Waters - Endoscope Rinse Water Scheme 28
15.0 Hospital Waters - Dialysis Water Scheme 29
16.0 Hospital Waters - Hospital Tap Water 30

FEPTU562.12 Page 3 of 30
Website links for scheme-specific information
FOOD MICROBIOLOGY
Standard Scheme Standard Scheme information
European Food Microbiology Legislation Scheme
European Food Microbiology Legislation Scheme information
Shellfish Scheme Shellfish Scheme information
Non-Pathogen Scheme Non-Pathogen Scheme information
Pathogenic Vibrio Scheme Pathogenic Vibrio Scheme information
Staphylococcus aureus Enterotoxin Scheme
Staphylococcus aureus Enterotoxin Scheme information
Environmental Swab Scheme Environmental Swab Scheme information
Shiga toxin-producing Escherichia coli Scheme
Shiga toxin-producing Escherichia coli scheme information
Norovirus and Hepatitis A Virus Scheme
Norovirus and Hepatitis A Virus Scheme information
WATER MICROBIOLOGY
Legionella Isolation Scheme Legionella Isolation Scheme information
Legionella Molecular Scheme Legionella Molecular Scheme information
Recreational and Surface Water Scheme
Recreational and Surface Water Scheme information
Drinking Water Scheme Drinking Water Scheme information
Bottled and Mineral Water Scheme Bottled and Mineral Water Scheme information
Endoscope Rinse Water Scheme Endoscope Rinse Water Scheme information
Dialysis Water Scheme Dialysis Water Scheme information
Hospital Tap Water Scheme Hospital Tap Water Scheme information
FEPTU562.12 Page 4 of 30
1.0 General introduction This guide is designed to help participants understand the scoring systems and statistics that are used to assist with assessing results reported for the PHE food and water microbiology proficiency testing (PT) schemes. The scoring systems were developed with input from participants and members of the Steering Group and are continually reviewed to ensure fitness-for-purpose. Scores are allocated to participants’ results (irrespective of the method used) to help participants assess their performance not only with a single sample but also over a period of time. Scoring also helps the organisers to recognise those participants who experience problems with the samples and thus allows provision of additional help, advice and support. The allocation of scores draws attention to differences between a participant’s result and what has been designated as the ‘assigned value’. Assigned values for qualitative (presence/absence) examinations are determined from the sample design and the results obtained in the FEPTU (Food and Environmental Proficiency Testing Unit) laboratory, although participants’ results are also considered to help identify anomalies with the sample. Assigned values for enumerations are determined using robust statistics; the participants’ median value is designated the assigned value. Differences of more than 0.3 log10 units (0.55 for Legionella isolation) between the participants’ median and the FEPTU median are investigated. The participants’ median is used rather than the mean because it is affected less by outlying results. Although scores may help participants to identify whether there is a problem with their testing, low or outlying scores do not always mean that this is the case. There will always be differences in laboratory practice; this means that the score allocated for the PT results may not be totally applicable to a particular laboratory situation. For example, a participant may report an outlying result for an enumeration because they use a method that results in a higher recovery than methods used in most other laboratories. In this situation the low score does not indicate a problem but this should be documented, indicating that no corrective actions are required. Participants are advised that if they report outlying results for enumerations and are allocated low scores on single occasions only then they should not be unduly alarmed, although they should still assess the reason(s) for the outlying result. This is particularly important for samples that are likely to contain very low levels of micro-organisms, such as for the Drinking Water, Bottled and Mineral Water, Endoscope Rinse Water, Dialysis Water and Hospital Tap Water Schemes. The allocation of scores is provided as a management tool to help assess performance; it cannot replace assessment of PT results in the context of the individual laboratory. It is important that laboratories plot the trend of their results to identify potential problems. Methods should never be amended for the sole purpose of achieving better scores with PT samples. This document includes a summary of how scores are allocated for each scheme. Scoring systems are not used for the Pathogenic Vibrio and Detection of Staphylococcus aureus Enterotoxin schemes; these are single parameter schemes where it is very easy for participants to determine their performance without the aid of a scoring system. Further guidance about the general use of the PHE PT schemes and advice for dealing with unsatisfactory results are available from the scheme guide: A guide to the use of the PHE Proficiency Testing Schemes for Food and Water Microbiology: https://www.gov.uk/government/publications/food-and-water-proficiency-testing-schemes-scheme-guide 1.0.1 Introduction to the scoring systems PHE scores are allocated for the Standard, Environmental Swab, Shellfish, European Food Microbiology Legislation, Non-Pathogen, Shiga toxin-producing Escherichia coli, Norovirus and Hepatitis A Virus Scheme, Legionella Isolation, Legionella Molecular, Drinking Water, Recreational and Surface Water, Endoscope Rinse Water, Bottled and Mineral Water, Dialysis Water and Hospital Tap Water Schemes to assess performance with every sample and also to assess performance over a period of time. The PHE scoring systems are devised with microbiological outcome as a priority. They are specifically designed to make it easier to identify those laboratories that experience significant and on-going difficulties with their examinations, i.e. difficulties that may ultimately impact on peoples’ health. Each PHE scoring system is tailored to the specific scheme, taking into account the sample designs and the examinations that are included for the scheme.
PHE scoring system recognises that, while every batch of PHE PT samples is fit-for-purpose, every participant will not receive a sample containing exactly the same number of micro-organisms. The samples are designed in such a
FEPTU562.12 Page 5 of 30
way that participants are extremely unlikely to obtain an incorrect negative result for a presence/absence examination by chance. However, for enumeration tests there will be a range of acceptable results, and a laboratory may occasionally report an outlying result by chance. The PHE scoring system for on-going performance assessment is designed to take this into consideration so genuine problems are always identified. It is difficult to provide a meaningful assessment of performance over time using PHE scores if participants choose not to receive all the distributions provided for a particular scheme.
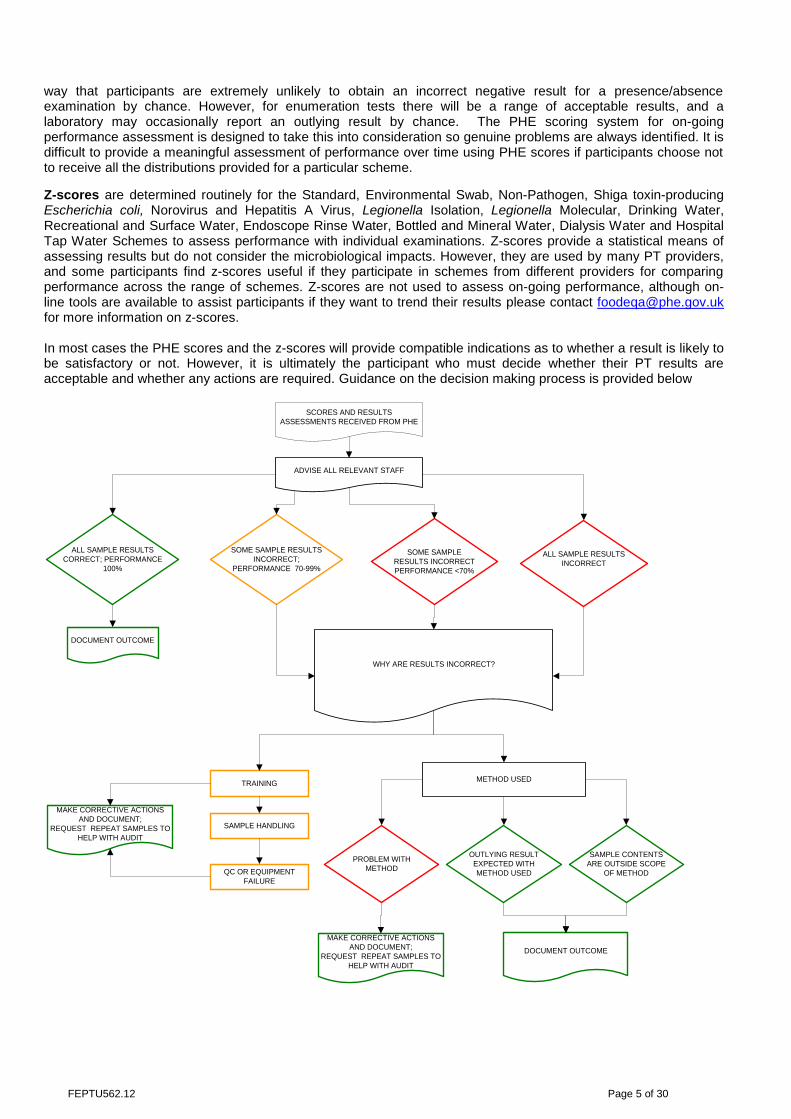
Z-scores are determined routinely for the Standard, Environmental Swab, Non-Pathogen, Shiga toxin-producing Escherichia coli, Norovirus and Hepatitis A Virus, Legionella Isolation, Legionella Molecular, Drinking Water, Recreational and Surface Water, Endoscope Rinse Water, Bottled and Mineral Water, Dialysis Water and Hospital Tap Water Schemes to assess performance with individual examinations. Z-scores provide a statistical means of assessing results but do not consider the microbiological impacts. However, they are used by many PT providers, and some participants find z-scores useful if they participate in schemes from different providers for comparing performance across the range of schemes. Z-scores are not used to assess on-going performance, although on-line tools are available to assist participants if they want to trend their results please contact [email protected] for more information on z-scores. In most cases the PHE scores and the z-scores will provide compatible indications as to whether a result is likely to be satisfactory or not. However, it is ultimately the participant who must decide whether their PT results are acceptable and whether any actions are required. Guidance on the decision making process is provided below
SCORES AND RESULTS
ASSESSMENTS RECEIVED FROM PHE
ADVISE ALL RELEVANT STAFF
ALL SAMPLE RESULTS
CORRECT; PERFORMANCE
100%
TRAINING
SOME SAMPLE RESULTS
INCORRECT;
PERFORMANCE 70-99%
ALL SAMPLE RESULTS
INCORRECT
SOME SAMPLE
RESULTS INCORRECT
PERFORMANCE <70%
WHY ARE RESULTS INCORRECT?
SAMPLE HANDLING
QC OR EQUIPMENT
FAILURE
METHOD USED
MAKE CORRECTIVE ACTIONS
AND DOCUMENT;
REQUEST REPEAT SAMPLES TO
HELP WITH AUDIT
PROBLEM WITH
METHOD
OUTLYING RESULT
EXPECTED WITH
METHOD USED
SAMPLE CONTENTS
ARE OUTSIDE SCOPE
OF METHOD
DOCUMENT OUTCOME
MAKE CORRECTIVE ACTIONS
AND DOCUMENT;
REQUEST REPEAT SAMPLES TO
HELP WITH AUDIT
DOCUMENT OUTCOME

FEPTU562.12 Page 6 of 30
1.0.2 When samples are not scored
The allocation of scores draws attention to differences between reported results and the results that has been designated as the ‘assigned value’. As PT providers we need to be fair when scoring results and work within pre-defined criteria. As a guideline, FEPTU may not score a sample or parameter if:
<80% of the participants obtained the intended results for a pathogen detection method, because this suggests that there may be an issue with the level of the organism in the sample or method limitation
<80% of the enumeration results reported are within the defined expected range (statistically calculated) taking into consideration the lower detection limit of methods used, the tightness of the participants’ results compared to the participants’ median and the number of data sets analysed. For samples containing low levels, zero results may be excluded from the calculations so that a score can still be provided, however this would be done in consultation with PHE’s statistician
A target organism included in the sample gives unexpectedly erroneous results in FEPTU’s ongoing quality control tests, such as atypical morphology on a selective agar or an unusual reaction in a confirmation test and the overall performance by the laboratories is <80%
Quality control tests that continue throughout the distribution period indicate a potential loss of stability in the sample
A target organism (including new strain types) is deliberately included in a sample for educational purpose, for example to raise awareness of an unusual species, morphology or other characteristic
1.1 PHE scores for performance assessment
PHE scores are allocated to results for the Standard, Environmental Swab, Shellfish, European Food Microbiology Legislation, Non-Pathogen, Shiga toxin-producing Escherichia coli, Norovirus and Hepatitis A Virus, Legionella Isolation, Legionella Molecular, Drinking Water, Recreational and Surface Water, Endoscope Rinse Water, Bottled and Mineral Water, Dialysis Water and Hospital Tap Water Schemes. The mechanism for allocating PHE scores is dependent on a number of factors such as the expected number of laboratories participating in a distribution (round) of samples and the nature of the test. PHE scores are allocated per examination for some of the schemes (Environmental Swab, Shellfish, Non-Pathogen, Norovirus and Hepatitis A Virus, Shiga toxin-producing Escherichia coli, Legionella Molecular, Drinking Water, Recreational and Surface Water, Endoscope Rinse Water, Bottled and Mineral Water, Dialysis Water and Hospital Tap Water). For other schemes (Standard, European Food Microbiology Legislation and Legionella Isolation), a composite score may be allocated that takes a number of different factors into consideration. For example in the Legionella isolation scheme the laboratory’s ability to isolate, enumerate, identify and determine the serogroup for a Legionella isolate are considered when the PHE score is allocated. Similarly, when the PHE scores are allocated for samples from the European Food Microbiology Legislation Scheme the process allows consideration of the microbiological results, applicable food category and also the interpretation of those results with regard to the correct part of the relevant EU legislation. Performance assessment forms an integral component for a laboratory to confirm their performance with PT samples. The data can show a trend in performance either with a specific parameter or as an overall examination in a scheme. Laboratories need to determine their own acceptable performance percentage as this will inform laboratories of the actions they need to take when performance is below the expectation. PHE advises to use the PHE scoring system to analyse performance as this has been proven to be more scientifically correct over z-scores. PHE scores are devised in such a way that they can be combined over a period of time; the cumulative results are summarised in the individualised distribution reports. Those laboratories with cumulative scores that are less than 70% of the maximum possible score are likely to have significant underlying problems with their examinations which should be addressed as a matter of urgency. Participants with cumulative scores of between 70% and 99% should also assess why they were allocated lower scores on one or more occasions. Note that the interpretations of PHE scores provided by FEPTU used to assess performance must be applied to the individual laboratory situation before a final conclusion is drawn. Charts are included in the individualised reports for the Standard, European Food Microbiology Legislation, Shellfish, Non-Pathogen, Legionella Isolation, Drinking Water, Endoscope Rinse Water, Bottled and Mineral Water, Dialysis Water and Hospital Tap Water Schemes to summarise performance over time, with colour-coded bars to draw attention to those scores that indicate potential problems with the examination results.
FEPTU562.12 Page 7 of 30
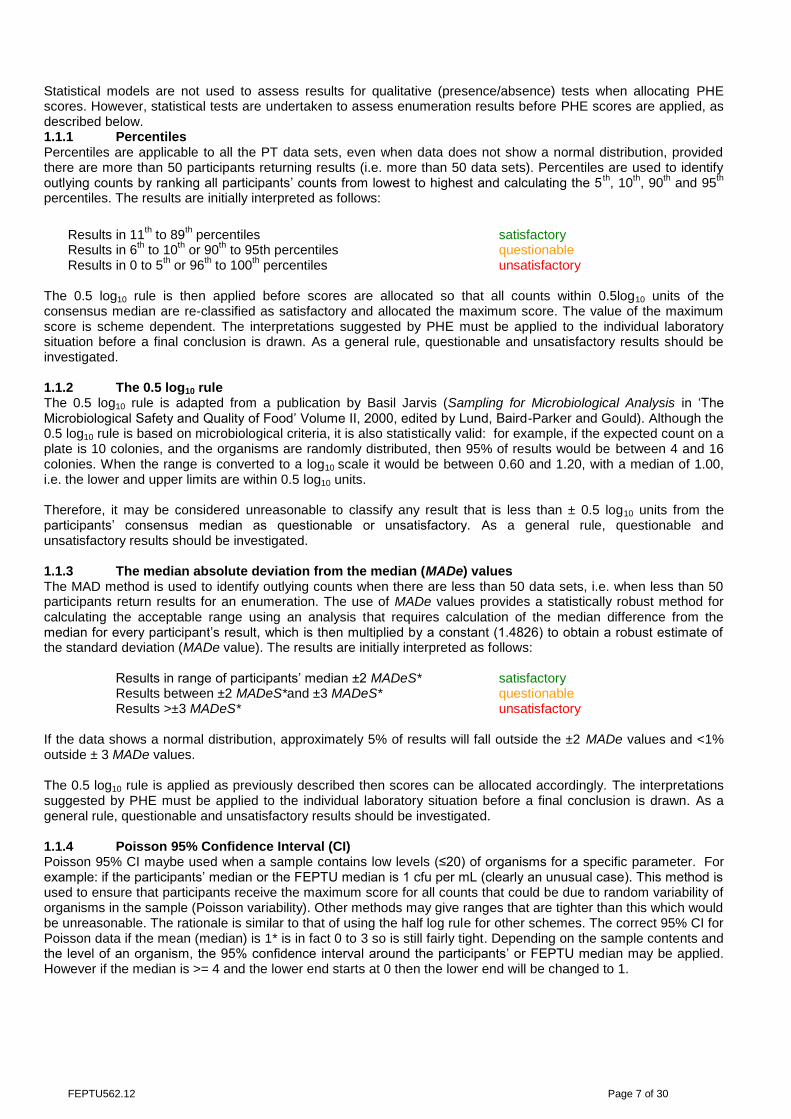
Statistical models are not used to assess results for qualitative (presence/absence) tests when allocating PHE scores. However, statistical tests are undertaken to assess enumeration results before PHE scores are applied, as described below. 1.1.1 Percentiles Percentiles are applicable to all the PT data sets, even when data does not show a normal distribution, provided there are more than 50 participants returning results (i.e. more than 50 data sets). Percentiles are used to identify outlying counts by ranking all participants’ counts from lowest to highest and calculating the 5
th, 10
th, 90
th and 95
th
percentiles. The results are initially interpreted as follows:
Results in 11th to 89
th percentiles satisfactory
Results in 6th to 10
th or 90
th to 95th percentiles questionable
Results in 0 to 5th or 96
th to 100
th percentiles unsatisfactory
The 0.5 log10 rule is then applied before scores are allocated so that all counts within 0.5log10 units of the consensus median are re-classified as satisfactory and allocated the maximum score. The value of the maximum score is scheme dependent. The interpretations suggested by PHE must be applied to the individual laboratory situation before a final conclusion is drawn. As a general rule, questionable and unsatisfactory results should be investigated. 1.1.2 The 0.5 log10 rule The 0.5 log10 rule is adapted from a publication by Basil Jarvis (Sampling for Microbiological Analysis in ‘The Microbiological Safety and Quality of Food’ Volume II, 2000, edited by Lund, Baird-Parker and Gould). Although the 0.5 log10 rule is based on microbiological criteria, it is also statistically valid: for example, if the expected count on a plate is 10 colonies, and the organisms are randomly distributed, then 95% of results would be between 4 and 16 colonies. When the range is converted to a log10 scale it would be between 0.60 and 1.20, with a median of 1.00, i.e. the lower and upper limits are within 0.5 log10 units. Therefore, it may be considered unreasonable to classify any result that is less than ± 0.5 log10 units from the participants’ consensus median as questionable or unsatisfactory. As a general rule, questionable and unsatisfactory results should be investigated. 1.1.3 The median absolute deviation from the median (MADe) values The MAD method is used to identify outlying counts when there are less than 50 data sets, i.e. when less than 50 participants return results for an enumeration. The use of MADe values provides a statistically robust method for calculating the acceptable range using an analysis that requires calculation of the median difference from the median for every participant’s result, which is then multiplied by a constant (1.4826) to obtain a robust estimate of the standard deviation (MADe value). The results are initially interpreted as follows: Results in range of participants’ median ±2 MADeS* satisfactory
Results between ±2 MADeS*and ±3 MADeS* questionable Results >±3 MADeS* unsatisfactory
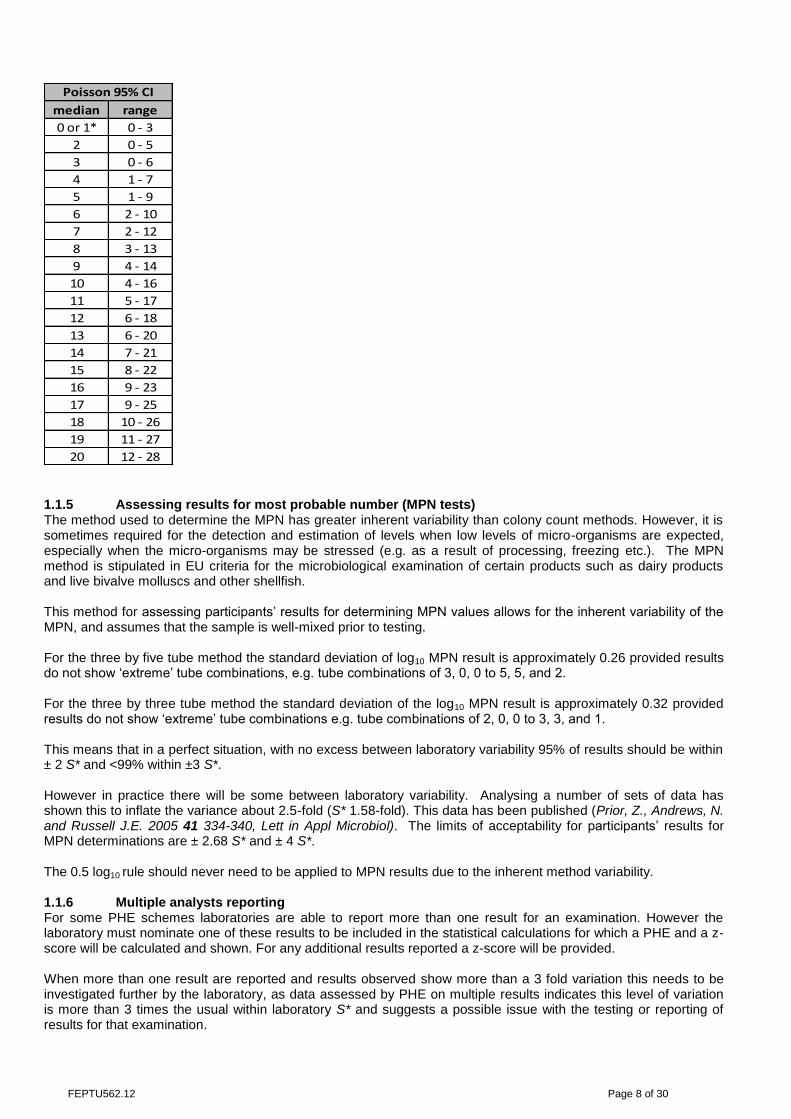
If the data shows a normal distribution, approximately 5% of results will fall outside the ±2 MADe values and <1% outside ± 3 MADe values. The 0.5 log10 rule is applied as previously described then scores can be allocated accordingly. The interpretations suggested by PHE must be applied to the individual laboratory situation before a final conclusion is drawn. As a general rule, questionable and unsatisfactory results should be investigated. 1.1.4 Poisson 95% Confidence Interval (CI) Poisson 95% CI maybe used when a sample contains low levels (≤20) of organisms for a specific parameter. For example: if the participants’ median or the FEPTU median is 1 cfu per mL (clearly an unusual case). This method is used to ensure that participants receive the maximum score for all counts that could be due to random variability of organisms in the sample (Poisson variability). Other methods may give ranges that are tighter than this which would be unreasonable. The rationale is similar to that of using the half log rule for other schemes. The correct 95% CI for Poisson data if the mean (median) is 1* is in fact 0 to 3 so is still fairly tight. Depending on the sample contents and the level of an organism, the 95% confidence interval around the participants’ or FEPTU median may be applied. However if the median is >= 4 and the lower end starts at 0 then the lower end will be changed to 1.
FEPTU562.12 Page 8 of 30
1.1.5 Assessing results for most probable number (MPN tests) The method used to determine the MPN has greater inherent variability than colony count methods. However, it is sometimes required for the detection and estimation of levels when low levels of micro-organisms are expected, especially when the micro-organisms may be stressed (e.g. as a result of processing, freezing etc.). The MPN method is stipulated in EU criteria for the microbiological examination of certain products such as dairy products and live bivalve molluscs and other shellfish. This method for assessing participants’ results for determining MPN values allows for the inherent variability of the MPN, and assumes that the sample is well-mixed prior to testing. For the three by five tube method the standard deviation of log10 MPN result is approximately 0.26 provided results do not show ‘extreme’ tube combinations, e.g. tube combinations of 3, 0, 0 to 5, 5, and 2. For the three by three tube method the standard deviation of the log10 MPN result is approximately 0.32 provided results do not show ‘extreme’ tube combinations e.g. tube combinations of 2, 0, 0 to 3, 3, and 1. This means that in a perfect situation, with no excess between laboratory variability 95% of results should be within ± 2 S* and <99% within ±3 S*. However in practice there will be some between laboratory variability. Analysing a number of sets of data has shown this to inflate the variance about 2.5-fold (S* 1.58-fold). This data has been published (Prior, Z., Andrews, N. and Russell J.E. 2005 41 334-340, Lett in Appl Microbiol). The limits of acceptability for participants’ results for MPN determinations are ± 2.68 S* and ± 4 S*. The 0.5 log10 rule should never need to be applied to MPN results due to the inherent method variability. 1.1.6 Multiple analysts reporting For some PHE schemes laboratories are able to report more than one result for an examination. However the laboratory must nominate one of these results to be included in the statistical calculations for which a PHE and a z-score will be calculated and shown. For any additional results reported a z-score will be provided. When more than one result are reported and results observed show more than a 3 fold variation this needs to be investigated further by the laboratory, as data assessed by PHE on multiple results indicates this level of variation is more than 3 times the usual within laboratory S* and suggests a possible issue with the testing or reporting of results for that examination.
median range
0 or 1* 0 - 3
2 0 - 5
3 0 - 6
4 1 - 7
5 1 - 9
6 2 - 10
7 2 - 12
8 3 - 13
9 4 - 14
10 4 - 16
11 5 - 17
12 6 - 18
13 6 - 20
14 7 - 21
15 8 - 22
16 9 - 23
17 9 - 25
18 10 - 26
19 11 - 27
20 12 - 28
Poisson 95% CI
FEPTU562.12 Page 9 of 30
1.1.7 Summary of PHE scores Sections 2.0 to 13.0 of this document summarise the specific details of how PHE scores are allocated for each of the schemes. Participants are advised in advance, by email, of any changes to the scoring systems. If a sample includes atypical micro-organisms or is sent out for the first time in a distribution, this may be considered as educational and scores may not be allocated. This decision is normally made in advance by the scheme organiser. If the results for a sample are not as expected, either in the FEPTU laboratory or after analysis of the results submitted by participants, then the organisers may decide not to allocate PHE scores. This will be explained in the relevant distribution report.
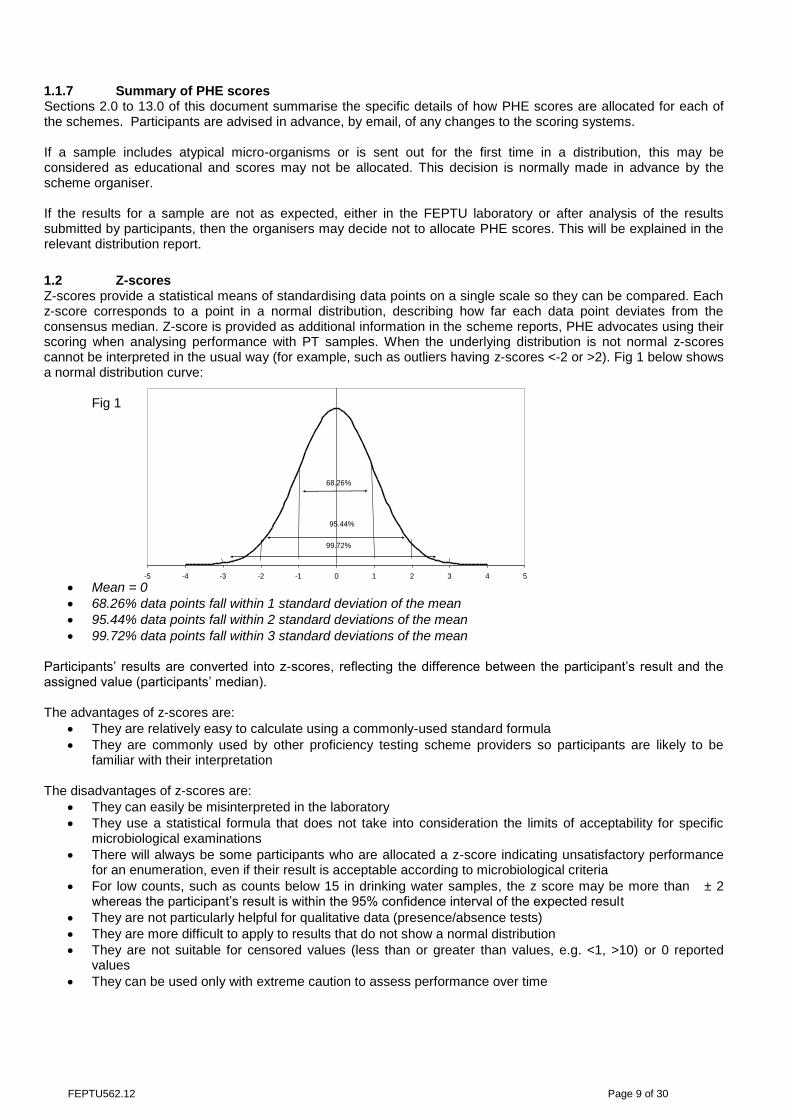
1.2 Z-scores Z-scores provide a statistical means of standardising data points on a single scale so they can be compared. Each z-score corresponds to a point in a normal distribution, describing how far each data point deviates from the consensus median. Z-score is provided as additional information in the scheme reports, PHE advocates using their scoring when analysing performance with PT samples. When the underlying distribution is not normal z-scores cannot be interpreted in the usual way (for example, such as outliers having z-scores <-2 or >2). Fig 1 below shows a normal distribution curve:
Fig 1
Mean = 0
68.26% data points fall within 1 standard deviation of the mean
95.44% data points fall within 2 standard deviations of the mean
99.72% data points fall within 3 standard deviations of the mean Participants’ results are converted into z-scores, reflecting the difference between the participant’s result and the assigned value (participants’ median). The advantages of z-scores are:
They are relatively easy to calculate using a commonly-used standard formula
They are commonly used by other proficiency testing scheme providers so participants are likely to be familiar with their interpretation
The disadvantages of z-scores are:
They can easily be misinterpreted in the laboratory
They use a statistical formula that does not take into consideration the limits of acceptability for specific microbiological examinations
There will always be some participants who are allocated a z-score indicating unsatisfactory performance for an enumeration, even if their result is acceptable according to microbiological criteria
For low counts, such as counts below 15 in drinking water samples, the z score may be more than ± 2 whereas the participant’s result is within the 95% confidence interval of the expected result
They are not particularly helpful for qualitative data (presence/absence tests)
They are more difficult to apply to results that do not show a normal distribution
They are not suitable for censored values (less than or greater than values, e.g. <1, >10) or 0 reported values
They can be used only with extreme caution to assess performance over time
-5 -4 -3 -2 -1 0 1 2 3 4 5
68.26%
95.44%
99.72%
FEPTU562.12 Page 10 of 30
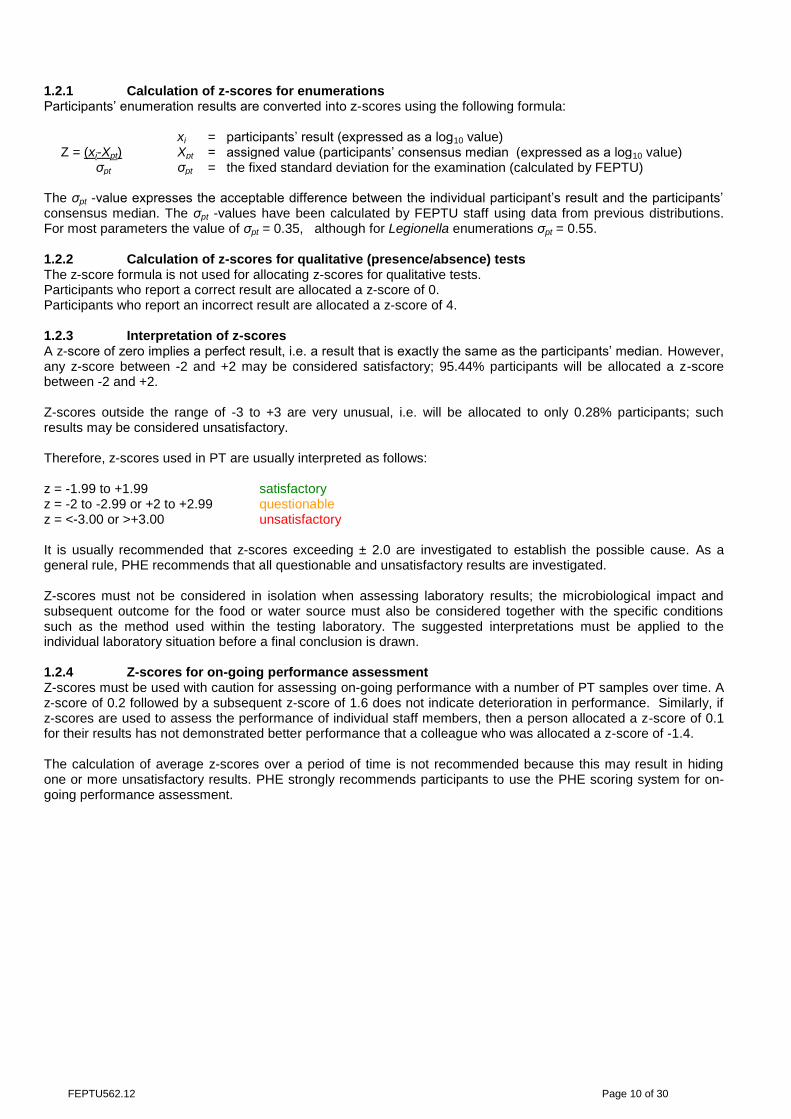
1.2.1 Calculation of z-scores for enumerations Participants’ enumeration results are converted into z-scores using the following formula:
Z = (xi-Xpt) σpt
xi = participants’ result (expressed as a log10 value) Xpt = assigned value (participants’ consensus median (expressed as a log10 value) σpt = the fixed standard deviation for the examination (calculated by FEPTU)
The σpt -value expresses the acceptable difference between the individual participant’s result and the participants’ consensus median. The σpt -values have been calculated by FEPTU staff using data from previous distributions. For most parameters the value of σpt = 0.35, although for Legionella enumerations σpt = 0.55. 1.2.2 Calculation of z-scores for qualitative (presence/absence) tests The z-score formula is not used for allocating z-scores for qualitative tests. Participants who report a correct result are allocated a z-score of 0. Participants who report an incorrect result are allocated a z-score of 4. 1.2.3 Interpretation of z-scores A z-score of zero implies a perfect result, i.e. a result that is exactly the same as the participants’ median. However, any z-score between -2 and +2 may be considered satisfactory; 95.44% participants will be allocated a z-score between -2 and +2. Z-scores outside the range of -3 to +3 are very unusual, i.e. will be allocated to only 0.28% participants; such results may be considered unsatisfactory. Therefore, z-scores used in PT are usually interpreted as follows: z = -1.99 to +1.99 satisfactory z = -2 to -2.99 or +2 to +2.99 questionable z = <-3.00 or >+3.00 unsatisfactory It is usually recommended that z-scores exceeding ± 2.0 are investigated to establish the possible cause. As a general rule, PHE recommends that all questionable and unsatisfactory results are investigated. Z-scores must not be considered in isolation when assessing laboratory results; the microbiological impact and subsequent outcome for the food or water source must also be considered together with the specific conditions such as the method used within the testing laboratory. The suggested interpretations must be applied to the individual laboratory situation before a final conclusion is drawn. 1.2.4 Z-scores for on-going performance assessment Z-scores must be used with caution for assessing on-going performance with a number of PT samples over time. A z-score of 0.2 followed by a subsequent z-score of 1.6 does not indicate deterioration in performance. Similarly, if z-scores are used to assess the performance of individual staff members, then a person allocated a z-score of 0.1 for their results has not demonstrated better performance that a colleague who was allocated a z-score of -1.4. The calculation of average z-scores over a period of time is not recommended because this may result in hiding one or more unsatisfactory results. PHE strongly recommends participants to use the PHE scoring system for on- going performance assessment.
FEPTU562.12 Page 11 of 30
PHE scoring systems by scheme:
2.0 Standard Scheme:
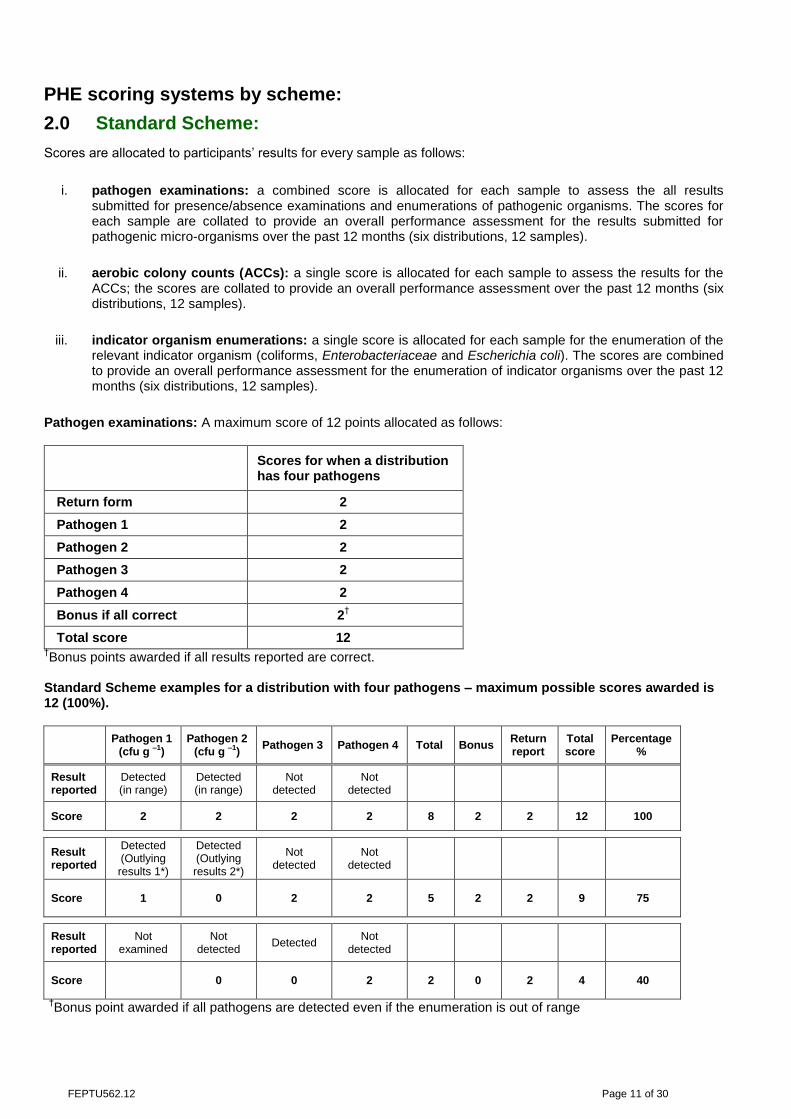
Scores are allocated to participants’ results for every sample as follows:
i. pathogen examinations: a combined score is allocated for each sample to assess the all results
submitted for presence/absence examinations and enumerations of pathogenic organisms. The scores for each sample are collated to provide an overall performance assessment for the results submitted for pathogenic micro-organisms over the past 12 months (six distributions, 12 samples).
ii. aerobic colony counts (ACCs): a single score is allocated for each sample to assess the results for the ACCs; the scores are collated to provide an overall performance assessment over the past 12 months (six distributions, 12 samples).
iii. indicator organism enumerations: a single score is allocated for each sample for the enumeration of the
relevant indicator organism (coliforms, Enterobacteriaceae and Escherichia coli). The scores are combined to provide an overall performance assessment for the enumeration of indicator organisms over the past 12 months (six distributions, 12 samples).
Pathogen examinations: A maximum score of 12 points allocated as follows:
Scores for when a distribution has four pathogens
Return form 2
Pathogen 1 2
Pathogen 2 2
Pathogen 3 2
Pathogen 4 2
Bonus if all correct 2†
Total score 12 †Bonus points awarded if all results reported are correct.
Standard Scheme examples for a distribution with four pathogens – maximum possible scores awarded is 12 (100%).
Pathogen 1
(cfu g –1) Pathogen 2
(cfu g –1) Pathogen 3 Pathogen 4 Total Bonus
Return report
Total score
Percentage %
Result reported
Detected (in range)
Detected (in range)
Not detected
Not detected
Score 2 2 2 2 8 2 2 12 100
Result reported
Detected (Outlying results 1*)
Detected (Outlying results 2*)
Not detected
Not detected
Score 1 0 2 2 5 2 2 9 75
Result reported
Not examined
Not detected
Detected Not
detected
Score 0 0 2 2 0 2 4 40
†Bonus point awarded if all pathogens are detected even if the enumeration is out of range
FEPTU562.12 Page 12 of 30
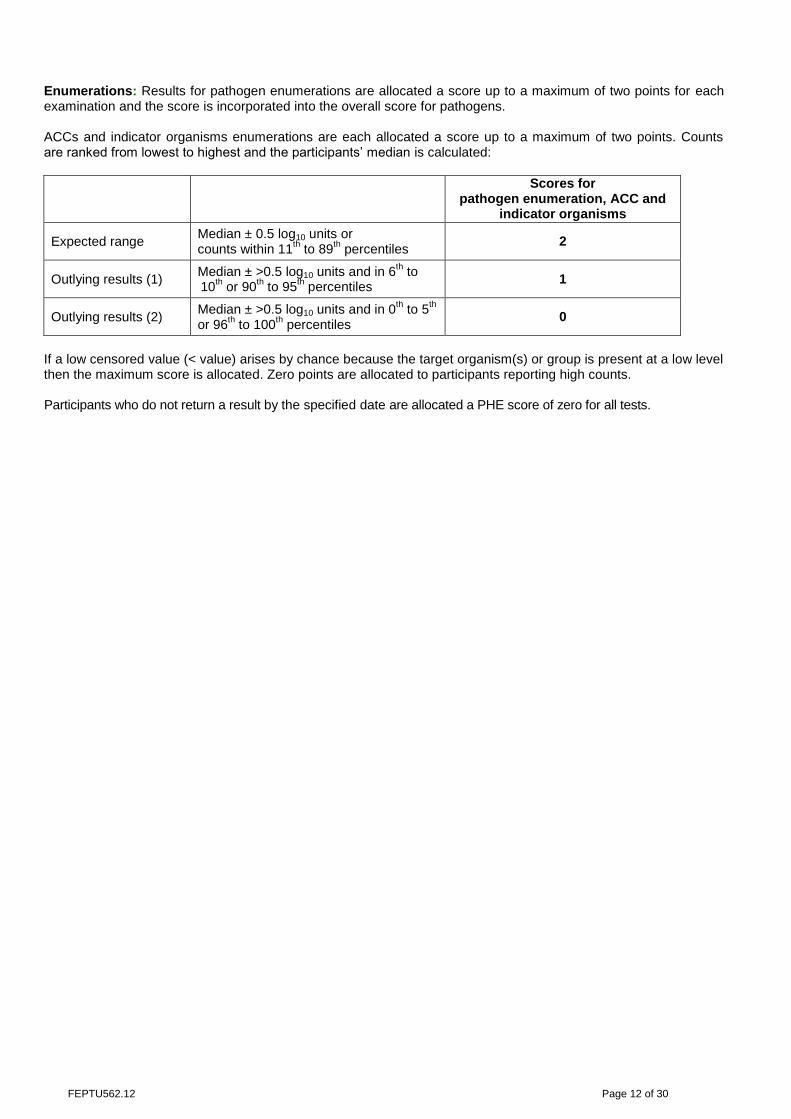
Enumerations: Results for pathogen enumerations are allocated a score up to a maximum of two points for each examination and the score is incorporated into the overall score for pathogens. ACCs and indicator organisms enumerations are each allocated a score up to a maximum of two points. Counts are ranked from lowest to highest and the participants’ median is calculated:
Scores for pathogen enumeration, ACC and
indicator organisms
Expected range Median ± 0.5 log10 units or counts within 11
th to 89
th percentiles
2
Outlying results (1) Median ± >0.5 log10 units and in 6
th to
10th or 90
th to 95
th percentiles
1
Outlying results (2) Median ± >0.5 log10 units and in 0
th to 5
th
or 96th to 100
th percentiles
0
If a low censored value (< value) arises by chance because the target organism(s) or group is present at a low level then the maximum score is allocated. Zero points are allocated to participants reporting high counts. Participants who do not return a result by the specified date are allocated a PHE score of zero for all tests.
FEPTU562.12 Page 13 of 30
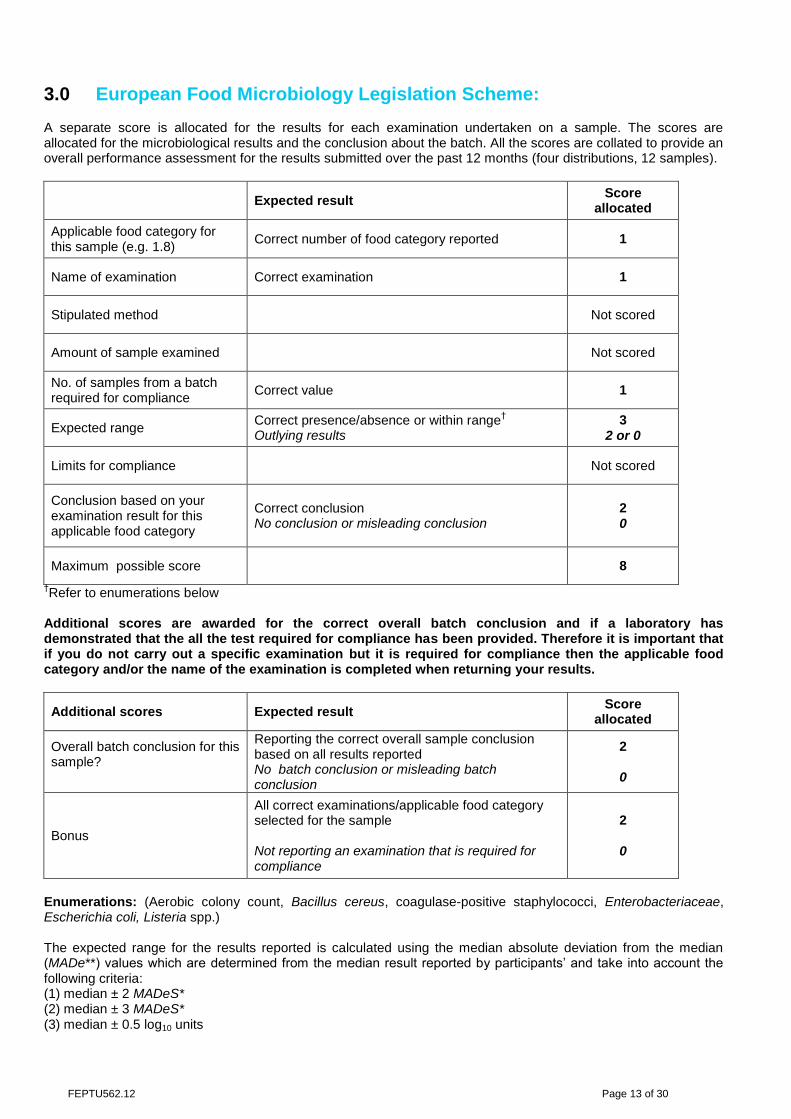
3.0 European Food Microbiology Legislation Scheme: A separate score is allocated for the results for each examination undertaken on a sample. The scores are allocated for the microbiological results and the conclusion about the batch. All the scores are collated to provide an overall performance assessment for the results submitted over the past 12 months (four distributions, 12 samples).
Expected result
Score allocated
Applicable food category for this sample (e.g. 1.8)
Correct number of food category reported 1
Name of examination Correct examination 1
Stipulated method Not scored
Amount of sample examined Not scored
No. of samples from a batch required for compliance
Correct value 1
Expected range Correct presence/absence or within range
†
Outlying results 3
2 or 0
Limits for compliance Not scored
Conclusion based on your examination result for this applicable food category
Correct conclusion No conclusion or misleading conclusion
2 0
Maximum possible score 8
†Refer to enumerations below
Additional scores are awarded for the correct overall batch conclusion and if a laboratory has demonstrated that the all the test required for compliance has been provided. Therefore it is important that if you do not carry out a specific examination but it is required for compliance then the applicable food category and/or the name of the examination is completed when returning your results.
Additional scores Expected result Score
allocated
Overall batch conclusion for this sample?
Reporting the correct overall sample conclusion based on all results reported No batch conclusion or misleading batch conclusion
2 0
Bonus
All correct examinations/applicable food category selected for the sample Not reporting an examination that is required for compliance
2 0
Enumerations: (Aerobic colony count, Bacillus cereus, coagulase-positive staphylococci, Enterobacteriaceae, Escherichia coli, Listeria spp.) The expected range for the results reported is calculated using the median absolute deviation from the median (MADe**) values which are determined from the median result reported by participants’ and take into account the following criteria: (1) median ± 2 MADeS* (2) median ± 3 MADeS* (3) median ± 0.5 log10 units
FEPTU562.12 Page 14 of 30
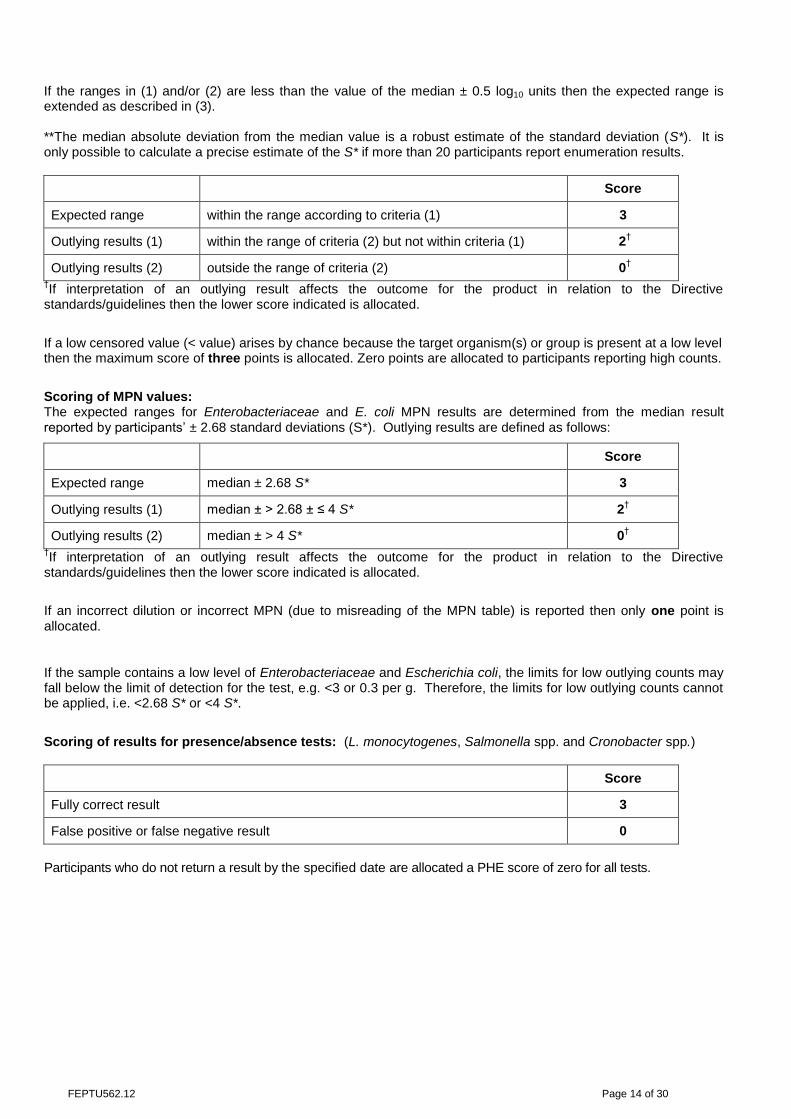
If the ranges in (1) and/or (2) are less than the value of the median ± 0.5 log10 units then the expected range is extended as described in (3). **The median absolute deviation from the median value is a robust estimate of the standard deviation (S*). It is only possible to calculate a precise estimate of the S* if more than 20 participants report enumeration results.
Score
Expected range within the range according to criteria (1) 3
Outlying results (1) within the range of criteria (2) but not within criteria (1) 2†
Outlying results (2) outside the range of criteria (2) 0†
†If interpretation of an outlying result affects the outcome for the product in relation to the Directive
standards/guidelines then the lower score indicated is allocated.
If a low censored value (< value) arises by chance because the target organism(s) or group is present at a low level then the maximum score of three points is allocated. Zero points are allocated to participants reporting high counts.
Scoring of MPN values: The expected ranges for Enterobacteriaceae and E. coli MPN results are determined from the median result reported by participants’ ± 2.68 standard deviations (S*). Outlying results are defined as follows:
Score
Expected range median ± 2.68 S* 3
Outlying results (1) median ± > 2.68 ± ≤ 4 S* 2†
Outlying results (2) median ± > 4 S* 0†
†If interpretation of an outlying result affects the outcome for the product in relation to the Directive
standards/guidelines then the lower score indicated is allocated.
If an incorrect dilution or incorrect MPN (due to misreading of the MPN table) is reported then only one point is allocated.
If the sample contains a low level of Enterobacteriaceae and Escherichia coli, the limits for low outlying counts may fall below the limit of detection for the test, e.g. <3 or 0.3 per g. Therefore, the limits for low outlying counts cannot be applied, i.e. <2.68 S* or <4 S*.
Scoring of results for presence/absence tests: (L. monocytogenes, Salmonella spp. and Cronobacter spp.)
Score
Fully correct result 3
False positive or false negative result 0
Participants who do not return a result by the specified date are allocated a PHE score of zero for all tests.
FEPTU562.12 Page 15 of 30
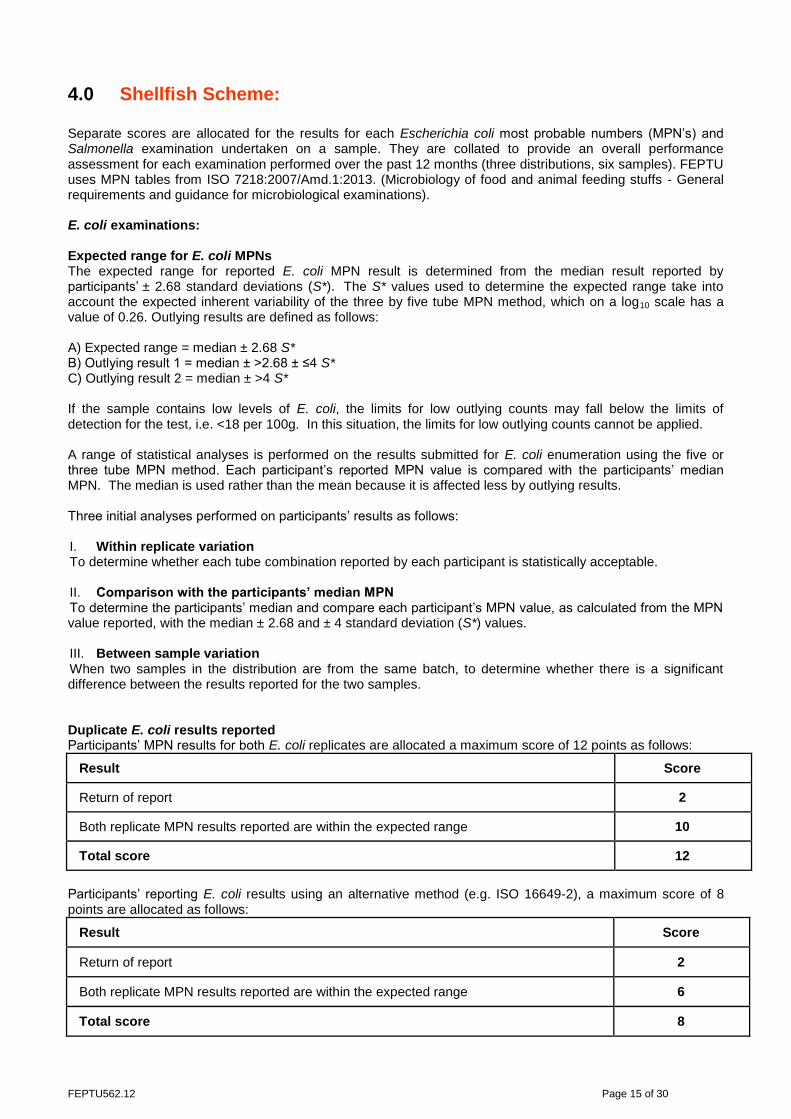
4.0 Shellfish Scheme: Separate scores are allocated for the results for each Escherichia coli most probable numbers (MPN’s) and Salmonella examination undertaken on a sample. They are collated to provide an overall performance assessment for each examination performed over the past 12 months (three distributions, six samples). FEPTU uses MPN tables from ISO 7218:2007/Amd.1:2013. (Microbiology of food and animal feeding stuffs - General requirements and guidance for microbiological examinations). E. coli examinations: Expected range for E. coli MPNs The expected range for reported E. coli MPN result is determined from the median result reported by participants’ ± 2.68 standard deviations (S*). The S* values used to determine the expected range take into account the expected inherent variability of the three by five tube MPN method, which on a log10 scale has a value of 0.26. Outlying results are defined as follows: A) Expected range = median ± 2.68 S* B) Outlying result 1 = median ± >2.68 ± ≤4 S* C) Outlying result 2 = median ± >4 S* If the sample contains low levels of E. coli, the limits for low outlying counts may fall below the limits of detection for the test, i.e. <18 per 100g. In this situation, the limits for low outlying counts cannot be applied. A range of statistical analyses is performed on the results submitted for E. coli enumeration using the five or three tube MPN method. Each participant’s reported MPN value is compared with the participants’ median MPN. The median is used rather than the mean because it is affected less by outlying results. Three initial analyses performed on participants’ results as follows: I. Within replicate variation To determine whether each tube combination reported by each participant is statistically acceptable. II. Comparison with the participants’ median MPN To determine the participants’ median and compare each participant’s MPN value, as calculated from the MPN value reported, with the median ± 2.68 and ± 4 standard deviation (S*) values. III. Between sample variation When two samples in the distribution are from the same batch, to determine whether there is a significant difference between the results reported for the two samples. Duplicate E. coli results reported Participants’ MPN results for both E. coli replicates are allocated a maximum score of 12 points as follows:
Result Score
Return of report 2
Both replicate MPN results reported are within the expected range 10
Total score 12
Participants’ reporting E. coli results using an alternative method (e.g. ISO 16649-2), a maximum score of 8 points are allocated as follows:
Result Score
Return of report 2
Both replicate MPN results reported are within the expected range 6
Total score 8
FEPTU562.12 Page 16 of 30
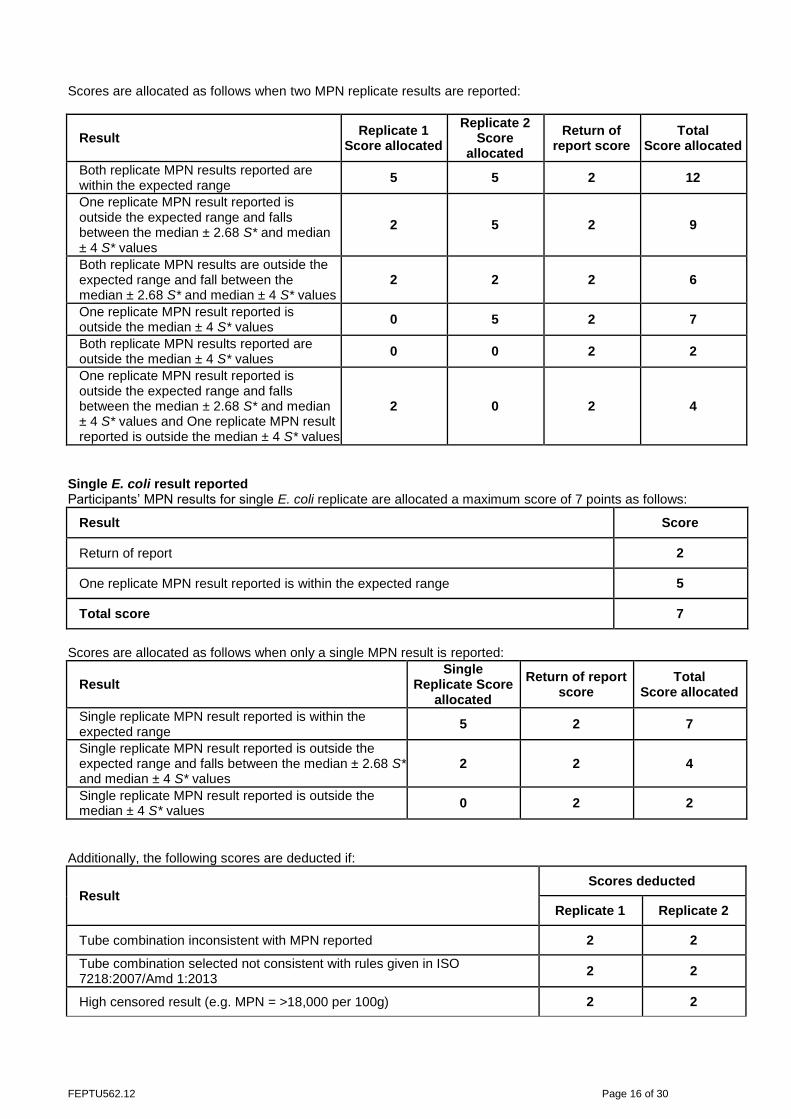
Scores are allocated as follows when two MPN replicate results are reported:
Result Replicate 1
Score allocated
Replicate 2 Score
allocated
Return of report score
Total Score allocated
Both replicate MPN results reported are within the expected range
5 5 2 12
One replicate MPN result reported is outside the expected range and falls between the median ± 2.68 S* and median ± 4 S* values
2 5 2 9
Both replicate MPN results are outside the expected range and fall between the median ± 2.68 S* and median ± 4 S* values
2 2 2 6
One replicate MPN result reported is outside the median ± 4 S* values
0 5 2 7
Both replicate MPN results reported are outside the median ± 4 S* values
0 0 2 2
One replicate MPN result reported is outside the expected range and falls between the median ± 2.68 S* and median ± 4 S* values and One replicate MPN result reported is outside the median ± 4 S* values
2 0 2 4
Single E. coli result reported Participants’ MPN results for single E. coli replicate are allocated a maximum score of 7 points as follows:
Result Score
Return of report 2
One replicate MPN result reported is within the expected range 5
Total score 7
Scores are allocated as follows when only a single MPN result is reported:
Result Single
Replicate Score allocated
Return of report score
Total Score allocated
Single replicate MPN result reported is within the expected range
5 2 7
Single replicate MPN result reported is outside the expected range and falls between the median ± 2.68 S* and median ± 4 S* values
2 2 4
Single replicate MPN result reported is outside the median ± 4 S* values
0 2 2
Additionally, the following scores are deducted if:
Result Scores deducted
Replicate 1 Replicate 2
Tube combination inconsistent with MPN reported 2 2
Tube combination selected not consistent with rules given in ISO 7218:2007/Amd 1:2013
2 2
High censored result (e.g. MPN = >18,000 per 100g) 2 2

FEPTU562.12 Page 17 of 30
Salmonella examinations: Participants’ results for examinations for Salmonella spp. are allocated scores up to a maximum of two points as follows:
Result Score
Fully correct result 2
False positive or false negative result 0
Participants who do not return a result by the specified date are allocated a PHE score of zero for all tests.
FEPTU562.12 Page 18 of 30
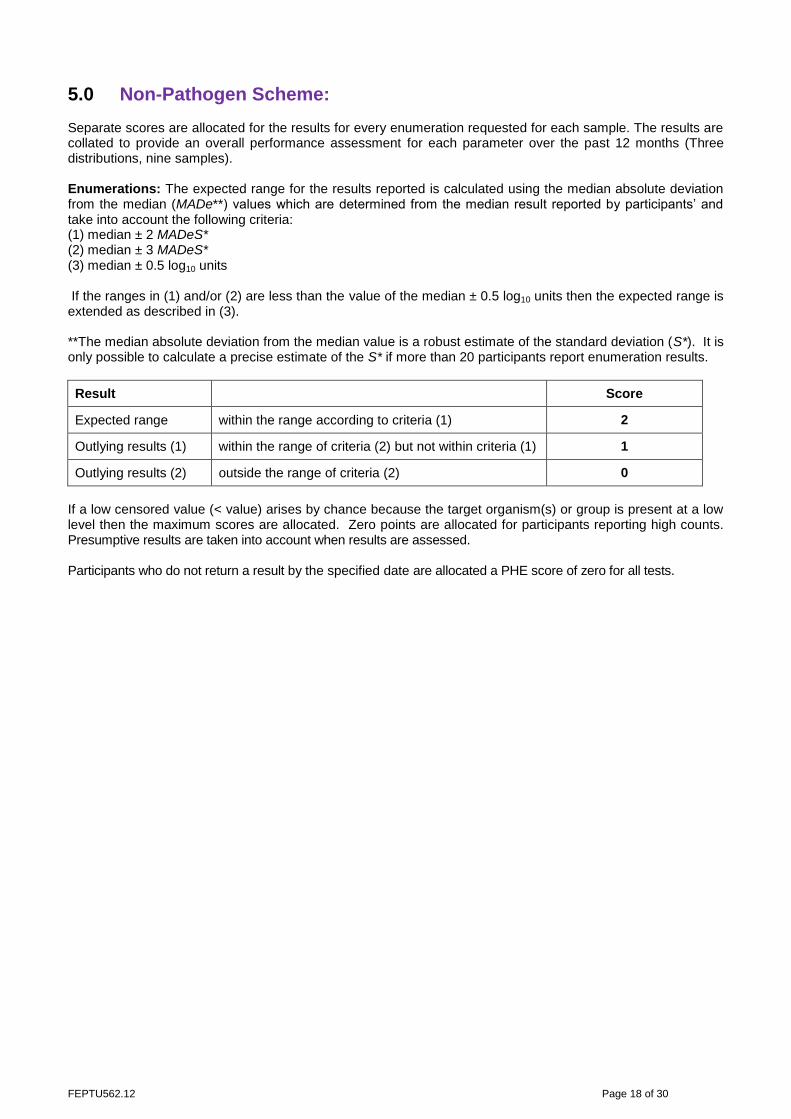
5.0 Non-Pathogen Scheme:
Separate scores are allocated for the results for every enumeration requested for each sample. The results are collated to provide an overall performance assessment for each parameter over the past 12 months (Three distributions, nine samples). Enumerations: The expected range for the results reported is calculated using the median absolute deviation from the median (MADe**) values which are determined from the median result reported by participants’ and take into account the following criteria: (1) median ± 2 MADeS* (2) median ± 3 MADeS* (3) median ± 0.5 log10 units If the ranges in (1) and/or (2) are less than the value of the median ± 0.5 log10 units then the expected range is extended as described in (3). **The median absolute deviation from the median value is a robust estimate of the standard deviation (S*). It is only possible to calculate a precise estimate of the S* if more than 20 participants report enumeration results.
Result Score
Expected range within the range according to criteria (1) 2
Outlying results (1) within the range of criteria (2) but not within criteria (1) 1
Outlying results (2) outside the range of criteria (2) 0
If a low censored value (< value) arises by chance because the target organism(s) or group is present at a low level then the maximum scores are allocated. Zero points are allocated for participants reporting high counts. Presumptive results are taken into account when results are assessed. Participants who do not return a result by the specified date are allocated a PHE score of zero for all tests.
FEPTU562.12 Page 19 of 30
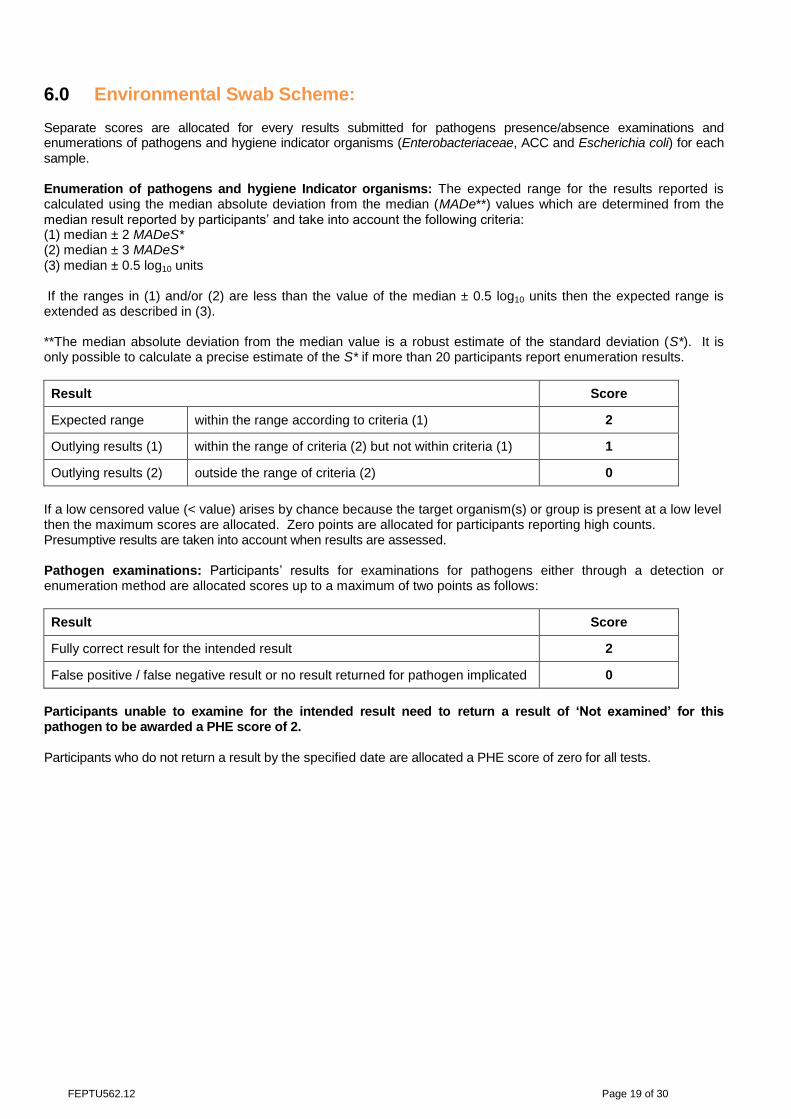
6.0 Environmental Swab Scheme: Separate scores are allocated for every results submitted for pathogens presence/absence examinations and enumerations of pathogens and hygiene indicator organisms (Enterobacteriaceae, ACC and Escherichia coli) for each sample. Enumeration of pathogens and hygiene Indicator organisms: The expected range for the results reported is calculated using the median absolute deviation from the median (MADe**) values which are determined from the median result reported by participants’ and take into account the following criteria: (1) median ± 2 MADeS* (2) median ± 3 MADeS* (3) median ± 0.5 log10 units If the ranges in (1) and/or (2) are less than the value of the median ± 0.5 log10 units then the expected range is extended as described in (3). **The median absolute deviation from the median value is a robust estimate of the standard deviation (S*). It is only possible to calculate a precise estimate of the S* if more than 20 participants report enumeration results.
Result Score
Expected range within the range according to criteria (1) 2
Outlying results (1) within the range of criteria (2) but not within criteria (1) 1
Outlying results (2) outside the range of criteria (2) 0
If a low censored value (< value) arises by chance because the target organism(s) or group is present at a low level then the maximum scores are allocated. Zero points are allocated for participants reporting high counts. Presumptive results are taken into account when results are assessed. Pathogen examinations: Participants’ results for examinations for pathogens either through a detection or enumeration method are allocated scores up to a maximum of two points as follows:
Result Score
Fully correct result for the intended result 2
False positive / false negative result or no result returned for pathogen implicated 0
Participants unable to examine for the intended result need to return a result of ‘Not examined’ for this pathogen to be awarded a PHE score of 2. Participants who do not return a result by the specified date are allocated a PHE score of zero for all tests.

FEPTU562.12 Page 20 of 30
7.0 Shiga toxin-producing Escherichia coli Scheme Participants’ results for detection of shiga toxin-producing Escherichia coli virulence genes by molecular methods are allocated scores up to a maximum of two points for each as follows:
Result Score
Fully correct result for the intended result 2
False positive / false negative result 0
Participants who do not return a result by the specified date are allocated a PHE score of zero for all tests.
FEPTU562.12 Page 21 of 30
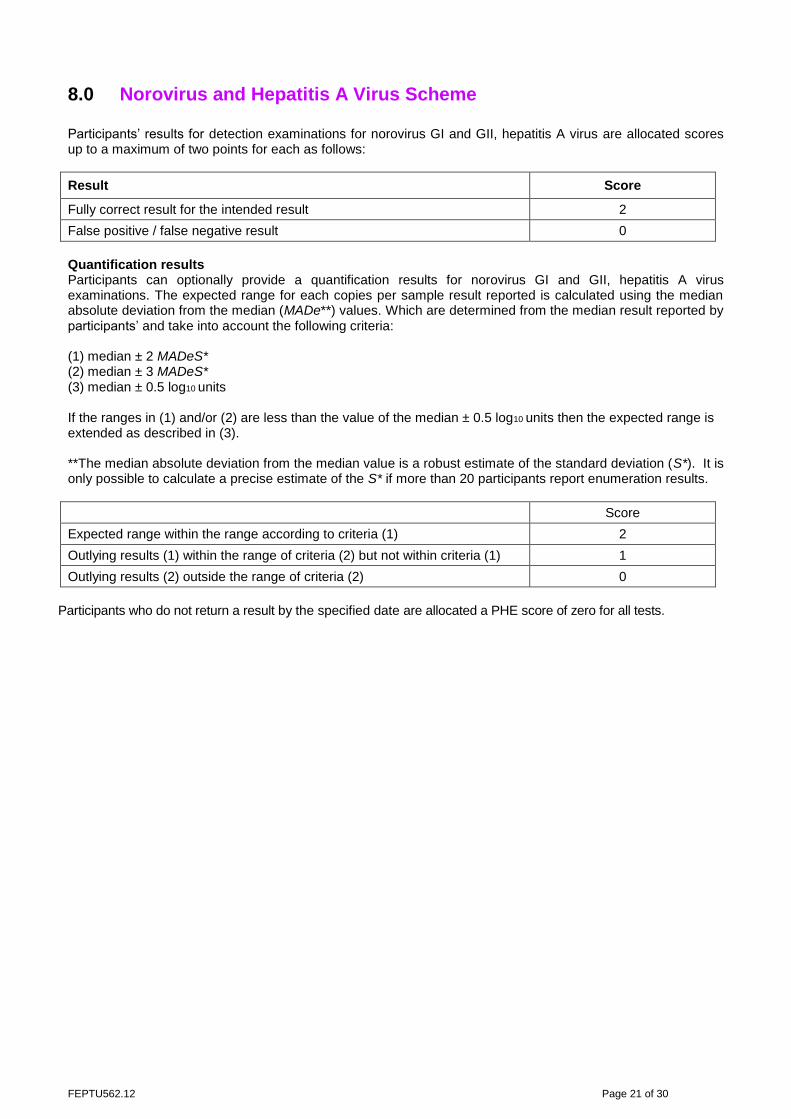
8.0 Norovirus and Hepatitis A Virus Scheme Participants’ results for detection examinations for norovirus GI and GII, hepatitis A virus are allocated scores up to a maximum of two points for each as follows:
Result Score
Fully correct result for the intended result 2
False positive / false negative result 0
Quantification results Participants can optionally provide a quantification results for norovirus GI and GII, hepatitis A virus examinations. The expected range for each copies per sample result reported is calculated using the median absolute deviation from the median (MADe**) values. Which are determined from the median result reported by participants’ and take into account the following criteria: (1) median ± 2 MADeS* (2) median ± 3 MADeS* (3) median ± 0.5 log10 units If the ranges in (1) and/or (2) are less than the value of the median ± 0.5 log10 units then the expected range is extended as described in (3). **The median absolute deviation from the median value is a robust estimate of the standard deviation (S*). It is only possible to calculate a precise estimate of the S* if more than 20 participants report enumeration results.
Score
Expected range within the range according to criteria (1) 2
Outlying results (1) within the range of criteria (2) but not within criteria (1) 1
Outlying results (2) outside the range of criteria (2) 0
Participants who do not return a result by the specified date are allocated a PHE score of zero for all tests.
FEPTU562.12 Page 22 of 30
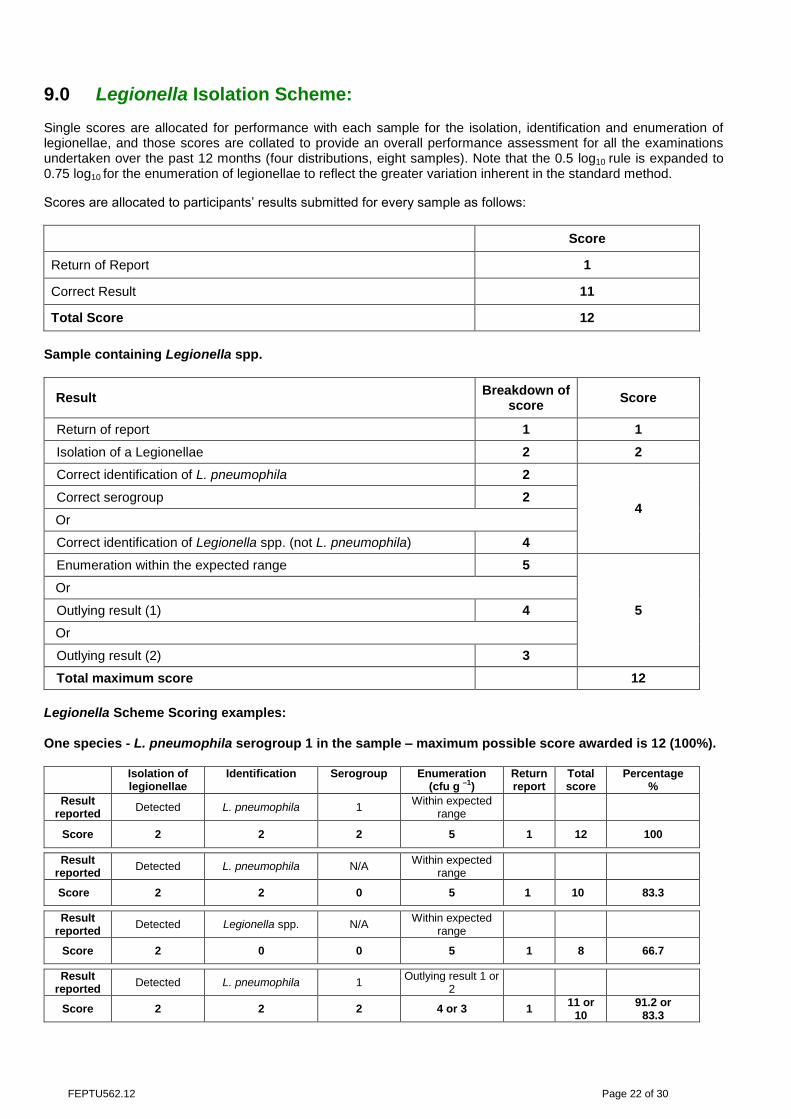
9.0 Legionella Isolation Scheme: Single scores are allocated for performance with each sample for the isolation, identification and enumeration of legionellae, and those scores are collated to provide an overall performance assessment for all the examinations undertaken over the past 12 months (four distributions, eight samples). Note that the 0.5 log10 rule is expanded to 0.75 log10 for the enumeration of legionellae to reflect the greater variation inherent in the standard method.
Scores are allocated to participants’ results submitted for every sample as follows:
Score
Return of Report 1
Correct Result 11
Total Score 12
Sample containing Legionella spp.
Result Breakdown of
score Score
Return of report 1 1
Isolation of a Legionellae 2 2
Correct identification of L. pneumophila 2
4 Correct serogroup 2
Or
Correct identification of Legionella spp. (not L. pneumophila) 4
Enumeration within the expected range 5
5
Or
Outlying result (1) 4
Or
Outlying result (2) 3
Total maximum score 12
Legionella Scheme Scoring examples: One species - L. pneumophila serogroup 1 in the sample – maximum possible score awarded is 12 (100%).
Isolation of legionellae
Identification Serogroup Enumeration (cfu g –1)
Return report
Total score
Percentage %
Result reported
Detected L. pneumophila 1 Within expected
range
Score 2 2 2 5 1 12 100
Result reported
Detected L. pneumophila N/A Within expected
range
Score 2 2 0 5 1 10 83.3
Result reported
Detected Legionella spp. N/A Within expected
range
Score 2 0 0 5 1 8 66.7
Result reported
Detected L. pneumophila 1 Outlying result 1 or
2
Score 2 2 2 4 or 3 1 11 or
10 91.2 or
83.3
FEPTU562.12 Page 23 of 30
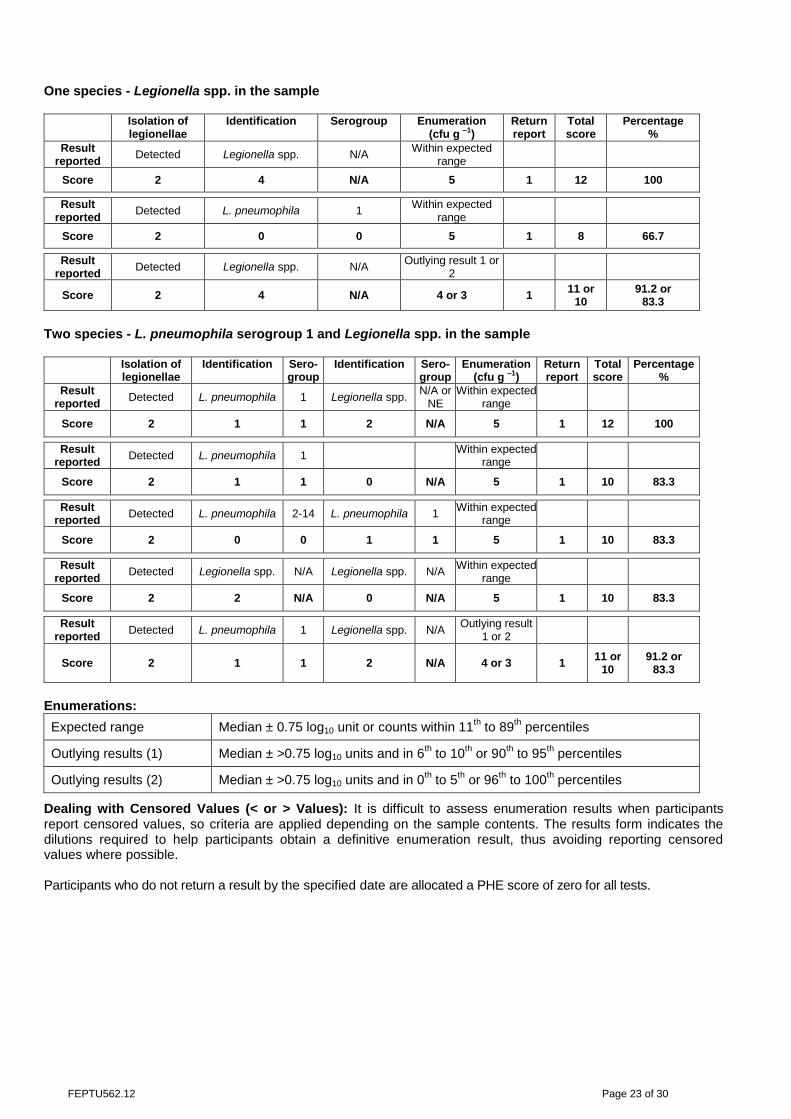
One species - Legionella spp. in the sample
Isolation of legionellae
Identification Serogroup Enumeration (cfu g –1)
Return report
Total score
Percentage %
Result reported
Detected Legionella spp. N/A Within expected
range
Score 2 4 N/A 5 1 12 100
Result reported
Detected L. pneumophila 1 Within expected
range
Score 2 0 0 5 1 8 66.7
Result reported
Detected Legionella spp. N/A Outlying result 1 or
2
Score 2 4 N/A 4 or 3 1 11 or
10 91.2 or
83.3
Two species - L. pneumophila serogroup 1 and Legionella spp. in the sample
Isolation of legionellae
Identification Sero- group
Identification Sero- group
Enumeration (cfu g –1)
Return report
Total score
Percentage %
Result reported
Detected L. pneumophila 1 Legionella spp. N/A or
NE Within expected
range
Score 2 1 1 2 N/A 5 1 12 100
Result reported
Detected L. pneumophila 1 Within expected
range
Score 2 1 1 0 N/A 5 1 10 83.3
Result reported
Detected L. pneumophila 2-14 L. pneumophila 1 Within expected
range
Score 2 0 0 1 1 5 1 10 83.3
Result reported
Detected Legionella spp. N/A Legionella spp. N/A Within expected
range
Score 2 2 N/A 0 N/A 5 1 10 83.3
Result reported
Detected L. pneumophila 1 Legionella spp. N/A Outlying result
1 or 2
Score 2 1 1 2 N/A 4 or 3 1 11 or
10 91.2 or
83.3
Enumerations:
Expected range Median ± 0.75 log10 unit or counts within 11th to 89
th percentiles
Outlying results (1) Median ± >0.75 log10 units and in 6th to 10
th or 90
th to 95
th percentiles
Outlying results (2) Median ± >0.75 log10 units and in 0th to 5
th or 96
th to 100
th percentiles
Dealing with Censored Values (< or > Values): It is difficult to assess enumeration results when participants report censored values, so criteria are applied depending on the sample contents. The results form indicates the dilutions required to help participants obtain a definitive enumeration result, thus avoiding reporting censored values where possible. Participants who do not return a result by the specified date are allocated a PHE score of zero for all tests.
FEPTU562.12 Page 24 of 30
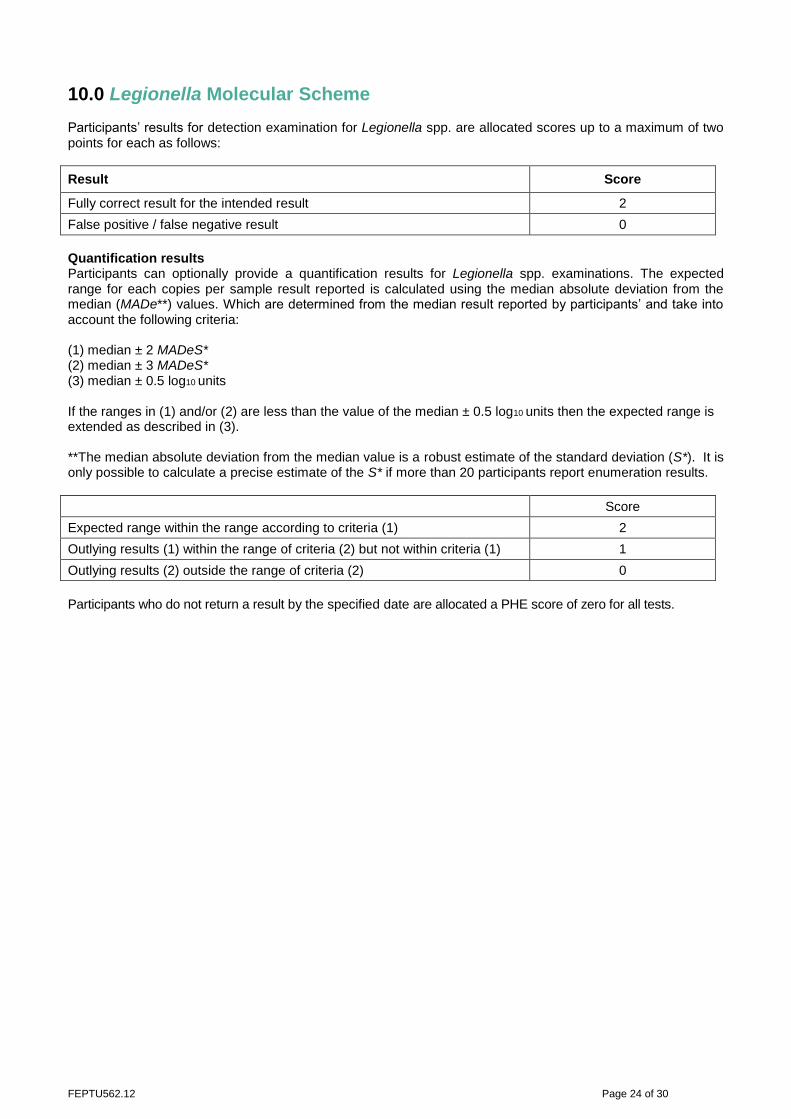
10.0 Legionella Molecular Scheme Participants’ results for detection examination for Legionella spp. are allocated scores up to a maximum of two points for each as follows:
Result Score
Fully correct result for the intended result 2
False positive / false negative result 0
Quantification results Participants can optionally provide a quantification results for Legionella spp. examinations. The expected range for each copies per sample result reported is calculated using the median absolute deviation from the median (MADe**) values. Which are determined from the median result reported by participants’ and take into account the following criteria: (1) median ± 2 MADeS* (2) median ± 3 MADeS* (3) median ± 0.5 log10 units If the ranges in (1) and/or (2) are less than the value of the median ± 0.5 log10 units then the expected range is extended as described in (3). **The median absolute deviation from the median value is a robust estimate of the standard deviation (S*). It is only possible to calculate a precise estimate of the S* if more than 20 participants report enumeration results.
Score
Expected range within the range according to criteria (1) 2
Outlying results (1) within the range of criteria (2) but not within criteria (1) 1
Outlying results (2) outside the range of criteria (2) 0
Participants who do not return a result by the specified date are allocated a PHE score of zero for all tests.
FEPTU562.12 Page 25 of 30
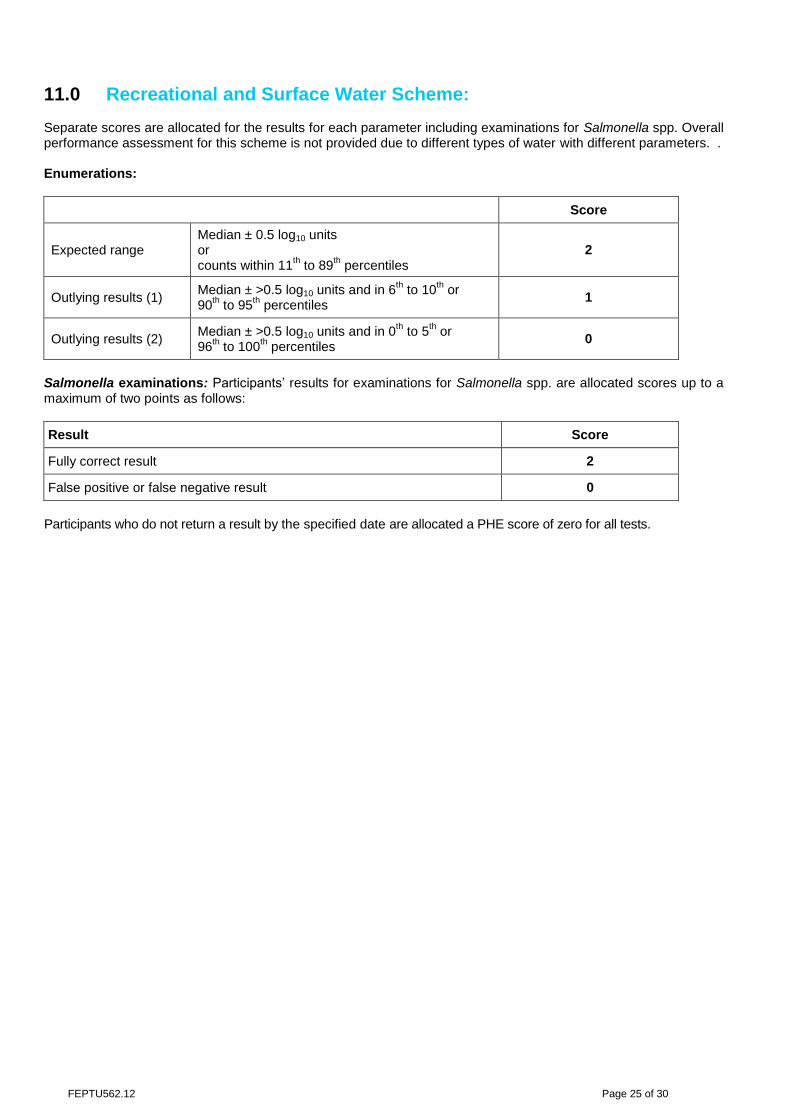
11.0 Recreational and Surface Water Scheme: Separate scores are allocated for the results for each parameter including examinations for Salmonella spp. Overall performance assessment for this scheme is not provided due to different types of water with different parameters. . Enumerations:
Score
Expected range Median ± 0.5 log10 units or counts within 11
th to 89
th percentiles
2
Outlying results (1) Median ± >0.5 log10 units and in 6
th to 10
th or
90th to 95
th percentiles
1
Outlying results (2) Median ± >0.5 log10 units and in 0
th to 5
th or
96th to 100
th percentiles
0
Salmonella examinations: Participants’ results for examinations for Salmonella spp. are allocated scores up to a maximum of two points as follows:
Result Score
Fully correct result 2
False positive or false negative result 0
Participants who do not return a result by the specified date are allocated a PHE score of zero for all tests.
FEPTU562.12 Page 26 of 30
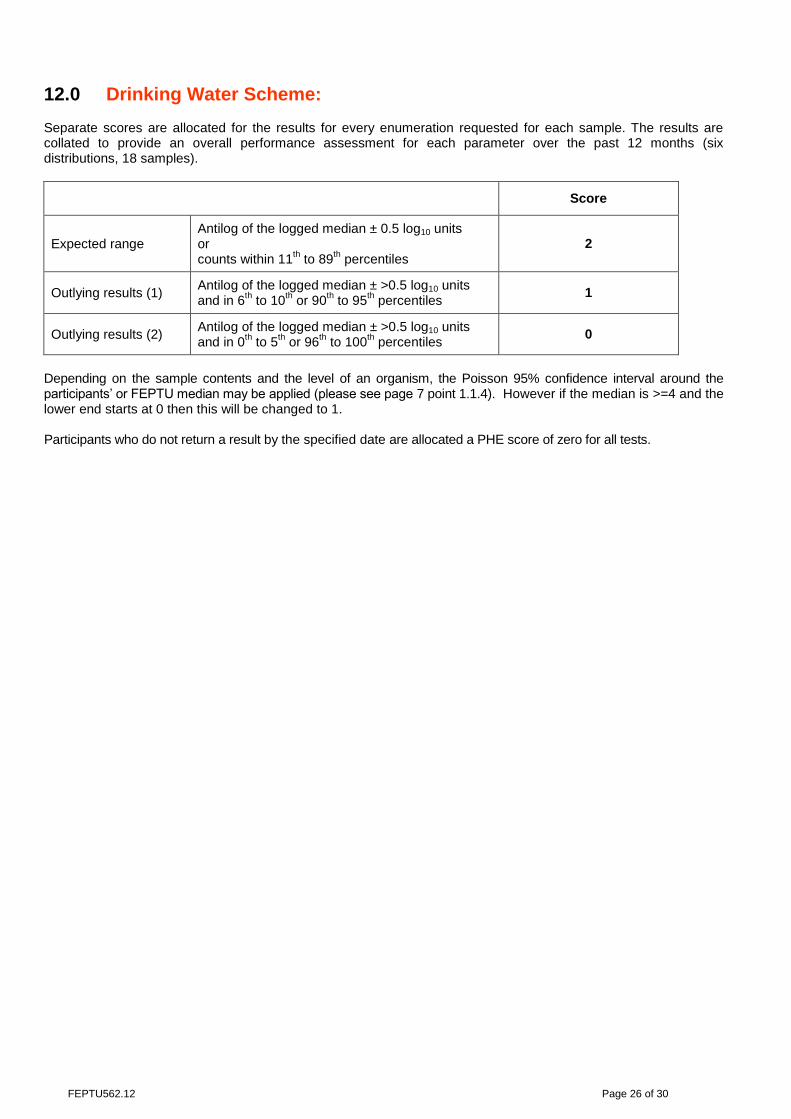
12.0 Drinking Water Scheme: Separate scores are allocated for the results for every enumeration requested for each sample. The results are collated to provide an overall performance assessment for each parameter over the past 12 months (six distributions, 18 samples).
Score
Expected range Antilog of the logged median ± 0.5 log10 units or counts within 11
th to 89
th percentiles
2
Outlying results (1) Antilog of the logged median ± >0.5 log10 units and in 6
th to 10
th or 90
th to 95
th percentiles
1
Outlying results (2) Antilog of the logged median ± >0.5 log10 units and in 0
th to 5
th or 96
th to 100
th percentiles
0
Depending on the sample contents and the level of an organism, the Poisson 95% confidence interval around the participants’ or FEPTU median may be applied (please see page 7 point 1.1.4). However if the median is >=4 and the lower end starts at 0 then this will be changed to 1. Participants who do not return a result by the specified date are allocated a PHE score of zero for all tests.
FEPTU562.12 Page 27 of 30
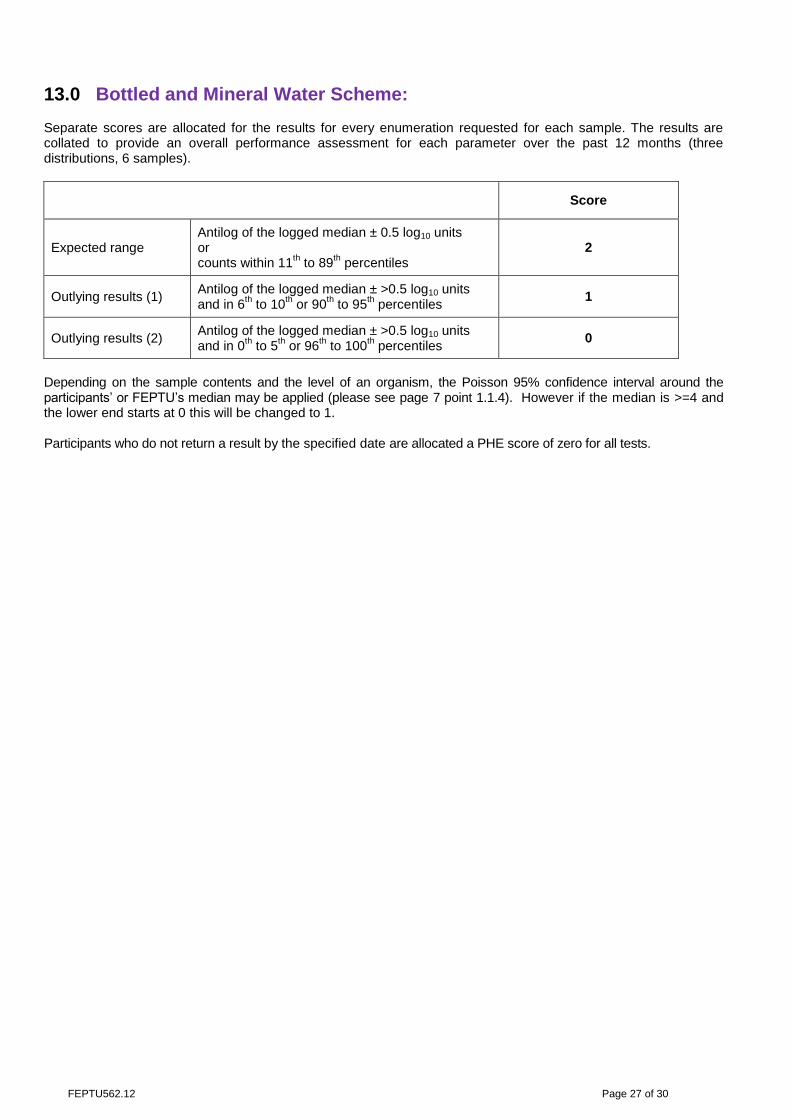
13.0 Bottled and Mineral Water Scheme: Separate scores are allocated for the results for every enumeration requested for each sample. The results are collated to provide an overall performance assessment for each parameter over the past 12 months (three distributions, 6 samples).
Score
Expected range Antilog of the logged median ± 0.5 log10 units or counts within 11
th to 89
th percentiles
2
Outlying results (1) Antilog of the logged median ± >0.5 log10 units and in 6
th to 10
th or 90
th to 95
th percentiles
1
Outlying results (2) Antilog of the logged median ± >0.5 log10 units and in 0
th to 5
th or 96
th to 100
th percentiles
0
Depending on the sample contents and the level of an organism, the Poisson 95% confidence interval around the participants’ or FEPTU’s median may be applied (please see page 7 point 1.1.4). However if the median is >=4 and the lower end starts at 0 this will be changed to 1. Participants who do not return a result by the specified date are allocated a PHE score of zero for all tests.
FEPTU562.12 Page 28 of 30
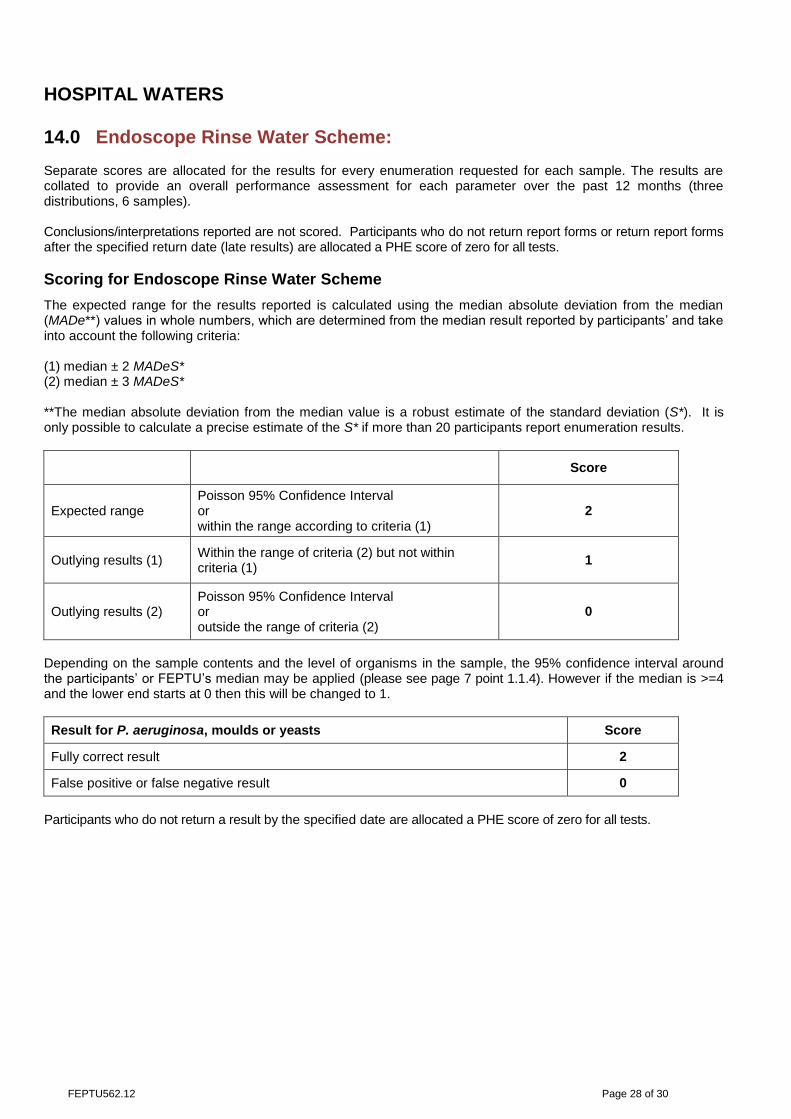
HOSPITAL WATERS 14.0 Endoscope Rinse Water Scheme: Separate scores are allocated for the results for every enumeration requested for each sample. The results are collated to provide an overall performance assessment for each parameter over the past 12 months (three distributions, 6 samples). Conclusions/interpretations reported are not scored. Participants who do not return report forms or return report forms after the specified return date (late results) are allocated a PHE score of zero for all tests.
Scoring for Endoscope Rinse Water Scheme
The expected range for the results reported is calculated using the median absolute deviation from the median (MADe**) values in whole numbers, which are determined from the median result reported by participants’ and take into account the following criteria: (1) median ± 2 MADeS* (2) median ± 3 MADeS* **The median absolute deviation from the median value is a robust estimate of the standard deviation (S*). It is only possible to calculate a precise estimate of the S* if more than 20 participants report enumeration results.
Score
Expected range Poisson 95% Confidence Interval or within the range according to criteria (1)
2
Outlying results (1) Within the range of criteria (2) but not within criteria (1)
1
Outlying results (2) Poisson 95% Confidence Interval or outside the range of criteria (2)
0
Depending on the sample contents and the level of organisms in the sample, the 95% confidence interval around the participants’ or FEPTU’s median may be applied (please see page 7 point 1.1.4). However if the median is >=4 and the lower end starts at 0 then this will be changed to 1.
Result for P. aeruginosa, moulds or yeasts Score
Fully correct result 2
False positive or false negative result 0
Participants who do not return a result by the specified date are allocated a PHE score of zero for all tests.

FEPTU562.12 Page 29 of 30
15.0 Dialysis Water Scheme: Separate scores are allocated for the results for every enumeration requested for each sample. The results are collated to provide an overall performance assessment for each parameter over the past 12 months (three distributions, 6 samples). Conclusions/interpretations reported are not scored. Participants who do not return report forms or return report forms after the specified return date (late results) are allocated a PHE score of zero for all tests.
Scoring for Dialysis Water Scheme
The expected range for the results reported is calculated using the median absolute deviation from the median (MADe**) values in whole numbers, which are determined from the median result reported by participants’ and take into account the following criteria: (1) median ± 2 MADeS* (2) median ± 3 MADeS* **The median absolute deviation from the median value is a robust estimate of the standard deviation (S*). It is only possible to calculate a precise estimate of the S* if more than 20 participants report enumeration results.
Score
Expected range Poisson 95% Confidence Interval or within the range according to criteria (1)
2
Outlying results (1) Within the range of criteria (2) but not within criteria (1)
1
Outlying results (2) Poisson 95% Confidence Interval or outside the range of criteria (2)
0
Depending on the sample contents and the level of organisms in the sample, the 95% confidence interval around the participants’ or FEPTU’s median may be applied (please see page 7 point 1.1.4). However if the median is >=4 and the lower end starts at 0 this will be changed to 1. Participants who do not return a result by the specified date are allocated a PHE score of zero for all tests.
FEPTU562.12 Page 30 of 30
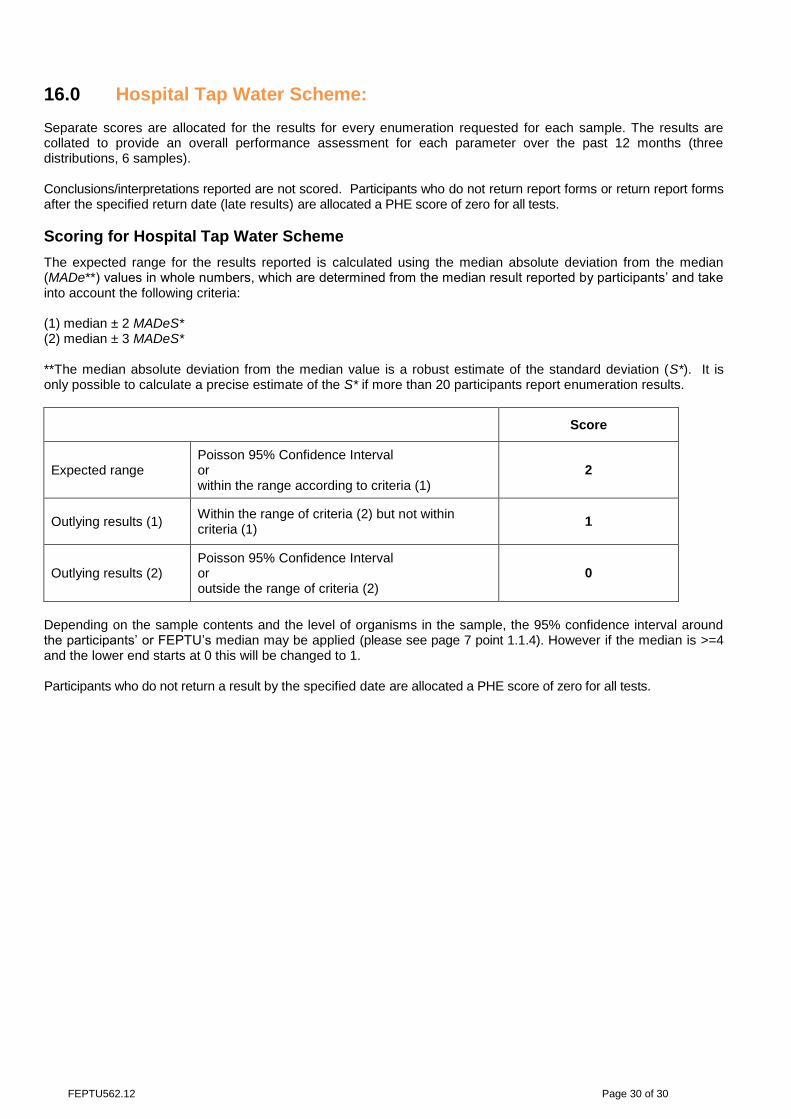
16.0 Hospital Tap Water Scheme: Separate scores are allocated for the results for every enumeration requested for each sample. The results are collated to provide an overall performance assessment for each parameter over the past 12 months (three distributions, 6 samples). Conclusions/interpretations reported are not scored. Participants who do not return report forms or return report forms after the specified return date (late results) are allocated a PHE score of zero for all tests.
Scoring for Hospital Tap Water Scheme
The expected range for the results reported is calculated using the median absolute deviation from the median (MADe**) values in whole numbers, which are determined from the median result reported by participants’ and take into account the following criteria: (1) median ± 2 MADeS* (2) median ± 3 MADeS* **The median absolute deviation from the median value is a robust estimate of the standard deviation (S*). It is only possible to calculate a precise estimate of the S* if more than 20 participants report enumeration results.
Score
Expected range Poisson 95% Confidence Interval or within the range according to criteria (1)
2
Outlying results (1) Within the range of criteria (2) but not within criteria (1)
1
Outlying results (2) Poisson 95% Confidence Interval or outside the range of criteria (2)
0
Depending on the sample contents and the level of organisms in the sample, the 95% confidence interval around the participants’ or FEPTU’s median may be applied (please see page 7 point 1.1.4). However if the median is >=4 and the lower end starts at 0 this will be changed to 1. Participants who do not return a result by the specified date are allocated a PHE score of zero for all tests.