philips delivers 4% growth in second quarter; management team … · 6 q2 quarterly report and...
TRANSCRIPT

Q2 2011 Quarterly report and Semi-annual report
Philips delivers 4% growth in second quarter ; management team takes next steps to improve growth and performance trajectory
• Comparable sales up 4%, led by strong growth at Healthcare, moderate growth at Lighting• Growth markets now represent one third of Group sales• EBITA of EUR 370 million, 7.1% of sales• Goodwill impairment leads to net loss of EUR 1.3 billion• FreecashoutflowofEUR210million• Sharebuy-backprogramofEUR2billionlaunched• Cost reduction program of EUR 500 million initiated• Mid-termperformancetargets:4-6%salesgrowth,10-12%EBITAand12-14%ROICby 2013
Q2 key financials impacted by investments for growth, market and operational challenges and impairment charge
Sector Q2 comparable sales reflect the strength of the portfolio Healthcare sales are up 8%, with strong growth and a healthy order book. Consumer Lifestyle sales declined by 2%; the businesses except Lifestyle Entertainment delivered double-digit growth on aggregate. Investments for growth, lower license income and a decline at Lifestyle Entertainment lowered second-quarter results. Lighting sales are up by 4%, with LED-based sales growing 21% year-on-year, while traditional lighting declined. The profitability of the sector was broadly impacted by tempered sales growth and margin pressure, as well as higher incremental investments in sales and marketing. EUR 1.4 billion impairment has resulted from the annual review of business projections and discount rates,
Accelerate!, a comprehensive performance improvement and change program, is being implemented across the organization to realize the value potential and speed up growth Key initiatives have been launched to implement the Philips Business System and step up resourcing for growth, granu-lar strategy execution, value delivery to customers, and to adapt the culture and reward system. Initiatives include a EUR 500 million cost reduction program which is expected to be margin-accretive from 2013 onwards, as well as investments in market penetration and innovation of around EUR 200 million a year. New Executive Committee has been formed.
Business portfolio is well positioned in highly attractive markets and geographies to capitalize on global trends The large majority of Philips businesses have the right fundamentals for profitable organic growth. A growing share of one-third of Group revenue is generated in growth markets.
Progress on our path to value by 2013Mid-term performance goals have been established: • Sales growth of 4-6%, assuming real GDP growth of 3-4% per annum• Reported EBITA margins of 10-12% for the Group; 15-17% for Healthcare; 8-10% for Consumer Lifestyle
(excluding licenses); 8-10% for Lighting• Return On Invested Capital of 12-14% A EUR 2 billion share buy-back program is being launched, reflecting our confidence to step up profitable growth.

CEO quote:
“Our second-quarter results were impacted by near-term operational challenges, weaker markets and a significant impairment charge. We are taking necessary steps to improve performance and we are confident in the prospects of our portfolio.
Healthcare performed strongly, improving earnings and growing comparable sales by 8% over last year. In Consumer Lifestyle, we are encouraged by growth in all businesses, excluding Lifestyle Entertainment, though investments in growth affected earnings in the quarter. Lighting sales grew 4% comparably, with our LED portfolio up a strong 21%. However, Lighting results in the quarter were disappointing.
We are addressing our operational issues, while investing for growth and instilling a new culture of entrepreneurship and accountability. We have strengthened our executive leadership and rolled out a comprehensive performance improvement and change program, Accelerate! In addition to growth initiatives, this includes a cost reduction program of EUR 500 million to improve our operating model and pave the way for profitable growth.
Given our confidence to grow organically, complemented with bolt-on acquisitions, we are launching a EUR 2 billion share buy-back program. This will also address the efficiency of our balance sheet.
We do not expect a material performance improvement in the near term as operational risks and issues remain, and also considering the current uncertain economic environment. However, we are pleased to give clarity on our mid-term trajectory ahead of plan, reflecting our ambitions for the future.”
Frans van Houten, PresidentandCEOofRoyalPhilipsElectronics
Please refer to page 18 of this press release for more information about forward-looking statements, third-party market share data, use of non-GAAP information and use of fair-value measurements.

Q2 Quarterly report and Semi-annual report 3
Philips GroupNet incomein millions of euros unless otherwise stated
Q2 Q2
2010 2011
Sales 5,346 5,213
EBITA 506 370 as a % of sales 9.5 7.1
EBIT 384 (1,123)as a % of sales 7.2 (21.5)
Financial income and expenses (70) (75)
Income taxes (85) (46)
Results investments in associates 11 (4)
Income (loss) from continuing operations 240 (1,248)
Discontinued operations 22 (97)
Net income (loss) 262 (1,345)
Net income (loss) - shareholders per commonshare (in euros) - basic 0.28 (1.39)
Sales by sectorin millions of euros unless otherwise stated
Q2 Q2 % change
2010 2011 nominal comparable
Healthcare 2,068 2,080 1 8
ConsumerLifestyle 1,338 1,293 (3) (2)
Lighting 1,859 1,777 (4) 4
GM&S 81 63 (22) 27 Philips Group 5,346 5,213 (2) 4
Sales per market clusterin millions of euros unless otherwise stated
Q21) Q2 % change
2010 2011 nominal comparable
Western Europe 1,531 1,446 (6) (4)
North America 1,745 1,627 (7) 4
Other mature markets 365 405 11 12
Total mature markets 3,641 3,478 (4) 2
Growth markets 1,705 1,735 2 9 Philips Group 5,346 5,213 (2) 4
1) Revised to reflect an adjusted market cluster allocation
Net income• Net income showed a loss of EUR 1,345 million, a
decline of EUR 1,607 million compared with Q2 2010,largely attributable to goodwill and intangible-assetimpairments of EUR 1,385 million. Excludingimpairments, the lower income was attributable tolower operating earnings and a loss in discontinuedoperations.
• The Q2 annual impairment review has led to anadjustment of the discount rate across Philips andselected adjustments of the pre-recession businesscases, leading to a EUR 1,345 million impairment.
• EBITA decreased by EUR 136 million year-on-year to7.1% of sales, due to lower earnings at Lighting andConsumer Lifestyle, partly offset by lower restructuringand acquisition-related charges. Excluding thosecharges, EBITA amounted to 7.6% of sales.
• Tax charges were EUR 39 million lower than in Q22010, mainly due to lower taxable earnings.
• Net income includes an after-tax loss of EUR 97 millionin discontinued operations, representing the results ofthe Television business, including an asset write-downassociated with the disentanglement.
Sales per sector• Group sales amounted to EUR 5,213 million, an
increase of 4% on a comparable basis. Group nominalsales decreased by 2%, including a 6% negative currencyimpact.
• Healthcare sales improved by 8% on a comparable basis,driven by high single-digit growth in all businesses.
• Consumer Lifestyle comparable sales declined by 2%year-on-year. Growth at Personal Care, Health &Wellness and Domestic Appliances was offset by a salesdecline at Lifestyle Entertainment and Licenses.
• Lighting sales grew by 4% on a comparable basis, drivenby double-digit growth at Professional Luminaires andLighting Systems & Controls. Lamps and Automotivereported moderate sales growth, whereas ConsumerLuminaires and Lumileds showed a decline.
Sales per market cluster• Comparable sales in the mature markets grew by 2%
compared to Q2 2010, mainly driven by Healthcare.• Growth markets showed 9% comparable growth,
predominantly driven by Healthcare and ConsumerLifestyle.

4 Q2 Quarterly report and Semi-annual report
EBITAin millions of euros
Q2 Q2
2010 2011
Healthcare 216 276
Consumer Lifestyle 168 60
Lighting 210 101
Group Management &Services (88) (67)Philips Group 506 370
EBITAas a % of sales
Q2 Q2
2010 2011
Healthcare 10.4 13.3
Consumer Lifestyle 12.6 4.6
Lighting 11.3 5.7
Group Management &Services − − Philips Group 9.5 7.1
Restructuring and acquisition-related chargesin millions of euros
Q2 Q2
2010 2011
Healthcare (46) 1
Consumer Lifestyle (7) (13)
Lighting (37) (14)
Group Management &Services − 2 Philips Group (90) (24)
EBITin millions of euros unless otherwise stated
Q2 Q2
2010 2011
Healthcare 148 (611)
Consumer Lifestyle 160 24
Lighting 166 (470)
Group Management &Services (90) (66)
Philips Group 384 (1,123)as a % of sales 7.2 (21.5)
Earnings• EBITA amounted to EUR 370 million, a decrease of EUR
136 million compared to Q2 2010, driven by lowerearnings at Lighting and Consumer Lifestyle.Restructuring and acquisition-related charges of EUR24 million were recorded, EUR 66 million lower than inQ2 2010. Excluding these charges, EBITA amounted toEUR 394 million, or 7.6% of sales.
• EBIT declined by EUR 1,507 million, reflecting goodwillimpairment losses of EUR 531 million at Lighting andEUR 824 million at Healthcare. EUR 30 million ofimpairment charges for intangibles other than goodwillwere recorded, largely attributable to ConsumerLifestyle. Amortization charges were EUR 17 millionhigher than in Q2 2010.
• Healthcare EBITA increased by EUR 60 million year-on-year, with improvement in earnings in most businesses,notably Imaging Systems, Patient Care & ClinicalInformatics and Customer Services. Restructuring andacquisition-related charges were EUR 47 million lowerthan in Q2 2010.
• Consumer Lifestyle EBITA decreased by EUR 108million year-on-year, with declines in earnings in mostbusinesses, except Health & Wellness. Restructuringand acquisition-related charges were EUR 6 millionhigher than in Q2 2010.
• Lighting EBITA decreased by EUR 109 million year-on-year, due to lower sales and higher selling costs. Thedecrease in EBITA was largely attributable to Lamps,Professional Luminaires, Lighting Systems & Controls,Lumileds and Consumer Luminaires. Improved EBITAwas visible at Automotive. Restructuring andacquisition-related charges were EUR 23 million lowerthan in Q2 2010.
• GM&S EBITA improved by EUR 21 million to a net costof EUR 67 million. Earnings were favorably impacted bylower costs within Research and Intellectual Property &Standards.

Q2 Quarterly report and Semi-annual report 5
Financial income and expensesin millions of euros
Q2 Q2
2010 2011
Net interest expenses (64) (48)
NXP arrangement − 4
Other (6) (31)(70) (75)
Cash balancein millions of euros
Q2 Q2
2010 2011
Beginning cash balance 4,388 4,772
Free cash flow 299 (210)
Net cash flow fromoperating activities 497 39 Net capital expenditures (198) (249)
Acquisitions of businesses (21) (136)
Other cash flow frominvesting activities (14) 36
Treasury sharestransactions 19 45
Dividend paid (296) (259)
Changes in debt/other 69 (841)
Net cash flowdiscontinued operations 49 (147)Ending balance 4,493 3,260
Cash flows from operating activitiesin millions of euros
600
340
80
(180)
(440)
(700)
497
Q2 2010
(474)
Q1 2011
39
Q2 2011
Financial income and expenses• The balance of financial income and expenses showed a
deficit that was EUR 5 million higher than in Q2 2010, asa fair-value gain on the option related to NXP and lowerinterest expense due to lower debt were offset byhigher interest expense related to tax positions andvalue adjustments in respect of available-for-salefinancial assets.
Cash balance• The Group cash balance in the quarter decreased to
EUR 3.3 billion, mainly due to EUR 841 million debt/other, EUR 259 million cash dividend and EUR 210million free cash outflow.
• In Q2 2010, the cash balance increased by EUR 105million, mainly driven by a EUR 69 million increase indebt/other and cash inflow from discontinuedoperations. Free cash inflow of EUR 299 million waslargely offset by a EUR 296 million cash dividendpayment.
Cash flows from operating activities• Operating activities led to a cash inflow of EUR 39
million, compared to an inflow of EUR 497 million in Q22010. The year-on-year decrease was largely due toEUR 310 million higher working capital outflow relatedto higher vendor payments.

6 Q2 Quarterly report and Semi-annual report
Gross capital expenditures1)
in millions of euros
200
150
100
50
0
158
Q2 2010
161
Q1 2011
184
Q2 20111) Capital expenditures on property, plant and equipment only
Inventoriesas a % of moving annual total sales
20
15
10
5
0
16.8
Q2 20101)
15.6
Q1 2011
16.8
Q2 20111) Excludes discontinued operations for both inventories and sales figures.
Inventories excluding discontinued operations are disclosed in quarterlystatistics.
Net debt and group equityin billions of euros
■-group equity--■-net debt20
13
6
(1)
15.8
0.3
2 : 98
Q2 2010
14.1
(0.4)
-3 : 103
Q1 2011
13.1
0.2
1 : 99
Q2 2011
ratio:
Gross capital expenditure• Gross capital expenditures on property, plant and
equipment were EUR 26 million higher than in Q2 2010,mainly due to higher investments at Lighting andConsumer Lifestyle.
Inventories• Inventories as a percentage of sales amounted to 16.8,
1.2 percentage points higher than at the end of Q12011. Inventory value at the end of Q2 2011 was EUR3.8 billion, an increase of EUR 232 million in the quarter.This increase was driven by all sectors, due to lower-than-expected sales.
• Compared to Q2 2010, inventories as a % of sales werein line.
Net debt and group equity• At the end of Q2 2011, Philips had a net debt position of
EUR 156 million, compared to EUR 306 million at theend of Q2 2010. During the quarter, the net debtposition increased by EUR 593 million, mainly due tolower free cash flow.
• Group equity decreased by EUR 1.0 billion in thequarter to EUR 13.1 billion. The decrease was largely aresult of lower net income and currency translationeffects, partly offset by stock dividend following a 63%selection of payout in shares.

Q2 Quarterly report and Semi-annual report 7
Number of employeesin FTEs
120,000
115,000
110,000
105,000
100,000
112,074
Q2 20101)
117,248
Q1 20111)
120,351
Q2 20111)
1) Number of employees excludes discontinued operations. Discontinuedoperations, comprising the Television business, employed at end of Q2 20104,516, at end of Q1 2011 3,560 and at end of Q2 2011 3,506.
Employees• The number of employees increased by 3,103 in the
quarter, largely due to the Preethi acquisition inConsumer Lifestyle and an increase in temporaryheadcount at Consumer Lifestyle.
• Compared to Q2 2010, the number of employeesincreased by 8,277, primarily due to variousacquisitions, higher permanent headcount mainly atHealthcare, and higher temporary headcountpredominantly at Lighting, principally in our growthmarkets.

8 Q2 Quarterly report and Semi-annual report
HealthcareKey datain millions of euros unless otherwise stated
Q2 Q2
2010 2011
Sales 2,068 2,080
Sales growth
% nominal 10 1 % comparable 4 8
EBITA 216 276 as a % of sales 10.4 13.3
EBIT 148 (611)as a % of sales 7.2 (29.4)
Net operating capital (NOC) 9,545 7,534
Number of employees (FTEs) 34,344 36,469
Salesin millions of euros
3,000
2,250
1,500
750
0
2,068
Q2 2010
2,070
Q3 2010
2,642
Q4 2010
1,971
Q1 2011
2,080
Q2 2011
EBITA
■-EBITA in millions of euros----EBITA as a % of sales600
480
360
240
120
0
40%
32%
24%
16%
8%
0
10.4216
Q2 2010
13.6282
Q3 2010
19.8522
Q4 2010
10.1199
Q1 2011
13.3276
Q2 2011
Business highlights• Philips expanded its capabilities in imaging equipment
services with the acquisition of AllParts Medical, aprivately owned US-based provider of imagingequipment parts and training.
• Philips signed a Memorandum of Understanding withthe Russian State Atomic Energy Corporation, underwhich the two intend to locally manufacture threeimportant imaging modalities in nuclear medicine.
• Philips’ Sleep business launched the GoLife for Womennasal pillow CPAP mask, expanding the GoLife platformthat was launched earlier in the year with GoLife forMen. This platform is our first designed around thedistinct features of men and women.
Financial performance• Currency-comparable equipment order intake grew 4%
year-on-year. Equipment order growth was seen atImaging Systems, while Patient Care & ClinicalInformatics orders were lower than in Q2 2010.Equipment orders in North American markets were10% higher than in Q2 2010. Equipment orders inmarkets outside of North America were 4% loweryear-on-year, with growth-market equipment ordersgrowing by 5%.
• Comparable sales were 8% higher year-on-year, withsolid sales increases in all businesses, notably high-single-digit growth at Home Healthcare and ImagingSystems. From a regional perspective, comparable salesin mature markets grew 4% year-on-year, with sales inNorth America 8% higher than in Q2 2010. Growth-market sales grew 22%, with notably better sales atImaging Systems.
• EBITA increased by EUR 60 million year-on-year toEUR 276 million, or 13.3% of sales. EBITA improvementwas driven by gross margin improvements in mostbusinesses. Excluding restructuring and acquisition-related charges, EBITA amounted to EUR 275 million,or 13.2% of sales, compared to EUR 262 million, or12.7% of sales, in Q2 2010.
• EBIT decreased by EUR 759 million year-on-year. EBITwas impacted by a EUR 824 million goodwill impairmentcharge at Home Healthcare Solutions following aslower-than-planned post-recession recovery andrevised growth projections for the US sleep market. Itincludes a value adjustment from a discount rateincrease, reflecting growing economic uncertainties.
• Net operating capital decreased by EUR 2.0 billion toEUR 7.5 billion, mainly due to currency effects andgoodwill impairment.

Q2 Quarterly report and Semi-annual report 9
• Compared to Q2 2010, the number of employeesincreased by 2,125, mainly permanent personnel,mostly in growth markets, as well as from acquisitions.
Miscellaneous• On June 27, Philips announced it has agreed to acquire
the mammography equipment product line of SectraAB. Through this acquisition, Philips will broaden itsWomen’s Health product portfolio with a unique digitalmammography solution that delivers high-quality breastimages while reducing the exposure to X-ray radiationfor women by up to 50% compared to other digitalmammography systems.

10 Q2 Quarterly report and Semi-annual report
Consumer Lifestyle** Excluding Television
Key datain millions of euros unless otherwise stated
Q2 Q2
2010 2011
Sales 1,338 1,293
Sales growth
% nominal 16 (3)% comparable 6 (2)
EBITA 168 60 as a % of sales 12.6 4.6
EBIT 160 24 as a % of sales 12.0 1.9
Net operating capital (NOC) 1,055 1,463
Number of employees (FTEs) 13,892 17,026
Salesin millions of euros
2,000
1,500
1,000
500
0
1,338
Q2 2010
1,389
Q3 2010
1,787
Q4 2010
1,300
Q1 2011
1,293
Q2 2011
EBITA
■-EBITA in millions of euros----EBITA as a % of sales250
200
150
100
50
0
20%
16%
12%
8%
4%
0
12.6168
Q2 2010
12.2169
Q3 2010
11.9213
Q4 2010
9.2119
Q1 2011
4.660
Q2 2011
Business highlights• Philips launched a premium sonic toothbrush, the
Sonicare DiamondClean. The most advancedtoothbrush in the Sonicare range, it has been proven tobe up to 50% more effective in removing plaque inclinical tests.
• In an independent clinical study, 89% of users of a newlaser-based skin rejuvenation solution from Philipsshowed a definite improvement in their skin’s overallappearance. This breakthrough appliance will beintroduced in Q3 of this year.
• Five Philips projects were recognized in the “2011 HongKong Awards for Industries”. The Philips winnersincluded a Consumer Product Design Grand Award forthe Fidelio Primo Docking Speaker DS9000.
Financial performance• Sales declined 3% nominally year-on-year. On a
comparable basis, sales were 2% below Q2 2010.Double-digit comparable growth at Health & Wellnessand Personal Care, and high single-digit growth atDomestic Appliances were offset by significantly lowerlicense revenue and declines at Lifestyle Entertainment.Comparable sales growth excluding licenses was 1%.
• EBITA includes an amount of EUR 17 million (EUR 13million in Q2 2010) of costs formerly reported as partof the Television business in Consumer Lifestyle.
• EBITA was EUR 108 million lower year-on-year, whichwas attributable to lower license income, a sales declineat Lifestyle Entertainment and higher investments inAdvertising & Promotion across all businesses.Excluding restructuring and acquisition-related chargesof EUR 7 million in Q2 2010 and EUR 13 million in Q22011, EBITA declined from 13.1% to 5.6%.
• Net operating capital increased by EUR 408 million,largely due to the discontinued operations of Televisionand the acquisitions of Discus and Preethi.
• Compared to Q2 2010, the number of employeesincreased by 3,134, largely related to the acquisitions ofPreethi and Discus.
Miscellaneous• On July 11, Philips announced that it has agreed to
acquire Povos Electric Appliance (Shanghai) Co., Ltd., aleading kitchen appliance company in China. Theacquisition, which is subject to confirmatory duediligence and other customary closing conditions,underlines the importance Philips attaches to buildingbusiness creation capabilities in growth markets.
Q2 Quarterly report and Semi-annual report 11
• Philips AVENT will launch the Advanced OrthodonticSoother, which has been designed together with aleading dentist to stimulate healthy oral developmentfor babies. The soother has a unique teat shape topromote healthy oral development and providemaximum comfort.
• At IFA 2011, Europe’s largest consumer lifestyle tradeshow, Philips will launch a range of innovations acrossits portfolio.
• Restructuring and acquisition-related charges in Q32011 are expected to total EUR 20 million.
• License revenues for the second half of the year areexpected to be around the same level as the second halfof last year.
12 Q2 Quarterly report and Semi-annual report
LightingKey datain millions of euros unless otherwise stated
Q2 Q2
2010 2011
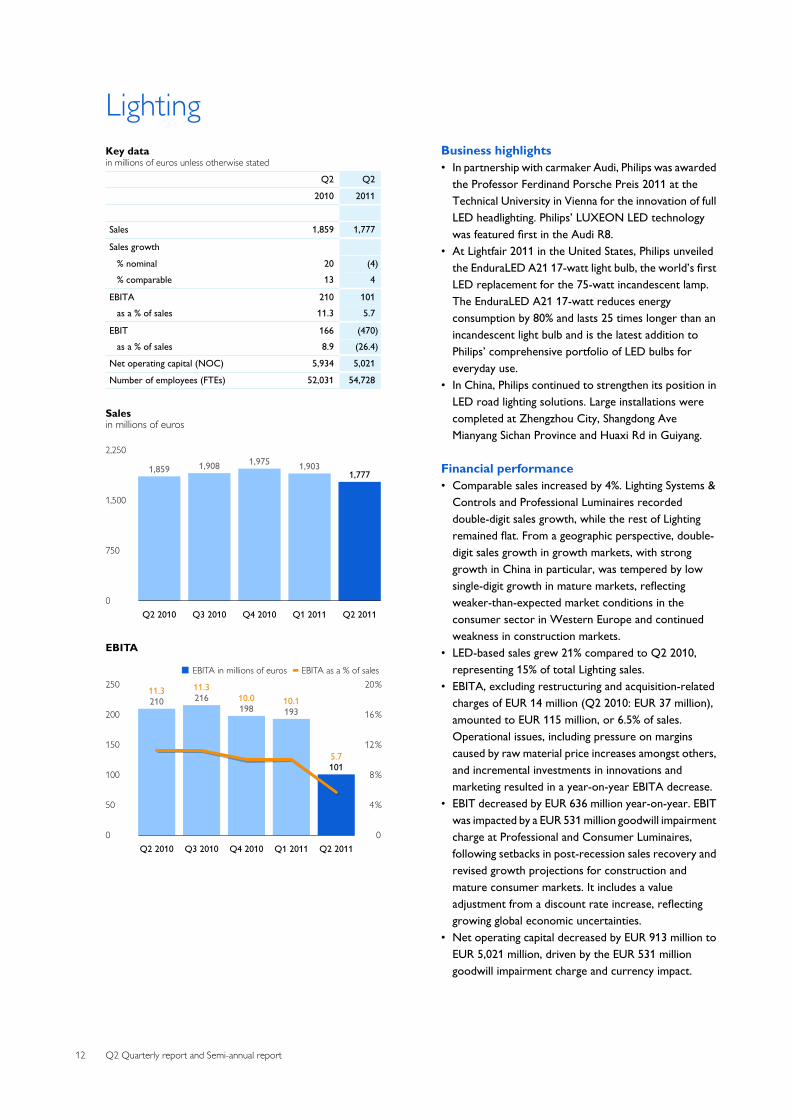
Sales 1,859 1,777
Sales growth
% nominal 20 (4)% comparable 13 4
EBITA 210 101 as a % of sales 11.3 5.7
EBIT 166 (470)as a % of sales 8.9 (26.4)
Net operating capital (NOC) 5,934 5,021
Number of employees (FTEs) 52,031 54,728
Salesin millions of euros
2,250
1,500
750
0
1,859
Q2 2010
1,908
Q3 2010
1,975
Q4 2010
1,903
Q1 2011
1,777
Q2 2011
EBITA
■-EBITA in millions of euros----EBITA as a % of sales250
200
150
100
50
0
20%
16%
12%
8%
4%
0
11.3210
Q2 2010
11.3216
Q3 2010
10.0198
Q4 2010
10.1193
Q1 2011
5.7101
Q2 2011
Business highlights• In partnership with carmaker Audi, Philips was awarded
the Professor Ferdinand Porsche Preis 2011 at theTechnical University in Vienna for the innovation of fullLED headlighting. Philips’ LUXEON LED technologywas featured first in the Audi R8.
• At Lightfair 2011 in the United States, Philips unveiledthe EnduraLED A21 17-watt light bulb, the world’s firstLED replacement for the 75-watt incandescent lamp.The EnduraLED A21 17-watt reduces energyconsumption by 80% and lasts 25 times longer than anincandescent light bulb and is the latest addition toPhilips’ comprehensive portfolio of LED bulbs foreveryday use.
• In China, Philips continued to strengthen its position inLED road lighting solutions. Large installations werecompleted at Zhengzhou City, Shangdong AveMianyang Sichan Province and Huaxi Rd in Guiyang.
Financial performance• Comparable sales increased by 4%. Lighting Systems &
Controls and Professional Luminaires recordeddouble-digit sales growth, while the rest of Lightingremained flat. From a geographic perspective, double-digit sales growth in growth markets, with stronggrowth in China in particular, was tempered by lowsingle-digit growth in mature markets, reflectingweaker-than-expected market conditions in theconsumer sector in Western Europe and continuedweakness in construction markets.
• LED-based sales grew 21% compared to Q2 2010,representing 15% of total Lighting sales.
• EBITA, excluding restructuring and acquisition-relatedcharges of EUR 14 million (Q2 2010: EUR 37 million),amounted to EUR 115 million, or 6.5% of sales.Operational issues, including pressure on marginscaused by raw material price increases amongst others,and incremental investments in innovations andmarketing resulted in a year-on-year EBITA decrease.
• EBIT decreased by EUR 636 million year-on-year. EBITwas impacted by a EUR 531 million goodwill impairmentcharge at Professional and Consumer Luminaires,following setbacks in post-recession sales recovery andrevised growth projections for construction andmature consumer markets. It includes a valueadjustment from a discount rate increase, reflectinggrowing global economic uncertainties.
• Net operating capital decreased by EUR 913 million toEUR 5,021 million, driven by the EUR 531 milliongoodwill impairment charge and currency impact.

Q2 Quarterly report and Semi-annual report 13
• The number of employees increased by 2,697, a largemajority of which is from an increase in temporarylabor.
Miscellaneous• On June 29, Philips announced its intention to acquire
Indal, a leading Spanish professional luminaires companymainly focused on outdoor lighting solutions. Theacquisition will fuel Philips’ growth in professionallighting solutions and further strengthen its marketposition in Europe.
• Philips won a large Mexican Federal Government bid,under which it will distribute, in the second half of 2011,22.9 million CFLi lamps across the entire Mexicanterritory, benefiting more than 5 million low-incomehouseholds. As a country, Mexico will be saving 816megawatts of energy, equivalent to 1.4 million tons ofCO2 emissions.
• Restructuring and acquisition-related charges in Q32011 are expected to total around EUR 30 million.

14 Q2 Quarterly report and Semi-annual report
Group Management & ServicesKey datain millions of euros unless otherwise stated
Q2 Q2
2010 2011
Sales 81 63
Sales growth
% nominal 11 (22)% comparable 11 27
EBITA Corporate Technologies (22) 2
EBITA Corporate & Regional Costs (35) (28)
EBITA Pensions (9) (13)
EBITA Service Units and Other (22) (28)
EBITA (88) (67)
EBIT (90) (66)
Net operating capital (NOC) (2,460)1) (2,716)
Number of employees (FTEs) 11,807 12,128
1) Revised to reflect an adjusted property, plant and equipment reclassification toassets classified as held for sale
Salesin millions of euros
100
50
0
81
Q2 2010
88
Q3 2010
87
Q4 2010
81
Q1 2011
63
Q2 2011
EBITAin millions of euros
0
(50)
(100)(88)
Q2 2010
(21)
Q3 2010
(16)
Q4 2010
(72)
Q1 2011
(67)
Q2 2011
Business highlights• Philips entered into a patent license agreement with
Cooper Industries relating to Philips’ LED systems andcontrols patent portfolio. This agreement is part ofPhilips’ LED Luminaire and Retrofit Bulb licensingprogram.
Financial performance• Sales decreased from EUR 81 million in Q2 2010 to
EUR 63 million in Q2 2011, due to the divestment ofAssembléon.
• EBITA amounted to a net cost of EUR 67 million, a costdecrease of EUR 21 million year-on-year, driven byhigher license revenues, lower expenses at Researchand a gain on the sale of assets.
• EBITA included an amount of EUR 15 million (EUR 16million in Q2 2010) of costs formerly reported as partof the Television business in Consumer Lifestyle.
• Net operating capital decreased by EUR 256 millionyear-on-year, mainly due to real estate assetsreclassified to assets held for sale.

Q2 Quarterly report and Semi-annual report 15
Additional information on the Television businessQ2 Q2
2010 2011
Television EBITA (7) (74)
Former Television net costs allocated to CL 13 17
Former Television net costs allocated to GM&S 16 15
Eliminated amortization other Televisionintangibles (1) (1)
Write-down to fair value less costs to sell (85)
EBIT discontinued operations 21 (128)
Financial income and expenses (1) −
Income taxes 2 31
Net income (loss) of discontinued operations 22 (97)
Number of employees (FTEs) 4,516 3,506
• In conjunction with the announcement of the Televisionlong-term strategic partnership with TPV, the results ofthe Television business to be carved out are reportedunder Discontinued operations in the Consolidatedstatements of income and Consolidated statements ofcash flows. Consequently, Television sales are nolonger reported in the Consumer Lifestyle and Groupoperational financials. Prior-period comparative figureshave been restated accordingly.
• Group Net income includes an after-tax loss of EUR 97million pertaining to the Television business, of whichEUR 85 million is related to the write-down to fair valueless cost to sell.
• The applicable net operating capital of this business isreported under Assets and Liabilities classified as heldfor sale in the Consolidated balance sheets as of the endof the first quarter of 2011.
• The EBITA of Consumer Lifestyle includes an amount ofEUR 17 million of costs formerly reported under theresult of the Television business, and the EBITA ofGroup Management & Services includes an amount ofEUR 15 million of costs formerly reported as part of theTelevision business.
• Management has used estimates in the calculation ofNet income. Final results could differ from the amountspresented.Cash flow reporting of discontinued operations hasbeen updated to reflect operational result reporting. New insights have led to an immaterial update on thecash flow and income statements and to areclassification of certain net operating capitalelements. Please refer to the Adjusted statements chapter for thechanged comparatives of cash flows.
• A reconciliation between the results of the formerTelevision business and its current representation isincluded in the table on this page.

16 Q2 Quarterly report and Semi-annual report
Other informationShare repurchase programThe Company will start a share repurchase program of upto EUR 2 billion to be executed during the next 12months.The maximum number of shares that will berepurchased under this program depends on thedevelopment in the share price during the course of theprogram. Subject to approval by the Annual GeneralMeeting of Shareholders, to be held in April 2012, allshares repurchased under this program will be cancelled,resulting in a reduction of Philips’ outstanding sharecapital. Due to Dutch tax legislation, EUR 1.7 billion of thisnew share repurchase program will be free of withholdingtax while the remaining part is subject to Dutchwithholding tax.
Philips will start this repurchase program as of today andwill enter into subsequent discretionary managementagreements with one or more banks to repurchase Philipsshares within the limits of relevant laws and regulations (inparticular EC Regulation 2273/2003) and Philips’ articlesof association. All transactions under this program will bepublished on Philips’ website (www.philips.com/investor)on a weekly basis.

Q2 Quarterly report and Semi-annual report 17
Board of Management and Executive Committee:Philips has strengthened its executive management teamby establishing an Executive Committee. The ExecutiveCommittee comprises of the current Board ofManagement members and five experienced leaders,allowing functions, businesses and markets to berepresented at the highest level in our company. Togetherthe team will optimize the performance of the companyand seize growth opportunities. As a result, the GroupManagement Committee will be disbanded.
This decision is in line with Philips’ increased focus onmarkets, with Ronald de Jong being Chief Market Leaderand Patrick Kung representing the fast-growing Chinesemarket. Furthermore, as innovation plays an essential rolein making a difference for our customers and winning inthe market, it is vital that Philips’ innovation portfolio isrepresented in Philips’ Executive Committee, togetherwith other functions.
Frans van HoutenPresident and Chief Executive Officer Royal PhilipsElectronicsActing Chief Executive Officer Philips LightingChairman of the Board of Management
Ron WirahadiraksaExecutive Vice-President and Chief Financial Officer RoyalPhilips ElectronicsActing Chief Financial Officer Philips LightingMember of the Board of Management
Steve RusckowskiExecutive Vice-President and Chief Executive OfficerPhilips HealthcareMember of the Board of Management
Pieter NotaExecutive Vice-President and Chief Executive OfficerPhilips Consumer LifestyleMember of the Board of Management
Rudy Provoost*Executive Vice-PresidentMember of the Board of Management
Gottfried Dutiné**Executive Vice-President Royal Philips Electronics andChief Innovation OfficerMember of the Board of Management
Ronald de JongExecutive Vice-President Royal Philips ElectronicsChief Market Leader
Patrick KungExecutive Vice-President Royal Philips ElectronicsCEO Greater China
Carole Wainaina***Executive Vice-President Royal Philips ElectronicsGlobal Head of Human Resources Management
Jim Andrew****Executive Vice-President Royal Philips ElectronicsChief Strategy Officer
Eric CoutinhoExecutive Vice-President Royal Philips ElectronicsChief Legal Officer
* Rudy Provoost will leave Philips as of September 30,2011.** Gottfried Dutiné will retire from Philips as ofDecember 31, 2011. *** Carole Wainaina will join Philips as of September 1,2011. She will succeed Hayko Kroese, the current GlobalHead of Human Resource Management.**** In the course of 2011, Jim Andrew will also take overthe innovation portfolio from Gottfried Dutiné.

18 Q2 Quarterly report and Semi-annual report
Forward-looking statementsForward-looking statements This document contains certain forward-lookingstatements with respect to the financial condition, resultsof operations and business of Philips and certain of theplans and objectives of Philips with respect to these items,in particular the sector sections “Miscellaneous”.Examples of forward-looking statements includestatements made about our strategy, estimates of salesgrowth, future EBITA and future developments in ourorganic business. By their nature, these statementsinvolve risk and uncertainty because they relate to futureevents and circumstances and there are many factors thatcould cause actual results and developments to differmaterially from those expressed or implied by thesestatements. These factors include but are not limited to domestic andglobal economic and business conditions, the successfulimplementation of our strategy and our ability to realizethe benefits of this strategy, our ability to develop andmarket new products, changes in legislation, legal claims,changes in exchange and interest rates, changes in taxrates, pension costs and actuarial assumptions, rawmaterials and employee costs, our ability to identify andcomplete successful acquisitions and to integrate thoseacquisitions into our business, our ability to successfullyexit certain businesses or restructure our operations, therate of technological changes, political, economic andother developments in countries where Philips operates,industry consolidation and competition. As a result,Philips’ actual future results may differ materially from theplans, goals and expectations set forth in such forward-looking statements. For a discussion of factors that couldcause future results to differ from such forward-lookingstatements, see the Risk management chapter included inour Annual Report 2010 and the “Risk and uncertainties”section in our semi-annual financial report for the sixmonths ended July 3, 2011.
Third-party market share data Statements regarding market share, including thoseregarding Philips’ competitive position, contained in thisdocument are based on outside sources such as researchinstitutes, industry and dealer panels in combination withmanagement estimates. Where information is not yetavailable to Philips, those statements may also be based onestimates and projections prepared by outside sources ormanagement. Rankings are based on sales unlessotherwise stated.
Use of non-GAAP information In presenting and discussing the Philips Group’s financial
position, operating results and cash flows, managementuses certain non-GAAP financial measures. These non-GAAP financial measures should not be viewed inisolation as alternatives to the equivalent IFRS measuresand should be used in conjunction with the most directlycomparable IFRS measures. A reconciliation of suchmeasures to the most directly comparable IFRS measuresis contained in this document. Further information onnon-GAAP measures can be found in our Annual Report2010.
Use of fair-value measurements In presenting the Philips Group’s financial position, fairvalues are used for the measurement of various items inaccordance with the applicable accounting standards.These fair values are based on market prices, whereavailable, and are obtained from sources that are deemedto be reliable. Readers are cautioned that these values aresubject to changes over time and are only valid at thebalance sheet date. When quoted prices or observablemarket data do not exist, we estimated the fair valuesusing appropriate valuation models and unobservableinputs. They require management to make significantassumptions with respect to future developments, whichare inherently uncertain and may therefore deviate fromactual developments. Critical assumptions used aredisclosed in our 2010 financial statements. Independentvaluations may have been obtained to supportmanagement’s determination of fair-values.
All amounts in millions of euros unless otherwise stated;data included are unaudited. Financial reporting is inaccordance with IFRS, unless otherwise stated. Thisdocument comprises regulated information within themeaning of the Dutch Financial Markets Supervision Act‘Wet op het Financieel Toezicht’.

Q2 Quarterly report and Semi-annual report 19
Semi-annual financial reportIntroduction
This report contains the semi-annual financial report ofKoninklijke Philips Electronics N.V. (‘the Company’), acompany with limited liability, headquartered inAmsterdam, the Netherlands. The principal activities ofthe Company and its group companies (the Philips Group)are described in note 4.
The semi-annual financial report for the six months endedJuly 3, 2011 consists of the condensed consolidated semi-annual financial statements, the semi-annual managementreport and responsibility statement by the Company’sBoard of Management. The information in this semi-annual financial report is unaudited.
The condensed consolidated semi-annual financialstatements do not include all the information anddisclosures required in the annual financial statements,and should be read in conjunction with the Company’sconsolidated IFRS financial statements for the year endedDecember 31, 2010.
The Board of Management of the Company herebydeclares that to the best of their knowledge, the semi-annual financial statements, which have been prepared in
accordance with the applicable financial reportingstandards for interim financial reporting, give a true andfair view of the assets, liabilities, financial position andprofit or loss of the Company and the undertakingsincluded in the consolidation taken as a whole, and thesemi-annual management report gives a fair review of theinformation required pursuant to section 5:25d(8)/(9) ofthe Dutch Financial Markets Supervision Act (Wet op hetFinancieel toezicht).
Amsterdam, July 18, 2011
Board of Management
Frans van Houten Ron Wirahadiraksa
Gottfried Dutiné Pieter Nota
Rudy Provoost Steve Rusckowski

20 Q2 Quarterly report and Semi-annual report
Management reportThe 1st six months of 2011
• The results for the first half of 2011 were mixed comparedto the first half of 2010, with Group sales at EUR 10.5billion, slightly above the 2010 level.
• On a comparable basis, sales grew 4%, with solid mid-single-digit growth in Latin America and India, while low-single-digit growth was visible in mature markets.
• EBITA declined EUR 190 million year-on-year, due tolower earnings at Lighting and Consumer Lifestyle as aresult of lower margins and higher spend.
• The net loss of EUR 1.2 billion is largely a result of the EUR1.4 billion impairment charge in Q2 2011, lower resultsrelated to discontinued operations, and a decline inoperating earnings.
Net incomein millions of euros unless otherwise stated
January-June 2010 2011
Sales 10,323 10,468
EBITA 999 809 as a % of sales 9.7 7.7
EBIT 763 (804)as a % of sales 7.4 (7.7)
Financial income and expenses (139) (76)
Income taxes (209) (140)
Results investments in associates 18 2
Income (loss) from continuing operations 433 (1,018)
Discontinued operations 30 (189)
Net income (loss) 463 (1,207)
Net income (loss) - shareholders percommon share (in euros) - basic 0.49 (1.26)
Performance of the Group• Group sales, at EUR 10.5 billion, were slightly above the
level of the first half of 2010, with higher sales recordedat Healthcare. Adjusted for currency impacts andportfolio changes, sales were 4% above last year’s level,with solid mid-single-digit growth at Healthcare andLighting.
• Group EBITA declined by EUR 190 million compared tothe first half of 2010, largely due to lower margins andhigher costs, notably at Lighting and ConsumerLifestyle.
• Net income was EUR 1.7 billion lower than in the firsthalf of 2010, mainly due to the EUR 1.4 billionimpairment charge in Q2 2011, lower results related todiscontinued operations, and lower operating earnings.
• Cash flow from operating activities was EUR 1.0 billionlower than in the first half of 2010, due to higherworking capital requirements, mainly related to vendorpayments, as well as higher pension and tax payments.
Q2 Quarterly report and Semi-annual report 21
Sales by sectorin millions of euros unless otherwise stated
January-June % change 2010 2011 nominal comparable
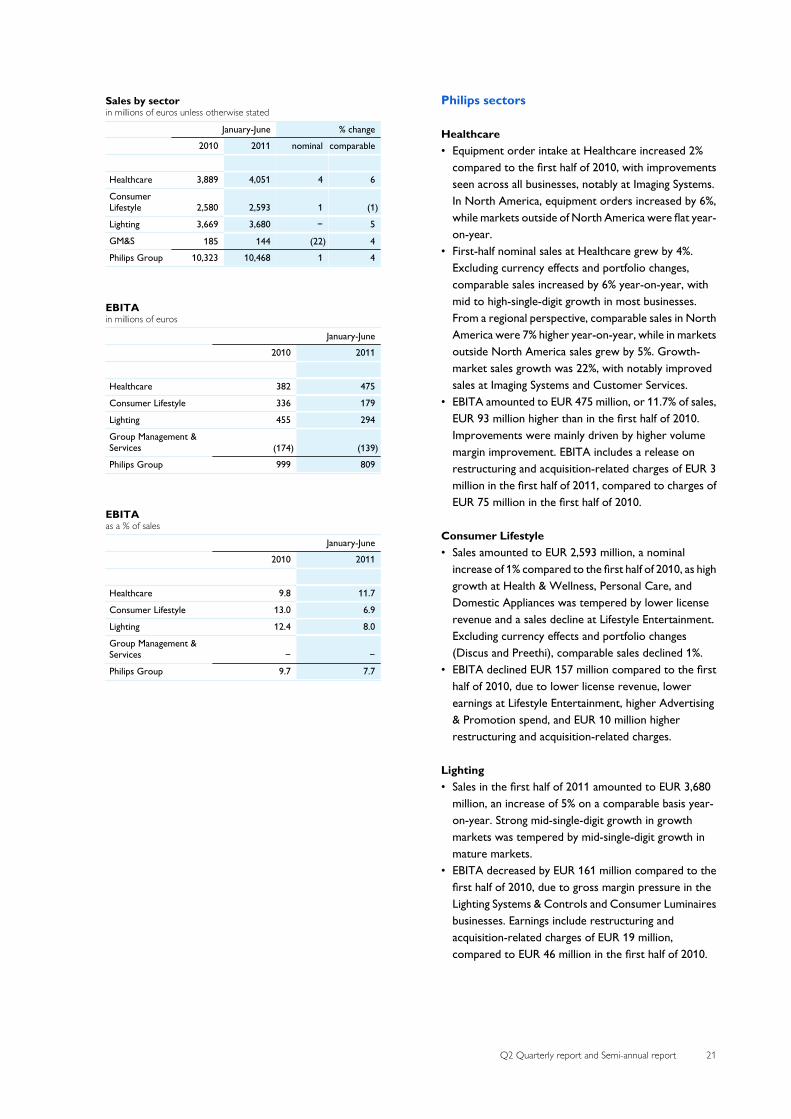
Healthcare 3,889 4,051 4 6
ConsumerLifestyle 2,580 2,593 1 (1)
Lighting 3,669 3,680 − 5
GM&S 185 144 (22) 4 Philips Group 10,323 10,468 1 4
EBITAin millions of euros
January-June 2010 2011
Healthcare 382 475
Consumer Lifestyle 336 179
Lighting 455 294
Group Management &Services (174) (139)Philips Group 999 809
EBITAas a % of sales
January-June 2010 2011
Healthcare 9.8 11.7
Consumer Lifestyle 13.0 6.9
Lighting 12.4 8.0
Group Management &Services − − Philips Group 9.7 7.7
Philips sectors
Healthcare• Equipment order intake at Healthcare increased 2%
compared to the first half of 2010, with improvementsseen across all businesses, notably at Imaging Systems.In North America, equipment orders increased by 6%,while markets outside of North America were flat year-on-year.
• First-half nominal sales at Healthcare grew by 4%.Excluding currency effects and portfolio changes,comparable sales increased by 6% year-on-year, withmid to high-single-digit growth in most businesses.From a regional perspective, comparable sales in NorthAmerica were 7% higher year-on-year, while in marketsoutside North America sales grew by 5%. Growth-market sales growth was 22%, with notably improvedsales at Imaging Systems and Customer Services.
• EBITA amounted to EUR 475 million, or 11.7% of sales,EUR 93 million higher than in the first half of 2010.Improvements were mainly driven by higher volumemargin improvement. EBITA includes a release onrestructuring and acquisition-related charges of EUR 3million in the first half of 2011, compared to charges ofEUR 75 million in the first half of 2010.
Consumer Lifestyle• Sales amounted to EUR 2,593 million, a nominal
increase of 1% compared to the first half of 2010, as highgrowth at Health & Wellness, Personal Care, andDomestic Appliances was tempered by lower licenserevenue and a sales decline at Lifestyle Entertainment.Excluding currency effects and portfolio changes(Discus and Preethi), comparable sales declined 1%.
• EBITA declined EUR 157 million compared to the firsthalf of 2010, due to lower license revenue, lowerearnings at Lifestyle Entertainment, higher Advertising& Promotion spend, and EUR 10 million higherrestructuring and acquisition-related charges.
Lighting• Sales in the first half of 2011 amounted to EUR 3,680
million, an increase of 5% on a comparable basis year-on-year. Strong mid-single-digit growth in growthmarkets was tempered by mid-single-digit growth inmature markets.
• EBITA decreased by EUR 161 million compared to thefirst half of 2010, due to gross margin pressure in theLighting Systems & Controls and Consumer Luminairesbusinesses. Earnings include restructuring andacquisition-related charges of EUR 19 million,compared to EUR 46 million in the first half of 2010.

22 Q2 Quarterly report and Semi-annual report
Group Management & Services• EBITA amounted to a net cost of EUR 139 million, a
cost decrease of EUR 35 million year-on-year, driven byhigher license revenues, lower expenses at Researchand gains on real estate transactions.
Risks and uncertaintiesIn our Annual Report 2010 we extensively describedcertain risk categories and risk factors which could have amaterial adverse effect on our financial position andresults. Those risk categories and risk factors are deemedincorporated and repeated in this report by reference.
Additional risks not known to us, or currently believednot to be material, could later turn out to have a materialimpact on our businesses, objectives, revenues, income,assets, liquidity or capital resources.
Q2 Quarterly report and Semi-annual report 23
Consolidated statements of incomeall amounts in millions of euros unless otherwise stated
2nd quarter January-June 2010 2011 2010 2011
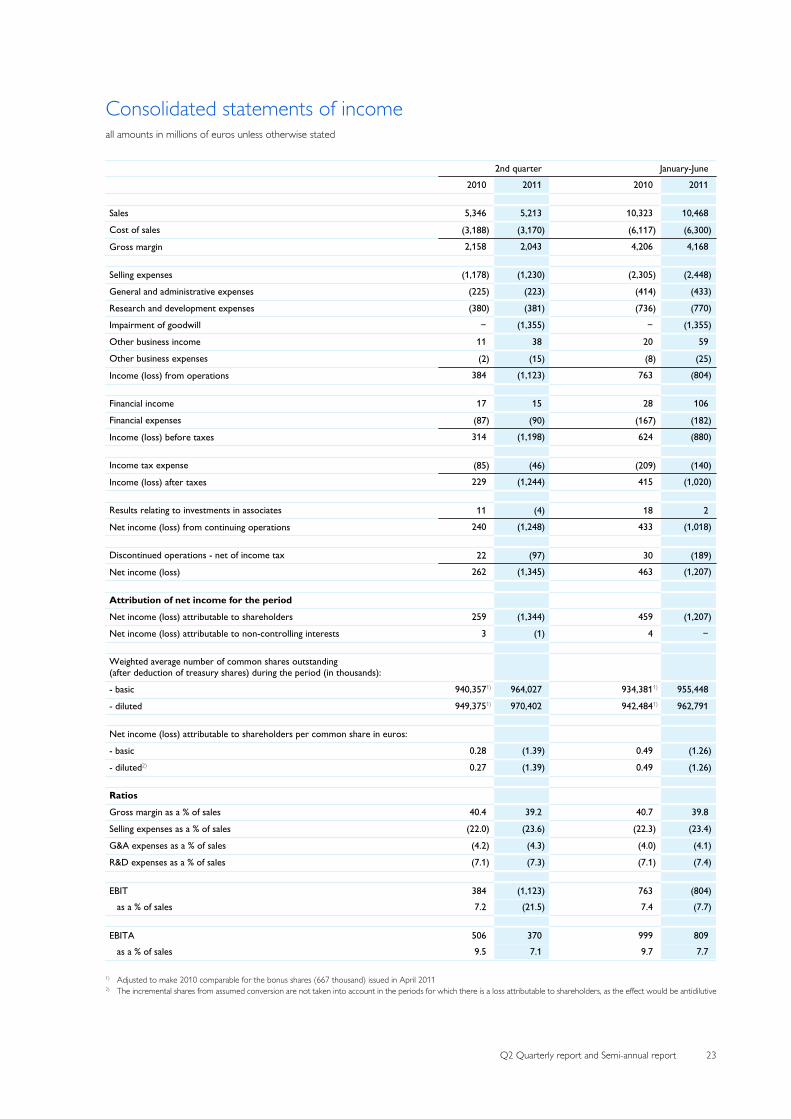
Sales 5,346 5,213 10,323 10,468
Cost of sales (3,188) (3,170) (6,117) (6,300)
Gross margin 2,158 2,043 4,206 4,168
Selling expenses (1,178) (1,230) (2,305) (2,448)
General and administrative expenses (225) (223) (414) (433)
Research and development expenses (380) (381) (736) (770)
Impairment of goodwill − (1,355) − (1,355)
Other business income 11 38 20 59
Other business expenses (2) (15) (8) (25)
Income (loss) from operations 384 (1,123) 763 (804)
Financial income 17 15 28 106
Financial expenses (87) (90) (167) (182)
Income (loss) before taxes 314 (1,198) 624 (880)
Income tax expense (85) (46) (209) (140)
Income (loss) after taxes 229 (1,244) 415 (1,020)
Results relating to investments in associates 11 (4) 18 2
Net income (loss) from continuing operations 240 (1,248) 433 (1,018)
Discontinued operations - net of income tax 22 (97) 30 (189)
Net income (loss) 262 (1,345) 463 (1,207)
Attribution of net income for the period
Net income (loss) attributable to shareholders 259 (1,344) 459 (1,207)
Net income (loss) attributable to non-controlling interests 3 (1) 4 −
Weighted average number of common shares outstanding (after deduction of treasury shares) during the period (in thousands):
- basic 940,3571) 964,027 934,3811) 955,448
- diluted 949,3751) 970,402 942,4841) 962,791
Net income (loss) attributable to shareholders per common share in euros:
- basic 0.28 (1.39) 0.49 (1.26)
- diluted2) 0.27 (1.39) 0.49 (1.26)
Ratios
Gross margin as a % of sales 40.4 39.2 40.7 39.8
Selling expenses as a % of sales (22.0) (23.6) (22.3) (23.4)
G&A expenses as a % of sales (4.2) (4.3) (4.0) (4.1)
R&D expenses as a % of sales (7.1) (7.3) (7.1) (7.4)
EBIT 384 (1,123) 763 (804)as a % of sales 7.2 (21.5) 7.4 (7.7)
EBITA 506 370 999 809 as a % of sales 9.5 7.1 9.7 7.7
1) Adjusted to make 2010 comparable for the bonus shares (667 thousand) issued in April 20112) The incremental shares from assumed conversion are not taken into account in the periods for which there is a loss attributable to shareholders, as the effect would be antidilutive

24 Q2 Quarterly report and Semi-annual report
Consolidated statements of comprehensive incomeall amounts in millions of euros
2nd quarter January-June 2010 2011 2010 2011
Net income (loss) for the period: 262 (1,345) 463 (1,207)
Other comprehensive income:
Actuarial losses on pension plans:
Net current period change, before tax − − − − Income tax on net current period change − (1) (4) (3)
Revaluation reserve:
Release revaluation reserve (4) (4) (8) (8)Reclassification into retained earnings 4 4 8 8
Currency translation differences:
Net current period change, before tax 568 (112) 954 (451)
Income tax on net current period change (5) − (9) 3 Reclassification adjustment for (income) loss realized 0 3 (2) 3
Available-for-sale financial assets:
Net current period change (47) (19) 1 (42)
Income tax on net current period change − 13 − 13 Reclassification adjustment for (income) loss realized (4) 11 (4) (47)
Cash flow hedges:
Net current period change, before tax (34) (15) (44) (23)
Income tax on net current period change 9 3 11 2 Reclassification adjustment for (income) loss realized (1) 1 (4) 6
Other comprehensive (income) loss for the period 486 (116) 899 (539)
Total comprehensive income (loss) for the period 748 (1,461) 1,362 (1,746)
Total comprehensive income (loss) attributable to:
Shareholders 745 (1,460) 1,358 (1,746)
Non-controlling interests 3 (1) 4 −

Q2 Quarterly report and Semi-annual report 25
Consolidated balance sheetsin millions of euros unless otherwise stated
July 4, December 31, July 3, 2010 2010 2011
Non-current assets:
Property, plant and equipment 3,4211) 3,1451) 2,866
Goodwill 8,589 8,035 6,180
Intangible assets excluding goodwill 4,612 4,198 3,796
Non-current receivables 104 88 102
Investments in associates 191 181 164
Other non-current financial assets 764 479 367
Deferred tax assets 1,390 1,351 1,304 Other non-current assets 1,714 75 210
Total non-current assets 20,785 17,552 14,989
Current assets:
Inventories - net 3,928 3,865 3,760
Other current financial assets 195 5 3
Other current assets 398 348 419
Derivative financial assets 238 112 137
Income tax receivable 85 79 108
Receivables 4,183 4,355 3,850
Assets classified as held for sale 91) 1201) 614 Cash and cash equivalents 4,493 5,833 3,260
Total current assets 13,529 14,717 12,151
Total assets 34,314 32,269 27,140
Shareholders’ equity 15,736 15,046 13,086 Non-controlling interests 61 46 30
Group equity 15,797 15,092 13,116
Non-current liabilities:
Long-term debt 3,053 2,818 2,703
Long-term provisions 1,803 1,716 1,687
Deferred tax liabilities 519 171 55 Other non-current liabilities 2,307 1,714 1,616
Total non-current liabilities 7,682 6,419 6,061
Current liabilities:
Short-term debt 1,746 1,840 713
Derivative financial liabilities 1,049 564 310
Income tax payable 279 291 206
Accounts and notes payable 3,462 3,691 2,585
Accrued liabilities 2,804 2,995 2,601
Short-term provisions 732 623 527
Liabilities directly associated with assets held for sale − − 427 Other current liabilities 763 754 594
Total current liabilities 10,835 10,758 7,963
Total liabilities and group equity 34,314 32,269 27,140

26 Q2 Quarterly report and Semi-annual report
July 4, December 31, July 3, 2010 2010 2011
Number of common shares outstanding (after deduction of treasury shares) at the endof period (in thousands) 945,312 946,506 972,436
Ratios
Shareholders’ equity per common share in euros 16.65 15.90 13.46
Inventories as a % of sales2) 16.8 15.6 16.8
Net debt : group equity 2:98 (8):108 1:99
Net operating capital 14,0741) 11,9511) 11,302
Employees at end of period 116,590 119,001 123,857 of which discontinued operations 4,516 3,610 3,506
1) Revised to reflect an adjusted property, plant and equipment reclassification to assets classified as held for sale2) Excludes discontinued operations for both inventories and sales figures. Inventories excluding discontinued operations are disclosed in quarterly statistics.
Q2 Quarterly report and Semi-annual report 27
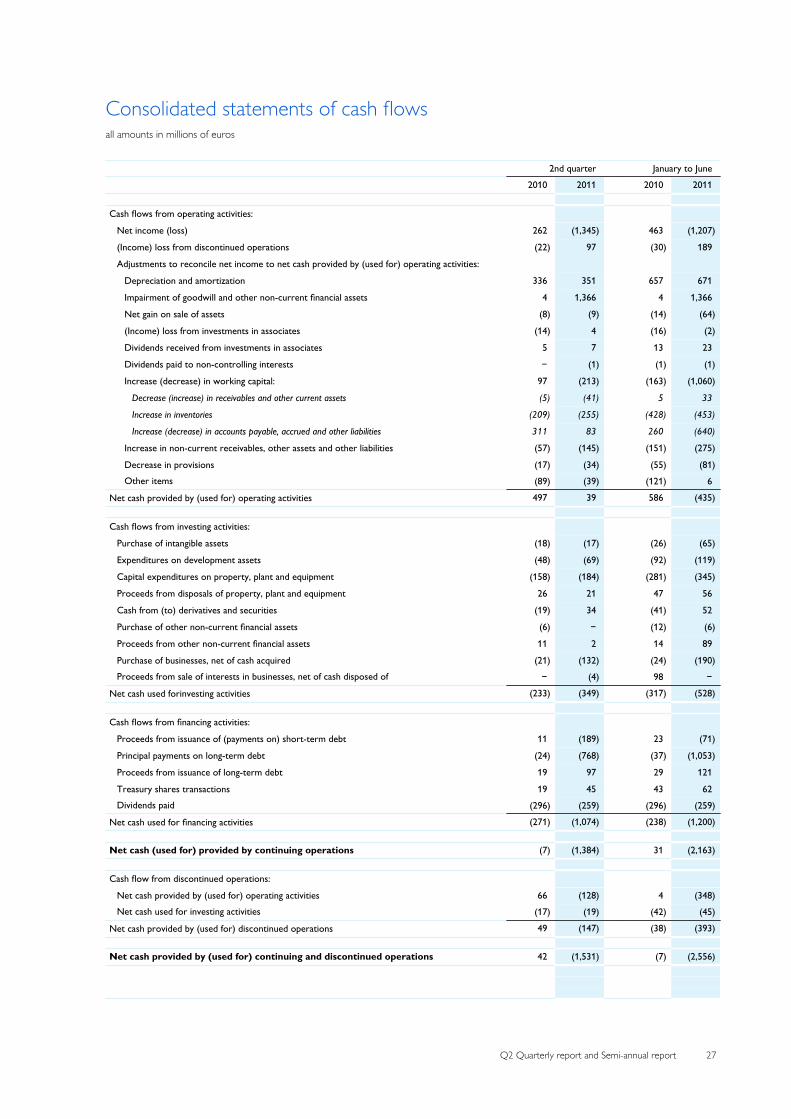
Consolidated statements of cash flowsall amounts in millions of euros
2nd quarter January to June 2010 2011 2010 2011
Cash flows from operating activities:
Net income (loss) 262 (1,345) 463 (1,207)
(Income) loss from discontinued operations (22) 97 (30) 189
Adjustments to reconcile net income to net cash provided by (used for) operating activities:
Depreciation and amortization 336 351 657 671
Impairment of goodwill and other non-current financial assets 4 1,366 4 1,366
Net gain on sale of assets (8) (9) (14) (64)
(Income) loss from investments in associates (14) 4 (16) (2)
Dividends received from investments in associates 5 7 13 23
Dividends paid to non-controlling interests − (1) (1) (1)
Increase (decrease) in working capital: 97 (213) (163) (1,060)
Decrease (increase) in receivables and other current assets (5) (41) 5 33
Increase in inventories (209) (255) (428) (453)
Increase (decrease) in accounts payable, accrued and other liabilities 311 83 260 (640)
Increase in non-current receivables, other assets and other liabilities (57) (145) (151) (275)
Decrease in provisions (17) (34) (55) (81)Other items (89) (39) (121) 6
Net cash provided by (used for) operating activities 497 39 586 (435)
Cash flows from investing activities:
Purchase of intangible assets (18) (17) (26) (65)
Expenditures on development assets (48) (69) (92) (119)
Capital expenditures on property, plant and equipment (158) (184) (281) (345)
Proceeds from disposals of property, plant and equipment 26 21 47 56
Cash from (to) derivatives and securities (19) 34 (41) 52
Purchase of other non-current financial assets (6) − (12) (6)
Proceeds from other non-current financial assets 11 2 14 89
Purchase of businesses, net of cash acquired (21) (132) (24) (190)Proceeds from sale of interests in businesses, net of cash disposed of − (4) 98 −
Net cash used forinvesting activities (233) (349) (317) (528)
Cash flows from financing activities:
Proceeds from issuance of (payments on) short-term debt 11 (189) 23 (71)
Principal payments on long-term debt (24) (768) (37) (1,053)
Proceeds from issuance of long-term debt 19 97 29 121
Treasury shares transactions 19 45 43 62 Dividends paid (296) (259) (296) (259)
Net cash used for financing activities (271) (1,074) (238) (1,200)
Net cash (used for) provided by continuing operations (7) (1,384) 31 (2,163)
Cash flow from discontinued operations:
Net cash provided by (used for) operating activities 66 (128) 4 (348)Net cash used for investing activities (17) (19) (42) (45)
Net cash provided by (used for) discontinued operations 49 (147) (38) (393)
Net cash provided by (used for) continuing and discontinued operations 42 (1,531) (7) (2,556)
28 Q2 Quarterly report and Semi-annual report
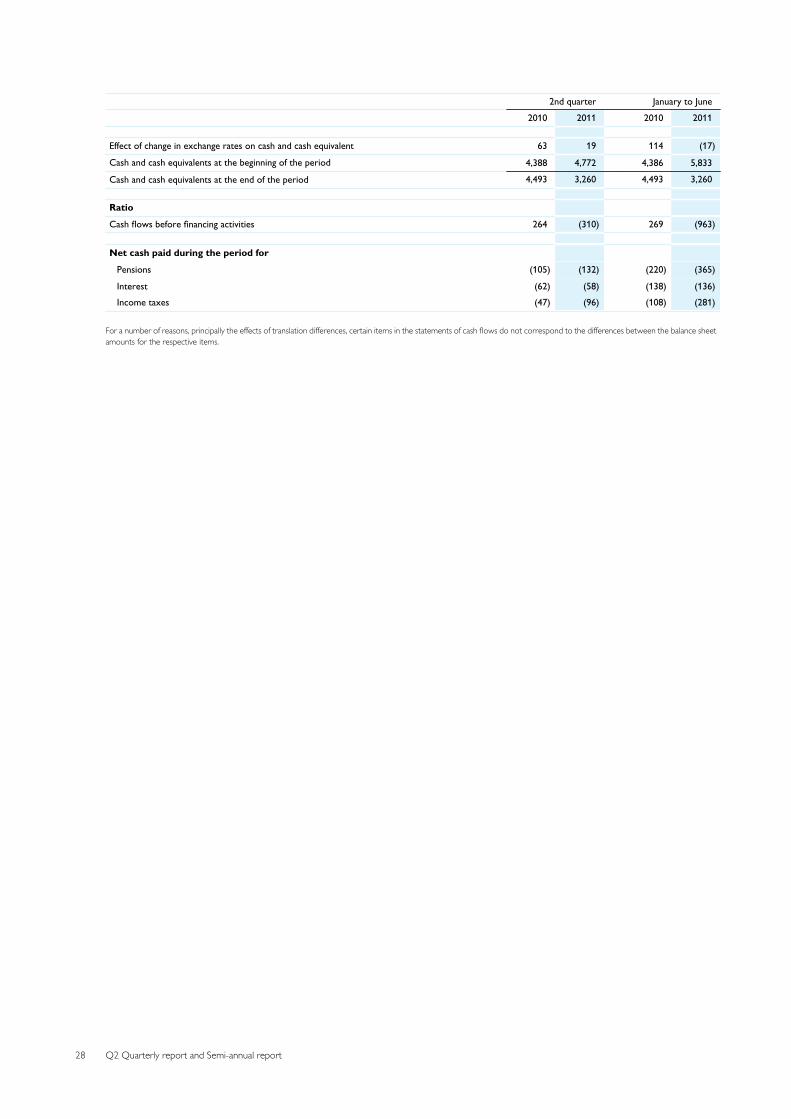
2nd quarter January to June 2010 2011 2010 2011
Effect of change in exchange rates on cash and cash equivalent 63 19 114 (17)
Cash and cash equivalents at the beginning of the period 4,388 4,772 4,386 5,833
Cash and cash equivalents at the end of the period 4,493 3,260 4,493 3,260
Ratio
Cash flows before financing activities 264 (310) 269 (963)
Net cash paid during the period for
Pensions (105) (132) (220) (365)
Interest (62) (58) (138) (136)Income taxes (47) (96) (108) (281)
For a number of reasons, principally the effects of translation differences, certain items in the statements of cash flows do not correspond to the differences between the balance sheetamounts for the respective items.

Q2 Quarterly report and Semi-annual report 29
Consolidated statements of changes in equityin millions of euros
other reserves
com-mon
shares
capitalin ex-
cess ofpar val-
ue
re-tainedearn-
ings
revalu-ation
re-serve
curren-cy
transla-tion dif-
feren-ces
unreal-ized gain(loss) onavailable-
for-salefinancial
assets
changesin fair
value ofcashflow
hedges total
treas-ury
sharesat cost
totalshare-hold-
ers’equity
non-con-
trollinginter-
ests total
equity
January-June 2011
Balance as of December 31, 2010 197 354 15,416 86 (65) 139 (5) 69 (1,076) 15,046 46 15,092
Total comprehensive income (1,202) (8) (445) (76) (15) (536) (1,746) − (1,746)
Dividend distributed 5 443 (711) (263) (263)
Movement non-controlling interest (5) (5) (16) (21)
Re-issuance of treasury shares (32) (2) 63 29 29
Share-based compensation plans 28 28 28
Income tax share-based compensationplans (3) (3) (3)
5 436 (718) 63 (214) (16) (230)
Balance as of July 3, 2011 202 790 13,496 78 (510) 63 (20) (467) (1,013) 13,086 30 13,116
January-June 2010
Balance as of December 31, 2009 194 - 15,947 102 (591) 120 10 (461) (1,187) 14,595 49 14,644
Total comprehensive income 463 (8) 943 (3) (37) 903 1,358 4 1,362
Dividend distributed 3 343 (650) (304) (304)
Movement non-controlling interest 8 8
Re-issuance of treasury shares (46) 8 86 48 48
Share-based compensation plans 29 29 29
Income tax share-based compensationplans 10 10 10
3 336 (642) 86 (217) 8 (209)
Balance as of July 4, 2010 197 336 15,768 94 352 117 (27) 442 (1,101) 15,736 61 15,797
30 Q2 Quarterly report and Semi-annual report
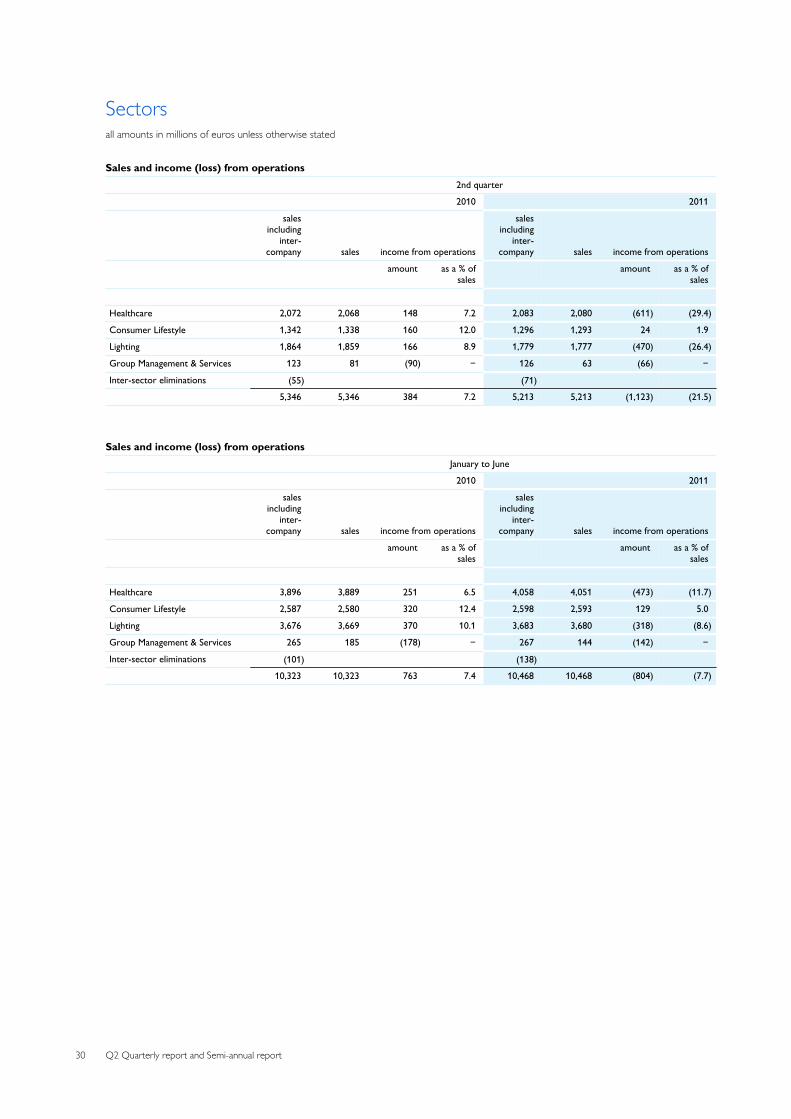
Sectorsall amounts in millions of euros unless otherwise stated
Sales and income (loss) from operations2nd quarter
2010 2011
salesincluding
inter-company sales income from operations
salesincluding
inter-company sales income from operations
amount as a % of
sales amount as a % of
sales
Healthcare 2,072 2,068 148 7.2 2,083 2,080 (611) (29.4)
Consumer Lifestyle 1,342 1,338 160 12.0 1,296 1,293 24 1.9
Lighting 1,864 1,859 166 8.9 1,779 1,777 (470) (26.4)
Group Management & Services 123 81 (90) − 126 63 (66) −
Inter-sector eliminations (55) (71) 5,346 5,346 384 7.2 5,213 5,213 (1,123) (21.5)
Sales and income (loss) from operationsJanuary to June
2010 2011
salesincluding
inter-company sales income from operations
salesincluding
inter-company sales income from operations
amount as a % of
sales amount as a % of
sales
Healthcare 3,896 3,889 251 6.5 4,058 4,051 (473) (11.7)
Consumer Lifestyle 2,587 2,580 320 12.4 2,598 2,593 129 5.0
Lighting 3,676 3,669 370 10.1 3,683 3,680 (318) (8.6)
Group Management & Services 265 185 (178) − 267 144 (142) −
Inter-sector eliminations (101) (138) 10,323 10,323 763 7.4 10,468 10,468 (804) (7.7)

Q2 Quarterly report and Semi-annual report 31
Sectors and main countriesin millions of euros
Sales and total assetssales total assets
January to June July 4, July 3,
2010 2011 2010 2011
Healthcare 3,889 4,051 12,550 10,297
Consumer Lifestyle 2,580 2,593 3,904 3,325
Lighting 3,669 3,680 7,766 6,644
Group Management & Services 185 144 10,094 6,260 10,323 10,468 34,305 26,526
Assets classified as held for sale 91) 614 34,314 27,140
1) Revised to reflect an adjusted property, plant and equipment reclassification to assets classified as held for sale
Sales and tangible and intangible assetssales tangible and intangible assets1)
January to June July 4, July 3,
20102) 2011 20102,3) 2011
Netherlands 328 329 1,206 920
United States 3,061 2,998 10,671 7,967
China 874 939 824 733
Germany 637 641 286 169
France 534 478 117 93
Japan 423 427 570 556
Brazil 298 336 140 18
Other countries 4,168 4,320 2,809 2,386 10,323 10,468 16,622 12,842
1) Includes property, plant and equipment, intangible assets excluding goodwill, and goodwill2) Revised to reflect an adjusted country allocation3) Revised to reflect an adjusted property, plant and equipment reclassification to assets classified as held for sale

32 Q2 Quarterly report and Semi-annual report
Pension costsin millions of euros
Specification of pension costs2nd quarter
2010 2011
Netherlands other total Netherlands other total
Costs of defined-benefit plans (pensions)
Service cost 23 21 44 32 17 49
Interest cost on the defined-benefit obligation 131 110 241 139 99 238
Expected return on plan assets (186) (93) (279) (179) (96) (275)
Prior service cost − (1) (1) − 1 1
Curtailments − − − − (15) (15)
Net periodic cost (income) (32) 37 5 (8) 6 (2)of which discontinued operations − − − 1 1 2
Costs of defined-contribution plans 2 29 31 2 24 26 of which discontinued operations − 1 1 − − −
Costs of defined-benefit plans (retireemedical)
Service cost − − − − 1 1
Interest cost on the defined-benefit obligation − 6 6 − 4 4
Prior service cost − (1) (1) − (1) (1)
Net periodic cost − 5 5 − 4 4 of which discontinued operations − − − − − −
Specification of pension costsJanuary to June
2010 2011
Netherlands other total Netherlands other total
Costs of defined-benefit plans (pensions)
Service cost 46 39 85 64 36 100
Interest cost on the defined-benefit obligation 261 211 472 278 201 479
Expected return on plan assets (372) (176) (548) (357) (193) (550)
Prior service cost − (1) (1) − 1 1
Curtailments − − − − (15) (15)
Net periodic cost (income) (65) 73 8 (15) 30 15 of which discontinued operations 1 − 1 2 1 3
Costs of defined-contribution plans 4 58 62 4 57 61 of which discontinued operations − 2 2 − 1 1
Costs of defined-benefit plans (retireemedical)
Service cost − 1 1 − 1 1
Interest cost on the defined-benefit obligation − 11 11 − 9 9
Prior service cost − (2) (2) − (2) (2)
Net periodic cost − 10 10 − 8 8 of which discontinued operations − − − − − −

Q2 Quarterly report and Semi-annual report 33
Reconciliation of non-GAAP performance measuresall amounts in millions of euros unless otherwise stated.
Certain non-GAAP financial measures are presented when discussing the Philips Group’s performance. In the following tables, areconciliation to the most directly comparable IFRS performance measure is made.
Sales growth composition (in %)2nd quarter January to June
comparablegrowth
currencyeffects
consolid-ation
changes nominalgrowth
comparablegrowth
currencyeffects
consolid-ation
changes nominalgrowth
2011 versus 2010
Healthcare 7.5 (6.9) − 0.6 6.1 (1.8) (0.1) 4.2
Consumer Lifestyle (1.7) (4.3) 2.6 (3.4) (0.9) (0.9) 2.3 0.5
Lighting 3.7 (5.9) (2.2) (4.4) 4.7 (1.2) (3.2) 0.3
GM&S 27.3 (0.2) (49.3) (22.2) 4.2 0.5 (26.9) (22.2)Philips Group 4.0 (5.8) (0.7) (2.5) 3.8 (1.4) (1.0) 1.4
EBITA (or Adjusted income from operations) to Income from operations (or EBIT)
Philips Group Healthcare Consumer
Lifestyle Lighting GM&S
January to June 2011
EBITA (or Adjusted income from operations) 809 475 179 294 (139)
Amortization of intangibles1) (258) (124) (50) (81) (3)
Impairment of goodwill (1,355) (824) − (531) −
Income from operations (or EBIT) (804) (473) 129 (318) (142)
January to June 2010
EBITA (or Adjusted income from operations) 999 382 336 455 (174)
Amortization of intangibles1) (236) (131) (16) (85) (4)Income from operations (or EBIT) 763 251 320 370 (178)
1) Excluding amortization of software and product development
Composition of net debt to group equityJuly 4, December 31, July 3,
2010 2010 2011
Long-term debt 3,053 2,818 2,703
Short-term debt 1,746 1,840 713
Total debt 4,799 4,658 3,416
Cash and cash equivalents 4,493 5,833 3,260
Net debt (cash) (total debt less cash and cash equivalents) 306 (1,175) 156
Shareholders’ equity 15,736 15,046 13,086
Non-controlling interests 61 46 30
Group equity 15,797 15,092 13,116
Net debt and group equity 16,103 13,917 13,272
Net debt divided by net debt and group equity (in %) 2 (8) 1
Group equity divided by net debt and group equity (in %) 98 108 99

34 Q2 Quarterly report and Semi-annual report
Reconciliation of non-GAAP performance measures (continued)all amounts in millions of euros
Net operating capital to total assets
Philips Group Healthcare Consumer
Lifestyle Lighting GM&S
July 3, 2011
Net operating capital (NOC) 11,302 7,534 1,463 5,021 (2,716)
Exclude liabilities comprised in NOC:
- payables/liabilities 7,912 2,363 1,445 1,330 2,774
- intercompany accounts − 73 109 51 (233)- provisions 2,214 255 308 221 1,430
Include assets not comprised in NOC:
- investments in associates 164 72 − 21 71
- other current financial assets 3 − − − 3
- other non-current financial assets 367 − − − 367
- deferred tax assets 1,304 − − − 1,304 - cash and cash equivalents 3,260 − − − 3,260
26,526 10,297 3,325 6,644 6,260
Assets classified as held for sale 614
Total assets 27,140
December 31, 2010
Net operating capital (NOC) 11,951 8,908 911 5,561 (3,429)1)
Exclude liabilities comprised in NOC:
- payables/liabilities 10,009 2,603 2,509 1,485 3,412
- intercompany accounts − 54 95 68 (217)- provisions 2,339 321 342 247 1,429
Include assets not comprised in NOC:
- investments in associates 181 76 1 18 86
- other current financial assets 6 − − − 6
- other non-current financial assets 479 − − − 479
- deferred tax assets 1,351 − − − 1,351 - cash and cash equivalents 5,833 − − − 5,833
32,149 11,962 3,858 7,379 8,950
Assets classified as held for sale1) 120
Total assets 32,269
July 4, 2010
Net operating capital (NOC) 14,074 9,545 1,055 5,934 (2,460)1)
Exclude liabilities comprised in NOC:
- payables/liabilities 10,664 2,521 2,358 1,443 4,342
- intercompany accounts − 49 94 76 (219)- provisions 2,535 355 396 290 1,494
Include assets not comprised in NOC:
- investments in associates 191 80 1 23 87
- other current financial assets 194 − − − 194
- other non-current financial assets 764 − − − 764
- deferred tax assets 1,390 − − − 1,390 - cash and cash equivalents 4,493 − − − 4,493
34,305 12,550 3,904 7,766 10,085
Assets classified as held for sale1) 9
Total assets 34,314
1) Revised to reflect an adjusted property, plant and equipment reclassification to assets classified as held for sale

Q2 Quarterly report and Semi-annual report 35
Reconciliation of non-GAAP performance measures (continued)all amounts in millions of euros
Composition of cash flows2nd quarter January to June
2010 2011 2010 2011
Cash flows provided by (used for) operating activities 497 39 586 (435)
Cash flows used for investing activities (233) (349) (317) (528)
Cash flows before financing activities 264 (310) 269 (963)
Cash flows provided by (used for) operating activities 497 39 586 (435)
Purchase of intangible assets (18) (17) (26) (65)
Expenditures on development assets (48) (69) (92) (119)
Capital expenditures on property, plant and equipment (158) (184) (281) (345)Proceeds from disposals of property, plant and equipment 26 21 47 56
Net capital expenditures (198) (249) (352) (473)
Free cash flows 299 (210) 234 (908)

36 Q2 Quarterly report and Semi-annual report
Philips quarterly statisticsall amounts in millions of euros unless otherwise stated
2010 2011 1st
quarter 2nd
quarter 3rd
quarter 4th
quarter 1st
quarter 2nd
quarter 3rd
quarter 4th
quarter
Sales 4,977 5,346 5,455 6,491 5,255 5,213 % increase 13 15 12 5 6 (2)
EBITA 493 506 646 917 439 370 as a % of sales 9.9 9.5 11.8 14.1 8.4 7.1
EBIT 379 384 517 800 319 (1,123) as a % of sales 7.6 7.2 9.5 12.3 6.1 (21.5)
Net income (loss) 201 262 524 465 138 (1,345)
Net income (loss) - shareholders percommon share in euros - basic 0.22 0.28 0.55 0.49 0.14 (1.39)
January- March
January- June
January- September
January- December
January- March
January- June
January- September
January- December
Sales 4,977 10,323 15,778 22,269 5,255 10,468 % increase 13 14 14 11 6 1
EBITA 493 999 1,645 2,562 439 809 as a % of sales 9.9 9.7 10.4 11.5 8.4 7.7
EBIT 379 763 1,280 2,080 319 (804) as a % of sales 7.6 7.4 8.1 9.3 6.1 (7.7)
Net income (loss) 201 463 987 1,452 138 (1,207)
Net income (loss) - shareholders percommon share in euros - basic 0.22 0.49 1.05 1.54 0.14 (1.26)
Net income (loss) from continuingoperations as a % of shareholders’ equity 5.6 6.3 9.1 9.8 6.6 (14.8)
period ended 2010 period ended 2011
Inventories as a % of sales1) 15.1 16.8 16.7 15.6 15.6 16.8 Inventories excluding discontinuedoperations 3,116 3,587 3,666 3,479 3,528 3,760
Net debt : group equity ratio 1:99 2:98 1:99 (8):108 (3):103 1:99
Total employees (in thousands) 116 117 118 119 121 124 of which discontinued operations 5 5 4 4 4 4
1) Excludes discontinued operations for both inventories and sales figures
Information also available on Internet, address: www.philips.com/investorrelations

Q2 Quarterly report and Semi-annual report 37
Adjusted statementsThe cash flow reporting of discontinued operations fromthe press release on the first quarter of 2011 has beenadjusted to reflect operational result reporting of theTelevision business. New insights have led to immaterial changes on thecomparatives of cash flow and income statements andhave led to a reclassification of certain net operatingcapital elements of the Television business transfer to thelong-term strategic partnership with TPV.
The following table presents the adjusted cash flowstatements from the press release on the first quarter of2011.
Adjusted statements of cash flowsQ1 Q1
2010 2011
Cash flows from operating activities:
Net income (loss) 201 138
Gain (loss) on discontinued operations (8) 92
Adjustments to reconcile net income to net cashprovided by (used for) operating activities:
Depreciation and amortization 321 320
Net gain on sale of assets (6) (55)
Income from investments in associates (2) (6)
Dividends received from investments inassociates 8 16
Dividends paid to non-controlling interests (1) −
Increase in working capital: (260) (847)
Decrease in receivables and other current assets 10 74
Increase in inventories (219) (198)
Decrease in accounts payable, accrued and otherliabilities (51) (723)
Increase in non-current receivables/other assets/other liabilities (94) (130)
Decrease in provisions (38) (47)Other items (32) 45
Net cash (used for) provided by operating activities 89 (474)
Cash flows from investing activities:
Purchase of intangible assets (8) (48)
Expenditures on development assets (44) (50)
Capital expenditures on property, plant andequipment (123) (161)
Proceeds from disposals of property, plant andequipment 21 35
Cash from (to) derivatives and securities (22) 18
Purchase of other non-current financial assets (6) (6)
Proceeds from other non-current financial assets 3 87
Purchase of businesses, net of cash acquired (3) (58)Proceeds from sale of interests in businesses 98 4
Net cash used for investing activities (84) (179)
Cash flows from financing activities:
Decrease in short-term debt 12 118
Principal payments on long-term debt (13) (285)
Proceeds from issuance of long-term debt 10 24 Treasury shares transactions 24 17
Net cash provided by financing activities 33 (126)
Net increase (decrease) in cash and cashequivalents 38 (779)
Cash flow from discontinued operations:
Net cash used for operating activities (62) (220)Net cash used for investing activities (25) (26)
Net cash used for discontinued operations (87) (246)
Net cash used for continued and discontinuedoperations (49) (1,025)

38 Q2 Quarterly report and Semi-annual report
Notes overview
Notes to the unaudited semi-annualconsolidated financial statements 1 Significant accounting policies 392 Estimates 403 Financial risk management 404 Segment information 405 Seasonality 406 Discontinued operations and other assets
classified as held for sale41
7 Acquisitions and divestments 418 Income taxes 419 Property, plant and equipment 4110 Goodwill 4211 Intangible assets excluding goodwill 4312 Other non-current financial assets 4413 Inventories 4414 Shareholders’ equity 4415 Short-term and long-term debt 4416 Provisions 4517 Accrued liabilities 4518 Pensions 4519 Contingent liabilities 4520 Related-party transactions 4621 Share-based compensation 4622 Subsequent events 47
Q2 Quarterly report and Semi-annual report 39
Notes to the unaudited semi-annual consolidated financial statementsall amounts in millions of euros unless otherwise stated
This report contains the semi-annual financial report ofKoninklijke Philips Electronics N.V. (‘the Company’), acompany with limited liability, headquartered inAmsterdam, the Netherlands. The principal activities ofthe Company and its group companies (the Philips Group)are described in note 4.
The semi-annual financial statements have been preparedin accordance with IAS 34 ‘Interim Financial Reporting’ asadopted by the European Union.
1 Significant accounting policies
The significant accounting policies applied in these semi-annual financial statements are consistent with thoseapplied in the Company’s Consolidated IFRS financialstatements as at and for the year ended December 31,2010, except for the adoption of the following newstandards, amendments to standards and interpretations,which have been adopted as relevant for the Company forthe first time. These standards and interpretations haveno material effect on the Company’s semi-annual financialstatements; however, some of these standards haveaffected disclosures.
• ‘Improvements to IFRSs 2010’• IAS 24 ‘Related Party Disclosures’• IAS 32 ‘Financial Instruments’• IAS 34 ‘Interim Financial Reporting’• IFRIC 14 ‘The Limit on a Defined Benefit Asset, Minimum
Funding Requirements and their Interaction’• IFRIC 19 ‘Extinguishing Financial Liabilities with Equity
Instruments’
The following new standards and amendments to existingstandards have been published and are mandatory for theCompany beginning on or after January 1, 2012 or laterperiods. The Company has not early adopted thesestandards.
IAS 19 ‘Employee benefits’
The revisions to IAS 19 are effective for annual periodsbeginning on or after January 1, 2013. In general, theamendment no longer allows for deferral of actuarial gainsand losses or cost of plan changes, and it introducessignificant changes to the recognition and measurement ofdefined-benefit pension expenses and their presentationin the income statement. Additional disclosurerequirements have been added for risks and plan
objectives, and the distinction between short-term andother long-term benefits has been revised. The revisionsfurther clarify the classification of various costs involved inbenefit plans like expenses and taxes.The amendment will have a material impact on incomefrom operations and net income of the Company,resulting from the changes in measurement and reportingof expected returns on plan assets (and interest costs),which is currently reported under income fromoperations. The revised standard requires expectedreturn on plan assets recognized in profit or loss to becalculated based on the rate used to discount the definedbenefit obligation. There is no impact on the cash flowstatement and the balance sheet, since the Companyalready applies immediate recognition of actuarial gainsand losses.
IFRS 9 ‘Financial Instruments’
The standard introduces certain new requirements forclassifying and measuring financial assets and liabilities.IFRS 9 divides all financial assets that are currently in thescope of IAS 39 into two classifications, those measured atamortized cost and those measured at fair value. Thestandard, along with proposed expansion of IFRS 9 forclassifying and measuring financial liabilities, de-recognition of financial instruments, impairment andhedge accounting, will be applicable from January 1, 2013,although entities are permitted to adopt earlier. TheCompany is currently evaluating the impact that this newstandard will have on the Company’s Consolidated IFRSfinancial statements.
IFRS 10 ‘Consolidated Financial Statements’
IFRS 10 replaces the consolidation requirements in SIC-12Consolidation—Special Purpose Entities and IAS 27Consolidated and Separate Financial Statements. IFRS 10changes the definition of control so the same criteria areapplied to all entities to determine control. The reviseddefinition of control focuses on the need to have bothpower and variable returns before control is present. Thenew standard includes guidance on control with less thanhalf of the voting rights (‘de-facto’ control), participatingand protective voting rights and agent/principalrelationships. This new standard will be applicable fromJanuary 1, 2013. The Company is currently evaluating theimpact that this new standard will have on the Company’sConsolidated IFRS financial statements.

40 Q2 Quarterly report and Semi-annual report
The following new standards or amendments are notexpected to have a material impact on the Company:
• IFRS 7 ‘Financial Instruments: Disclosures’• IFRS 11 ‘Joint Arrangements’• IFRS 12‘Disclosures of Interests in Other Entities’• IFRS 13 ‘Fair Value Measurement’• IAS 1 ‘Presentation of financial statements’ (2011
amendment)• IAS 12 ‘Income Taxes’ (2010 amendment)• IAS 27‘Separate Financial Statements’• IAS 28 ‘Investments in Associates and Joint Ventures’
IFRS 7 ‘Financial Instruments: Disclosures’ and IFRS 13‘Fair Value Measurement’ are expected to impactdisclosures only.
2 Estimates
The preparation of the semi-annual financial statementsrequires management to make judgments, estimates andassumptions that affect the application of accountingpolicies and the reported amounts of assets and liabilities,income and expense. Actual results may differ from theseestimates.
In preparing these condensed consolidated semi-annualfinancial statements, the significant estimates andjudgments made by management in applying the Group’saccounting policies and the key sources of estimationuncertainty were the same as those applied to theconsolidated financial statements as at and for the yearended December 31, 2010.
3 Financial risk management
The Group’s financial risk management objectives andpolicies are consistent with those disclosed in theconsolidated financial statements as at and for the yearended December 31, 2010.
4 Segment information
Philips’ activities are organized on a sector basis, withoperating sectors – Healthcare, Consumer Lifestyle andLighting – each being responsible for the management ofits business worldwide, and Group Management &Services (GM&S). A short description of these sectors isas follows:
• Healthcare: consists of the following businesses –Imaging Systems, Home Healthcare Solutions, PatientCare & Clinical Informatics, and Customer Services.
• Consumer Lifestyle: consists of the followingbusinesses – Personal Care, Lifestyle Entertainment,Domestic Appliances, Health & Wellness, and Licenses.
• Television: results are reported separately underdiscontinued operations as a result of theannouncement in the press release on the first quarterof 2011 that Philips will transfer its Television businessinto a long-term strategic partnership with TPVTechnology.
• Lighting: consists of the following businesses – Lamps,Professional Luminaires, Consumer Luminaires,Lighting Systems & Controls, Automotive, PackagedLEDs and LED solutions.
• GM&S: consists of various activities and businessesincluding the Corporate center, Countries & Regions,Global Service Units, Pensions, Research, IntellectualProperty & Standards, Applied Technologies, NewVenture Integration, and Design.
Reportable segments for the purpose of the segmentaldisclosures required by IAS 34 Interim FinancialStatements are: Healthcare, Consumer Lifestyle andLighting.
Significant segment information can be found in theSectors, Sectors and main countries and Reconciliation ofnon-GAAP performance measures sections of thisdocument.
5 Seasonality
Under normal economic conditions, the Group’s sales areimpacted by seasonal fluctuations, particularly atConsumer Lifestyle and Healthcare, typically resulting inhigher revenues and earnings in the second half-yearresults. Within Healthcare, sales are generally higher inthe second half of the year, largely due to the timing ofnew product availability and customers attempting tospend their annual budgeted allowances before the end ofthe year. Within Consumer Lifestyle, sales are generallyhigher in the second half-year due to the holiday sales.Sales in the Lighting businesses are generally not materiallyaffected by seasonality.
For the 12 months ended July 3, 2011, Healthcare,Consumer Lifestyle and Lighting had revenues of EUR8,763 million, EUR 5,769 million and EUR 7,563 millionrespectively (12 months ended July 4, 2010, Healthcare,Consumer Lifestyle and Lighting had revenues of EUR8,115 million, EUR 5,706 million and EUR 7,161 millionrespectively) and reported adjusted income fromoperations of EUR 1,278 million, EUR 560 million and EUR

Q2 Quarterly report and Semi-annual report 41
708 million respectively (12 months ended July 4, 2010:EUR 1,009 million, EUR 693 million and EUR 616 millionrespectively).
The seasonality comments exclude the Televisionbusiness, which is now reported under discontinuedoperations.
6 Discontinued operations and other assetsclassified as held for sale
Televisionbusiness other total
July 3, 2011
Assets classified as held forsale 328 286 614
Liabilities directlyassociated with assets heldfor sale (425) (2) (427)Total (97) 284 187
Discontinued operations: Television businessAs announced in the press release on the first quarter of2011, the Television business is reported as discontinuedoperations as per the end of the first quarter of 2011. TheTelevision business will form a long-term strategicpartnership with TPV; the results of the Televisionbusiness to be carved out are reported underDiscontinued operations in the Consolidated statementsof income and Consolidated statements of cash flows.Assets classified as held for sale and liabilites directlyassociated with assets held for sale are reported on theface of the balance sheet as of announcement.
The following table summarizes the results of theTelevision business included in the consolidatedstatements of income as discontinued operations.
January - June
2010 2011
Sales 1,545 1,186
Costs and expenses (1,516) (1,304)
Write-down to fair value less costs to sell (85)
Income (loss) before taxes 29 (203)
Income taxes 1 14 Results from discontinued operations 30 (189)
The following table presents the assets and liabilities of theTelevision business, classified as discontinued operations,in the consolidated balance sheets.
July 3, 2011
Property, plant and equipment 44
Intangible assets including goodwill 41
Write-down to fair value less costs to sell (85)
Inventories 328
Other assets −
Assets classified as held for sale 328
Accounts payable 398
Provisions 8
Other liabilities 19 Liabilities directly associated with assets held for sale 425
Other assets classified as held for saleOther assets classified as held for sale mainly related toproperty, plant and equipment for an amount of EUR 278million at July 3, 2011 (December 31, 2010 EUR 120million).
7 Acquisitions and divestments
During the first six months of 2011, Philips entered intofour acquisitions. These acquisitions involved anaggregated purchase price of EUR 164 million and havebeen accounted for using the acquisition method.Measured on a half-yearly basis, the aggregated impact ofthe four acquisitions on Group Sales, Income fromoperations, Net income and Net income per commonshare (on a fully diluted basis) is not material in respect ofIFRS 3 disclosure requirements.
Divestments during the first six months of 2011 involvedan aggregated consideration of EUR 10 million and weretherefore deemed immaterial.
8 Income taxes
Income tax expense is recognized based on management’sbest estimate of the weighted average annual income taxrate expected for the full financial year applied to thepretax income of the interim period. Income tax expenseis recorded for the interim period despite a loss incurredmainly due to non-tax-deductible impairmentcharges.This year’s income tax expense is lowercompared with 2010, mainly due to lower taxable profits.
9 Property, plant and equipment
Acquisitions and disposalsDuring the first six months ended July 3, 2011, there wereno significant movements in property, plant andequipment. Apart from currency translation-relateddifferences of EUR 116 million (six months ended July 4,

42 Q2 Quarterly report and Semi-annual report
2010: EUR 243 million), the addition of EUR 346 million(six months ended July 4, 2010: EUR 305 million) waslargely offset by depreciation and impairment charges ofEUR 308 million (six months ended July 4, 2010: EUR 324million).
10 Goodwill
Goodwill is summarized as follows:
Balance as of December 31, 2010
Cost 8,742 Amortization / Impairments (707)
Book value 8,035
Changes in book value:
Acquisitions 76
Impairments (1,355)
Transfer to assets classified as held for sale (5)
Translation differences (571)
Balance as of July 3, 2011:
Cost 8,185 Amortization / Impairments (2,005)
Book value 6,180
During the first six months of 2011 Philips completed fouracquisitions, which involved an aggregate goodwill amountof EUR 76 million, mainly related to the acquisition of theIndia-based kitchen appliances business of Preethi andOptimum Lighting. The goodwill recognized in thistransaction is mainly related to synergies expected fromthe creation of a manufacturing and distribution footprintin India.
For impairment testing, goodwill is allocated to (groupsof) cash-generating units (typically one level below sectorlevel), which represent the lowest level at which thegoodwill is monitored for internal management purposes.
The goodwill associated with the cash-generating unitsRespiratory Care & Sleep Management, ProfessionalLuminaires, Imaging Systems, and Patient Care & ClinicalInformatics are considered to be significant in comparisonto the total book value of goodwill for the Group at July 3,2011. The amounts associated as of July 3, 2011, arepresented in the following table.
July 3, 2011
Respiratory Care & Sleep Management 1,584
Professional Luminaires 1,093
Imaging Systems 1,311
Patient Care & Clinical Informatics 1,219
The basis of the recoverable amount used in the annual(performed in the second quarter) and trigger-basedimpairment tests is the value in use. Key assumptions usedin the impairment tests for the units in the table abovewere sales growth rates, adjusted income fromoperations and the rates used for discounting theprojected cash flows. These cash flow projections weredetermined using management’s internal forecasts thatcover an initial period from 2011 to 2015, which matchesthe period used for our strategic review. Projections wereextrapolated with stable or declining growth rates for aperiod of 5 years, after which a terminal value wascalculated. For terminal value calculation, growth rateswere capped at a historical long-term average growthrate.
The sales growth rates and margins used to estimate cashflows are based on past performance, external marketgrowth assumptions and industry long-term growthaverages.
Adjusted income from operations in all units is expectedto increase over the projection period as a result ofvolume growth and cost efficiencies.
Cash flow projections of Respiratory Care & SleepManagement, Professional Luminaires, Imaging Systems,and Patient Care & Clinical Informatics for 2011 werebased on the following key assumptions (based on theannual impairment test performed in the second quarter):
in %
compound sales growth rate1)
initialforecast
period
extrapolation
period
used tocalculateterminal
value
pre-taxdiscount
rates
Respiratory Care &Sleep Management 7.6 5.6 2.7 11.5
ProfessionalLuminaires 9.5 6.1 2.7 13.6
Imaging Systems 7.2 4.7 2.7 11.8
Patient Care & ClinicalInformatics 8.2 5.6 2.7 13.4
1) Compound sales growth rate is the annualized steady growth rate over theforecast period
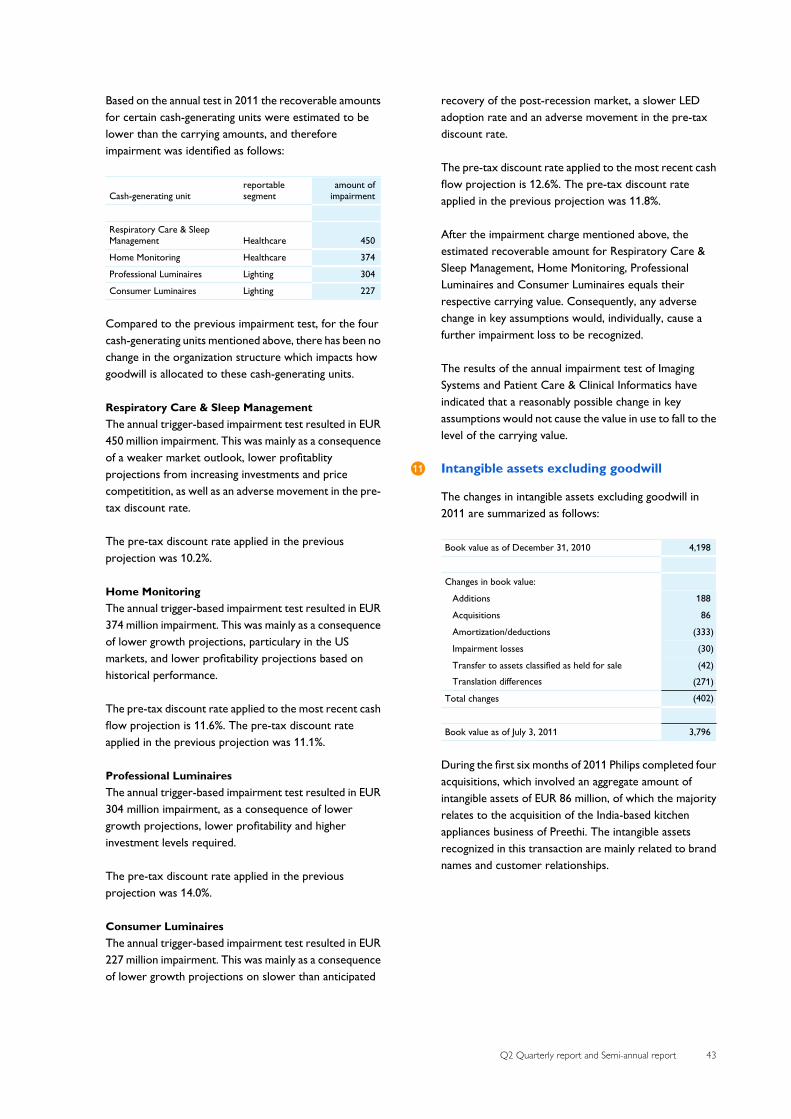
Q2 Quarterly report and Semi-annual report 43
Based on the annual test in 2011 the recoverable amountsfor certain cash-generating units were estimated to belower than the carrying amounts, and thereforeimpairment was identified as follows:
Cash-generating unitreportablesegment
amount ofimpairment
Respiratory Care & SleepManagement Healthcare 450
Home Monitoring Healthcare 374
Professional Luminaires Lighting 304
Consumer Luminaires Lighting 227
Compared to the previous impairment test, for the fourcash-generating units mentioned above, there has been nochange in the organization structure which impacts howgoodwill is allocated to these cash-generating units.
Respiratory Care & Sleep ManagementThe annual trigger-based impairment test resulted in EUR450 million impairment. This was mainly as a consequenceof a weaker market outlook, lower profitablityprojections from increasing investments and pricecompetitition, as well as an adverse movement in the pre-tax discount rate.
The pre-tax discount rate applied in the previousprojection was 10.2%.
Home MonitoringThe annual trigger-based impairment test resulted in EUR374 million impairment. This was mainly as a consequenceof lower growth projections, particulary in the USmarkets, and lower profitability projections based onhistorical performance.
The pre-tax discount rate applied to the most recent cashflow projection is 11.6%. The pre-tax discount rateapplied in the previous projection was 11.1%.
Professional LuminairesThe annual trigger-based impairment test resulted in EUR304 million impairment, as a consequence of lowergrowth projections, lower profitability and higherinvestment levels required.
The pre-tax discount rate applied in the previousprojection was 14.0%.
Consumer LuminairesThe annual trigger-based impairment test resulted in EUR227 million impairment. This was mainly as a consequenceof lower growth projections on slower than anticipated
recovery of the post-recession market, a slower LEDadoption rate and an adverse movement in the pre-taxdiscount rate.
The pre-tax discount rate applied to the most recent cashflow projection is 12.6%. The pre-tax discount rateapplied in the previous projection was 11.8%.
After the impairment charge mentioned above, theestimated recoverable amount for Respiratory Care &Sleep Management, Home Monitoring, ProfessionalLuminaires and Consumer Luminaires equals theirrespective carrying value. Consequently, any adversechange in key assumptions would, individually, cause afurther impairment loss to be recognized.
The results of the annual impairment test of ImagingSystems and Patient Care & Clinical Informatics haveindicated that a reasonably possible change in keyassumptions would not cause the value in use to fall to thelevel of the carrying value.
11 Intangible assets excluding goodwill
The changes in intangible assets excluding goodwill in2011 are summarized as follows:
Book value as of December 31, 2010 4,198
Changes in book value:
Additions 188
Acquisitions 86
Amortization/deductions (333)
Impairment losses (30)
Transfer to assets classified as held for sale (42)Translation differences (271)
Total changes (402)
Book value as of July 3, 2011 3,796
During the first six months of 2011 Philips completed fouracquisitions, which involved an aggregate amount ofintangible assets of EUR 86 million, of which the majorityrelates to the acquisition of the India-based kitchenappliances business of Preethi. The intangible assetsrecognized in this transaction are mainly related to brandnames and customer relationships.

44 Q2 Quarterly report and Semi-annual report
12 Other non-current financial assets
The changes in other non-current financial assets in 2011are as follows:
Balance as of December 31, 2010 479
Changes:
Reclassifications 2
Acquisitions/additions 5
Sales/redemptions/reductions (96)
Value adjustments (8)
Impairments (11)Translation and exchange differences (4)
Balance as of July 3, 2011 367
Other non-current financial assets mainly consist ofavailable-for-sale financial assets.
On March 10 and March 11, 2011, Philips sold all shares ofcommon stock in TCL Corporation (TCL) to financialinstitutions in a capital market transaction. Thistransaction represented 3.84% of TCL’s issued sharecapital. The transaction resulted in a gain of EUR 44million, reported under Financial income.
On September 7, 2010 Philips sold its entire holding ofcommon shares in NXP Semiconductors B.V. (NXP) toPhilips Pension Trustees Limited (herein after referred toas “UK Pension Fund”). As a result of this transaction theUK Pension fund obtained the full legal title and ownershipof the NXP shares, including the entitlement to any futuredividends and the proceeds from any sale of shares. Fromthe date of the transaction the NXP shares are an integralpart of the plan assets of the UK Pension Fund. Thepurchase agreement with the UK Pension Fund includesan arrangement that may entitle Philips to a cash paymentfrom the UK Pension Fund on or after September 7, 2014,if the value of the NXP shares has increased by this date toa level in excess of a predetermined threshold, which atthe time of the transaction was substantially above thetransaction price, and the UK Pension Fund is in a surplus(on the regulatory funding basis) on September 7, 2014.The arrangement qualifies as a financial instrument and isreported under Other non-current financial assets. Thefair value of the arrangement was estimated to be zero asof December 31, 2010. As of July 3, 2011 management’sbest estimate of the fair value of the arrangement is EUR23 million, based on the risks, the stock price of NXP, thecurrent progress and the long-term nature of therecovery plan for the 2009 deficit of the UK Pension Fund.The change in fair value until July 3, 2011 is reported undervalue adjustments in the table above and also recognizedin Financial income.
13 Inventories
Inventories are summarized as follows:
December 31, July 3,
2010 2011
Raw materials and supplies 1,131 1,174
Work in progress 510 624
Finished goods 2,224 1,962 3,865 3,760
The amounts recorded above are net of allowances forobsolescence.
On July 3, 2011, the write-down of inventories to netrealizable value amounted to EUR 88 million (year-end2010: EUR 215 million). The write-down is included incost of sales.
14 Shareholders’ equity
In May 2011, Philips settled a dividend of EUR 0.75 percommon share, representing a total value of EUR 711million. Shareholders could elect for a cash dividend or ashare dividend. Around 63% of the shareholders electedfor a share dividend, resulting in the issuance of22,896,661 new common shares. The settlement of thecash dividend involved an amount of EUR 263 million.
As of July 3, 2011, the issued and fully paid share capitalconsists of 1,008,975,445 common shares, each sharehaving a par value of EUR 0.20.
During the first six months of 2011 a total of 3,033,253treasury shares were delivered as a result of stock optionexercises, restricted share deliveries and other employee-related share plans. There were no transactions to reduceshare capital. On July 3, 2011 the total number of treasuryshares amounted to 36,539,147, which were purchased atan average price of EUR 27.71 per share.
15 Short-term and long-term debt
At the end of Q2 2011, Philips had total debt of EUR 3,416million, a decrease of EUR 1,242 million compared toDecember 31, 2010. Long-term debt was EUR 2,703million, a decrease of EUR 115 million, and short-termdebt was EUR 713 million, a decrease of EUR 1,127 millioncompared to December 31, 2010. The movement of debtwas mainly due to redemptions of USD 350 million andEUR 750 million in public bonds, repayments of othershort-term debt and currency translation effects. Totalremaining long-term debt mainly consists of outstandingpublic bonds for a book value of EUR 2,249 million, which

Q2 Quarterly report and Semi-annual report 45
were previously issued in USD. The weighted averageinterest rate of the long-term USD bonds was 6.17% atthe end of Q2 2011.
16 Provisions
Provisions are summarized as follows:
December 31,2010
July 3,2011
longterm
shortterm
longterm
shortterm
Provisions for defined-benefit plans 719 52 703 53
Other postretirement benefits 297 21 283 19
Postemployment benefits andobligatory severance payments 95 21 85 21
Product warranty 94 254 57 240
Loss contingencies (environmentalremediation and product liability) 222 28 218 33
Restructuring-related provisions 49 177 33 109
Other provisions 240 70 308 52 1,716 623 1,687 527
The reduction of restructuring-related provisions islargely attributable to utilization of the restructuring-related provisions.
17 Accrued liabilities
The decrease in accrued liabilities was mainly driven bylower personnel-related accruals totalling EUR 148million. Additonally, material and other cost-relatedaccruals were EUR 113 million lower compared to theend of 2010.
18 Pensions
In accordance with IAS 34, actuarial gains and losses arereported in the semi-annual financial statements only ifthere have been significant changes in financial markets. Inthe first six months of 2011 no actuarial gains or losseswere recorded as the changes in financial markets duringthat period were considered not significant. In the first sixmonths of 2010 no actuarial gains and losses wererecorded. For the whole of 2010 the combined effect ofactuarial gains and losses and IFRIC 14 was a reduction inequity of EUR 1.4 billion net of tax due to unfavorabledevelopments in the second half of the year, including theeffect of a newly adopted mortality table in theNetherlands.
The half-year estimates are limited to the principal plans,i.e. the defined-benefit plans in the Netherlands,Germany, the UK and the US, which together representmore than 90% of the defined-benefit pension assets and
liabilities for the Group as a whole. Estimated changes inrecognized prepaid pension costs are in accordance withIFRIC 14.
Actuarial gains or losses, if any, are reported under Othercomprehensive income and against the respective balancesheet items.
19 Contingent liabilities
GuaranteesPhilips’ policy is to provide guarantees and other letters ofsupport only in writing. Philips does not stand by otherforms of support. At the end of Q2 2011, the total fairvalue of guarantees recognized on the balance sheet wasEUR 9 million (December 31, 2010: EUR 9 million).Remaining off-balance-sheet business and credit-relatedguarantees provided to third parties and associatesdecreased by EUR 22 million during the first half of 2011to EUR 318 million.
Environmental remediationThe Company and its subsidiaries are subject toenvironmental laws and regulations. Under these laws, theCompany and/or its subsidiaries may be required toremediate the effects of the release or disposal of certainchemicals on the environment. The company accrues forlosses associated with environmental obligations whensuch losses are probable and reliably estimable. Suchamounts are recognized on a discounted basis since theyreflect the present value of estimated future cash flows.
Provisions for environmental remediation can changesignificantly due to the emergence of additionalinformation regarding the extent or nature of thecontamination, the need to utilize alternativetechnologies, actions by regulatory authorities andchanges in judgments, assumptions, and discount rates.
The Company and/or its subsidiaries have recognizedenvironmental remediation provisions for sites in variouscountries. In the United States, subsidiaries of theCompany have been named as potentially responsibleparties in state and federal proceedings for the clean-up ofvarious sites.
Legal proceedingsThe Company and certain of its group companies andformer group companies are involved as a party in legalproceedings, including regulatory and other governmentalproceedings, including discussions on potential remedialactions, relating to such matters as competition issues,commercial transactions, product liability, participationsand environmental pollution. In respect of antitrust laws,

46 Q2 Quarterly report and Semi-annual report
the Company and certain of its (former) group companiesare involved in investigations by competition lawauthorities in several jurisdictions and are engaged inlitigation in this respect. Since the ultimate disposition ofasserted claims and proceedings and investigations cannotbe predicted with certainty, an adverse outcome couldhave a material adverse effect on the Company’sconsolidated financial position and consolidated results ofoperations for a particular period. For certain legalproceedings information required under IAS 37 is notdisclosed, if the Company concludes that the disclosurecan be expected to prejudice seriously the outcome of thelegal proceeding.
For information regarding legal proceedings in which theCompany is involved, please refer to our Annual Report2010. Significant developments regarding legalproceedings that have occurred since the publication ofour Annual Report 2010 are described below:
CRTIn the U.S. action, the magistrate judge granted certaindefendants’ motion to strike from the ConsolidatedAmended Complaint plaintiffs’ claims regarding an allegedconspiracy in products containing CRTs. The decision issubject to approval of the U.S. District Court.
Due to the considerable uncertainty associated with thesematters, on the basis of current knowledge, the Companyhas concluded that potential losses cannot be reliablyestimated with respect to these matters. An adverse finalresolution of these matters could have a materiallyadverse effect on the Company’s consolidated financialposition, results of operation and cash flows.
LG DisplayAs previously disclosed in the Annual Report 2010, anumber of plaintiffs have filed separate, individual actionsalleging essentially the same claims as those asserted in theclass actions. During the second quarter, the Companyand PENAC were named as defendants in an actionbrought by Jaco Electronics, Inc. PENAC has also beennamed as a defendant in an action brought by T-MobileUSA, Inc.
Motorola, Inc. has filed a motion for leave to file a ThirdAmended Complaint in order to add PENAC and certainunrelated parties as defendants. Various defendants havefiled oppositions to Motorola’s motion.The court has notyet ruled on whether to allow the Third AmendedComplaint to be filed.
Due to the considerable uncertainty associated with thesematters, on the basis of current knowledge, the Companyhas concluded that potential losses cannot be reliablyestimated with respect to these matters. An adverse finalresolution of this litigation could have a materially adverseeffect on the Company’s consolidated financial position,results of operations and cash flows.
Philips PolskaAs previously reported, Philips is conducting a review ofcertain activities related to the sale of medical equipmentfor potential violations of the U.S. Foreign CorruptPractices Act (FCPS) in connection with an indictmentissued by authorities in Poland in December 2009 againstnumerous individuals, including three former employeesof Philips Polska Sp.z.o.o. The review has been reportedto the U.S. Department of Justice and the U.S. Securitiesand Exchange Commission and Philips is cooperating withthese authorities in connection with the review. The legalproceedings in Poland against the individuals commencedon June 13, 2011 with a preliminary hearing.
20 Related-party transactions
In the normal course of business, Philips purchases andsells goods and services from/to various related parties inwhich Philips typically holds a 50% or less equity interestand has significant influence. These transactions aregenerally conducted on terms comparable to transactionswith third parties.
Related-party transactions are summarized as follows:
January-June 2010 2011
Purchases of goods and services 151 95
Sales of goods and services 68 50
Balance outstanding July 4, 2010 July 3, 2011
Receivables from related parties 11 15
Payables to related parties 13 3
21 Share-based compensation
Share-based compensation expense amounted to EUR 29million and EUR 29 million in the first six months of 2011and 2010 respectively.

Q2 Quarterly report and Semi-annual report 47
During the first six months of 2011 the Company granted6,747,531 stock option rights on its common shares and1,821,513 rights to receive common shares in the future(restricted share rights).
A total of 1,535,504 restricted shares were issued toemployees. 241,211 EUR-denominated options and705,745 USD-denominated options were exercised at aweighted average exercise price of EUR 18.71 and USD26.09 respectively.
Under the employee stock purchase plans 706,790 shareshave been purchased at an average price of EUR 22.05.
For further information on the characteristics of theseplans, please refer to the Annual Report 2010, note 29.
22 Subsequent events
Acquisition of Mammography Equipmentproduct line of Sectra ABOn June 27, 2011, Philips announced that it has agreed toacquire the mammography equipment product line ofSectra AB, a Swedish provider of medical systems andsecure communication systems. The closing of thetransaction, which is subject to certain contractual andother closing conditions, is expected in the third quarterof 2011.
Acquisition of IndalOn June 29, 2011, Philips announced that it has enteredinto an agreement to acquire Indal, a Spanish professionalluminaires company mainly focused on outdoor lightingsolutions. The closing of the transaction, which is subjectto certain contractual and other closing conditions, isexpected in the third quarter of 2011.
Acquisition of Povos Electric Appliance(Shanghai) Co LtdOn July 11, 2011, Philips announced that it has agreed toacquire Povos Electric Appliance (Shanghai) Co., Ltd., akitchen appliance company in China. The closing of thetransaction, which is subject to confirmatory due diligenceand other customary closing conditions, is expected in thefourth quarter of 2011.

© 2011 Koninklijke Philips Electronics N.V.All rights reserved.
http://www.philips.com/investorrelations