philosophical magazine letters role of surface … magazine letters 2010, 1–12, ifirst role of...
TRANSCRIPT

PLEASE SCROLL DOWN FOR ARTICLE
This article was downloaded by: [Stanford University]On: 12 October 2010Access details: Access Details: [subscription number 920455431]Publisher Taylor & FrancisInforma Ltd Registered in England and Wales Registered Number: 1072954 Registered office: Mortimer House, 37-41 Mortimer Street, London W1T 3JH, UK
Philosophical Magazine LettersPublication details, including instructions for authors and subscription information:http://www.informaworld.com/smpp/title~content=t713695410
Role of surface roughness in hysteresis during adhesive elastic contactHaneesh Kesaria; Joseph C. Dolla; Beth L. Pruitta; Wei Caia; Adrian J. Lewa
a Department of Mechanical Engineering, Stanford University, Stanford, CA 94305-4040, USA
First published on: 30 September 2010
To cite this Article Kesari, Haneesh , Doll, Joseph C. , Pruitt, Beth L. , Cai, Wei and Lew, Adrian J.(2010) 'Role of surfaceroughness in hysteresis during adhesive elastic contact', Philosophical Magazine Letters,, First published on: 30September 2010 (iFirst)To link to this Article: DOI: 10.1080/09500839.2010.521204URL: http://dx.doi.org/10.1080/09500839.2010.521204
Full terms and conditions of use: http://www.informaworld.com/terms-and-conditions-of-access.pdf
This article may be used for research, teaching and private study purposes. Any substantial orsystematic reproduction, re-distribution, re-selling, loan or sub-licensing, systematic supply ordistribution in any form to anyone is expressly forbidden.
The publisher does not give any warranty express or implied or make any representation that the contentswill be complete or accurate or up to date. The accuracy of any instructions, formulae and drug dosesshould be independently verified with primary sources. The publisher shall not be liable for any loss,actions, claims, proceedings, demand or costs or damages whatsoever or howsoever caused arising directlyor indirectly in connection with or arising out of the use of this material.

Philosophical Magazine Letters2010, 1–12, iFirst
Role of surface roughness in hysteresis during
adhesive elastic contact
Haneesh Kesari, Joseph C. Doll, Beth L. Pruitt, Wei Caiand Adrian J. Lew*
Department of Mechanical Engineering, Stanford University,Stanford, CA 94305-4040, USA
(Received 22 April 2010; final version received 24 August 2010)
In experiments that involve contact with adhesion between two surfaces, asfound in atomic force microscopy or nanoindentation, two distinct contactforce (P) versus indentation-depth (h) curves are often measured dependingon whether the indenter moves towards or away from the sample. Theorigin of this hysteresis is not well understood and is often attributed tomoisture, plasticity or viscoelasticity. Here we report experiments whichshow that hysteresis can exist in the absence of these effects, and that itsmagnitude depends on surface roughness. We develop a theoretical modelin which the hysteresis appears as the result of a series of surfaceinstabilities, in which the contact area grows or recedes by a finite amount.The model can be used to estimate material properties from contactexperiments even when the measured P–h curves are not unique.
Keywords: atomic force microscopy; nanoindentation; surface roughness;adhesion; contact mechanics
1. Introduction
Adhesive contacts play a central role in many biological phenomena and engineeredsystems, such as in cell adhesion [1] and microdevices [2]. In particular,characterization of materials using contact experiments, such as Atomic ForceMicroscopy (AFM), requires an understanding of adhesive contacts [3–5]. Duringadhesive contact, the measured contact force versus indentation-depth P�hð Þ curvesoften display a clear and repeatable hysteresis loop, H [4,6–9] (Figure 1a). Thesecurves have two branches, one measured as the indenter moves towards the sample,and another one as it moves away. The area inside measures the energy loss during acycle. In some adhesive contact experiments (such as [4,6–9] and this study),H depends on the maximum indentation-depth, jhminj. We refer to this behavior asdepth-dependent hysteresis (DDH).
DDH cannot be explained by classical contact theories [10–13], which predict aP–h curve with a single branch in the regime of h5 0. Fitting experimental datadisplaying DDH to these theories leads to different estimates for material propertiesdepending on which branch of the curve is used [8,9,14,15]. The mechanism of DDH
*Corresponding author. Email: [email protected]
ISSN 0950–0839 print/ISSN 1362–3036 online
� 2010 Taylor & Francis
DOI: 10.1080/09500839.2010.521204
http://www.informaworld.com
Downloaded By: [Stanford University] At: 21:48 12 October 2010

is not well understood, but it has been attributed to several factors, such as materialdamage (plasticity) [16], ambient moisture [6,17], viscoelasticity [18], and chemistry-related mechanisms [7–9,19]. Here, we report experiments in which the observedDDH cannot be explained by these factors alone. Furthermore, the observed DDH isfound to depend on surface roughness. Thus, we hypothesize that surface roughnesscoupled with adhesion can give rise to DDH. We also present a model for adhesiveelastic contact between rough surfaces whose predictions are consistent with ourexperiments. Most notably, it predicts different P–h branches during loading andunloading. Therefore, our model enables the estimation of material properties bysimultaneously fitting both branches of the experimental P–h curves, instead ofhaving to choose among the two. The fitting also provides certain information aboutsurface roughness of the contacting surfaces.
2. Materials and methods
2.1. Hysteresis measurements
To investigate the mechanism of DDH, we measured P–h curves on fourpolydimethylsiloxane (PDMS) samples having varying roughness using both AFMand nanoindentation (NI) apparatus. The AFM tip was a spherical glass bead andthe NI tip was a flat face of a truncated diamond cube. Details of PDMS samplepreparation, AFM, and NI experiments are given in the following sections.
On each sample we measured P–h curves at five different sample spots that wereseparated from one another by at least 200 mm. We brought the tip into contact witheach sample spot several times (�20); each time starting from a tip-sample separationwhere P ¼ 0. The tip base was moved towards the samples until the tip was pushedinto the sample by a predetermined amount – jhminj – and then moved away untilP ¼ 0 again. We counted each time the tip is brought into contact with the sampleas a contact cycle. The speed of the tip‘s base ð _d Þ was kept constant during themeasurements. As stated, at each sample location we performed several contactcycles with jhminj ranging from 0 to 1500 nm. For each jhminj, we calculated theenergy loss H by computing the area enclosed within the corresponding contactcycle’s P–h loop.
For a given jhminj, the H for a sample is the average of the data taken at the fivelocations. The error bars for H are the standard deviation of the data taken over thefive locations.
2.2. PDMS sample preparation
We fabricated PDMS samples having varying roughness but identical mechanicalproperties and surface chemistry using a soft-lithography technique [20], where thesame PDMS solution (base : crosslinker¼ 10 : 1, Sylgard 184, Dow Corning,Midland, MI) was cast onto different silicon (Si) molds (University Wafer, SouthBoston, MA). The Si molds were roughened to varying extents by exposing them toreactive ions in a parallel plate plasma etcher (RIE-100, Drytek) for durations
2 H. Kesari et al.
Downloaded By: [Stanford University] At: 21:48 12 October 2010
ranging from 30 s to 6min. The gas flow rates (SF6=O2¼ 90=25 sccm), RF power(200W), and pressure (70mTorr) were held constant for all etches. The PDMSsolution was mixed well and deaerated in a centrifugal mixer (AR-100, Thinky,Tokyo, Japan) to obtain a uniformly mixed prepolymer solution. The Si molds werevapor coated with a releasing agent (Chlorotrimethylsilane, Sigma-Aldrich, St.Louis, MO) before casting a 5–10mm thick prepolymer solution onto them. Vacuumwas applied to the casts for 15min before curing them at room temperature (�20�C)for 48 h.
We measured the Si molds topography by scanning their surfaces using a sharpSi-tipped AFM operated in tapping mode. We performed these measurements over4 mm2 scan areas at three different locations on each sample. From thesemeasurements, we observed that the Si molds root mean square (RMS) roughnessvaried from 0.65 to 1.52 nm. The number of asperities, which we determined bycounting the points where the topography had a local maxima, were 213� 10, 99� 8,98� 8, and 75� 4 per square micron on the Si wafers exposed to 0 s, 30 s, 3min, and6min of reactive ion etching, respectively.
Because of the large compliance of PDMS (Young’s modulus �1 MPa), we couldnot measure the PDMS sample roughness directly using an AFM. However, the soft-lithography technique we used [20] is known to replicate features down to 2 nm [21].Thus, in this work we assume that the RMS roughness of our PDMS samples isproportional to that of their respective Si molds on which they were cast.Furthermore, since the different PDMS samples were cast from the same prepolymersolution we expect that all samples have the same bulk mechanical properties andsurface chemistry.
2.3. AFM contact experiments
Indentation with soda lime glass beads (Duke Scientific, Palo Alto, USA) wasperformed in air at room temperature using an AFM (alpha300A, WitecInstruments, Ulm, Germany) operated in the contact mode. The beads had adiameter of 50 mm, and an RMS roughness of 6 nm. They were attached onto anAFM cantilever (Arrow NCR, Nanoworld, Neuchatel, Switzerland) using epoxyresin. The spring constant of the cantilever was estimated to be 30� 6N/m bymeasuring the resonant frequency, for details see [22].
Underwater measurements were performed by placing the samples in a containerfilled with deionized water. At the beginning of the experiment the AFM tip waslowered into the container such that it was completely under water.
2.4. NI experiments
To estimate the viscoelasticity of our PDMS samples, we also measured P–h curveson all our PDMS samples using a flat faced diamond tip. These measurements wereperformed using a NI apparatus (Hysitron, Minneapolis, USA). The tip is a cornerof a diamond cube whose apex has been flattened. The RMS roughness of the
Philosophical Magazine Letters 3
Downloaded By: [Stanford University] At: 21:48 12 October 2010

diamond tip measured through imprints on gold surfaces was 51 nm. The flatcontacting face is an equilateral triangle with sides 10.5 mm long and an area of47 mm2. The machine was operated in displacement control mode.
3. Results and discussion
3.1. AFM experiments
Figure 1a shows the P–h curves using an AFM during glass-PDMS contact at theloading rate _d ¼ 10 nm=s. Two distinct P–h branches are found for the loading andunloading stages. Figure 1b shows that the energy loss H of a contact cycle increaseswith jhminj, which is a signature of DDH. Figures 1c and d show that similarbehavior is also observed at a faster loading rate of _d ¼ 1000 nm=s. For a givenjhminj, the energy loss is larger at the higher loading rate. This rate dependence will bediscussed further in Section 3.2.
At the higher loading rate of _d ¼ 1000 nm=s, we measured the energy loss asa function of jhminj on PDMS samples with different surface roughness but similarbulk properties and surface chemistry (see Section 2.2). We chose to use thehigher loading rate in order to expedite the experiments and reduce anyinstrumentation drift errors in our measurements. Figure 1d shows that for agiven jhminj, H increases as the sample RMS roughness grows from 0.65 to 1.31 nm,but then decreases as RMS roughness increases further to 1.52 nm. These dataare also plotted in Figure 2a with RMS roughness as the x-axis. This behavior ofinitial increase and then decrease of H with RMS roughness was observed usingtwo different sets of PDMS samples, AFM cantilevers, and glass beads on twodifferent days. The two sets of PDMS samples were prepared using the same set ofSi molds.
Ambient moisture can cause DDH because condensation of a liquid meniscus atthe contact periphery is known to change the contact forces [23, p. 880]. To test thispossibility, we performed glass bead-PDMS contact experiments under water, whereno meniscus can form. Figures 1e and f show that DDH still appears in thisexperiment. We estimated the contributions to DDH from water’s viscosity to benegligible (�attojoules) for the loading rates used in our experiments. This isconfirmed by the flat region of the P–h curve in Figure 1e at h40, which indicatesthat no appreciable force was measured while the cantilever moves in water beforetouching the sample. Hence, we expect that the same mechanisms causing DDH inthe in-air experiments are responsible for DDH in the under water experiments aswell. In addition, moisture contribution in our in-air AFM experiments, shown inFigures 1a–d, should be negligible since PDMS is known to be hydrophobic [24], andthese experiments were performed at conditions (relative humidity 34%, temperature23�C) at which moisture condensation is estimated to be negligible. Hence, we canrule out the possibility of moisture as the main cause of DDH in the experimentsshown in Figure 1.
To test the possibility that the observed DDH may be instrumentation artifacts,we performed glass-on-glass indentation experiments both before and after the in-airand under-water glass-PDMS experiments. No sign of DDH was observed in the
4 H. Kesari et al.
Downloaded By: [Stanford University] At: 21:48 12 October 2010

glass-on-glass experiments, which rules out instrumentation artifacts as a cause ofthe observed DDH. Furthermore, successive P–h loops measured while indenting thesame sample spot to the same jhminj always overlapped. We therefore excludematerial damage as a plausible cause of DDH in our experiments.
(b) AFM, glass-PDMS in air,
(pJ
)
(d) AFM, glass-PDMS in air,
100 200 300 400 500 600
1.6
–500 –250 0 250 500–4
–3
–2
–1
0
1
m Theory,
h
r -z
Equations (1a), (1b)
Unloading
Loading Sample
(a) AFM, glass-PDMS in air,
= 570 nm
410 nm
145 nm
Tip
hd
−500 0 500−4
−2
0
2
4
6
(c) AFM, glass-PDMS in air,
1.3
1.4
1.5
/
/ /
/
(pJ)
400 800 1200 1600
2
3
4
5
6
0
400 800 1200 1600
2
3
4
5
6
RMS roughness (nm)
1.521.22
0.65
1.31
Figure 1. (a) AFM contact force (P) as a function of indentation-depth (h) during glass-PDMS contact in air at an indenting rate of _d ¼ 10 nm=s. The PDMS sample was cast on a Siwafer with an RMS roughness of 1.31 nm. The dashed lines in (a) are the P–h curves predictedby Equations (1a) and (1b). (b) The energy loss H as a function of the jhminj obtained from theP–h curves shown in (a). (c) AFM P–h curve during glass-PDMS contact in air at_d ¼ 1000 nm=s. The PDMS sample was cast on a Si wafer with an RMS roughness of 0.65 nm.(d) The energy lossH as a function of jhminj for indentation conditions similar to (c) on severalPDMS samples cast on Si wafers with different RMS roughness (indicated next to each curve).Each curve corresponds to a different PDMS sample and was computed from measurementsat five different locations on the sample. The shaded region around each curve indicates thestandard deviation of the measurements taken at five locations on the PDMS samples. At eachlocation H was measured for �20 different jhminj, for additional details see Section 2.1.(e) AFM P–h curve during glass-PDMS contact under water at _d ¼ 1000 nm=s. The PDMSsample was cast on a Si wafer with an RMS roughness of 0.65 nm. (f) The energy loss H as afunction of jhminj obtained from (e).
Philosophical Magazine Letters 5
Downloaded By: [Stanford University] At: 21:48 12 October 2010

3.2. NI experiments
Viscoelasticity of the sample can cause DDH [25]. To test this possibility, weindented our PDMS samples with a flat tip so that the contact area remainedconstant during the experiment. Flat-faced tips are not standard for an AFMapparatus. However, a NI apparatus (Section 2.4) with flat-faced diamond tips wasreadily available. Although the glass-PDMS adhesion energy is different from that ofdiamond-PDMS,1 when the contact area remains constant, the adhesion energyshould not affect the contact forces.
(e) AFM, glass-PDMS under water,
− 500 0 500−4
−2
0
2
4
6
(f) AFM, glass-PDMS under water,
(pJ
)
200 400 600 800
1
1.8
1.6
1.4
1.2
0.8
/ /
Figure 1. Continued.
RMS roughness (nm)
5
6
4
1300
1100
Small roughness
0.7 0.9 1.1 1.3 1.5
Large roughness
= 1500
PDMS
Spherical tip
(a) AFM in air, (b) NI in air,
1
2
= 1000
750
500
Flat tip
0
PDMS
RMS roughness (nm)1.51.31.10.90.7
(pJ
)
/ /
Figure 2. Energy loss H on different PDMS samples versus the Si mold roughness onwhich the PDMS samples were cast, measured using (a) AFM and (b) NI apparatus. Thedifferent curves correspond to different jhminj. For each jhminj, the H for a sample is theaverage of the data taken over five different locations separated by at least 200 mm. The errorbars for H are the standard deviation of the data taken over the five locations. The error barsin (b) are not clearly visible as there are quite small ð10�2 pJÞ. The loading rate _d for both (a)and (b) was 1000 nm=s. The insets in (a) show the qualitative nature of the contact regionhypothesized in this work, in the small, and large roughness limits.
6 H. Kesari et al.
Downloaded By: [Stanford University] At: 21:48 12 October 2010

The jhminj depth, indentation rates and size of contact region in the NI
experiments were chosen such that bulk deformation and deformation rates in the
NI and AFM experiments were comparable. The jhminj in both the AFM and the
NI experiments lay in the range of �250–1500 nm. The contact area in the NI
experiments remained constant at 47 mm2, while that in the AFM experiments varied
from 10 to 230 mm2 as h went from 0 to 1000 nm. The loading rates, _d, in both
AFM and NI experiments were varied in the range 10� 1000 nm=s. However
note that the base-tip stiffness in the NI experiments is effectively infinite compared
to the stiffness of the AFM cantilever. Thus, the deformation rates in the NI
experiments are expected to be somewhat larger than those in the AFM experiments
for the same _d.At the loading rate _d ¼ 10 nm=s, the P–h measurements from our NI experiments
did not display any appreciable hysteresis, with H5 0.03 pJ. At the higher loading
rate of _d ¼ 1000 nm=s, hysteresis was observed and was found to increase with jhminj.
However, this DDH was insensitive to the sample roughness, as shown in Figure 2b.
The NI P–h measurements were quite repeatable, i.e., repeatedly indenting a sample
spot to the same jhminj gave indistinguishable P–h curves. Thus, material damage can
be ruled out as playing any role in these experiments. In addition, before indenting
PDMS, indenting polycarbonate samples using the same NI apparatus showed no
hysteresis at all. This shows that the NI apparatus did not have any intrinsic
hysteresis associated with it. Thus, the DDH seen in the NI experiments is likely due
to the viscoelasticity of the PDMS samples.Since the NI experiments at _d ¼ 10 nm=s showed negligible viscoelasticity effect,
the DDH seen in the AFM experiments at the same low loading rate cannot be
explained by viscoelasticity. The NI experiments at _d ¼ 1000 nm=s imply that some
fraction of the DDH seen in the AFM experiments at this rate is due to PDMS’
viscoelasticity. However, since DDH in the NI experiments did not depend on the
sample’s roughness, a fraction of the DDH seen in the AFM experiments at_d ¼ 1000 nm=s, specifically, the amount that varies with roughness, cannot be
explained solely by PDMS’ viscoelasticity.Therefore, our study shows that there is an additional, yet unaccounted, source of
DDH in our AFMexperiments. Because the primary difference between the AFMand
NI experiments is whether the contact area changes or remains fixed, this unaccounted
source of DDH suggests a surface-related mechanism that operates when the contact
area changes. This hypothesis is reinforced from the observation that H in the AFM
experiments initially increases and then decreases with the sample’s roughness. In the
next section, we explore this hypothesis in depth by developing an analytic model of
adhesive contact that accounts for surface roughness.
3.3. Theory: a model for adhesive elastic contact between rough surfaces
The correlation between DDH and surface roughness suggests that DDH may be
explained in terms of surface roughness, in the absence of all the other aforementioned
factors such as moisture, plasticity, viscoelasticity, etc. In the following we develop
such a theory, and answer the following two questions. First, how can roughness
Philosophical Magazine Letters 7
Downloaded By: [Stanford University] At: 21:48 12 October 2010

cause DDH? Second, why does the energy loss first increase and then decrease withincreasing RMS roughness?
To some extent, the effect of roughness on DDH is surprising, since the RMSroughness of the surfaces of the samples and the indenter (a few nm) is significantlysmaller than the radius of the contact region in our experiments (2–8.5 mm). In manysituations the effect of such small surface perturbations on H are negligible, such asin the NI experiments in Figure 2b (see also [26]). As we discuss next, however,surface roughness can change how the contact area evolves with h, and hence exert adramatic influence on H as shown in Figure 2a.
During a slow loading (unloading) process, the contact area grows (decreases)in a way that is always in equilibrium: changes in elastic and interfacial energies
induced by small variations of the contact area exactly balance. When the surfaces
are perfectly smooth, only one equilibrium contact area exists for each h. However,
multiple equilibria can exist if the surfaces are rough. Among these equilibria, those
with smaller contact areas are probed while loading, while equilibria with larger
contact areas are explored during unloading. This leads to two different P–h curves
for the loading and unloading phases, and is sufficient to cause DDH.To quantify the magnitude of the energy loss due to roughness, we consider the
contact between a rigid spherical indenter with radius R and a wavy sample surfacewith wave length � and amplitude 2A (Figure 3c). The RMS roughness of this modelsurface is proportional to A. In the following we find that, as A grows, H increaseswhen A is small, and decreases when A is large, in agreement with our experimentalobservations.
We first assume that A is small enough such that the contact area between thetwo bodies is simply connected, i.e, within the contact area the surfaces adhereuniformly leaving no gaps (small roughness in Figure 2a). When the surface shape ofthe sample is an axi-symmetric sinusoid, the equilibrium P–h curve has beenanalytically derived in [27], Equations (2), (3), in [14].
Examples of this equilibrium P–h curve are shown in Figures 3a and b, assolid gray curves. The equilibrium P–h curve has oscillations, or folds, owing to thesinusoidal topography of the surfaces. In some cases (such as those shown inFigure 3) the oscillations can be so pronounced that multiple values of P appear foreach h, each one the consequence of a different equilibrium contact area. Thisphenomenon has been discussed in [27], and explored experimentally at themacroscale (�10–2m) in [14].
We construct a model for roughness by first deriving asymptotic forms forEquations (2), (3) of [14] and then using them to derive the equations for themeasured P–h curve. Specifically, as we will show elsewhere, when �=R� 1 andA=��Oð1Þ, the P(h) curve is multiply valued. Consequently, the P–h curve measuredin an experiment does not follow the folds of the equilibrium P–h curve, but dependson the loading history (e.g. the thin solid curve in Figure 3a (red online). As �=Rdecreases, the folds in Figure 3a get tighter, (see also Figure 3b). Under theseconditions, an experimentally measured P–h loop will essentially follow the envelopeof the folded analytic curve, given by2
P að Þ ¼4E �
3Ra3 �
ffiffiffiffiffiffiffiffiffiffiffiffiffiffi8��E �
pa
32 � 2�E �
A
�1=2a
32, ð1aÞ
8 H. Kesari et al.
Downloaded By: [Stanford University] At: 21:48 12 October 2010

h að Þ ¼1
Ra2 �
ffiffiffiffiffiffiffiffi2��
E �
ra12 � �
A
�1=2a
12: ð1bÞ
This envelope is parameterized by the radius a of the contact area. The shape of theenvelope depends on the adhesion energy between the bodies � and the plain-strainYoung’s modulus E �. The+and � signs correspond to the loading and unloadingphases of the experiment, respectively. When unloading begins, the experiment willinitially sample a leg of the very last fold, which for �� R becomes a straight line.An example of the envelope curve is shown in Figure 3b (solid curve (blue online)).
Notice that when A ¼ 0, the loading and unloading branches in (1a) and (1b)collapse to a single curve, the equilibrium P–h curve given by the JKR contact theory[10]. The JKR theory also considers adhesive contact between a paraboloid and ahalf-space, but ignores the roughness of the surfaces. Similarly, when both A and �are set to 0, Equations (1a) and (1b) reduce to the equilibrium P–h curve given byHertz contact theory [11], which ignores both adhesion and roughness.
3.4. Comparing theory with AFM experiments
A comparison of the experimental results with a fitting to Equations (1a) and (1b)is shown as dashed lines in Figure 1a. For the fitting we used E � for PDMS as
Ph
−1 −0.8 −0.4 −0.2 0 0.2 0.4 0.6
−10
−5
0
5
Rough contact
Smooth contact
Measured during rough contact
d
e c
f
(b)
h
R
λ
2A
a
−1 −0.8 −0.6 −0.4 −0.2 0 0.2 0.4 0.6 0.8−0.6
PhEqs. (1a), (1b)
Eqs. (1a), (1b)
Envelope of the P–h curve
r
(a)
(d) (f)(e)(c)
Figure 3. (a) P–h curves predicted by a smooth-surface contact model [10] (dashed curve) andby the small roughness contact model studied in this article (thick solid curve). Both curves areparameterized by the radius of the contact area. In an experiment in which h is prescribed,sudden changes in the contact area occur at the tip of every fold, such as from d to e. As aresult, an experiment will measure only parts of its envelope (thin solid curve). (b) When theroughness length scale (�) is much smaller than the radius of the indenter (R) the folds in theP–h curve are so close together that the envelope of the P–h curve can be described byEquations (1a) and (1b) (thick solid curve). (c)–(f) Contact shapes at different stages ofloading/unloading marked in (a).
Philosophical Magazine Letters 9
Downloaded By: [Stanford University] At: 21:48 12 October 2010
0.75MPa, � for glass-PDMS contact as 2:6 10�2 J and A=ffiffiffi�p¼ 9 10�6
ffiffiffiffimp
.These values for E � and � are very close to the reported values [5,6,28,29] for thesame composition of PDMS and glass used in this work (Section 2.2). Additionally,the value of A=� is commensurate with AFM scans of the glass bead, and the Si moldsurfaces, which revealed a combined RMS-roughness of the bead and the samples�10 nm (A) and features sizes smaller then 1000 nm ð�Þ.
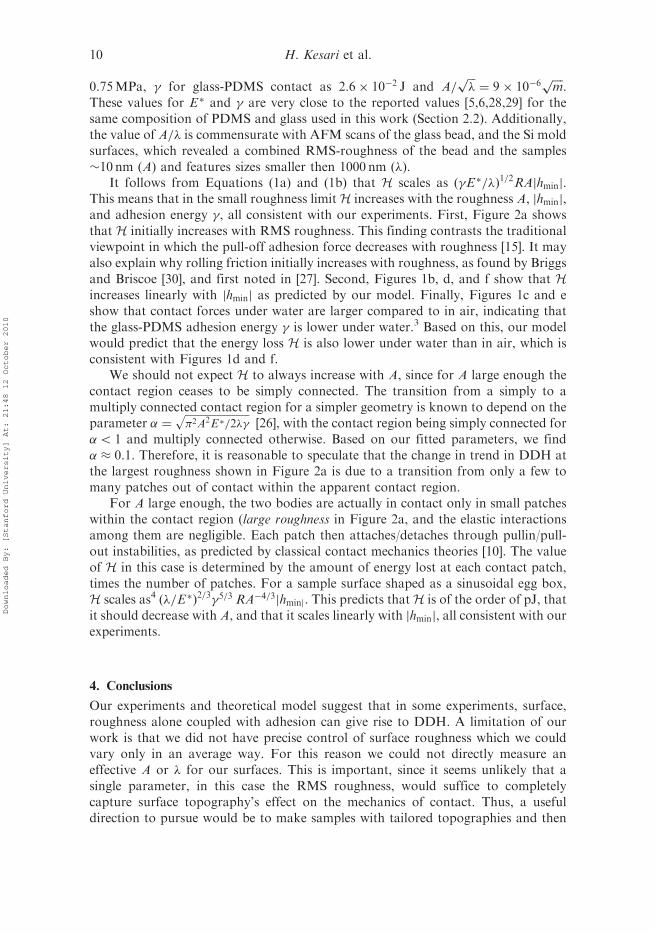
It follows from Equations (1a) and (1b) that H scales as �E �=�ð Þ1=2RAjhminj.
This means that in the small roughness limitH increases with the roughness A, jhminj,and adhesion energy �, all consistent with our experiments. First, Figure 2a showsthat H initially increases with RMS roughness. This finding contrasts the traditionalviewpoint in which the pull-off adhesion force decreases with roughness [15]. It mayalso explain why rolling friction initially increases with roughness, as found by Briggsand Briscoe [30], and first noted in [27]. Second, Figures 1b, d, and f show that Hincreases linearly with jhminj as predicted by our model. Finally, Figures 1c and eshow that contact forces under water are larger compared to in air, indicating thatthe glass-PDMS adhesion energy � is lower under water.3 Based on this, our modelwould predict that the energy loss H is also lower under water than in air, which isconsistent with Figures 1d and f.
We should not expect H to always increase with A, since for A large enough thecontact region ceases to be simply connected. The transition from a simply to amultiply connected contact region for a simpler geometry is known to depend on theparameter � ¼
ffiffiffiffiffiffiffiffiffiffiffiffiffiffiffiffiffiffiffiffiffiffiffiffiffiffi�2A2E �=2��
p[26], with the contact region being simply connected for
�5 1 and multiply connected otherwise. Based on our fitted parameters, we find� � 0:1. Therefore, it is reasonable to speculate that the change in trend in DDH atthe largest roughness shown in Figure 2a is due to a transition from only a few tomany patches out of contact within the apparent contact region.
For A large enough, the two bodies are actually in contact only in small patcheswithin the contact region (large roughness in Figure 2a, and the elastic interactionsamong them are negligible. Each patch then attaches/detaches through pullin/pull-out instabilities, as predicted by classical contact mechanics theories [10]. The valueof H in this case is determined by the amount of energy lost at each contact patch,times the number of patches. For a sample surface shaped as a sinusoidal egg box,H scales as4 �=E �ð Þ
2=3�5=3 RA�4=3jhminj. This predicts thatH is of the order of pJ, thatit should decrease with A, and that it scales linearly with jhminj, all consistent with ourexperiments.
4. Conclusions
Our experiments and theoretical model suggest that in some experiments, surface,roughness alone coupled with adhesion can give rise to DDH. A limitation of ourwork is that we did not have precise control of surface roughness which we couldvary only in an average way. For this reason we could not directly measure aneffective A or � for our surfaces. This is important, since it seems unlikely that asingle parameter, in this case the RMS roughness, would suffice to completelycapture surface topography’s effect on the mechanics of contact. Thus, a usefuldirection to pursue would be to make samples with tailored topographies and then
10 H. Kesari et al.
Downloaded By: [Stanford University] At: 21:48 12 October 2010

study the effect of surface topography on contact phenomenon in more detail.Nonetheless, the current study clearly demonstrates that surface topography can giverise to DDH during contact. Our study demonstrates that when there is evidence tosuggest that surface roughness is responsible for the observed DDH, then materialsproperties, such as E � and �, can be estimated by simultaneously using bothbranches of the P–h curve. It is somewhat surprising that while the sample surfaceslikely have complicated surface topographies, the fit to Equations (1a) and (1b),which are derived by assuming a sinusoidal surface shape, produces values for themechanical properties that are in the range of the expected values. These results areencouraging, but further exploration and validation are needed to test the robustnessof this procedure to extract mechanical properties from AFM experiments.Our findings also demonstrate the possibility of extracting information aboutsurface roughness at the nanoscale (the value of A=
ffiffiffi�p
) even from experimentsemploying micrometer-sized AFM probes.
Acknowledgements
This work is partly supported by the Center for Probing the Nanoscale (CPN), an NSF NSEC,NSF Grant No. PHY-0425897, by the NSF Career programs CMS-0547681, ECS-0449400and CMMI-0747089, NIH R01-EB006745, and by the NSF award CNS-0619926 forcomputer resources. J.C. Doll is supported in part by NSF and NDSEG Graduate ResearchFellowships. H. Kesari is supported by the Herbert Kunzel Stanford Graduate Fellowship andhe thanks Dr. Bjorn Backes for helping perform the NI experiments.
Notes
1. In this work, we estimate glass-PDMS adhesion energy to be 26mJ/m2 (Section 3.4).Cao et al. [31] report the diamond-PDMS adhesion energy to be 227mJ/m2.However, from other sources the glass-PDMS adhesion energy is seen to lie in therange 12–150mJ/m2 [6,32], and the diamond-PDMS adhesion energy is seen to lie in therange 20–500mJ/m2 [33–35].
2. The derivation of Equations (1a) and (1b) requires considerable space to be properlyexplained, so it will be published separately. Briey, however, when �/R� 1 andA/��O(1), the equilibrium P–h curve given by Equations (2), (3) in [14], which areparametric equations of the form P(a), h(a), reduces to a form which contains terms givenby the JKR contact theory and additional oscillatory terms arising due to the sinusoidaltopography. We derive the equation for the envelope by replacing the oscillatory termswith their respective maximum andminimum values.
3. Reduced adhesion under water has also been observed between mica surfaces [36].4. The derivation of this expression will be published elsewhere.
References
[1] Y.S. Chu, S. Dufour, J.P. Thiery, E. Perez and F. Pincet, Phys. Rev. Lett. 94 (2) (2005)
p.28102.[2] F.W. DelRio, M.P. de Boer, J.A. Knapp, E.D. Reedy Jr., P.J. Clews and M.L. Dunn,
Nature Mater. 4 (2005) p.629.[3] E.K. Dimitriadis, F. Horkay, J. Maresca, B. Kachar and R.S. Chadwick, Biophys. J. 82 (5)
(2002) p.2798.
Philosophical Magazine Letters 11
Downloaded By: [Stanford University] At: 21:48 12 October 2010
[4] O. Sahin, S. Magonov, C. Su, C.F. Quate and O. Solgaard, Nature 2 (2007) p.507.[5] S. Park, M. Goodman and B. Pruitt, Proc. Nat. Acad. Sci. 104 (44) (2007) p.17376.[6] J. Pickering, D. Van Der Meer and G. Vancso, J. Adhesion Sci. Tech. 15 (12) (2001)
p.1429.
[7] N. Maeda, N. Chen, M. Tirrell and J.N. Israelachvili, Science 297 (5580) (2002) p.379.[8] Y. Chen, C. Helm and J. Israelachvili, J. Phys. Chem. 95 (1991) p.10736.[9] G. Choi, S. Kim and A. Ulman, Languir 13 (1997) p.6333.
[10] K.L. Johnson, K Kendall and A.D. Roberts, Proc. Roy. Soc. Lon. Ser. A, Math. Phys.Sci. 324 (1558) (1971) p.301.
[11] H. Hertz, J. Reine Angew. Math. 92 (1881) p.156.
[12] B.V. Derjaguin, V.M. Muller and Y.P. Toporov, J. Colloid Interface Sci. 53 (2) (1975)p.314.
[13] D. Maugis, Contact Adhesion and Rupture of Elastic Solids, Solid State Sciences, Springer,
Berlin, 2000.[14] P. Guduru and C. Bull, J. Mech. Phys. Solids 55 (3) (2007) p.473.[15] B. Zappone, K. Rosenberg and J. Israelachvili, Tribology Lett. 26 (3) (2007) p.191.[16] W. Oliver and G. Pharr, J. Mater. Res. 7 (6) (1992) p.1564.
[17] J. Grobelny, N. Pradeep, D.I. Kim and Z.C. Ying, Appl. Phys. Lett. 88 (2006) p.091906.[18] M. Giri, D. Bousfield and W. Unertl, Langmuir 17 (10) (2001) p.2973.[19] H. She, D. Malotky and M. Chaudhury, Langmuir 14 (11) (1998) p.3090.
[20] Y. Xia and G. Whitesides, Annu. Rev. Mater. Sci. 28 (1) (1998) p.153.[21] F. Hua, Y. Sun, A. Gaur, M.A. Meitl, L. Bilhaut, L. Rotkina, J. Wang, P. Geil, M. Shim
and J.A. Rogers, Nano Lett. 4 (12) (2004) p.2467.
[22] N.A. Burnham, X. Chen, C.S. Hodges, G.A. Matei, E.J. Thoreson, C.J. Roberts,M.C. Davies and S.J.B. Tendler, Nanotechnology 14 (1) (2003) p.1.
[23] B. Bhushan, Springer Handbook of Nanotechnology, Springer, Berlin, 2006.[24] J.C. McDonald, D.C. Duffy, J.R. Anderson, D.T. Chiu, H. Wu, O.J.A. Schueller and
G.M. Whitesides, Electrophoresis 21 (1) (1999) p.27.[25] Y.Y. Lin and C.Y. Hui, J. Polymer Sci. Part B Polymer Phys. 40 (2002) p.772.[26] K. Johnson, Int. J. Solids Struct. 32 (3) (1995) p.423.
[27] P. Guduru, J. Mech. Phys. Solids 55 (3) (2007) p.445.[28] F. Schneider, T. Fellner, J. Wilde and U. Wallrabe, J. Micromech. Microeng. 18 (6) (2008)
p.065008.
[29] X. Brown, K. Ookawa and J. Wong, Biomaterials 26 (16) (2005) p.3123.[30] G. Briggs and B. Briscoe, Nature 260 (5549) (1976) p.313.[31] Y. Cao, D. Yang and W. Soboyejoy, J. Mater. Res. 20 (8) (2005) p.2004.
[32] A. Sofla, E. Seker, J.P. Landers and M.R. Begley, J. Appl. Mech. 77 (2010) p.031007.[33] C.J. Buchko, M.J. Slattery, K.M. Kozloff and D.C. Martin, J. Mater. Res. 15 (1) (2000)
p.231.[34] L. Bes, K. Huan, E. Khoshdel, M.J. Lowe, C.F. McConville and D.M. Haddleton, Eur.
Polymer J. 39 (1) (2003) p.5.[35] A. Bietsch and B. Michel, J. Appl. Phys. 88 (2000) p.4310.[36] H. Christenson, J. Phys. Chem. 97 (46) (1993) p.12034.
12 H. Kesari et al.
Downloaded By: [Stanford University] At: 21:48 12 October 2010