philosophy, structure, voice of the customer, and lean · philosophy, structure, voice of the...
TRANSCRIPT

6s
DEFINE
Chapter 3-3
Philosophy, Structure, Voice of the Customer, and Lean
3-3-1 © 2015 Institute of Industrial Engineers
6s
DEFINE
Six Sigma Defined
Six Sigma (s) is a customer focused, well defined problem solving methodology supported by a handful of powerful analytical tools.
Continuous improvement is driven by the execution of carefully selected projects. The goal of the Six Sigma approach is to take small steps forward and no steps backward.
3-3-2 © 2015 Institute of Industrial Engineers
6s
DEFINE
From the GE Web Site
Customers are the center of GE's universe: they define
quality. They expect performance, reliability, competitive
prices, on-time delivery, service, clear and correct
transaction processing and more. In every attribute that
influences customer perception, we know that just being
good is not enough. Delighting our customers is a
necessity. Because if we don't do it, someone else will!
3-3-3 © 2015 Institute of Industrial Engineers

6s
DEFINE
Voice of the Customer
The "voice of the customer" is a process used to capture the requirements/feedback from the customer (internal or external) to provide the customers with the best in class service/product quality. This process is all about being proactive and constantly innovative to capture the changing requirements of the customers with time. The "voice of the customer" is the term used to describe the stated and unstated needs or requirements of the customer. The voice of the customer can be captured in a variety of ways: Direct discussion or interviews, surveys, focus groups, customer specifications, observation, warranty data, field reports, complaint logs, etc.
3-3-4 © 2015 Institute of Industrial Engineers

6s
DEFINE
Voice-of-the-customer is
a crossfunctional, systems approach to gathering data on customer needs and perceptions of performance, that translates this data into useful information, highlighting opportunities to respond and foster extraordinary customer experience.
3-3-5 © 2015 Institute of Industrial Engineers
6s
DEFINE
Definition of Customer
Gather the Voice of the Customer
• Anyone whose success or satisfaction depends on one’s actions
• Analyze Customer Needs
• Prioritize customer needs.
3-3-6 © 2015 Institute of Industrial Engineers

6s
DEFINE
Information on QFD….
• Developed in Japan in the mid 1970s
• Introduced in USA in the late 1980s
• Toyota was able to reduce 60% of cost to bring a new car model to market
• Toyota decreased 1/3 of its development time
• Used in cross functional teams
• Companies feel it increased customer satisfaction
3-3-7 © 2015 Institute of Industrial Engineers

6s
DEFINE
Quality Function Deployment
• Is a structured method (house of quality) that is intended to transmit and translate customer requirements, that is, the
• Voice of the Customer
• through each stage of the product development and production process, that is, through the product realization cycle.
• These requirements are the collection of customer needs, including all satisfiers, exciters/delighters, and dissatisfiers.
3-3-8 © 2015 Institute of Industrial Engineers

6s
DEFINE
Why….?
Product should be designed to reflect customers’ desires and
tastes.
House of Quality is a kind of a conceptual map that provides the means for inter-functional planning and communications
To understand what customers mean by quality and how to
achieve it from an engineering perspective.
HQ is a tool to focus the product development process
3-3-9 © 2015 Institute of Industrial Engineers

6s
DEFINE
QFD Target
3-3-10 © 2015 Institute of Industrial Engineers

6s
DEFINE
Components of House of Quality
Customer
Evaluation
Units
Targets
Th
is P
rod
uct
This Product
Targets
Who
Whats
Who v
s.
Wh
ats
Hows vs
Hows
Hows
Whats vs
Hows
Now
No
w v
s
Wh
at
How Muches Hows vs
How
Muches
3-3-11 © 2015 Institute of Industrial Engineers

6s
DEFINE
Step 1: Who are the customers?
• To “Listen to the voice of the customer” first need to identify the customer
• In most cases there are more than one customer
– consumer
– regulatory agencies
– manufacturing
– marketing/Sales
Customer
Evaluation
Units
Targets
Th
is P
rod
uct
This Product
Targets
Who
Whats
Who v
s.W
hats
Hows vsHows
Hows
Whats vsHows
Now
Now
vs
What
How MuchesHows vs
HowMuches
Customers drive the development of
the product, not the designer
3-3-12 © 2015 Institute of Industrial Engineers

6s
DEFINE
Step 2: Determine the customers’ requirements
• Need to determine what is to be designed
• Consumer
– product works as it should
– lasts a long time
– is easy to maintain
– looks attractive
– incorporated latest technology
– has many features
Customer
Evaluation
Units
Targets
Th
is P
rod
uct
This Product
Targets
Who
Whats
Who v
s.W
hats
Hows vsHows
Hows
Whats vsHows
Now
Now
vs
What
How MuchesHows vs
HowMuches
List all the demanded qualities at the same level
of abstraction
3-3-13 © 2015 Institute of Industrial Engineers
6s
DEFINE
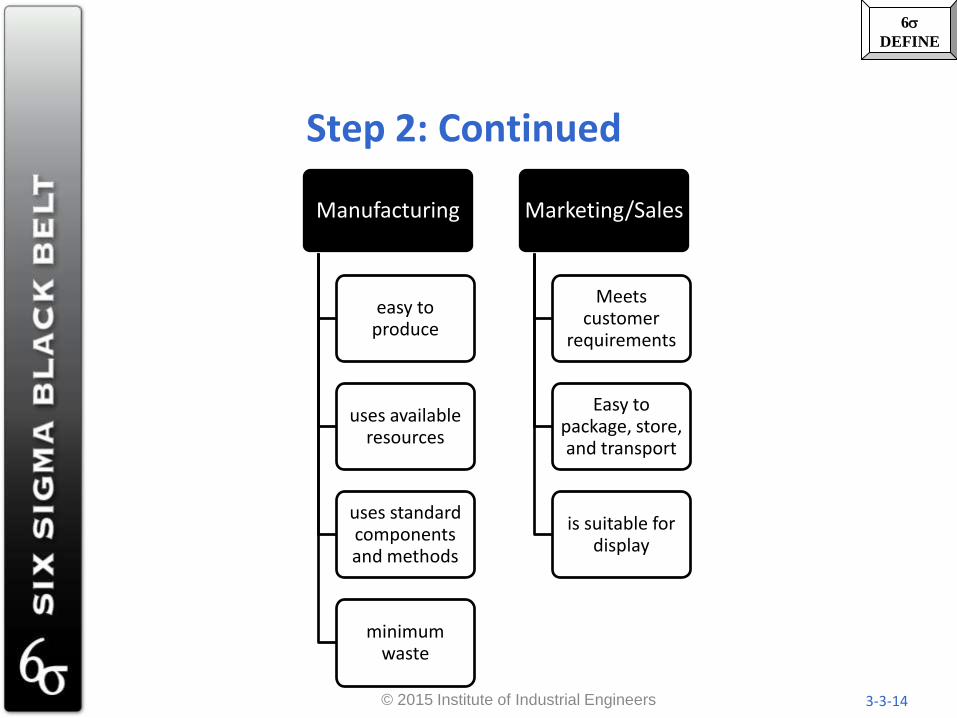
Step 2: Continued
Manufacturing
easy to produce
uses available resources
uses standard components and methods
minimum waste
Marketing/Sales
Meets customer
requirements
Easy to package, store, and transport
is suitable for display
3-3-14 © 2015 Institute of Industrial Engineers
6s
DEFINE
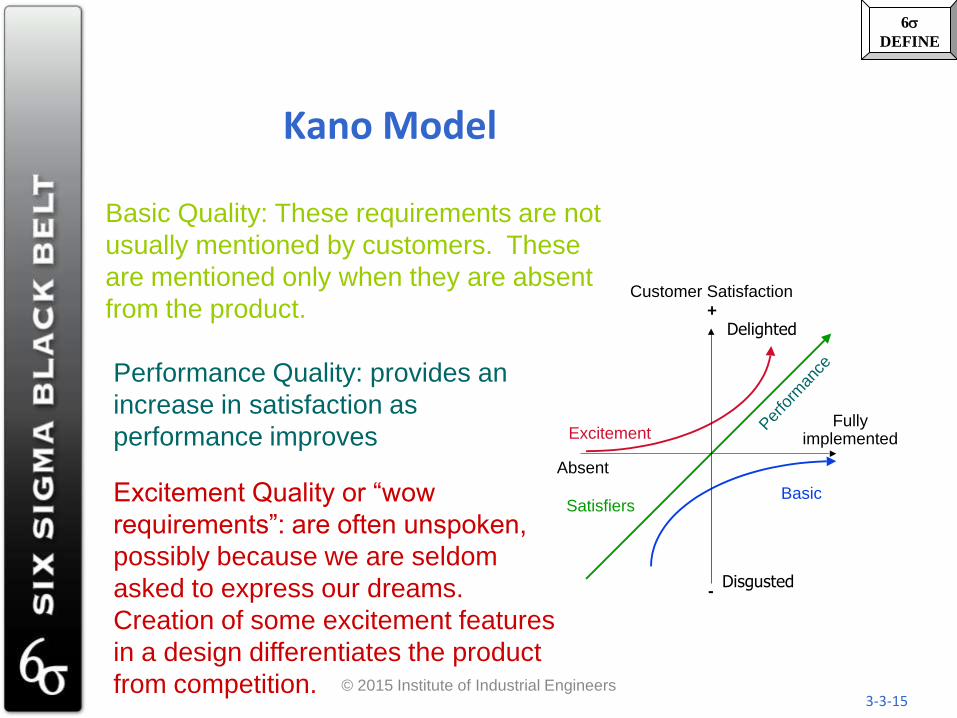
Kano Model
Excitement
SatisfiersBasic
Per
form
ance
Fullyimplemented
Absent
Customer Satisfaction
-
+
Disgusted
Delighted
Basic Quality: These requirements are not
usually mentioned by customers. These
are mentioned only when they are absent
from the product.
Performance Quality: provides an
increase in satisfaction as
performance improves
Excitement Quality or “wow
requirements”: are often unspoken,
possibly because we are seldom
asked to express our dreams.
Creation of some excitement features
in a design differentiates the product
from competition. 3-3-15
© 2015 Institute of Industrial Engineers
6s
DEFINE
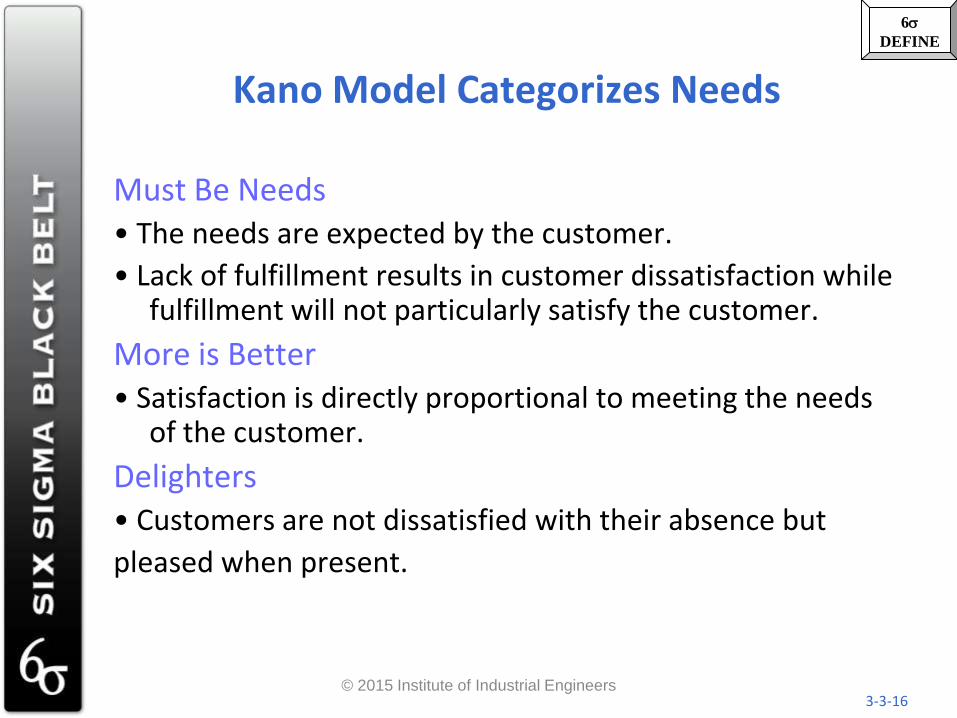
Kano Model Categorizes Needs
Must Be Needs • The needs are expected by the customer.
• Lack of fulfillment results in customer dissatisfaction while fulfillment will not particularly satisfy the customer.
More is Better • Satisfaction is directly proportional to meeting the needs
of the customer.
Delighters • Customers are not dissatisfied with their absence but
pleased when present.
3-3-16 © 2015 Institute of Industrial Engineers

6s
DEFINE
Example
It is critical that the Must Be and More is Better
features are present before Delighters become
effective in attaining a leadership position.
Airline Hotel
Must Be Safety Cleanliness
More is Better Cheap Tickets Award Points
Delighter Vanity Kits Cookies
3-3-17 © 2015 Institute of Industrial Engineers

6s
DEFINE
What Customers Want Garvin’s Eight Dimensions
Performance
Features
Conformance
Aesthetics
Reliability
Durability
Serviceability
Perceived Quality
3-3-18 © 2015 Institute of Industrial Engineers
6s
DEFINE
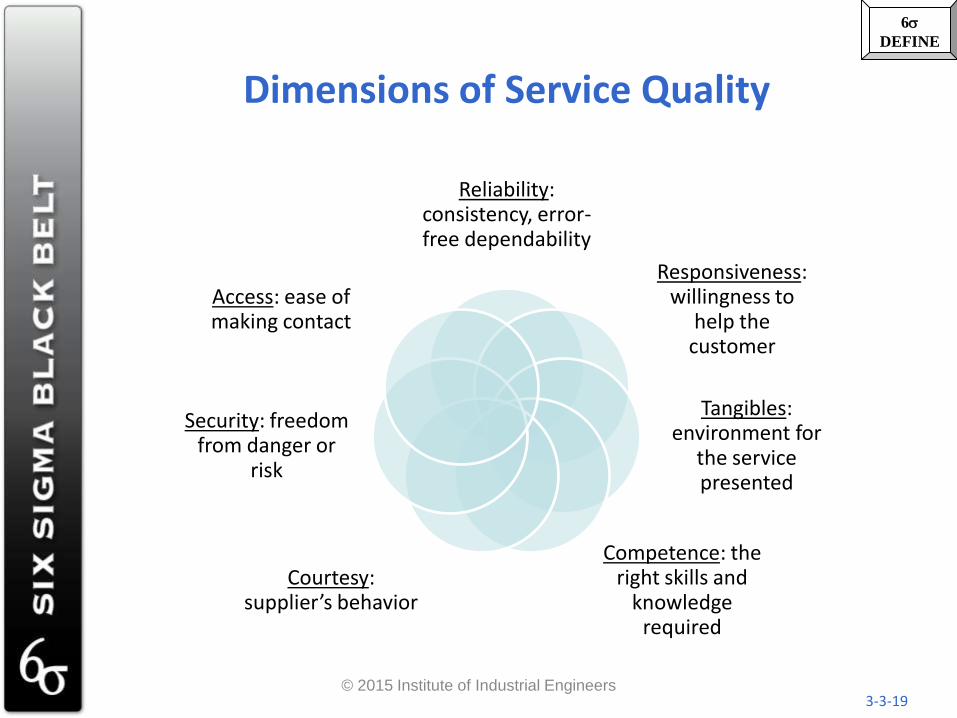
Dimensions of Service Quality
Reliability: consistency, error-free dependability
Responsiveness: willingness to
help the customer
Tangibles: environment for
the service presented
Competence: the right skills and
knowledge required
Courtesy: supplier’s behavior
Security: freedom from danger or
risk
Access: ease of making contact
3-3-19 © 2015 Institute of Industrial Engineers

6s
DEFINE
Types of Customer Requirements
• Functional requirements describe the product’s desired behavior
• Human factors
• Physical requirements
• Reliability
• Life-cycle concerns
• Resource concerns
• Manufacturing requirements
3-3-20 © 2015 Institute of Industrial Engineers

6s
DEFINE
How to determine the Whats?
• Customer survey (have to formulate the questions very carefully)
• If redesign, observe customers using existing products
• Combine both or one of the approaches with designer knowledge/experience to determine “the customers’ voice”
3-3-21 © 2015 Institute of Industrial Engineers

6s
DEFINE
Step 3: Determine Relative Importance of the Requirements: Who vs. What
• Need to evaluate the importance of each of the customer’s requirements.
– Generate weighing factor for each requirement by rank ordering or other methods
Customer
Evaluation
Units
Targets
Th
is P
rod
uct
This Product
Targets
Who
Whats
Who v
s.
Whats
Hows vs Hows
Hows
Whats vs
Hows
Now
Now
vs
What
How Muches Hows vs
How
Muches
3-3-22 © 2015 Institute of Industrial Engineers

6s
DEFINE
Step 4: Identify and Evaluate the Competition: How satisfied is the customer now?
• The goal is to determine how the customer perceives the competition’s ability to meet each of the requirements
– it creates an awareness of what already exists
– it reveals opportunities to improve on what already exists
The design:
1. does not meet the requirement at all
2. meets the requirement slightly
3. meets the requirement somewhat
4. meets the requirement mostly
5. fulfills the requirement completely
Customer
Evaluation
Units
Targets
Th
is P
rod
uct
This Product
Targets
Who
Whats
Who v
s.
Whats
Hows vs Hows
Hows
Whats vs
Hows
Now
Now
vs
What
How Muches Hows vs
How
Muches
3-3-23 © 2015 Institute of Industrial Engineers
6s
DEFINE
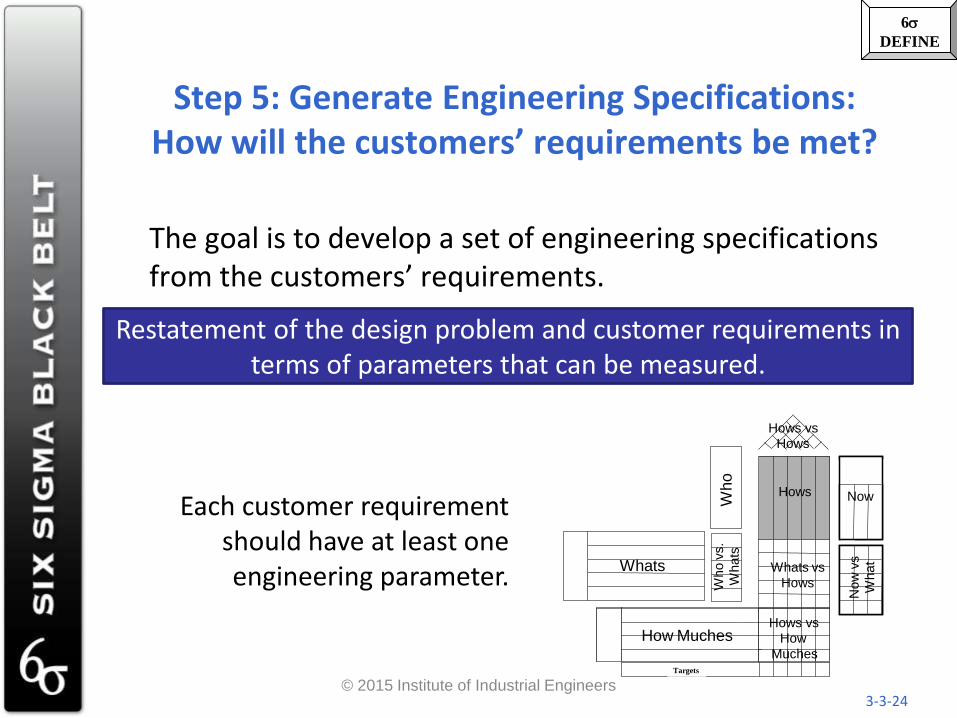
Step 5: Generate Engineering Specifications: How will the customers’ requirements be met?
The goal is to develop a set of engineering specifications from the customers’ requirements.
Restatement of the design problem and customer requirements in terms of parameters that can be measured.
Each customer requirement should have at least one engineering parameter.
Customer
Evaluation
Units
Targets
Th
is P
rod
uct
This Product
Targets
Who
Whats
Who v
s.
Whats
Hows vs Hows
Hows
Whats vs
Hows
Now
Now
vs
What
How Muches Hows vs
How
Muches
3-3-24 © 2015 Institute of Industrial Engineers

6s
DEFINE
Step 6: Relate Customers’ requirements to Engineering Specifications: Hows measure Whats?
This is the center portion of the house. Each cell represents how an engineering parameter relates to a customers’ requirements.
Customer
Evaluation
Units
Targets
Th
is P
rod
uct
This Product
Targets
Who
Whats
Who v
s.
Whats
Hows vs Hows
Hows
Whats vs
Hows
Now
Now
vs
What
How Muches Hows vs
How
Muches
9 = Strong Relationship 3 = Medium Relationship 1 = Weak Relationship Blank = No Relationship at all
3-3-25 © 2015 Institute of Industrial Engineers

6s
DEFINE
Step 7: Identify Relationships Between Engineering Requirements: How are the Hows Dependent on
each other?
Engineering specifications maybe dependent on each other.
Customer
Evaluation
Units
Targets
Th
is P
rod
uct
This Product
Targets
Who
Whats
Who v
s.
Whats
Hows vs Hows
Hows
Whats vs
Hows
Now
Now
vs
What
How Muches Hows vs
How
Muches
+9 = Strong Relationship
+3 = Medium Relationship
+1 = Weak Relationship
-1 = Weak Negative Relationship
-3 = Medium Negative Relationship
-9 = Strong Negative Relationship
Blank = No Relationship at all
3-3-26 © 2015 Institute of Industrial Engineers
6s
DEFINE
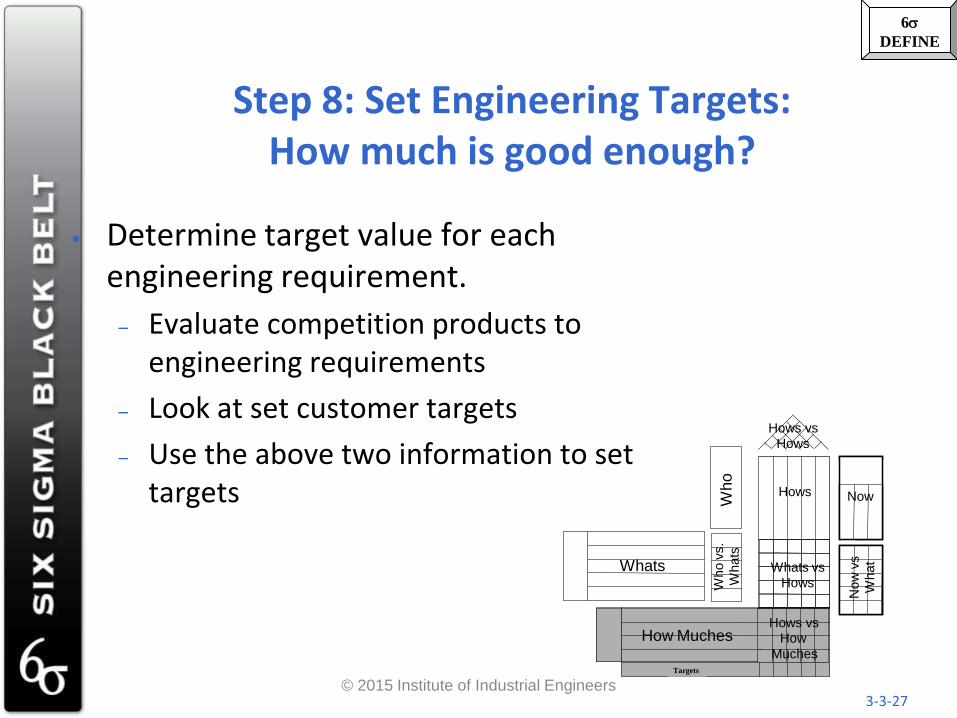
Step 8: Set Engineering Targets: How much is good enough?
• Determine target value for each engineering requirement.
– Evaluate competition products to engineering requirements
– Look at set customer targets
– Use the above two information to set targets
Customer
Evaluation
Units
Targets
Th
is P
rod
uct
This Product
Targets
Who
Whats
Who v
s.
Whats
Hows vs Hows
Hows
Whats vs
Hows
Now
Now
vs
What
How Muches Hows vs
How
Muches
3-3-27 © 2015 Institute of Industrial Engineers

6s
DEFINE The House
of Quality
Quality Function Deployment’s
House of Quality
Customer
Perceptions
Relationships
between
Customer Needs
and
Design Attributes
Imp
ort
an
ce
Ra
nk
ing
s
Customer
Needs
Design
Attributes
Costs/Feasibility
Engineering Measures
Correlation
Matrix
1 2
3
4
5
6
7
8
Establishes the Flowdown Relates WHAT'S & HOW'S Ranks The Importance
3-3-28 © 2015 Institute of Industrial Engineers

6s
DEFINE
Design for Manufacturability
is the general engineering art of designing products in such a way that they are easy to manufacture. The basic idea exists in almost all engineering disciplines, but of course the details differ widely depending on the manufacturing technology. This design practice not only focuses on the design aspect of a part but also on the producibility. In simple language it means relative ease to manufacture a product, part or assembly.
3-3-29 © 2015 Institute of Industrial Engineers
6s
DEFINE
Value Engineering/Analysis
is a systematic method to improve the "value" of goods or products and services by using an examination of function. Value, as defined, is the ratio of function to cost. Value can therefore be increased by either improving the function or reducing the cost.
3-3-30 © 2015 Institute of Industrial Engineers

6s
DEFINE
Six Sigma Philosophy and Organization
A brief synopsis of the key points of the six sigma philosophy that Green Belts and Black Belts are expected to be knowledgeable of.
3-3-31 © 2015 Institute of Industrial Engineers

6s
DEFINE
What Distinguishes Six Sigma from the Other Quality Improvement Methods?
a. The use of Greek in its name
b. Better marketing
c. The use of statistics
d. Justifying improvements in the language of management
Does the name Mikel Harry ring a bell?
3-3-32 © 2015 Institute of Industrial Engineers

6s
DEFINE
Savings
• A cable TV company reduced customer service calls by over 50% resulting in an annual savings into 7 figures.
• A hospital increased captured revenue by over half a million annually and save over $300,000 yearly by reducing no show and cancellation rates for procedures.
• A soft drink company decreased time for Engineering Change Notice from 56 days to 7 days
3-3-33 © 2015 Institute of Industrial Engineers
6s
DEFINE
More Savings
• A hospital reduced the time required to provide timely information about lab tests and saved over $140,000 annually.
• A drug store chain reduced inventory of perishable pharmaceuticals by $173 million per year.
A telecommunications company saved $5.2 million annually by improving the scheduling system for technician dispatches.
3-3-34 © 2015 Institute of Industrial Engineers

6s
DEFINE
Six Sigma Structured Approach
• Six Sigma involves a series of steps designed to lead the organization through the gauntlet of process improvement. Major steps include:
– Define
– Measure
– Analyze
– Improve
– Implement
– Control (Standardize and Validate)
3-3-35 © 2015 Institute of Industrial Engineers
6s
DEFINE
Memory Trip
• Can you remember back to your first science class and the scientific method?
• Are there any similarities between the scientific method and DMAIIC?
3-3-36 © 2015 Institute of Industrial Engineers

6s
DEFINE
Define
The first step is to define. This includes identifying the problem and setting the scope. It also includes the following:
– Identifying customers and requirements?
– Determining the outputs?
– Determining the inputs?
– Determining what is critical
– Determining what to measure
– Determining what we want to accomplish
• Tools sometimes used – Process Analysis
– Flow Charting
– Check Sheets
– Pareto Analysis
– Cause and Effect
Diagrams
– FMEA (Failure Mode Effects Analysis)
3-3-37 © 2015 Institute of Industrial Engineers

6s
DEFINE
Measure
The second step is to measure
– Identify and verify critical quality characteristics
– Estimate current capability
– Determine where you are relative to desired objectives
• Process Capability
– Percent Nonconforming
– Capability Indices
• Measurement Systems Analysis
– Gage R&R
– Operational Definitions
• Cost of Quality
3-3-38 © 2015 Institute of Industrial Engineers
6s
DEFINE
Analyze
• The third step is to analyze. This makes sense out of the data that is collected during measure.
• This shows the amount of improvement that might be possible to make the critical quality characteristic “best in class.”
Possible Tools
• Descriptive Statistics
• Inferential Statistics
• Probability
3-3-39 © 2015 Institute of Industrial Engineers

6s
DEFINE
Improvement
• Design of Experiments • ANOVA
• Factorial
• Simulation
• Cost Justification
• FMEA
• Project Management
• Correlation
• Regression
– Linear
– Multivariate
In order to improve, possible improvements are evaluated in a logical and planned fashion
3-3-40 © 2015 Institute of Industrial Engineers
6s
DEFINE
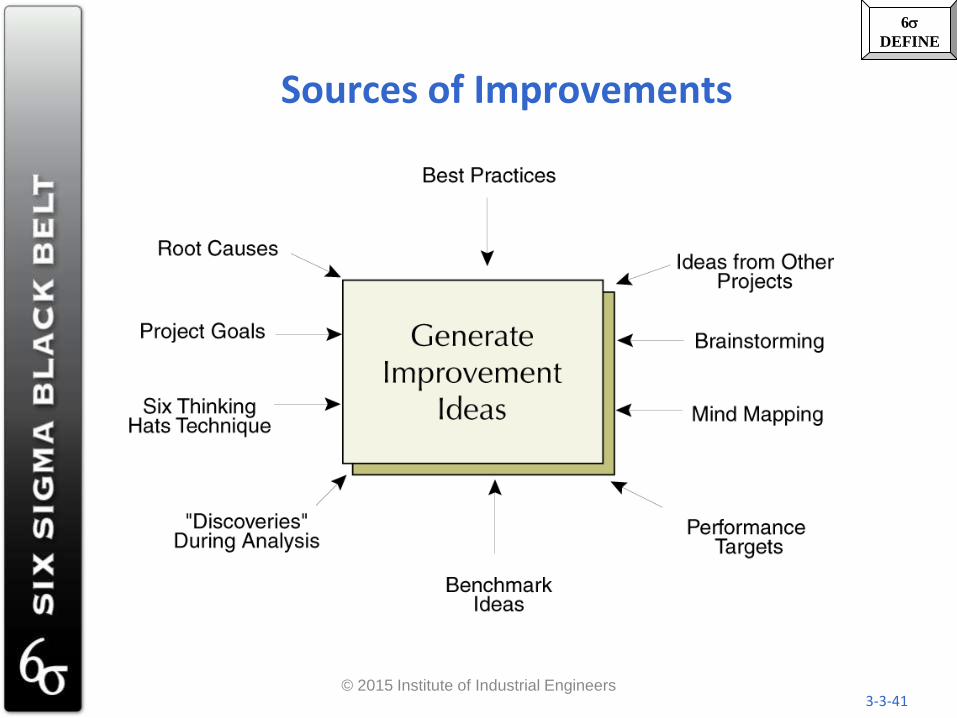
Sources of Improvements
3-3-41 © 2015 Institute of Industrial Engineers

6s
DEFINE
Implement
• Improvements are implemented in a logical and planned fashion
• A project plan is developed and managed
3-3-42 © 2015 Institute of Industrial Engineers

6s
DEFINE
Control (Standardize and Validate)
• The final stage is control. In the control phase measures have been implemented and steps are taken to make sure improvements are maintained. We also validate that the improvement…the reduction in variation…has actually occurred and the suggested benefits have been “seen.”
• Some Tools
– Statistical Process Control
– Cost of Quality
– Cost Analysis
– ISO 9000
3-3-43 © 2015 Institute of Industrial Engineers

6s
DEFINE
MEASURE THE
CURRENT PERFORMANCE
DEFINE THE OPPORTUNITY
IMPROVE PROCESS EFFICIENCY
ANALYZE THE CURRENT PROCESSES
CONTROL AND ADJUST
NEW PROCESSES
IMPLEMENT IMPROVEMENTS
• Determine
breakthroughs,
design future state:
new process, new
“Sigma” level
• Create dashboards,
scorecards and
plans
• Perform cause-
effect analysis to
determine reasons
for gaps in
performance
• Map the process,
gather initial
performance data
and determine
current “Sigma”
level
• Obtain client input,
factors Critical to
Quality (CTQ)
• Improve on what
matters most to the
client
• Significantly impact
the bottom line
• Measure
improvements and
breakthroughs
• Report dashboard,
scorecard data and
client feedback
• Execute plans,
overcome barriers
• Transition to the
new process
Client Driven,
Consistent,
Metrics Focused,
Results Oriented
DMAIIC Overview
3-3-44 © 2015 Institute of Industrial Engineers
6s
DEFINE
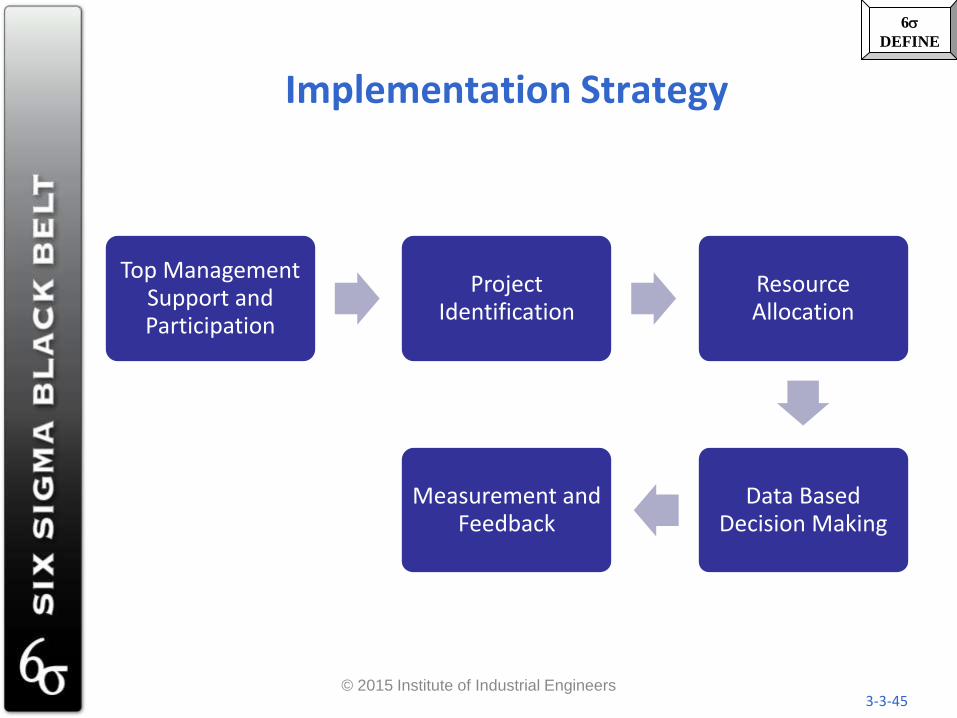
Implementation Strategy
Top Management Support and Participation
Project Identification
Resource Allocation
Data Based Decision Making
Measurement and Feedback
3-3-45 © 2015 Institute of Industrial Engineers

6s
DEFINE
Implementation
The process of implementing Six Sigma must be a top down approach. Responsibility must lie with senior management. Senior management must drive the process through the organization. Elements of this include careful selection of projects, allocation of resources, and decisions based on the measurements.
3-3-46 © 2015 Institute of Industrial Engineers

6s
DEFINE
Top Management Support / Participation
Leaders of successful Six Sigma implementations make it a top priority. They devote enormous amounts of thought, energy, time, and personal resources to making sure the Six Sigma succeeds.
In effect, they challenge employees.
“Would you tell me please which way I ought to go from here?” asked Alice. “That depends a good deal on where you want to get to,” said the Cat. “I don’t much care,” said Alice. “Then it doesn’t matter which way you go,” said the Cat.
3-3-47 © 2015 Institute of Industrial Engineers
6s
DEFINE
Six Sigma “Challenge”
• Senior leadership establishes its Six Sigma vision, customer satisfaction promise, goal, and new measurement indices
• This vision should fit within context of existing quality policy
• Establishes the common goal of reducing variability
3-3-48 © 2015 Institute of Industrial Engineers
6s
DEFINE
Develop Structure
Six Sigma has used the language
– Steering Committee
– Champion
– Yellow Belt
– Green Belt
– Black Belt
– Master Black Belt
– Master Black Belt Trainer
– Process Owner
3-3-49 © 2015 Institute of Industrial Engineers

6s
DEFINE
Steering Committee
• Identifies projects
• Identifies black belts
• Allocates resources
• Monitors progress
• Reviews effectiveness
• Establish implementation strategy and policies
3-3-50 © 2015 Institute of Industrial Engineers

6s
DEFINE
Champions
• Key management personnel who provide support, resources, and encouragement for the process
• Champions require a more in-depth understanding of the methods used, especially the measurements and the interpretation of the process measurements
3-3-51 © 2015 Institute of Industrial Engineers
6s
DEFINE
Green Belt
A green belt is an introductory participant in the process. Green belts understand concepts of problem solving, data collection, data interpretation, variation, process capability, and cost analysis.
3-3-52 © 2015 Institute of Industrial Engineers

6s
DEFINE
Black Belt
• Black belts are “thoroughly” trained individuals knowledgeable of all the analysis tools
• Black belt training is typically structured around a project where the analysis tools are applied as part of the training
3-3-53 © 2015 Institute of Industrial Engineers

6s
DEFINE
Black Belt
Black belts perform the following tasks:
– Teach
– Coach
– Transfer knowledge
– Identify opportunities
– Influence the organizational use of the Six Sigma methods
3-3-54 © 2015 Institute of Industrial Engineers

6s
DEFINE
Master Black Belt
• The master black belt has demonstrated proficiency by documenting saving in excess of a predetermined amount. Master black belts also are competent teachers.
• Title is one given as recognition for outstanding performance or as the result of additional training, including train the trainer.
3-3-55 © 2015 Institute of Industrial Engineers
6s
DEFINE
Process Owner
• A process owner is the individual who has the ultimate authority to change a process.
• The process owner should be identified for every project or task that is entered onto an organizational metric tracking system.
• The process owner: – Monitors the performance of his/her process through key
indicators
– Works with all Six Sigma project teams in the area to enable them to successfully complete their projects
– Manages the process after completion to the Six Sigma project to sustain the gains made.
– Continues to improve and/or innovate the process through the application of the PDCA cycle.
3-3-56
© 2015 Institute of Industrial Engineers
6s
DEFINE
Outside-In Thinking
Six Sigma requires us to look at our business from the customer’s perspective, not ours. In other words, we must look at our processes from the outside-in. By understanding the transaction lifecycle from the customer’s needs and processes, we can discover what they are seeing and feeling. With this knowledge, we can identify areas where we can add significant value or improvement from their perspective.
3-3-57 © 2015 Institute of Industrial Engineers
6s
DEFINE
Data Based Decision Making
Obtaining a return on your Six Sigma investment requires that you make use of the information you obtain.
In successful Six Sigma organizations both strategic and operational decisions are guided by facts and data.
EOE
3-3-58 © 2015 Institute of Industrial Engineers

6s
DEFINE
The 6s Process
ID Customer Expectations
Process Flow Analysis
Root Cause Analysis
(Cause & Effect, Pareto)
Key Process Identified Data Collection Strategy
•Histogram
•Scatter Diagram
•Run Chart
•Control Chart
Baseline Measures
Propose Improvement Plan
Implement Plan
Collect & Analyze Data
Compare with Previous Results
Document & Standardize
Monitor
Causes Identified?
No
Objectives Met?
YES
No
YES
Define Measure and Analyze Improve, Implement
and Control
3-3-59 © 2015 Institute of Industrial Engineers

6s
DEFINE
Lean (Toyota Production System)
• Purpose: Reduce Waste
• Methodology: – Identify Customer Value
– Draft Value Stream Map
– Improve Stream • Remove Waste
• Balance Workload
• Flow the Process and Pull the Service/Product
• Effects: – Improved Delivery Time
– Reduced Waste
– Less Cost $$$
3-3-60 © 2015 Institute of Industrial Engineers
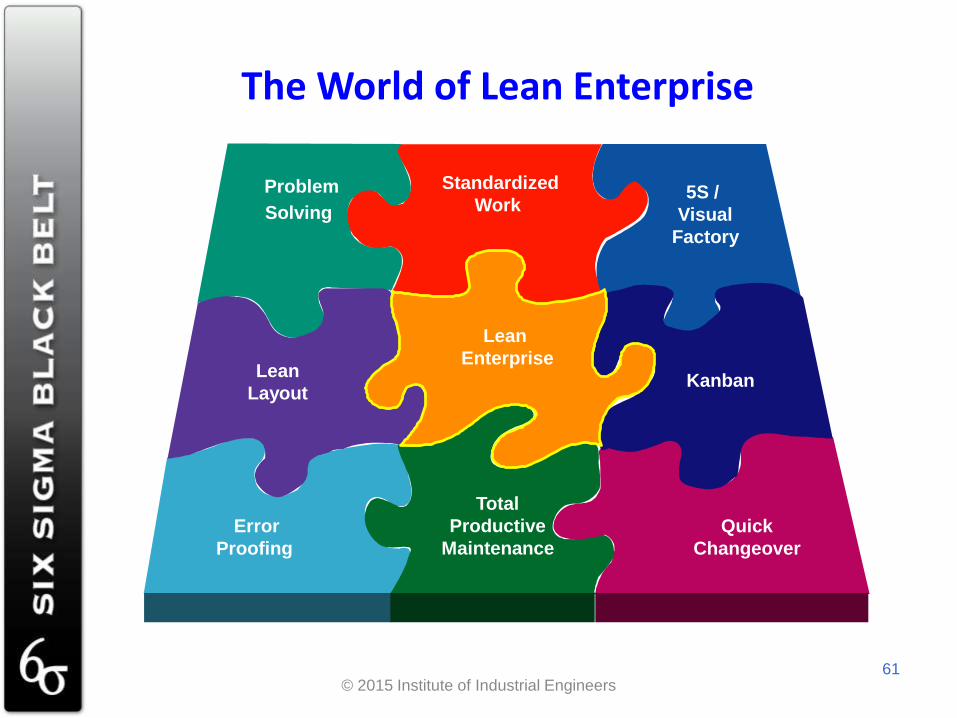
Problem
Solving
Standardized
Work
Error
Proofing
Quick
Changeover
Total
Productive
Maintenance
5S /
Visual
Factory
Kanban Lean
Layout
Lean
Enterprise
The World of Lean Enterprise
61 © 2015 Institute of Industrial Engineers

Observables in Lean Operations:
– Reliable Systems and Virtual Uptimes for Operations.
– Consistently Capable Processes – Capable, Reliable Suppliers – Minimal Non-Value Added Work – Point of Use Layouts, and Processes Without
Excessive Movement and Bulk/Mass Storage Systems
– Just-In-Time Delivery and Shipping – Involved Workforce – No Investment for Non-Value Added
Equipment/Resources
62 © 2015 Institute of Industrial Engineers

Lean Is . . . .
• According to . . . Michael George
– Lean is a process philosophy with three purposes – “To eliminate wasted time, effort, and material”
– “To provide customers with make-to-order products”
– “To reduce cost while improving quality”
Henry Ford, 1926 (Ford Motor Company) – “One of the most noteworthy accomplishments in keeping
the price of Ford products low is the gradual shortening of the production cycle. The longer an article is in the process of manufacture and the more it is moved about, the greater is the ultimate cost.”
63 © 2015 Institute of Industrial Engineers
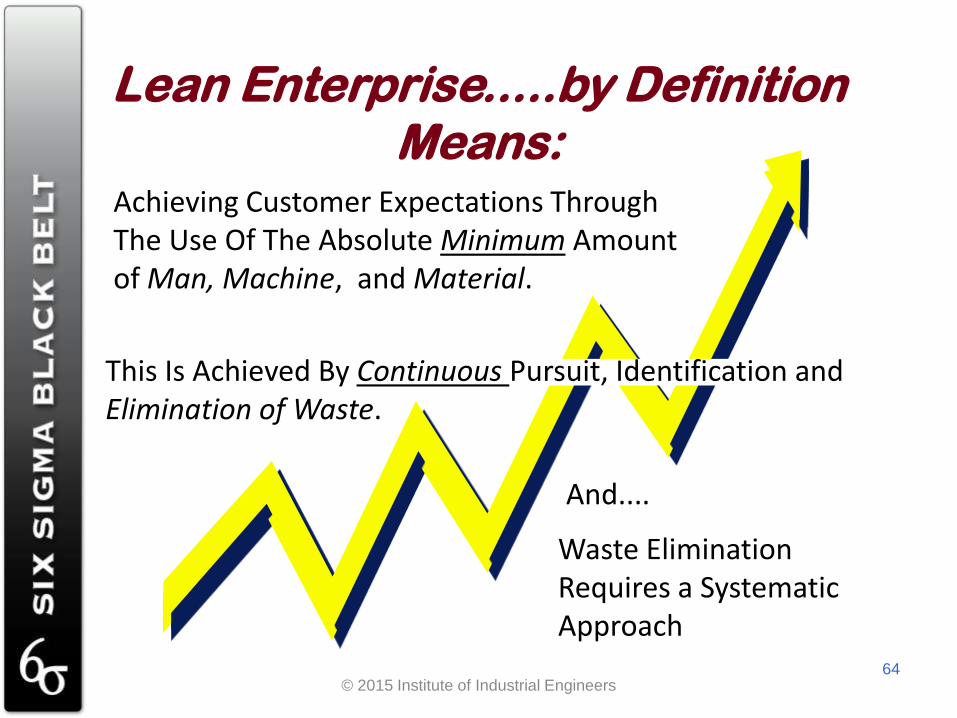
Lean Enterprise.....by Definition Means:
Achieving Customer Expectations Through The Use Of The Absolute Minimum Amount of Man, Machine, and Material.
Waste Elimination Requires a Systematic Approach
And....
This Is Achieved By Continuous Pursuit, Identification and Elimination of Waste.
64 © 2015 Institute of Industrial Engineers

Lean Enterprise Elements
Quality
Man/Mach.
Effectiveness
Employee
Involvement
Employee
Training
TPM Total Productive
Maintenance
Level
Schedules
& Pull
Workplace
Organization
Visual
Controls Simultaneous
Engineering
Supplier
Partnership
Material Flow
Lean
Enterprise
65 © 2015 Institute of Industrial Engineers

Adaptable to Demand Changes
Just-In-Time Production
Parts
Defect-Free
Error Proofing
Total Quality
Assurance
Program
Supplier
Involvement
Partnership
Pull
Kanban
Smooth
Production
Set-up
Reduction
Small Lot
Production
TPM
Flexible
Workforc
e
Reduced
Lead Time
Single Piece
Flexible
Production
Man Machine
Effectiveness
Std
Work
Multi
Function
Ops
Integrate
d Layout
Material Flow
Visual Control/Workplace
Organization
Employee Involvement
Improvement Activities By
Small Groups
Education & Training
Respect
Trust Increased
Morale
Element
Result
Eliminate
Material Waste
Reduced Scrap & Rework
Reduced Inspection
Reduced
expediting
Simple Systems
Eliminate Process and Conveyance waste
Less Inventory
Reduced Storage
Less Direct
Less Indirect
Less Handling
Less Idle Space
Lean Enterprise Goal: Higher Productivity = Less Material, Labor and Indirect Inputs for the Same or Higher Output. Less Delay = Faster response, Better Forecasts, and Less Administration
66
© 2015 Institute of Industrial Engineers
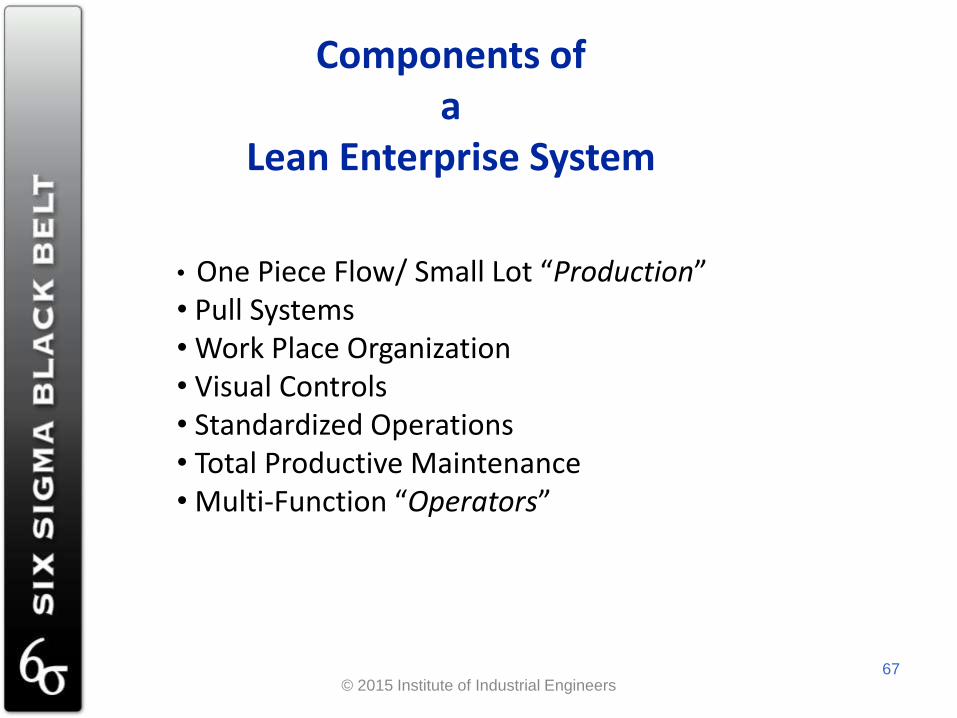
Components of a
Lean Enterprise System
• One Piece Flow/ Small Lot “Production” • Pull Systems • Work Place Organization • Visual Controls • Standardized Operations • Total Productive Maintenance • Multi-Function “Operators”
67 © 2015 Institute of Industrial Engineers

Value
Anything the ‘customer’ is willing to pay you to do.
Anything that fulfills ‘customer’ requirements.
Anything that increases the satisfaction of the ‘customer’.
68 © 2015 Institute of Industrial Engineers
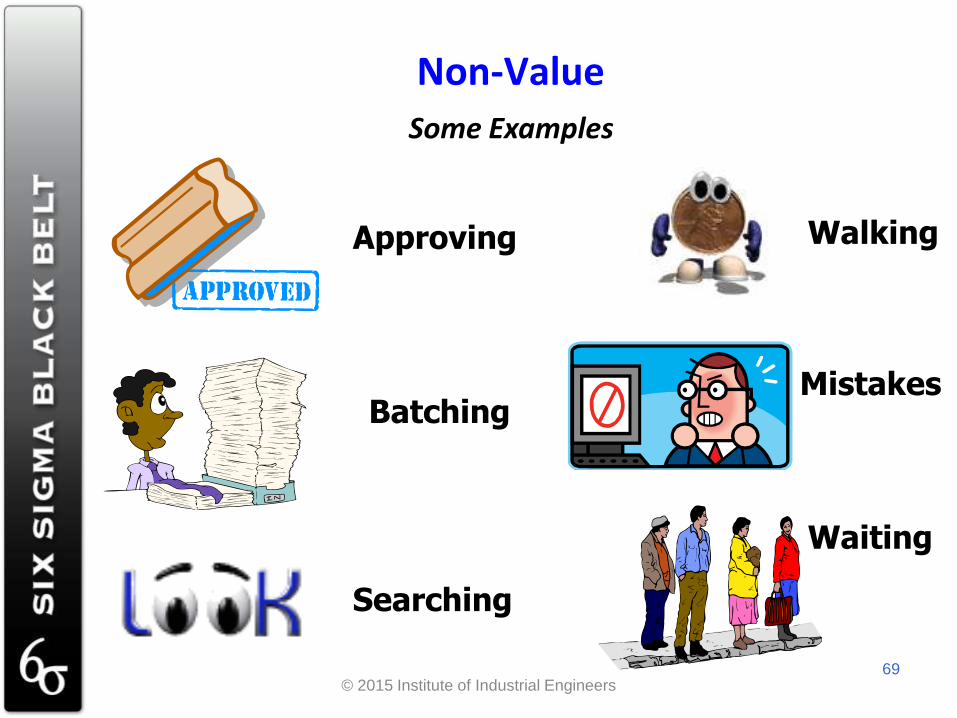
Approving
Batching
Searching
Walking
Waiting
Non-Value
Some Examples
Mistakes
69 © 2015 Institute of Industrial Engineers
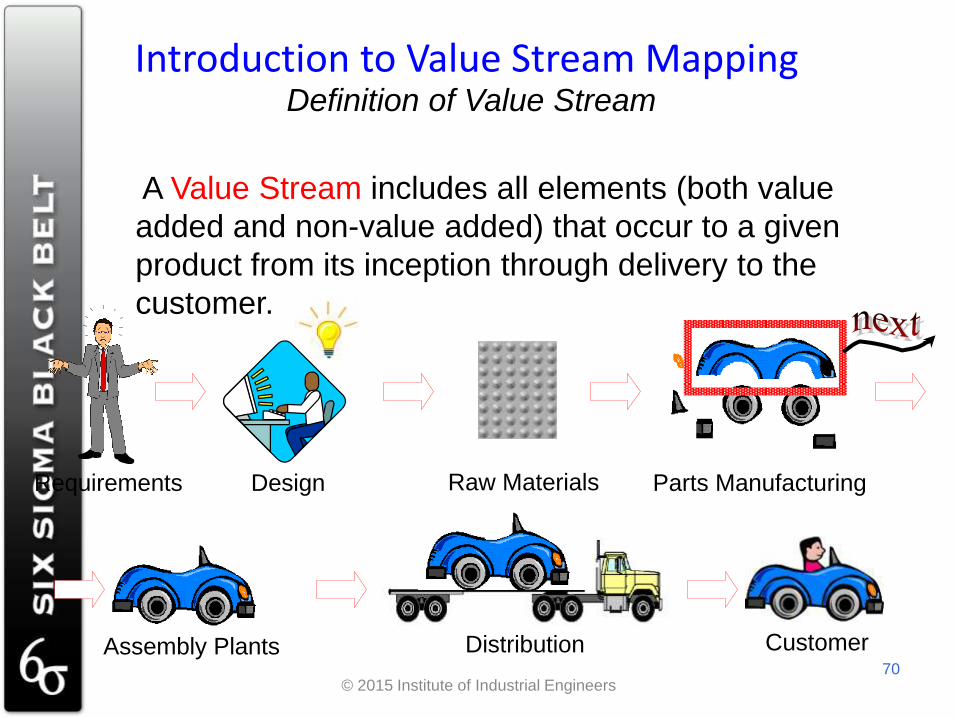
Design Raw Materials
Definition of Value Stream
Assembly Plants Distribution Customer
Parts Manufacturing
Introduction to Value Stream Mapping
A Value Stream includes all elements (both value
added and non-value added) that occur to a given
product from its inception through delivery to the
customer.
Requirements
70 © 2015 Institute of Industrial Engineers

6s
DEFINE
Value Stream Maps
1. Define the Current State
2. Lead to the Future State
3-3-71 © 2015 Institute of Industrial Engineers

Future State Questions
1. What does the customer really need?
2. How often will we check our performance to customer needs?
3. Which steps create value and which are waste?
4. How can we flow work with fewer interruptions?
5. How do we control work between interruptions? How will work be prioritized?
6. Is there an opportunity to balance the work load and/or different activities?
7. What process improvements will be necessary?
72 © 2015 Institute of Industrial Engineers

Elimination of Waste: Muda
• A Japanese term for anything that is wasteful and doesn't add value.
• Waste reduction is an effective way to increase profitability.
• A process adds value by producing goods or providing a service.
• A process consumes resources. • Waste occurs when more resources are consumed
than are necessary to produce the goods or provide the service.
73 © 2015 Institute of Industrial Engineers

Muda
• The Seven Wastes – Overproduction
– Inventory
– Defects (Repair / Rejects / Rework / Correction)
– Motion
– Processing (Over-processing)
– Waiting
– Transportation (Material Movement)
• Plus One More – Skill Abuse
74 © 2015 Institute of Industrial Engineers

5 S Workplace Organization
• 5S is used to diminish the slack hidden in plants and offices – finding the “dirt” and “washing it out”.
• Dirt in a plant includes
– unnecessary work-in-process inventories
– defective inventories
– unnecessary jigs, tools, methods
– Unneeded carts, equipment, tables
• Dirt in an office includes
– Unnecessary documents, reports, stationery
75 © 2015 Institute of Industrial Engineers

Standard Work
Definition: Best Practice
An effective process to systematically organize work
elements to support the operator and assure health and safety.
Work is designated “Operator or Machine” and broken into
individual elements.
Employees should be involved with documenting work
elements
in maintaining the standard process in an environment
supportive of health and safety.
76 © 2015 Institute of Industrial Engineers

VS.
A central planning approach which determines and disseminates production schedules to all processes simultaneously.
Characteristics Include:
•Product delivered late
•High levels of waste
•Low productivity
An approach where you go to the preceding process to withdraw the necessary units in the necessary quantity at the necessary time. The preceding process produces only enough units to replace those that have been withdrawn. The production schedule is determined by one process (the pacemaker).
Characteristics Include:
•Product delivered when needed
•Low levels of waste
Review
77 © 2015 Institute of Industrial Engineers

6s
DEFINE
Lean and Six Sigma Together
Define Measure Analyze Improve
Implement Control
Benchmarking
FMEA
IPO Diagram
Kano Model
KB
Management
SIPOC
QFD
VOC
Task Analysis
VSM
Confidence
MSA
NGT
Pairwise
Ranking
Flow
Capability
Time Value
VSM
Waste Analysis
Affinity Diagram
Brainstorming
C&E Diagram
F test, T test
Fault Tree Analysis
FMEA
Histogram
Pareto
Regression
Scatter
5 whys
DFSS
DOE
Kanban
Mistake Proofing
Standard Work
Takt Time
TOC
TPM
Work Cell Design
Visual
Management
5S
Control Charts
Control Plan
Reaction Plan
Run Charts
SOP
3-3-78 © 2015 Institute of Industrial Engineers